class opener: what do these 3 graphs show? t t t d v a
TRANSCRIPT
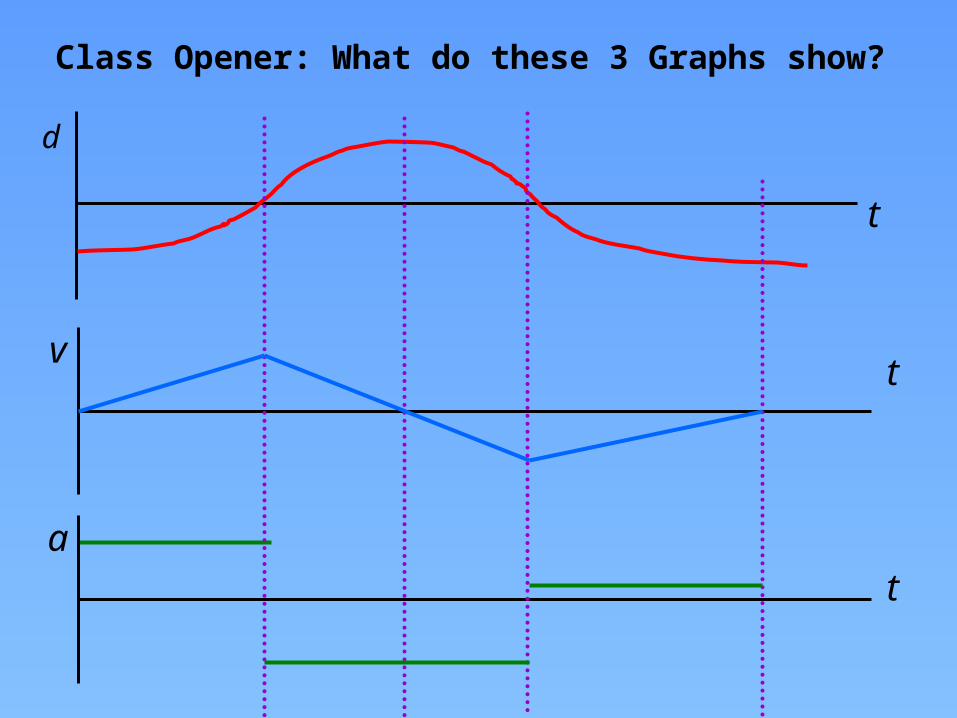
Class Opener: What do these 3 Graphs show?
t
t
t
d
v
a

Kinematic EquationsKinematics is the study of objects in Motion
Grade 11 PhysicsNIS, Taldykorgan
Mr. Marty

Objectives:•Recall the definitions of position, distance, displacement, speed, velocity and acceleration and distinguish whether these are scalars or vectors.•Use the equations of motion involving distance/displacement, speed/velocity, acceleration and time in calculations and in interpreting experimental results.•Plot and interpret DTVA Graphs distance-time, velocity-time and acceleration-time graphs calculating the area under velocity-time graph to work out distance travelled for motion with constant velocity or constant acceleration.
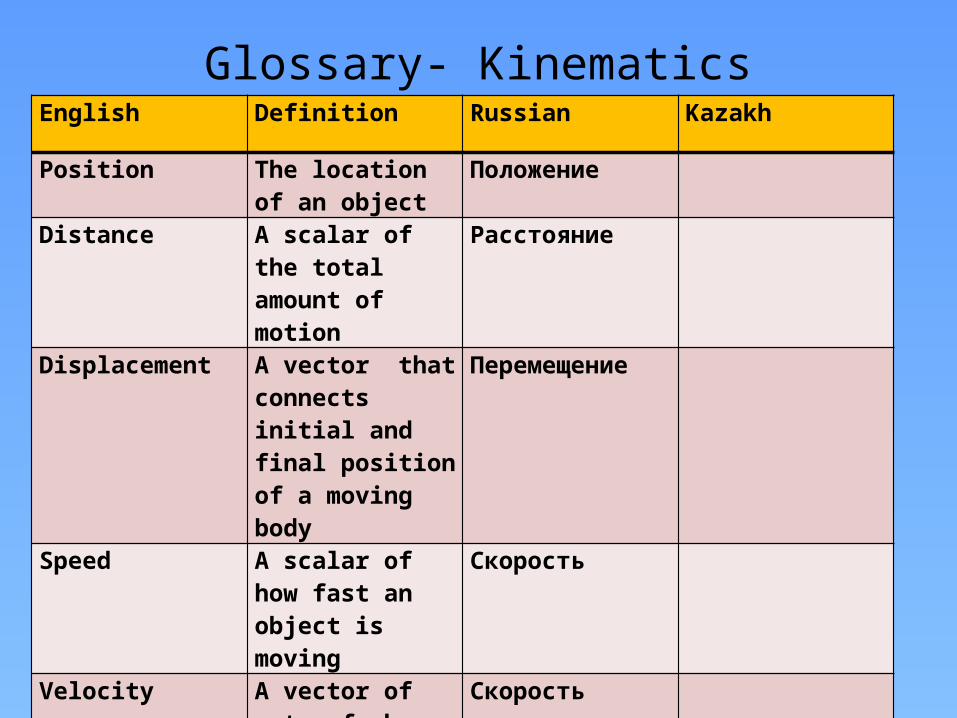
Glossary- KinematicsEnglish Definition Russian Kazakh
Position The location of an object
Положение
Distance A scalar of the total amount of motion
Расстояние
Displacement A vector that connects initial and final position of a moving body
Перемещение
Speed A scalar of how fast an object is moving
Скорость
Velocity A vector of rate of change of displacement
Скорость
Acceleration Rate of change of velocity
Ускорение
Gradient The rate of change of an incline
Градиент, наклон

Scalars and VectorsScalar is a quantity that has only magnitude
Vector is a quantity that has magnitude and direction
Examples:• distance• time• mass• speed• area• work• energy• pressure
Examples:•displacement•velocity•acceleration•force•momentum•electric field strength

Learners should know the equations:• s = ½ (u+v)t• v = u +at• v2 = u2 +2as• s = ut + ½ at2
• When 3 quantities are know the other 2 can be calculated
• These equations only apply during constant acceleration (motion is one-dimensional motion with uniform acceleration).
• When the acceleration is zero, s = ut.
Where:s = final displacement (metres)u = initial velocity (metres per second, ms-1)v = final velocity (ms-1)a = acceleration (metres per second per second, ms-2) t = time taken (seconds, s)

Other symbols used in General Kinematic Equations
• Final velocity: vf = v0 + a(t)
• Distance traveled: d = v0 t + (½)at2
• (Final velocity)2: vf2= (v0 t)2 + 2ad
• Distance traveled: d = [(v0 + vf)/2]*t

Calculus formulas• Acceleration is the second derivative of
displacement and velocity is the first derivative of displacement
• Integration willgive the area under
a curve

• Motion is described by the equation d = vt • The slope (gradient) of the DT graph = Velocity• The steeper the line of a DT graph, the greater the
velocity of the body
1 d(m) 2 3 v1 > v2 > v3
t(s)
Slope of Distance-Time Graphs
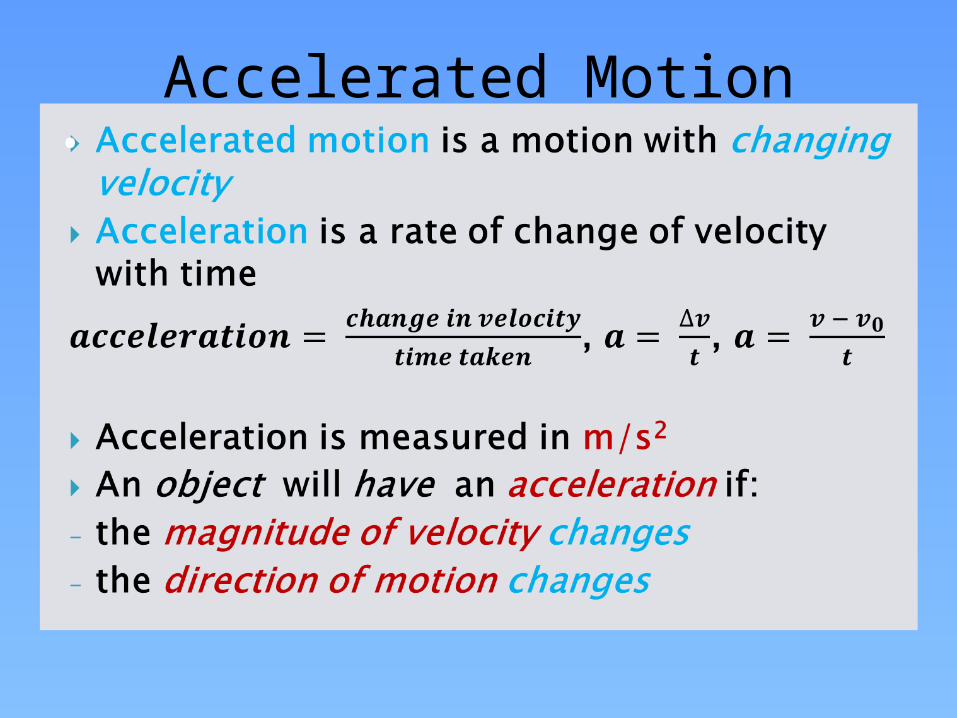
• Accelerated Motion

• Uniform accelerated motion is a motion with the constant acceleration (a – const)
• Slope (gradient) of the velocity –time graph v(t) = acceleration• The steeper the line of the graph v(t) the greater the
acceleration of the body v(m/s) 1 2 3 t(s) a1 > a2 > a3
Velocity-time Graphs

Graphing Negative Displacementd
t
A
B
C
A … Starts at home (origin) and goes forward slowly
B … Not moving (position remains constant as time progresses)
C … Turns around and goes in the other direction quickly, passing up home
1 – D Motion

Tangent Lines show velocity
t
SLOPE VELOCITY
Positive Positive
Negative Negative
Zero Zero
SLOPE SPEED
Steep Fast
Gentle Slow
Flat Zero
d
On a position vs. time graph:

Increasing & Decreasing
Displacementt
d
Increasing
Decreasing
On a position vs. time graph:
Increasing means moving forward (positive direction).
Decreasing means moving backwards (negative direction).

Concavity shows acceleration
t
d
On a position vs. time graph:
Concave up means positive acceleration.
Concave down means negative acceleration.
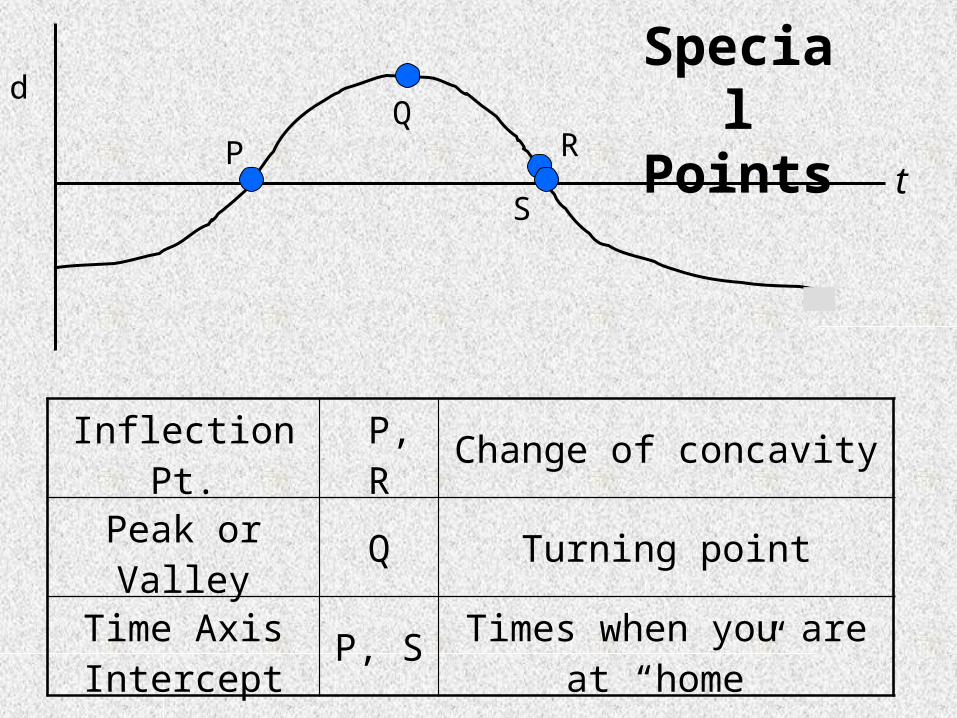
Special Points
t
d
PQ
R
Inflection Pt. P, R Change of concavity
Peak or Valley Q Turning point
Time Axis Intercept P, S Times when you are at
“home”
S

Curve Summary
t
d
Concave Up Concave Down
Increasing v > 0 a > 0 (A)
v > 0 a < 0 (B)
Decreasing
v < 0 a > 0 (D)
v < 0 a < 0 (C)
A
BC
D

All 3 Graphs
t
d
v
t
a
t

Graphing Tips
• Line up the graphs vertically.
• Draw vertical dashed lines at special points except intercepts.
• Map the slopes of the position graph onto the velocity graph.
• A red peak or valley means a blue time intercept.
t
d
v
t
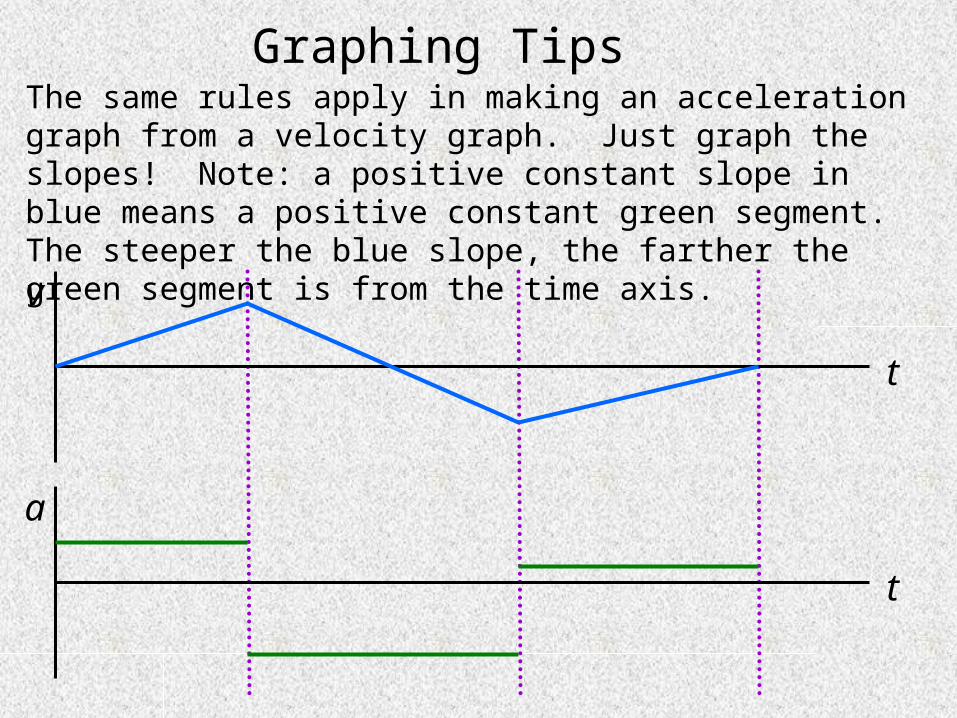
Graphing TipsThe same rules apply in making an acceleration graph from a velocity graph. Just graph the slopes! Note: a positive constant slope in blue means a positive constant green segment. The steeper the blue slope, the farther the green segment is from the time axis.
a
t
v
t

Real lifeNote how the v graph is pointy and the a graph skips. In real life, the blue points would be smooth curves and the green segments would be connected. In our class, however, we’ll mainly deal with constant acceleration.
a
t
v
t
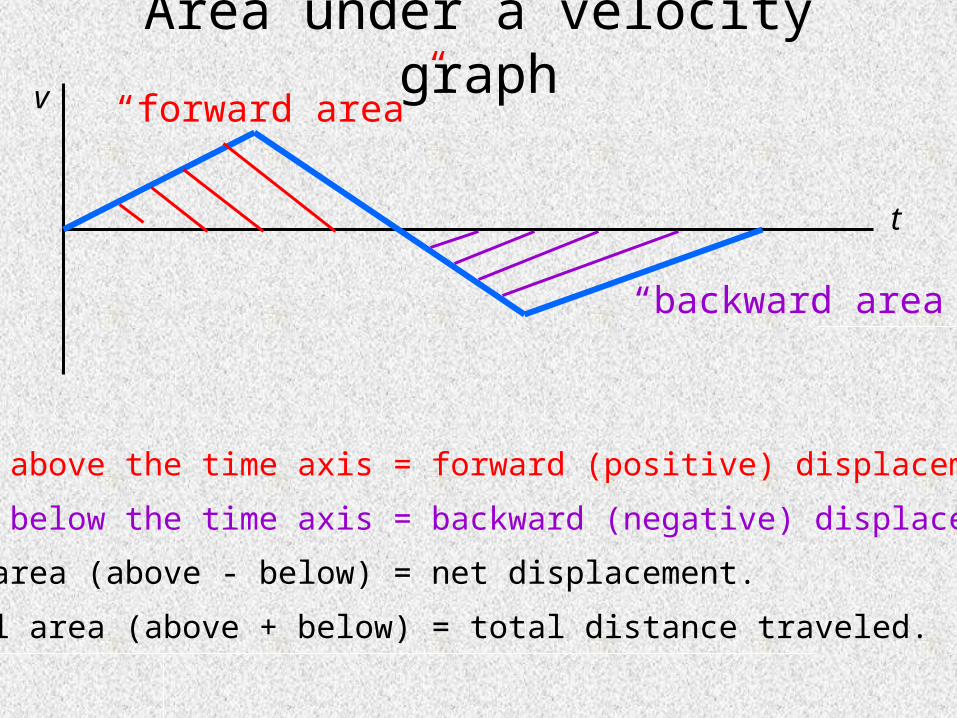
Area under a velocity graphv
t
“forward area”
“backward area”
Area above the time axis = forward (positive) displacement.
Area below the time axis = backward (negative) displacement.
Net area (above - below) = net displacement.
Total area (above + below) = total distance traveled.
Area
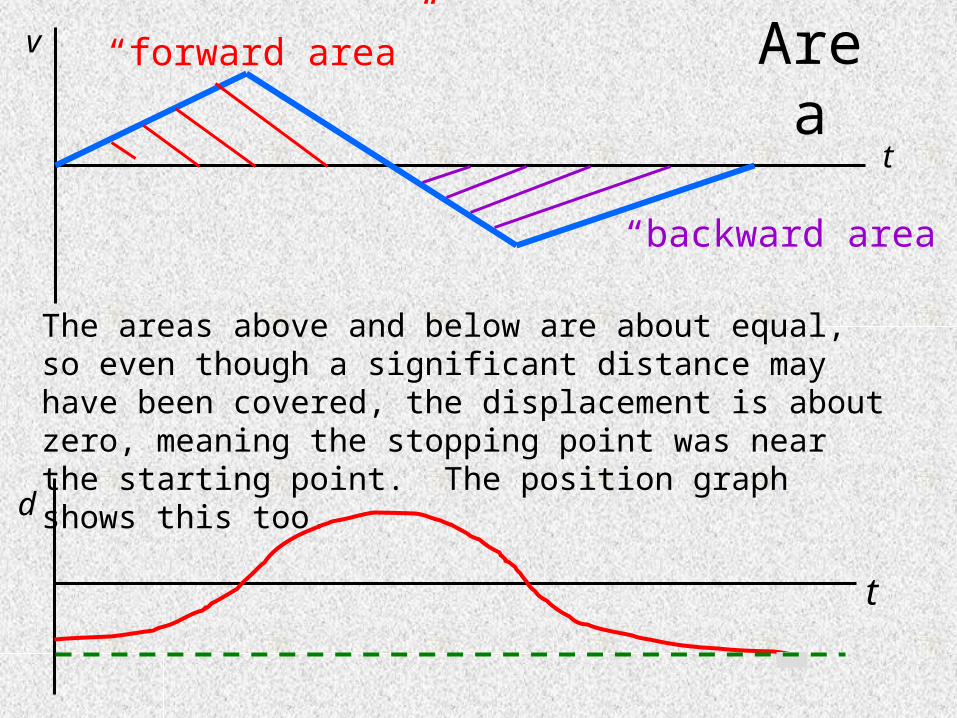
The areas above and below are about equal, so even though a significant distance may have been covered, the displacement is about zero, meaning the stopping point was near the starting point. The position graph shows this too.
v
t
“forward area”
“backward area”
t
d
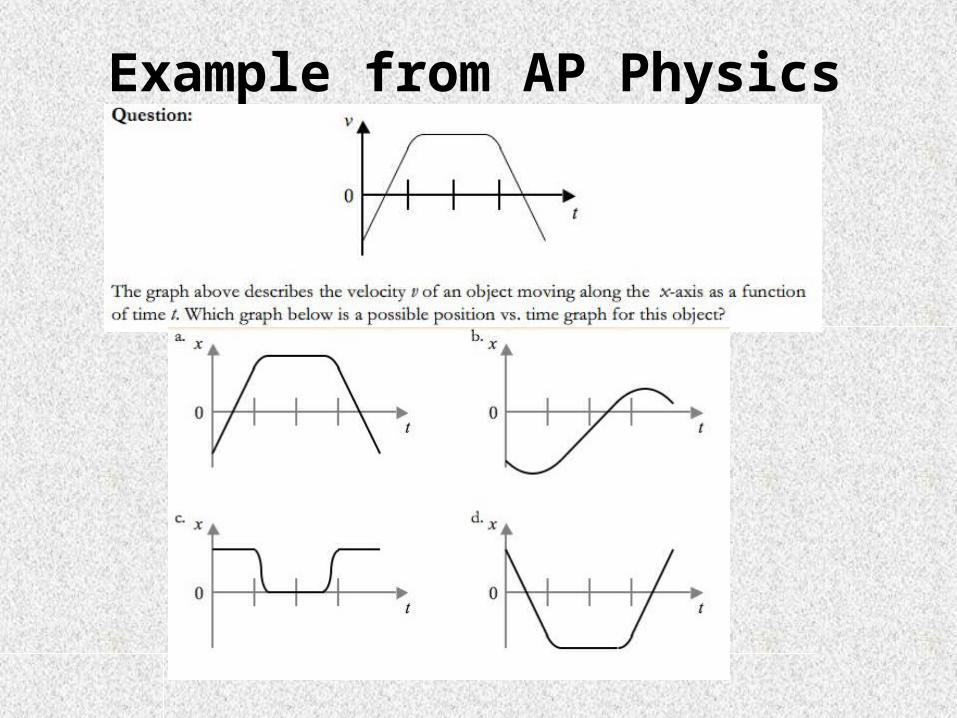
Example from AP Physics
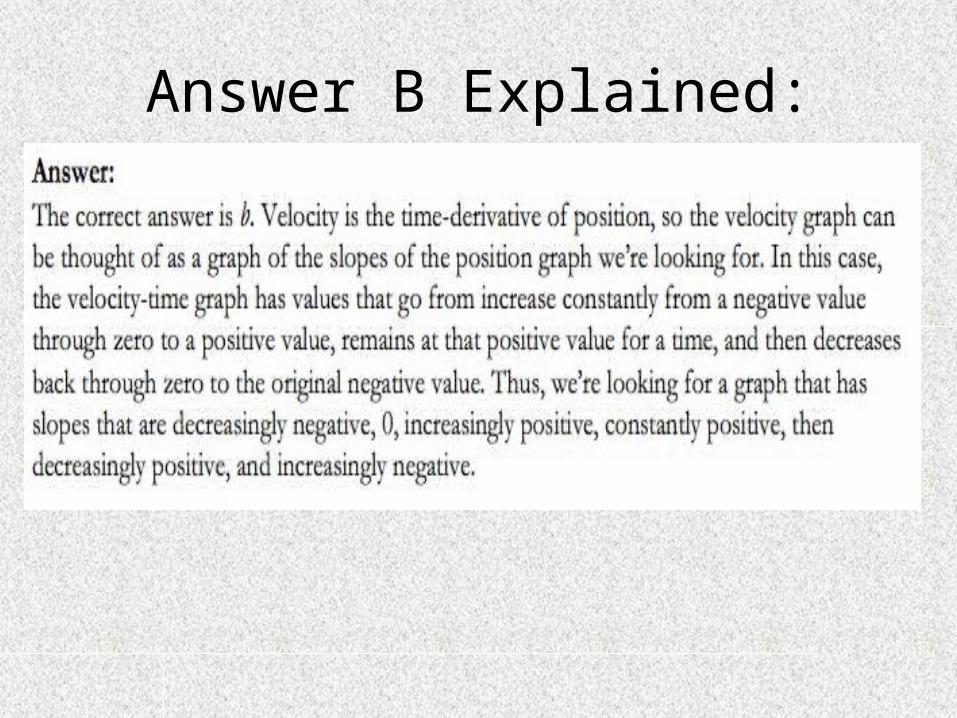
Answer B Explained:

References:• http://www.thestudentroom.co.uk/wiki/Revisi
on:Kinematics_-_Equations_of_Motion_for_Constant_Acceleration
• https://www.csun.edu/science/credential/cset/cset-physics/ppt/kinematics-graphing.ppt
• http://www.learnapphysics.com/index.html