civilizations as dynamic networks: from medieval to...
TRANSCRIPT

Civilizations as Dynamic Networks: From Medieval to Modern
Douglas R. White
Filesource: FTP/Spufford/222net/citiesWWWnet.doc See: http://eclectic.ss.uci.edu/~drwhite/Civ/ for additional slides
Outline Introduction 1. Banks, Money and Trade Imbalances 2. Commodity Chains: Raw Materials, Finished Goods, and Consumption. 3. Roads and Flows. 4. A Network Perspective on Shifts in Economic Hegemony (Flow Centrality) 5. Volume of Trade and Commercial Transformation (Institutional Change) 6. Landed and Commercial or Capitalist Hegemony (Demographic and Network effects) 7. Transformations in Agent Space. – (Paris, Champagne Fairs) 8. Polities 9. Capital Cities and Wealth and Investment of Rulers and Merchant 10. Event and Agent Data 11. Modeling 12. Conclusion Introduction
Peter Spufford’s (2002) history of late medieval Europe in Power and Profit: the Merchant in
Medieval Europe provides a new synthesis of the transition from feudalism – based on rights and
services tied to land – to a monetized economy. The history is told in terms of networks – among
cities, merchants, peasants, elites, states and empires, ecclesiastical and other organizations – and a
rising velocity of trade that at successive thresholds transforms sites and organizations within the
network. The focus of this study on network representation allows a formulation of explanatory
concepts that can be measured and tested as to network effects on social transformation. The goal is
to expand and formalize the explanations offered by Spufford for the many organizational and tech-
nological transformations that he recounts. Monetization, velocity of trade and thresholds beyond
which organizations cannot perform without reorganization are crucial to Spufford’s explanations
of the transformation that took place in this historical period, and are equally important in other
contexts as well (Chandler 1977, 1990, Iberall and Soodak 1978, Soodak and Iberall 1978).

Dynamics of Civilizational Networks D. R. White 2
This paper adopts the view that pressures towards monetization in this period were not en-
dogenous but largely driven by the dynamics of demographic and sociopolitical instability cycles,
as described by Nefedov (2003) and Turchin (2004). The demographic cycle of the ‘long 13th cen-
tury’ began with population expansion in 1150 and reached a peak that provoked crisis at the end of
the 13th century, as did the population peak in Braudel’s ‘long 16th century.’ Early in the 1300s
famines were rife and extended (Spufford:14). The crisis was exacerbated by the onslaught of Black
Death in successive waves, but the Late Medieval ‘economic depression of the Renaissance’ (Spuf-
ford:12) did not end until 1480. Nefedov, Turchin, Goldstone (1991) and others identified a dy-
namic in which – in the three great 150-300 year swings of European population between 1150 and
1920 as well as other agrarian regimes – the peaking of population up against a Malthusian carrying
capacity initiates a rise in sociopolitical violence that only abates long after population has fallen
during the demographic crisis. The Nefedov-inspired and Turchin-informed model at the end of this
study reviews how the stagflation, crisis, and economic depression segments of the 13th century
population cycle spurred the transition from feudalism to a highly monetized economy, and views
the resultant monetization as a key factor in the rising velocity of trade that spurred organizational
transformations.
Network visualizations of historical trends and changes described by Spufford (2002) and the
preliminary hypotheses that might explain them are crucial to this effort at modeling. Six initial ca-
veats must be stated with regard to the visualizations and hypotheses offered here. (1) The data pre-
sented are not models but visualizations prior to modeling trade-system dynamics. The advantage
of the visualizations is that they allow us to inspect the kinds of variables that might be coded in
such models, and how these variables appear, at the time-scales for which they are coded, in time
series representations. (2) The hypotheses are not models, but first-order attempts to account for
patterns in the observed data. (3) Given the kinds of data available, the variables that are coded are
qualitative. The codings are of nodes representing cities and edges representing trade between cit-
ies. It is useful to be able to visualize this as a time-series network. (4) While the time-series will
eventually be rescaled to generations (two decades each), at this point only changes by century are
coded, e.g., 12th to 15th. (5) This is not a representation of a world-system, but only of limited as-

Dynamics of Civilizational Networks D. R. White 3
pects of one region within a larger world-system dealing with cities, politics, and religion; and ig-
noring for the time being other types of organizations. The larger world-system stretches through
the Middle East to India and is interlinked through bulk and luxury trade to the contemporaneous
Indonesian, Far Eastern and West African regions (Wilkinson 2004). (6) These representations,
which proceed in stages, are not as complex as might be called for in models intended for statistical
analyses. Rather, they are simplified in order to render visually – and render judgment of adequacy
– some of the main patterns of Spufford’s synthesis and analysis of medieval trade. Simplification
allows lower-dimensional network analyses to be employed, e.g., assuming a few simple types of
weighted edges between comparable nodes.
These caveats stated, a considerable range of patterns of attribute data and network relation-
ships are simultaneously and successively visualized in a network time-series. Attributes are
mapped onto the nodes in a series of static or temporal comparisons, using size of nodes and color
(type) or scalar shading (or color intensity) of nodes, shape of nodes, and position of nodes to cap-
ture attribute variation. Thus, up to four aspects of attribute variation of nodes may be simultane-
ously represented. Edge relationships are mapped using width of edges, color (type) or scalar shad-
ing (weighting) of edges, solidity (versus various kinds of dotted or broken lines) and direction of
edges. Again, up to four aspects of edge variation may be simultaneously represented. Further, be-
cause edges (or arcs as directed edges) can be specified of different types, each type can have its
own weightings. Even these simple representations deal with multidimensional attribute and rela-
tional complexes. Table 1 shows some of features of network representation for the cities network.
NODES LINES
Size of
nodes
Position of
nodes
Color or
Shading
Shape
of Nodes
Width of
lines
Solid /
Broken
Color or
Shading
Direction
of lines
Population Geographic Polities as
needed
Importance Trade as needed Export
Centralities,
Wealth
Equivalence
Scaling
Cohesion as
needed
Flow War as needed Import
Table 1: Information Conveyed in Graphing the Network
Dynamics of Civilizational Networks D. R. White 4
The problem is not to overburden our visual representations so that they are too complex to
comprehend and thus carry the ‘story’ in Spufford’s book. The requisite networks are built out of
the maps and descriptions of changing relationships and attributes of the medieval players (cities,
polities, religious and commercial organizations, families). By analyzing the city network, for ex-
ample, some dimensions are simplified into spatial positions, like that of geographic location.1
Similarly, relative distances in a more abstract representational space can be computed in terms
relative equivalence of positions within the network (White and Reitz 1983). Such representations
supplement the historical text in important ways: The network allows measurements made accord-
ing to the configuration of relationships in trading networks. Examples are centrality of nodes
(Freeman 1977, Freeman, Borgatti and White 1991) and nested levels of structural cohesion of
nodes (Moody and White 2001). The results of these computations may be shown on the same spa-
tial network by the scalar shading of nodes. In some cases, the results of a network analysis are eas-
ier to visualize when the spatial configuration of nodes reflects an x-y (or 3d) grid of distances de-
termined directly by the analysis. Such is the case, for example, with structural positions calculated
in a multidimensional similarity space (Smith and White 1992). If needed, we can represent 3d out-
comes of positional analysis. Hence, visualization allows some flexibility in the ways that we view
the ensemble of attributes and relationships that constitute the network and we have similar flexibil-
ity in how to construct the network for purposes of visualization.
Choice of network visualizations and preparation of data for network measurement evolved
out of the way that Spufford (2002:12-14) organized and began his book with transformations of
trade: the increase in population and money supply; and the capital cities and commercial centers
that were most transformed by the expansion and then the contraction of trade. A strategy for
mathematical modeling will be suggested for one aspect of change, namely, the effects of monetiza-
tion and network flows on episodic change in organizational complexity.
Spufford’s (2002:26) first map presents a weighting of edges in terms of the flows of credit
1 Latitude and longitude were codes for each city so that GIS mappings could be made for cities and attributes as shown at http://eclectic.ss.uci.edu/~drwhite/Civ/Spufford.htm. Eventually the network links will be available in GIS as well.
Dynamics of Civilizational Networks D. R. White 5
among cities as banking places and the concomitant courier routes involved in credit transfers. Cod-
ing began with that network, noting the different types of cities and flows, and added to it the mari-
time trading links which are so important to the physical transport of bulk commodities in addition
to the flow network of credits. The maritime network was not presented by Spufford (p. 398) until
the concluding chapter – exemplified only for the Venetian trade –and required that we supplement
from outside sources the maritime trade routes of the Venetians with those of the Genoese. These
initial data, after Wehbe’s compilation of the cities and populations in the figure on page 26, re-
quired only a few days of work to assemble into a network of 91 cities, displayed on the web
(http://eclectic.ss.uci.edu/~drwhite/Civ/Spufford.htm) in a series of introductory slides.
Results of this first stage of network construction led to initial network analyses that can be
briefly summarized. Computation of betweenness centralities of the nodes in this network, ignoring
the weights of edges, showed Genoa to be the most central city, commensurate with its role in the
trade network by the early 13th C. Cohesion analysis showed a biconnected core, that is, a set of
cities in which each pair are connected by two or more independent trade routes.2 Positional equiva-
lence analysis showed that this core could be visualized as an overall trading “circle” reminiscent of
the anthropological ‘kula ring’ rather than the core-periphery structure of the modern international
world-system (Smith and White 1992). These, however, were only suggestive and not definitive
results, i.e., provisional rather than final conclusions about network structure.
The harder work then began to decide how to treat the actual flow of commodities, including
credit and the metals used for coinage. The areas of wool production and the towns or cities that
had or imported wool and had a woollens industry are well described by Spufford (see pp. 230-233
and 328-329 for raw wool production) as were the transport routes and intermediary agents of trade.
It is not difficult to envision coding, if only in cursory form, the flows of raw wool and then of fin-
ished woollens in the network, and the flows of revenues produced; and similarly for other major
commodities and commodity flows. Revenue flows for commodities, however, were facilitated by
coinage and the scarcity of coins was offset by the flows of precious metals out of mining areas and
towns that served as mining centers. Constructing this part of the network was the next step.
2 Two routes from A to B are (node) independent if they have no intermediate points in common.

Dynamics of Civilizational Networks D. R. White 6
Changes in agent space are exemplified by such processes as the takeover in the 1320s of
London exports by Florentines from the earlier network of Lowland European agents resident in
London (2002:238). The shift of agents-of-trade, while of utmost importance, is difficult to repre-
sent. A more complex representation would have networks of agents moving among the nodes of
the network of cities. Also coded into the network for the wool trade were the English ports of ex-
port, Lowland countries’ ports of import and changes in major trade routes.
Abstract of the Argument
Spufford’s book is not a dry descriptive historical account of a historical period: It abounds in theo-
retical summaries of transformations that are conversant with theories of complexity. Spufford’s
argument follows a complex interacting systems logic. The empirical base for my development of
this argument is Spufford (2002), supplemented by Arrighi (1994), Fischer (1996), Nefedov (2003)
and Turchin (2004).
1. Networks lack causality per se; it is strategies and activities in networks that may be causal.
2. Activities transform sites (France’s wealthiest court in Champagne moves to Paris; Aalst,
whose nobility marries a Burgundian ruler and who shift political membership). Decisions to move
(e.g., by the Champagne nobility) might be highly influenced by changes in agent space (reconcen-
tration of agents in Paris (2002:75).
3. Intensity of activities transforms organizations (intensity use of agents (division of labor)
bypassing of markets, contracts made at arm’s length in Italian examples and Champagne fairs)
4. Changes in agent space change the logic of systems.
a. In the period of Genoese economic hegemony, the agents are family oversea diasporas.
b. The new type of agent is a commercial agent that allows the merchant to stay in one place.
This might begin in one place (e.g., Florence) but ends by diffusion to other place (Examples
are the Antwerp Bourse (p.50) and later rise of Dutch firms, transformed by the new possibili-
ties of overseas organization while staying in place).
5. System logics are reversible, although their infrastructural changes are cumulative. For example,
following Dutch economic hegemony, the new types of British Imperial agent include a diasporic
colonist, not so much on a family model as a class model. And prior to the Genoese ‘family capital-

Dynamics of Civilizational Networks D. R. White 7
ist’ diaspora there was a period of Venetian economic hegemony in which the agents were those of
the ship crews who joined Venetian corporations as a form of investment but did not form diasporas
but returned home to their trades.
6. Competition determines which actors are replaced with others. (Lowlander Florentine agents
in England)
7. Warfare outcomes tend to be influenced by success in other forms of economic competition (e.g.,
wealth more potential for successful armament) which further eliminates resources of defeated
competitors (e.g., destruction of a large part of Genoese fleet)
8. Population swings (e.g., Black Death) might not be the determinants of system decline. Indeed,
after the Black Death of the 1340s there was a brief period of economic boom before the European
economy went to ground. Climate shift in the 13th century also had a major negative effect.
9. The general model of change is one where, while Malthusian constraints are not the determinants
of system decline, since major climate fluctuation and epidemic disease may act as exogenous
shocks, population cycles operate here, as elsewhere in agrarian societies (Turchin 2004), as the
major dynamic driving a host of other factors, including those that tend to affect monetization. Ef-
fects of and on monetization are extensively discussed by Spufford as a main focus of the book,
summarized as follows:
The thirteenth-century increase in the demand for luxury goods was backed up by newly-liberated quantities of ready cash, arising from a revolution in rents. By the end of the century landlords essentially collected their rents in money in place of a mixture of goods, services and coin, amongst which coin had been the least important. It is no wonder that this demand for distant luxuries brought about an enormous quantitative change in the volume of inter-national trade. Moreover, as business became focused on a limited number of particular places, or rather along a lim-ited number of routes between those places, a critical mass was reached, so that qualitative as well as merely quanti-tative changes in the nature of commerce began to take place. This vital transformation could only happen when the concentrated supply of money, and consequently of trade, rose beyond a certain critical point.
Up to that point, on any particular route, all that occurred was an increase in the volume of trade within the tradi-tional framework. Italian merchants, for example, merely added extra mules loaded with goods to the mule-trains that accompanied them when they ventured northwards across the Alps. However, once the critical point was reached, the scale of enterprises allowed for a division of labour. (2002:29)
I will follow Turchin (2004) in viewing monetization not as the driver of the dynamics of change
but as a secondary effect of population dynamics. Monetization, however, can be seen as the prin-
cipal driver of reorganization and of increases in the complexity of organizations when velocities of

Dynamics of Civilizational Networks D. R. White 8
money and commodity exchanges surpass the capacity thresholds of existing organizations. This is
an episodic process. Network predictions will help to predict where, given overall patterns in the
velocities of trade, specific reorganizations will tend to occur.
Nine topics of network coding guided construction of a network dataset. These involved
rules for coding new cities, towns, or in some cases, junctions, and the difference in importance of
links between them, for example. Links were coded by type so that higher numbers would have
higher flow or importance. Each node and link was coded for its presence or importance in time,
e.g., [12-15] for the duration of a node or link from the 12th to the 15th century.3 How these cod-
ings were done will be discussed under the nine topics.
1. Banks, Money and Trade Imbalances The commercial changes of thirteenth-century Europe were largely made possible by very substantial increases in popula-
tion and an enormous growth in the money supply, to such an extent that early fourteenth-century Europe was both overpopu-
lated in relation to agricultural productivity and also nearly everywhere accustomed to the general use of coined money, supple-
mented by credit. In most parts of Europe the early fourteenth-century population levels were not equaled again until the seven-
teenth century, or surpassed until the eighteenth. The money supply was also at a high point, not to be reached again for several
centuries. In England, for instance, over 800 tons of silver was circulating as coined motley by 1319 under Edward II, at least a
twenty-fourfold increase since the mid-twelfth century. However, at the end of Queen Elizabeth I's reign, some three centuries
later, only the equivalent of 500 tons of silver was circulating as coined money, gold and silver together. (2002:12)
The increase in the supply of money may not have been directly a cause of the late medieval commercial revolution, but it
was a necessary pre-condition for it. Without an adequate money supply available in the countryside, even if only seasonally,
the landlords could not have taken advantage of the pressure that growing population was enabling them to put on their tenants
and bring about the revolution in rents that they desired. Without such a revolution in rents the landlords could not have
achieved an enhanced standard of living and obtained a variety of choice of purchases that had not been available before. The
demand generated in the mining areas might have initiated commercial and industrial expansion, but it was the strong and sus-
tained demand from the rulers and landowners that acted as the stimulus to continuous commercial and industrial growth almost
uninterruptedly for a century and a half. Without the concentrated force of that demand in capital cities, rather than scattered
between rural castles throughout western Europe, merchants could not have operated on an adequate scale for the revolutionary
division of labour in commerce to take place, with all its ancillary changes. (2002:59; italics mine)
Network coding began with the banking and courier routes that formed the spine of the me-
dieval trade system. Most of these places and routes were time-coded [12-15], but Spufford will
have to detail which came later, as in the case of Buda and the bank courier route from Buda to 3 When coding generational time series in a later phase, the symbols will be 110, 112, 114, …, 148, 150 to capture the twenty-one two-decade intervals from 1100 to 1500CE. This larger number of points in a time series will be needed to begin to test models of temporal dependencies.
Dynamics of Civilizational Networks D. R. White 9
Venice. A careful textual transcription of the data in the entire book might catch 80% of the time
codings, but it is more reliable to get these judgments directly from Spufford.
Monetary flows come in two varieties: credit and money. Because precision in amounts or
even categorical ranking is impossible with extensive missing data, the coding strategy was rather
to estimate trade imbalances – offset by monetary or credit flow imbalances – and construct com-
modity flows qualitatively. When the project advances to semifinal stages, it will be useful to have
Spufford check and refine the codings and results. The coding in some way reflects Spufford’s
strategy in organizing the book, where consideration of trade imbalances comes last. Trade imbal-
ances, of course, not only occur within Medieval Europe but along the routes leading through the
Middle East and Central Asia to India and China, and along routes to North Africa and the Gold
Coast. The “spice trade” to and through India and the caravan trade were so broad in the commodi-
ties that were transported, for example, as to go well beyond mere trade in luxury goods. India may
be considered as part of the same bulk-goods world-system, recalling as well that bulk goods were
easily transported by boat and camel. Trade with China, and import of silks, for example, would be
considered to fall in the luxury-goods category of trade. While these goods were important, China
in this period would be considered a separate world-system linked by trade in luxury goods. The
world-system that includes Spufford’s Medieval Europe would include India, North Africa, the
Middle East and other regions (the Hanseatic trading network is not covered by Spufford and
should be added to the Medieval European database through auxiliary sources). The reason for con-
sidering world-system bulk-goods boundaries here is because of the heavy trade imbalance and
consequent monetary flow from Europe to India to compensate not only for luxury goods but also
countless items that were in common use in Europe’s courts and urban populations.
Hence to represent the dynamics of trade and credit or monetary flows, it was important to
include in the network the mining towns in which gold and silver were mined within Europe (espe-
cially silver, because gold was scarce in European mines and more commonly imported from Af-
rica) and to construct the links from the mines through mining towns to urban centers and polities
where coins were minted and monetary flows originated. From rural rent to courtly living, from banking and international trade to public revenue and military service, the long thir-
teenth century of the commercial revolution witnessed a series of fundamental transformations, each associated with a complete

Dynamics of Civilizational Networks D. R. White 10
change in the scale of, and attitudes to, the use of money. The whole period from this commercial revolution to the industrial
revolution of the eighteenth and nineteenth centuries possessed an economic unity, the basis of which was established by these
radical transformations arising from the new uses of money. These fundamental changes lay behind and underpinned the whole
fabric of medieval European trade to which this book is devoted. (2002:59)
2. Commodity Chains: Raw Materials, Finished Goods, and Consumption. The southern Netherlands was in some sense the industrial heartland of medieval Europe. An extraordinary range of goods
was made in a broad cigar-shaped pattern of cities and towns stretching from Calais and Sluys [outport of Bruges] on the coast
to Cologne on the Rhine. Until the fifteenth century the area was intensely politically divided, so that industry was to be found
in the counties of Flanders, Hainault, and Namur, the duchy of Brabant, the prince bishoprics of Cambrai, Liege and Cologne,
the cities of Tournai and Aachen, and to a certain extent a little to the south in the county of Artois and to the north in the
county of Holland. Here the finest woollens in Europe were manufactured, and also of a great deal of cheap woollen cloth and
linens. The finest tapestries in Europe were made here, as well as poorer ones, and carpets. The greatest centre for brass-
working was here. So also was some iron-working, including armor and the finest swords. Pewter too was made here, and the
only coalfield to be exploited on a significant scale in the Middle Ages was here as well. Here was one of the great focal points
for artists in Europe. Some of the greatest of medieval painters and miniaturists worked here, but in the context of a large pro-
duction of cheaper art and book production. This continued and expanded when printing from moveable type was invented.
Italy, north of a line from Siena to Perugia to Ancona, formed a second industrial area. An equally extraordinary and over-
lapping range of goods was made here. This area was split into two by the Appenines. It was also politically fragmented, al-
though by the fifteenth century the three states of Milan, Venice and Florence controlled much of it and had absorbed a large
number of hitherto independent city states. Here there was to be found the manufacture of luxury woollens, only surpassed by
the best from Flanders and Brabant, and also a great deal of cheap woollen cloth, of cottons and linens and fustians and the
most astonishing range of superlative silk fabrics, besides leather-working. Working in iron in northern Italy included the prin-
cipal armor manufacture in Europe. The most important glass manufacture, the finest pottery, and an extensive manufacture of
soap and paper were also to be found. Here, too, was the other great focal point for artists. Most of the other great medieval
painters worked here, once again in the context of large production of cheaper art, much of which was exported, and of books.
Here too, book production continued and expanded when printing from moveable type was invented.
In the third area between the Alps and the Main, industry came relatively late on the scene, but shared many of the products
of the other two areas. Once again there was an important production of textiles, for the most extensive production of linens and
fustians grew up here. At the end of the Middle Ages this area was coming to be the most important centre of metal-working in
Europe as well. There was a growing and significant brass industry, whilst the iron industry of the Upper Palatinate made it a
late medieval Ruhr. Both fine and mass-produced armor were made. Here, too, a manufacture of paper began. The art of print-
ing with moveable type was invented and had its first diffusion. Woodworking was important and a whole host of lesser indus-
tries, leather, glass, pottery, contributed something to trade.
The three areas were joined together by the Rhineland, by the Rhône valley and by the ever growing and improving net-
work of Alpine passes. Together they formed a broad band from the North Sea to the Mediterranean, stretching from Umbria to
south Holland, which to a large extent coincides with Jan de Vries' early modern urban belt, or the 'blue banana' of the urban
fabric of contemporary geographers (see pp. 389-90). Outside this broad band, much industry was to be found in capital cities,
like London which still lay outside the band to the north, Paris to the west, and Rome, Naples and Palermo to the south. All
Dynamics of Civilizational Networks D. R. White 11
capital cities, whether inside this band or not, were to some extent industrial cities, since the court market stimulated luxury in-
dustries, either on the spot or in the immediate vicinity. The importance of such domestic court markets made for the growth of
some luxury industries which later became export industries. The broderers of Opus Anglicanum in London, the ivory-carvers
of Paris, the armour-makers of Milan, the tapestry-weavers of Brussels all catered in the first instance for a domestic, court,
market, but then exported all over Europe. Other aspects of court demand also stimulated local industry. Every capital had its
own goldsmiths and silversmiths. Other aspects of these capital cities also stimulated specialist demand, like the parchment-
makers who were so numerous in the university quarter of Paris. (2002:228-230)
The network coding of commodities reflects an approach that emphasizes dynamics over
statics. The goal was to construct commodity chains, starting from raw materials that move to pro-
duction sites and thence through trade networks and middlemen and consumers. As noted, this was
not possible in quantitative but only in qualitative terms. After beginning with Spufford’s mapping
of finished goods industry in cities and towns, each commodity was treated as a binary attribute of
the nodes in the network, simply coding presence/absence of each type of industry in each century.
These data were stored in an excel spreadsheet and transferred to binary partitions labeled by indus-
try and century. These partitions could then be called up to color the nodes in the network for a time
period as to the distribution of each industry. The next stage (not yet complete) would then look at
the distribution of raw materials for each industry, and to create nodes outside of cities which would
represent regions or centers of accumulation from which raw materials were exported to other sites
or cities for industrial processes such as wool into woolens.
Commodity flows of raw materials can be represented by directed links that overlay the bidi-
rected links that represent roads. There could then be as many directed flows as needed to represent
trade along a transport system. The work needed to estimate such directed links has not yet begun.
3. Roads and Flows.
Once the flow of raw materials to producers is mapped to the network, directed links might
be coded to represent how finished products move through trade routes to markets. The mapping
may be done by software that starts from itemized lists of sources and sinks, and moves finished
commodities from courses and sinks through the shortest available links. Directed edges to indicate
movement of commodities over a road system would then be checked with Spufford as to reason-
able additions to the network.
Figure 1 shows how such a coding might work, classifying cities by the combinatorics of

Dynamics of Civilizational Networks D. R. White 12
producing and shipping raw wool and finished woolens. Wool such as produced in northern Eng-
land must reach sites that make finished woolens. Port transfers are preferred for long distances
since raw wool is a bulk good. An optimal assignment algorithm would minimize distant land
transport over sites, for example, from Hull and Boston as ports and export sites for wool, for ex-
ample, to fulfill industrial demands in lowland cities across the channel and in northern Italy.
Wool only Wollens Wollens and Woll Wool Port Raw wool and Port Wollens & Port
Figure 1: Bicomponent Trade positions in the woollens trade
A second set of refinements in coding aims at establishing when new roads or bridges were
built and, on some qualitative scale, how this affected the capacity for transport. Spufford gives de-
tailed data indicative of road- and bridge-building projects, which were the most commonly used
roads, and when shifts took place between alternate routes.
A third refinement involves closer attention to intermediate nodes. After initial assignment of
major routes between banking sites, such as that between Paris and Troyes, that were given edge

Dynamics of Civilizational Networks D. R. White 13
values of 3 (2002:26, map), intermediate nodes (such as Provins) were added and for sake of conti-
nuity also given a value of three. Provins was not a banking center like Troyes but this is coded by
node attributes. The coded Paris-Troyes link in this period was then downgraded to value 0 so as to
nullify the counting of the link in network calculations such as degree, and to nullify visualization
of the link, keeping track of links at different levels. In the 15th C Provins is largely bypassed in the
Paris-Troyes route, which is handled by time coding. (Another route change is the bypass of Aalst
in the route between Brussels and Ghent due to a royal marriage and transfer of sovereignty in the
15th C to Burgundy.)
Spufford provides a map of routes for Venetian maritime trade, and a comparable map was
located for Genoese maritime trade (Abu Lughod 1973). Spufford also describes the maritime ex-
ports and imports through ports in north-western Europe and the agents involved.
4. A Network Perspective on Shifts in Economic hegemony.
A network is more than a re-presentation of data because it allows measure of structural pa-
rameters that may affect strategy and activity. Flow betweenness is a network measure designed to
detect centrality of nodes in an economic system (White 1988) in which mobility is based on profit
from flows of goods sold dear (retail) and bought cheap (wholesale).4 Flow betweenness is a perfect
predictor for testing, in this Medieval era, the applicability of Arrighi’s (1994) hypothesis concern-
ing changes in the dominant economic hegemon in Europe, that of a pendulum swing back and
forth in the type and form in capital accumulation of the hegemon. In his view, the shift in the sec-
ond millennium CE is from intensive capital accumulation (Venetian trading corporations) to ex-
tensive (Genoese diaspora in the city state period) to intensive (the Dutch in the nation-state period
developing international corporate organization like the Dutch East Indies Trading company) back
to extensive (British overseas colonization, another diaspora) and finally to intensive (the American
international corporate model, which has its origins in the 1890s, as studied by Chandler 1977,
1990). These alternations between Venetian - Genoese - Amsterdam - London - New York hege-
monic forms of capital accumulation from the 12th to the 20th century, in Arrighi’s view, also rep- 4 White (1988) designed the flow-centrality algorithm and asked Steve Borgatti to implement it in the UCINET soft-ware package. White used flow centralit to test the hypotheses about data on the world economy, 1965-1980 (White and Smith 1988, Smith and White 1992). Freeman came upon this algorithm in UCInet in 1989 drafted the first article on the algoritm itself, Freeman, Borgatti and White (1991).
Dynamics of Civilizational Networks D. R. White 14
resent alternations between states (city, state, and continental state, respectively) operating through
legal forms of political hegemony and looser networks (family, class) that operate through move-
ment of administrative personnel and goods and accumulation of capital goods. I will refer to this as
Arrighi’s alternation hypothesis in the binary forms of economic capital.
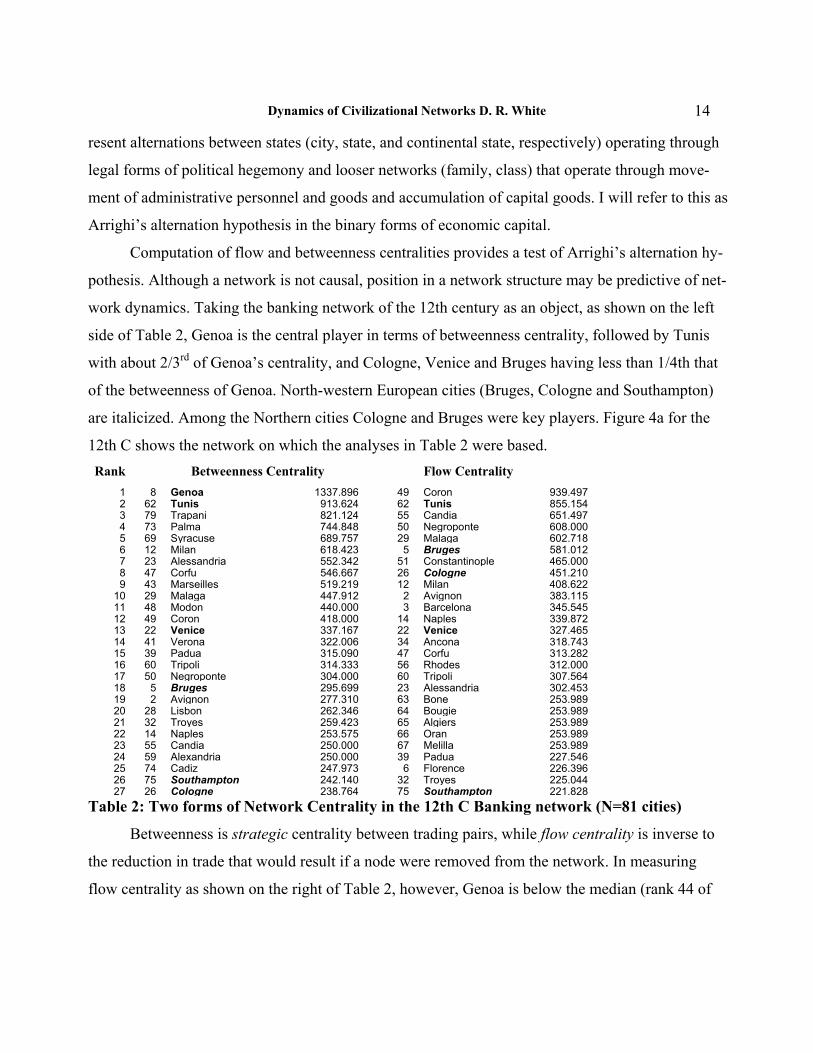
Computation of flow and betweenness centralities provides a test of Arrighi’s alternation hy-
pothesis. Although a network is not causal, position in a network structure may be predictive of net-
work dynamics. Taking the banking network of the 12th century as an object, as shown on the left
side of Table 2, Genoa is the central player in terms of betweenness centrality, followed by Tunis
with about 2/3rd of Genoa’s centrality, and Cologne, Venice and Bruges having less than 1/4th that
of the betweenness of Genoa. North-western European cities (Bruges, Cologne and Southampton)
are italicized. Among the Northern cities Cologne and Bruges were key players. Figure 4a for the
12th C shows the network on which the analyses in Table 2 were based. Rank Betweenness Centrality Flow Centrality
1 8 Genoa 1337.896 49 Coron 939.497 2 62 Tunis 913.624 62 Tunis 855.154 3 79 Trapani 821.124 55 Candia 651.497 4 73 Palma 744.848 50 Negroponte 608.000 5 69 Syracuse 689.757 29 Malaga 602.718 6 12 Milan 618.423 5 Bruges 581.012 7 23 Alessandria 552.342 51 Constantinople 465.000 8 47 Corfu 546.667 26 Cologne 451.210 9 43 Marseilles 519.219 12 Milan 408.622
10 29 Malaga 447.912 2 Avignon 383.115 11 48 Modon 440.000 3 Barcelona 345.545 12 49 Coron 418.000 14 Naples 339.872 13 22 Venice 337.167 22 Venice 327.465 14 41 Verona 322.006 34 Ancona 318.743 15 39 Padua 315.090 47 Corfu 313.282 16 60 Tripoli 314.333 56 Rhodes 312.000 17 50 Negroponte 304.000 60 Tripoli 307.564 18 5 Bruges 295.699 23 Alessandria 302.453 19 2 Avignon 277.310 63 Bone 253.989 20 28 Lisbon 262.346 64 Bougie 253.989 21 32 Troyes 259.423 65 Algiers 253.989 22 14 Naples 253.575 66 Oran 253.989 23 55 Candia 250.000 67 Melilla 253.989 24 59 Alexandria 250.000 39 Padua 227.546 25 74 Cadiz 247.973 6 Florence 226.396 26 75 Southampton 242.140 32 Troyes 225.044 27 26 Cologne 238.764 75 Southampton 221.828
Table 2: Two forms of Network Centrality in the 12th C Banking network (N=81 cities)
Betweenness is strategic centrality between trading pairs, while flow centrality is inverse to
the reduction in trade that would result if a node were removed from the network. In measuring
flow centrality as shown on the right of Table 2, however, Genoa is below the median (rank 44 of

Dynamics of Civilizational Networks D. R. White 15
81), Tunis and Venice are in the same ranks, but Cologne and Bruges, two of the three northern cit-
ies in Table 2 move from ranks 18 and 27 in betweenness, respectively, to ranks 6 and 8 in flow
centrality. The latter have over half the flow centrality of the leader. Note in both columns of Table
2 that 89% of the most central cities are from the south, reflecting the predominance of trade in the
Mediterranean by either criteria of centrality, although two key northern cities are positioned much
higher according to the flow measure. Note also how two of the three northern cities move up in
this comparison.
If Spufford is correct about transformations due to the volume of trade, we might hypothe-
size that Genoa gained its centrality by its strategic placement in the trade network, but that as the
velocity or volume of trade increases and flow centrality – which translates into potential financial
profits – becomes the criteria of success, with north-western Europe’s advantages already immanent
even in the 12th century banking network. This is consistent with Arrighi’s (Arrighi and Silver
2001) view that the economic hegemony of Genoa was based on successful competition in the trade
of commodities (dependent on strategic capacity to move goods and strike contracts) while the
emergence of economic hegemony of the Lowland countries (with Amsterdam emerging as eco-
nomic hegemon in the 17th C) was based on profit maximization.
Arrighi’s thesis is that successful implementation of each of the two alternating modes of
amassing capital stimulates imitative competition which leads to failure of the current economic
hegemon, but the successful replacement eventually succeeds by substituting or falling back on the
antithetical form of capital accumulation.
5. Volume of Trade and Commercial Transformation (Institutional Change) Nearly twenty years ago, in an essay for John Day's collection of studies, and as I repeated at the beginning of this book, I
pointed out, for the Mediterranean, that as the amount of business focused on a limited number of particular places, or rather
along a limited number of routes between these places, passed a critical mass, qualitative changes in the nature of commerce
began to take place as well as merely qualitative ones. Until the critical scale of operations was reached, on any particular route,
all that occurred was an increase in the volume of trade within the traditional framework. However, once the critical volume
was reached, the scale of enterprises which became possible allowed for a division of labour.5 When that point was reached,
5 A stronger statement of this principle is made by Iberall and Soodak (1984). If we look at the capacity of a given or-ganization for recurrent movement of goods, a critical capacity is reached where the volume exceeds this capacity and reorganization is not only possible but necessary. A city like Genoa, with thousamds of extended family cells and ships

Dynamics of Civilizational Networks D. R. White 16
businesses became large enough and continuous enough to maintain three separate parties, sedentary merchants at home, spe-
cialist carriers, and fulltime agents. Only now can I see that the difference in scale between Baltic trade, even that of Lübeck,
and Mediterranean trade, explains why the division of labour so noticeable in the south hardly occurred in the north. With this
sort of difference in the scale of trade it is not surprising that the number of inhabitants who could be supported by it was so dif-
ferent. Historical demographers have estimated that in Lübeck in the late fourteenth century the population was barely more
than 25,000, which in itself made it much the largest city on the Baltic, whilst the population of Genoa is supposed to have been
four times as great. A century later the population of Lübeck apparently had not changed, whilst that of Venice was well over
four times as great."
In the last generation historical demographers have been providing more and more sophisticated estimates of population. I
hope that, in the next generation, economic historians will be able to produce some clearer estimates of the scale of trade. We
already have a great many pieces of this jigsaw puzzle, although many have been irrecoverably lost. Yet it still remains to try to
make an overall picture from them. (2002:388-9)
From a strategic point of view within Europe, the high betweenness of Genoa and Venice in
mediating trade between other cities gives them one type of centrality, but centrality based on flow
(measured by how much total network flow is reduced with removal of a node) reflects the poten-
tial for profit making on trade flows, and also reflects the flow velocities that Spufford argues are
central to the transformations undergone by different cities and trading organization. Because of the
dispersion of trade along multiple sea and land routs, higher flow velocities and flow centrality
should be distributed away from the strategic betweenness centers of Genoa and Venice. Figure 2
shows the distribution of flow centrality for the 12th C. Genoa and Venice are low in the flow cen-
trality hierarchy (levels 3 and 4, shown by smaller than average silver spheres). At the high end are
Tunis and Malaga (the largest node and next largest), involved in the Hafsid Dynasty’s political
transformation as successors to the Almohids, with establishment of the European merchant fun-
duks enclaves in their Ifriqiya or North African cities (p20), Bruges (third largest), undergoing
commercial transformation, and Provins (fourth largest) of the Champagne Fairs, engaged in a
transformation of agent space involving money and trade representatives that leads to the migration
of the Provins nobility, the wealthiest in France, to the new political capital at Paris at century's
end.
The rising levels of flow centrality in the Lowland Countries of north-western Europe, even in
the 12th C, presages the type of capital accumulation -- profit making rather than commodity trade for moving goods might, however, be able to tolerate expansion of trade without reorganization. Florence, on the con-trary, lacking ships and large family warehouses, might have a lower threshold before reorganization occurs.

Dynamics of Civilizational Networks D. R. White 17
betweenness -- that Giovanni Arrighi sees as involved in the swing from Genoese commodity trade
hegemony in the early 13th century to the eventual rise of Dutch financial capital hegemony in the
17th C., with the financial center shifting to Amsterdam.
Bruges was one of several cities that underwent transformations involving arcaded galleries
where financial functions were concentrated (the Loggia dei Mercanti on the Piazza of the Rialto in
Venice, 1322, the Lottja or Lonja in Barcelona, 1392). Prior to the development of such galleries,
brokers had come to concentrate in particular squares that gradually came to be set aside for their
use. In Bruges the van der Beurse square came to serve this function, organized by a wealthy fam-
ily of innkeeper-brokers, giving rise to the origin of the name ‘Bourse.’ Similarly, the Piazza dei
Banchi in Genoa and Plaça dels Canvis de la Mar in Barcelona, or the Place du Change in Lyons,
all places with substantial flow centrality.
Antwerp underwent a further step in financial reorganization in the 15th century: “[It] evolved from a place notable for its regular, but temporary, fairs into a city in which business was continuously being
transacted. In the 1480s, a period of civil war in the Netherlands, Antwerp replaced Bruges as the principal permanent in-
ternational marketplace for north-western Europe. The ‘nations’ of foreign merchants, Venetian, Genoese, Florentine, Luc-
chese, Milanese, Spanish, Portuguese, Breton, English and Hanseatic, moved there.
The focus of business was the exchange, at which specialized brokers of various sorts were to be found, at fixed hours
of the day, ready to introduce to each other buyers and sellers of particular commodities, borrowers and lenders, shippers
and underwriters and to put deals together between them. (2002:50)

Dynamics of Civilizational Networks D. R. White 18
Figure 2: Flow centralities of cities in the twelfth century.
6. Landed and Commercial or Capitalist Hegemony. While Arrighi identified two distinct
forms of commercial hegemony based on material flows and wealth versus monetary flows and
profits, the other major form of hegemony in the 13th century is that of territorially-based political
power. Neither Venice nor Genoa nor the financial hegemony of Amsterdam in the later period had
much of a large landed political base. All three had strong merchant navies. France, in the 13th cen-
tury, was the uncontested political power emulated by other monarchies. It was also the most pow-
erful center of elite consumption driving the European economy. Compared to the political hegem-
ony of France, that of Genoa or Amsterdam was short lived. In relation to demographic cycles, the
commercial hegemons seem to emerge when populations throughout the region are close to carry-

Dynamics of Civilizational Networks D. R. White 19
ing capacity and inflation is at its peak (‘stagflation’). Regional crisis and new economic hegemons
of this type seem to occur together, and the duration of their hegemony seems to extend during eco-
nomic depression (often with stable or falling prices and declining real wages), when the landed
powers or hegemon(s) are at their lowest in terms of wealth or energy with which to undertake new
conquests.6
While the conditions for emergence of commercial hegemons might be predictable from the
phasing of regional demographic cycles, which of the competitors for commercial hegemony is
most likely to emerge ought to be predictable from network variables concerning position or flow,
as in section 4.
7. Transformations in Agent Space.
Transformations due to growing scope and scale, and tipping points in reorganization, are one of
the dominant findings across a host of topics in Spufford’s book. The transformations of the Cham-
pagne fairs and its nobility (Spufford, 143-150, see maps on 144 and 149),7 the wealthiest in
France, are but one example. The Counts of Brie had made their capital at Provins (143), county of
Champagne. They resided in Provins in 12thC but in the 13th were more frequently at Troyes. The
fairs, concentrated in Troyes and Provins, grew in importance between 1135 and 1285. By 1170
the ‘Troy’ had become the major international currency. Two factors contributed to the decline of
the Champagne fairs. One was increased volume of trade both by sea and land that effected a divi-
sion of labor (148), as in the Levant, whereby agents or partners attended the fairs while merchants
remained in Siena, Lucca, Florence, and other cities. Agents created contracts, for example, be-
tween Flanders and Italy, without having to use Champagne as an intermediary market. Perhaps
more important was the opening of a sea route to Bruges in the 1270s (147) made possible by the
Castilian conquest of Seville and Cadiz. This route was first navigated by Genoa, and then in the
early 1300s by Venice and Barcelona as well. Both factors contributed to replacement of agents
residing in Champagne with those residing in Paris or, starting in 1250, in London. The effects on
6 This discussion is based on discussions with Peter Turchin who has shared unpublished work bearing on the timing of European population cycles and their correlates. These observations may be expanded once these papers by Turchin and others are published. 7 See references in Spufford to Troyes 27,140,143-5-,160,201,257-8, Barsur-Aube 146,150-1, Lagny 146-50, Provins 143-50, 60, 63-4; Châlons-sur-Marne 238-40, Rheims 251,253,266

Dynamics of Civilizational Networks D. R. White 20
the fairs were ruinous (134-136). The fairs remained a money market for a time, but by 1400
Troyes had become a route to be bypassed on the road to Paris. After a marriage with Royalty, in
1284 the court of Champagne moved to Paris, and the fairs died. Paris absorbed the attributes of
Troyes and Provins (147).
Princes and their Paris palaces c. 1400. On the left the hôtels of some of the great princes are shown within the walls of Paris. The royal palaces are marked in bold in the key. On the right are the areas ruled by these princes. Their presence in Paris made the city a centre of consumption that drew on princely revenues from immense areas of territory, including principalities that were not at that time within the Kingdom of France: the Kingdom of Navarre, which was entirely independent; and the counties of Provence, Burgundy and Hainault, and part of Flanders which were all then quite clearly within the Empire, not France. Taxpayers in Na-varre or Hainault had the mortification of seeing their taxes spent in Paris, not in Pamplona or Valenciennes! (DRW note: the line of Counts of Brie and Champagne had ceased in the 13th C as their nobility had become Royals and moved to Paris with the mar-riage of the heiress of Champagne and Navarre to Phillip IV in 1284). Figure 3: Princes and their Paris palaces c. 1400 (2002:75)

Dynamics of Civilizational Networks D. R. White 21
Capital cities first sprang into prominence in the 13th C (Spufford, 60) with the remarkable
growth in urbanization, monetization and government, and as the leading landed polity, Paris was
the leader in population, attraction and influence. Figure 3 shows for the end of the 13th C how six-
teen of the great princes in the French sphere of influence, from Flanders to Navarre, had estab-
lished their hôtels within the walls of Paris.
8. Polities.
To map political systems and their changes, a list of polities was compiled from Nüsli
(2002), Periodical Historical Atlas of Europe and from McEvedy (1961), The Penguin Atlas of
Medieval History, checking them with Spufford’s text. All polities in the region with trading loca-
tions were listed, for all dates for which McEvedy provided data (1173, 1212, 1230, 1278, 1360,
1401, 1430, and 1478). To characterize the polities for the 12th through 15th centuries, the dates of
1173, 1230, 1360 and 1430 were chosen for vectors of polity identifiers for each location. These are
maintained in an excel file of cities and towns classified by polity membership, so that changes
through time and attributions pertinent to characterizing centuries can be examined in detail. Figure
4 shows nodes colored by polity memberships over four centuries for those nodes for which we
have coded trade routes.
[[note: need better political atlases recommended by Spufford, especially for the political al-
liance groups within the German Empire]]
In the networks of Figure 4, most of the new routes appear for the 15th century, which is a
temporary artifact of not having fine-tuned as yet the addition of new routes for centuries 12-14.
What is evident, however, is that Venice (in red) and the Papal States (white) expand their territo-
ries, the major Muslim polities (purple) are either taken by Castile or other caliphates, the Byzan-
tine Empire (orange) falls in the 13th C, and the routes from Italy to north-western Europe change
both through France (from Champagne fairs to the east to Tour to the east) and through the Low-
lands (from south to north) as France expands as a kingdom in the 15th C(?).

Dynamics of Civilizational Networks D. R. White 22
12th Century 13th Century
14th Century 15th Century
Figure 4: Trade and Political Units over 12-15th C (needs operation “generate in time”) Key: node size=# of links; color=polity; width of lines=importance of the banking route
In the networks of Figure 4, most of the new routes appear for the 15th century, which is a
temporary artifact of not having fine-tuned as yet the addition of new routes for centuries 12-14.
What is evident, however, is that Venice (in red) and the Papal States (white) expand their territo-
ries, the major Muslim polities (purple) are either taken by Castile or other caliphates, the Byzan-
tine Empire (orange) falls in the 13th C, and the routes from Italy to north-western Europe change

Dynamics of Civilizational Networks D. R. White 23
both through France (from Champagne fairs to the east to Tour to the east) and through the Low-
lands (from south to north) as France expands as a kingdom in the 15th C(?).
Genoa established its independence as a sea power by the decisive defeat of Pisa in 1284. In
1294 and 1298 it handed Venice decisive defeat as well. Its political hegemony began in the 14th C.
It seized Cyprus from Venice in 1373. In the War of Chioggia the Genoese were defeated at Anzio
(1378), but were victorious at Pola (1379) and then blockaded Venice. They were obliged to sur-
render when the blockade was broken. While this great maritime rivalry was at a standstill in the
late 14th C, by the 15th C (1431) Genoa’s fleet was defeated by Florence and Venice. Venice had
taken Verona, Vicenza into its expanded Republic, defeated Milan, and taken Brescia and Bergamo,
giving it some control over Alessandria and the route from Genoa to the north (Qn: Was Alessan-
dria actually in the Venetian Republic in the 14th C as shown?).
9. Capital Cities and Wealth and Investment of Rulers and Merchant. All capital cities, whether inside this band or not, were to some extent industrial cities, since the court market stimulated
luxury industries, either on the spot or in the immediate vicinity. (Spufford 2002:231)
Capital cities of polities are frequently mentioned by Spufford, who gives comparative run-
downs of indices of wealth. In the network dataset, cities are mapped into polities according to how
political boundaries change over time.
Figure 4 shows capital cities (in black) for the aggregate network, and a cross-tabulation by
degree shows that capitals are likely to be on trade routes (degree 2 or 3) but not the hubs of net-
works, there were disproportionately port cities, as might be expected. Table 3 shows the tabulation
of capital and port cities by degree (number of links per node). Degree 0 1 2 3 4 5 6 7 8
Capitals 2 1 11 8 3 2 1 0 0
Other 76 14 52 18 10 6 4 1 1
Ports
Other
Table 3: Capital Cities tabulated by degree

Dynamics of Civilizational Networks D. R. White 24
Same, showing port cities
Figure 4: Trade Network Capital and Port Cities
10. Event and Agent Data
The coding of agency requires a separate and later stage of coding. This requires going
through Spufford’s book not only to annotate all the details of the first eight areas of coding, plus
major historical events such as warfare or annexation of territory, but to identify agents of trade: the
Monarchies, royalties and aristocratic elites that play a role in events, and similarly for churches,
monasteries, families, and guilds. Conflicts and wars need also to be inventoried.
At the current time the network representation has 205 cities (222 nodes in file 222.net,
seven of which are used in the legend), and extensive time-coded attribute data in excel files. At-
tributes save in Pajek format are collected with the time-series networks in a *.paj formatted sum-
mary file.
Outside the scope of Spufford’s focus on trade is the possibility of overlapping the relatively
complete data on European Royalty for which genealogical links are already coded in network for-
mat. Codes might include succession to office, marriage ties, and successive places of rule and resi-
dence.
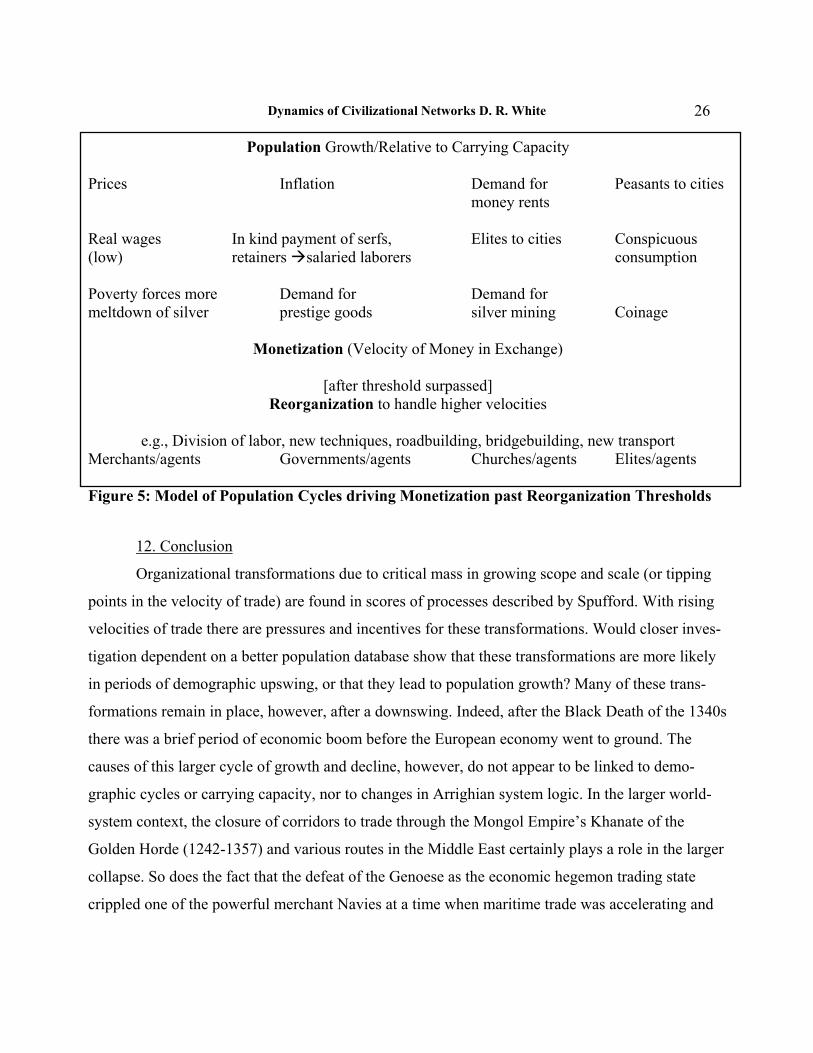
11. Modeling
Figure 5 represents the process of transformation by which higher velocities of trade affect
the reorganization of social, political, ecclesiastic, or commercial entities and their agents. As popu-
lation grows relative to carrying capacity, possible effects are shown in each of the four columns.

Dynamics of Civilizational Networks D. R. White 25
Quantitative analysis of time series across different populations will show correlations or time-lags
among these variables (generally, effects run from upper left to lower right). Their net effect is to
increase monetization, through a variety of routes. Population pressure, for example, often causes
inflation (price rises) and diminished real wages (with increased poverty creating incentives for
melting silver or gold objects which can be turned into currency; holding this tendency constant the
price of silver and gold would tend to rise). For landowners, whose welfare is cushioned relative to
peasants, the inventive is to reduce payment in kind (given the inflated value of land and reduced
real wages) and substitute salaries for laborers, while demanding cash for rents. With greater cash
income, elites are more free to move to cities, and curtail loses of obligated land while increasing
land rents, diminishing labors costs, and appointing agents to run their estates. Once aggregated into
cities, rules and elites will tend to spend more on prestige goods, increasing imports. For polities to
pay for conspicuous consumption to increase status in this context, there will be strong demand for
more bullion and coinage and demands for example for silver mining.
The net effect of all these processes is increased monetization in terms of the circulation ve-
locity of money in exchange for prestige and other commodities. For any given organization – a
family enterprise, or commercial business, for example, after the threshold surpassed whereby the
higher velocity cannot be processes without reorganization, e.g., through division of labor and
adoption of new techniques.
The model of monetization and reorganization in Figure 5 differs modestly from the discus-
sion of these issues by Spufford. He tends to refer to the twelve elements between population and
monetization as driven by modernization. He discusses the interactions among these elements in
detail. Following recent findings of Turchin and others, however, I tend to regard monetization as
an aggregate outcome of these twelve and other related factors, and to see the driver behind these
changes as differing phases of population phases. The quantitative analysis for this model will look
for correlated factors that can be aggregated into main effects, and the examines time lags. The un-
derlying dynamic is assumed to be population cycles as altered or affected by exogenous shocks
(e.g., Black Death, climate change). Reorganization, however, alters carrying capacity in support of
the upward millennial trend.
Dynamics of Civilizational Networks D. R. White 26
Population Growth/Relative to Carrying Capacity Prices Inflation Demand for Peasants to cities money rents Real wages In kind payment of serfs, Elites to cities Conspicuous (low) retainers salaried laborers consumption Poverty forces more Demand for Demand for meltdown of silver prestige goods silver mining Coinage
Monetization (Velocity of Money in Exchange)
[after threshold surpassed]
Reorganization to handle higher velocities
e.g., Division of labor, new techniques, roadbuilding, bridgebuilding, new transport Merchants/agents Governments/agents Churches/agents Elites/agents Figure 5: Model of Population Cycles driving Monetization past Reorganization Thresholds
12. Conclusion
Organizational transformations due to critical mass in growing scope and scale (or tipping
points in the velocity of trade) are found in scores of processes described by Spufford. With rising
velocities of trade there are pressures and incentives for these transformations. Would closer inves-
tigation dependent on a better population database show that these transformations are more likely
in periods of demographic upswing, or that they lead to population growth? Many of these trans-
formations remain in place, however, after a downswing. Indeed, after the Black Death of the 1340s
there was a brief period of economic boom before the European economy went to ground. The
causes of this larger cycle of growth and decline, however, do not appear to be linked to demo-
graphic cycles or carrying capacity, nor to changes in Arrighian system logic. In the larger world-
system context, the closure of corridors to trade through the Mongol Empire’s Khanate of the
Golden Horde (1242-1357) and various routes in the Middle East certainly plays a role in the larger
collapse. So does the fact that the defeat of the Genoese as the economic hegemon trading state
crippled one of the powerful merchant Navies at a time when maritime trade was accelerating and

Dynamics of Civilizational Networks D. R. White 27
being reorganized through specialized agents. These conclusions, however, are only tentative. A
review of causal or feedback principles is given in the abstract of the argument, derived from the
complex interacting systems principles evident or expressed in Spufford’s book.
Much more can and remains to be done in terms of network analysis. Only one set of hy-
potheses has been presented and tested: that Genoa’s network hegemony rested on betweenness
centrality, while the rising economic power of certain of the north-western European cities, even in
the 12th century, was based on very different principles, those of flow centrality and, presumably,
profit-taking. The extended implication is that the eventual shift to Dutch economic hegemony,
which took centuries, was based on this shift. Aspects of this set of hypotheses could be tested for
the 13th through 15th centuries with the network data.8 If the analysis were to move into agent
space, the motivations for conflicts and wars might be useful to model in terms of network-based
hypotheses.
Expansion of the project could go in several directions: one, to expand the linkage data to
the Hanseatic League, Mongols and Middle East, India, Southeast Asia, Africa and China. Second,
the temporal coding at generational intervals rather than centuries, seems to have greater payoff in
terms of providing a statistical basis for testing dynamical hypotheses and eventually doing more
generalized dynamical modeling. Third, the exploration of agent spaces can be done with consider-
able effort, both at the level of adding additional layers to the database, and in terms of simulations.
What has been gratifying in this project, still far from complete even for this first stage, is
that network measures and principles appear to play a useful role in understanding macrosocial dy-
namics. The Arrighian hypotheses as to competition among and alternations of forms in economic
hegemony can be given a foundation in network measurements and testable hypotheses. They play
into hypotheses and economic data provided by Fischer (1996) and seem to provide a basis for see-
ing some of the regularities that come out of Spufford’s exquisite descriptions of the many critical
mass phenomena in organizational transformations due to growing scope and scale, many of which
a cumulative and lay the foundation for the urban, transport, economic, infrastructural and operat-
ing principles of the subsequent macrosystems. 8 The question raided by Pomeranz ( ) is whether profit-taking could have boosted the European economy once the mines of Eastern Europe were exhausted, i.e., whether Europe’s rebound was due to the opening of the New World.
Dynamics of Civilizational Networks D. R. White
28
Acknowledgments This work, with help from Joseph Wehbe, was supported by ISCOM, a European Union project on Information Society as a Complex System, co-PIs David Lane, Sander van der Leeuw and Geoffrey West. Funding for participation of Joseph Wehbe in the coding of city data was also supported by ISCOM. An early draft of the paper was presented at the Working Group on Macrosocial Systems, April 28-May 2, 2004, at the Santa Fe Institute. The paper benefited from comments by Working Group participants, including those of Peter Spufford. Errors of fact or interpretation, however, are mine along. The slides that accompany this paper, at http://eclectic.ss.uci.edu/~drwhite/Civ, were given at the Workshop on Dynamics of groups and institutions: Their emergence, co-evolution and environment. Santa Fe Institute and the Research Centre of the Slovenian Academy of Sciences, from June 7 to June 11, 2004. I am grateful in both presentations for funding from the Santa Fe In-stitute. References Abu- Lughod, J. 1993. The World System in the Thirteenth Century: Dead-End or Precursor? Washington, D.C.: American Historical Association. Arrighi, G. 1994. The Long Twentieth Century. London: Verso Arrighi, G. and B. J. Silver. 2001. 'Capitalism and World (Dis)order.' Review of International Studies 27:257-279. Chandler, A. D. 1977. The Visible Hand: The Managerial Revolution in American Business. Cambridge: Harvard University Press. -------- 1990. Scale and Scope: The Dynamics of Industrial Capitalism Corporation. Cam-bridge, MA: Harvard University Press. Fischer, D. H. 1996. The Great Wave: Price Revolutions and the Rhythm of History. Oxford: Oxford University Press. Freeman, L. C. 1979. ‘Centrality in social networks: Conceptual clarication.’ Social Networks 1:215-239. Freeman, L. C., S. Borgatti, D. R. White. 1991. ‘Centrality in valued graphs: A measure of be-tweenness based on network flow.’ Social Networks 13:141-154. Goldstone, J. A. 1991. Revolution and Rebellion in the Early Modern World. University of California Press. eScholarship edition http://ark.cdlib.org/ark:/13030/ft9k4009kq/

Dynamics of Civilizational Networks D. R. White
29
Iberall, A.S., and H. Soodak. Physical basis for complex systems--Some propositions relating lev-els of organization. 1978, Collective Phenomena ,3:9-24. McEvedy. C. 1961. The Penguin Atlas of Medieval History. Middlesex: Penguin Books. Moody, J., D. R. White. ‘Structural Cohesion and Embeddedness: A Hierarchical Conception of Social Groups.’ American Sociological Review 68(1):1-25. . Nefedov, S. 2003. “The Theory of Demographic Cycles and the Social Evolution of Ancient and Medieval Oriental Societies,” (English translation) Vostok-Oriens 3:5-22. Nüsli, 2002. Periodical Historical Atlas of Europe. http://www.euratlas.com/time2.htm. Pomeranz. K. L. 2000. The Great Divergence: China, Europe, and the Making of the Modern World Economy. Princeton: Princeton University Press. Smith, D. and D. R. White. 1992. ‘Structure and Dynamics of the Global Economy: Network Analysis of International Trade 1965-1980.’ Social Forces 70:857-894. Soodak, H. and A.S. Iberall. 1978.Homeokinetics: A physical science for complex systems. Sci-ence, 201: 579-582. Spufford, P. 2002. Power and Profit: The Merchant in Medieval Europe. London: Thames & Hudson. Turchin, P. 2004. Dynamical Analysis of Socio-Economic Oscillations: England, 1100-1900. Un-published. White, D. R. 1988. ‘Predictors of Mobility in the World-Trade Hierarchy.’ 12th Annual Sunbelt Social Networks Conference. San Diego. White, D. R., and D. A. Smith. 1988 Large-Scale Network of World Economy: Social scientists use the CRAY. Interview: Douglas R. White, David A. Smith. Science at the San Diego Supercom-puter Center 1987: 27-28. White, D. R., and K. P. Reitz. 1983 ‘Graph and Semigroup Homomorphisms.’ Social Networks 5:193-234. Wilkinson, D. 2004. ‘The Globalization of the World Systems, with Sequences of their Power Structures.’ Specialist Workshop on Globalization in the World-System: Mapping Change over Time. Institute for Research on World-Systems. University of California, Riverside. Feb., 2004.

Dynamics of Civilizational Networks D. R. White
30
Appendix
Codes 1. Spufford Population codes (1,000s) (Chase-Dunn estimates in 1,000s also. # 1000s frequencies 6 300- 5 200-299 10 4 100-199 10 3 60-99 4 2 40-59 2 1 10-39 2 2. Polity codes (these stand to be corrected as applied to cities per century) K-kingdom E-empire P-principality(ies) S-sultanate D-despotate
1173 (12thC) 1212
1230 (13thC) 1278
1360 (14thC) 1401
1430 (14thC) 1478 # Capitals
1 EnglandK EnglandK EnglandK EnglandK EnglandK EnglandK EnglandK EnglandK 1 London-Westminster
2 GermanE GermanE GermanE GermanE GermanK GermanK GermanK GermanHE Holland 2 Amsterdam
3 GermanE GermanE GermanE GermanE GermanK GermanK GermanK GermanHE Brabant 3 Leuven
4 GermanE GermanE GermanE GermanE GermanK GermanK GermanK GermanHE Flanders 4 Ghent
5 GermanE GermanE GermanE GermanE GermanK GermanK GermanK SwissConfeder-acy Switzerland 5 Bern
6 GermanE GermanE GermanE GermanE GermanK GermanK GermanK Other(Italy,Austria,etc) 6 Prague, etc
7 FranceK FranceK FranceK FranceK FranceK FranceK FranceK FranceK 7 Paris
8 Venice Venice Venice Venice Venice Venice Venice Venice 8 Venice
9 PisaR PisaR PisaR PisaR Genoa(1284) Genoa Genoa Genoa(French Protectorate) 9 Genoa
10 PapalState(Italy PapalState(Italy) PapalState(Italy) PapalState(Incl Avignon,Italy)
PapalState(Incl Avi-gnon,Italy) 10 Rome, Avignon
11 Naples Naples Naples Naples Naples 11 Naples
12 SicilyK SicilyK SicilyK SicilyK SicilyK SicilyK SicilyK 12 Palermo
13 AragonK AragonK AragonK AragonK AragonK AragonK AragonK AragonK 13 Barcelona
14 NavarreKK NavarreK NavarreK NavarreK NavarreK NavarreK NavarreK NavarreK 14 Vitoria-Gasteiz
15 CastilleK CastilleK CastilleK CastilleK CastilleK CastilleK CastilleK CastilleK 15
16 LeonK LeonK 16
17 PortugalK PortugalK PortugalK PortugalK PortugalK PortugalK PortugalK PortugalK 17 Lisbon
18 Knights-Sword Knights-Sword 18
19 Teu-tonicKnights TeutonicKnights TeutonicKnights TeutonicKnights TeutonicKnights TeutonicKnights 19
20 Lithuanians LithuaniaP LithuaniaP 20
21 PolishPs PolishPs PolishPs PolishPs PolandP Poland-LithuaniaP Poland-LithuaniaP PolandK 21 Cracow
22 Wallachia Wallachia Wallachia Wallachia 22 Târgoviste
23 BulgarianE BulgarianE BulgarianE BulgarianE 23 Sofia
24 VolnyniaP VolnyniaP VolnyniaP VolnyniaP 24

Dynamics of Civilizational Networks D. R. White
31
25 GaliciaP GaliciaP GaliciaP MoldaviaP MoldaviaP MoldaviaP MoldaviaP 25Halicz in Ukraine
26 HungaryK HungaryK HungaryK HungaryK HungaryK HungaryK HungaryK HungaryK 26 Buda
27 Serbs SerbianK SerbianK SerbianPs SerbianP SerbianP 27 Zagreb
28 BosniaP 28 Sarajevo
29 EpirusD SalonikaE EpirusD 29 Salonika
30 LatinEmpire LatinEmpire LatinEmpire LatinEmpire LatinStates LatinStates 30 Istanbul
31 Monemvasia 31 Monemvasia
32
ByzantineEmpire (betrayed in 1204 by Venetians), fell to Seljuks, re-taken by Nicaea NicaeaE NicaeaE ByzantineEmpire ByzantineEmpire ByzantineEmpire ByzantineEmpire 32 Bursa 1335
33 JerusalemK 33
34 SeljukS SeljukS SeljukS SeljukS OttomanSultan-ate
OttomanSultan-ate OttomanSultanate OttomanSultanate 34 Damascus
35 Four Emirates SixEmirates 35
36 RhodesD KnightsSt.John KnightsSt.John KnightsSt.John KnightsSt.John 36 Rhodes
37 TrebizondE TrebizondE TrebizondE TrebizondE TrebizondE TrebizondE TrebizondE 37 Trebizond
38 GeorgiaK GeorgiaK GeorgiaK GeorgiaK GeorgiaK GeorgiaK GeorgiaK GeorgiaK 38 Tiblisi
39 KaramanE KaramanE KaramanE 39
40 KastamuniE KastamuniE KastamuniE 40
41 Alans Alans Alans Alans Alans 41
44 Cumans Cumans Cumans 44
45 KhanateMon-gols KhanateMongols KhanateMongols KhanateMongols KhanateMongols KhanateMongols 45 Sarai
46 CrimeaKhanate CrimeaKhanate 46
47 CyprusK CyprusK CyprusK 47 Cyprus
48 ArmeniaK ArmeniaK ArmeniaK ArmeniaK 48 Yerevan
49 Tripoli Antioch-Tripoli Antioch-Tripoli Tripoli 49 Tripoli?
50 AcreK AcreK AcreK 50 Acre
51 Zangid AyyubidS AyyubidS MamlukeS MamlukeS MamlukeS MamlukeS MamlukeS 51 Alexandria
52 MuwahidC MuwahidC MuwahidC HafsidCaliphate HafsidCaliphate HafsidCaliphate HafsidCaliphate HafsidCaliphate 52 Fez?
53 HafsidEast HafsidEast 53 Bougie
54 ZiyanidEmirate ZiyanidEmirate ZiyanidEmirate 54 Algiers
55 MaranidSultan-ate MaranidSultanate MaranidSultanate MaranidSultanate WattasidS 55 Melilla
56 GranadaEmirate GranadaEmirate GranadaEmirate GranadaEmirate GranadaEmirate 56 Granada
98 Indep COMMUNE leading to REPUBLIC 98Florence, Siena, Lucca
99 City REPUBLIC other than Venice, Genoa 99 Venice

Dynamics of Civilizational Networks D. R. White
32
Notes pursuant to coding of Spufford book: 1. Break in northern Flanders route in 15th: One town that transferred to Burgundy; a new
direct road was created around it to maintain the northern route. 2. Decision to treat higher-order cities as having permanent existence for our purposes,
Bruges, etc, and put double set of brackets [general] [wollens] 3. Then the specific woollen production will show up in the partitions. 4. Not clear yet whether we want to have a separate ARC (directed...) but that may be the
case for wool/woollens, etc. 5. Added links from English seaports to Low Countries: see pages P328 MAP: wool from
England FROM TO (AND BACK) 10 London 44 Antwerp 192 Hull 6 Bruge 193 Boston 111 St-Omer 88 Sandwich - Calais captured by English 1346 P329, kept by England Montreuil – a French port – nothing in Spufford except map p. 233 St Omer – French, marshes drained in 12th C.- became a port Douai - French P327 list, to mid 13th C Flemish traders of raw wool in London: Ypres, Dixmude, Aarden-burg, Lille, Oostburg, Damme, Furnes, Turnai. Italian merchants could borrow at lower rates could pay in advance, eased the Flemings out of England took their place as ex-porters, by early 14th esp. to Bruges, but also to Italy (P380 too). Great Florentine houses were Bardi and Peruzzi. P328 Wave of Florentine bankruptcies. Native English ex-porters took over. But English crown taxed English wool heavily P388 Qualitative organizational changes with volume of trade - Iberall P380 War of Chiogga Genoa-Venice Current *.net file (accompanied by *.clu files for city size, products (woollens, sil-ver, gold...), Pajek Format: Example of the network Numbers Names Coordinates Time Codes *Vertices 193 1 "1 Asti" 0.3955 0.4940 0.5000 [12-15] 2 "1 Avignon" 0.3212 0.4493 0.5000 [12-15] 3 "1 Barcelona" 0.2732 0.5804 0.5000 4 "1 Barletta" 0.6511 0.7309 0.5000 5 "1 Bologna" 0.6328 0.5563 0.5000 6 "1 Bruges-woollens” 0.3806 0.1658 0.5000 [12-15] [13-14] 7 "1 Florence" 0.5962 0.5824 0.5000 [12-15] 8 "1 Geneva" 0.3755 0.4392 0.5000 [12-15] 9 "1 Genoa" 0.4530 0.5345 0.5000 10 "1 London-woollens” 0.2793 0.1647 0.5000 [12-15] [12-12] 11 "1 Lucca" 0.5508 0.5476 0.5000 [12-15] 12 "1 Lyons" 0.3351 0.3833 0.5000 [12-15] 13 "1 Milan" 0.4640 0.4350 0.5000 14 "1 Montpelier" 0.2584 0.4663 0.5000 15 "1 Naples" 0.5242 0.7835 0.5000 16 "1 Palermo" 0.4772 0.7999 0.5000 17 "1 Paris" 0.3941 0.2491 0.5000 18 "1 Perugia" 0.6226 0.6738 0.5000

Dynamics of Civilizational Networks D. R. White
33 19 "1 Pisa" 0.5379 0.5824 0.5000 20 "1 Rome" 0.5751 0.7052 0.5000 21 "1 Seville" 0.1553 0.6970 0.5000 22 "1 Siena" 0.5813 0.6333 0.5000 23 "1 Valencia" 0.2826 0.6300 0.5000 24 "1 Venice" 0.6675 0.5108 0.5000 25 "2 Alessandria" 0.4429 0.4878 0.5000 26 "3 Alicante" 0.2952 0.7032 0.5000 27 "3 Basel" 0.5314 0.2906 0.5000 28 "3 Cologne" 0.5419 0.1506 0.5000 29 "3 Gaeta" 0.5665 0.7540 0.5000 30 "3 Lisbon" 0.0977 0.6383 0.5000 31 "3 Malaga" 0.2185 0.7407 0.5000 32 "3 Perpignan" 0.2721 0.5307 0.5000 33 "3 Piacenza" 0.5121 0.4841 0.5000 34 "3 Troyes" 0.3699 0.3223 0.5000 35 "3 Turin" 0.3583 0.5134 0.5000 36 "4 Ancona" 0.6350 0.6114 0.5000 37 "4 Buda" 0.7139 0.2872 0.5000 38 "4 Cagliari" 0.4588 0.7327 0.5000 39 "3 Ferrara" 0.6033 0.4723 0.5000 40 "4 Mallorca" 0.4198 0.6662 0.5000 41 "4 Padua" 0.6330 0.4336 0.5000 42 "4 Ragusa" 0.6845 0.7019 0.5000 43 "4 Verona" 0.5314 0.4336 0.5000 44 "5 Antwerp" 0.1398 0.0032 0.5000 45 "5 Lubeak" 0.4859 0.0054 0.5000 46 "5 Marseilles" 0.4189 0.5552 0.5000 47 "6 Brussels-woollens" 0.4485 0.1506 0.5000 [12-15] [13-14] 48 "6 Cordoba" 0.1541 0.7819 0.5000 [12-15] 49 "6 Ghent-woollens" 0.4079 0.1560 0.5000 [12-15] [13-14] 50 "6 Granada" 0.1943 0.6787 0.5000 [12-15] 51 "6 Prague" 0.6842 0.1841 0.5000 [12-15] 52 "6 Tours" 0.3923 0.2991 0.5000 53 "7 Douai-woollens" 0.3718 0.1939 0.5000 [12-15] [12-15] 54 "7 Leuven-woollens” 0.4687 0.1495 0.5000 [12-15] [13-14] 55 "7 Lier-woollens" 0.1352 0.0441 0.5000 [12-15] [14-15] 56 "7 Ypres-woollens" 0.1398 0.0226 0.5000 [12-15] [13-14] 57 "7 Modena?" 0.5645 0.5183 0.5000 [12-15] 58 "9 Zara" 0.7179 0.5650 0.5000 [12-15] 59 "9 Corfu" 0.7220 0.6257 0.5000 60 "9 Modon" 0.7718 0.6622 0.5000 61 "9 Coron" 0.8254 0.6448 0.5000 62 "9 Negroponte" 0.8338 0.5685 0.5000 63 "9 Constantinople" 0.8365 0.5272 0.5000 64 "9 Sinope" 0.8843 0.5021 0.5000 65 "9 Trebizond" 0.9153 0.4597 0.5000 66 "9 Tana" 0.8954 0.3946 0.5000 67 "9 Candia" 0.8697 0.6984 0.5000 68 "9 Rhodes" 0.8944 0.7463 0.5000 69 "9 Famagusta" 0.9163 0.7782 0.5000 70 "9 Beirut" 0.9514 0.8282 0.5000 71 "9 Alexandria" 0.8211 0.9438 0.5000 72 "9 Tripoli" 0.7118 0.9525 0.5000 73 "9 Jerba" 0.5972 0.9128 0.5000 74 "9 Tunis" 0.5751 0.8545 0.5000 75 "9 Bone" 0.5193 0.8545 0.5000 76 "9 Bougie" 0.4477 0.8607 0.5000 77 "9 Algiers" 0.3815 0.8656 0.5000 78 "9 Oran" 0.3110 0.8656 0.5000 79 "9 Melilla" 0.2468 0.8693 0.5000 80 "9 Almeria" 0.2837 0.7304 0.5000 81 "9 Syracuse" 0.7329 0.7577 0.5000 82 "9 Messina" 0.3836 0.8247 0.5000 83 "9 Civitaveccia” 0.4968 0.6666 0.5000

Dynamics of Civilizational Networks D. R. White
34 84 "9 Aigues Mortes" 0.3637 0.5779 0.5000 85 "9 Palma" 0.3899 0.7776 0.5000 86 "9 Cadiz" 0.1111 0.7466 0.5000 87 "9 Southhampton” 0.2465 0.2592 0.5000 88 "9 Sandwich" 0.2705 0.2004 0.5000 89 "9 Bari" 0.6960 0.6754 0.5000 90 "10 Murcia" 0.2647 0.6593 0.5000 91 "10 Trapani" 0.5740 0.8151 0.5000 92 "Bank cities" 0.0628 0.0659 0.5000 93 "Financial Courier cities" 0.0628 0.1014 0.5000 94 "Financial junction site" 0.0625 0.1335 0.5000 95 "Other Cities Spufford:26" 0.0617 0.1679 0.5000 96 "Not in Spufford map" 0.0625 0.1991 0.5000 97 "Not in Spufford map" 0.0628 0.2308 0.5000 98 "Ports for Venice- Genoa" 0.0625 0.2616 0.5000 99 "pp233,230,231,373,329" 0.0625 0.3057 0.5000 [12-15] 100 "233Arras-woollens” 0.3524 0.1972 0.5000 [12-12] 101 "233Cambrai-woollens" 0.3969 0.2153 0.5000 [12-15] 102 "233Courtrai-woollens" 0.4031 0.1798 0.5000 [14-15] 103 "233Honsdechoote-woollens" 0.3672 0.1744 0.5000 [12-15] 104 "233Huy" 0.4766 0.1773 0.5000 105 "233Liege" 0.4980 0.1744 0.5000 [12-15] 106 "233Lille-woollens” 0.4094 0.1798 0.5000 [12-12] 107 "233Mons" 0.4370 0.1874 0.5000 [12-15] 108 "233Montreuil" 0.3295 0.2004 0.5000 [12-15] 109 "233Namur" 0.4573 0.1820 0.5000 110 "233Poperinghe-woollens" 0.3750 0.1808 0.5000 [14-15] 111 "233St Omer-woollens" 0.3609 0.1808 0.5000 [12-12] 112 "233Tournai-woollens" 0.4227 0.1787 0.5000 [12-15] 113 "233Valenciennes-woollens" 0.4180 0.2002 0.5000 [13-14] 114 "233Wervik-woollens" 0.3852 0.1916 0.5000 [14-15] 115 "233Aalst-woollens” 0.4291 0.1549 0.5000 [13-14] 116 "233Diest-woollens” 0.4844 0.1582 0.5000 [14-15] 117 "233Maastricht" 0.5078 0.1628 0.5000 [12-15] 118 "233Mechelen-woollens" 0.4188 0.1636 0.5000 [13-14] 119 "233St Truiden-woollens" 0.5059 0.1439 0.5000 [12-15] 120 "233Tienen-woollens" 0.4907 0.1473 0.5000 [14-15] 121 "233Delft-woollens” 0.4023 0.1281 0.5000 [12-15] 122 "233Leiden-woollens" 0.4055 0.1141 0.5000 123 "233Beverley-woollens" 0.3110 0.1083 0.5000 [12-12] 124 "233Bradford-woollens" 0.2793 0.1203 0.5000 [14-15] 125 "233Bristol-woollens" 0.2000 0.1701 0.5000 [14-15] 126 "233Castle Combe-woollens" 0.2273 0.1614 0.5000 [14-15] 127 "233Coggeshall-woollens" 0.2854 0.1318 0.5000 [14-15] 128 "233Colchester-woollens" 0.2948 0.1310 0.5000 [12-15] 129 "233Coventry-woollens" 0.2547 0.0883 0.5000 [14-15] 130 "233Frome-woollens” 0.2053 0.1857 0.5000 [14-15] 131 "233Halifax-woollens" 0.2539 0.0389 0.5000 [14-15] 132 "233Lavenham-woollens" 0.3233 0.1278 0.5000 [14-15] 133 "233Leeds-woollens” 0.2574 0.0298 0.5000 [14-15] 134 "233Leicester-woollens" 0.2457 0.0895 0.5000 [12-12] 135 "233Lincoln-woollens" 0.2705 0.0588 0.5000 [12-12] 136 "233Long Melford-woollens" 0.2732 0.0903 0.5000 [14-15] 137 "233Northampton-woollens" 0.2655 0.1011 0.5000 [12-12] 138 "233Oxford-woollens" 0.2328 0.1426 0.5000 [12-12] 139 "233Ripon-woollens” 0.2579 0.0190 0.5000 [14-15] 140 "233Salisbury-woollens" 0.2106 0.2040 0.5000 [14-15] 141 "233Stamford-woollens" 0.2692 0.0733 0.5000 [12-12] 142 "233Stroud-woollens" 0.2068 0.1438 0.5000 [14-15] 143 "233Sudbury-woollens" 0.2743 0.0820 0.5000 [12-15] 144 "233Winchester-woollens" 0.2223 0.2044 0.5000 [12-12] 145 "233York-woollens" 0.2664 0.0301 0.5000 [12-15] 146 "273Goslar- silver" 0.7709 0.0195 0.5000 [10-12] 147 "273Montieri- silver" 0.7471 0.0953 0.5000 [12-13] 148 "273Friesach- silver" 0.7471 0.1224 0.5000 [12-13]
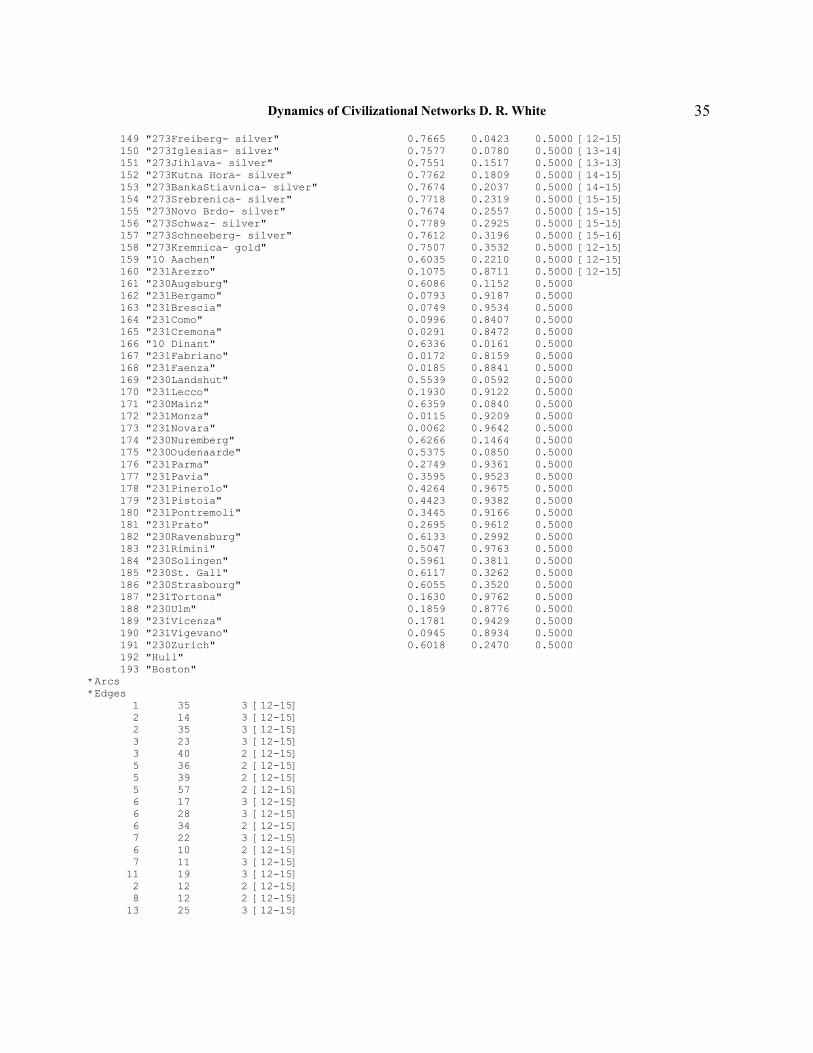
Dynamics of Civilizational Networks D. R. White
35 149 "273Freiberg- silver" 0.7665 0.0423 0.5000 [12-15] 150 "273Iglesias- silver" 0.7577 0.0780 0.5000 [13-14] 151 "273Jihlava- silver" 0.7551 0.1517 0.5000 [13-13] 152 "273Kutna Hora- silver" 0.7762 0.1809 0.5000 [14-15] 153 "273BankaStiavnica- silver" 0.7674 0.2037 0.5000 [14-15] 154 "273Srebrenica- silver" 0.7718 0.2319 0.5000 [15-15] 155 "273Novo Brdo- silver" 0.7674 0.2557 0.5000 [15-15] 156 "273Schwaz- silver" 0.7789 0.2925 0.5000 [15-15] 157 "273Schneeberg- silver" 0.7612 0.3196 0.5000 [15-16] 158 "273Kremnica- gold" 0.7507 0.3532 0.5000 [12-15] 159 "10 Aachen" 0.6035 0.2210 0.5000 [12-15] 160 "231Arezzo" 0.1075 0.8711 0.5000 [12-15] 161 "230Augsburg" 0.6086 0.1152 0.5000 162 "231Bergamo" 0.0793 0.9187 0.5000 163 "231Brescia" 0.0749 0.9534 0.5000 164 "231Como" 0.0996 0.8407 0.5000 165 "231Cremona" 0.0291 0.8472 0.5000 166 "10 Dinant" 0.6336 0.0161 0.5000 167 "231Fabriano" 0.0172 0.8159 0.5000 168 "231Faenza" 0.0185 0.8841 0.5000 169 "230Landshut" 0.5539 0.0592 0.5000 170 "231Lecco" 0.1930 0.9122 0.5000 171 "230Mainz" 0.6359 0.0840 0.5000 172 "231Monza" 0.0115 0.9209 0.5000 173 "231Novara" 0.0062 0.9642 0.5000 174 "230Nuremberg" 0.6266 0.1464 0.5000 175 "230Oudenaarde" 0.5375 0.0850 0.5000 176 "231Parma" 0.2749 0.9361 0.5000 177 "231Pavia" 0.3595 0.9523 0.5000 178 "231Pinerolo" 0.4264 0.9675 0.5000 179 "231Pistoia" 0.4423 0.9382 0.5000 180 "231Pontremoli" 0.3445 0.9166 0.5000 181 "231Prato" 0.2695 0.9612 0.5000 182 "230Ravensburg" 0.6133 0.2992 0.5000 183 "231Rimini" 0.5047 0.9763 0.5000 184 "230Solingen" 0.5961 0.3811 0.5000 185 "230St. Gall" 0.6117 0.3262 0.5000 186 "230Strasbourg" 0.6055 0.3520 0.5000 187 "231Tortona" 0.1630 0.9762 0.5000 188 "230Ulm" 0.1859 0.8776 0.5000 189 "231Vicenza" 0.1781 0.9429 0.5000 190 "231Vigevano" 0.0945 0.8934 0.5000 191 "230Zurich" 0.6018 0.2470 0.5000 192 "Hull" 193 "Boston" *Arcs *Edges 1 35 3 [12-15] 2 14 3 [12-15] 2 35 3 [12-15] 3 23 3 [12-15] 3 40 2 [12-15] 5 36 2 [12-15] 5 39 2 [12-15] 5 57 2 [12-15] 6 17 3 [12-15] 6 28 3 [12-15] 6 34 2 [12-15] 7 22 3 [12-15] 6 10 2 [12-15] 7 11 3 [12-15] 11 19 3 [12-15] 2 12 2 [12-15] 8 12 2 [12-15] 13 25 3 [12-15]
Dynamics of Civilizational Networks D. R. White
36 13 34 3 [12-15] 13 43 2 [12-15] 14 32 3 [12-15] 15 16 2 [12-15] 15 29 3 [12-15] 17 34 3 [12-15] 7 19 2 [12-15] 21 30 3 [12-15] 20 22 3 [12-15] 23 26 3 [12-15] 24 37 2 [12-15] 1 25 3 [12-15] 9 25 3 [12-15] 26 31 3 [12-15] 13 27 3 [12-15] 27 28 3 [12-15] 20 29 3 [12-15] 21 31 3 [12-15] 3 32 3 [12-15] 25 33 3 [12-15] 13 34 3 [12-15] 12 34 2 [12-15] 36 42 2 [12-15] 11 57 3 [12-15] 33 57 3 [12-15] 38 40 2 [12-15] 24 41 2 [12-15] 39 41 2 [12-15] 41 43 2 [12-15] 24 58 4 [12-15] 58 59 4 [12-15] 59 60 4 [12-15] 59 81 4 [12-15] 60 61 4 [12-15] 61 67 4 [12-15] 61 62 4 [12-15] 62 63 4 [12-15] 63 64 4 [12-15] 64 65 4 [12-15] 65 66 4 [12-15] 63 66 4 [12-15] 67 68 4 [12-15] 67 71 4 [12-15] 68 69 4 [12-15] 69 70 4 [12-15] 72 73 4 [12-15] 73 74 4 [12-15] 74 75 4 [12-15] 75 76 4 [12-15] 76 77 4 [12-15] 77 78 4 [12-15] 78 79 4 [12-15] 31 79 4 [12-15] 31 80 4 [12-15] 72 81 4 [12-15] 74 81 4 [12-15] 16 82 4 [12-15] 15 16 4 [12-15] 16 85 4 [12-15] 15 83 4 [12-15] 19 83 4 [12-15] 46 84 4 [12-15] 3 84 4 [12-15] 19 46 4 [12-15]

Dynamics of Civilizational Networks D. R. White
37 3 23 4 [12-15] 85 86 4 [12-15] 30 86 4 [12-15] 30 87 4 [12-15] 6 88 4 [12-15] 10 88 4 [12-15] 87 88 4 [12-15] 71 72 4 [12-15] 81 89 4 [12-15] 36 89 4 [12-15] 24 36 4 [12-15] 9 15 5 [12-15] 9 91 5 [12-15] 9 85 5 [12-15] 9 46 5 [12-15] 31 85 5 [12-15] 31 86 5 [12-15] 15 83 5 [12-15] 23 90 5 [12-15] 80 90 5 [12-15] 38 85 5 [12-15] 38 82 5 [12-15] 74 91 5 [12-15] 38 82 5 [12-15] 28 117 1 [12-15] 117 119 1 [12-15] 119 120 1 [12-15] 54 120 1 [12-15] 47 54 1 [12-15] 47 115 1 [12-15] 49 115 1 [12-15] 6 49 1 [12-15] 28 105 1 [12-15] 105 117 1 [12-15] 104 105 1 [12-15] 104 109 1 [12-15] 107 109 1 [12-15] 107 113 1 [12-15] 53 113 1 [12-15] 53 100 1 [12-15] 100 108 1 [12-15] 47 49 1 [15-15] l “drw: bypass of Aalst which transferred to Burgundy” 10 45 1 10 6 1 10 111 1 192 45 1 192 6 1 192 111 1 193 45 1 193 6 1 193 111 1 88 45 1 88 6 1 88 111 1
Spufford quotes… not used In the end the only safe comparison that I could make was that between Lübeck and Genoa in the years between 1379 and
1384, when the seaborne trade at Genoa was five or six times greater than that at Lübeck. Since Lübeck is generally conceded to have been dominant on the Baltic and to have had a very large share of Hanseatic trade, whilst Genoa was rivaled, although not yet over-shadowed by Venice, it is clear that Mediterranean trade was many times greater in scale than that on the Baltic. (2002:388)

Dynamics of Civilizational Networks D. R. White
38
An example that elegantly ties together a number of these strands is provided by the accounts of the Tresor du Louvre. Philip IV of France, in need of money for his war with Aragon, was granted permission by Pope Nicholas IV to tax the reve-nues of the French clergy. In 1289 one of the largest international business houses in Florence, the company of Musciatto and Albizzo di Guido di Figline, commonly known as the 'Franzesi' on account of the amount of business they did for the king of France, were nominated as receivers of this tax, a tenth, in the Auvergne. The company sent out three men, led by NofTo Dei, their resident agent at the Champagne fairs, who collected it in ready cash and transported it by cart to the May fair at Provins, where the coin was used for loans and the purchase of goods." At one stroke coin was drawn out of rural Auvergne directly into the mainstream of international banking and trade. (2002:59)