civil society through a research lens. elizabeth boris 3-26 ppt.pdf · civil society through a...
TRANSCRIPT
Civil Society through a Research LensElizabeth T. Boris, Ph.D.
DirectorCenter on Nonprofits and Philanthropy
Exploring the Big Questions ConferenceMarch 26, 2015
Los Angeles, California
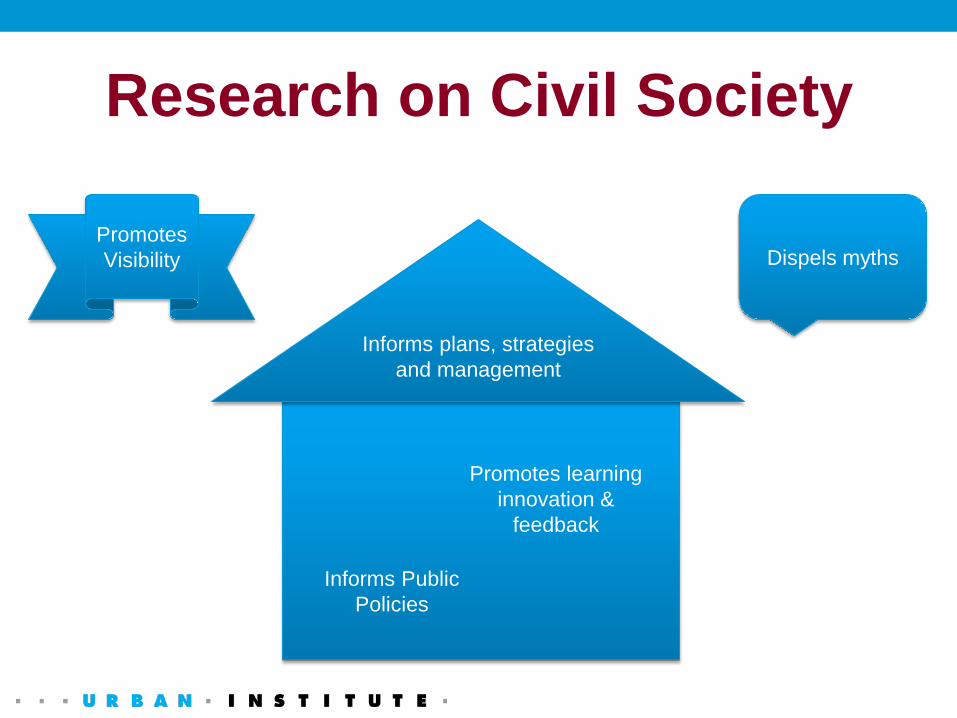
Research on Civil Society
Informs plans, strategies and management
Promotes learning innovation &
feedback
Informs Public Policies
Dispels mythsPromotes Visibility

Research can help answer our
Big Questions
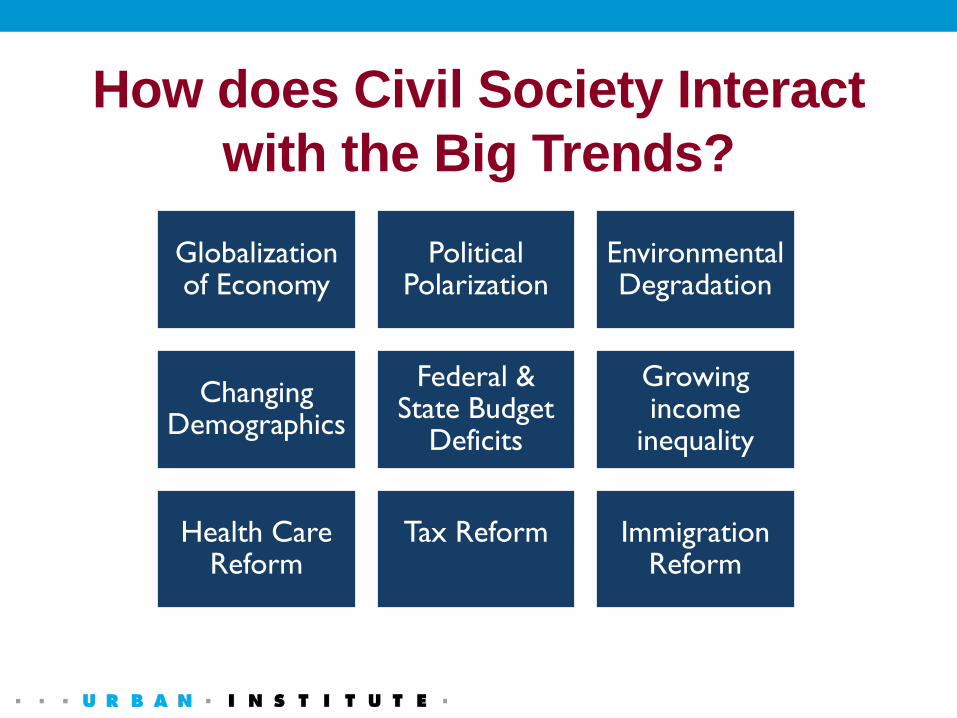
How does Civil Society Interact with the Big Trends?
Globalization of Economy
Political Polarization
Environmental Degradation
Changing Demographics
Federal & State Budget
Deficits
Growing income
inequality
Health Care Reform
Tax Reform Immigration Reform
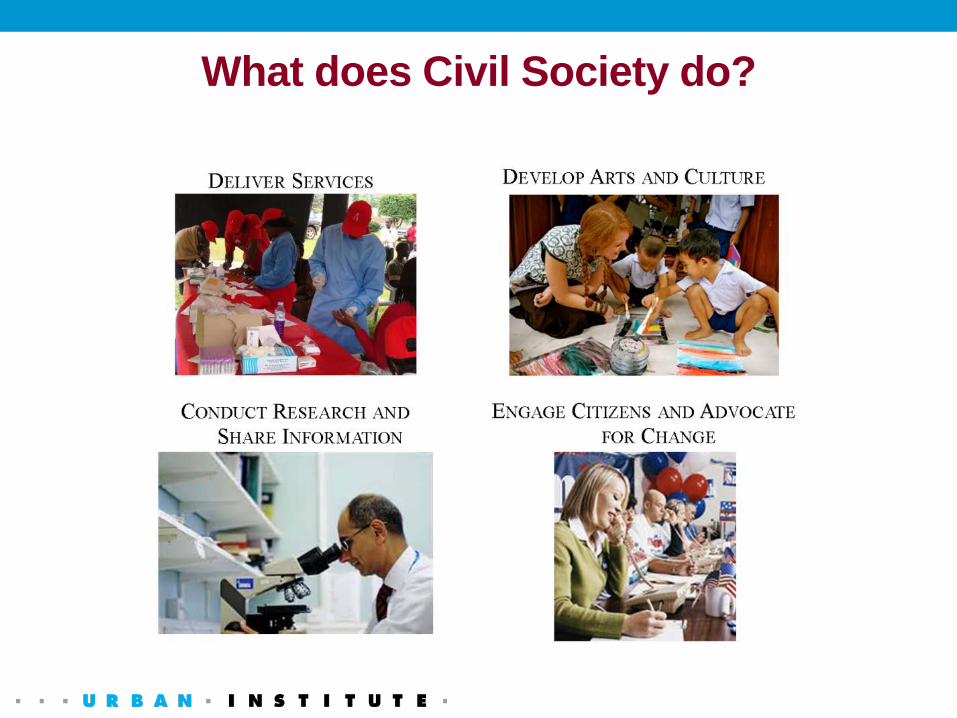
What does Civil Society do?

How Do Nonprofits & Philanthropy:Contribute to individual and community well-being
Promote civic engagement
Impact the economy
Work with government and business in communities
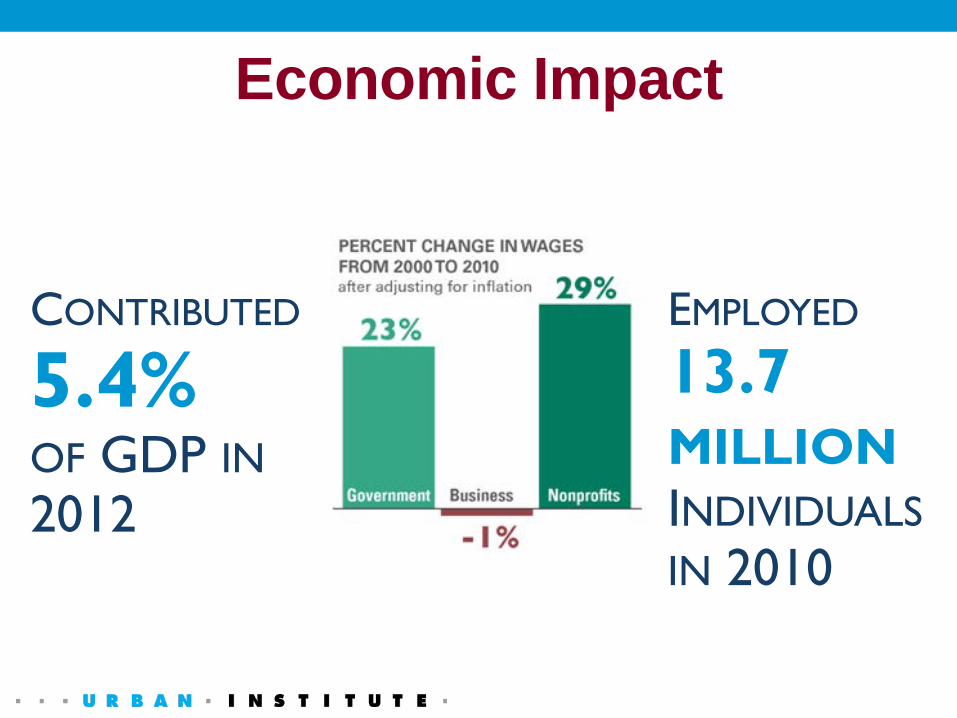
Economic Impact
CONTRIBUTED
5.4% OF GDP IN2012
EMPLOYED
13.7 MILLIONINDIVIDUALSIN 2010

Economic Impact of Nonprofits in California
Source: California Association of Nonprofits. 2014. Causes Count. Available online at http://calnonprofits.org/causes-count

Economic Impact of Nonprofits in California
Source: California Association of Nonprofits. 2014. Causes Count. Available online at http://calnonprofits.org/causes-count

Finances2012
Revenue $2.16 trillion
Expenses $2.03 trillion
Assets $4.84 trillion

To understand the
Dimensions of Civil Society:
Community and National Assets and Trends

Growth of the Nonprofit Sector (Excluding Hospitals and Higher Education)
Source: The Urban Institute, National Center for Charitable Statistics, Core Files (Public Charities, Trend File)
% Change in Number of Organizations
% Change in Inflation-Adjusted Revenue
1991-2001 2001-2011 1991-2001 1991-2001 2001-2011 1991-2001
All USA 76.6% 47.1% 159.9% 54.8% 36.1% 110.6%
California 70.3% 41.6% 141.3% 95.0% 24.6% 142.9%
San Fernando Valley 69.2% 67.6% 183.6% 94.1% 28.8% 150.0%

Nonprofit Subsectors: National, California, & San Fernando Valley
0.0
5.0
10.0
15.0
20.0
25.0
30.0
35.0
Arts, Culture,and
Humanities
HigherEducation
OtherEducation
Environmentand Animals
Hospitals andPrimary Care
Facilities
Other HealthCare
HumanServices
International Public andSocial Benefit
Supporting
Subs
ecto
r O
rgan
izat
ions
as
a Pe
rcen
tage
of N
onpr
ofit
s in
Reg
ion
United States California San Fernando Valley

Trends in Revenues and Expenses: National Public Charities
Source: The Urban Institute, National Center for Charitable Statistics, Core Files (Public Charities, Trend File)
0
200
400
600
800
1,000
1,200
1,400
1,600
1,800
1990 1992 1994 1996 1998 2000 2002 2004 2006 2008 2010 2012Bill
ions
of I
nfla
tion
-Adj
uste
d D
olla
rs
Total Revenue Total Expenses
Total Revenue (Excluding Hospitals and Higher Ed) Total Expenses (Excluding Hospitals and Higher Ed)

Source: The Urban Institute, National Center for Charitable Statistics, Core Files (Public Charities, Trend File)
Trends in Revenues and Expenses: California Public Charities
0.0
50.0
100.0
150.0
200.0
250.0
1990 1992 1994 1996 1998 2000 2002 2004 2006 2008 2010 2012Bill
ions
of I
nfla
tion
-Adj
uste
d D
olla
rs
Total Revenue Total Expenses
Total Revenue (Excluding Hospitals and Higher Ed) Total Expenses (Excluding Hospitals and Higher Ed)
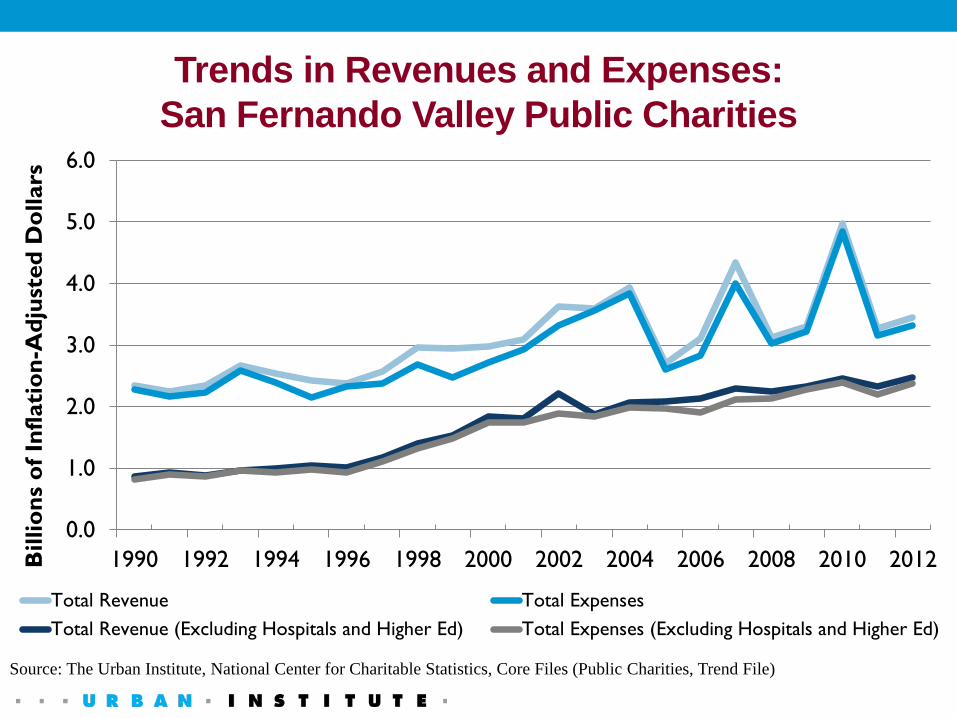
Trends in Revenues and Expenses: San Fernando Valley Public Charities
Source: The Urban Institute, National Center for Charitable Statistics, Core Files (Public Charities, Trend File)
0.0
1.0
2.0
3.0
4.0
5.0
6.0
1990 1992 1994 1996 1998 2000 2002 2004 2006 2008 2010 2012Bill
ions
of I
nfla
tion
-Adj
uste
d D
olla
rs
Total Revenue Total ExpensesTotal Revenue (Excluding Hospitals and Higher Ed) Total Expenses (Excluding Hospitals and Higher Ed)

• Map community resources and needs
• Share nonprofit resources
• Build the local Knowledgebase
• Track program outcomes
• Link to local data sources
• Customize for local partners
NCCS Community Platform for N. Virginia

Research can help to answer:
Operationalquestions about
Civil Society

Civil Society Trends
Transparency Accountability PerformanceMeasurement
Economic & Social Impact
Tax & Regulatory
Policy
Financial & Capacity
Challenges
Fee for Service &
Enterprises
New Giving Tools & Models
Impact Investing

Governance, staffing & structure
Program & Financial management, contracting
Fundraising, Marketing, communications & partnering
Volunteer management & donor relations
Performance measurement & evaluation

National Survey of Nonprofit Governance: What do Boards Do?
52%
44%
32%29% 27%
FinancialOversight &
Policy
Planning MonitoringPrograms &
Service
Fundraising CommunityRelations
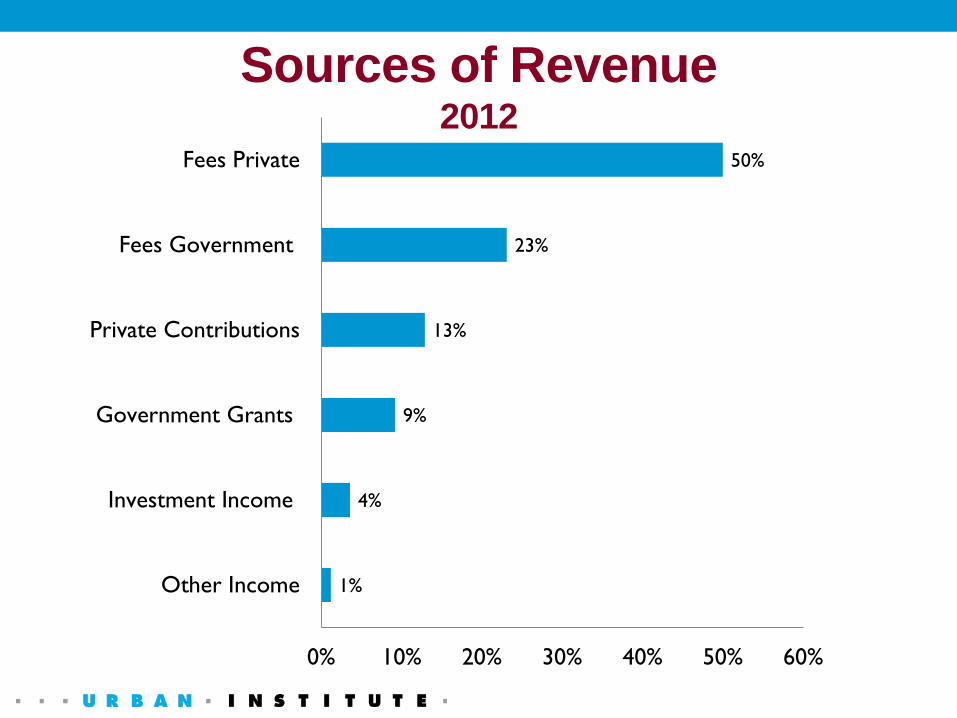
1%
4%
9%
13%
23%
50%
0% 10% 20% 30% 40% 50% 60%
Other Income
Investment Income
Government Grants
Private Contributions
Fees Government
Fees Private
Sources of Revenue2012
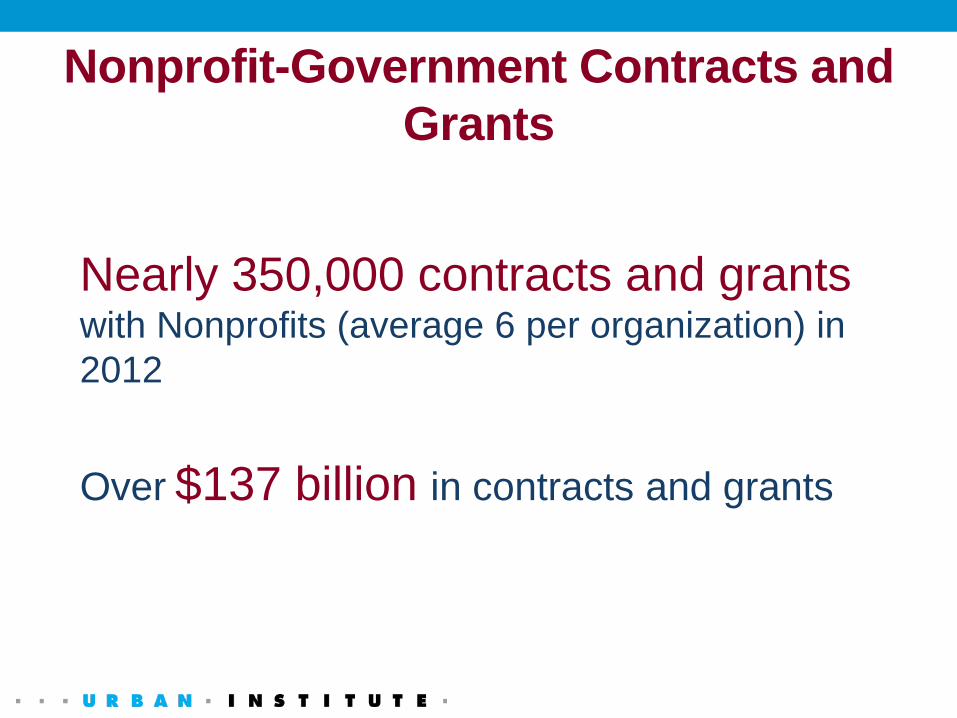
Nonprofit-Government Contracts and Grants
Nearly 350,000 contracts and grants with Nonprofits (average 6 per organization) in 2012
Over $137 billion in contracts and grants
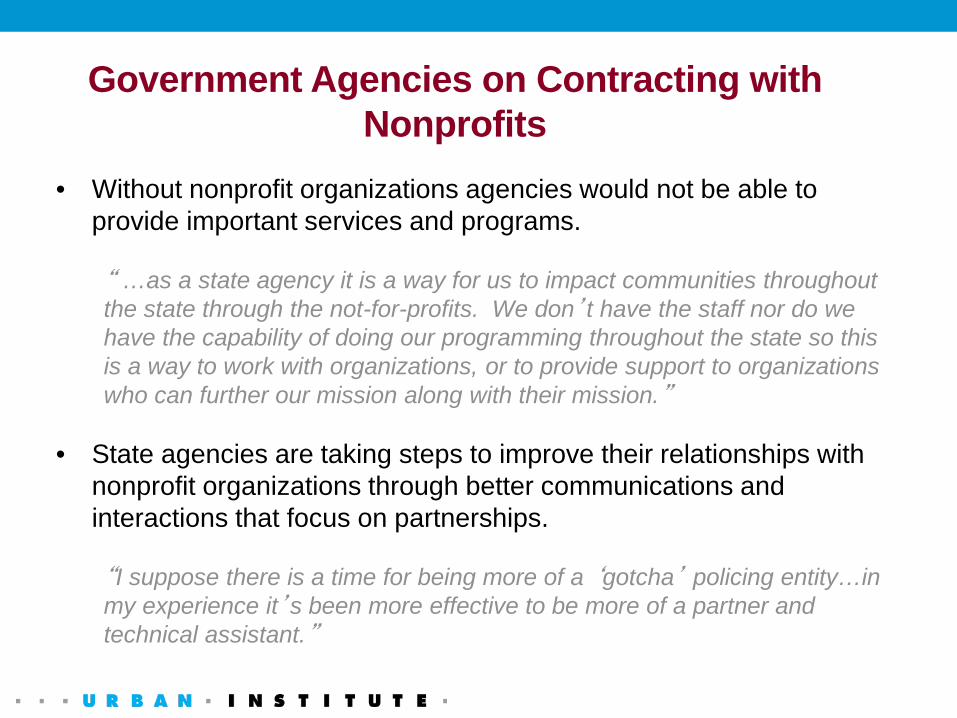
Government Agencies on Contracting with Nonprofits
• Without nonprofit organizations agencies would not be able to provide important services and programs.
“ …as a state agency it is a way for us to impact communities throughout the state through the not-for-profits. We don’t have the staff nor do we have the capability of doing our programming throughout the state so this is a way to work with organizations, or to provide support to organizations who can further our mission along with their mission.”
• State agencies are taking steps to improve their relationships with nonprofit organizations through better communications and interactions that focus on partnerships.
“I suppose there is a time for being more of a ‘gotcha’ policing entity…in my experience it’s been more effective to be more of a partner and technical assistant.”

To understand what
Influencesindividuals and groups

Why do people give, volunteer?
What works? Why? When? Where?
Why do people get involved in community and political activities?

Civic EngagementPromotes and facilitates civic education, voter registration, other forms of community involvement
Brings together groups and individuals to learn about and work on solving community issues
Educates about causes and promotes participation—civil rights, poverty, health

Total private contributions increased to $335.17
Congregations receive 31% of total
Corporations, 6%
Bequests, 8%
Foundations, 15%
Individuals, 72%
Private Giving for 2013
CorporationsBequestsFoundationsIndividuals

Research on Fundraising
Fundraising Effectiveness Project probes how to increase giving:
Giving: about 2% of GDP for the last 40 years
Research question: What would it take to move that percentage upward?
Research to date: suggests a greater focus on retaining past givers might yield big benefits

Volunteering
62.6 million people volunteered in 2013 25.4% of the population
They volunteered an estimate total of 8.1 billion total hours Valued at $163 billion

Organizational Research Needed
Management &Administration
Finances-Commercial
Revenues, Expenses, Surplus
Governance
Volunteer Management
Leadership & Staffing
Infrastructure & Capacity

Sector Research Needed
Achievements, Impacts,
Innovation
Advocacy & Social
Change
What Works & Why
Self-Regulation
Relationships w/Governments
& Businesses
Civic & Social Capital Building
Donor and Volunteer
Motivations

Conclusions• Civil Society is vibrant, diverse and growing, but our knowledge base is
still fairly primitive, especially at the state and local levels.• Scope and dimensions research is well underway
• Economic impact research is becoming more robust
• Civic engagement research is in its infancy
• Impacts of specific initiatives on communities and populations are evaluated, but synthesis and knowledge sharing is weak
• Management and financial research is increasing
• Performance research and data gathering is in demand, but capacity to collect, analyze and use performance data is quite limited
• Policy analysis is not well developed outside of associations
• Universities have important roles to play in designing and implementing basic and applied research
• Community collaborations will ensure that the research is valid and useful.
Elizabeth T. Boris, Ph.D.Director
Center on Nonprofits and Philanthropy
Urban Institute2100 M Street NW
Washington, DC 20037202-261-5770
The Urban Institute
Thank you!

References• Boris, Elizabeth T. and C. Eugene Steuerle, eds. Nonprofits &
Government: Collaboration & Conflict, 2006, Urban Institute. • CalNonprofits. Causes Count. www.calnonprofits.org/causes-count• Ferris, James M., Elwood Hopkins. Place-Based Initiatives in the Context of
Public Policy and Markets. http://bit.ly/18iICyu,• 2014 Fundraising Effectiveness Report.
http://www.urban.org/url.cfm?ID=2000052• Ostrower, Francie. Nonprofit Governance in the United States: Findings on
Performance and Accountability from the First National Representative Study. 2007. Urban Institute
• McKeever, Brice and Sarah Pettijohn. The Nonprofit Sector in Brief: Public Charities, Giving and Volunteering, 2014. Urban Institute.
• Pettijohn, Sarah et al. Nonprofit-Government Contracts and Grants: Findings from the 2013 National Survey, 2013. Urban Institute. www.urban.org/nonprofitcontracting.cfm
• Roeger, Katie et. al., Nonprofit Almanac 2012, Urban Institute.
Other Resources
– Center on Nonprofits and Philanthropy, the Urban Institutehttp://www.urban.org/center/cnp/index.cfm
– The Johns Hopkins Center for Civil Society Studies.http://www.ccss.jhu.edu/index.php?section=content&view=20
– The Foundation Center. http://foundationcenter.org/– Giving USA Foundation. Giving USA. http://www.givingusareports.org/– National Center for Charitable Statistics, the Urban Institute, http://nccs.urban.org. – Nonprofit and Voluntary Sector Quarterly (NVSQ) http://nvs.sagepub.com/– Nonprofit Management and Leadership (NML).
http://onlinelibrary.wiley.com/journal/10.1002/(ISSN)1542-7854 – PerformWell www.performwell.org– Stanford Social Innovation Review – Volunteering in America. http://www.volunteeringinamerica.gov– Bureau of Labor Statistics, Volunteering in the U.S., http://www.bls.gov/news.release/pdf/volun.pdf– Icon credit, Slide #6, Stephen Borengasser, DeadType, Urban Institute– Icon credit, Slide #21, Ferran Brown, Urban Institute– Photo credit, Slide #5, http://www.flickr.com/photos/53258658@N08/5925958386

Research & Programs• At the Center on Nonprofits and Philanthropy we conduct research
to inform public policy and nonprofit and foundation practice, for example, in national surveys of Nonprofit-Government Contracts and Grants, and we convene policy-makers and practitioners in Emerging Issues Seminars on tax and other public policy issues.
• Through our National Center for Charitable Statistics (NCCS), we create and share research quality data on nonprofits and philanthropy, produce the Nonprofit Almanac and research on the size and scope of sector and other topics, and collaborate with IRS, states, and others to promote better nonprofit data.
• We also develop tools for practitioners, for example, PerformWell.org, and we host webinars on performance measurement, conduct evaluations, and mentor Emerging Scholars from diverse backgrounds.
Elizabeth T. Boris, Ph.D.Founding Director, Center on Nonprofits and Philanthropy at the Urban Institute since 1996; involved in research on the nonprofit sector for 36 years; previously at the Aspen Institute and the Council on Foundations.
[email protected] Institute
2100 M Street NWWashington, DC 20037
www.urban.org

Identify Outcomes
Improve Service Delivery
Find Surveys/Assessments• Browse surveys and assessments alphabetically,
or browse by outcome area or program strategy.
• Drill down to specific outcomes and indicators for useful context, and find practitioner-friendly surveys and assessments.
• Find out how to measure and manage program implementation to ensure effective service delivery.
www.performwell.org