citywide assessment of sanitation service delivery ... · pdf filesan benchmark citywide...
TRANSCRIPT

San Benchmark Citywide Assessment of Sanitation Service Delivery
- Including On-Site Sanitation
Meera Mehta
Jaladhi Vavaliya, Upasana Yadav
CEPT University

Water supply, Waste Water, Solid waste Management & Storm Water
PAS Annual service delivery
profile for 800+
cities in 6 States
National database for 1800 cities For 18 states for 3 years
Performance Assessment System
Old city area
Newly developing colonies
www.pas.org.in
2

PAS Approach – moving to a virtuous cycle
Worsening urban water and sanitation
service delivery
No monitoring by state and local
governments
Complete lack of performance
Measurement
Service performance deteriorates over time
Performance Monitoring
at scale and at all levels: centre, state and local
Performance Measurement
With agreed key indicators against goals
Performance Improvement plans, tools and
innovative financing
Influence policy and financing
Set goals and priorities
Use of technology for sustainability and scale
Improved urban water and sanitation
service delivery
Measure and monitor performance to reward and learn from success and demonstrate results

We have come a long way from this

Online data entry camps in state capitals
PAS Project 5

Sanitation benchmarks
• Many performance measurement, indicator and benchmarking systems for wastewater services
– IWA Performance Indicators for Wastewater Services (Matos et al. 2003)
– AWWA & WEF QualServe programme (United States)
– SLB(GoI, 2008)
• All of them deal with waste water network and treatment
• No system to assess on-site sanitaiton

CEPT Process of developing SAN Benchmarks
Review of different types of sanitation
system in cities of India
Key findings and Lessons
Review of existing indicators
Peer Reviewed by various national and international experts
SAN Benchmarks – Citywide assessment of
sanitation service delivery Including on-site sanitation
Pilot testing in cities of Gujarat and Maharashtra

GoI indicators (SLB) - Sanitation
1. Coverage of toilets
3. Collection efficiency of sewerage network
4. Adequacy of sewage treatment capacity 6. Extent of reuse
and recycling of sewage
Conventional Underground Sewerage system
User interface Collection Conveyance Treatment Recycle & Reuse
2. Coverage of sewerage network
5. Quality of sewage treatment

CEPT Indicators for Onsite sanitation systems Onsite system – Septic tank with Settled Sewer/lined drain
User interface Collection Conveyance Treatment Recycle & Reuse
4a. Adequacy of septage treatment plant
4b. Adequacy of effluent and grey water
treatment plant
6a. Extent of reuse and recycling of treated Septage
2. Coverage of onsite sanitation system
3a. Collection efficiency of septage
6b. Extent of reuse and recycling of treated effluent and grey water
3b. Collection efficiency of effluents from septic tank and
grey water
Settled sewers/drains
1. Coverage of toilets 5a. Quality of septage
treatment plant
5b. Quality of effluent and grey water treatment plant

SAN Benchmarks: Citywide assessment of sanitation service
delivery Including on-site sanitation
1. Coverage of toilets
Access Collection Conveyance Treatment Recycle & Reuse
4. Adequacy of treatment capacity of sanitation
system (weighted average)
5. Quality of treatment of sanitation system
(weighted average)
6. Extent of reuse and recycling in
sanitation system (weighted average)
2. Coverage of adequate sanitation
systems
3. Collection efficiency of sanitation system (weighted average)
SAN Benchmarks provides a framework for performance assessment of city wide sanitation by capturing onsite sanitation systems along with the conventional sewerage systems.

PAS Project 11
Revised Sanitation Indicators
(Sewerage system + Onsite systems)
1. Coverage of toilets Percentage of properties with access to toilet facility in the city
2. Coverage of
adequate sanitation
system
Percentage of households with individual toilets connected with adequate
sanitation systems (sewer network/ septic tank / double pit system) to
total households in the city.
3. Collection
efficiency of
sanitation system
Weighted average of collection efficiency of each sanitation system,
weighted by share of households dependent on each sanitation system.
4. Adequacy of
treatment capacity of
Sanitation System
Weighted average of adequacy of treatment plant capacity available for
each sanitation system, weighted by share of households dependent on
each sanitation system.
5. Quality of
treatment of
sanitation system
Weighted average of quality of treatment of each sanitation system,
weighted by share of households dependent on each sanitation system.
6. Extent of reuse and
recycling in sanitation
system
Weighted average of extent of reuse of treated wastewater and sludge
after adequate treatment as a percentage of wastewater and sludge
received at the treatment plant, weighted by share of household
dependent on each sanitation system.
SAN Benchmarks: Citywide assessment of sanitation service delivery
Including on-site sanitation

PAS Project 12
SAN Benchmarks: Citywide assessment of sanitation service delivery
Including on-site sanitation
Drill Down Indicators Key
Indicators
3. Collection efficiency of
sanitation system
Collection efficiency of sewer system
- % of area covered with sewer network
- Frequency of sewer overflows
Collection efficiency of septage
- % of septic tanks cleaned annually
- No of septage sucking machines / 1000 septic tank
- PSP in septic tank cleaning
- User charges levied per emptying
Collection efficiency of effluent and grey
water
- % of septic tank connected to settled sewer / lined drains
- % of septic tanks connected to soak pits
- Coverage of sullage network
Additional indicators Local action indicators

PAS Project 13
SAN Benchmarks: monitoring framework suggested
Monitored by local governments as well as higher level of governments at state and national level
• Monitored by local governments
• Provide more details on the key indicators and explain the indicator better to the city officials.
• Monitored by local governments
• Facilitate in identifying local actions required and set sub-targets to achieve improved performance on service delivery.
Key Indicators
Drill Down Indicators
Additional indicators Local action indicators

SAN Benchmarks: List of all Indicators Capture Collection Conveyance Treatment Recycle and Reuse
1. Coverage
of toilets
2. Coverage of each
sanitation system
3. Weighted average of
collection efficiency of each
sanitation system
4. Weighted average of adequacy
of each sanitation system
5. Weighted average of quality of
treatment of each sanitation
system
6. Weighted average of
extent of reuse and
recycling of each
sanitation system
Coverage of
households
with own
toilets (%)
Percentage of
households connected to
septic tank (%)
Collection efficiency of septage
(%)
% of septic tanks cleaned
annually
Adequacy of septage treatment
facility (%)
Extent of reuse and
recycling of treated
septage received at
treatment plant (%)
Percentage
of functional
community
toilet seats
(%)
Percentage of
households connected to
septic tank as per design
standards (%)
Number of septage sucking
machines/1000 septic tanks
(Ratio)
Adequacy of effluent (from septic tank
and grey water) treatment capacity
(%)
Extent of reuse and
recycling of treated
effluent (from septic tank
and grey water) (%)
Percentage of households
connected to twin pit
system (%)
PSP in septic tank cleaning
services (Y/ N)
User charges levied per
emptying
PSP in O & M operations for treatment
plant (Y/N)
Extent of reuse and
recycling of treated sewage
(%)
Percentage of households
connected to sewer
network (%)
Percentage of septic tanks
connected to settled sewer /
drains for effluent disposal
Quality of septage treatment (%)
Percentage of illegal sewer
network connections (%)
Percentage of septic tanks
connected to soak pit for
effluent disposal (%)
Quality of effluent (from septic tank)
treatment (%)
Percentage of identified
illegal sewer network
connections that are
regularized (%)
Collection efficiency of effluent
(from septic tank) and grey
water (%)
Coverage of sullage network
(open + covered) (%)
Adequacy of sewage treatment
facility (underground sewerage
system) (%)
Percentage of area
covered with sewer
network (%)
Collection efficiency of sewer
network (%)
Frequency of sewer overflows
(number)
Quality of treated sewage disposed
(BOD & COD) (%)
Ke
y I
nd
ica
tors
D
rill
Do
wn
In
dic
ato
rs
Indicator definition , formula and rationale have been developed…
Onsite indicators

APPLICATION OF SAN BENCHMARK

Application of San Benchmark
SAN Benchmark indicators added in online PAS system
Calculated for more than 600+ cities
Included in IFSM toolkit and SANI PLAN tool
Used for preparation of Shit Flow Diagram (SFD)
Trained more than 1200 government officials

SAN Benchmarks: State Level Sanitation Assessment
37 29
41
8
47 52
31 28
1
21
0
10
20
30
40
50
60
70
80
90
100
Coverage of adequatesanitation system
Collection efficiency ofsanitation system
Adequacy of treatmentcapacity
Extent of reuse and recycling Quality of treatment
Va
lue
in
%
Sanitation assessment using existing and revised indicators - urban Maharashtra (2014-15)
SLB indicators Revised indicators
Maharashtra: 259 urban local bodies (ULBs); 3000 to 3.5 million population Partial underground sewer network: 34 ULBs; STP: 22 ULBs San Benchmark shows better performance for coverage of adequate sanitation
system and collection efficiency. Adequacy of treatment decreases as only a few cities treat septage and grey
water
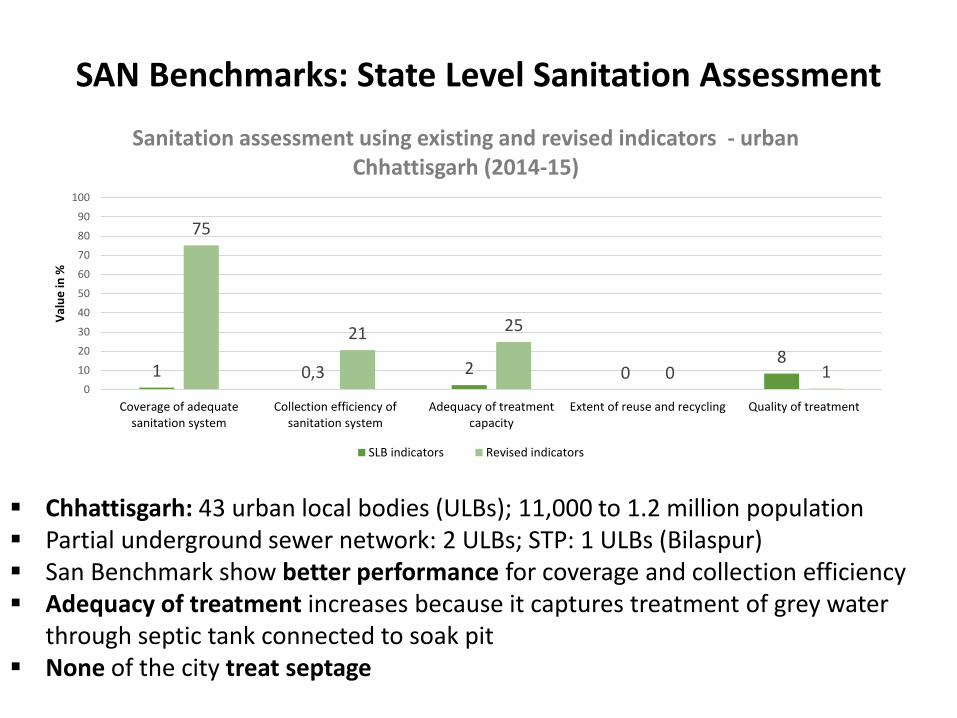
SAN Benchmarks: State Level Sanitation Assessment
Chhattisgarh: 43 urban local bodies (ULBs); 11,000 to 1.2 million population Partial underground sewer network: 2 ULBs; STP: 1 ULBs (Bilaspur) San Benchmark show better performance for coverage and collection efficiency Adequacy of treatment increases because it captures treatment of grey water
through septic tank connected to soak pit None of the city treat septage
1 0,3 2 0 8
75
21 25
0 1 0
10
20
30
40
50
60
70
80
90
100
Coverage of adequatesanitation system
Collection efficiency ofsanitation system
Adequacy of treatmentcapacity
Extent of reuse and recycling Quality of treatment
Val
ue
in %
Sanitation assessment using existing and revised indicators - urban Chhattisgarh (2014-15)
SLB indicators Revised indicators

San Benchmark helps city government in monitoring FSM improvement plans
SLB SLB SAN Benchmark
Sinnar City Example
• SLB indicators show zero value for all indicators • Implementation of fecal sludge management plan not reflected in
SLB indicators • San Benchmark framework shows improvements in sanitation
services

PAS Project
82
27 36
100
0
95
37 46
82
0 0
20
40
60
80
100
Coverage of
adequate
sanitation
Collection
efficiency
Adequacy of
treatment
Capacity
Quality of
treatment
Reuse and
recycling
Val
ues
in
%
Sanitation assessment using SLB and proposed sanitation
indicators framework (mixed sanitation system - Nagpur)
19 33 33
94
33
91
60
85
18 19
0
20
40
60
80
100
Coverage of
adequate
sanitation
Collection
efficiency
Adequacy of
treatment
Capacity
Quality of
treatment
Reuse and
recycling
Val
ues
in
%
Kalyan Dombivli
SLB Indicators Revised indicators
Nagpur : 82% of properties are connected
to sewer network. 13% have septic tanks with soak pits.
WW generated: 276 MLD STP capacity: 100 MLD 12% of septic tanks are cleaned
annually and treated in existing STP
Quality tests are not carried out for sludge treatment
Kalyan Dombivli: 19% of properties are connected
to sewer network. 78% have septic tanks with soak pits.
WW generated: 370 MLD STP capacity: 123 MLD 8% of septic tanks are cleaned
annually and treated in existing STP
Quality tests are not carried out for sludge treatment
30 MLD treated sewage is reused
SAN Benchmarks: City Level Sanitation Assessment

Automatic SFD & WW Flow diagram Generation tool (Excel based)
21
Automatic SFD generation tool will generate SFD diagrams and WW Flow diagram for around 400 cities using PAS data of 4 Indian states (Maharashtra, Gujarat, Chhattisgarh and Telangana states)

Addressing Data Challenges
User interface: Lack of recorded information on household level access to onsite sanitation system, i.e. HHs with septic tank
Collection: Septic tank cleaned by private operators
Conveyance: Quantity of grey water and effluent collected by drains
Treatment: Quantity of septage treated in treatment plant
Currently estimated based on city officials knowledge. Can be improved by addition of question in property tax assessment form
Provide license to private operators
Monitor flow in outlet drains
Maintain record at treatment plant for septage received
Challenges Measures
Major challenge: Availability of adequate information for onsite sanitation system

Report and presentation
• Available at • www.pas.org.in/urban sanitation

Thank you . . .
www.pas.org.in
PAS project
@pas_project
http://fb.com/pas.cept
https://twitter.com/pas_project
[email protected]| [email protected]
Download SAN Benchmarks document