city of sydney decentralised energy master plan trigeneration
TRANSCRIPT
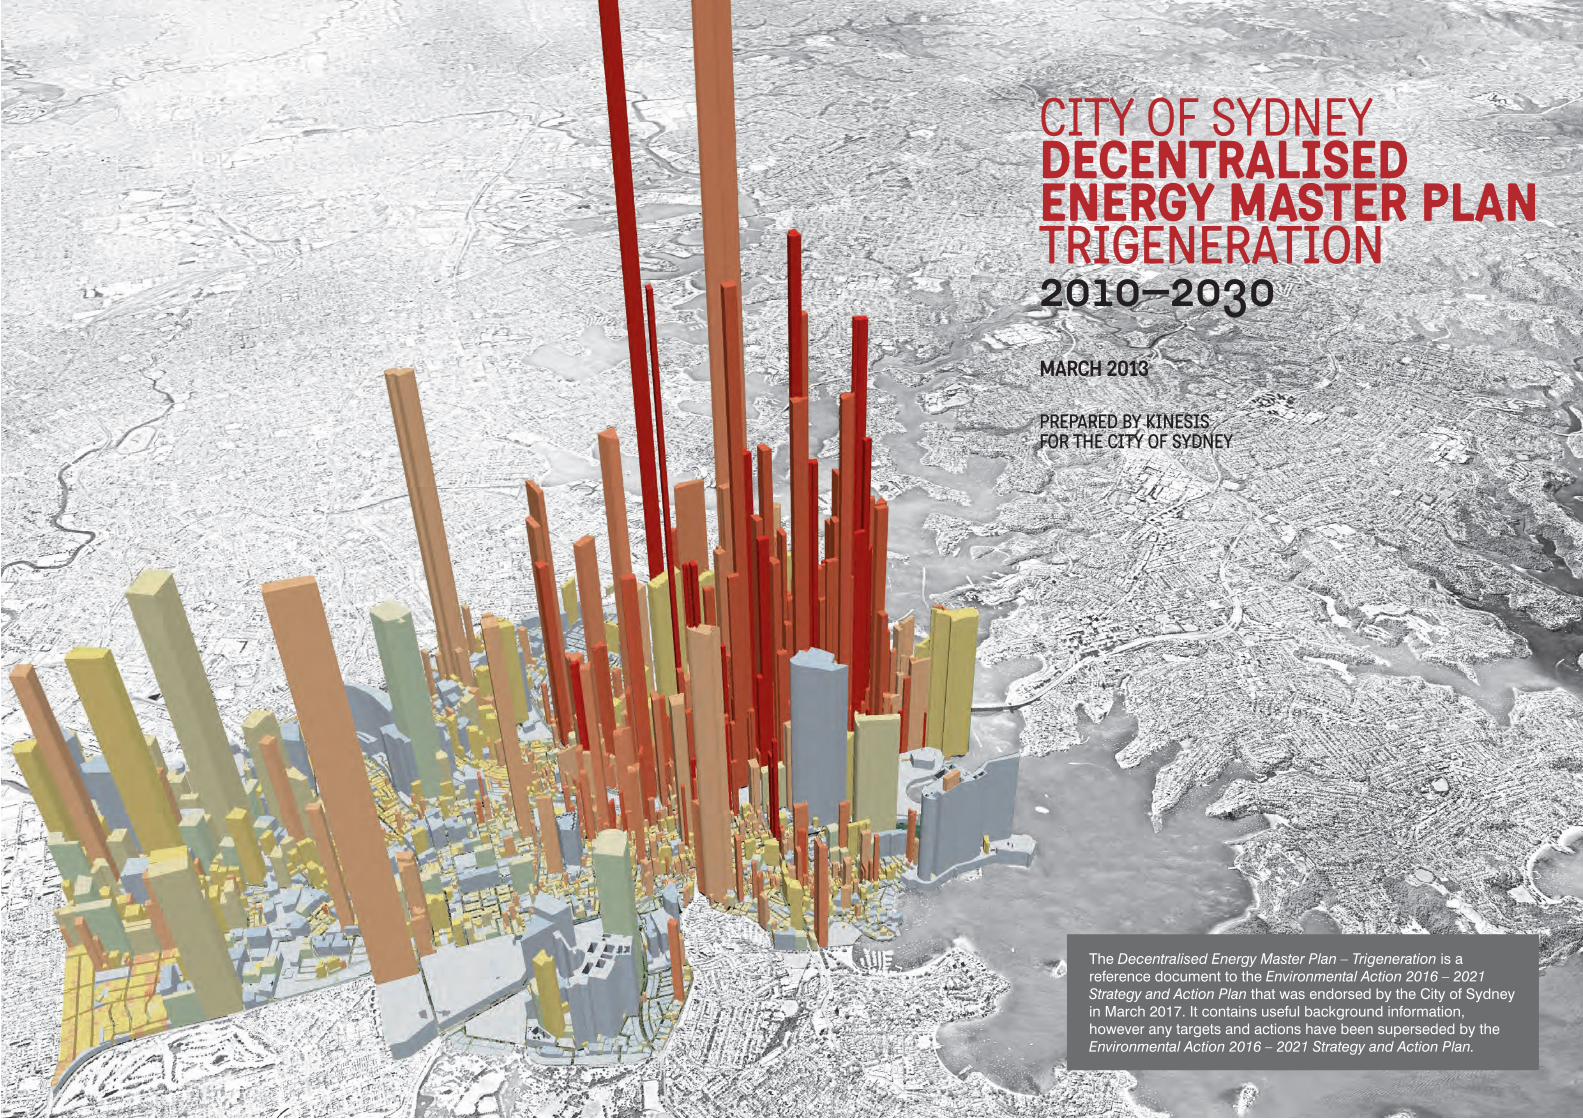
CITY OF SYDNEYDecentraliseD energy Master plan TrigeneraTion2010–2030MARCH 2013
PrePared by Kinesis For The CiTy oF sydney
The Decentralised Energy Master Plan – Trigeneration is a reference document to the draft Environmental Action 2016 – 2021 Strategy and Action Plan that was endorsed by the City of Sydney for public exhibition in June 2016. It contains useful background information, however any targets and actions have been superseded by the Environmental Action 2016 – 2021 Strategy and Action Plan.
The Decentralised Energy Master Plan – Trigeneration is a reference document to the Environmental Action 2016 – 2021 Strategy and Action Plan that was endorsed by the City of Sydney in March 2017. It contains useful background information, however any targets and actions have been superseded by the Environmental Action 2016 – 2021 Strategy and Action Plan.

This Final Master Plan has been prepared by Kinesis.
This report follows the guiding scope and parameters set out by the City of Sydney and therefore does not necessarily reflect the policies or views of those who prepared or contributed to this report.
The consortium wishes to acknowledge and thank The City of Sydney, the University of Sydney, CSIRO, EnergyAustralia (now AusGrid), Jemena, The Allen Consulting Group, Mirvac, Leighton Holdings, Landcom, Stockland and Anagram Studio for their valuable time and input.
Copyright 2012
www.kinesis.org [email protected]
aCKnoWLedgeMenTs
FOREWORD Page 4
UNLOCKING THE MASTER PLAN Page 5
1. TRigeneRATion Page 6
2. Re–THinKing THe URBAn FoRM Page 10
3. THe DeCenTRALiSeD eneRgY neTWoRK Page 18
4. PeRFoRMAnCe Page 26
5. oUTSiDe THe neTWoRK Page 36
6. enABLing THe MASTeR PLAn Page 40
7. CASe STUDieS Page 46
8. gAS FeASiBiLiTY STUDY Page 68
ConTenTS

4 City of Sydney | decentralised energy Master Plan—trigeneration
Central to this vision was the commitment to be internationally recognised as an environmental leader of outstanding performance and with green industries driving economic growth.
The City of Sydney has set a target of reducing greenhouse gas emissions across the entire local government area by 70% below 2006 levels by 2030. Sustainable Sydney 2030—The Vision sets out a clear path for reaching this target by improving energy efficiency, encouraging people to cycle and walk, utilising waste as a resource, converting non recyclable waste to energy, recycling water, renewable energy and a Decentralised Energy Network, powered by Trigeneration. Key to this vision were ‘Green Transformers’—the co–location of trigeneration, waste collection/treatment and recycled water treatment that would deliver the greatest reduction in greenhouse gas emissions.
When Sustainable Sydney 2030 was released, it was understood that vision alone would not achieve the City’s
targets; the City needed to take the next step and determine how these actions could be implemented.
That is why the City has commissioned the development of a Green Infrastruc-ture Plan comprising five Master Plans to determine the most appropriate pathway for achieving the City’s vision:1. Decentralised Energy—
Trigeneration Master Plan2. Decentralised Energy—
Renewable Energy Master Plan3. Decentralised Energy—
Alternative Waste Treatment Business Case
4. Decentralised Water Master Plan5. Automated Waste Collection
Master Plan
This Master Plan, which has been prepared by Kinesis, is the first step in achieving significant emissions reductions at the city scale. • It calls for the deployment of
trigeneration, a technology proven to reduce greenhouse gas emissions.
• It recognises that sustainability must incorporate more than new
individual buildings. 80% of the floor space that will exist within the City of Sydney in 2030 has already been built. Strategies that focus on new buildings alone will ignore this source of potential abatement.
• It acknowledges that to reduce the greenhouse gas emissions of an entire city we need more than a building strategy; we need city and precinct wide solutions. Ones which address the sustainability of our existing infrastructure and assets.
The solution provided in this Master Plan is for now and the future. However, it is not a silver bullet that ignores other opportunities such as energy efficiency, renewable electricity and renewable gases. Instead, it should be seen for what it is; a crucial bridging strategy that can be used to reduce greenhouse gas emissions today and enable continued emissions reductions in the future.
This Master Plan is not just for the City of Sydney. It is for the property industry who will be working on the
construction and maintenance of their assets. It is for the gas and electricity utilities who will be integrating with the decentralised energy network. It is for all levels of Government to understand their role in realising this vision. And it will be for the people of Sydney to understand how realising the City’s Sustainable Sydney vision will be for their benefit and their future.
allan Jones Mbe Chief Development Officer, Energy & Climate Change City of Sydney
Clover Moore Lord Mayor City of Sydney
in 2008 the City of Sydney launched Sustainable Sydney 2030—The Vision and committed Sydney to becoming a green, global and connected city.
FoReWoRDReducing the greenhouse gas emissions of an entire city requires more than a building strategy; we need city wide solutions which address the sustainability of existing infrastructure and assets.

5City of Sydney | decentralised energy Master Plan—trigeneration
CASE STUDIES
8 GAS FEASIBILITY STUDY
The key sustainability component of Sustainable Sydney 2030 is the call for a network of Green Transformers, principally housing trigeneration, to supply the City of Sydney local government area (LGA) with low carbon electricity and zero carbon heating and cooling.
Realising such a transformative vision cannot be achieved using the old ways of thinking about cities and city planning. It requires a new approach to how we understand our city.
The analysis that has been undertaken in the preparation of this Master Plan has been in itself transformative. It has drawn upon a unique combination of metered utility data, detailed floor space analysis and comprehensive energy and trigeneration modelling that has allowed us to understand the city in a way that has never before been attempted.
By doing so, we are able to present a Master Plan that sets out the most appropriate path for the City to achieve
Sustainable Sydney 2030 based on both greenhouse performance and cost. It demonstrates how best to configure the trigeneration systems, where they should be located, how they will perform and how they can be enabled.
This Master Plan is limited in its scope. It is not a development application for construction, nor is it a business plan. Yet its implications are profound. It makes the case for the priority development of the four most energy and carbon intense zones into Low Carbon Infrastructure Zones across the City of Sydney, each of which would supply low carbon electricity and zero carbon thermal energy for hot water, heating and cooling. In developing this Master Plan, our challenge was twofold:• To confirm that the emissions
reductions modelled in Sustainable Sydney 2030 were robust and achievable.
• To show that the original Sustainable Sydney 2030 vision could be implemented in an affordable and effective timeframe.
We believe this Master Plan has met both these challenges by showing that if implemented, a decentralised energy network could:
1. connect 65% of all commercial floor space, 50% of all retail floor space and 30% of all residential floor space within the City of Sydney LGA to low carbon electricity and zero carbon heating and cooling
2. reduce greenhouse gas emissions within Low Carbon Infrastructure Zones by 39% to 56% below 2006 levels by 2030
3. reduce greenhouse gas emissions across the entire City of Sydney by 18% to 26% below 2006 levels by 2030 from the Low Carbon Infrastructure Zones alone. Additional emission reductions from displaced greenhouse gas refrigerants and trigeneration and other forms of decentralised energy outside these zones will increase the reduction of greenhouse gas emissions across the entire City of Sydney by 24% to 32%.
4. provide lower cost CO2 abatement than solar, wind, hydro, or coal or gas fired power station carbon capture and storage
5. provide the city with an energy solution that is transformative, future proof and will provide an energy infrastructure that other green infrastructure can take advantage of.
This final Master Plan has been updated from the interim Master Plan to include potential trigeneration and fuel cell capacity outside the four Low Carbon Infrastructure Zones outlined in Chapter 5 and increased trigeneration capacity for the Green Square Low Carbon Infrastructure Zone outlined in the case study in Chapter 7. These additions increase total trigeneration capacity within this Master Plan from 360 MW to 477 MW for the entire City of Sydney local government area.
Kinesis has prepared this Master Plan to validate the vision set out in the City of Sydney’s Sustainable Sydney 2030. The combination of this Master Plan, other Master Plans and the federal government’s Renewable energy Target will position the city to be off coal fired electricity by 2030.
UnLoCKing THe MASTeR PLAn
1. Connect 65% of all commercial floor space, 50% of all retail floor space and 30% of all residential floor space within the City of Sydney LGA to low carbon electricity and zero carbon heating and cooling
2. Reduce greenhouse gas emissions within Low Carbon Infrastructure Zones by 39% to 56% below 2006 levels by 2030
3. Reduce greenhouse gas emissions across the entire City of Sydney by 18% to 26% below 2006 levels by 2030 from the Low Carbon Infrastructure Zones alone. Additional emission reductions from displaced greenhouse gas refrigerants and trigeneration and other forms of decentralised energy outside these zones will increase the reduction of greenhouse gas emissions across the entire City of Sydney by 24% to 32%
4. Provide lower cost CO2 abatement than solar, wind, hydro, or coal or gas fired power station carbon capture and storage
5. Provide the city with an energy solution that is transformative, future proof and will provide an energy infrastructure that other green infrastructure can take advantage of
This final Master Plan has been updated from the interim Master Plan to include potential trigeneration capacity outside the four Low Carbon Infrastructure Zones outlined in Chapter 5 and increased trigeneration capacity for the Green Square Low Carbon Infrastructure Zone outlined in the case study in Chapter 7. These additions increase total trigeneration capacity within this Master Plan from 360 MW to 477 MW for the entire City of Sydney local government area.

6 CITY OF SYDNEY | Decentralised Energy Master Plan—Trigeneration
1.
6
TRigeneRATion
7City of Sydney | decentralised energy Master Plan—trigeneration
3 THe DeCenTRALiSeD eneRgY neTWoRK
2 Re–THinKing THe URBAn FoRM
4 5
PeRFoRMAnCe
oUTSiDe THe neTWoRK
6 enABLing THe MASTeR PLAn
7 CASe STUDieS
8 gAS FeASiBiLiTY STUDY
1 TRigeneRATion
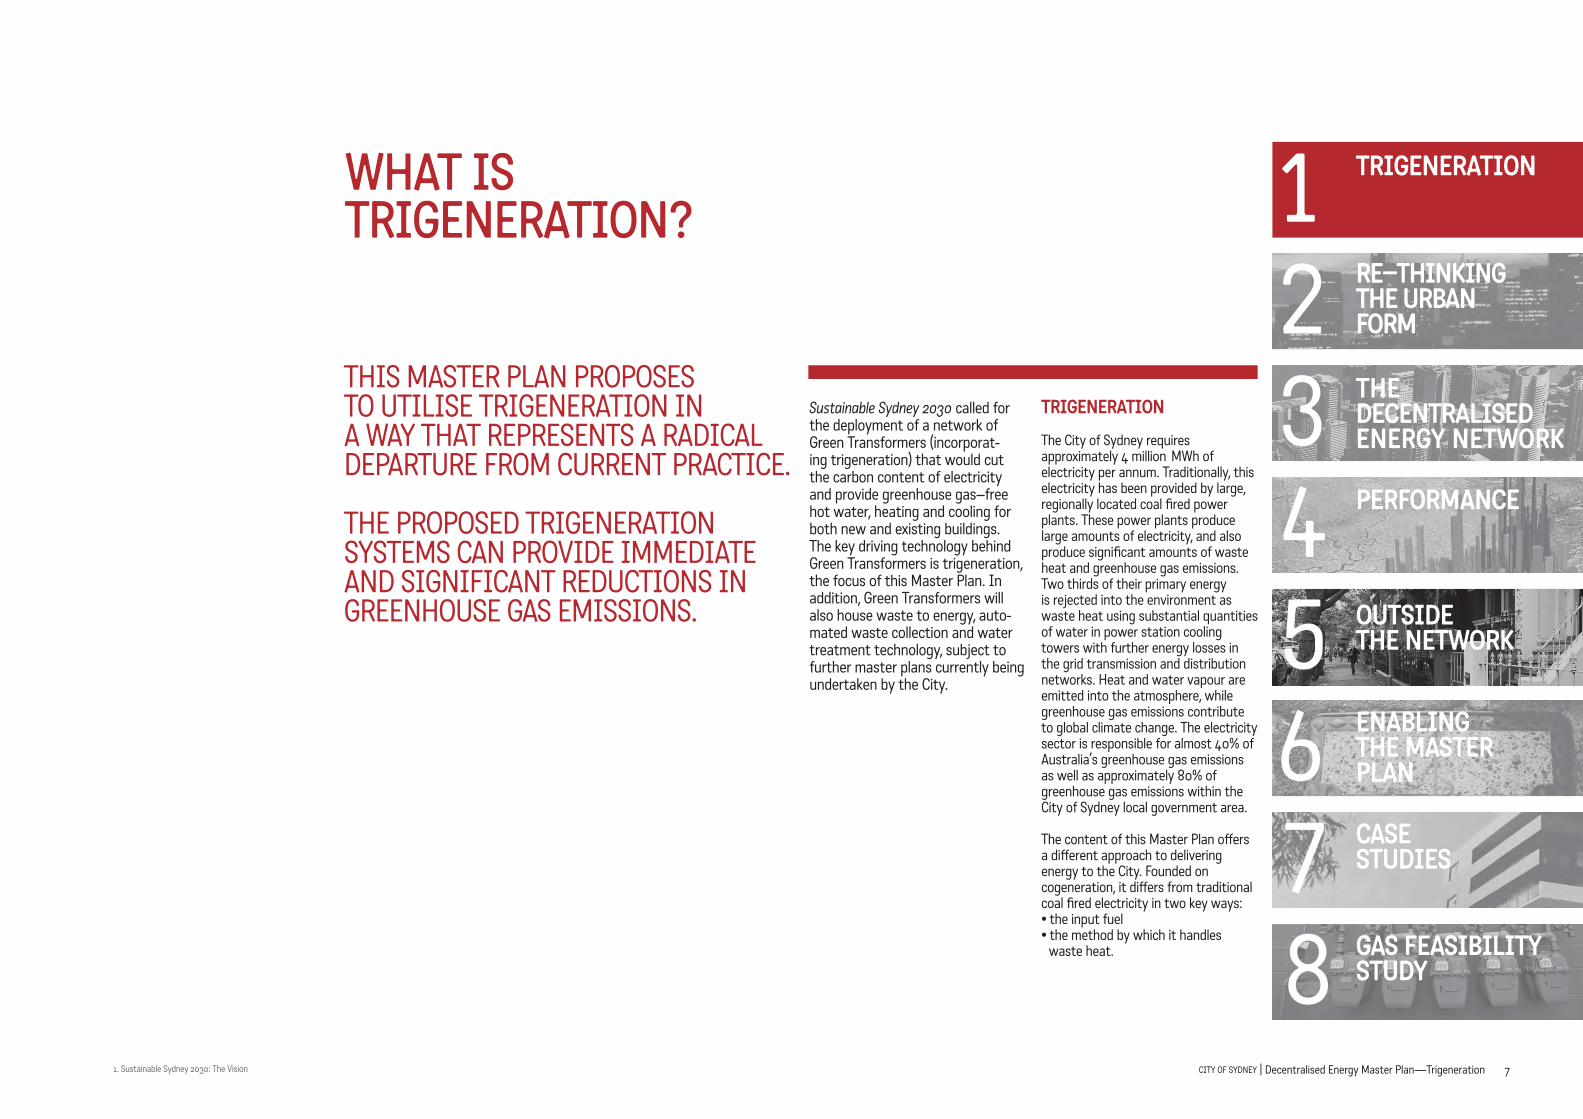
Sustainable Sydney 2030 called for the deployment of a network of Green Transformers (incorporat-ing trigeneration) that would cut the carbon content of electricity and provide greenhouse gas–free hot water, heating and cooling for both new and existing buildings. The key driving technology behind Green Transformers is trigeneration, the focus of this Master Plan. In addition, Green Transformers will also house waste to energy, auto-mated waste collection and water treatment technology, subject to further master plans currently being undertaken by the City.
WhaT is TrigeneraTion?
1. Sustainable Sydney 2030: The Vision
TRigeneRATion
The City of Sydney requires approximately 4 million MWh of electricity per annum. Traditionally, this electricity has been provided by large, regionally located coal fired power plants. These power plants produce large amounts of electricity, and also produce significant amounts of waste heat and greenhouse gas emissions. Two thirds of their primary energy is rejected into the environment as waste heat using substantial quantities of water in power station cooling towers with further energy losses in the grid transmission and distribution networks. Heat and water vapour are emitted into the atmosphere, while greenhouse gas emissions contribute to global climate change. The electricity sector is responsible for almost 40% of Australia’s greenhouse gas emissions as well as approximately 80% of greenhouse gas emissions within the City of Sydney local government area.
The content of this Master Plan offers a different approach to delivering energy to the City. Founded on cogeneration, it differs from traditional coal fired electricity in two key ways:• the input fuel• the method by which it handles
waste heat.
THIS MASTER PLAN PROPOSES TO UTILISE TRIGENERATION IN A WAY THAT REPRESENTS A RADICAL DEPARTURE FROM CURRENT PRACTICE.
THE PROPOSED TRIGENERATION SYSTEMS CAN PROVIDE IMMEDIATE AND SIGNIFICANT REDUCTIONS IN GREENHOUSE GAS EMISSIONS.
8 City of Sydney | decentralised energy Master Plan—trigeneration
2.
3.
4.
5.
6.
7.
8.
1.
A FUTURe PRooF SoLUTionThe proposed trigeneration systems can provide immediate and significant reductions in greenhouse gas emissions. Furthermore, they also provide future– proof infrastructure that can be expanded and improved with emerging technological advancements.
It must be acknowledged that, despite producing far fewer greenhouse gas emissions than traditional coal fired power stations, the proposed trigeneration systems will still burn gas, which is a fossil fuel, and therefore will not provide carbon free electricity which renewable technologies can provide. The City of Sydney has resolved that by 2030 renewable gases from waste and other renewable energy sources such as geothermal will replace fossil fuel natural gas in the trigeneration systems enabling them to provide carbon free electricity as well as carbon free thermal energy for heating and cooling.
Over a longer period, fuel cells may replace natural gas powered reciprocating or turbine engines as the primary engine within the trigeneration systems. Fuel cells, which are rapidly falling in cost, generate electricity through reactions between a fuel and
an oxidant. They can raise the end use efficiency of the fuel stock to as high as approximately 80%, producing a similar amount of electricity with less gas and less greenhouse gas emissions than a reciprocating or turbine engine.
Sustainable Sydney 2030 recognised that a broad range of energy efficiency and alternative energy technologies and actions are needed to meet the City of Sydney’s ambitious emissions reduction targets. This Master Plan is designed to work in concert with the City’s actions in areas such as renewable energy, energy efficiency and waste to energy as well as the significant actions already being undertaken by residents and businesses throughout the City of Sydney to improve their energy efficiency and install renewable energy technologies.
The decentralised energy network proposed in this Master Plan will be implemented through a staged installation process and has been designed to work optimally with demand side energy efficiency actions. For example, the Master Plan supports higher coefficients of performance for peak lopping electric chillers to support the base and shoulder load thermal chillers and that the performance of the electric chillers is upgraded as buildings connect to the decentralised energy network.
Both renewable electricity and renewable gases are the subject of the Renewable Energy Master Plan and Alternative Waste Treatment Master Plan which are currently being developed and which will be published following this Master Plan.
reneWabLe energy MasTerPLanThe Renewable Energy Master Plan has established that there are sufficient waste derived renewable feedstocks (organic waste) within proximity of the City of Sydney to provide for a 100% renewable fuelled trigeneration decentralised energy network by 2030. This excludes gases derived from non-organic waste.
With these possible transitions, the decentralised energy network outlined in this Master Plan will remain the vital delivery platform for the City of Sydney’s low carbon future.
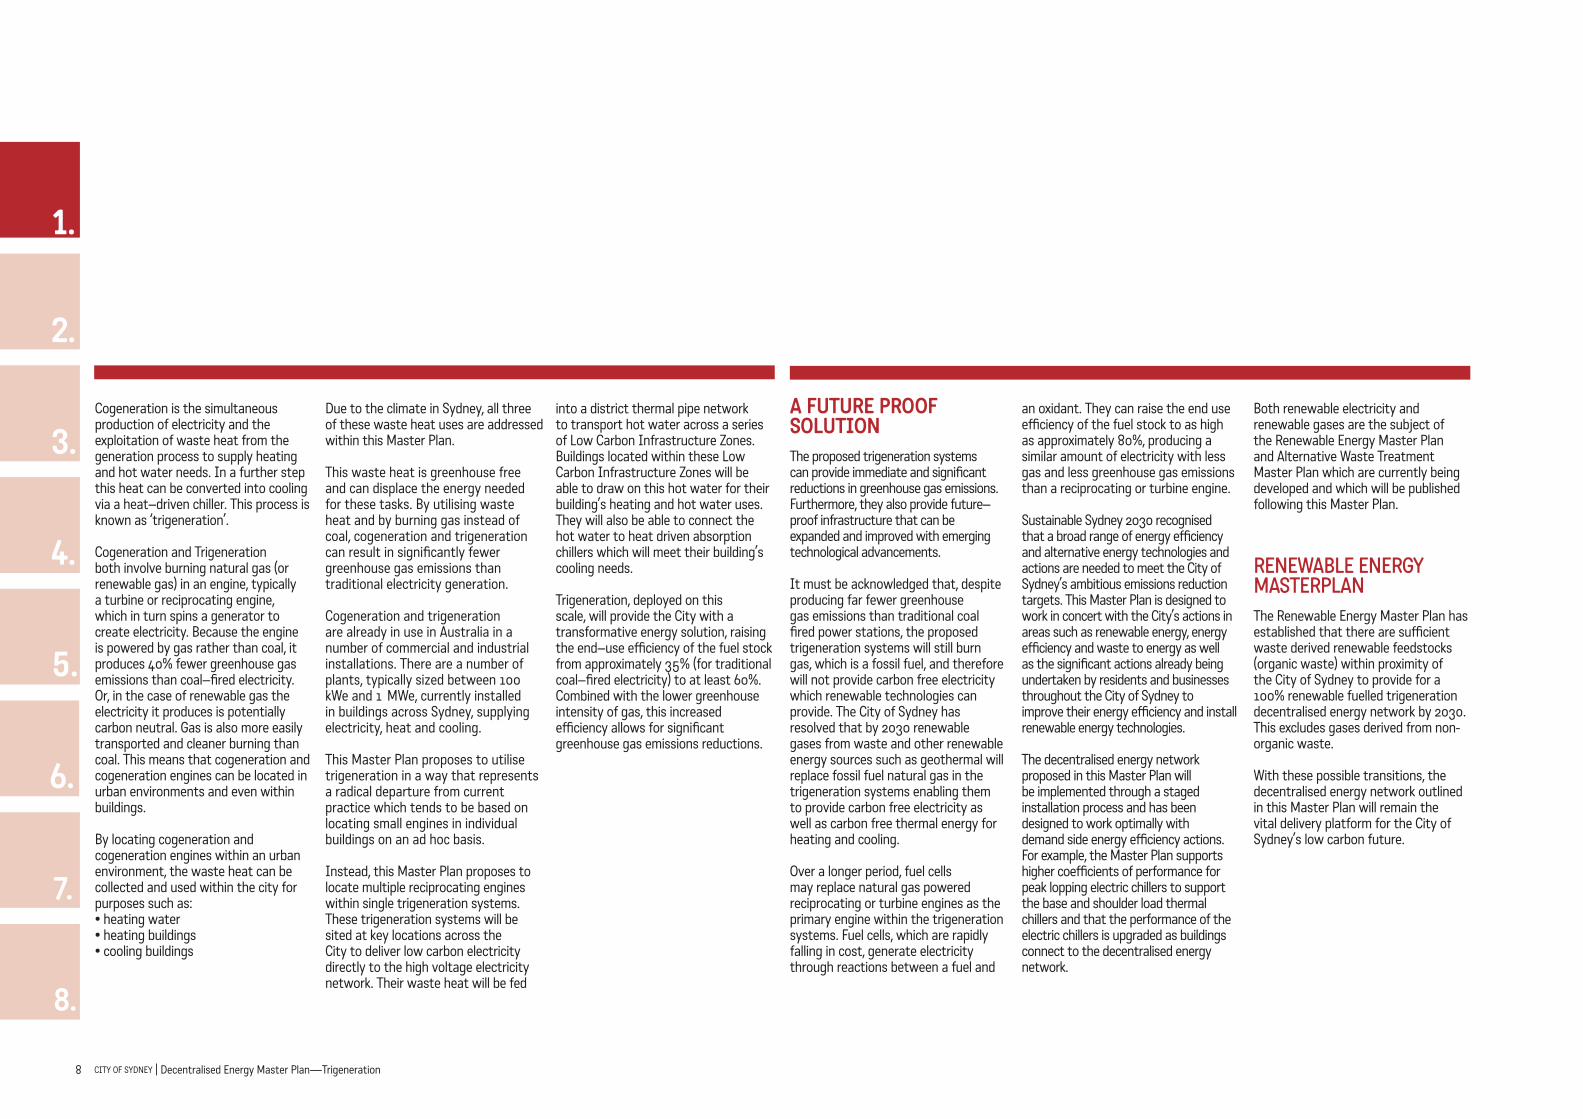
Cogeneration is the simultaneous production of electricity and the exploitation of waste heat from the generation process to supply heating and hot water needs. In a further step this heat can be converted into cooling via a heat–driven chiller. This process is known as ‘trigeneration’.
Cogeneration and Trigeneration both involve burning natural gas (or renewable gas) in an engine, typically a turbine or reciprocating engine, which in turn spins a generator to create electricity. Because the engine is powered by gas rather than coal, it produces 40% fewer greenhouse gas emissions than coal–fired electricity. Or, in the case of renewable gas the electricity it produces is potentially carbon neutral. Gas is also more easily transported and cleaner burning than coal. This means that cogeneration and cogeneration engines can be located in urban environments and even within buildings.
By locating cogeneration and cogeneration engines within an urban environment, the waste heat can be collected and used within the city for purposes such as:• heating water• heating buildings• cooling buildings
Due to the climate in Sydney, all three of these waste heat uses are addressed within this Master Plan.
This waste heat is greenhouse free and can displace the energy needed for these tasks. By utilising waste heat and by burning gas instead of coal, cogeneration and trigeneration can result in significantly fewer greenhouse gas emissions than traditional electricity generation.
Cogeneration and trigeneration are already in use in Australia in a number of commercial and industrial installations. There are a number of plants, typically sized between 100 kWe and 1 MWe, currently installed in buildings across Sydney, supplying electricity, heat and cooling.
This Master Plan proposes to utilise trigeneration in a way that represents a radical departure from current practice which tends to be based on locating small engines in individual buildings on an ad hoc basis.
Instead, this Master Plan proposes to locate multiple reciprocating engines within single trigeneration systems. These trigeneration systems will be sited at key locations across the City to deliver low carbon electricity directly to the high voltage electricity network. Their waste heat will be fed
into a district thermal pipe network to transport hot water across a series of Low Carbon Infrastructure Zones. Buildings located within these Low Carbon Infrastructure Zones will be able to draw on this hot water for their building’s heating and hot water uses. They will also be able to connect the hot water to heat driven absorption chillers which will meet their building’s cooling needs.
Trigeneration, deployed on this scale, will provide the City with a transformative energy solution, raising the end–use efficiency of the fuel stock from approximately 35% (for traditional coal–fired electricity) to at least 60%. Combined with the lower greenhouse intensity of gas, this increased efficiency allows for significant greenhouse gas emissions reductions.

9City of Sydney | decentralised energy Master Plan—trigeneration
3 THe DeCenTRALiSeD eneRgY neTWoRK
2 Re–THinKing THe URBAn FoRM
4 5
PeRFoRMAnCe
oUTSiDe THe neTWoRK
6 enABLing THe MASTeR PLAn
7 CASe STUDieS
8 gAS FeASiBiLiTY STUDY
1 TRigeneRATion
5MWh
20MWh
33MWh
25MWh58MWh
42MWh
NATURAL/RENEWABLE GAS
100MWh
TRIGENERATIONSYSTEM
Figure 1: indiCaTiVe energy breaKdoWn oF a TrigeneraTion sysTeM The content of this Master Plan offers a different approach to delivering energy to the City. Founded on cogeneration, it differs from traditional coal fired electricity in two key ways:• the input fuel• the method by which
it handles waste heat.Cogeneration is the simultaneous production of electricity and the exploitation of waste heat from the generation process to supply heating and hot water needs (see Figure 1).

Re–THinKing THe URBAn FoRM
CITY OF SYDNEY | Decentralised Energy Master Plan10
2.

11City of Sydney | decentralised energy Master Plan—trigeneration
3 THe DeCenTRALiSeD eneRgY neTWoRK
4 5
PeRFoRMAnCe
oUTSiDe THe neTWoRK
1 TRigeneRATion
6 enABLing THe MASTeR PLAn
7 CASe STUDieS
8 gAS FeASiBiLiTY STUDY
2 Re–THinKing THe URBAn FoRM
This chapter outlines the approach to determining the most appropri-ate location for the trigeneration systems by harnessing and enabling the data and knowledge that exists across a wide variety of stakeholders to re–interpret the city.Traditionally, urban planners have inter-preted the city through its built form. Building heights and envelopes, however, hide the real picture of the city’s energy consumption and greenhouse gas emissions. While larger buildings tend to consume more energy, the intensity of this use as well as the amount of energy that is consumed for heating, cooling, hot water and appliances will differ significantly. Transforming the City of Sydney’s energy supply requires us to re–think our understanding of the urban form.
This Master Plan intentionally dis-tinguishes itself from the traditional approach, re–visualising the city in relation to energy consumption and greenhouse gas emissions. The City of Sydney’s rich land use and floor space data, reconciled against metered electricity and gas consumption data that was provided by Energy Australia and Jemena, has enabled spatial diag-nostics of the city’s energy and thermal demands to locate the trigeneration systems and the thermal distributions that makes up the Decentralised Energy Network (Figure 2).
MoVing To a LoW Carbon energy FuTure CannoT be aChieVed Through a ConVenTionaL VieW oF CiTies and CiTy PLanning
Layer a = Land use and FLoor sPaCeThe City of Sydney Floor Space and Employment Survey (FES) measures and captures the entire built form of the city providing an understanding of every space and use across every building in the local government area.
Layer b = uTiLiTy eLeCTriCiTy and gas ConsuMPTion daTaWith the assistance of EnergyAustralia and Jemena, detailed energy consumption data was provided across the different suburbs and sub–station zones within the local government area, allowing the City’s FES to be matched to real metered electricity and gas consumption data.
Layer C = buiLding by buiLding eLeCTriCiTy ConsuMPTionHow is electricity used across the city? And where is electricity use concentrated? Matching the City’s FES with EnergyAustralia electricity consumption data created a detailed picture of electricity consumption across the City.
Layer d = buiLding by buiLding gas ConsuMPTionHow is gas used across the city? And where is gas use concentrated? Matching the City’s FES with Jemena gas consumption data created a detailed picture of gas consumption across the City.
Layer e = buiLding by buiLding TherMaL deMandsWhere are thermal loads concentrated across the city? The primary advantage of trigeneration energy is the ability to use the waste heat for space cooling, heating and hot water—heat energy that is otherwise wasted. Understanding where these thermal loads are distributed highlights the areas of the City where these loads can be displaced with zero–carbon energy.
Layer F = CoMPrehensiVe Land use, energy and greenhouse gas eMission anaLysis ProFiLe The synthesis of the City’s FES and energy data has facilitated a comprehensive understanding of land use, energy and greenhouse gas emissions abatement opportunities to reveal the challenge and pathway to the solution for a low carbon city.
Figure 2
12 City of Sydney | decentralised energy Master Plan—trigeneration
3.
4.
5.
6.
7.
8.
2.
1.Layer a Land use and FLoor sPaCe
Figure 3: Land use Zoning Figure 4: gross FLoor area
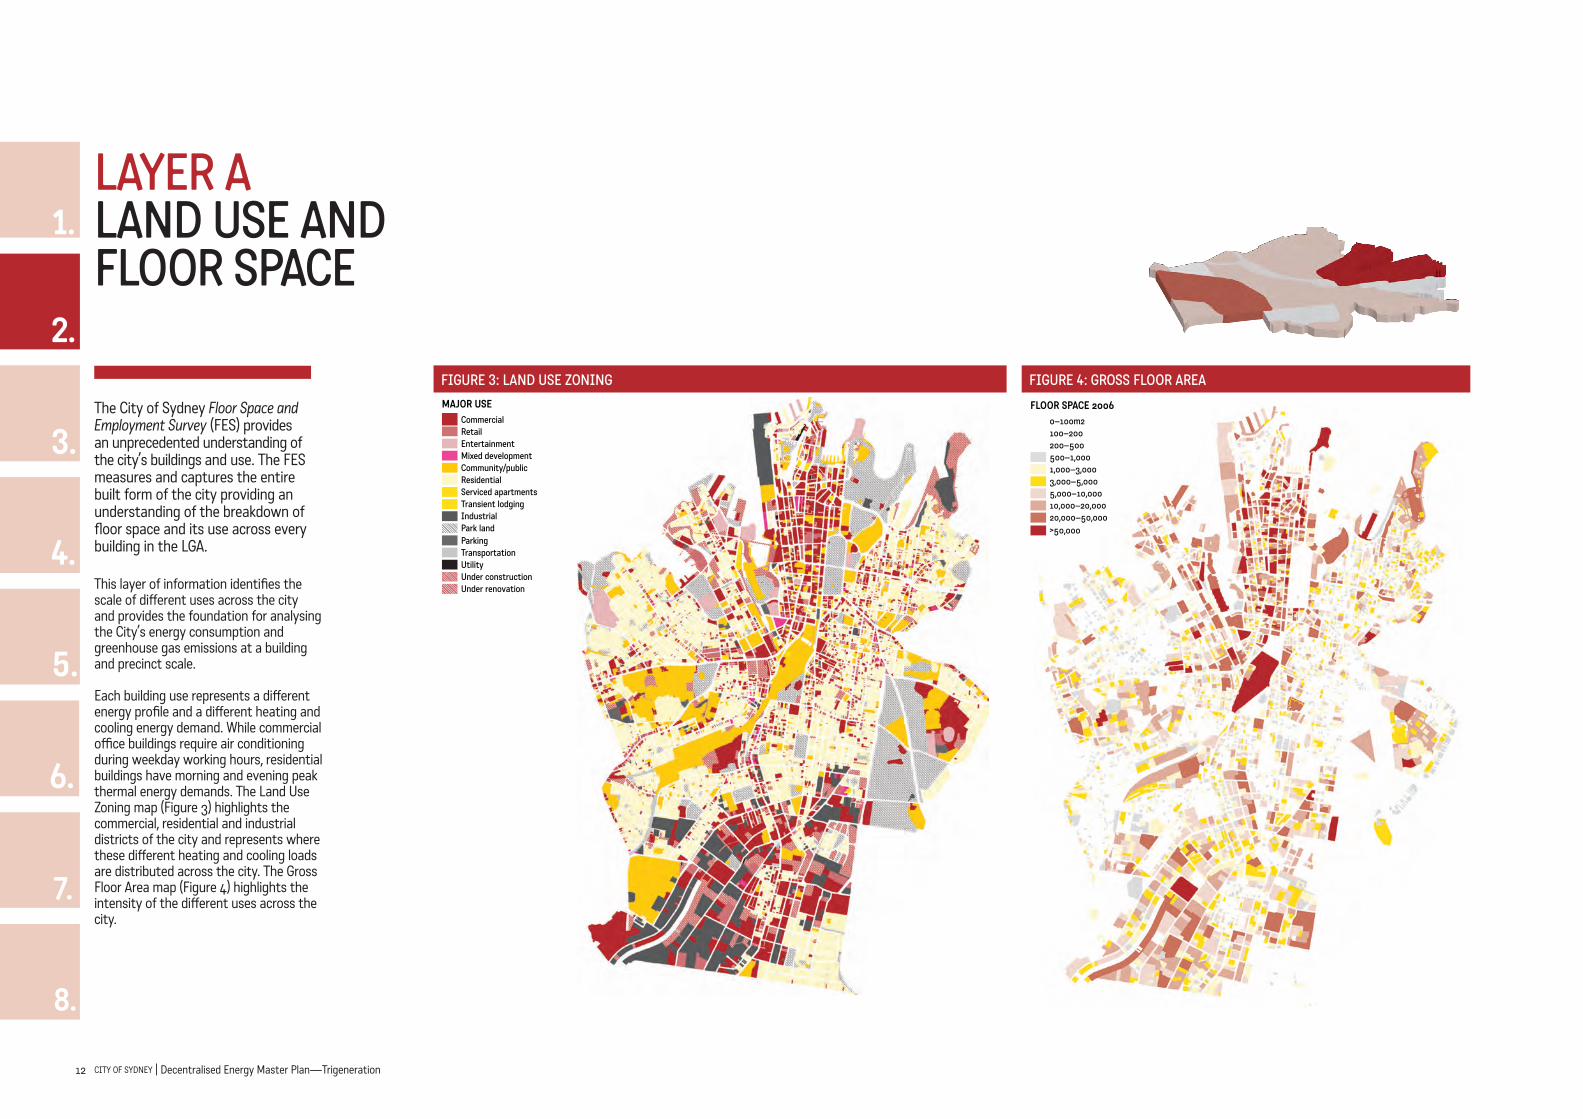
The City of Sydney Floor Space and Employment Survey (FES) provides an unprecedented understanding of the city’s buildings and use. The FES measures and captures the entire built form of the city providing an understanding of the breakdown of floor space and its use across every building in the LGA.
This layer of information identifies the scale of different uses across the city and provides the foundation for analysing the City’s energy consumption and greenhouse gas emissions at a building and precinct scale.
Each building use represents a different energy profile and a different heating and cooling energy demand. While commercial office buildings require air conditioning during weekday working hours, residential buildings have morning and evening peak thermal energy demands. The Land Use Zoning map (Figure 3) highlights the commercial, residential and industrial districts of the city and represents where these different heating and cooling loads are distributed across the city. The Gross Floor Area map (Figure 4) highlights the intensity of the different uses across the city.
MAJOR USE
CommercialRetailEntertainmentMixed developmentCommunity/publicResidentialServiced apartmentsTransient lodgingIndustrialPark landParkingTransportationUtilityUnder constructionUnder renovation
FLOOR SPACE 20060–100m2100–200200–500500–1,0001,000–3,0003,000–5,0005,000–10,00010,000–20,00020,000–50,000>50,000

13City of Sydney | decentralised energy Master Plan—trigeneration
3 THe DeCenTRALiSeD eneRgY neTWoRK
4 5
PeRFoRMAnCe
oUTSiDe THe neTWoRK
1 TRigeneRATion
6 enABLing THe MASTeR PLAn
7 CASe STUDieS
8 gAS FeASiBiLiTY STUDY
2 Re–THinKing THe URBAn FoRM
0
5
10
15
20
25
30
35
40
45
50
02 JAN 30 JAN 27 FEB 27 MAR
POW
ER (W
/M2)
BUILDING 1 BUILDING 2 CALIBRATING MODEL PROFILE
Layer b uTiLiTy eLeCTriCiTy and gas ConsuMPTion daTa
Figure 5: exaMPLe uTiLiTy daTa siTe anaLysis
Figure 6: CaLibraTing deMand side Loads
Most macro scale analysis of cities relies on assumptions and data generated through models.
Within this Master Plan the use of metered utility data has provided an evidence base for calibrating the demand profiles of various building types in different locations across the city (Figure 5).
Metered electricity and gas consumption data, was provided by EnergyAustralia and Jemena to calculate hourly energy demand profiles for each building use type. These demand profiles were further calibrated against climate data to create a robust platform for extrapolating these demand profiles across the City (Figure 6).

14 City of Sydney | decentralised energy Master Plan—trigeneration
1.
3.
4.
5.
6.
7.
8.
2.
Layer C buiLding by buiLding eLeCTriCiTy ConsuMPTion
Figure 7: total electricity consuMption on a buiLding by buiLding sCaLe
Figure 8: intensity of electricity consuMption on a buiLding by buiLding sCaLe
Linking metered electricity consumption data to the City’s FES provides the story of where and how electricity is used on a building by building scale across the City. This is important for understanding both current and future greenhouse gas emissions as well as the impact of the electricity generated by trigeneration systems on the electricity network (Figure 7).
Total electricity consumption on a building by building level ( MWh/year) highlights the concentration of electricity consumption in both the commercial core and industrial south of the City. Due to uncertainty around their future use and lack of appropriate data, electric vehicles were not included in the electricity consumption analysis. Electric vehicles could provide additional demand on the network depending on the penetration of electric vehicles and charging points and this may need to be accounted for in the future.
The intensity of this electricity consumption is critical to understanding where alternative energy supplies have the greatest impact (Figure 8). Showing electricity consumption as an intensity metric (kWh per m2 of lot area/year) draws attention to the high intensity consumption areas of the CBD, Pyrmont and areas along Broadway and William Street. This can be attributed to the scale of buildings in these locations as well as the high electricity loads from lighting and space conditioning.
ELECTRICITY CONSUMPTION 20060–1 MWh/YEAR1–55–1010–5050–100100–500500–1,0001,000–2,0002,000–5,000> 5,000
ELECTRICITY INTENSITY 20060–10 kWh/m2 of lot area10–2020–5050–100100–200200–300300–500500–1,0001,000–5,000> 5,000

15City of Sydney | decentralised energy Master Plan—trigeneration
3 THe DeCenTRALiSeD eneRgY neTWoRK
4 5
PeRFoRMAnCe
oUTSiDe THe neTWoRK
1 TRigeneRATion
6 enABLing THe MASTeR PLAn
7 CASe STUDieS
8 gAS FeASiBiLiTY STUDY
2 Re–THinKing THe URBAn FoRM
Layer d buiLding by buiLding
gas ConsuMPTion
Figure 9: total gas consuMption on a buiLding by buiLding sCaLe
Figure 10: intensity of gas consuMption on a buiLding by buiLding sCaLe
Linking metered gas consumption data to the City’s FES provides the story of where and how gas is used on a building by building scale across the City. This is important to understanding both current and future greenhouse gas emissions as well as the impact of the additional gas consumption needed for trigeneration systems on gas infrastructure and supply (Figure 9).
Total gas consumption on a building by building level (MJ/year) highlights the concentration of gas consumption in both the commercial core and industrial south of the City.
The intensity of this gas consumption is critical to understanding where alternative energy supplies have the greatest impact (Figure 10). Showing gas consumption as an intensity metric (MJ per m2 of lot area/year) draws attention to the high intensity consumption areas of the CBD, Pyrmont and areas along Broadway and William Street. This can be attributed to the scale of buildings, i.e. areas with the greatest concentration of floor area.
GAS CONSUMPTION 2006
0–10,000 MJ/YEAR10,000–15,00015,000–20,00020,000–50,00050,000–100,000100,000–500,000500,000–1,000,0001,000,000–5,000,0005,000,000–10,000,000> 10,000,000
GAS INTENSITY 2006
0–50 MJ/m2 of lot area50–7575–100100–150150–200200–500500–1,0001,000–2,0002,000–3,000> 3,000
16 City of Sydney | decentralised energy Master Plan—trigeneration
3.
4.
5.
6.
7.
8.
2.
1.Layer e buiLding by buiLding TherMaL energy ConsuMPTion
Figure 11: total heating, cooling & hot water consuMption on a buiLding by buiLding sCaLe
Figure 12: intensity of heating, cooling & hot water consuMption on a buiLding by buiLding sCaLe
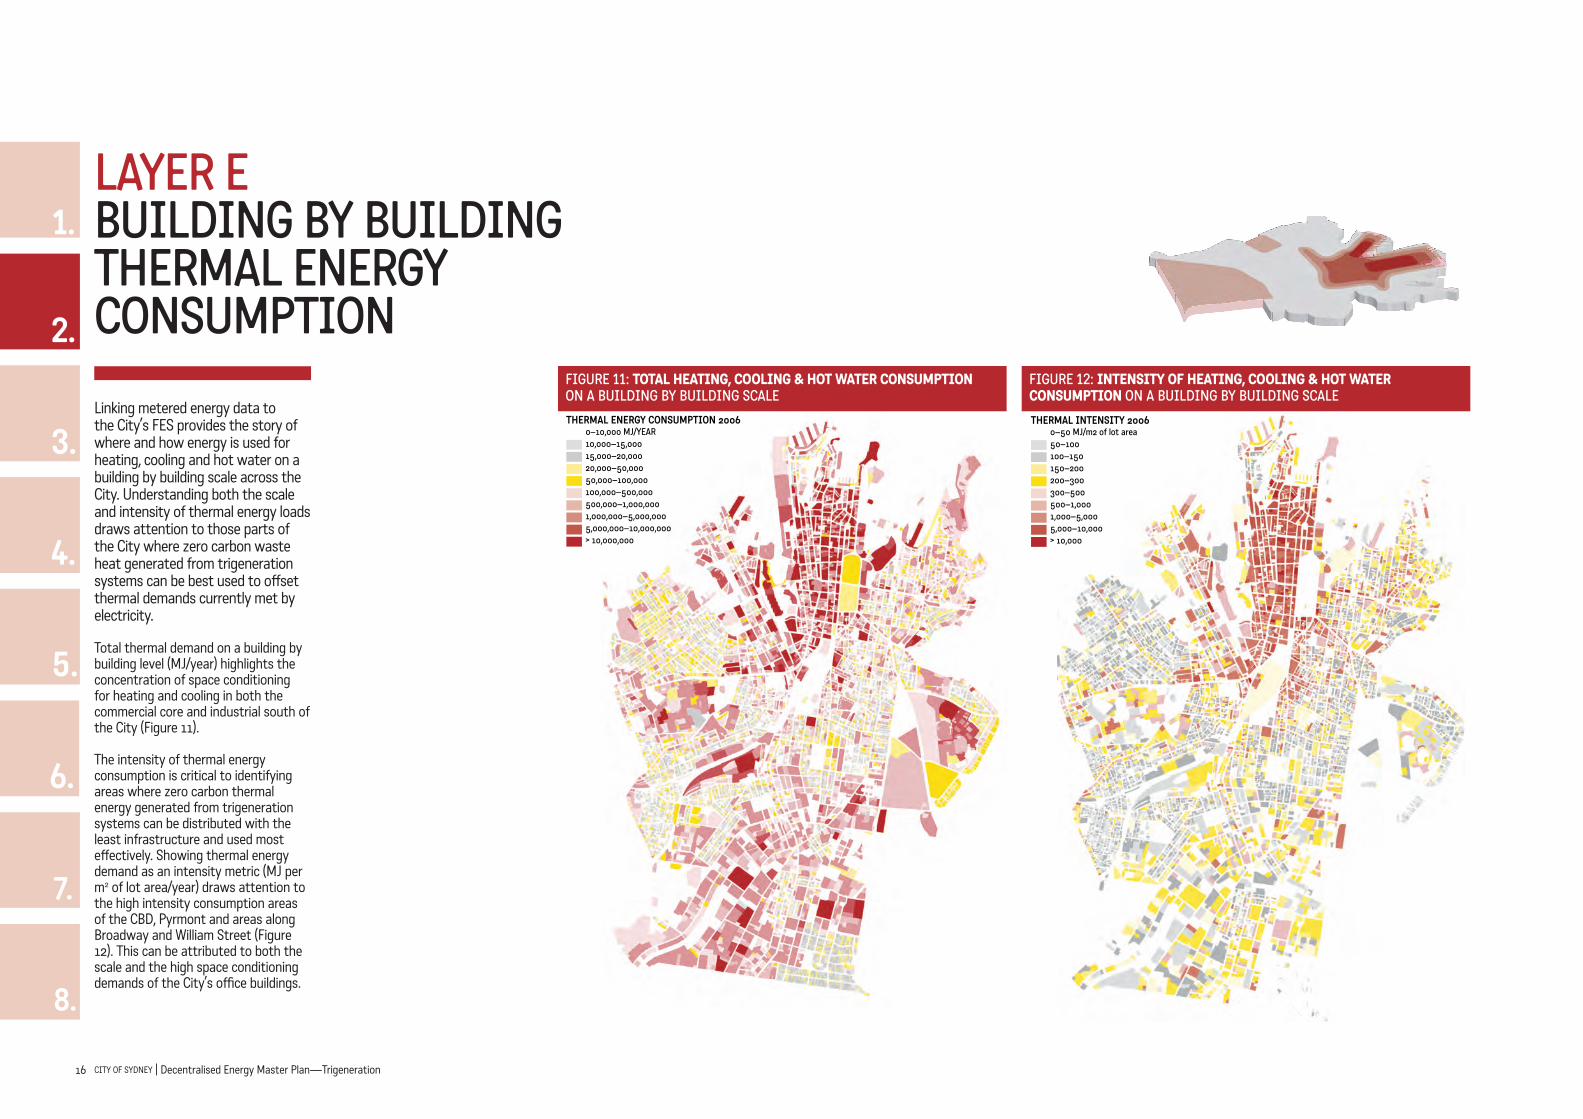
Linking metered energy data to the City’s FES provides the story of where and how energy is used for heating, cooling and hot water on a building by building scale across the City. Understanding both the scale and intensity of thermal energy loads draws attention to those parts of the City where zero carbon waste heat generated from trigeneration systems can be best used to offset thermal demands currently met by electricity.
Total thermal demand on a building by building level (MJ/year) highlights the concentration of space conditioning for heating and cooling in both the commercial core and industrial south of the City (Figure 11).
The intensity of thermal energy consumption is critical to identifying areas where zero carbon thermal energy generated from trigeneration systems can be distributed with the least infrastructure and used most effectively. Showing thermal energy demand as an intensity metric (MJ per m2 of lot area/year) draws attention to the high intensity consumption areas of the CBD, Pyrmont and areas along Broadway and William Street (Figure 12). This can be attributed to both the scale and the high space conditioning demands of the City’s office buildings.
THERMAL ENERGY CONSUMPTION 20060–10,000 MJ/YEAR10,000–15,00015,000–20,00020,000–50,00050,000–100,000100,000–500,000500,000–1,000,0001,000,000–5,000,0005,000,000–10,000,000> 10,000,000
THERMAL INTENSITY 20060–50 MJ/m2 of lot area50–100100–150150–200200–300300–500500–1,0001,000–5,0005,000–10,000> 10,000

17City of Sydney | decentralised energy Master Plan—trigeneration
3 THe DeCenTRALiSeD eneRgY neTWoRK
4 5
PeRFoRMAnCe
oUTSiDe THe neTWoRK
1 TRigeneRATion
6 enABLing THe MASTeR PLAn
7 CASe STUDieS
8 gAS FeASiBiLiTY STUDY
2 Re–THinKing THe URBAn FoRM
Layer F CoMPrehensiVe Land use,
energy and greenhouse gas eMission anaLysis ProFiLe
Figure 13: CiTy oF sydney buiLding greenhouse gas eMissions ProFiLe 2010
The City’s target of reducing greenhouse gas emissions across the local government area by 70% requires us to re–think the urban form.
Figure 13 displays the amount of greenhouse gas emissions through vertical height and the intensity through colour, i.e. the greater the stack the higher the emissions, the darker the colour the greater the intensity. This spatial representation of emissions across the City captures the stationary greenhouse gas emissions across nine different building types.
Even with the benefit of a declining greenhouse gas intensity enabled through the implementation of the Federal Government’s Renewable Energy Target, the addition of new developments such as Green Square and Barangaroo could increase the City’s absolute greenhouse gas emissions by 11% by 2030.
The solution to this challenge is presented in this Master Plan.
CITY OF SYDNEY | Decentralised Energy Master Plan18
3. THe DeCenTRALiSeD eneRgY neTWoRK
19City of Sydney | decentralised energy Master Plan—trigeneration
2 Re–THinKing THe URBAn FoRM
4 5
PeRFoRMAnCe
oUTSiDe THe neTWoRK
1 TRigeneRATion
6 enABLing THe MASTeR PLAn
7 CASe STUDieS
8 gAS FeASiBiLiTY STUDY
3 THe DeCenTRALiSeD eneRgY neTWoRK
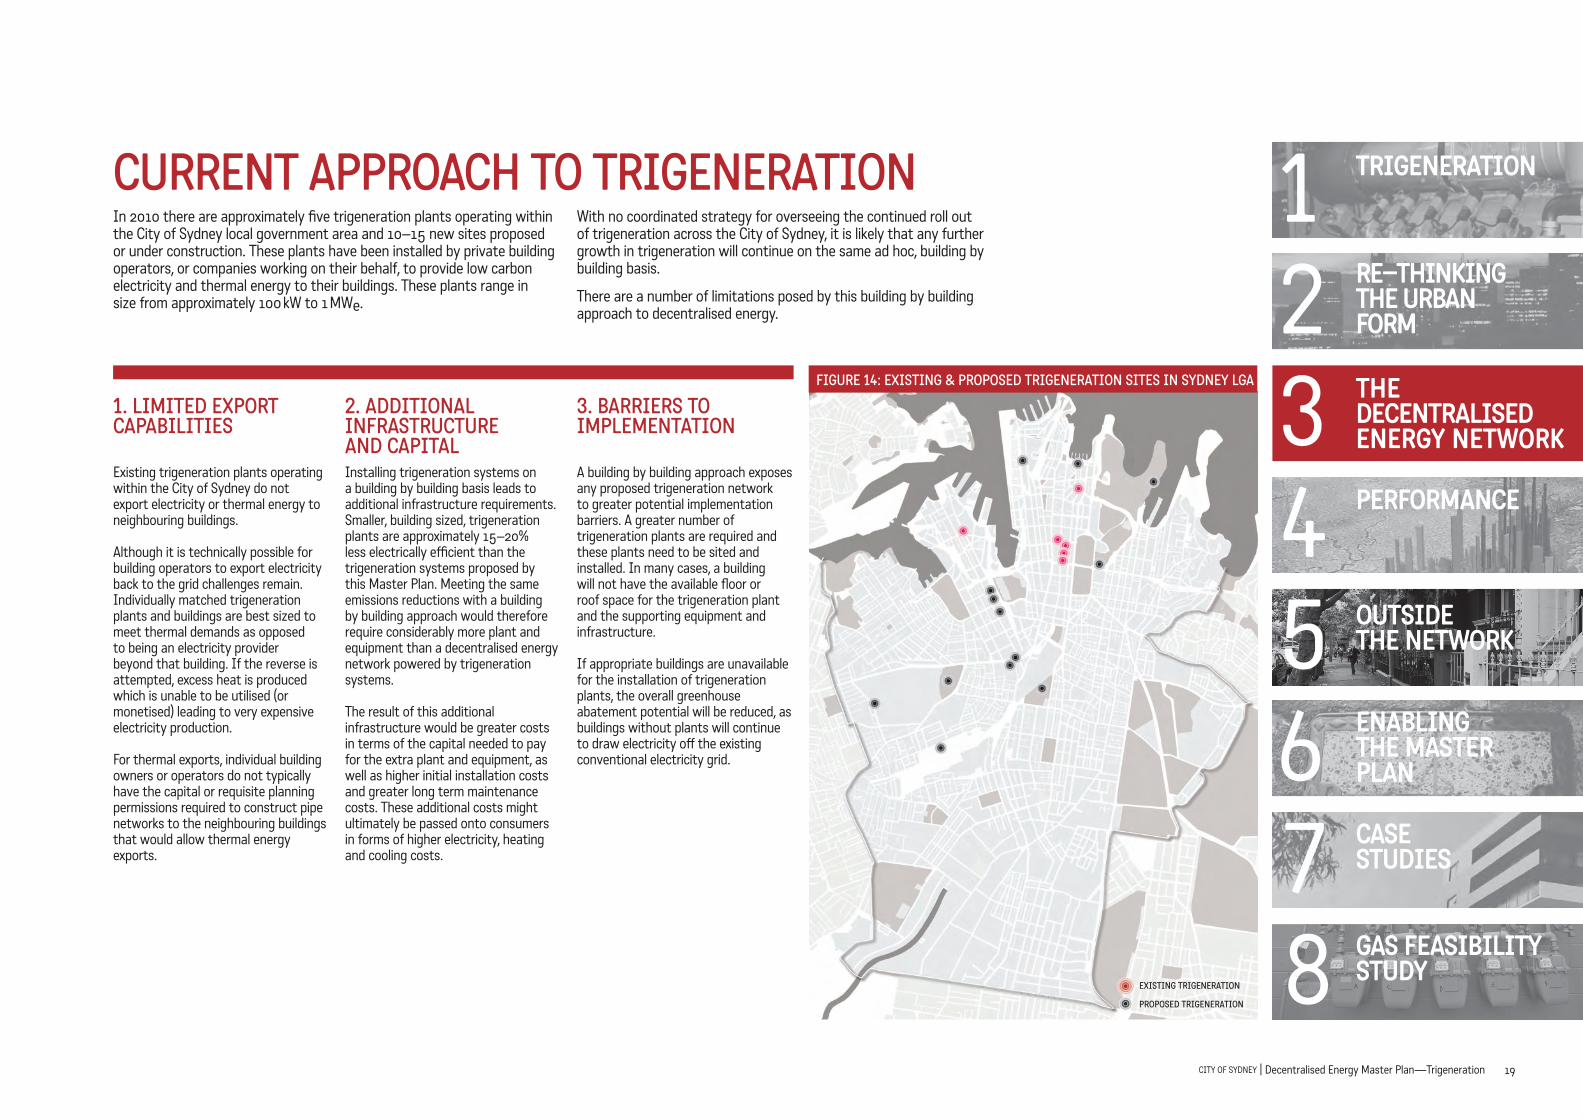
1. LiMiTed exPorT CaPabiLiTies Existing trigeneration plants operating within the City of Sydney do not export electricity or thermal energy to neighbouring buildings.
Although it is technically possible for building operators to export electricity back to the grid challenges remain. Individually matched trigeneration plants and buildings are best sized to meet thermal demands as opposed to being an electricity provider beyond that building. If the reverse is attempted, excess heat is produced which is unable to be utilised (or monetised) leading to very expensive electricity production.
For thermal exports, individual building owners or operators do not typically have the capital or requisite planning permissions required to construct pipe networks to the neighbouring buildings that would allow thermal energy exports.
2. addiTionaL inFrasTruCTure and CaPiTaLInstalling trigeneration systems on a building by building basis leads to additional infrastructure requirements. Smaller, building sized, trigeneration plants are approximately 15–20% less electrically efficient than the trigeneration systems proposed by this Master Plan. Meeting the same emissions reductions with a building by building approach would therefore require considerably more plant and equipment than a decentralised energy network powered by trigeneration systems.
The result of this additional infrastructure would be greater costs in terms of the capital needed to pay for the extra plant and equipment, as well as higher initial installation costs and greater long term maintenance costs. These additional costs might ultimately be passed onto consumers in forms of higher electricity, heating and cooling costs.
3. barriers To iMPLeMenTaTion A building by building approach exposes any proposed trigeneration network to greater potential implementation barriers. A greater number of trigeneration plants are required and these plants need to be sited and installed. In many cases, a building will not have the available floor or roof space for the trigeneration plant and the supporting equipment and infrastructure.
If appropriate buildings are unavailable for the installation of trigeneration plants, the overall greenhouse abatement potential will be reduced, as buildings without plants will continue to draw electricity off the existing conventional electricity grid.
Figure 14: exisTing & ProPosed TrigeneraTion siTes in sydney Lga
In 2010 there are approximately five trigeneration plants operating within the City of Sydney local government area and 10–15 new sites proposed or under construction. These plants have been installed by private building operators, or companies working on their behalf, to provide low carbon electricity and thermal energy to their buildings. These plants range in size from approximately 100 kW to 1 MWe.
CurrenT aPProaCh To TrigeneraTionWith no coordinated strategy for overseeing the continued roll out of trigeneration across the City of Sydney, it is likely that any further growth in trigeneration will continue on the same ad hoc, building by building basis.
There are a number of limitations posed by this building by building approach to decentralised energy.
exisTing TrigeneraTion
ProPosed TrigeneraTion

20 City of Sydney | decentralised energy Master Plan—trigeneration
1.
4.
5.
6.
7.
8.
3.
2.
engine TyPeSetting aside fuel cells as an emerging technology, there are two primary types of gas powered engines which can be used in the trigeneration system: reciprocating or turbine. Each engine type has its own specific advantages and disadvantages.
For a rated power, reciprocating engines are generally more electrically efficient than turbines. That is, when coupled to an electrical generator, they can produce more electricity from the same amount of fuel than a turbine. On the other hand, reciprocating engines tend to be larger in size, requiring more floor space than a turbine to produce the same electrical output.
TherMaL reTiCuLaTion neTWorKEach Trigeneration System will be connected to a thermal reticulation network that will capture the waste heat generated by the cogeneration engine and distribute it as useable thermal energy. There are three methods for distributing this thermal energy:
1. HOT WATER ONLY DISTRIBUTION: Waste heat from the centralised cogeneration engines is used to heat water which is then piped to individual buildings. Heat is used to provide heating and hot water services to the building and cooling is provided by local decentralised heat driven absorption chillers which create cold water to the building.
2. CHILLED WATER ONLY DISTRIBUTION: Waste heat from the centralised cogeneration engines drives heat driven absorption chillers which create cold water that is piped to individual buildings.
3. HOT AND COLD WATER DISTRIBUTION: Two separate pipes are connected to the centralised Trigeneration System. One pipe carries hot water, the other cold water.
Each distribution method has different infrastructure implications and capital costs.
For hot water only distribution, buildings will need to convert the supplied heat into cooling in order to provide for the space cooling needs of the building. For this reason, heat–driven cooling will be generally undertaken within each individual building using an absorption chiller.
For chilled water only distribution, large absorption chillers need to be centrally incorporated within each trigeneration system. In this case, heating will need to be provided locally by means of gas or electricity.
TherMaL disTribuTion TeMPeraTureIn addition to the different hot and chilled water distribution methods, there are also different temperatures at which the thermal energy can be distributed. These temperatures, as well as the total amount of available heat, are dependent on whether a turbine or reciprocating engine is the source.
Virtually all waste heat that can be harvested from a turbine is embodied in its exhaust gasses at a temperature in excess of 300oC. This energy can be readily used to heat water to a ‘high temperature’ state of 180oC.
In the case of reciprocating engines, exhaust gasses can be used to generate similar water temperatures. However, a considerable amount of waste heat is embodied in the 95oC cooling water jacket of the engine. If a reciprocating engine is the source of heat, then a high temperature network will draw mainly on exhaust heat and can generally not exploit the lower temperature water jacket heat, the heat embodied in the water used to cool the body of the reciprocating engine. In this case, a low temperature network is better suited to exploit and transport thermal energy to the end users.
deTerMining The ideaL soLuTion For The CiTy
oPeraTing sTraTegyThe mode of operation of trigeneration systems is a primary determinant of the amount of electricity produced and greenhouse gases saved.
Running trigeneration systems for 24 hours per day generates the greatest amount of low–carbon electricity and associated heat, and hence delivers the highest greenhouse savings. However, as a business proposition, such operation may not be cost effective as, outside of peak and shoulder periods, gas is being used to displace low cost off–peak electricity. Running the plant during periods of high electrical load and tariffs (7am to 10pm) has the advantage of displacing the majority of electrical demand and is able to compete with peak and shoulder electricity prices. Two typical load profiles measured within zone substations within the City of Sydney are represented within Figure 15.
Figure 15: Load ProFiLes WiThin sydney Cbd
CITY ZONE ACITY ZONE B
0
20
40
60
80
100
120
140
6:00 12:00 16:00 0:000:00TIME OF DAY
POW
ER (M
We)

21City of Sydney | decentralised energy Master Plan—trigeneration
2 Re–THinKing THe URBAn FoRM
4 5
PeRFoRMAnCe
oUTSiDe THe neTWoRK
1 TRigeneRATion
6 enABLing THe MASTeR PLAn
7 CASe STUDieS
8 gAS FeASiBiLiTY STUDY
3 THe DeCenTRALiSeD eneRgY neTWoRK
HOTWATER
COLDWATER
HOT+COLDWATER
1601.8
1.6
1.4
1.2
1.0
0.8
0.6
0.4
0.2
140
120
100
60
80
40
20
Greenhouse Gas Saving % (left axis)Fuel Use Efficiency % (left axis)Greenhouse Gas Saving tonnes/CO2-e/pa (right axis)
Greenhouse Gas Saving tonnes per kW installed (left axis)Engine Size Total MWe (right axis)
FUEL
EFF
ICIE
NCY
— %
GHG
SAV
INGS
— IN
STAL
LED
TONN
ES/K
W
TONN
ES C
O2 S
AVED
P.A
. — E
NGIN
E SI
ZE K
W
HOTWATER
COLDWATER
HOT+COLDWATER
HOTWATER
COLDWATER
HOT+COLDWATER
LOW TEMPERATURE/RECIPROCATING/AVERAGE ELECTRIC
HIGHTEMPERATURE/TURBINE/AVERAGE ELECTRIC
HIGHTEMPERATURE/TURBINE/AVERAGE THERMAL
Figure 16: anaLysis oF Various TrigeneraTion deLiVery sTraTegies For souThern Cbd
To determine the most appropriate configuration for the City of Sydney, 24 possible combinations of engine type, engine size, distribution method and type of operation were modelled using the floor space, energy demand, gas demand and trigeneration modelling data described in Chapter 2. Nine preferred configurations were selected for detailed analysis across the entire City of Sydney. Figure 16 illustrates part of this analysis for the southern part of the CBD.
Each potential configuration was assessed on the following criteria:
1. gReenHoUSe gAS eMiSSionS SAVing
2. FUeL eFFiCienCY3. CAPiTAL AnD
ReCURRenT CoSTS
There is no ideal system. Different configurations will be appropriate in different locations. The key is determining the most appropriate configuration for the City of Sydney’s specific context. This is outlined in the next section.
As illustrated in Figure 16, the shortlisted delivery strategies included two engine types, reciprocating and turbine and three distribution methods, hot water only, cold water only and hot and cold water (delivered through a two pipe system).
LOW TEMPERATURE = 95°C HIGH TEMPERATURE = 180°C
THERE IS NO IDEAL SYSTEM. DIFFERENT CONFIGURATIONS WILL BE APPROPRIATE IN DIFFERENT LOCATIONS. THE KEY IS DETERMINING THE MOST APPROPRIATE CONFIGURATION FOR THE CITY OF SYDNEY’S SPECIFIC CONTExT.
Turbine engines can deliver higher water temperatures and higher thermal efficiencies through the use of double effect chillers. Reciprocating engines cannot generate hot water at as high a temperature as a turbine engine. However, they have higher electrical efficiencies. It was, therefore, determined that the greater overall emissions reductions associated with reciprocating engines, along with the engineering challenges and complexities of reticulating 180°C hot water meant that reciprocating engines were the favoured technology.
Once reciprocating engines were selected as the preferred engine type, the three distribution methods (low temperature (95oC) hot water only, cold water only and hot and cold water delivered through a two pipe system) were assessed. Hot and cold water distribution was eliminated due to the costs associated with retrofitting a two pipe system within an existing CBD environment.
A cold water only system would require less retrofitting of existing buildings, as it would eliminate the need for building owners to install heat fired absorption chillers. However, it would require building operators to maintain gas boilers in order to meet their building’s entire hot water and space heating requirements, lowering the overall emissions reduction potential.
The consortium also settled on a commercial model where the cost of the absorption chiller was financed and installed at the time of connection to the decentralised energy network by the customer.

22 City of Sydney | decentralised energy Master Plan—trigeneration
1.
4.
5.
6.
7.
8.
3.
2.oPeraTing sTraTegy: oPeraTion during PriMary business hours; 7aM–10PM
Operating the trigeneration systems during periods of high electrical load and tariffs is considered the most appropriate balance of high greenhouse gas emissions savings and high economic return. This strategy has the advantage of displacing the majority of electrical demand and is able to compete with peak and shoulder electricity prices.
Potential monetary value could be captured if operation of the trigeneration systems coincides with minimising peak issues either on the network or from remote generators.
Further potential monetary value, utilisation of the system and greater reduction in greenhouse gas emissions could be captured in particular precincts or Low Carbon Infrastructure Zones where buildings such as entertainment buildings operated beyond 10pm and/or where the waste heat from trigeneration was used for recycled water treatment.
Further potential monetary value, utilisation of the system and greater reduction in greenhouse gas emissions could also be captured with a price on carbon and avoided off–peak network charges.
Table 1 outlines the detailed specifications for the preferred trigeneration systems configuration modelled in this Master Plan.
Figure 17: greenhouse saVings For Various engine siZes/TyPes, oPeraTing sTraTegies and neTWorK TeMPeraTure
engine TyPe: reCiProCaTing engines, ToTaLLing aPProxiMaTeLy 360 MWe
There is a clear advantage in using reciprocating engines when compared to gas turbines. This advantage comes simply from the fact that these engines can achieve an electrical efficiency of approximately 42% based on the higher heating value of the fuel gas (46% lower heating value), in comparison to approximately 36% achieved with gas turbines (Figure 17).
As engine size increases, greenhouse gas emissions savings also increase but at a diminishing rate (Figure 17). Moreover, for an installed capacity of greater than approximately 360 MWe, utilisation of the plant falls below 60%. This means that while larger plants will return greater greenhouse gas emissions savings, the investment in the plant is not returning its full potential.
TherMaL disTribuTion neTWorK: LoW TeMPeraTure hoT WaTer disTribuTion
The City’s major thermal demand is space cooling. This can be supplied by a chilled water system, however, given the small amount of thermal power that can be distributed due to the restricted operating temperature range (typically 6°C sent out, 14°C return), hot water connected to individual heat–driven coolers located in individual buildings can provide
significantly greater amounts of thermal power through an acceptably sized pipe network.
Overall, there is a modest additional greenhouse saving available from a high temperature distributed system (Figure 17). However, the greater costs, engineering challenges and complexities of reticulating 180°C hot water around the city are likely to offset any marginal benefit compared to a low temperature 95°C hot water loop.
Sent out water temperatures of approximately 98°C have been envisaged as the energy carrier for the thermal network. After allowance for pipe losses, such a supply is compatible with the drive heat demands of the conventional single–effect absorption chillers that represent the major thermal loads on the decentralised energy network. In the main, the most efficient operating point of this plant requires a temperature differential of approximately 15°C. Given that a variety of chillers, as well as direct (space and hot water) heating demand, will be powered by the network, the supply and return water temperatures could, in practice vary somewhat from the scenario chosen for this Master Plan. However, precinct scale decentralised networks can operate at a much greater temperature differential (delta T) to minimise the diameter of the thermal energy network pipes. A compromise could be to operate the decentralised energy network with a greater delta T, say 60°C, and supply heat fired absorption chillers via a decentralised heat exchanger with a return temperature of 83°C.
The ideaL soLuTion For The CiTy
TabLe 1: CiTy oF sydney deCenTraLised energy neTWorK ModeLLed ConFiguraTion
TrigeneraTion sysTeM ConFiguraTion VariabLe
ENGINE TYPE RECIPROCATING
Total installed capacity 360 MWeEngine fuel to electricity generation efficiency (HHV) at full load 42 %
Engine operating hours 7 am–10 pm
THERMAL DISTRIBUTION NETWORK HOT WATER
Sent out water temperature 98°C
Return water temperature 83°C
Dispatched thermal energy 4,600 TJ/yr
Estimated distribution network losses 250 TJ/yr
Estimated distribution network recirculation pumping energy 135,000 MWe/yr
Thermal network maximum flow velocity 2.0 m/s
Arterial mains maximum pipe diameter 0.50 m
Estimated pipe network length (supply+return) 40 km
RECIPROCATINGTURBINE
HIGH TEMPERATURE HOT WATER DISTRIBUTION LOW TEMPERATURE HOT WATER DISTRIBUTION
0
0.2m
0.4m
0.6m
0.8m
1.0m
1.2m
1.4m
100 200 300 400 500 600
ENGINE SIZE (MWe)
GHG
SAVI
NGS
(TCO
2–E/
YEAR
)
100 200 300 400 500 600
ENGINE SIZE (MWe)
0
0.2m
0.4m
0.6m
0.8m
1.0m
1.2m
1.4m
GHG
SAVI
NGS
(TCO
2–E/
YEAR
)
RECIPROCATINGTURBINE
TherMaL sTorage For peak and shoulder only operation of the cogeneration plant, the overnight thermal demands of the decentralised energy network could be serviced by the provision of thermal storage rather than reverting to operation of local electric chillers and boost gas boilers. It is estimated that this would require approximately 2.5 TJ (or 700 MWh) of thermal storage. If embodied in hot water, this storage would equate to a volume of approximately 40 ML—similar to the volume of a 30 metre deep pool of Olympic width and breadth. A volume of this scale could be distributed across several sites, however its provision will not materially affect greenhouse savings because the favoured operational strategy of the trigeneration systems avoids any generation of thermal power in excess to the real–time thermal demand.
gas augMenTaTionTo deliver the decentralised energy network the natural gas network will require augmentation since there is very limited capacity to supply trigeneration sites in the city. This will be required to be developed in two stages—secondary network augmentation for Stage 1 by 2015 and primary network augmentation and pressure reducing station for Stage 2 by 2020 as set out in Chapter 8—Gas Augmentation Feasibility Study.
23City of Sydney | decentralised energy Master Plan—trigeneration
2 Re–THinKing THe URBAn FoRM
4 5
PeRFoRMAnCe
oUTSiDe THe neTWoRK
1 TRigeneRATion
6 enABLing THe MASTeR PLAn
7 CASe STUDieS
8 gAS FeASiBiLiTY STUDY
3 THe DeCenTRALiSeD eneRgY neTWoRK
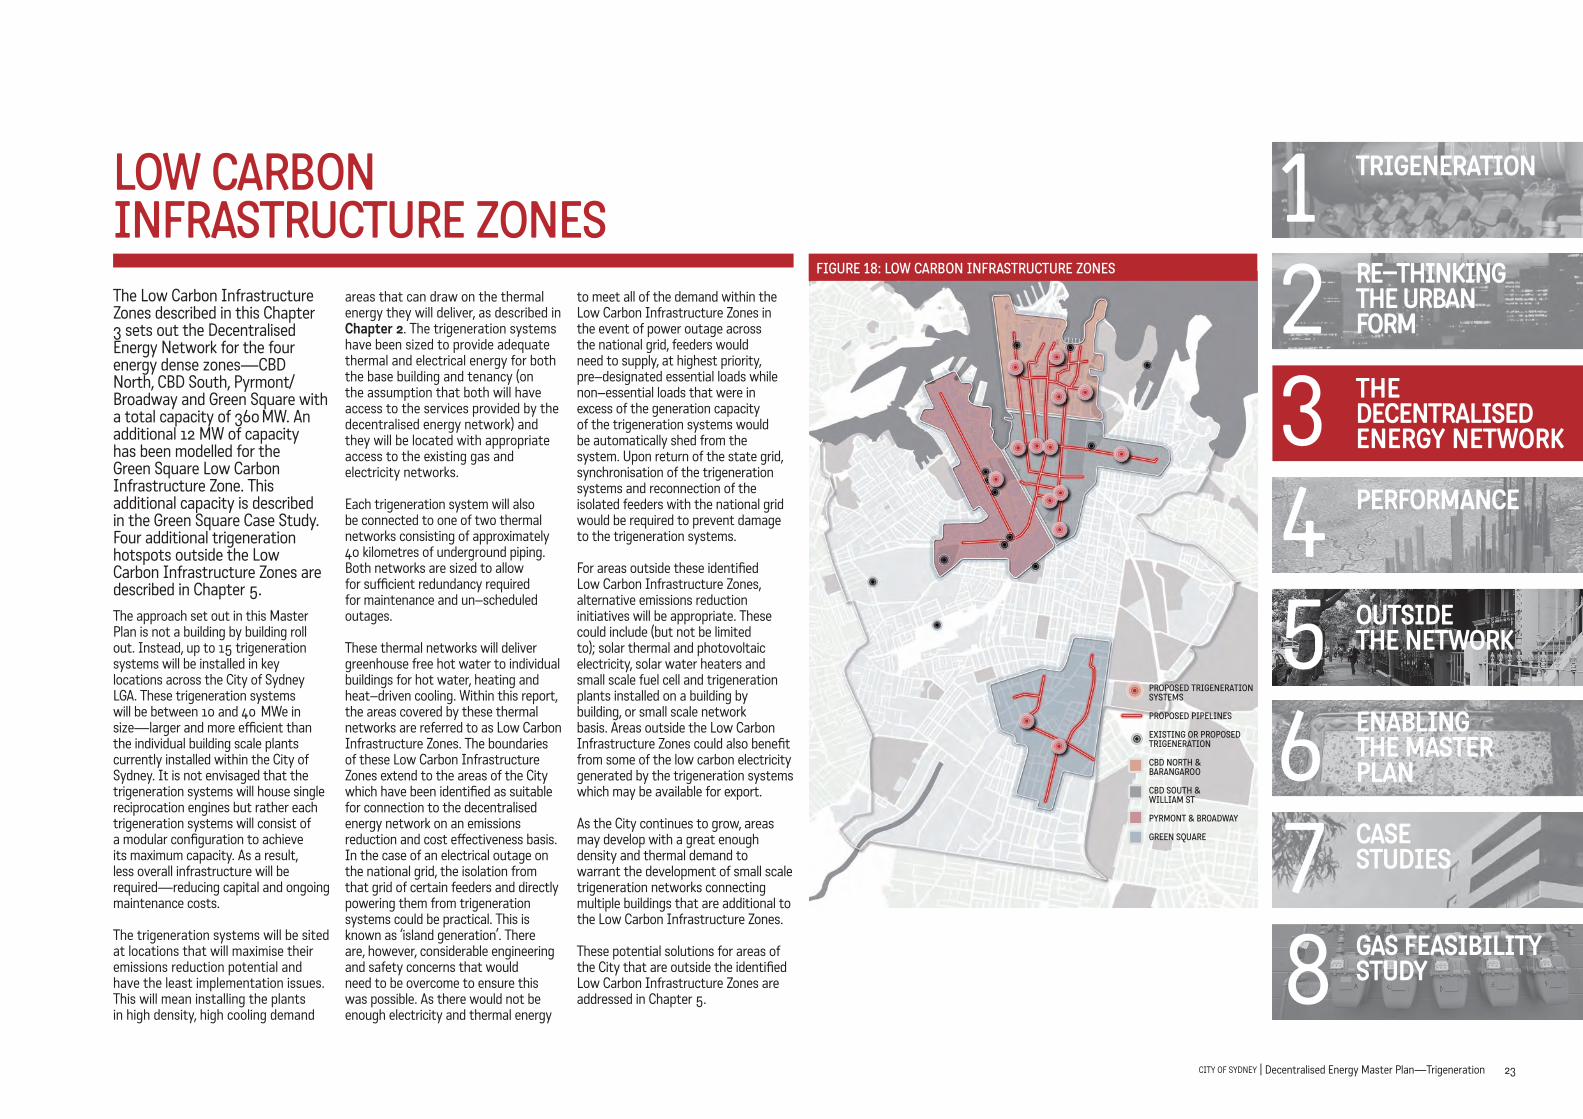
The Low Carbon Infrastructure Zones described in this Chapter 3 sets out the Decentralised Energy Network for the four energy dense zones—CBD North, CBD South, Pyrmont/Broadway and Green Square with a total capacity of 360 MW. An additional 12 MW of capacity has been modelled for the Green Square Low Carbon Infrastructure Zone. This additional capacity is described in the Green Square Case Study. Four additional trigeneration hotspots outside the Low Carbon Infrastructure Zones are described in Chapter 5.The approach set out in this Master Plan is not a building by building roll out. Instead, up to 15 trigeneration systems will be installed in key locations across the City of Sydney LGA. These trigeneration systems will be between 10 and 40 MWe in size—larger and more efficient than the individual building scale plants currently installed within the City of Sydney. It is not envisaged that the trigeneration systems will house single reciprocation engines but rather each trigeneration systems will consist of a modular configuration to achieve its maximum capacity. As a result, less overall infrastructure will be required—reducing capital and ongoing maintenance costs.
The trigeneration systems will be sited at locations that will maximise their emissions reduction potential and have the least implementation issues. This will mean installing the plants in high density, high cooling demand
areas that can draw on the thermal energy they will deliver, as described in Chapter 2. The trigeneration systems have been sized to provide adequate thermal and electrical energy for both the base building and tenancy (on the assumption that both will have access to the services provided by the decentralised energy network) and they will be located with appropriate access to the existing gas and electricity networks.
Each trigeneration system will also be connected to one of two thermal networks consisting of approximately 40 kilometres of underground piping. Both networks are sized to allow for sufficient redundancy required for maintenance and un–scheduled outages.
These thermal networks will deliver greenhouse free hot water to individual buildings for hot water, heating and heat–driven cooling. Within this report, the areas covered by these thermal networks are referred to as Low Carbon Infrastructure Zones. The boundaries of these Low Carbon Infrastructure Zones extend to the areas of the City which have been identified as suitable for connection to the decentralised energy network on an emissions reduction and cost effectiveness basis.In the case of an electrical outage on the national grid, the isolation from that grid of certain feeders and directly powering them from trigeneration systems could be practical. This is known as ‘island generation’. There are, however, considerable engineering and safety concerns that would need to be overcome to ensure this was possible. As there would not be enough electricity and thermal energy
to meet all of the demand within the Low Carbon Infrastructure Zones in the event of power outage across the national grid, feeders would need to supply, at highest priority, pre–designated essential loads while non–essential loads that were in excess of the generation capacity of the trigeneration systems would be automatically shed from the system. Upon return of the state grid, synchronisation of the trigeneration systems and reconnection of the isolated feeders with the national grid would be required to prevent damage to the trigeneration systems.
For areas outside these identified Low Carbon Infrastructure Zones, alternative emissions reduction initiatives will be appropriate. These could include (but not be limited to); solar thermal and photovoltaic electricity, solar water heaters and small scale fuel cell and trigeneration plants installed on a building by building, or small scale network basis. Areas outside the Low Carbon Infrastructure Zones could also benefit from some of the low carbon electricity generated by the trigeneration systems which may be available for export.
As the City continues to grow, areas may develop with a great enough density and thermal demand to warrant the development of small scale trigeneration networks connecting multiple buildings that are additional to the Low Carbon Infrastructure Zones.
These potential solutions for areas of the City that are outside the identified Low Carbon Infrastructure Zones are addressed in Chapter 5.
Figure 18: LoW Carbon inFrasTruCTure Zones
LoW CarboninFrasTruCTure Zones
ProPosed TrigeneraTion sysTeMs
ProPosed PiPeLines
exisTing or ProPosed TrigeneraTion
Cbd norTh & barangaroo
Cbd souTh & WiLLiaM sT
PyrMonT & broadWay
green sQuare

24 City of Sydney | decentralised energy Master Plan—trigeneration
1.
2.
4.
5.
6.
7.
8.
3.
The decentralised energy network will deliver approximately 360 MWe of trigeneration system driven electricity and associated thermal energy to the following locations:— Approximately 130 MWe servicing CBD North and Barangaroo — Approximately 130 MWe servicing CBD South and William Street— Approximately 80 MWe servicing Pyrmont and Broadway— Approximately 20 MWe servicing Green Square
20 MWe
gReen SQUARe
80 MWe
PYRMonT & BRoADWAY
130 MWe
CBD noRTH 98 MWe
& BARAngARoo 32 MWe
130 MWe
CBD SoUTH & WiLLiAM ST
Figure 19: MegaWaTTs oF TrigeneraTion eLeCTriCiTy suPPLy
Figure 20 indicates the expected relationship between greenhouse gas emission reduction, plant utilisation and plant size. Whilst greater plant size can yield a greater greenhouse gas emission reduction, this is achieved at the expense of lower plant utilisation and will therefore impact
the economic viability of the Low Carbon Infrastructure Zones. As indicated earlier, less than 60% plant utilisation is to be avoided. This was the major determining factor in capping the maximum installed generation capacity within each Low Carbon Infrastructure Zone.
CBD NORTH PYRMONT–BROADWAY
GREENHOUSE REDUCTIONPLANT UTILISATION
PLANT SIZE (MWe) PLANT SIZE (MWe)CBD SOUTH & WILLIAM STREET
PLANT SIZE (MWe)
GREEN SQUARE
PLANT SIZE (MWe)
0%
20%
40%
60%
80%
100%
0 20 40 60 80 100 1200%
20%
40%
60%
80%
100%
0 20 40 60 80 100 120 140 160
0%
20%
40%
60%
80%
100%
0 4 8 12 16 20 24 28 320%
20%
40%
60%
80%
100%
0 20 40 60 80 100 120 140 160
Figure 20: MegaWaTTs oF TrigeneraTion eLeCTriCiTy suPPLy

25City of Sydney | decentralised energy Master Plan—trigeneration
2 Re–THinKing THe URBAn FoRM
4 5
PeRFoRMAnCe
oUTSiDe THe neTWoRK
1 TRigeneRATion
6 enABLing THe MASTeR PLAn
7 CASe STUDieS
8 gAS FeASiBiLiTY STUDY
3 THe DeCenTRALiSeD eneRgY neTWoRK
The proposed Low Carbon Infrastructure Zones currently consume approximately 2,500 GWh or 65% of the City’s electricity demand. This electricity is supplied almost entirely by coal–fired electricity. Under a business as usual scenario, this electricity consumption will increase by approximately 356 GWh.
By 2030, over 80% of this electrical demand will be met by a combination of low carbon electricity and carbon free heat generated by the trigeneration system (Table 2). This scenario will:1. Displace 2000 GWh of conventional
coal–fired electricity through the increase in gas consumption of 17,000 TJ. The gas network provider has confirmed there is sufficient natural gas supply available to meet this demand
2. Displace a further 365 GWh of electricity through connection to the thermal network. (Assuming existing electric chillers have an average co-efficient of performance of 3.5).
3. Displace 537 TJ of natural gas that will no longer be required for space heating or hot water.
This is equivalent to approximately 500 MWe of coal–fired electrical capacity. The potential location of these trigeneration systems is provided in Figure 21. Table 2 also shows their proposed size and performance data. The installed capacity for each trigeneration system within the Low Carbon Infrastructure Zones are representative of a mid–growth floor space scenario. Underpinning the analysis that sits behind the Master Plan, sensitivity tests were carried out using a low, high and mid growth scenario that varied the rate of connections to the decentralised energy network.
The deCenTraLised energy neTWorK
Figure 21: LoCaTion oF TrigeneraTion sysTeMs WiThin LoW Carbon inFrasTruCTure Zones, 2030
TabLe 2: LoW Carbon CaPaCiTy 2010–2030Cbd norTh LoW Carbon inFrasTruCTure Zones 2010 2015 2020 2025 2030CONNECTED FLOOR AREA–m2 0 652,000 2,745,000 5,195,000 6,993,000GAS CONSUMPTION–TJ/YR 0 815 2,445 4,891 6,114LOW–CARBON ELECTRICITY GENERATION–GWH/YR 0 96 287 573 717DISPLACED ELECTRICAL THERMAL LOAD–GWH/YR 0 16 58 99 121INSTALLED GENERATION–MWe CBDN 1 0 5 15 20 20
CBDN 2 0 9 22 60 60CBDN 3 0 0 5 10 20CBDN 4 0 3 10 15 30
SUBToTAL 0 17 52 105 130
Cbd souTh LoW Carbon inFrasTruCTure Zones 2010 2015 2020 2025 2030CONNECTED FLOOR AREA–m2 0 694,000 2,852,000 5,373,000 7,200,000GAS CONSUMPTION– TJ/YR 0 815 2,445 4,891 6,114LOW–CARBON ELECTRICITY GENERATION–GWH/YR 0 96 287 573 717DISPLACED ELECTRICAL THERMAL LOAD–GWH/YR 0 17 61 104 127INSTALLED GENERATION–MWe CBDS 1 0 6 22 35 50
CBDS 2 0 5 10 20 20CBDS 3 0 0 0 20 30CBDS 4 0 6 10 10 10CBDS 5 0 0 10 20 20
SUBToTAL 0 17 52 105 130
PyrMonT–broadWay LoW Carbon inFrasTruCTure Zones 2010 2015 2020 2025 2030
CONNECTED FLOOR AREA–m2 0 393,000 1,613,000 3,038,000 4,071,000GAS CONSUMPTION–TJ/YR 0 408 1,630 2,853 3,668LOW–CARBON ELECTRICITY GENERATION–GWH/YR 0 48 191 334 430DISPLACED ELECTRICAL THERMAL LOAD–GWH/YR 0 11 42 71 89INSTALLED GENERATION–MWe PB 1 0 4 10 20 20
PB 2 0 5 5 10 20PB 3 0 0 10 20 30PB 4 0 0 10 10 10
SUBToTAL 0 9 35 60 80
green sQuare LoW Carbon inFrasTruCTure Zones 2010 2015 2020 2025 2030
CONNECTED FLOOR AREA–m2 0 214,000 1,144,000 1,564,000 1,768,000GAS CONSUMPTION–TJ/YR 0 193 772 965 965LOW–CARBON ELECTRICITY GENERATION–GWH/YR 0 22 88 110 110DISPLACED ELECTRICAL THERMAL LOAD–GWH/YR 0 4 21 27 28INSTALLED GENERATION–MWe GS 1 0 0 4 4 4
GS 2 0 4 12 16 16SUBToTAL 0 4 16 20 20
ToTaL LoW Carbon Zone insTaLLed CaPaCiTy–MWe 0 47 155 290 360
65% OF CoMMeRCiAL FLooR SPACe
50% OF ReTAiL FLooR SPACe
30% OF ReSiDenTiAL FLooR SPACe
WILL BE CONNECTED TO A LOW CARBON INFRASTRUCTURE ZONE BY 2030

26 City of Sydney | decentralised energy Master Plan—trigeneration
4. PeRFoRMAnCe

27City of Sydney | decentralised energy Master Plan—trigeneration
THe DeCenTRALiSeD eneRgY neTWoRK
2 Re–THinKing THe URBAn FoRM
5 oUTSiDe THe neTWoRK
1 TRigeneRATion
6 enABLing THe MASTeR PLAn
7 CASe STUDieS
8 gAS FeASiBiLiTY STUDY
34 PeRFoRMAnCe
The trigeneration system capacity increases to 410 MWe taking account of the increased trigeneration capacity at Green Square and the hotspot decentralised energy networks outside of the Low Carbon Infrastructure Zones.
A further 67 MW of capacity has been identified across residential dwellings within the City of Sydney that could be met by small scale fuel cell systems. This would bring total generation capacity to 477 MW. These additional capacities are examined in detail in Chapter 5.
This chapter also outlines the performance of alternate configurations which were considered during the modelling and assessment process. These alternate configurations have been included to show the full range of possible performance scenarios that might be achieved if the Master Plan is implemented.
This chapter describes the measured performance2 of the decentralised energy network, as described in Chapter 3 measured against three key criteria:
1. gReenHoUSe gAS eMiSSion ReDUCTionS
2. FinAnCiAL AnD eConoMiC ViABiLiTY
3. AiR QUALiTY iMPLiCATionS
The performance results for each criteria are outlined in this chapter. The analysis is based on the ideal trigeneration system configuration described in Chapter 2:• Engine type: Reciprocating engines,
totalling approximately 360 MWe• Thermal distribution network: low
temperature (approximately 98oC) hot water distribution
• Operating Strategy: operation during primary business hours; 7am–10pm under a mid–growth scenario Note that by 2030 the operating strategy may be 24 hours if off-peak electricity costs continue to increase making a 24 hour operation more financially viable.
The main purpose of this Master Plan is to determine whether the decen-tralised energy network can deliver significant greenhouse gas reduc-tions to the City of Sydney, as pro-posed by Sustainable Sydney 2030. By 2030, greenhouse gas emissions across the City of Sydney LGA are expected to be approximately 6.5 million tonnes of which station-ary energy emissions contribute approximately 5.5 million tonnes.
A decentralised energy network, as described in this Master Plan, can reduce the City of Sydney’s greenhouse gas emissions by 1.1 million tonnes a year. This represents an approximately 18% reduction by 2030.
Emission reductions across the City could be as high as 1.7 million tonnes, a 26% reduction in total greenhouse gas emissions, using an alternate trigeneration system configuration; with the key difference being the hours of operation (Table 3). However, this difference may affect the financial viability of the network.
Within the Low Carbon Infrastructure Zones, emissions reductions will be approximately 39% and could be as high as 56%.
In addition to displacing traditional grid electricity and electrically driven heating and cooling, additional reductions in greenhouse gas emissions may be achieved through avoided
leakage of refrigerant cooling as electrically driven air conditioners are replaced with heat driven cooling units. Based on industry data, refrigerant losses generate approximately 4kg/yr of greenhouse emissions per square metre of commercial floor space. Given the floor area coverage of the Low Carbon Infrastructure Zones, it is estimated that a halving of conventional electric chillers could return an annual reduction of greenhouse gas emissions from refrigerant use within the Low Carbon Infrastructure Zones of approximately 40,000 tonnes (CO2–e)/yr. This equates to an additional 2.5% to 3.5% reduction on top of the 1.1 to 1.7 Mt (CO2)/yr greenhouse gas emission saving delivered directly by the decentralised energy network.
Water consumption is an important consideration for trigeneration. Heat rejection from conventional space conditioning within the Low Carbon Infrastructure Zones is estimated to currently consume approximately 3.8 GL of water per year. Greater levels of heat rejection will be required with the introduction of electricity generation plant into the city together with the substitution of heat–driven cooling for electric cooling. If conventional cooling towers are used for this task, then it is estimated that the trigeneration systems servicing the city’s Low Carbon Infrastructure Zones will consume an additional 1.6 to 2.6 GL/yr of water depending on the daily operational mode of the plant
(see Table 3). This is equivalent to approximately one fifth of the water needed to deliver the same amount of energy through conventional coal fired power stations. It is estimated that alternative heat rejection techniques such as evaporative fluid coolers could further reduce the marginal demand to between 1 and 1.5 GL per year. Further savings may be realised by drawing on recycled water delivered from the trigeneration systems network and/or the City’s proposed city–wide recycled water network for a portion of the total required heat exchange (estimated at roughly 10,000 TJ/yr, or approximately 3,000 GWh/year).
A recent report by Hyder Consulting, that was commissioned by the City of Sydney, reported that approximately 87 tonnes of coal ash from coal fired electricity could be avoided for every GWh of local electricity that is generated or avoided as a result of the proposed decenatralised energy network. Based on figures in Table 3, this would reduce coal ash waste by approximately 343,000 to 470,000 tonnes per year.
Key PerForManCe resuLTs For Mid groWTh sCenario 7aM–10PM 24 hoursLow Carbon Infrastructure Zones connected floor area 20,032,000 m2 20,032,000 m2
Trigeneration system installed capacity 360 MWe 360 MWeTrigeneration system fuel gas consumption 17,000 TJ/yr 27,000 TJ/yrLow carbon electricity generation 2,000 GWh/yr 3,000 GWh/yrDisplaced electrical thermal load 365 GWh/yr 375 GWh/yrContribution of total LGA electricity consumption 46% 69%Fuel use efficiency 63% 58%Estimated current water use for heat rejection 3.8 GL/yr 3.8 GL/yrExpected additional water use for heat rejection 1.6 GL/yr 2.6 GL/yrGHG savings 1.1 MT (CO2–e)/yr 1.7 MT (CO2–e)/yrCumulative emission savings 2010–2030 10.6 MT (CO2–e)/yr 15.3 MT (CO2–e)/yrGHG reduction for connected buildings 39% 56%GHG reduction across City of Sydney LGA 18% 26%
TabLe 3: Key PerForManCe resuLTs For Mid–groWTh sCenario
greenhouse gas eMissions, WaTer ConsuMPTion and WasTe aVoidanCe
PerForManCe
2. The greenhouse gas emissions savings shown in this report are modelled estimates of scope 1, 2 and 3 emissions. Emissions calculations are based on best available data from the National Greenhouse Accounts Factors Workbook and incorporate the Federal Government’s 20% renewable energy target, representative efficiencies for engine and associated plant together with representative hourly energy consumption and climate data.
28 City of Sydney | decentralised energy Master Plan—trigeneration
1.
2.
3.
5.
6.
7.
8.
4.
2010 2015 20252020 2030
Installed GenerationLow 25 MWeMid 45 MWeHigh 80 MWe
Installed GenerationLow 80 MWeMid 150 MWeHigh 220 MWe
Green Square Urban Renewal begins 2012
Green Square Town CentreCompleted
Installed GenerationLow 180 MWeMid 270 MWeHigh 360 MWe (fully implemented)
Installed GenerationLow 360 MWeMid 360 MWeHigh 360 MWe
0.5m
1.0m
1.5m
2.0m
2.5m
3.0m
HIGH GROWTH SCENARIO WITH 24 HOUR OPERATION
MID GROWTH SCENARIO WITH 7AM–10PM OPERATION
LOW GROWTH SCENARIO WITH 7AM–10PM OPERATION
BUSINESS AS USUAL EMISSIONS
TONN
ES C
O2–e
Figure 22: CuMuLaTiVe greenhouse saVings To 2030
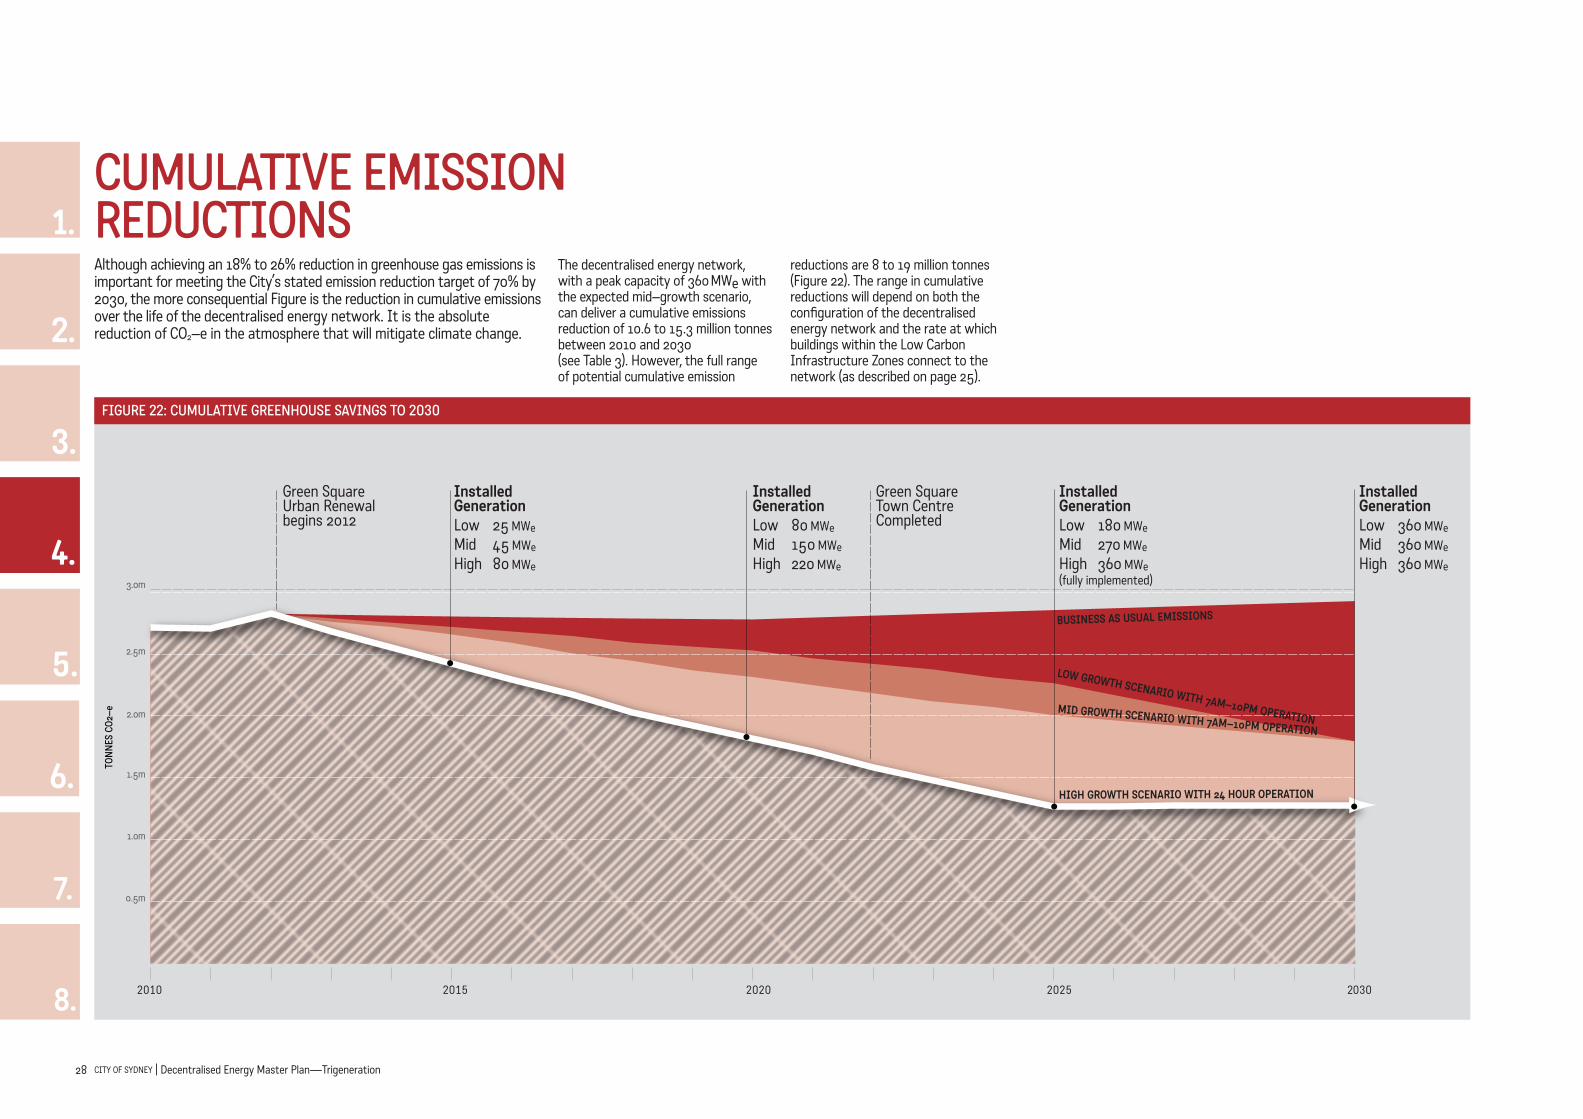
Although achieving an 18% to 26% reduction in greenhouse gas emissions is important for meeting the City’s stated emission reduction target of 70% by 2030, the more consequential Figure is the reduction in cumulative emissions over the life of the decentralised energy network. It is the absolute reduction of CO2–e in the atmosphere that will mitigate climate change.
CuMuLaTiVe eMission reduCTions
The decentralised energy network, with a peak capacity of 360 MWe with the expected mid–growth scenario, can deliver a cumulative emissions reduction of 10.6 to 15.3 million tonnes between 2010 and 2030 (see Table 3). However, the full range of potential cumulative emission
reductions are 8 to 19 million tonnes (Figure 22). The range in cumulative reductions will depend on both the configuration of the decentralised energy network and the rate at which buildings within the Low Carbon Infrastructure Zones connect to the network (as described on page 25).
29City of Sydney | decentralised energy Master Plan—trigeneration
3 THe DeCenTRALiSeD eneRgY neTWoRK
2 Re–THinKing THe URBAn FoRM
5 oUTSiDe THe neTWoRK
1 TRigeneRATion
6 enABLing THe MASTeR PLAn
7 CASe STUDieS
8 gAS FeASiBiLiTY STUDY
4 PeRFoRMAnCe
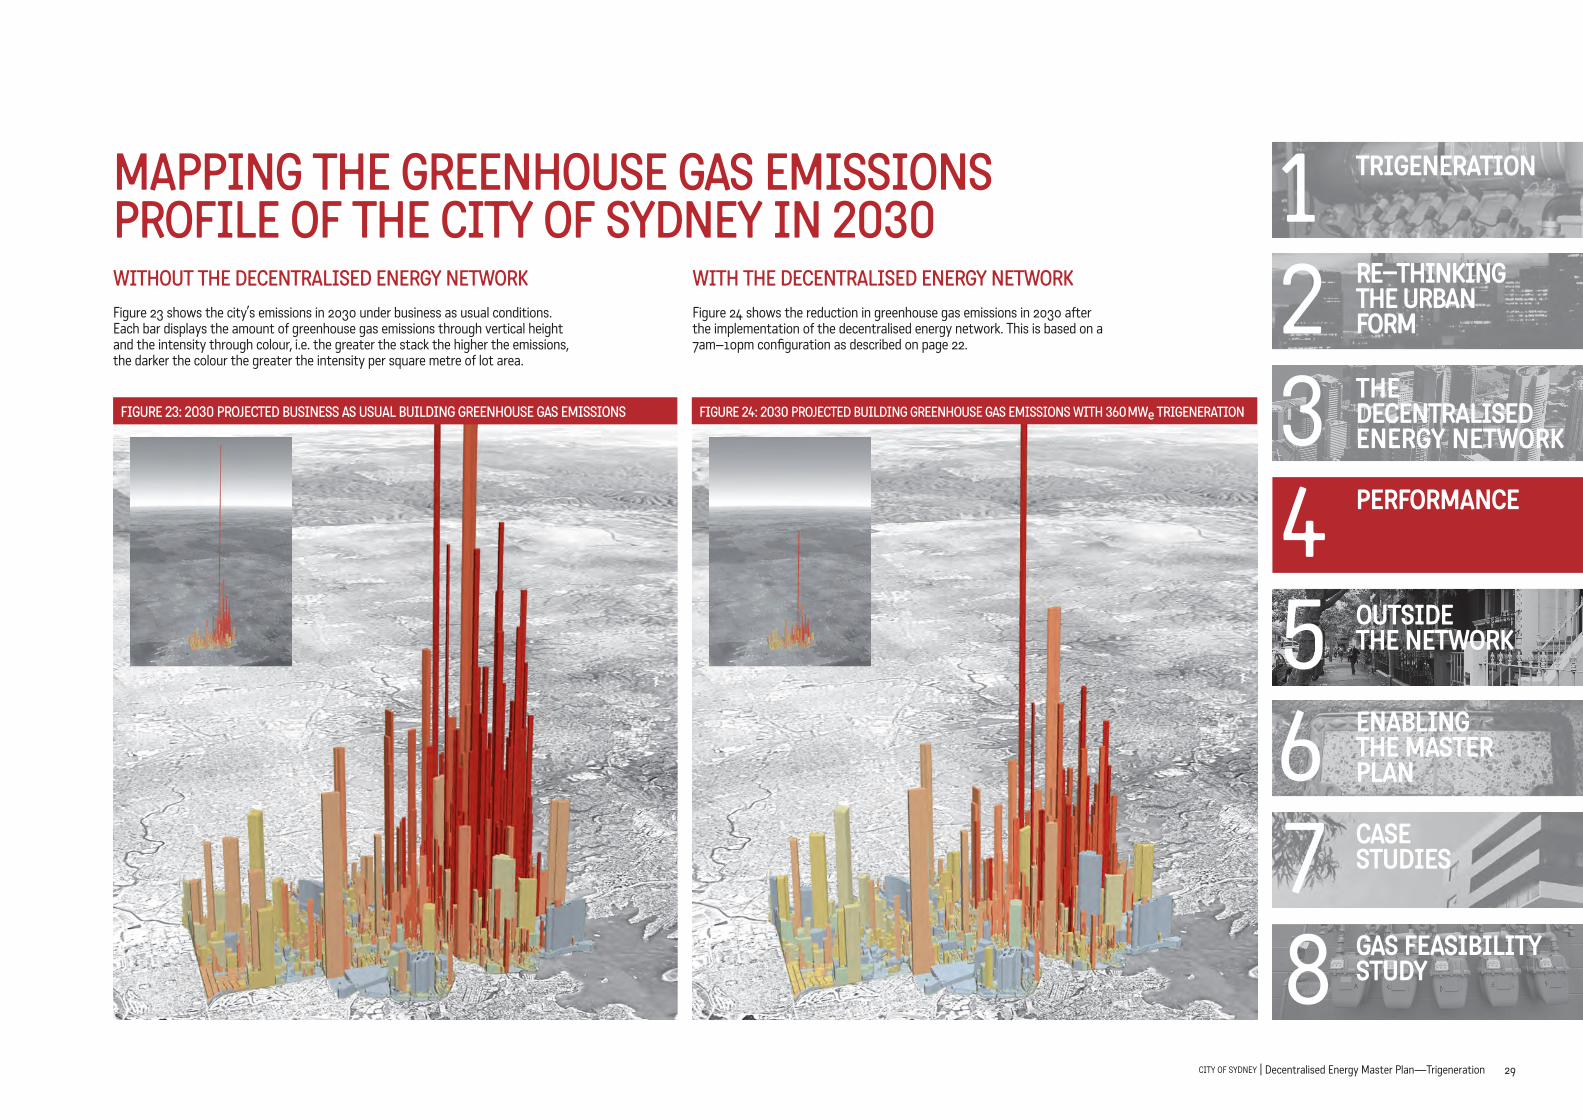
Figure 24: 2030 ProJeCTed buiLding greenhouse gas eMissions WiTh 360 MWe TrigeneraTionFigure 23: 2030 ProJeCTed business as usuaL buiLding greenhouse gas eMissions
WiThouT The deCenTraLised energy neTWorKFigure 23 shows the city’s emissions in 2030 under business as usual conditions. Each bar displays the amount of greenhouse gas emissions through vertical height and the intensity through colour, i.e. the greater the stack the higher the emissions, the darker the colour the greater the intensity per square metre of lot area.
WiTh The deCenTraLised energy neTWorKFigure 24 shows the reduction in greenhouse gas emissions in 2030 after the implementation of the decentralised energy network. This is based on a 7am–10pm configuration as described on page 22.
MaPPing The greenhouse gas eMissions ProFiLe oF The CiTy oF sydney in 2030

30 City of Sydney | decentralised energy Master Plan—trigeneration
1.
2.
3.
5.
6.
7.
8.
4.
548 GWh
276 GWh 994 TJ
345 GWh 1,242 TJ
4,642 GWh 16,710 TJ
325 GWh 1,170 TJ 146 GWh
525 TJ
134 GWh 482 TJ
53 GWh 190 TJ
291 GWh 1,048 TJ
1,806 GWh 6,503 TJ
179 GWh 645 TJ
425 GWh 1,530TJ
1,859 GWh 6,693 TJ
629 GWh 2,264 TJ
802 GWh
2,888 TJ
1,230 GWh 4,429 TJ
537 TJ149 GWh
2,235GWh
379 GWh
7,668 GWh
WITHIN CITY OF SYDNEY
Natural gas fired trigeneration, grid electricity and trigeneration waste heat thermal energy and boiler natural gas thermal energy
NATURAL GAS
GRID ELECTRICITY
A
PUMPING ENERGY135 GWh
2,683 GWh9,657 TJ
137 GWh
GAS BOILERCoP: 0.8
53,000 tCO2-e
GASGAS
SH HW
ELEC
SC
GAS
SH HW
ELEC
SC
BUILDINGS DELIVERED RESIDENTIAL
NON RESIDENTIAL
TRIGENERATION SYSTEM360 MWe/HHV=42.5%
LOW-GRADE HEAT6,023 TJ 1,673 GWh
NOx 220 tonnes
HEAT DRIVEN CHILLER
CoP: 0.78
ELECTRIC CHILLER
CoP: 8.98
SPACE HEATING & HOT WATER
REFRIGERANTLEAKAGE
EMISSIONS
ELECTRICITY
SPACE COOLING
GHG1,847,000
tCO2-e
GHG1,847,000
tCO2-e
19,122 TJ
5,312 GWhDISTRIBUTION HEAT LOSS
210 TJ 58 GWh
Figure 25
existing Energy SupplyThis diagram shows how electricity and gas is currently used within the areas proposed as Low Carbon Infrastructure Zones.
proposeD Decentralised Energy Network This diagram shows how energy use changes with the implementation of the decentralised energy network.
Figure 25 shows how the decentralised energy network will alter the way the city receives and uses energy and in turn reduce total greenhouse gas emissions. Each diagram represents energy use and emissions in 2030. The Proposed and Future diagrams are based on a 7am–10pm operating scenario.
Changing The Way The CiTy reCeiVes and uses energy

31City of Sydney | decentralised energy Master Plan—trigeneration
3 THe DeCenTRALiSeD eneRgY neTWoRK
2 Re–THinKing THe URBAn FoRM
5 oUTSiDe THe neTWoRK
1 TRigeneRATion
6 enABLing THe MASTeR PLAn
7 CASe STUDieS
8 gAS FeASiBiLiTY STUDY
4 PeRFoRMAnCe
NOx 220 tonnes
2,235GWh
WITHIN CITY OF SYDNEY
Renewable gas fired trigeneration, renewable electricity and trigeneration waste thermal energy and boiler renewable gas thermal energyD
548 GWh
RENEWABLE ELECTRICITY
RENEWABLE GAS
19,122 TJ
146 GWh 525 TJ
134 GWh 482 TJ
53 GWh 190 TJ
291 GWh 1,048 TJ
1,806 GWh 6,503 TJ
179 GWh 645 TJ
379 GWh
7,668 GWh
345 GWh 1,242 TJ
4,642 GWh 16,710 TJ5,312 GWh
149 GWh
REFRIGERANTLEAKAGE
EMISSIONS53,000 tCO2-e
137 GWh
GASGAS
SH HW
ELEC
SC
GAS
SH HW
ELEC
SC
BUILDINGS DELIVERED RESIDENTIAL
NON RESIDENTIAL
9,657 TJSPACE HEATING & HOT WATER
ELECTRICITY
SPACE COOLING
GAS BOILERCoP: 0.8
TRIGENERATION SYSTEM360 MWe/HHV=42.5%
PUMPING ENERGY135 GWh
ELECTRIC CHILLER
CoP: 8.98
HEAT DRIVEN CHILLER
CoP: 0.78
GHG130,000
tCO2-e
GHG130,000
tCO2-e802 GWh
2,888 TJ
325 GWh 1,170 TJ
425 GWh 1,530TJ
1,859 GWh 6,693 TJ
537 TJ
276 GWh 994 TJ
629 GWh 2,264 TJ
1,230 GWh 4,429 TJ
DISTRIBUTION HEAT LOSS 210 TJ 58 GWh
LOW-GRADE HEAT6,023 TJ 1,673 GWh
Figure 25
future Decentralised Energy Network with Renewable Electricity and Renewable GasThis diagram indicates the additional reductions in greenhouse gas emissions that could be achieved through the use of renewable gas and renewable electricity
TRIGENERATION SYSTEMS WILL PROVIDE THE CITY WITH A TRANSFORMATIVE ENERGY SOLUTION, RAISING THE END–USE EFFICIENCY OF THE FUEL STOCK FROM APPROxIMATELY 35% TO 60%

32 City of Sydney | decentralised energy Master Plan—trigeneration
1.
2.
3.
5.
6.
7.
8.
4.
FinanCiaL and eConoMiC ViabiLiTy
The cost of implementing the decentralised energy network was assessed using two distinct methodologies that cater to both financial and economic perspectives. Firstly, the financial cash flow of the project was analysed to establish its commercial viability. Secondly, the economic outcome of the project was assessed using a marginal social cost of abatement approach.
The economic and financial analysis included in this chapter is for the four Low Carbon Infrastructure Zones. Some additional potential trigeneration capacity has been identified in Chapter Five. If this capacity was realised, it would be in addition to the financial results outlined here
FinanCiaL anaLysisTo determine the commercial feasibility of the decentralised energy network, detailed financial analysis was undertaken to estimate the total cost to build and operate the decentralised energy network according to the specifications set out in the Master Plan. These specifications involve the trigeneration systems operating between the hours of 7 am and 10 pm and running at maximum power, with installation of the decentralised energy network beginning in 2012.
The financial analysis evaluated both the estimated total capital cost and operating cost of the decentralised energy network from 2010 to 2030. These costs and their composition are shown in Figures 26 and 27.
Across the period 2010 to 2030, the estimated total capital cost of the decentralised energy network equates to $950 million ($440 million in 2010 dollars when discounted using a 7% nominal rate). This is comprised of $630 million of trigeneration systems capital expenditure, $180 million of trigeneration systems overhaul expenditure, and $140 million of thermal distribution network capital expenditure. For the period 2010 to 2030, the estimated total operating cost of the decentralised energy network equates to $3,920million ($1,460 million when discounted).
Figure 26: ToTaL CaPiTaL CosT oF The deCenTraLised energy neTWorK
The total capital cost of the decentralised energy network is evaluated from 2010 to 2030. The trigeneration system capital cost includes the trigeneration system and heat recovery capital cost, the cost to connect the trigeneration system to the existing electricity network, and the NOx control costs.
Figure x: Total capital cost of the cogeneration plant and thermal distribution network. The cogeneration plant upfront capital cost includes the cogeneration plant and heat recovery capital cost, the cogeneration plant connection cost to the existing electricity network, and the upfront NOx control costs.
THERMAL DISTRIBUTION NETWORK CAPITAL COSTTRIGENERATION SYSTEM OVERHAUL COSTTRIGENERATION SYSTEM CAPITAL COST
0100
200
300
400
500
600
700
800
900
1,000
UNDISCOUNTED TOTAL COST 2010–2030
DISCOUNTED TOTAL COST 2010–2030
$ M
ILLI
ON
Figure 27: ToTaL oPeraTing CosT oF The deCenTraLised energy neTWorK
The total operating cost of the decentralised energy network is evaluated from 2010 to 2030. The trigeneration system plant maintenance cost includes regular maintenance costs and ongoing NOx control costs.
$ M
ILLI
ON
0
500
1,000
1,500
2,000
2,500
3,000
3,500
4,000
4,500
THERMAL DISTRIBUTION NETWORK MAINTENANCE COSTTRIGENERATION SYSTEM OVERHAUL COSTTRIGENERATION SYSTEM CAPITAL COST
DISCOUNTED TOTAL COST2010–2030
UNDISCOUNTED TOTAL COST2010–2030
This is comprised of $3,090 million of expenditure on gas input for the trigeneration systems, $700 million of trigeneration systems maintenance expenditure, and $130 million of thermal distribution network maintenance expenditure.
The financial viability of the Master Plan was investigated through the analysis of a potential operator’s cash flow, where the operator acts as a retailer for trigenerated electricity, grid electricity, and thermal energy demand for connected customers in the City of Sydney LGA. The retail model chosen for the financial analysis used a scenario in which the operator sells direct to customers all trigenerated and grid electricity at a single rate, and does not sell outside of this market. In the analysis, forward electricity and gas prices included an estimated carbon price. The capital and operating cost of both the trigeneration systems and thermal distribution network were included in the operator’s cash flow, along with a capital injection for these capital components. The land required by the trigeneration systems was assumed to be provided at zero cost in the financial model.
The commercial performance of the Master Plan is commensurate with a sound financial return for the trigeneration systems operator. A capital injection, totalling $190 million over 2010 to 2030 ($100 million when discounted), was included to support the commercial attractiveness of the project. It is acknowledged that the financing for this capital injection could come from a number of potential sources or mechanisms. The results of the financial analysis found that when a partial capital injection is provided on capital, a single price received for retailed grid and trigenerated electricity would be a suitable option in order for the project to achieve an acceptable rate of return of between 10% and 20%. This single price for retailed grid and trigenerated electricity sits in–between the business as usual grid price and an adjusted price that factors in the lower emissions intensity of trigenerated electricity according to the value of GreenPower.
Thermal energy is priced such that it is cost–effective for customers to purchase and transform the generated heat into cooling, in comparison to standard cooling systems being powered by GreenPower. Thermal energy used directly for heating is also cost–effective in comparison to customers utilising and powering standard heating systems.

33City of Sydney | decentralised energy Master Plan—trigeneration
3 THe DeCenTRALiSeD eneRgY neTWoRK
2 Re–THinKing THe URBAn FoRM
5 oUTSiDe THe neTWoRK
1 TRigeneRATion
6 enABLing THe MASTeR PLAn
7 CASe STUDieS
8 gAS FeASiBiLiTY STUDY
4 PeRFoRMAnCe
MarginaL soCiaL CosT oF abaTeMenTCost of abatement metrics provide a measurement of the social cost of a project per tonne of greenhouse gas abatement it achieves. The calculation of abatement costs allows different projects to be readily compared in terms of their relative cost–effectiveness per tonne of achieved emissions reduction. Economic efficiency is attained when the efficient level of total emissions reduction is achieved at the lowest overall cost to society.
Kinesis independently engaged The Allen Consulting Group to estimate the cost of abatement for the decentralised energy network, as well as assess the cost of abatement across a variety of emissions reduction strategies. The resulting performance indicator concerned the marginal or incremental cost to society of the modelled scenario versus business as usual. This analysis involved like–for–like comparison of alternative strategies, based on a common set of assumptions and a consistent costing methodology between the alternative strategies.
The cost of abatement approach assumes that a marketplace for trigenerated electricity exists which enables this form of low carbon electricity to be valued according to the emissions content of its
generated electricity. Therefore under the economic approach, unlike in the financial model, all of the trigenerated electricity is assumed to be sold at a price which values its emissions intensity at a scaled GreenPower rate, and grid electricity is sold at its standard rate. The GreenPower rate is scaled according to the emissions intensity of the trigenerated electricity.
The preferred configuration for the decentralised energy network was analysed with the inclusion of a subsidy on a portion of the costs installed in order to support the project’s commercial attractiveness. This subsidy, totalling $160 million over 2010 to 2030 ($80 million when discounted), and smaller than used in the financial analysis, represents a cost to society and is therefore included in the overall marginal social cost. Other inclusions in the marginal social cost were the modelled change in consumers’ total energy costs, the modelled change in consumers’ in–building equipment capital and operating costs, and the value of the land occupied by the trigeneration sytems.
The cost of abatement for the decentralised energy network equates to $20/tCO2–e (2010 dollars, using a nominal discount rate of 7%). This metric takes into account the marginal cost to society of implementing the decentralised energy network, while recognising that the project
is a financially viable and attractive investment.
An assessment of the cost of abatement for alternative emissions abatement strategies was conducted in order to demonstrate the decentralised energy network’s comparative social cost. As Figure 28 demonstrates, the decentralised energy network has a low marginal social cost of abatement compared to other emissions reduction strategies. Its absolute capacity in reducing emissions on a large scale also makes it attractive. The results from both the financial and economic analyses
indicate that the decentralised energy network is an attractive commercial proposition, as well as a cost–effective means of emissions reduction from the perspective of society.
Figure 28: MarginaL soCiaL CosT oF abaTeMenT For a VarieTy oF eMissions reduCTion sTraTegies
2010$/tCO2–e0 20 40 60 80 100
ENERGY EFFICIENCY INCOMMERCIAL PROPERTY
DECENTRALISED ENERGY NETWORK
HIGH CAPACITY WIND
SMALL HYDRO
COMBINED CYCLE GAS TURBINE
COMBINED CYCLE GAS TURBINEWITH CARBON CAPTURE AND STORAGE
SOLAR THERMAL
GREENING HOMES (FULL UPGRADE)
HOUSEHOLD SOLAR PV
BLACK COAL WITH CARBONCAPTURE AND STORAGE
Source: The Allen Consulting Group (2010).
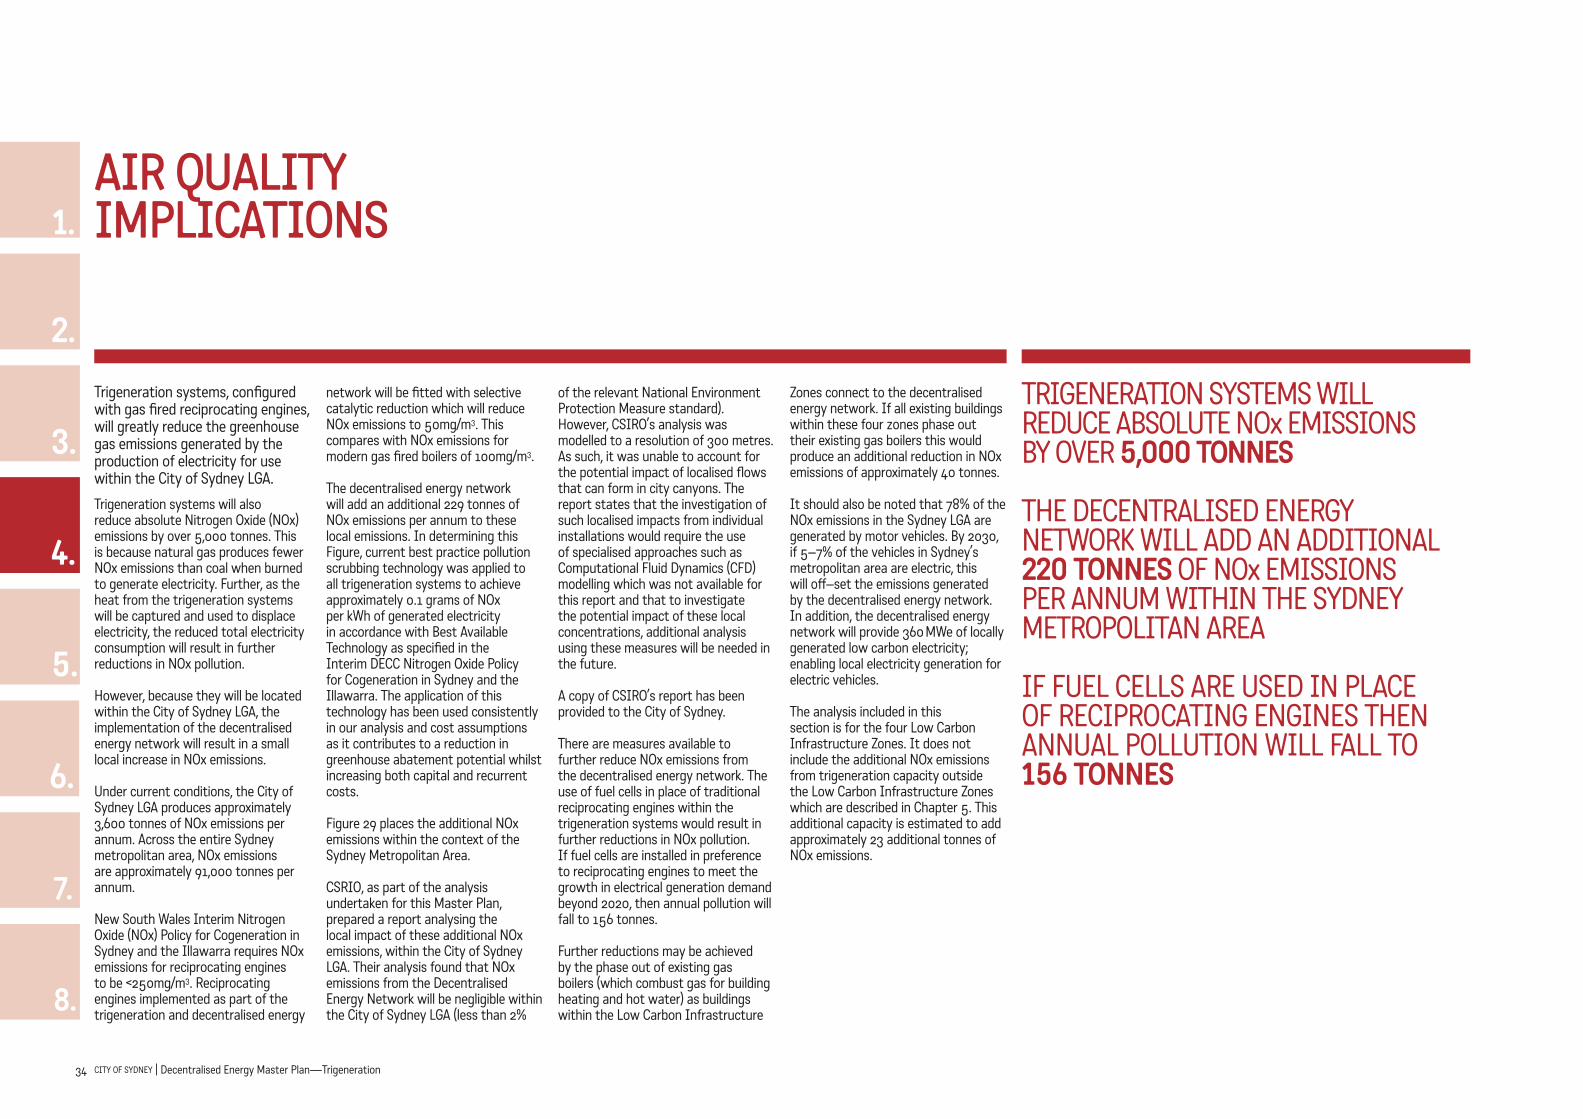
34 City of Sydney | decentralised energy Master Plan—trigeneration
1.
2.
3.
5.
6.
7.
8.
4.
air QuaLiTyiMPLiCaTions
Trigeneration systems, configured with gas fired reciprocating engines, will greatly reduce the greenhouse gas emissions generated by the production of electricity for use within the City of Sydney LGA.
Trigeneration systems will also reduce absolute Nitrogen Oxide (NOx) emissions by over 5,000 tonnes. This is because natural gas produces fewer NOx emissions than coal when burned to generate electricity. Further, as the heat from the trigeneration systems will be captured and used to displace electricity, the reduced total electricity consumption will result in further reductions in NOx pollution.
However, because they will be located within the City of Sydney LGA, the implementation of the decentralised energy network will result in a small local increase in NOx emissions.
Under current conditions, the City of Sydney LGA produces approximately 3,600 tonnes of NOx emissions per annum. Across the entire Sydney metropolitan area, NOx emissions are approximately 91,000 tonnes per annum.
New South Wales Interim Nitrogen Oxide (NOx) Policy for Cogeneration in Sydney and the Illawarra requires NOx emissions for reciprocating engines to be <250mg/m3. Reciprocating engines implemented as part of the trigeneration and decentralised energy
network will be fitted with selective catalytic reduction which will reduce NOx emissions to 50mg/m3. This compares with NOx emissions for modern gas fired boilers of 100mg/m3.
The decentralised energy network will add an additional 229 tonnes of NOx emissions per annum to these local emissions. In determining this Figure, current best practice pollution scrubbing technology was applied to all trigeneration systems to achieve approximately 0.1 grams of NOx per kWh of generated electricity in accordance with Best Available Technology as specified in the Interim DECC Nitrogen Oxide Policy for Cogeneration in Sydney and the Illawarra. The application of this technology has been used consistently in our analysis and cost assumptions as it contributes to a reduction in greenhouse abatement potential whilst increasing both capital and recurrent costs.
Figure 29 places the additional NOx emissions within the context of the Sydney Metropolitan Area.
CSRIO, as part of the analysis undertaken for this Master Plan, prepared a report analysing the local impact of these additional NOx emissions, within the City of Sydney LGA. Their analysis found that NOx emissions from the Decentralised Energy Network will be negligible within the City of Sydney LGA (less than 2%
of the relevant National Environment Protection Measure standard). However, CSIRO’s analysis was modelled to a resolution of 300 metres. As such, it was unable to account for the potential impact of localised flows that can form in city canyons. The report states that the investigation of such localised impacts from individual installations would require the use of specialised approaches such as Computational Fluid Dynamics (CFD) modelling which was not available for this report and that to investigate the potential impact of these local concentrations, additional analysis using these measures will be needed in the future.
A copy of CSIRO’s report has been provided to the City of Sydney.
There are measures available to further reduce NOx emissions from the decentralised energy network. The use of fuel cells in place of traditional reciprocating engines within the trigeneration systems would result in further reductions in NOx pollution. If fuel cells are installed in preference to reciprocating engines to meet the growth in electrical generation demand beyond 2020, then annual pollution will fall to 156 tonnes.
Further reductions may be achieved by the phase out of existing gas boilers (which combust gas for building heating and hot water) as buildings within the Low Carbon Infrastructure
TRIGENERATION SYSTEMS WILL REDUCE ABSOLUTE NOx EMISSIONS BY OVER 5,000 TonneS
THE DECENTRALISED ENERGY NETWORK WILL ADD AN ADDITIONAL 220 TonneS OF NOx EMISSIONS PER ANNUM WITHIN THE SYDNEY METROPOLITAN AREA
IF FUEL CELLS ARE USED IN PLACE OF RECIPROCATING ENGINES THEN ANNUAL POLLUTION WILL FALL TO 156 TonneS
Zones connect to the decentralised energy network. If all existing buildings within these four zones phase out their existing gas boilers this would produce an additional reduction in NOx emissions of approximately 40 tonnes.
It should also be noted that 78% of the NOx emissions in the Sydney LGA are generated by motor vehicles. By 2030, if 5–7% of the vehicles in Sydney’s metropolitan area are electric, this will off–set the emissions generated by the decentralised energy network. In addition, the decentralised energy network will provide 360 MWe of locally generated low carbon electricity; enabling local electricity generation for electric vehicles.
The analysis included in this section is for the four Low Carbon Infrastructure Zones. It does not include the additional NOx emissions from trigeneration capacity outside the Low Carbon Infrastructure Zones which are described in Chapter 5. This additional capacity is estimated to add approximately 23 additional tonnes of NOx emissions.

35City of Sydney | decentralised energy Master Plan—trigeneration
3 THe DeCenTRALiSeD eneRgY neTWoRK
2 Re–THinKing THe URBAn FoRM
5 oUTSiDe THe neTWoRK
1 TRigeneRATion
6 enABLing THe MASTeR PLAn
7 CASe STUDieS
8 gAS FeASiBiLiTY STUDY
4 PeRFoRMAnCe
TYPI
CAL
NOx
EMIS
SION
S –
G/M
WH
0
500
1,000
1,500
2,000
2,500
FUEL CELLGAS TURBINEWITH EXHAUST
GAS SCRTREATMENT
RECIPROCATINGENGINE WITH EXHAUST GAS
SCR TREATMENT
CONVENTIONALNSW COAL–FIRED POWER STATION
EXISTING SYDNEY LOCALGOVERNMENT AREA
6%
94%
0.2%
99.8%
PROPOSED DECENTRALISEDENERGY NETWORK
EXISTING SYDNEY METROPOLITAN AREA
PROPOSED DECENTRALISEDENERGY NETWORK
Figure 30: CoMParaTiVe nox eMissionsFigure 29: nox eMissions WiThin The sydney MeTroPoLiTan area

36 CITY OF SYDNEY | Decentralised Energy Master Plan—Trigeneration
5. oUTSiDe THe neTWoRK
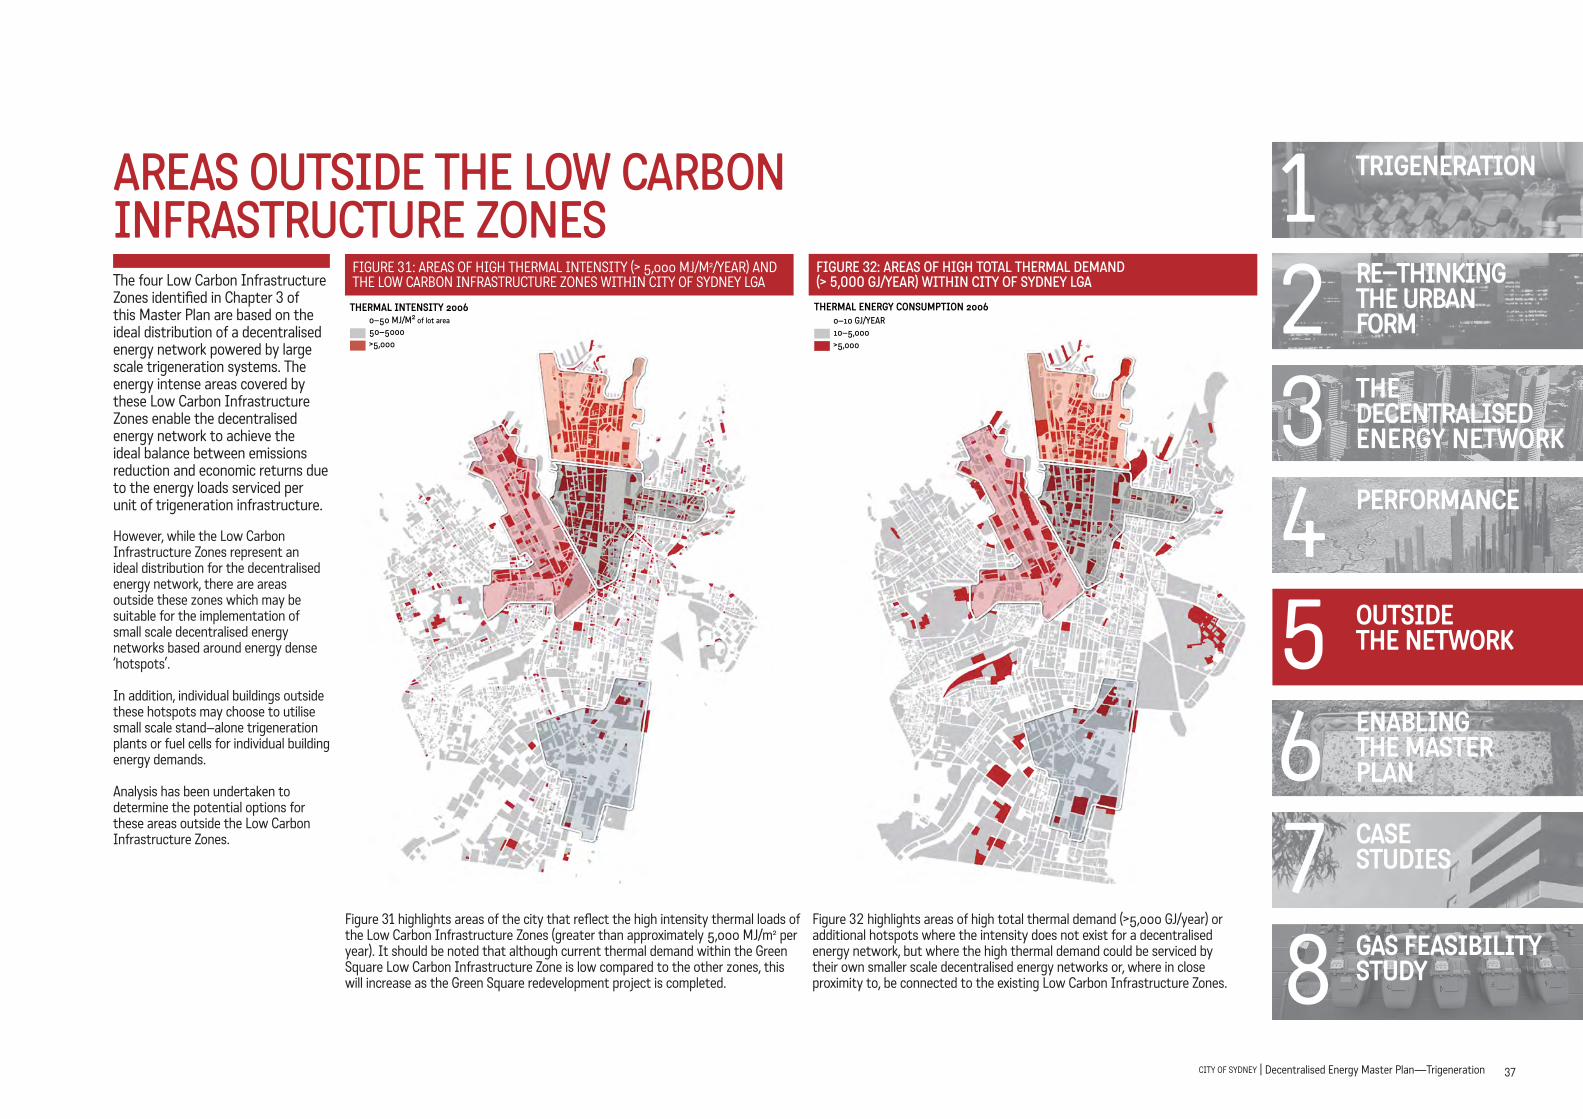
37City of Sydney | decentralised energy Master Plan—trigeneration
3 THe DeCenTRALiSeD eneRgY neTWoRK
2 Re–THinKing THe URBAn FoRM
4 PeRFoRMAnCe
1 TRigeneRATion
6 enABLing THe MASTeR PLAn
7 CASe STUDieS
8 gAS FeASiBiLiTY STUDY
5 oUTSiDe THe neTWoRK
The four Low Carbon Infrastructure Zones identified in Chapter 3 of this Master Plan are based on the ideal distribution of a decentralised energy network powered by large scale trigeneration systems. The energy intense areas covered by these Low Carbon Infrastructure Zones enable the decentralised energy network to achieve the ideal balance between emissions reduction and economic returns due to the energy loads serviced per unit of trigeneration infrastructure.
However, while the Low Carbon Infrastructure Zones represent an ideal distribution for the decentralised energy network, there are areas outside these zones which may be suitable for the implementation of small scale decentralised energy networks based around energy dense ‘hotspots’.
In addition, individual buildings outside these hotspots may choose to utilise small scale stand–alone trigeneration plants or fuel cells for individual building energy demands.
Analysis has been undertaken to determine the potential options for these areas outside the Low Carbon Infrastructure Zones.
THERMAL INTENSITY 20060–50 MJ/M2 of lot area50–5000 >5,000
Figure 31 highlights areas of the city that reflect the high intensity thermal loads of the Low Carbon Infrastructure Zones (greater than approximately 5,000 MJ/m2 per year). It should be noted that although current thermal demand within the Green Square Low Carbon Infrastructure Zone is low compared to the other zones, this will increase as the Green Square redevelopment project is completed.
THERMAL ENERGY CONSUMPTION 20060–10 GJ/YEAR10–5,000>5,000
FIGURE 31: AREAS OF HIGH THERMAL INTENSITY (> 5,000 MJ/M2/YEAR) AND THE LOW CARBON INFRASTRUCTURE ZONES WITHIN CITY OF SYDNEY LGA
Figure 32: areas oF high ToTaL TherMaL deMand (> 5,000 gJ/year) WiThin CiTy oF sydney Lga
areas ouTside The LoW Carbon inFrasTruCTure Zones
Figure 32 highlights areas of high total thermal demand (>5,000 GJ/year) or additional hotspots where the intensity does not exist for a decentralised energy network, but where the high thermal demand could be serviced by their own smaller scale decentralised energy networks or, where in close proximity to, be connected to the existing Low Carbon Infrastructure Zones.

38 City of Sydney | decentralised energy Master Plan—trigeneration
1.
2.
3.
4.
6.
7.
8.
5.
HoTSPoT PoTenTiALBased on areas of high thermal demand, four potential hotspots, shown in Figure 33, have been identified:• Sydney University• Carriage Works and the Australian
Technology Park• Entertainment Quarter• Southern Industrial Zone
These four hotspots will, by 2030, contain approximately 3,000,000 square metres of floor space, a 15% increase on floor space within the Low Carbon Infrastructure Zones.
Building use varies across each hotspot. Sydney University is dominated by educational facilities. The Southern Industrial hotspot is primarily characterised by light industrial (including warehouses, distribution centres and light manufacturing), commercial and retail floor spaces. The Entertainment Quarter includes the Sydney Cricket Ground and Sydney Football Stadium as well as a mix of commercial, retail and residential. Carriage Works and the Australian Technology Park consist mostly of commercial buildings and community or theatre spaces.
In total, these four hotspots could be serviced by 38 MWe of trigeneration capacity—a 10% increase on the Decentralised Energy Network.
Trigeneration, supplying the hot water, space heating and space cooling needs of the floor areas comprising the four hotspots, can achieve an emissions reduction of between 29% and 41% compared to a conventional grid–powered scenario. The variation in emissions reduction across each hotspot is due to the different building uses and hence differing electrical and thermal demands (Table 4).
These greenhouse gas emission reductions are lower than those achieved within the Low Carbon Infrastructure Zones due to the lower density of the built environment within the hotspots which requires relatively longer pipe distances (and therefore higher pipe losses) to service a given amount of floor space.
KEY PERFORMANCE RESULTS FOR HOT SPOTS SYDNEY UNIVERSITY ENTERTAINMENT QUARTER CARRIAGE WORKS + ATP SOUTHERN INDUSTRIAL ZONE TOTAL
7AM–10PM 24 HOURS 7AM–10PM 24 HoURS 7AM–10PM 24 HoURS 7AM–10PM 24 HoURS 7AM–10PM 24 HoURS
CONNECTED FLOOR AREA (M2) 619,000 619,000 277,000 277,000 104,000 104,000 2,048,000 2,048,000 3,048,000 3,048,000
TRIGENERATION SYSTEM INSTALLED CAPACITY ( MW) 12 12 4 4 2 2 20 20 38 38
TRIGENERATION SYSTEM FUEL GAS CONSUMPTION (TJ/YR) 700 700 200 300 100 100 1,500 1,900 2,500 3,000
LOW CARBON ELECTRICITY GENERATION (GWH/YR) 60 70 20 30 10 10 110 180 210 290
DISPLACED ELECTRICAL THERMAL LOAD (GWH/YR) 11 11 4 4 2 2 32 34 49 51
FUEL USE EFFICIENCY 66% 65% 66% 65% 63% 62% 68% 68% 66% 65%
GHG SAVINGS (TONNES CO2/YR) 32,000 36,000 10,000 13,000 5,000 6,000 57,000 95,000 104,000 150,000
GHG REDUCTION FOR CONNECTED BUILDINGS 42% 48% 35% 46% 36% 43% 23% 38% 29% 41%
GHG REDUCTION ACROSS CITY OF SYDNEY LGA 0.5% 0.6% 0.2% 0.2% 0.1% 0.1% 0.9% 1.5% 1.6% 2.4%
TABLE 4: HOTSPOT TRIGENERATION RESULTS
FIGURE 33: TOTAL THERMAL DEMAND WITHIN THE CITY OF SYDNEY LGA SHOWING ADDITIONAL HOTSPOTS

39City of Sydney | decentralised energy Master Plan—trigeneration
3 THe DeCenTRALiSeD eneRgY neTWoRK
2 Re–THinKing THe URBAn FoRM
4 PeRFoRMAnCe
1 TRigeneRATion
6 enABLing THe MASTeR PLAn
7 CASe STUDieS
8 gAS FeASiBiLiTY STUDY
serViCing indiViduaL buiLdingsOutside the Low Carbon Infrastructure Zones and additional hotspots there are a number of suburbs, including Glebe, Newtown, Redfern and Surry Hills which consist primarily of (relatively) low density dwellings, as well as small scale commercial, retail and industrial buildings.
Due to the low intensity of the energy demand within these suburbs, they are unlikely to have access to an extended thermal network and will be remote from the sort of large scale Decentralised Energy Networks that could supply the Low Carbon Infrastructure Zones and additional hotspots. For these buildings outside the Low Carbon Infrastructure Zones and additional hotspot areas, small scale cogeneration systems or fuel cells, servicing individual dwellings, apartment buildings or a local group of residences, could be a viable alternative energy option.
Under this scenario, emissions reductions of between 19% and 45% are possible, depending on whether the stand alone system is a reciprocating engine or a more electrically efficient fuel cell, and whether it is sized to provide thermal energy for hot water only or hot water and space heating.
The greater electrical efficiency of a fuel cell means that there is less heat available per unit of electrical output. The effect of this can be seen in comparing the ‘Hot Water’ only and the ‘Hot Water Heating’ greenhouse savings in Table 5. As the fuel cell output is limited by the electrical demand of the dwelling, the removal of an electric heating system will reduce the electrical output of the system and therefore the heat output, thereby reducing the greenhouse gas emission savings. Allowing the fuel cell to export electricity to the grid will remove this limitation and maximise the greenhouse gas emission savings available from the fuel cell.
adding iT aLL uPThe Decentralised Energy Network will reduce greenhouse gas emissions across the entire City of Sydney LGA by between 18–26%. The additional area hotspots will add an additional 2% emissions reduction. Installing a small scale fuel cell system in all residential dwellings outside the Low Carbon Infrastructure Zones and additional hotspots would achieve a further 2% to 3% emissions reduction.
Achieving all of this installed trigeneration and fuel cell capacity would result in a total emissions reduction of 23% to 31% by 2030 (depending on the decentralised energy network’s hours of operation, Table 6). Further reductions in greenhouse gas refrigerant use through the displacement of electric chillers in the additional hotspot and other areas could achieve a further emissions reduction of approximately 1%.
The emissions reductions which have been reported in this Master Plan have been calculated using a consistent methodology which has been applied throughout the calculations. The final reductions achieved by the deployment of trigeneration systems and fuel cells within the City of Sydney could vary above or below the stated reductions depending on the distribution, timing and extent of future floor space growth within the City.
5 oUTSiDe THe neTWoRK
TABLE 5: SMALL SCALE COGENERATION AND FUEL CELL PERFORMANCE RESULTS
KEY PERFORMANCE RESULTS FOR INDIVIDUAL BUILDINGS reCiProCaTion engine FueL CeLL
HOT WATER
HOT WATER
+HEATING HOT WATER
HOT WATER
+HEATING
CONNECTED FLOOR AREA (M2) 10,009,000 10,009,000 10,009,000 10,009,000
INDIVIDUAL SYSTEMS INSTALLED CAPACITY ( MWE) 28 28 67 67
SYSTEM FUEL GAS CONSUMPTION (TJ/YR) 2700 3500 2700 3300
LOW CARBON ELECTRICITY GENERATION (GWH/YR) 210 210 310 270
GHG SAVINGS (TONNES CO2/YR) 82,000 94,000 177,000 164,000
GHG REDUCTION FOR CONNECTED BUILDINGS 20% 23% 43% 40%
GHG REDUCTION ACROSS CITY OF SYDNEY LGA 1.3% 1.5% 2.8% 2.6%
TABLE 6: POTENTIAL EMISSION REDUCTIONS ACROSS THE CITY OF SYDNEY
KeY PeRFoRMAnCe ReSULTS LoW CARBon ZoneS HoT SPoTS FUeL CeLLS DiSPLACeD ToTAL
7AM–10PM 24 HoURS 7AM–10PM 24 HoURS HoT WATeR ReFRigeRAnTS 7AM–10PM 24 HOURS
CONNECTED FLOOR AREA 21,429,000 21,429,000 3,048,000 3,048,000 10,009,000 — 34,476,000 34,476,000
TRIGENERATION INSTALLED CAPACITY ( MWE) 372 372 38 38 67 — 477 477
TRIGENERATION FUEL GAS CONSUMPTION (TJ/YR) 17,000 27,000 2,500 3,000 2,700 — 22,200 32,700
LOW CARBON ELECTRICITY GENERATED (GWH/YR) 2,050 3,100 210 290 310 — 2,570 3,700
GHG SAVINGS (TONNES CO2/YR) 1,100,000 1,700,000 104,000 150,000 177,000 — 1,381,000 2,027,000
GHG REDUCTION FOR CONNECTED BUILDINGS 39% 56% 29% 41% 43% — — —
GHG REDUCTIONS ACROSS CITY OF SYDNEY LGA 18% 26% 2% 2% 3% 1% 24% 32%

40 City of Sydney | decentralised energy Master Plan—trigeneration
6.
CITY OF SYDNEY | Decentralised Energy Master Plan40
enABLing THe MASTeR PLAn

41City of Sydney | decentralised energy Master Plan—trigeneration
3 THe DeCenTRALiSeD eneRgY neTWoRK
2 Re–THinKing THe URBAn FoRM
4 5
PeRFoRMAnCe
oUTSiDe THe neTWoRK
1 TRigeneRATion
7 CASe STUDieS
8 gAS FeASiBiLiTY STUDY
6 enABLing THe MASTeR PLAn
enabLing The MasTer PLan
ThirTeen enabLing aCTions
reForM basix WiThin LoW Carbon inFrasTruCTure Zones Greenhouse gas compliance targets for all new multi–unit residential construction (6 stories and above) under NSW Building Sustainability Index (BASIx) should be lifted from 20 to a minimum of 30 within any low carbon zone.
BASIx, and its enabling legislation, is already configured to operate with different reduction targets across NSW depending on location and building type. The operating system could easily be configured to identify low carbon zone infrastructure, as it presently does for reticulated recycled water schemes where they exist in NSW.
The decentralised energy network would provide the infrastructure whereby all new residential construction could benefit from greenhouse free thermal energy for hot water or to supplement heating and cooling requirements to achieve effective and low cost BASIx compliance. However, such a target would not preclude building owners from meeting the target through other means such as increased energy efficiency actions.
1. The decentralised energy network outlined in this Master Plan will provide a transformative energy solution to the City of Sydney, significantly reducing greenhouse gas emissions at a cost that is practical and affordable, relative to other solutions. It also offers a future proof solution that is capable of integration with new technologies and fuel stocks which may be available soon, but are outside the current scope of practical implementation.
The responsibility for implementing this Master Plan rests with the City of Sydney, which is ideally placed to deliver on many of the necessary key components of the proposed network.
However, a network such as the one described within this Master Plan cannot be implemented without careful consideration and action on behalf of the business community and the State and Federal Governments working in cooperation with the City of Sydney.
This chapter outlines thirteen enabling actions that would assist the implementation and delivery of the decentralised energy network. These actions have been identified through consultation with key stakeholders in the public and private sector. They are included not as barriers that would prevent implementation but as enablers, to ensure the decentralised energy network delivers its promised performance.
Primarily, this is a chapter about cooperation. There is no single entity in the Government or private sector that can implement a project of this type and scale on its own. Included are actions which would need to be delivered by all sectors of Government as well as private business and industry.
1. reForM basix WiThin LoW Carbon inFrasTruCTure Zones
2. ModiFy The CiTy oF sydney’s deVeLoPMenT ConTroL PLan To reFLeCT The LoW Carbon inFrasTruCTure Zones
3. reCognise The deCenTraLised energy neTWorK in MandaTory disCLosure and nabers
4. inCenTiVise energy eFFiCienCy and LoW Carbon energy
5. sTandardise ConneCTion Fees For gas and eLeCTriCiTy neTWorKs
6 inTroduCe deMand ManageMenT rebaTes
7. MaKe sTaTe and FederaL inFrasTruCTure Funds aVaiLabLe
8. inTroduCe enVironMenTaL uPgrade agreeMenTs For neW deVeLoPMenTs
9. reMoVe The reguLaTory barriers To deCenTraLised energy
10. LoW Carbon Zone reCogniTion sCheMe
11. sTreaMLine sTaTe enVironMenTaL PLanning PoLiCy PLanning aPProVaLs For deCenTraLised energy
12. sTreaMLine easeMenTs and aCCess arangeMenTs For deCenTraLised energy
13. nsW handbooK

42 City of Sydney | decentralised energy Master Plan—trigeneration
1.
2.
3.
4.
5.
7.
8.
6.
ModiFy The CiTy oF sydney’s deVeLoPMenT ConTroL PLan To reFLeCT The LoW Carbon inFrasTruCTure ZonesWithin Low Carbon Infrastructure Zones, the City of Sydney should specify basic plant room and connection requirements for any new construction through future amendments to the comprehensive City Plan DCP. This would ensure that buildings built today are easily able to plug into the low carbon zone infrastructure as it becomes available.
It is recommended that any additional floor space required for absorption chillers and ancillary equipment not be included within the floor space ratio assessment. These equipment and space requirements could include:• connectivity to the network boundary
heat exchanger and any pumps required• absorption chiller and plinth (the plinth
freed up by displacing an electric chiller can be reused)
• chilled water pump(s)• cooling tower capacity for the
absorption chiller• plant room access and ceiling
height of 4m.
This could also apply, and not serve as a disincentive to, other forms of emissions savings technologies or actions such as energy efficiency and renewable energy.
reCognise The deCenTraLised energy neTWorK in MandaTory disCLosure and nabers
Confirm that the decentralised energy network will be recognised under the Federal Government’s mandatory disclosure legislation.
From 1 November 2010, all sellers or lessors of commercial property of 2,000 m2 or more are required to obtain and disclose an up–to–date Building Energy Efficiency Certificate (BEEC). This will include the building’s NABERS rating.
Mandatory disclosure of a building’s energy efficiency performance has the potential to create demand for low emissions buildings by allowing buyers and tenants to compare the relative performance of different buildings. However, mandatory disclosure does not require the emissions of a building to be disclosed.
It could also create an incentive for building owners to connect to the decentralised energy network. In July 2010, NABERS formally released the approved validation protocol regarding the treatment of cogeneration and trigeneration within a NABERS assessment. This ruling supported the use of district and individual trigeneration systems when performing a NABERS assessment of a building
connected to the network. However, the ruling is being reviewed by NABERS.
A basic example of a 35,000 m2 net lettable area building in the Sydney CBD (postcode 2000), occupied 50 hours a week with approximately 2,400 occupants shows how connection to the decentralised energy network can improve a NABERS rating.
Prior to connection to the network, the base–building (public lights, lifts, HVAC, and other ‘common’ systems) consumes 4.2 GWh of electricity per year and 780 GJ of gas for heating.
The building produces 600 MWh of ‘displaceable’ chilled water on–site via electric chillers and 216 MWh of hot water via gas–fired boilers for heating. A building of this type would achieve a NABERS rating of 3.5 stars.
Assuming that connection to the decentralised energy network enables the building to obtain 100% of its ‘displaceable’ onsite chilled water, and hot water production and 90% of the building’s remaining electricity usage, then the building would achieve a five star NABERS rating.
Importantly, under the disclosure rules the building owner cannot achieve the same rating improvement through a GreenPower purchase as the NABERS ratings disclosed on a BEEC must be exclusive of any GreenPower consumed at the site. This creates an
immediate incentive for connecting to the decentralised energy network over purchasing GreenPower electricity through the grid.
Precinct scale trigeneration provides heating and cooling to buildings using the zero carbon waste heat from local low carbon electricity generation that would otherwise be rejected into the atmosphere at remote centralised energy power stations. This fundamentally alters the energy profile with a precinct scale or city–wide decentralised energy network by displacing electric cooling with thermal cooling driven from the zero carbon waste heat of trigeneration. Replacing electric cooling or air conditioning with thermal cooling is a key part of reducing electricity consumption by 30% and reducing electricity peak demand by 60% across the four Low Carbon Zones. This results in surplus low–carbon electricity from the initial stages of a precinct scale or city–wide trigeneration network that needs to be exported locally to other buildings in the precincts, not the grid, until the last stages of the precincts when the electricity demand and generation can be balanced off with final technology solutions. This process provides maximum economic and environmental outcomes for a decentralised energy network that must by its very nature be developed in stages that will eventually provide local security of supply as well as maximum reductions in greenhouse gas emissions across the city.
Mandatory disclosure and NABERS should recognise in their ratings the surplus low carbon electricity from precinct scale trigeneration supplying other buildings in the precincts not initially connected to the first stages of the precent scale decentralised energy thermal reticulation networks in the precincts, otherwise the much poorer carbon abatement and much lower energy efficiency of small scale ‘boiler in the basement’ cogeneration and trigeneration schemes for individual buildings will be incentivised over the much greater carbon abatement and reductions in electricity consumption and peak demand of precinct scale or city–wide decentralised energy. Recognition of the surplus low carbon electricity from precinct scale or city–wide trigeneration and the associated ratings of supplied buildings can be administered through a decentralised energy plan for a new development such as Dandenong or through a published decentralised energy plan such as the City of Sydney’s Decentralised Energy Master Plan–Trigeneration
3. 2.

43City of Sydney | decentralised energy Master Plan—trigeneration
3 THe DeCenTRALiSeD eneRgY neTWoRK
2 Re–THinKing THe URBAn FoRM
4 5
PeRFoRMAnCe
oUTSiDe THe neTWoRK
1 TRigeneRATion
7 CASe STUDieS
8 gAS FeASiBiLiTY STUDY
6 enABLing THe MASTeR PLAn
inCenTiVise energy eFFiCienCy & LoW Carbon energy
Establish a premium rate for low carbon electricity.
The Report of the Prime Minister’s Task Group on Energy Efficiency states that despite some piecemeal efforts by Government to date, Australia has not consciously or explicitly targeted world best practice in energy efficiency policy and, by comparison with other countries, has significant gaps in its energy efficiency policy armoury3.
This is especially true for cogeneration and trigeneration which receives no benefit for the reduced carbon content of the electricity it generates. Despite this, there are a number of policy mechanisms available that could, with some modification, be used to provide financial incentive that would help ensure the viability of the decentralised energy network.
The first such mechanism is a feed in tariff which has been deployed in various forms across Australia to support small scale, grid–connected, renewable energy systems. Under such schemes, a guaranteed rate, which is above the retail price for electricity, is paid for electricity generated from renewable energy systems.
Although these schemes provide an incentive for renewable energy, they generally do not provide any support for the low carbon electricity and carbon free thermal energy generated by cogeneration and trigeneration systems. This is despite the fact that cogeneration and trigeneration has a much lower abatement cost than small scale renewable energy.
However, it would be possible to introduce a feed in tariff scheme that provides a financial incentive for cogeneration and trigeneration, and in turn the trigeneration systems that would power the decentralised energy network. Under such a scheme renewable electricity could be purchased at a premium rate while a lower premium rate could be paid for technologies that produce electricity with higher greenhouse intensity per MWh of electricity than renewables, but lower intensity than coal (such as gas powered trigeneration). An energy conversion algorithm could also be used to value the carbon free thermal energy delivered by decentralised energy network.
Although such a scheme would represent a departure from the current feed in tariff schemes in operation in Australia, it would not be a totally new scheme. The UK Government has recently announced details of its feed in tariff that includes financial support for cogeneration and trigeneration,
including the thermal energy generated by cogeneration and trigeneration plants.4
Another scheme which could be modified to provide financial incentives for the decentralised energy network is the NSW Government’s Energy Savings Scheme (ESS). ESS is a mandatory energy efficiency scheme. It works by establishing a market for tradable Energy Savings Certificates (ESCs). The certificates are made by Accredited Certificate Providers (ACPs) when they undertake energy savings activities that improve energy efficiency in a variety of residential, commercial and industrial settings. Once created, ESCs must be obtained and surrendered by electricity retailers and other parties known as Scheme Participants, who need to meet annual targets as set out in legislation.
Currently, ESS applies only to savings derived from reduced electricity use. Gas, whether through cogeneration and trigeneration or the use of gas appliances, cannot generate ESCs. The NSW Office of Environment and Heritage should consider amending ESS to include gas. Doing so would allow building owners to claim ESCs for the emissions savings generated through connection to the decentralised energy network.
Both a feed in tariff scheme and Energy Savings Scheme have the potential, if modified, to provide financial incentives
that would increase the viability of the decentralised energy network and encourage building owners within the Low Carbon Infrastructure Zones to connect to the network.
sTandardise ConneCTion Fees For gas and eLeCTriCiTy neTWorKs
Establishing standards for grid connection fees is a simple way to provide transparency and reduce uncertainty during the implementation of the trigeneration systems.
One of the significant barriers to greater adoption of cogeneration and trigeneration is uncertainty regarding potential fees for connecting to the gas and electricity networks.
Augmentation costs as normally charged to connecting users of the gas network may act as a price barrier to the implementation of the decentralised energy network. Gas distribution charges can be between 30–40% of the delivered gas cost for many of the proposed trigeneration system locations.
Further, application costs and charge structures for electricity network re–enforcement may place high financial burden on the decentralised energy network and ultimately the connected customers.
5. 4. 3. The Report of the Prime Minister’s Task Group on Energy
Efficiency (pp 25 & 36)
4. Department of Energy and Climate Change, Feed–in Tariffs (FITs) (Available: www.decc.gov.uk/en/content/cms/what_we_do/uk_supply/energy_mix/renewable/feedin_tariff/feedin_tariff.aspx)
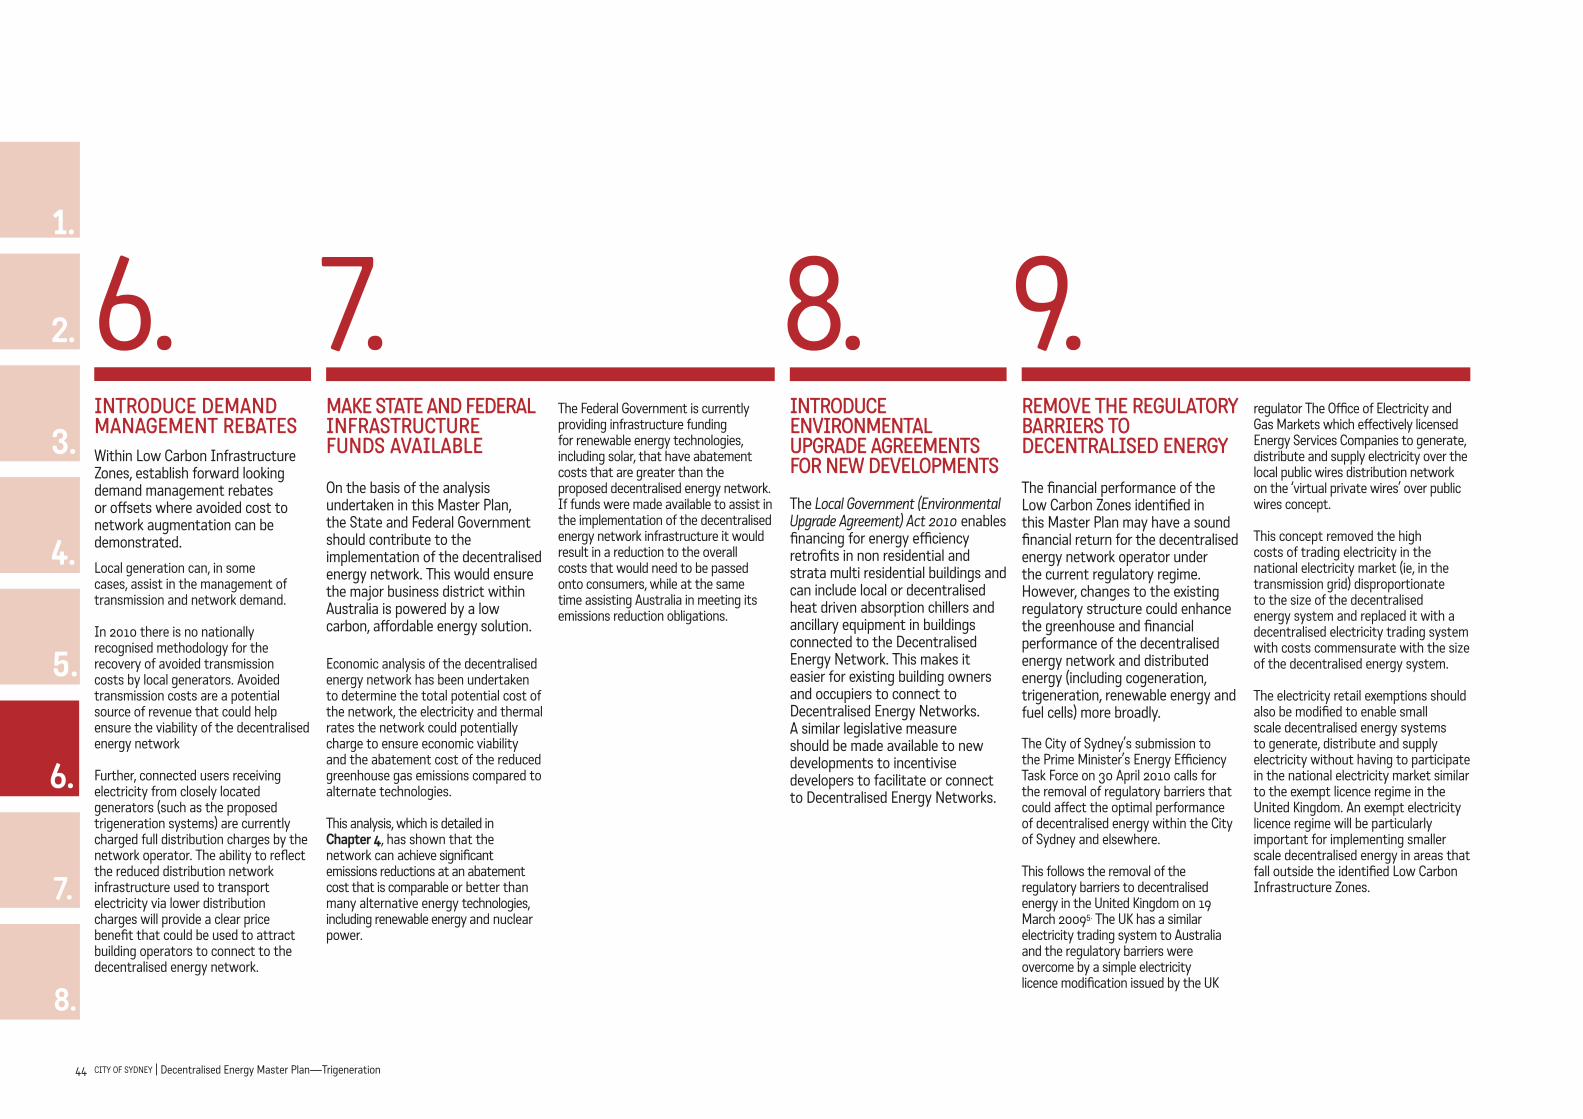
44 City of Sydney | decentralised energy Master Plan—trigeneration
1.
2.
3.
4.
5.
7.
8.
6.
inTroduCe deMand ManageMenT rebaTesWithin Low Carbon Infrastructure Zones, establish forward looking demand management rebates or offsets where avoided cost to network augmentation can be demonstrated.
Local generation can, in some cases, assist in the management of transmission and network demand.
In 2010 there is no nationally recognised methodology for the recovery of avoided transmission costs by local generators. Avoided transmission costs are a potential source of revenue that could help ensure the viability of the decentralised energy network
Further, connected users receiving electricity from closely located generators (such as the proposed trigeneration systems) are currently charged full distribution charges by the network operator. The ability to reflect the reduced distribution network infrastructure used to transport electricity via lower distribution charges will provide a clear price benefit that could be used to attract building operators to connect to the decentralised energy network.
MaKe sTaTe and FederaL inFrasTruCTure Funds aVaiLabLe
On the basis of the analysis undertaken in this Master Plan, the State and Federal Government should contribute to the implementation of the decentralised energy network. This would ensure the major business district within Australia is powered by a low carbon, affordable energy solution.
Economic analysis of the decentralised energy network has been undertaken to determine the total potential cost of the network, the electricity and thermal rates the network could potentially charge to ensure economic viability and the abatement cost of the reduced greenhouse gas emissions compared to alternate technologies.
This analysis, which is detailed in Chapter 4, has shown that the network can achieve significant emissions reductions at an abatement cost that is comparable or better than many alternative energy technologies, including renewable energy and nuclear power.
The Federal Government is currently providing infrastructure funding for renewable energy technologies, including solar, that have abatement costs that are greater than the proposed decentralised energy network. If funds were made available to assist in the implementation of the decentralised energy network infrastructure it would result in a reduction to the overall costs that would need to be passed onto consumers, while at the same time assisting Australia in meeting its emissions reduction obligations.
inTroduCe enVironMenTaL uPgrade agreeMenTs For neW deVeLoPMenTs
The Local Government (Environmental Upgrade Agreement) Act 2010 enables financing for energy efficiency retrofits in non residential and strata multi residential buildings and can include local or decentralised heat driven absorption chillers and ancillary equipment in buildings connected to the Decentralised Energy Network. This makes it easier for existing building owners and occupiers to connect to Decentralised Energy Networks. A similar legislative measure should be made available to new developments to incentivise developers to facilitate or connect to Decentralised Energy Networks.
reMoVe The reguLaTory barriers To deCenTraLised energy
The financial performance of the Low Carbon Zones identified in this Master Plan may have a sound financial return for the decentralised energy network operator under the current regulatory regime. However, changes to the existing regulatory structure could enhance the greenhouse and financial performance of the decentralised energy network and distributed energy (including cogeneration, trigeneration, renewable energy and fuel cells) more broadly.
The City of Sydney’s submission to the Prime Minister’s Energy Efficiency Task Force on 30 April 2010 calls for the removal of regulatory barriers that could affect the optimal performance of decentralised energy within the City of Sydney and elsewhere.
This follows the removal of the regulatory barriers to decentralised energy in the United Kingdom on 19 March 20095. The UK has a similar electricity trading system to Australia and the regulatory barriers were overcome by a simple electricity licence modification issued by the UK
regulator The Office of Electricity and Gas Markets which effectively licensed Energy Services Companies to generate, distribute and supply electricity over the local public wires distribution network on the ‘virtual private wires’ over public wires concept.
This concept removed the high costs of trading electricity in the national electricity market (ie, in the transmission grid) disproportionate to the size of the decentralised energy system and replaced it with a decentralised electricity trading system with costs commensurate with the size of the decentralised energy system.
The electricity retail exemptions should also be modified to enable small scale decentralised energy systems to generate, distribute and supply electricity without having to participate in the national electricity market similar to the exempt licence regime in the United Kingdom. An exempt electricity licence regime will be particularly important for implementing smaller scale decentralised energy in areas that fall outside the identified Low Carbon Infrastructure Zones.
8. 7. 9. 6.

45City of Sydney | decentralised energy Master Plan—trigeneration
3 THe DeCenTRALiSeD eneRgY neTWoRK
2 Re–THinKing THe URBAn FoRM
4 5
PeRFoRMAnCe
oUTSiDe THe neTWoRK
1 TRigeneRATion
7 CASe STUDieS
8 gAS FeASiBiLiTY STUDY
6 enABLing THe MASTeR PLAn
LoW Carbon Zone reCogniTion sCheMeCity of Sydney could establish a recognition scheme to recognise and differentiate buildings which have connected to the green infrastructure, including the decentralised energy network.
This could include recognition on the City of Sydney’s website and the development of public materials to assist property agents searching for green buildings and to incentivise and recognise Low Carbon Infrastructure Zone buildings.
sTreaMLine STATE ENVIRONMENTAL PLANNING POLICY PLanning aPProVaLs For deCenTraLised energyThe planning approval framework for precinct scale trigeneration energy centres and thermal reticulation networks must be streamlined. A framework where co/trigeneration facilities are separately defined and identified as ‘development permitted without consent’ in the State Environmental Planning Policy (Infrastructure) 2007 should be adopted. A Part 5 approval process would allow for a more streamlined assessment process and would promote better long term coordination of sites for precinct scale trigeneration.
sTreaMLine easeMenTs and aCCess arangeMenTs For deCenTraLised energy
Mechanisms for surveying and registering easements and access arrangements onto property titles should be streamlined to ensure that trigeneration thermal reticulation networks on private and government land, including public roads, can be readily installed and maintained.
nsW handbooKA NSW Handbook or Good Practice Guide on Co/Trigeneration Development should be developed to provide detailed information on key engineering, environmental and planning issues to assist proponents and consent authorities.
5. Ofgem Distributed Energy–Electricity Supply Licence Modification– 19 March 2009 (Available: http://www.ofgem.gov.uk/Sustainability/Environment/Policy/SmallrGens/DistEng)
11. 12. 13. 10.

7.
46 CITY OF SYDNEY | Decentralised Energy Master Plan
CASe STUDieS:gReen SQUARe, ASHMoRe eSTATe, FUeL CeLLS, BUiLDing inTegRATion

47City of Sydney | decentralised energy Master Plan—trigeneration
3 THe DeCenTRALiSeD eneRgY neTWoRK
2 Re–THinKing THe URBAn FoRM
4 5
PeRFoRMAnCe
oUTSiDe THe neTWoRK
1 TRigeneRATion
6 enABLing THe MASTeR PLAn
8 gAS FeASiBiLiTY STUDY
7 CASe STUDieS
Figure 34: green sQuare ToWn CenTre Case sTudy area The Interim Master Plan included a case study for the Green Square Town Centre, which provided an example of how a new development could link into the decentralised energy network. Its analysis focused only on a small part of the total Green Square Redevelopment Area, the Green Square Town Centre, while the remainder of Green Square was included in the Green Square Low Carbon Infrastructure Zone.
Since the Interim Master Plan was released, subsequent analysis was undertaken to better understand the delivery requirements for installing trigeneration systems within the Green Square Redevelopment Area. This was delivered to the City of Sydney in the form of the Green Square Green Infrastructure Concept Plan which was prepared by a consortium led by Kinesis. The Concept Plan also considered the delivery requirements for including recycled water and powering an evacuated waste network as part of the redevelopment.
The results presented in the Green Square Green Infrastructure Concept Plan differ from the Interim Decentralised Energy Master Plan’s Green Square Case Study. These changes were the result of additional floor space and development information, unavailable at the time of the Interim Master Plan.
For this final Master Plan, the Green Square Case Study has been updated to include the results of the Green Square Green Infrastructure Concept Plan.
CASe STUDY green sQuare ToWn CenTre
gReen SQUARe ReDeVeLoPMenT AReA
The details of the land use and floor space information for the Green Square Redevelopment Area was sourced from the City of Sydney based on current developments that have already occurred at Green Square and the most recent development applications. A number of potential development scenarios, based on different growth projections, were considered. On advice from the City of Sydney, a high development scenario was utilised for the Concept Plan.
The Green Square Redevelopment Area (and associated floor space) defined for the analysis undertaken in the Concept Plan varies greatly from the Green Square Low Carbon Infrastructure Zone adopted in the Interim Trigeneration Master Plan. The revised redevelopment area consists of three zones:
These stages are shown in Figure 34. Stage 1 of the Green Square Town Centre is assumed to be largely built between 2012 and 2013 with some additional commercial and retail development to 2016. The remainder of the Redevelopment Area is due for completion by 2031 (Table 5).
SOUT
H DO
WLI
NG S
TREE
TZONE 1sTage 1 oF green sQuare ToWn CenTre
ZONE 2ToTaL green sQuare ToWn CenTre
ZONE 3ToTaL green sQuare redeVeLoPMenT area

48 City of Sydney | decentralised energy Master Plan—trigeneration
1.
2.
3.
4.
5.
6.
8.
7.
STAGE OF DEVELOPMENT 2011 2013 2016 2021 2026 2031STAge 1 gReen SQUARe ToWn CenTRe
RETAIL M2 0 5,734 6,544 6,544 6,544 6,544
COMMERCIAL M2 0 7,791 19,478 19,478 19,478 19,478
RESIDENTIAL M2 0 37,640 37,640 37,640 37,640 37,640
ToTAL M2 0 51,165 63,662 63,662 63,662 63,662
DWELLINGS 0 362 362 362 362 362
POPULATION 0 713 713 713 713 713
ToTAL gReen SQUARe ToWn CenTRe
RETAIL M2 0 7,553 15,162 18,710 22,271 22,271
COMMERCIAL M2 0 7,791 43,157 61,943 143,483 143,483
RESIDENTIAL M2 0 66,419 142,073 295,331 345,831 345,831
ToTAL M2 0 81,762 200,393 375,985 511,586 511,586
DWELLINGS 0 640 1,396 2,890 3,330 3,330
POPULATION 0 1,257 2,744 5,681 6,547 6,547
ToTAL gReen SQUARe STUDY AReA
RETAIL M2 10,667 19,353 28,662 32,210 46,771 57,771
COMMERCIAL M2 18,000 41,258 99,824 127,276 244,983 272,483
RESIDENTIAL M2 816,763 1,255,513 1,889,665 2,357,902 2,728,881 2,834,381
ToTAL M2 845,429 1,316,123 2,018,151 2,517,389 3,020,636 3,164,636
DWELLINGS 3,965 12,089 18,223 22,750 26,276 27,292
POPULATION 7,795 23,767 35,826 44,726 51,658 53,655
TabLe 7: green sQuare ToWn CenTre Case redeVeLoPMenT area
DeTeRMining THe CoRReCT SoLUTion– FoR eACH DeVeLoPMenT STAge
As Green Square will be a predominantly residential development, its thermal demands are quite different from the other Low Carbon Infrastructure Zones. Residential hot water is the primary demand, along with commercial and retail space cooling (Figure 35).
However, the initial Town Centre development stage, due for completion by the end of 2013, will have a very different thermal demand with a large amount of commercial and retail floor space compared with the remainder of the Green Square Redevelopment Area (Figure 36). This presents a considerable challenge in determining the ideal trigeneration solution.
The thermal demands (in particular the residential space cooling demands) are characterised by high and inconsistent peaks that respond to outside temperature, time of day and days of the week.
If, however, the residential space cooling and space heating loads are removed from the loads (i.e. the trigeneration system is designed to meet the non–residential hot water, space heating and space cooling and the residential hot water only) the thermal demand profile connected to trigeneration becomes significantly more consistent and the peak loads significantly lower.
For consistency with the analysis undertaken for the City of Sydney’s Decentralised Energy Master Plan– Trigeneration, the trigeneration plant for the Green Square Study Redevelopment Area was sized based on the net electrical load of
the connected residential and non–residential floor space, operating between the peak and shoulder energy demand periods of 7am and 10pm.
Due to the variable residential thermal demands, three trigeneration configurations were considered:
OPTION 1: Connecting only the residential hot water demand. OPTION 2: Connecting the residential hot water and heating demand. OPTION 3: Connecting all residential thermal demands.
The results indicated that a relatively small additional greenhouse gas emission reduction could be achieved by connecting the residential space heating and space cooling. This is due to the peakiness of the residential space cooling demand.
Additional analysis was undertaken to consider alternative options for meeting the residential space cooling demands. One option would be to utilise electricity generated from a fuel cell to drive high COP electric heat pumps for provision of the required thermal energy. A fuel cell installation of approximately 18 kWe would service the net annual space conditioning demand of the residential floor space from Stage 1 of the Town Centre. Similarly, the net annual residential electric space conditioning loads of the entire Green Square Study Area would be met by a 1.4 MWe fuel cell running continuously throughout the year.
The Concept Plan proposed the installation of a 100–400 kWe fuel cell within the Green Square Town Centre as a demonstration to:
1. Demonstrate the logical transition of reciprocating engines to more electrically efficient technologies.
2. Better understand the potential benefits of fuel cells to manage peak demands issues generated by residential electric cooling.
The Concept Plan also evaluated the application of heat exchangers on the network return water pipe (or low grade heat) for the provision of space heating and domestic hot
water to both the residential and non–residential floor area. This has the advantage of harnessing otherwise unusable thermal energy that while too low grade for heat–driven cooling, can be harnessed for low grade thermal demands of space heating and hot water. This means that a greater proportion of waste heat energy can be harnessed and used within the precinct.
DeLiVeRY PLAn
To ensure that all appropriate trigeneration infrastructure is available as Green Square is redeveloped, temporary trigeneration systems may need to be installed before the primary trigeneration system is available. A staged solution is also important given that the initial Town Centre stage of the redevelopment will include large commercial and retail thermal loads which are quite different from the residential thermal loads that will dominate the rest of the Green Square redevelopment.
In consultation with the City of Sydney and the Mirvac Leighton consortium responsible for developing the Green Square Town Centre, a temporary site (totalling 652 m2) was identified which could house two 600 kWe reciprocating trigeneration engines and ancillary equipment. This temporary solution will
be configured to meet the commercial and retail thermal loads that will make up a significant percentage of the energy demand within this initial area.
A permanent site was identified by the City of Sydney as capable of housing the primary trigeneration system which will consist of eight 4 MWe reciprocating engines and ancillary equipment. This site is located at the old Hospital Site (See Figure 36). Approximately 1,500 m2 of space has been allocated at this site for the Trigeneration system, out of a total site area of 17,067 m2.
The final 32 MWe trigeneration capacity for the entire Green Square Redevelopment Area is 12 MWe greater than was originally identified in the Interim Decentralised Energy Master Plan. This increase is due to the increased floor space that will need to be serviced at Green Square. The floor space assumed to be connected to trigeneration in the Green Square Green Infrastructure Concept Plan is approximately 45% higher than the floor space analysed in the Interim Green Square Low Carbon Infrastructure Zone.
0
500
1,000
1,500
2,000
2,500
3,000
3,500
4,000
4,500
COMMERCIAL RETAIL RESIDENTIAL
TOTA
L GJ/
YEAR
SPACE COOLING
SPACE HEATING
HOT WATER
0
50,000
100,000
150,000
200,000
250,000
300,000
COMMERCIAL RETAIL RESIDENTIAL
TOTA
L GJ/
YEAR
SPACE COOLING
SPACE HEATING
HOT WATER
Figure 36: ToTaL TherMaL Loads For The CoMPLeTe green sQuare sTudy area aT 2031
Figure 35: ToTaL TherMaL Loads For sTage 1 oF green sQuare ToWn CenTre aT 2013
0
50,000
100,000
150,000
200,000
250,000
300,000
COMMERCIAL RETAIL RESIDENTIAL
TOTA
L GJ/
YEAR
SPACE COOLING
SPACE HEATING
HOT WATER

49City of Sydney | decentralised energy Master Plan—trigeneration
3 THe DeCenTRALiSeD eneRgY neTWoRK
2 Re–THinKing THe URBAn FoRM
4 5
PeRFoRMAnCe
oUTSiDe THe neTWoRK
1 TRigeneRATion
6 enABLing THe MASTeR PLAn
8 gAS FeASiBiLiTY STUDY
7 CASe STUDieS
PeRFoRMAnCe
The performance results for trigeneration at the Temporary Site and the completed Green Square Redevelopment Area are based on the following configuration:• Engine type: reciprocating engines sized to follow the
connected electrical load of the residential and non–residential buildings.
• Thermal network: low temperature (approximately 98°C) hot water distribution. An additional option that includes the use of low grade heat is also analysed.
• Building demand: distributed hot water used for residential hot water and heating and commercial and retail hot water, space heating and space cooling. An additional fuel cell option, included to meeting the residential cooling demand was also analysed.
Results for both a 7 am to 10 pm and a 24 hour operating strategy are provided above in Table 8.
Figure 37: green sQuare ToWn CenTre siTe
7aM —10PM oPeraTion 24 hour oPeraTion
residenTiaL hW residenTiaL hW
KEY PERFORMANCE uniT
sTage 1 green sQuare ToWn CenTre
ToTAL gReen SQUARe
STUDY AReA
sTage 1 green sQuare ToWn CenTre
ToTAL gReen SQUARe
STUDY AReA
Connected floor space m2 51,165 3,164,636 51,165 3,164,636
Trigeneration in0 stalled capacity MWe 1.27 32.2 1.27 32.2
Absorption chiller plant size MWt 0.74 12 0.74 12
Electric boost chiller max power MWt 0.62 17 0.62 17
Trigeneration gas fuel consumption GJ/yr 26,000 896,000 31,000 1,129,000
Low carbon electricity generation MWh/yr 2,500 101,800 3,000 128,300
Exported low carbon electricity MWh/yr 0 –600 0 –600
Displaced coal–fired electricity MWh/yr 610 20,950 610 20,840
Reduction in peak load MW 1.2 32.8 1.2 32.8
Fuel use efficiency % 60% 61% 60% 59%
Cogen electrical utilisation % 35% 58% 27% 45%
Est. water use for heat rejection kL/yr 4,500 104,800 4,500 112,700
No use of low grade heatGHG savings* t CO2–e 1,000 62,000 2,000 73,000
GHG reductions % 38% 36% 42% 43%
Low grade heat used for heating & hot water
GHG savings* t CO2–e 1,105 77,500 1,071 73,535
GHG reductions % 42% 45% 45% 51%
Low grade heat used for heating & hot water & fuel cell for residential cooling
GHG savings* t CO2–e 16 676 16 676
GHG reductions % 43% 45% 46% 51%
TabLe 8: green sQuare TrigeneraTion PerForManCe resuLTs
FinAL ConFigURATion
Since the release of the Green Square Green Infrastructure Concept Plan, the City of Sydney is now considering the implementation of residential space cooling for the Green Square Low Carbon Infrastructure Zone. This will achieve some additional emissions reductions. However, the extent of these additional emissions reductions will depend on the final plant configuration (whether it is sized to meet average or peak space cooling demand) and the extent of the space cooling infrastructure.
TEMPORARY SITE
PERMANENT SITE
PRIMARY PATH FOR THERMAL, RECYCLED WATER AND VACUUM WASTE PIPE NETWORK
SOUT
H DO
WLI
NG S
TREE
T

50 City of Sydney | decentralised energy Master Plan—trigeneration
1.
2.
3.
4.
5.
6.
8.
7.
TabLe 9: ashMore esTaTe
Key greenhouse PerForManCe resuLTs
CONNECTED COMMERCIAL FLOOR AREA 7,900 m2
CONNECTED RETAIL FLOOR AREA 2,100 m2
CONNECTED RESIDENTIAL FLOOR AREA 212,000 m2
ToTaL ConneCTed FLoor area 222,000 m2
TRIGENERATION SYSTEM INSTALLED CAPACITY 1.2 MWeDISPLACED PEAK POWER 4.8 MWeLOW CARBON ELECTRICITY GENERATION 6.6 GWh/yr
DISPLACED ELECTRICAL THERMAL LOAD 8.7 GWh/yr
TRIGENERATION SYSTEM FUEL GAS CONSUMPTION 57 TJ/yr
FUEL USE EFFICIENCY 62 %
SUPPLIED HEAT DEMAND 21,641 GJ/yr
SUPPLIED COOLTH DEMAND 12,339 GJ/yr
THERMAL NETWORK MAXIMUM FLOW VELOCITY 2.0 m/s
ARTERIAL MAINS ESTIMATED MAXIMUM PIPE DIAMETER 0.10 m
ESTIMATED PIPE THERMAL LOSSES 603 GJ/yr
GHG SAVINGS 5,767 tonnes(CO2)/yr
GHG REDUCTION FOR CONNECTED BUILDINGS 48 %
Page 23 of the Master Plan describes the boundaries of the areas in which buildings will be able to connect to the decentralised energy network. These boundaries, referred to as Low Carbon Infrastructure Zones, represent the areas of the City that are best suited for connection to the decentralised energy network due to the density of buildings, the electrical and thermal demand intensity and the potential greenhouse gas emission reductions with appropriate financial returns.
However, as the City continues to grow, areas may develop with suitable density and energy intensity to warrant the development of small scale trigeneration networks, outside the Low Carbon Infrastructure Zones.
One such potential development is Ashmore Estate which is the largest industrial estate outside Green Square allocated for urban renewal. It is approximately 17.4 ha in land area. Located in Erskineville, Ashmore Estate is bounded by Ashmore Street, Mitchell Road, Coulson Street and the Bankstown rail line. Completion is expected well before 2020.
Unlike Green Square Town Centre, Ashmore Estate will be unable to connect to one of the four proposed Low Carbon Infrastructure Zones due to its size and location. However, it would be an ideal location for a standalone trigeneration system powering a discrete decentralised energy network within the development itself.
A 1.2 MWe trigeneration system could provide 100% of Ashmore Estate’s floor space with heating and cooling energy and thereby displace approximately 40% of electricity demand. Such a system would also supply approximately 75% of the remaining need for electrical energy with low carbon electricity produced by the gas–powered trigeneration plant.
This system could reduce Ashmore Estate’s greenhouse gas emissions by approximately 48% when fully operational (Table 5).
CASe STUDY ashMore esTaTe

51City of Sydney | decentralised energy Master Plan—trigeneration
3 THe DeCenTRALiSeD eneRgY neTWoRK
2 Re–THinKing THe URBAn FoRM
4 5
PeRFoRMAnCe
oUTSiDe THe neTWoRK
1 TRigeneRATion
6 enABLing THe MASTeR PLAn
8 gAS FeASiBiLiTY STUDY
7 CASe STUDieS
A fuel cell is a device that efficiently generates electricity, heat and water from hydrogen rich fuels, through a clean and silent electrochemical reaction rather than combustion. A fuel cell is similar to a battery in that it provides continuous DC electricity. Like a battery, it has an anode, a cathode, and an electrolyte. Unlike batteries, fuel cells can continuously generate electricity as long as they have a supply of fuel and air.
Fuel cell technology was invented in the 19th century but it was not used in a practical environment until the 1950s and 60s when the USA National Aeronautics and Space Administration (NASA) used fuel cells to provide electricity, heat and water on space missions. There are now thousands of fuel cell systems installed and operating around the world, ranging in size from units for homes and small commercial and community buildings, up to utility scale generators.
Fuel cells are extremely efficient at generating energy with electrical efficiency of up to 60%, plus thermal efficiency of 20–25%. This electrical efficiency is higher than any other small scale generating technology. This very high electrical efficiency delivers lower greenhouse gas emissions, and nitrogen oxide (NOx) and sulphur dioxide (SOx) emissions compared to combustion technologies.
hoW do FueL CeLLs WorK?The principle of fuel cells was first demonstrated to the London Institution by British scientist and judge Sir William Grove in 1839. He discovered a relatively straightforward electro–chemical process where hydrogen and oxygen interact within a cell to generate electricity, heat and water.
The fuel cell contains an anode and a cathode with an electrolyte sandwiched between them, separating the two. Hydrogen is supplied into the anode and oxygen into the cathode. The two gases want to join but are prevented from doing so by the electrolyte which causes the hydrogen to split into a proton and an electron. The proton passes freely through the electrolyte whilst the electron is forced to take a different route around it, creating an electric current before re–combining with the proton to make hydrogen again and combining with oxygen through a catalyst, creating a molecule of water.
There are several different types of fuel cell that work on this principle, each using a different material for the electrolyte (alkaline, phosphoric acid, molten carbonate, solid oxide and solid polymer or proton exchange membrane). Each operates at different temperature ranges and is suitable for different applications within stationary or portable power, or transport.
sMaLL sCaLe CogeneraTion Fuel cells can provide very efficient cogeneration (combined power and heat) for individual homes and small businesses and community facilities. Fuel cell units can generate power 24 hours a day, all year round, and the output can be turned up or down to match demand or to balance intermittent renewable energy or electric vehicle charging. Fuel cell cogeneration can be installed indoors or outdoors and connected to the natural gas network as natural gas can be reformed into hydrogen gas by the on board reformer in the fuel cell unit. Domestic scale fuel cell units can be installed in a day by a qualified plumber and electrician. Multiple units can also be installed for larger buildings to match higher demands.
sydney Case sTudyThe Ausgrid Smart Home located in Newington, Sydney was created by Ausgrid and Sydney Water to trial the next generation of energy and water efficient technologies and distributed generation including a 1.5 kW fuel cell unit. The fuel cell unit connects to the existing natural gas supply and converts this gas into electricity which is used on site or exported to the distribution network grid. The heat is used to provide up to 200 litres of domestic hot water per day. During times of peak demand (i.e. more than 1.5 kW), the home needs to import electricity from the grid but in general, the Smart Home produces more electricity than it consumes.
In January 2012 Ausgrid published an overview of the Smart Home’s energy performance over approximately a 12 month period which showed that the fuel cell unit reduced greenhouse gas emissions by 65% compared to the NSW electricity grid.
Water Heater 25% HEAT
15% LOSS
UP TO 60% POWER
IMPORT FROM GRID DURING PEAK DEMAND
EXPORT EXCESS TO GRID
Fuel Cell
100% FUEL ENERGY IN
REMOTE CONTROL AND MONITORING BY UTILITY COMPANY VIA INTERNET
HEAT
H2 H+ O2
e-
e-
e-
HYDROGEN
ANODE
ELECTROLYTE
CATHODE
OXYGEN FROM AIR
WATER
CASe STUDYFueL CeLLs For sydney residenTiaL and sMaLL CoMMerCiaL buiLdings

52 City of Sydney | decentralised energy Master Plan—trigeneration
1.
2.
3.
4.
5.
6.
8.
7.
exeCuTiVe suMMaryFive buildings have been selected as case studies to review the high level technical opportunities and constraints associated with connecting to a thermal reticulation network (TRN), as proposed by the City of Sydney’s Decentralised Energy Master Plan—Trigeneration.
The case studies have been developed for the City of Sydney by WSP who acknowledges the valuable assistance provided by the Better Buildings Partnership (BBP).
Each case study represents a different energy load profile, building use typology and location in Sydney. The intent is to validate how a particular building type and its unique circumstances would fit within the context of a TRN. Case study locations and proposed early stage trigeneration precincts are illustrated in Figure 38, and the opportunities and TRN context for each case study are summarised in Table 10.
Please note that the opportunities identified are intended as guidance only, and building owners that are interested in evaluating a business case for connection should contact the City of Sydney for a detailed proposal. This will allow the building owner to consider the full range of issues and financial contributions available to them based on their individual circumstances.
THIS CASE STUDY HAS BEEN PREPARED BY WSP ON BEHALF OF THE CITY OF SYDNEY. NO INPUT WAS SOUGHT OR PROVIDED FROM THE KINESIS PROJECT TEAM IN THE PREPARATION OF THIS CASE STUDY. KINESIS HAS NOT REVIEWED OR VALIDATED, NOR DOES IT ENDORSE, ANY OF ITS FINDINGS.
Figure 38: Case sTudy LoCaTions and earLy sTage TrigeneraTion PreCinCTs
CASe STUDY buiLding inTegraTion

53City of Sydney | decentralised energy Master Plan—trigeneration
3 THe DeCenTRALiSeD eneRgY neTWoRK
2 Re–THinKing THe URBAn FoRM
4 5
PeRFoRMAnCe
oUTSiDe THe neTWoRK
1 TRigeneRATion
6 enABLing THe MASTeR PLAn
8 gAS FeASiBiLiTY STUDY
7 CASe STUDieS
coMMercial BuilDing no.1 (CB NO.1)
coMMercial BuilDing no.2 (CB NO.2)
BuilDing 10, uniVersity of technology, syDney (UTS)
highgate (HG)
BroaDway shopping centre (BRO)
BUiLDing TYPoLogY
CoMMerCiaL oFFiCe ToWers WiTh reTaiL PodiuM
CoMMerCiaL oFFiCe buiLding
heriTage TyPe eduCaTionaL FaCiLiTy
high rise residenTiaL ToWer
reTaiL shoPPing CenTre
WHAT THE BUILDING REPRESENTS
• Mixed use building• Comfort Cooling driven• Separate plant servicing
strategy for each tower and retail accommodation
• Plant space readily available
• Intensive energy use associated with high tenancy requirements
• Comfort cooling driven• Plant space physically
constrained
• Building forms part of UTS’ wider City Campus
• Identified by the City of Sydney as a host building for an energy centre
• Different energy demand profile than that of commercial and retail buildings
• Individual packaged water cooled heat pumps within each unit
• Centralised domestic hot water (DHW) heating system
• Distinct servicing split between base building and tenant systems
• Decentralised electric DHW heating systems
• All electric base building services• Plant space readily available
OPPORTUNITIES IDENTIFIED
• Establish local satellite thermal station in the building to support a local chilled water (CHW) network
• Consolidate commercial and retail spaces to enhance commercial viability of a local satellite thermal station in the building
• Seek a heating hot water (HHW) TRN connection
• Seek a CHW supply from a local satellite thermal station
• Connect the energy centre to other campus buildings
• Establish network connection with Central Park to supply the proposed early stage Pyrmont and Broadway trigeneration precinct
• Seek a HHW TRN connection to support wider network efficiencies
• Reconsider the asset replacement program urgently to realise greatest economic benefits, i.e. the high prices that residential customers pay for electricity incentivises an immediate shift from a condenser water based system to a HHW/CHW based system
• Seek a HHW TRN connection• Consolidate base building and
tenant air conditioning systems• Centralise base building space
and DHW heating systems
TabLe 10: suMMary oF Case sTudy oPPorTuniTies
CASe STUDY buiLding inTegraTion
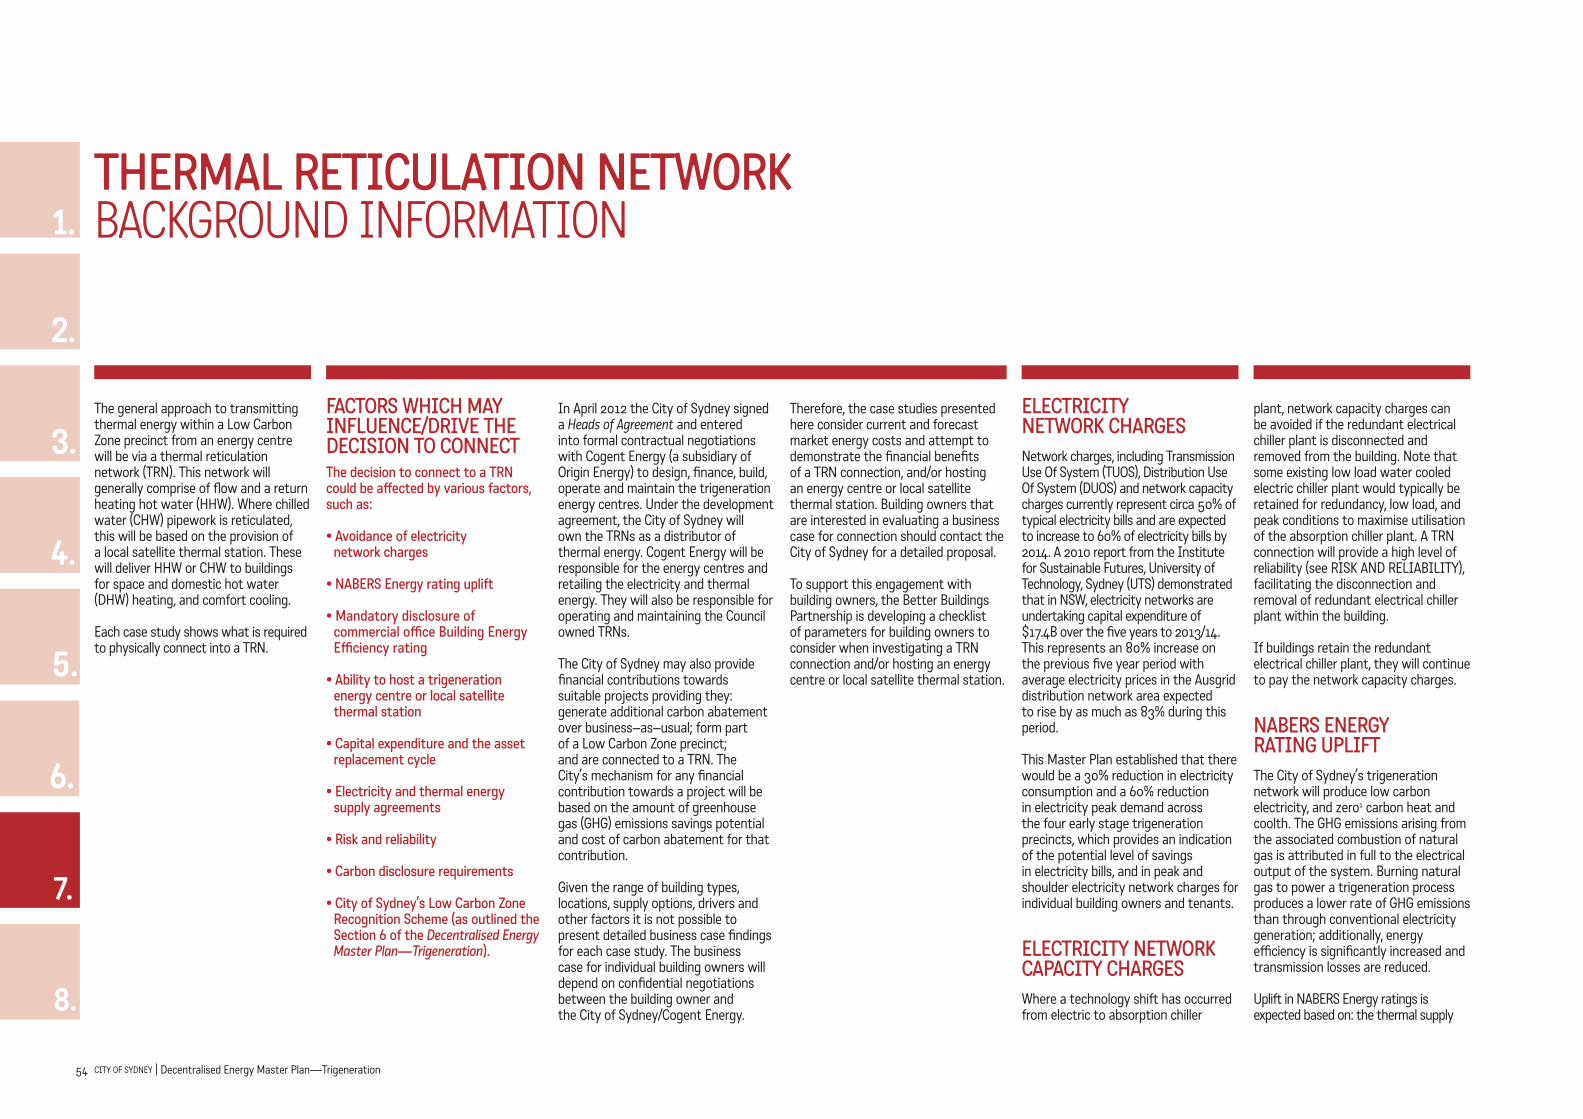
54 City of Sydney | decentralised energy Master Plan—trigeneration
1.
2.
3.
4.
5.
6.
8.
7.
The general approach to transmitting thermal energy within a Low Carbon Zone precinct from an energy centre will be via a thermal reticulation network (TRN). This network will generally comprise of flow and a return heating hot water (HHW). Where chilled water (CHW) pipework is reticulated, this will be based on the provision of a local satellite thermal station. These will deliver HHW or CHW to buildings for space and domestic hot water (DHW) heating, and comfort cooling.
Each case study shows what is required to physically connect into a TRN.
FaCTors WhiCh May inFLuenCe/driVe The deCision To ConneCTThe decision to connect to a Trn could be affected by various factors, such as:
• avoidance of electricity network charges
• nabers energy rating uplift
• Mandatory disclosure of commercial office building energy efficiency rating
• ability to host a trigeneration energy centre or local satellite thermal station
• Capital expenditure and the asset replacement cycle
• electricity and thermal energy supply agreements
• risk and reliability
• Carbon disclosure requirements
• City of sydney’s Low Carbon Zone recognition scheme (as outlined the section 6 of the Decentralised Energy Master Plan—Trigeneration).
In April 2012 the City of Sydney signed a Heads of Agreement and entered into formal contractual negotiations with Cogent Energy (a subsidiary of Origin Energy) to design, finance, build, operate and maintain the trigeneration energy centres. Under the development agreement, the City of Sydney will own the TRNs as a distributor of thermal energy. Cogent Energy will be responsible for the energy centres and retailing the electricity and thermal energy. They will also be responsible for operating and maintaining the Council owned TRNs.
The City of Sydney may also provide financial contributions towards suitable projects providing they: generate additional carbon abatement over business–as–usual; form part of a Low Carbon Zone precinct; and are connected to a TRN. The City’s mechanism for any financial contribution towards a project will be based on the amount of greenhouse gas (GHG) emissions savings potential and cost of carbon abatement for that contribution.
Given the range of building types, locations, supply options, drivers and other factors it is not possible to present detailed business case findings for each case study. The business case for individual building owners will depend on confidential negotiations between the building owner and the City of Sydney/Cogent Energy.
Therefore, the case studies presented here consider current and forecast market energy costs and attempt to demonstrate the financial benefits of a TRN connection, and/or hosting an energy centre or local satellite thermal station. Building owners that are interested in evaluating a business case for connection should contact the City of Sydney for a detailed proposal.
To support this engagement with building owners, the Better Buildings Partnership is developing a checklist of parameters for building owners to consider when investigating a TRN connection and/or hosting an energy centre or local satellite thermal station.
eLeCTriCiTy neTWorK ChargesNetwork charges, including Transmission Use Of System (TUOS), Distribution Use Of System (DUOS) and network capacity charges currently represent circa 50% of typical electricity bills and are expected to increase to 60% of electricity bills by 2014. A 2010 report from the Institute for Sustainable Futures, University of Technology, Sydney (UTS) demonstrated that in NSW, electricity networks are undertaking capital expenditure of $17.4B over the five years to 2013/14. This represents an 80% increase on the previous five year period with average electricity prices in the Ausgrid distribution network area expected to rise by as much as 83% during this period.
This Master Plan established that there would be a 30% reduction in electricity consumption and a 60% reduction in electricity peak demand across the four early stage trigeneration precincts, which provides an indication of the potential level of savings in electricity bills, and in peak and shoulder electricity network charges for individual building owners and tenants.
eLeCTriCiTy neTWorK CaPaCiTy ChargesWhere a technology shift has occurred from electric to absorption chiller
plant, network capacity charges can be avoided if the redundant electrical chiller plant is disconnected and removed from the building. Note that some existing low load water cooled electric chiller plant would typically be retained for redundancy, low load, and peak conditions to maximise utilisation of the absorption chiller plant. A TRN connection will provide a high level of reliability (see RISK AND RELIABILITY), facilitating the disconnection and removal of redundant electrical chiller plant within the building.
If buildings retain the redundant electrical chiller plant, they will continue to pay the network capacity charges.
nabers energy raTing uPLiFTThe City of Sydney’s trigeneration network will produce low carbon electricity, and zero1 carbon heat and coolth. The GHG emissions arising from the associated combustion of natural gas is attributed in full to the electrical output of the system. Burning natural gas to power a trigeneration process produces a lower rate of GHG emissions than through conventional electricity generation; additionally, energy efficiency is significantly increased and transmission losses are reduced.
Uplift in NABERS Energy ratings is expected based on: the thermal supply
THERMAL RETICULATION NETWORK BACKGROUND INFORMATION

55City of Sydney | decentralised energy Master Plan—trigeneration
3 THe DeCenTRALiSeD eneRgY neTWoRK
2 Re–THinKing THe URBAn FoRM
4 5
PeRFoRMAnCe
oUTSiDe THe neTWoRK
1 TRigeneRATion
6 enABLing THe MASTeR PLAn
7 CASe STUDieS
8 gAS FeASiBiLiTY STUDY
7 CASe STUDieS
arrangement, i.e. a heating hot water (HHW) or chilled water (CHW) reticulation network connection; and the proportion of the building’s space and DHW heating, and comfort cooling demands met by the thermal energy supply; and uptake of low carbon electricity.
Please note that the uplift in NABERS Energy ratings defined for each case study have only considered the GHG emissions savings associated with a TRN connection, i.e. do not include the GHG emissions savings that could be achieved through the purchase of low carbon electricity from the trigeneration energy centres. Should a low carbon electricity supply be sought, this could have the potential to deliver a conditional uplift of 1 star, as outlined in the Decentralised Energy Master Plan—Trigeneration. This would be an additional 1 star above what has been defined for each case study based on a TRN connection.
hosTing an energy CenTre or a LoCaL saTeLLiTe TherMaL sTaTion
Customers may elect to host an energy centre whereby electricity used by the building is produced on site, avoiding virtually all network charges. Hosting an energy centre would require a low/no cost lease to the City of Sydney who will sub lease to Cogent Energy.
Hosting a local satellite thermal station can also incentivise a building owner to connect to a TRN due to a lower capital expenditure (CAPEx) requirement for the host building. The local satellite thermal station will be owned by Cogent Energy but the host building owner could avoid most, if not all, of the CAPEx requirements for the absorption chiller plant (e.g. plant procurement and installation costs) relative to the host building. The cost of additional absorption chiller plant at the host building (over and above what the host building requires) and the additional cost of connection from the satellite thermal station to adjacent customer buildings will have to be borne by the non–host connected buildings. Hosting a local satellite thermal station would require a low/no cost lease to the City of Sydney who will sub lease to Cogent Energy.
CaPex and The asseT rePLaCeMenT CyCLeEach case study sets out the estimated CAPEx for the new plant required to connect to a TRN. However, the CAPEx outlined is subject to a detailed proposal prepared as part of any negotiations with the City of Sydney/Cogent Energy.
In addition to the financial contributions that may be available to buildings that elect to host an energy centre or local satellite thermal station, and are connected to a TRN, opportunities may
also exist for external grants or low interest loans such as Environmental Upgrade Agreements.
Inherent asset replacement cycles may also support capital upgrade works, including retrofit of building services and connection to a TRN. As such, the CAPEx figures denoted for each case study should be treated as indicative only. Customers may elect to replace plant early to deliver financial and other benefits, such as the ability to shield against increasing electricity network charges, Carbon Price impacts, organisation carbon disclosure, more readily achieve NABERS Energy and Green Star Performance ratings, and attract/retain anchor tenants.
Please note that the scope of this study did not allow for analysis of tenant systems.
eLeCTriCiTy and TherMaL energy suPPLy agreeMenTsAs outlined in the Decentralised Energy Master Plan—Trigeneration, replacing electric chiller plant with absorption chiller plant (HHW fired) in customer buildings will offer economic benefits to customers. The following case studies provide some preliminary indication of the capital cost associated with connection and the associated economic benefits that may be achieved.
Whilst the CAPEx for connection to a CHW TRN may appear in some cases to be lower than connection to a HHW TRN, consideration of the higher CHW supply tariffs (due to the pass through costs associated with the extra plant and reinforced reticulation infrastructure required to provide chilled water) needs to be considered. Building owners that are interested in evaluating a business case for connection should contact the City of Sydney for a detailed proposal. This will allow the building owner to consider the full range of issues and financial contributions available to them based on their individual circumstances.
risK and reLiabiLiTyThe TRN will ultimately be designed with multiple energy centres feeding into the network. If an energy centre were to fail, the TRN would still be supplied through other energy centres. The trigeneration network will also have back–up boiler plant and thermal storage at the energy centres or at customer buildings, which will be used to supplement the day time thermal load should any generator downtime be experienced. This provides redundancy within the TRN. It is expected that the connection to a TRN should provide the same or better security of supply as that offered by the electricity and gas supply networks. Electricity will be supplied 24 hours a day; backed up by other energy centres and the grid.
reduCed exPosure To The Carbon PriCeWhen interrogating the Energy Price Projection, developed by the Institute for Sustainable futures, University of Technology, Sydney (UTS) for the NSW Office of Environment and Heritage (OEH), December 2011, over the period 2011–2020, the projected impact of the Carbon Price on energy costs starts to become apparent. With the introduction of the Carbon Price on 1st July 2012, an additional electricity cost of 2.39c/kWh is expected to be included in NSW business electricity prices. This represents circa 13% of the total electricity supply tariff, which is expected to rise to 15–27% based on projected low or high Carbon Price trends.
Mitigating exposure to the Carbon Price through a TRN connection could support annual electricity cost savings in the order of 15% by 2020 depending on the volume of electricity displaced through a technology shift from electric chiller plant to absorption chiller plant
THERMAL RETICULATION NETWORK BACKGROUND INFORMATION
1 Some greenhouse gas emissions may be attributed to ancillary services of the thermal network.
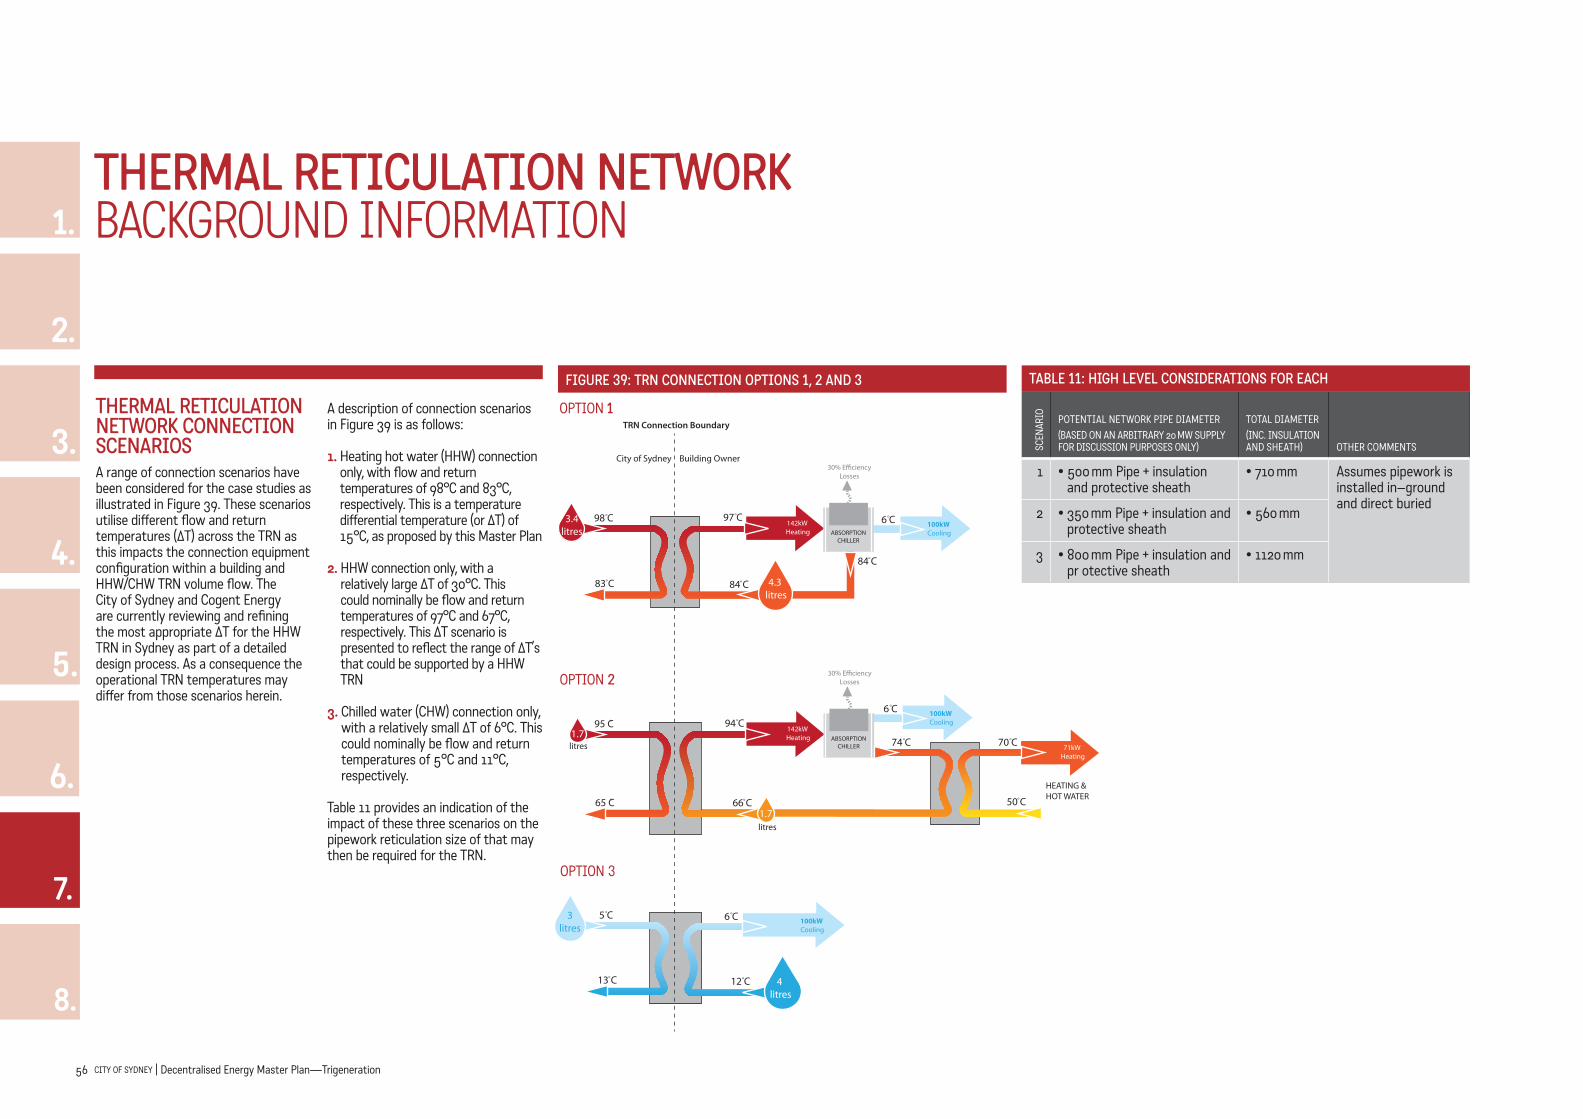
56 City of Sydney | decentralised energy Master Plan—trigeneration
1.
2.
3.
4.
5.
6.
8.
7.
OPTION 1
OPTION 2
OPTION 3
100kW Cooling
6 Co
71kW Heating
100kW Cooling
30% E�ciencyLosses
142kW Heating ABSORPTION
CHILLER
98 Co
83 Co
6 Co
12 Co
97 Co
84 Co
3.4litres
5 Co
13 Co
4.3 litres
4 litres
3litres
100kW Cooling
30% E�ciencyLosses
142kW Heating ABSORPTION
CHILLER
95 Co
65 Co
94 Co
66 Co
1.7litres
1.7litres
6 Co
70 Co
50 Co
74 Co
HEATING &HOT WATER
84 Co
City of Sydney Building Owner
TRN Connection Boundary
TherMaL reTiCuLaTion neTWorK ConneCTion sCenariosA range of connection scenarios have been considered for the case studies as illustrated in Figure 39. These scenarios utilise different flow and return temperatures (ΔT) across the TRN as this impacts the connection equipment configuration within a building and HHW/CHW TRN volume flow. The City of Sydney and Cogent Energy are currently reviewing and refining the most appropriate ΔT for the HHW TRN in Sydney as part of a detailed design process. As a consequence the operational TRN temperatures may differ from those scenarios herein.
A description of connection scenarios in Figure 39 is as follows:
1. Heating hot water (HHW) connection only, with flow and return temperatures of 98°C and 83°C, respectively. This is a temperature differential temperature (or ΔT) of 15°C, as proposed by this Master Plan
2. HHW connection only, with a relatively large ΔT of 30°C. This could nominally be flow and return temperatures of 97°C and 67°C, respectively. This ΔT scenario is presented to reflect the range of ΔT’s that could be supported by a HHW TRN
3. Chilled water (CHW) connection only, with a relatively small ΔT of 6°C. This could nominally be flow and return temperatures of 5°C and 11°C, respectively.
Table 11 provides an indication of the impact of these three scenarios on the pipework reticulation size of that may then be required for the TRN.
Figure 39: Trn ConneCTion oPTions 1, 2 and 3
THERMAL RETICULATION NETWORK BACKGROUND INFORMATION
SCEN
ARIO POTENTIAL NETWORK PIPE DIAMETER
(BASED ON AN ARBITRARY 20 MW SUPPLY FOR DISCUSSION PURPOSES ONLY)
TOTAL DIAMETER(INC. INSULATION AND SHEATH) OTHER COMMENTS
1 • 500 mm Pipe + insulation and protective sheath
• 710 mm Assumes pipework is installed in–ground and direct buried
2 • 350 mm Pipe + insulation and protective sheath
• 560 mm
3 • 800 mm Pipe + insulation and pr otective sheath
• 1120 mm
TabLe 11: high LeVeL ConsideraTions For eaCh
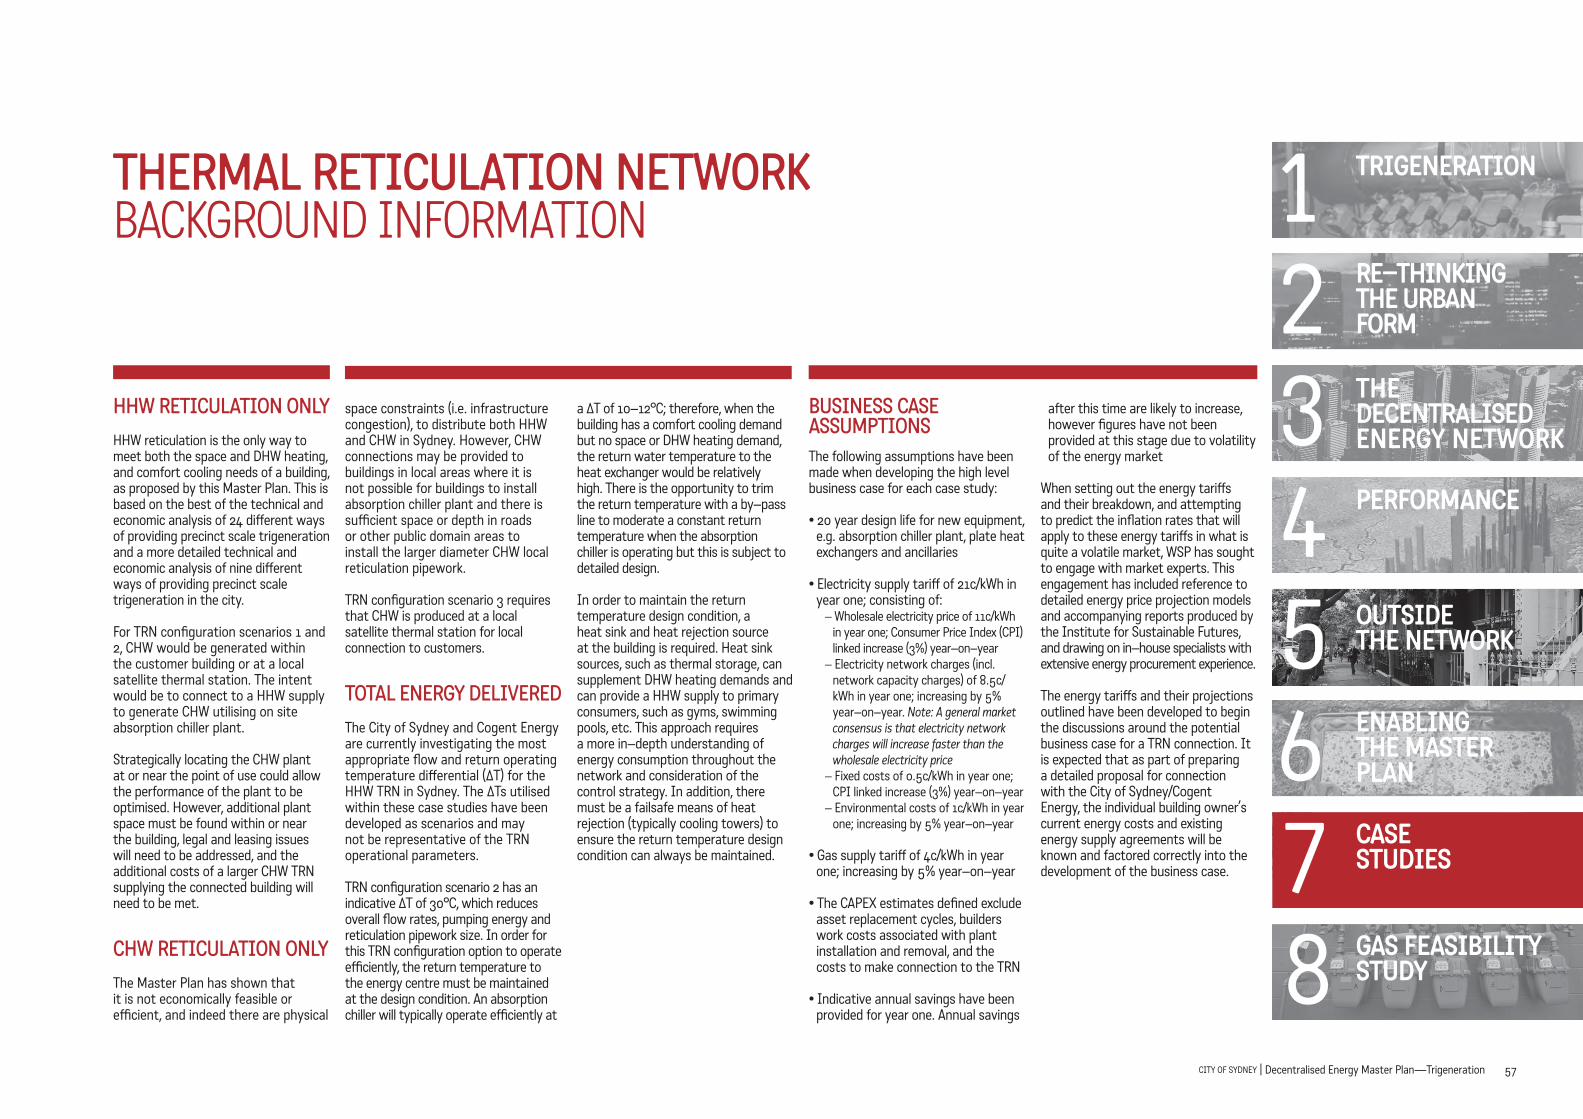
57City of Sydney | decentralised energy Master Plan—trigeneration
3 THe DeCenTRALiSeD eneRgY neTWoRK
2 Re–THinKing THe URBAn FoRM
4 5
PeRFoRMAnCe
oUTSiDe THe neTWoRK
1 TRigeneRATion
6 enABLing THe MASTeR PLAn
7 CASe STUDieS
8 gAS FeASiBiLiTY STUDY
7 CASe STUDieS
hhW reTiCuLaTion onLyHHW reticulation is the only way to meet both the space and DHW heating, and comfort cooling needs of a building, as proposed by this Master Plan. This is based on the best of the technical and economic analysis of 24 different ways of providing precinct scale trigeneration and a more detailed technical and economic analysis of nine different ways of providing precinct scale trigeneration in the city.
For TRN configuration scenarios 1 and 2, CHW would be generated within the customer building or at a local satellite thermal station. The intent would be to connect to a HHW supply to generate CHW utilising on site absorption chiller plant.
Strategically locating the CHW plant at or near the point of use could allow the performance of the plant to be optimised. However, additional plant space must be found within or near the building, legal and leasing issues will need to be addressed, and the additional costs of a larger CHW TRN supplying the connected building will need to be met.
ChW reTiCuLaTion onLyThe Master Plan has shown that it is not economically feasible or efficient, and indeed there are physical
space constraints (i.e. infrastructure congestion), to distribute both HHW and CHW in Sydney. However, CHW connections may be provided to buildings in local areas where it is not possible for buildings to install absorption chiller plant and there is sufficient space or depth in roads or other public domain areas to install the larger diameter CHW local reticulation pipework.
TRN configuration scenario 3 requires that CHW is produced at a local satellite thermal station for local connection to customers.
ToTaL energy deLiVeredThe City of Sydney and Cogent Energy are currently investigating the most appropriate flow and return operating temperature differential (ΔT) for the HHW TRN in Sydney. The ΔTs utilised within these case studies have been developed as scenarios and may not be representative of the TRN operational parameters.
TRN configuration scenario 2 has an indicative ΔT of 30°C, which reduces overall flow rates, pumping energy and reticulation pipework size. In order for this TRN configuration option to operate efficiently, the return temperature to the energy centre must be maintained at the design condition. An absorption chiller will typically operate efficiently at
a ΔT of 10–12°C; therefore, when the building has a comfort cooling demand but no space or DHW heating demand, the return water temperature to the heat exchanger would be relatively high. There is the opportunity to trim the return temperature with a by–pass line to moderate a constant return temperature when the absorption chiller is operating but this is subject to detailed design.
In order to maintain the return temperature design condition, a heat sink and heat rejection source at the building is required. Heat sink sources, such as thermal storage, can supplement DHW heating demands and can provide a HHW supply to primary consumers, such as gyms, swimming pools, etc. This approach requires a more in–depth understanding of energy consumption throughout the network and consideration of the control strategy. In addition, there must be a failsafe means of heat rejection (typically cooling towers) to ensure the return temperature design condition can always be maintained.
business Case assuMPTionsThe following assumptions have been made when developing the high level business case for each case study:
• 20 year design life for new equipment, e.g. absorption chiller plant, plate heat exchangers and ancillaries
• Electricity supply tariff of 21c/kWh in year one; consisting of:
– Wholesale electricity price of 11c/kWh in year one; Consumer Price Index (CPI) linked increase (3%) year–on–year – Electricity network charges (incl. network capacity charges) of 8.5c/kWh in year one; increasing by 5% year–on–year. Note: A general market consensus is that electricity network charges will increase faster than the wholesale electricity price – Fixed costs of 0.5c/kWh in year one; CPI linked increase (3%) year–on–year – Environmental costs of 1c/kWh in year one; increasing by 5% year–on–year
• Gas supply tariff of 4c/kWh in year one; increasing by 5% year–on–year
• The CAPEx estimates defined exclude asset replacement cycles, builders work costs associated with plant installation and removal, and the costs to make connection to the TRN
• Indicative annual savings have been provided for year one. Annual savings
after this time are likely to increase, however figures have not been provided at this stage due to volatility of the energy market
When setting out the energy tariffs and their breakdown, and attempting to predict the inflation rates that will apply to these energy tariffs in what is quite a volatile market, WSP has sought to engage with market experts. This engagement has included reference to detailed energy price projection models and accompanying reports produced by the Institute for Sustainable Futures, and drawing on in–house specialists with extensive energy procurement experience.
The energy tariffs and their projections outlined have been developed to begin the discussions around the potential business case for a TRN connection. It is expected that as part of preparing a detailed proposal for connection with the City of Sydney/Cogent Energy, the individual building owner’s current energy costs and existing energy supply agreements will be known and factored correctly into the development of the business case.
THERMAL RETICULATION NETWORK BACKGROUND INFORMATION
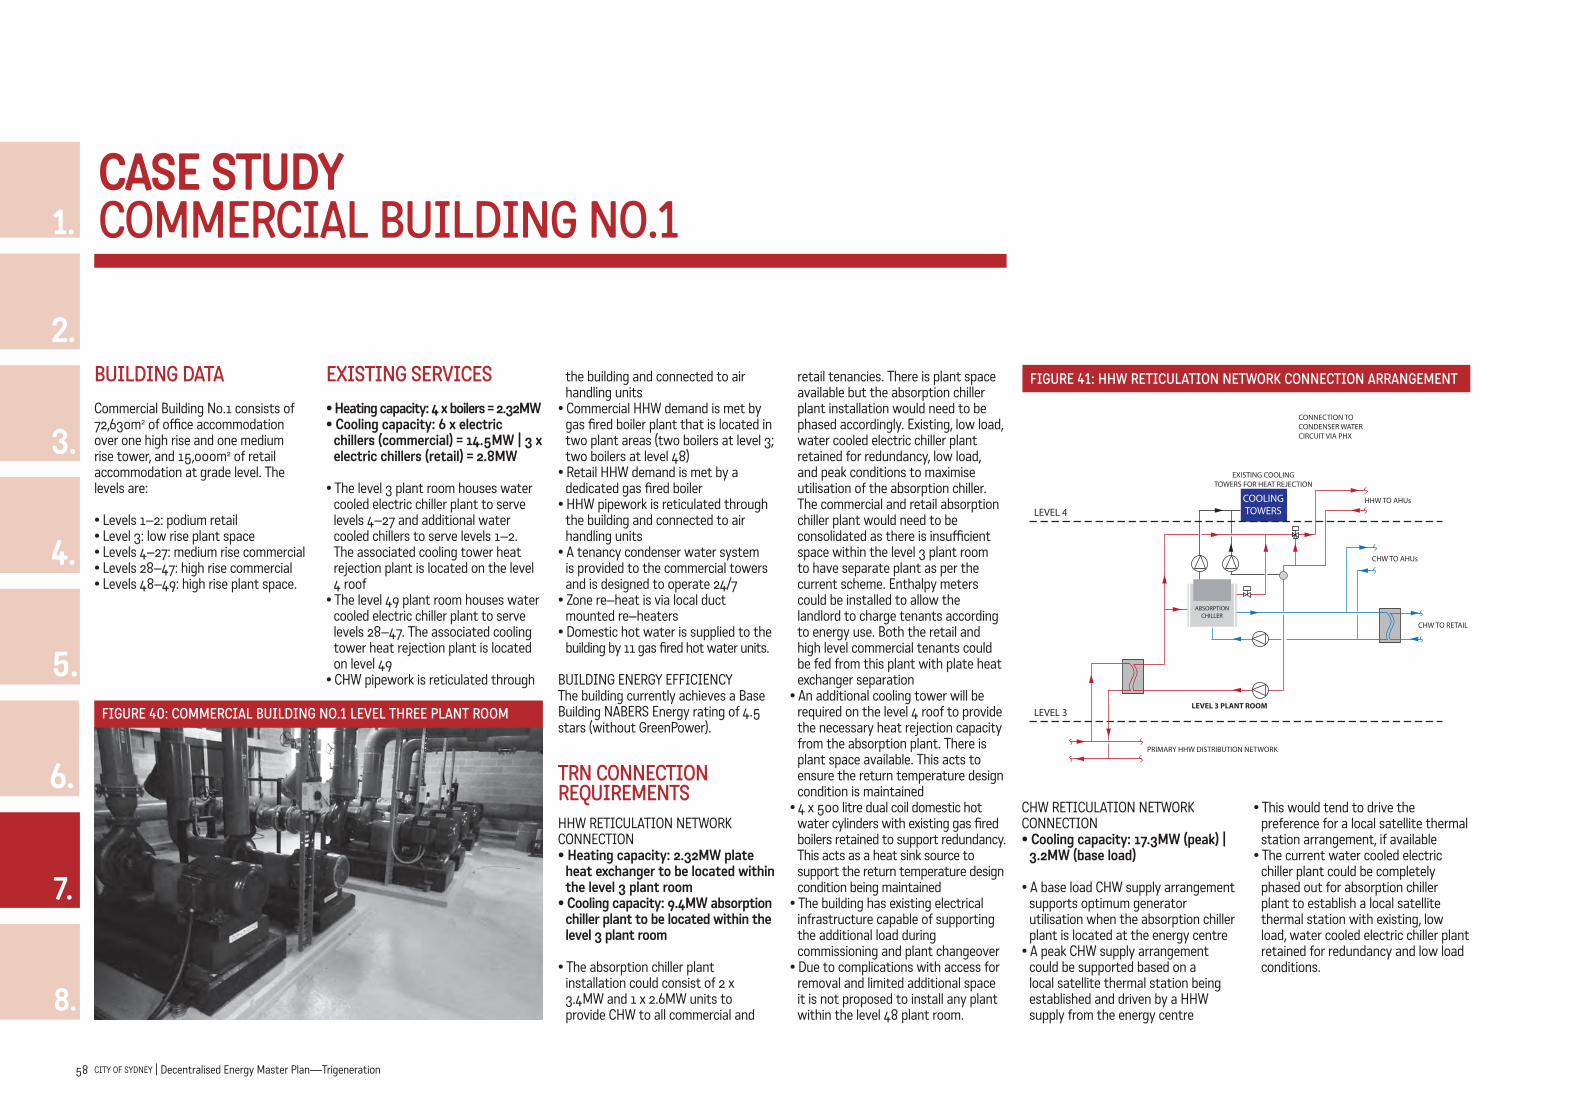
58 City of Sydney | decentralised energy Master Plan—trigeneration
1.
2.
3.
4.
5.
6.
8.
7.
buiLding daTaCommercial Building No.1 consists of 72,630m2 of office accommodation over one high rise and one medium rise tower, and 15,000m2 of retail accommodation at grade level. The levels are:
• Levels 1–2: podium retail• Level 3: low rise plant space• Levels 4–27: medium rise commercial• Levels 28–47: high rise commercial• Levels 48–49: high rise plant space.
exisTing serViCes • Heating capacity: 4 x boilers = 2.32MW• Cooling capacity: 6 x electric
chillers (commercial) = 14.5MW | 3 x electric chillers (retail) = 2.8MW
• The level 3 plant room houses water cooled electric chiller plant to serve levels 4–27 and additional water cooled chillers to serve levels 1–2. The associated cooling tower heat rejection plant is located on the level 4 roof
• The level 49 plant room houses water cooled electric chiller plant to serve levels 28–47. The associated cooling tower heat rejection plant is located on level 49
• CHW pipework is reticulated through
the building and connected to air handling units
• Commercial HHW demand is met by gas fired boiler plant that is located in two plant areas (two boilers at level 3; two boilers at level 48)
• Retail HHW demand is met by a dedicated gas fired boiler
• HHW pipework is reticulated through the building and connected to air handling units
• A tenancy condenser water system is provided to the commercial towers and is designed to operate 24/7
• Zone re–heat is via local duct mounted re–heaters
• Domestic hot water is supplied to the building by 11 gas fired hot water units.
BUILDING ENERGY EFFICIENCYThe building currently achieves a Base Building NABERS Energy rating of 4.5 stars (without GreenPower).
Trn ConneCTion reQuireMenTsHHW RETICULATION NETWORK CONNECTION• Heating capacity: 2.32MW plate
heat exchanger to be located within the level 3 plant room
• Cooling capacity: 9.4MW absorption chiller plant to be located within the level 3 plant room
• The absorption chiller plant installation could consist of 2 x 3.4MW and 1 x 2.6MW units to provide CHW to all commercial and
retail tenancies. There is plant space available but the absorption chiller plant installation would need to be phased accordingly. Existing, low load, water cooled electric chiller plant retained for redundancy, low load, and peak conditions to maximise utilisation of the absorption chiller. The commercial and retail absorption chiller plant would need to be consolidated as there is insufficient space within the level 3 plant room to have separate plant as per the current scheme. Enthalpy meters could be installed to allow the landlord to charge tenants according to energy use. Both the retail and high level commercial tenants could be fed from this plant with plate heat exchanger separation
• An additional cooling tower will be required on the level 4 roof to provide the necessary heat rejection capacity from the absorption plant. There is plant space available. This acts to ensure the return temperature design condition is maintained
• 4 x 500 litre dual coil domestic hot water cylinders with existing gas fired boilers retained to support redundancy. This acts as a heat sink source to support the return temperature design condition being maintained
• The building has existing electrical infrastructure capable of supporting the additional load during commissioning and plant changeover
• Due to complications with access for removal and limited additional space it is not proposed to install any plant within the level 48 plant room.
CHW RETICULATION NETWORK CONNECTION• Cooling capacity: 17.3MW (peak) |
3.2MW (base load)
• A base load CHW supply arrangement supports optimum generator utilisation when the absorption chiller plant is located at the energy centre
• A peak CHW supply arrangement could be supported based on a local satellite thermal station being established and driven by a HHW supply from the energy centre
• This would tend to drive the preference for a local satellite thermal station arrangement, if available
• The current water cooled electric chiller plant could be completely phased out for absorption chiller plant to establish a local satellite thermal station with existing, low load, water cooled electric chiller plant retained for redundancy and low load conditions.
CASe STUDY CoMMerCiaL buiLding no.1
LEVEL 3 PLANT ROOM
COOLINGTOWERS
ABSORPTIONCHILLER
CHW TO AHUs
HHW TO AHUs
EXISTING COOLINGTOWERS FOR HEAT REJECTION
CHW TO RETAIL
LEVEL 4
LEVEL 3
CONNECTION TO CONDENSER WATER CIRCUIT VIA PHX
PRIMARY HHW DISTRIBUTION NETWORK
Figure 41: hhW reTiCuLaTion neTWorK ConneCTion arrangeMenT
Figure 40: CoMMerCiaL buiLding no.1 LeVeL Three PLanT rooM

59City of Sydney | decentralised energy Master Plan—trigeneration
3 THe DeCenTRALiSeD eneRgY neTWoRK
2 Re–THinKing THe URBAn FoRM
4 5
PeRFoRMAnCe
oUTSiDe THe neTWoRK
1 TRigeneRATion
6 enABLing THe MASTeR PLAn
7 CASe STUDieS
8 gAS FeASiBiLiTY STUDY
7 CASe STUDieS
CaPex and beneFiTsTwo TRN connection options were investigated (HHW and CHW to supply the peak demand). The CAPEx estimates defined below exclude asset replacement cycles, builders work costs associated with plant installation and removal, and the costs to make connection to the TRN
• HHW CAPEx of $4.9M (relatively lower HHW supply tariff)—This includes: absorption chiller plant ($2.3M), cooling tower, pumps, heat exchangers, pipework including all associated valves and connections, controls and electrical connections to plant and equipment
• CHW to supply peak demand CAPEx of $470,000 (relatively higher CHW supply tariff)—This includes: pumps, heat exchangers, pipework including all associated valves and connections, controls and electrical connections to plant and equipment.
Provided the redundant electric chiller plant is disconnected and removed, the combined annual electricity network charge and gas (HHW connection only) savings in year 1 are:• HHW – $215,000• CHW to supply peak
demand—$210,000
Note: Savings will likely escalate over time; however these have not been presented due to market volatility
Whilst the CAPEx of a CHW reticulation network connection is lower than that of HHW reticulation network connection, this would be offset by higher CHW supply tariffs due to the pass through costs associated with installing absorption chiller plant in the energy centres and distributing larger diameter CHW reticulation pipework in roads and other public domain areas.
In addition to the NABERS Energy rating uplift stated in Table 12, should a low carbon electricity supply be sought
from a trigeneration energy centre, this could have the potential to deliver a conditional uplift of 1 star above what has been defined for a TRN connection.
WHEN TO CONNECT
The primary driver for a TRN connection is establishing a local satellite thermal station at Commercial Building No.1 as this will deliver the greatest financial contribution from the City of Sydney to the host building, incentivising the building owner to connect to a TRN due to a lower CAPEx requirement associated with acting as the host building (see BACKGROUND INFORMATION, HOSTING A LOCAL SATELLITE THERMAL STATION).
The building offers sufficient plant space to host a local satellite thermal station based on the current water cooled electric chiller plant being completely phased out for absorption chiller plant and a HHW reticulation network connection being established.
The NABERS Energy rating uplift and GHG emissions savings benefits are maximised when all the building’s peak CHW demand is met.
FURTHER OPPORTUNITIES
Consolidation of the commercial and retail spaces, and the commercial and retail tenancies will drive the greatest benefits in terms of reduced electricity network charges, an uplift in the NABERS Energy rating and GHG emissions savings; enhancing commercial viability; and incentivising the City of Sydney/Cogent Energy to establish a local satellite thermal station at Commercial Building No.1.
TRN CONNECTIONGREENHOUSE GAS (GHG) EMISSIONS SAVINGS ASSOCIATED WITH A TRN CONNECTION
NABERS ENERGY RATING UPLIFT ASSOCIATED WITH TRN CONNECTION
HHW 2,000 tonnes CO2–e/year
28kg CO2–e/m2/year
22% savings in current GHG emissions
Uplift from 4.5 stars to 5 stars
CHW (peak) 2,040 tonnes CO2–e/year
28kg CO2–e/m2/year
23% savings in current GHG emissions
Uplift from 4.5 stars to 5 stars
TabLe 12: ghg eMissions saVings and assoCiaTed nabers energy raTing uPLiFT
CASe STUDY CoMMerCiaL buiLding no.1

60 City of Sydney | decentralised energy Master Plan—trigeneration
1.
2.
3.
4.
5.
6.
8.
7.
CASe STUDY CoMMerCiaL buiLding no.2
buiLding daTaCommercial Building No.2 consists of a commercial tower with a net lettable area of approximately 40,000m2. The levels are:
• Basement Level 3–Lower Ground: plant space and car parking
• Levels 1–24: commercial tower• Roof Plant Levels 1–3: plant space.
exisTing serViCes • Heating capacity: 3 x boilers =
2.79MW• Cooling capacity: 5 x electric
chillers = 7.1MW
• Basement level 2 houses the water cooled electric chiller plant, which supplies CHW to the building. The associated heat rejection plant is located on roof plant levels 2 and 3. CHW pipework is reticulated through the building and connected to air handling units
• HHW is supplied to the building by gas fired boiler plant located within the roof plant levels. HHW pipework is reticulated through the building and connected to air handling units
• A tenancy condenser water system is provided to all levels and is designed to operate 24/7
• A condenser water system provides heat rejection from on–floor packaged plant (tenancy systems)
• Zone re–heat is via local duct mounted re–heaters
• Domestic hot water is supplied to the building by four gas fired hot water units.
BUILDING ENERGY EFFICIENCYThe existing building currently achieves a Base Building NABERS Energy rating of 3.5 stars.
Trn ConneCTion reQuireMenTsHHW RETICULATION NETWORK CONNECTION• Heating capacity: 2.8MW plate
heat exchanger to be located within the basement plant room
• 3 x 1MW plate heat exchangers and associated pump sets to serve the building. A new primary header arrangement to facilitate connection and 2 x 275 litre dual coil domestic hot water cylinders for the supply of domestic hot water to the building are required
• Due to the limited access and egress routes to the basement water cooled electric chiller plant for plant replacement and the lack of additional plant space, it is not technically feasible to retrofit absorption chiller plant without severe disruption to the building’s operation. This work would need to be carried out as a complete refurbishment of the building. The plant and equipment fall under a long–term replacement cycle
• All of the building’s domestic hot water and space heating requirements will be met. This would be approximately 243MWh per year; with a peak load of 26kW for domestic hot water heating and 2,270kW for space heating. 1 x existing gas fired boiler within the roof plant room retained to provide redundancy and connected into the new dual coil domestic hot water cylinders. Should the HHW reticulation network
fail, domestic hot water could still be generated but the boiler would not be able to meet the peak load requirements.
CHW RETICULATION NETWORK CONNECTION• Cooling capacity: 7.1MW (peak) |
1.8MW (base load)
• A peak or base load CHW supply arrangement could be supported based on a local satellite thermal station being established in suitable proximity to the building
• The building’s existing CHW system
could be readily connected to a local CHW reticulation network. 4 x 2MW (peak) | | 1 x 2MW (base load) plate heat exchanger(s) and associated pump set(s) to be located within the basement plant room
• Existing, low load, water cooled electric chiller plant retained for redundancy and low load conditions. All other redundant chiller plant to be broken down and removed to provide plant space for plate heat exchanger(s) and associated pump set(s).
EXISTING BOILER PLANT
HHW TO AHUs
CONNECT DISTRICT HHW INTO PRIMARYHEADER
NEW PRIMARY HEADERINSTALLED WITH ONE BOILER RETAINED FOR REDUNDANCY
PRIMARY HHWDISTRIBUTIONNETWORK
BASEMENT
ROOF
Figure 43: hhW reTiCuLaTion neTWorK ConneCTion arrangeMenT
Figure 42: CoMMerCiaL buiLding no.2 baseMenT PLanT rooM

61City of Sydney | decentralised energy Master Plan—trigeneration
3 THe DeCenTRALiSeD eneRgY neTWoRK
2 Re–THinKing THe URBAn FoRM
4 5
PeRFoRMAnCe
oUTSiDe THe neTWoRK
1 TRigeneRATion
6 enABLing THe MASTeR PLAn
7 CASe STUDieS
8 gAS FeASiBiLiTY STUDY
7 CASe STUDieS
CaPex and beneFiTsThree TRN connection options were investigated (HHW, CHW to supply the peak demand and CHW to supply the base load demand). The CAPEx estimates include for pumps, heat exchangers, pipework including all associated valves and connections, controls and electrical connections to plant and equipment. Further, the CAPEx estimates defined below exclude asset replacement cycles, builders work costs associated with plant installation and removal, and the costs to make connection to the TRN
• HHW CAPEx breakdown of $86,000 (relatively lower HHW supply tariff)
• CHW to supply the peak demand
CAPEx of $180,000 (relatively higher CHW supply tariff)
• CHW to supply the base load demand CAPEx of $49,000 (relatively higher CHW supply tariff)
Provided the redundant electric chiller plant is disconnected and removed, the savings in year 1 are:
• HHW—$11,500 (gas savings only)• CHW to supply peak
demand—$116,000 (through avoidance of electricity network charges only)
• CHW to supply the base load demand —$42,000 (through avoidance of electricity network charges only)
Note: Savings will likely escalate over
time; however these have not been presented due to market volatility
In addition to the NABERS Energy rating uplift stated in Table 13, should a low carbon electricity supply be sought from a trigeneration energy centre, this could have the potential to deliver a conditional uplift of 1 star above what has been defined for a TRN connection.
WHEN TO CONNECT
The primary driver for a TRN connection is establishing a local satellite thermal station in suitable proximity to the building. The NABERS Energy rating uplift and GHG emissions savings benefits are maximised when all the building’s peak CHW demand is met.
FURTHER OPPORTUNITIES
To fully realise the benefits associated with a TRN connection, the building could be connected to both HHW and CHW reticulation networks. The building’s space and DHW heating, and comfort cooling requirements would then be fully met by the supply of zero carbon thermal energy.
CASe STUDYCoMMerCiaL buiLding no.2
TRN CONNECTIONGREENHOUSE GAS (GHG) EMISSIONS SAVINGS ASSOCIATED WITH A TRN CONNECTION
NABERS ENERGY RATING UPLIFT ASSOCIATED WITH TRN CONNECTION
HHW 68 tonnes CO2–e/year
2kg CO2–e/m2/year
1% savings in current GHG emissions
No rating change
CHW (peak) 1,125 tonnes CO2–e/year
28kg CO2–e/m2/year
16% savings in current GHG emissions
Uplift from 3.5 stars to 4 stars
CHW (base load) 407 tonnes CO2–e/year
10kg CO2–e/m2/year
6% savings in current GHG emissions
No rating change
TabLe 13: ghg eMissions saVings and assoCiaTed nabers energy raTing uPLiFT
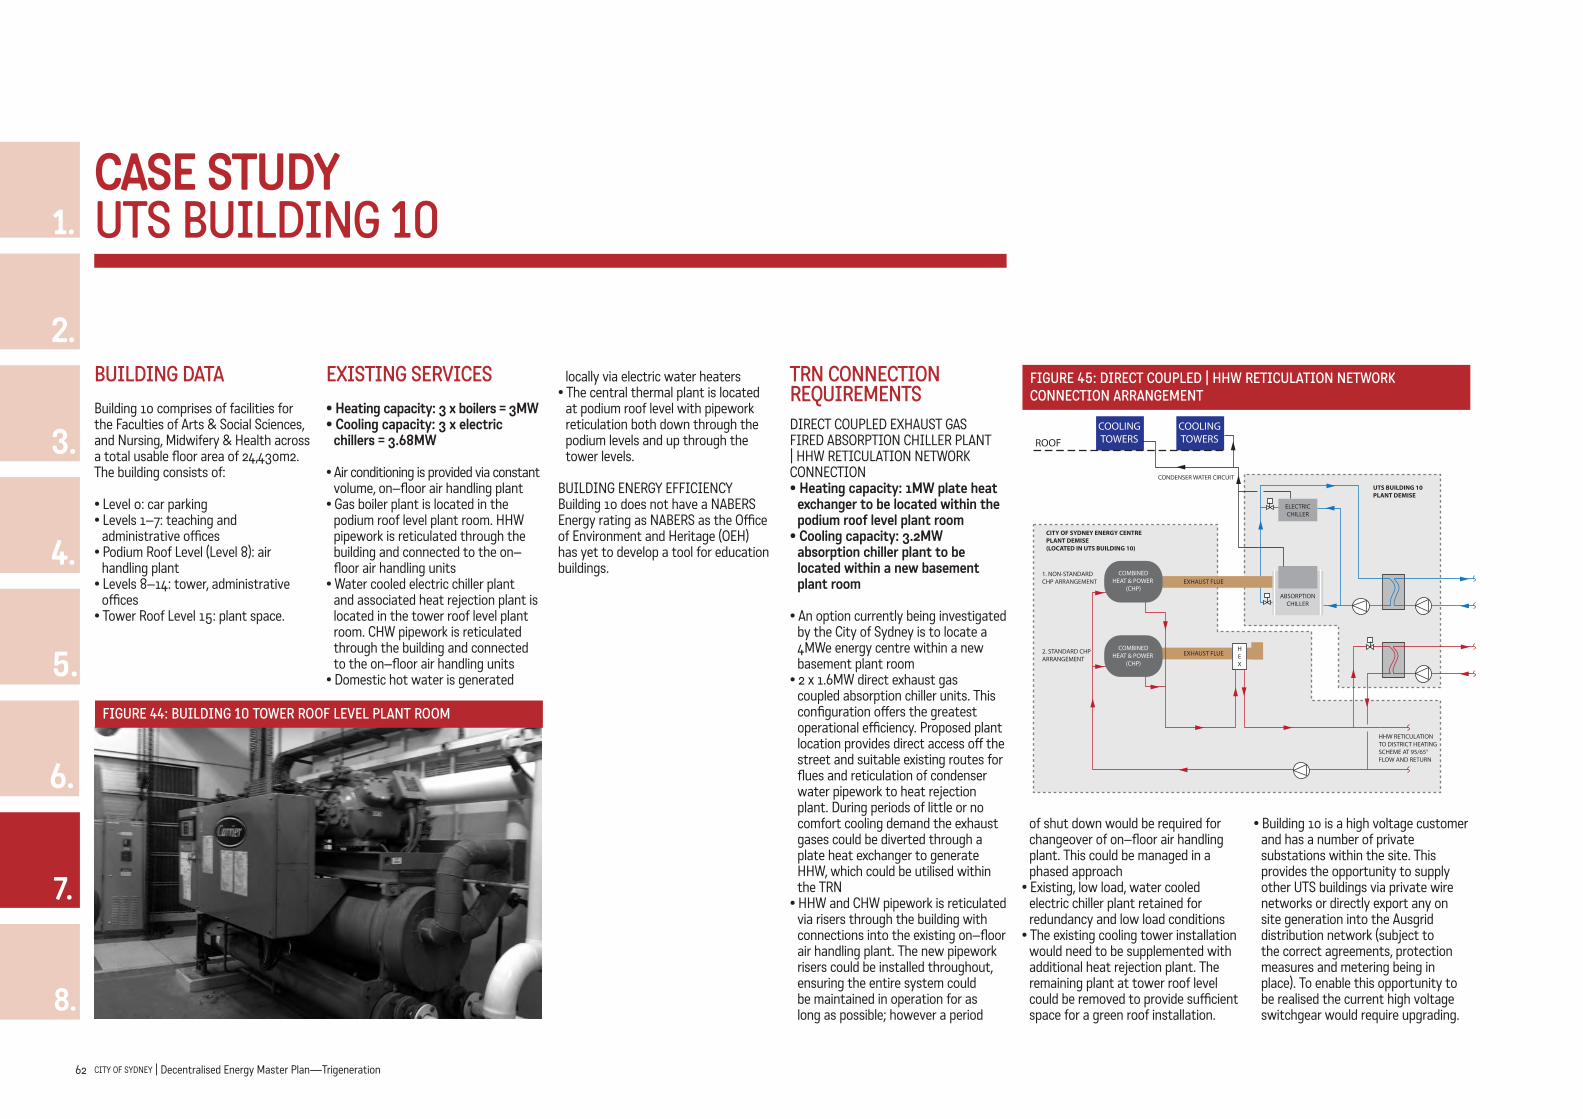
62 City of Sydney | decentralised energy Master Plan—trigeneration
1.
2.
3.
4.
5.
6.
8.
7.
CASe STUDY uTs buiLding 10
buiLding daTaBuilding 10 comprises of facilities for the Faculties of Arts & Social Sciences, and Nursing, Midwifery & Health across a total usable floor area of 24,430m2. The building consists of:
• Level 0: car parking• Levels 1–7: teaching and
administrative offices• Podium Roof Level (Level 8): air
handling plant• Levels 8–14: tower, administrative
offices• Tower Roof Level 15: plant space.
exisTing serViCes • Heating capacity: 3 x boilers = 3MW• Cooling capacity: 3 x electric
chillers = 3.68MW
• Air conditioning is provided via constant volume, on–floor air handling plant
• Gas boiler plant is located in the podium roof level plant room. HHW pipework is reticulated through the building and connected to the on–floor air handling units
• Water cooled electric chiller plant and associated heat rejection plant is located in the tower roof level plant room. CHW pipework is reticulated through the building and connected to the on–floor air handling units
• Domestic hot water is generated
locally via electric water heaters• The central thermal plant is located
at podium roof level with pipework reticulation both down through the podium levels and up through the tower levels.
BUILDING ENERGY EFFICIENCYBuilding 10 does not have a NABERS Energy rating as NABERS as the Office of Environment and Heritage (OEH) has yet to develop a tool for education buildings.
Trn ConneCTion reQuireMenTsDIRECT COUPLED ExHAUST GAS FIRED ABSORPTION CHILLER PLANT | HHW RETICULATION NETWORK CONNECTION • Heating capacity: 1MW plate heat
exchanger to be located within the podium roof level plant room
• Cooling capacity: 3.2MW absorption chiller plant to be located within a new basement plant room
• An option currently being investigated by the City of Sydney is to locate a 4MWe energy centre within a new basement plant room
• 2 x 1.6MW direct exhaust gas coupled absorption chiller units. This configuration offers the greatest operational efficiency. Proposed plant location provides direct access off the street and suitable existing routes for flues and reticulation of condenser water pipework to heat rejection plant. During periods of little or no comfort cooling demand the exhaust gases could be diverted through a plate heat exchanger to generate HHW, which could be utilised within the TRN
• HHW and CHW pipework is reticulated via risers through the building with connections into the existing on–floor air handling plant. The new pipework risers could be installed throughout, ensuring the entire system could be maintained in operation for as long as possible; however a period
of shut down would be required for changeover of on–floor air handling plant. This could be managed in a phased approach
• Existing, low load, water cooled electric chiller plant retained for redundancy and low load conditions
• The existing cooling tower installation would need to be supplemented with additional heat rejection plant. The remaining plant at tower roof level could be removed to provide sufficient space for a green roof installation.
• Building 10 is a high voltage customer and has a number of private substations within the site. This provides the opportunity to supply other UTS buildings via private wire networks or directly export any on site generation into the Ausgrid distribution network (subject to the correct agreements, protection measures and metering being in place). To enable this opportunity to be realised the current high voltage switchgear would require upgrading.
Figure 44: buiLding 10 ToWer rooF LeVeL PLanT rooM
Figure 45: direCT CouPLed | hhW reTiCuLaTion neTWorK ConneCTion arrangeMenT
EXHAUST FLUE
COOLINGTOWERS
COOLINGTOWERSROOF
ABSORPTIONCHILLER
ELECTRICCHILLER
UTS BUILDING 10PLANT DEMISE
CONDENSER WATER CIRCUIT
CITY OF SYDNEY ENERGY CENTREPLANT DEMISE (LOCATED IN UTS BUILDING 10)
1. NON-STANDARD CHP ARRANGEMENT
2. STANDARD CHP ARRANGEMENT
HHW RETICULATIONTO DISTRICT HEATING SCHEME AT 95/65° FLOW AND RETURN
HEX
COMBINEDHEAT & POWER
(CHP)
EXHAUST FLUECOMBINED
HEAT & POWER (CHP)

63City of Sydney | decentralised energy Master Plan—trigeneration
3 THe DeCenTRALiSeD eneRgY neTWoRK
2 Re–THinKing THe URBAn FoRM
4 5
PeRFoRMAnCe
oUTSiDe THe neTWoRK
1 TRigeneRATion
6 enABLing THe MASTeR PLAn
7 CASe STUDieS
8 gAS FeASiBiLiTY STUDY
CaPex and beneFiTsA HHW TRN connection has an estimated CAPEx of $1.6M. This CAPEx estimate includes for absorption chiller plant ($750,000), pumps, heat exchangers, pipework including all associated valves and connections, controls and electrical connections to plant and equipment. This CAPEx estimate excludes asset replacement cycles, builders work costs associated with plant installation and removal, and the costs to make connection to the TRN
The combined annual electricity network charge and gas savings will be $86,000 in year 1.
Note: Savings will likely escalate over time; however these have not been presented due to market volatility
WHEN TO CONNECTThe primary drivers for a TRN connection are the implementation of the City of Sydney’s proposals to construct and install a 4MWe energy centre in the basement of Building 10, and the ability to design in the connection requirements outlined based on the Building 10 refurbishment works currently under way.
FURTHER OPPORTUNITIES
UTS announced their City Campus Master Plan in May 2008. The new Faculty of Science (the Thomas Street building) is currently being designed and will be constructed to the east of Building 10. UTS’ intent is to share services, i.e. to facilitate connection of the Thomas Street building to the energy centre proposed at Building 10. This supports the ability of Building 10 and the Thomas Street building to share heat rejection plant and realise further efficiencies.
UTS’ City Campus and the adjacent precinct development, Central Park, being constructed by Frasers Property to the south could facilitate the development of over 10MWe of trigeneration system capacity (4MWe – UTS’ City Campus | 6MWe Central Park) for the proposed early stage Pyrmont Broadway trigeneration precinct. The interconnection of the two energy centres will begin to support the broader power and thermal energy demands of the proposed early stage precinct.
TRN CONNECTIONGREENHOUSE GAS (GHG) EMISSIONS SAVINGS ASSOCIATED WITH A TRN CONNECTION
NABERS ENERGY RATING UPLIFT ASSOCIATED WITH TRN CONNECTION
Direct Coupled | HHW 750 tonnes CO2–e/year
31kg CO2–e/m2/year
11% savings in current GHG emissions
Not applicable
CASe STUDY uTs buiLding 10
TabLe 14: ghg eMissions saVings and assoCiaTed nabers energy raTing uPLiFT

64 City of Sydney | decentralised energy Master Plan—trigeneration
1.
2.
3.
4.
5.
6.
8.
7.
CASe STUDY highgaTe
buiLding daTaHighgate is a high rise residential tower consisting of 204 residential units. The levels are:
• Levels 1–2: car park and plant space• Level 3: ground level• Level 4: swimming pool and spa• Level 5: car park• Levels 6–29: residential units• Level 30–31: roof level plant space.
exisTing serViCes • Heating Capacity: 4 x boilers =
1.74 MW and 2 x boilers = 0.13 MW• Cooling Capacity: 5 x cooling
towers = 2.12 MW
• Gas fired boiler plant located in roof level plant room
• Domestic hot water cylinders located in basement level plant room
• Gas fired boilers serve the swimming pool and spa
• Heat rejection plant located in roof level plant room
• Heating and cooling to each apartment is provided via packaged water cooled heat pump units within the ceiling void of each residential unit
• Condenser water pipework is reticulated through the building and connected to the packaged water cooled heat pump units. Heat is rejected from the condenser water system via roof mounted cooling towers. Heat is injected into the condenser water system via the boiler plant.
BUILDING ENERGY EFFICIENCYHighgate does not have a NABERS Energy rating as NABERS as the OEH has yet to develop a tool for apartment buildings.
DHW TOLEVELS 25-29
DHW TOLEVELS 5-24
TO SERVE SPA HEATING SYSTEM
TO SERVE SWIMMING POOLHEATING SYSTEM
VSD
BASEMENT
BUILDING
DISTRICT SYSTEMPRIMARY HHW FROM DISTRICT SYSTEM
LEAD BOILER FOR CENTRAL CONDENSER WATER SYSTEM
STANDARDBOILERCONNECTION(SBC)
SBC SBC SBC
A
Figure 46: highgaTe rooF LeVeL PLanT rooM
Figure 47: hhW reTiCuLaTion neTWorK ConneCTion arrangeMenTTrn ConneCTion reQuireMenTsHHW RETICULATION NETWORK CONNECTION• Heating capacity: 2 x primary
500 kW plate heat exchangers to be located within basement plant room
• 4 x 1,000 litre dual coil cylinders with an existing gas fired boiler within the roof level plant room retained to provide redundancy
• 2 x primary 500 kW plate heat exchangers and associated pump sets to support the space and DHW heating demand of the residential units and ancillary spaces
• 2 x secondary100 kW and 1 x secondary 40 kW plate heat exchangers and associated pump sets to meet the residential unit space and DHW heating, swimming pool and spa heating demands, respectively
• The works associated with stripping out and replacing the infrastructure associated with the packaged water cooled heat pump units throughout the building and within each residential unit are disruptive and complex works
• The existing packaged water cooled heat pump units are approaching the end–of–life and will require wholesale replacement within the next five years. This is currently being rolled out and approximately 10 residential units have had replacement water cooled units installed within the last two years.
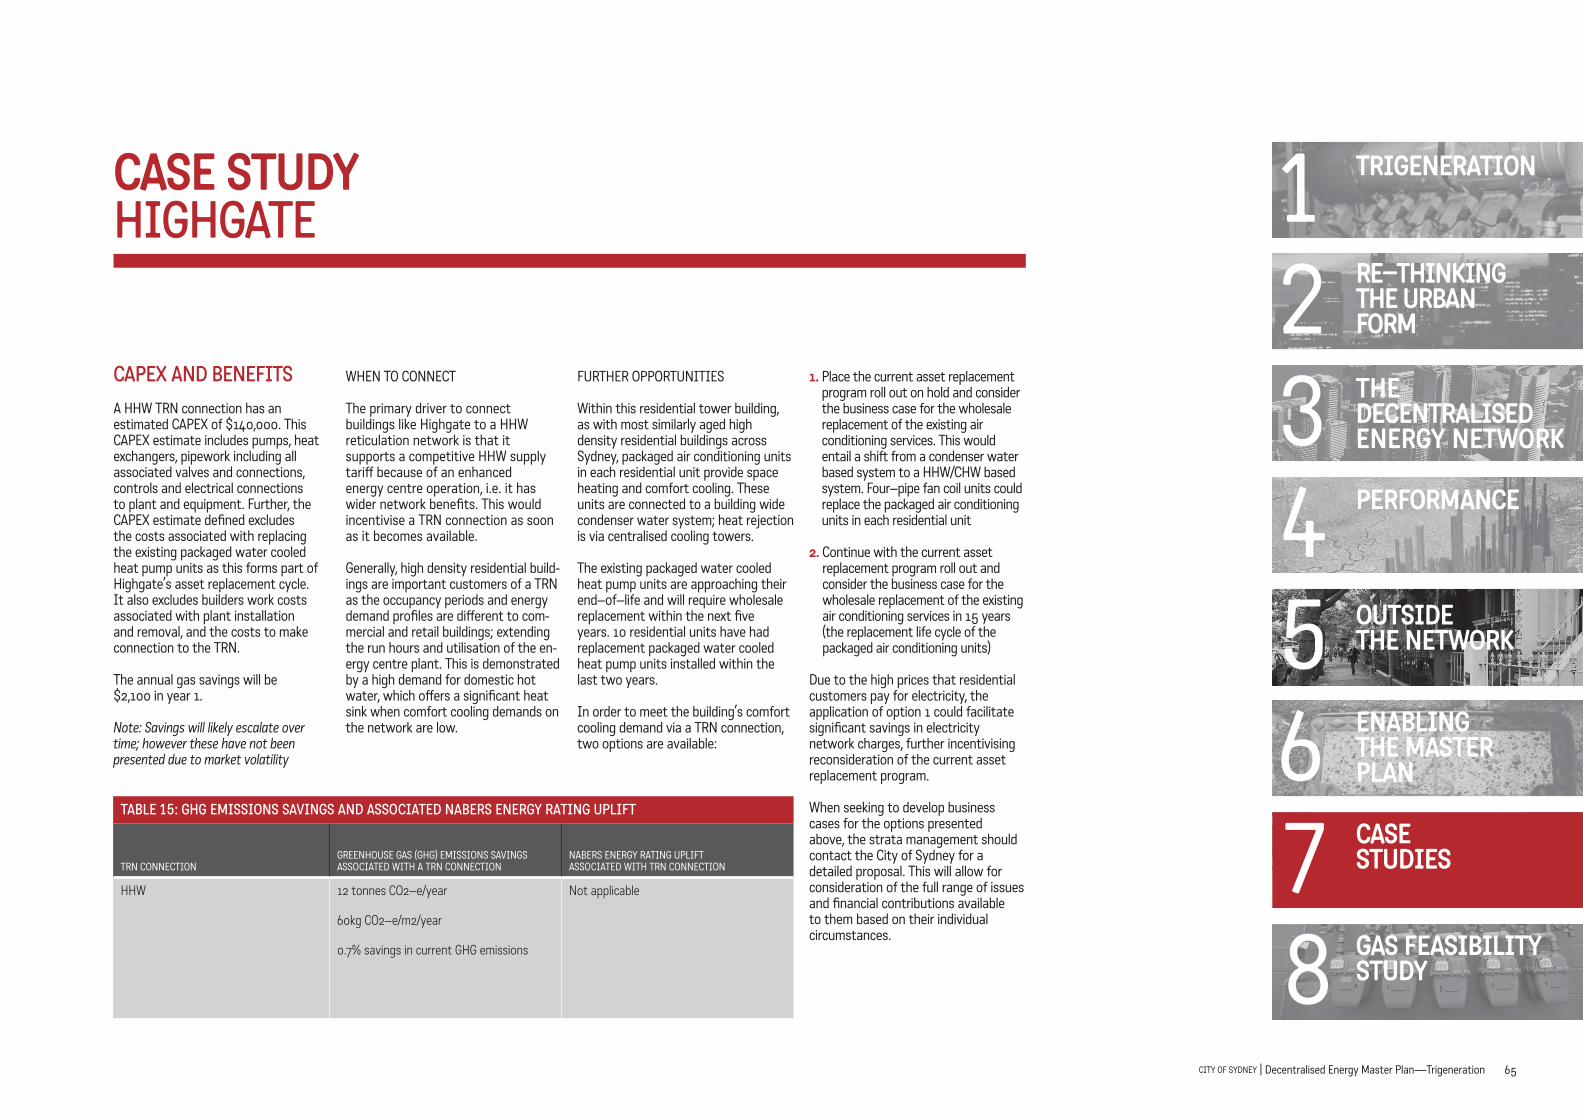
65City of Sydney | decentralised energy Master Plan—trigeneration
3 THe DeCenTRALiSeD eneRgY neTWoRK
2 Re–THinKing THe URBAn FoRM
4 5
PeRFoRMAnCe
oUTSiDe THe neTWoRK
1 TRigeneRATion
6 enABLing THe MASTeR PLAn
7 CASe STUDieS
8 gAS FeASiBiLiTY STUDY
7 CASe STUDieSTRN CONNECTION
GREENHOUSE GAS (GHG) EMISSIONS SAVINGS ASSOCIATED WITH A TRN CONNECTION
NABERS ENERGY RATING UPLIFT ASSOCIATED WITH TRN CONNECTION
HHW 12 tonnes CO2–e/year
60kg CO2–e/m2/year
0.7% savings in current GHG emissions
Not applicable
CaPex and beneFiTsA HHW TRN connection has an estimated CAPEx of $140,000. This CAPEx estimate includes pumps, heat exchangers, pipework including all associated valves and connections, controls and electrical connections to plant and equipment. Further, the CAPEx estimate defined excludes the costs associated with replacing the existing packaged water cooled heat pump units as this forms part of Highgate’s asset replacement cycle. It also excludes builders work costs associated with plant installation and removal, and the costs to make connection to the TRN.
The annual gas savings will be $2,100 in year 1.
Note: Savings will likely escalate over time; however these have not been presented due to market volatility
WHEN TO CONNECT
The primary driver to connect buildings like Highgate to a HHW reticulation network is that it supports a competitive HHW supply tariff because of an enhanced energy centre operation, i.e. it has wider network benefits. This would incentivise a TRN connection as soon as it becomes available.
Generally, high density residential build-ings are important customers of a TRN as the occupancy periods and energy demand profiles are different to com-mercial and retail buildings; extending the run hours and utilisation of the en-ergy centre plant. This is demonstrated by a high demand for domestic hot water, which offers a significant heat sink when comfort cooling demands on the network are low.
FURTHER OPPORTUNITIES
Within this residential tower building, as with most similarly aged high density residential buildings across Sydney, packaged air conditioning units in each residential unit provide space heating and comfort cooling. These units are connected to a building wide condenser water system; heat rejection is via centralised cooling towers.
The existing packaged water cooled heat pump units are approaching their end–of–life and will require wholesale replacement within the next five years. 10 residential units have had replacement packaged water cooled heat pump units installed within the last two years.
In order to meet the building’s comfort cooling demand via a TRN connection, two options are available:
1. Place the current asset replacement program roll out on hold and consider the business case for the wholesale replacement of the existing air conditioning services. This would entail a shift from a condenser water based system to a HHW/CHW based system. Four–pipe fan coil units could replace the packaged air conditioning units in each residential unit
2. Continue with the current asset replacement program roll out and consider the business case for the wholesale replacement of the existing air conditioning services in 15 years (the replacement life cycle of the packaged air conditioning units)
Due to the high prices that residential customers pay for electricity, the application of option 1 could facilitate significant savings in electricity network charges, further incentivising reconsideration of the current asset replacement program.
When seeking to develop business cases for the options presented above, the strata management should contact the City of Sydney for a detailed proposal. This will allow for consideration of the full range of issues and financial contributions available to them based on their individual circumstances.
TabLe 15: ghg eMissions saVings and assoCiaTed nabers energy raTing uPLiFT
CASe STUDY highgaTe

66 City of Sydney | decentralised energy Master Plan—trigeneration
1.
2.
3.
4.
5.
6.
8.
7.
CASe STUDY broadWay shoPPing CenTre
buiLding daTaThis retail mall comprises of three buildings with differing levels of interconnectivity, including general administrative and facility management offices, retail units and food court across a gross lettable area of 49,600m2. The building generally consists of:
• Retail and facility management offices
• Main shopping centre: car parking, retail units, public house and food court
• North building: car parking, retail units and cinema.
exisTing serViCes • Cooling capacity: 3 x electric
chillers = 2.6MW and 1 x low load electric chiller = 0.8MW
• The base building water cooled electric chiller plant and heat rejection plant provide cooling to the on–floor air handling units, which serve the common areas of the shopping centre
• The anchor stores (including Hoyts, Bi–Lo, Coles, Kmart and the public house) are serviced by their own standalone heat rejection plant
• Domestic hot water for the public toilet facilities and food court is generated locally via instantaneous electric water heaters
• Zone re–heat is via local electric
duct mounted re–heaters; No gas fired boiler plant based on this arrangement, i.e. all electric base building services arrangement
• Standalone tenant systems are complex and serve a variety of comfort cooling and refrigeration applications.
BUILDING ENERGY EFFICIENCYThe building currently does not have a Base Building NABERS Energy rating. An assumption based on 49,600m2 of GLAR (total shopping centre floor area) with 30% of this space dedicated to car park (of which 30% is naturally ventilated) results in an estimated Base Building NABERS Energy rating of 3 Stars. This is based on an all electric base building services arrangement.
Trn ConneCTion reQuireMenTsHHW RETICULATION NETWORK CONNECTION• Heating capacity: 4 x 1MW plate
heat exchanger• Cooling capacity: 1 x 2.6MW
absorption chiller and supplementary heat rejection plant to be located within the main shopping centre roof plant room
• The 4MW heat exchanger services the connection between the TRN and the building to support the base building heating and cooling, and centralised DHW application
PRIMARY HHWDISTRIBUTION
COOLINGTOWERS
COOLINGTOWERS
ABSORPTIONCHILLER
CWW
TO
AH
Us
HH
W T
O A
HU
s
DH
W T
O F
OO
D C
OU
RT
NEW CENTRALISED DHWDUAL COIL CYLINDERS
BACK UPGAS FIRED
BOILER
CONNECTION TO CONDENSER WATERCIRCUIT VIA PHX
Figure 48: Main shoPPing CenTre rooF PLanT rooM
Figure 49: hhW reTiCuLaTion neTWorK ConneCTion arrangeMenT
• Absorption chiller plant to supply CHW to the base building systems
• Centralise the domestic hot water demand for the public toilet facilities and food court. 4 x 1,000 litre dual coil domestic hot water cylinders would be required to meet the domestic hot water demand of the public toilet facilities and food court; however more detailed information is required on the number of meals served to correctly size this provision
• Dual coil domestic hot water cylinders to be located within the main shopping centre roof plant room and pipework reticulated to each point of use within the food court which currently accommodates 28 different food outlets
• Broadway Shopping Centre is an HV customer, and there is sufficient existing infrastructure capable of supporting the additional load during any commissioning and changeover to new plant.
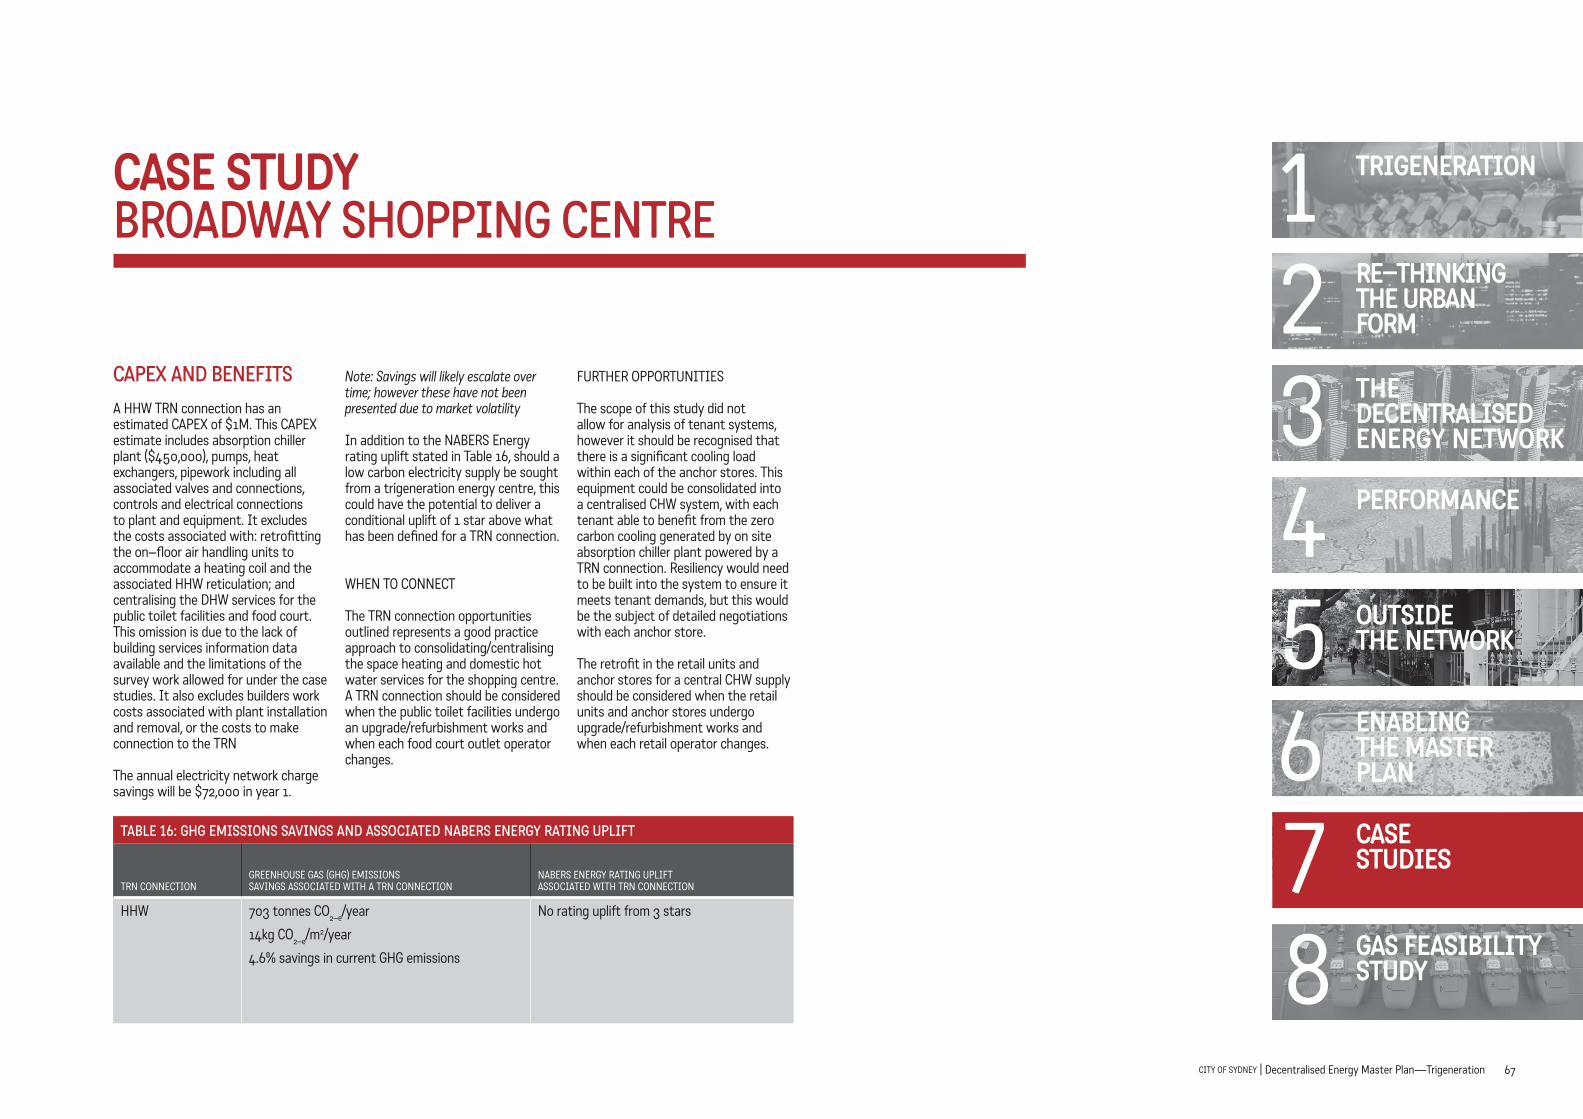
67City of Sydney | decentralised energy Master Plan—trigeneration
3 THe DeCenTRALiSeD eneRgY neTWoRK
2 Re–THinKing THe URBAn FoRM
4 5
PeRFoRMAnCe
oUTSiDe THe neTWoRK
1 TRigeneRATion
6 enABLing THe MASTeR PLAn
7 CASe STUDieS
8 gAS FeASiBiLiTY STUDY
7 CASe STUDieS
CASe STUDY broadWay shoPPing CenTre
CaPex and beneFiTsA HHW TRN connection has an estimated CAPEx of $1M. This CAPEx estimate includes absorption chiller plant ($450,000), pumps, heat exchangers, pipework including all associated valves and connections, controls and electrical connections to plant and equipment. It excludes the costs associated with: retrofitting the on–floor air handling units to accommodate a heating coil and the associated HHW reticulation; and centralising the DHW services for the public toilet facilities and food court. This omission is due to the lack of building services information data available and the limitations of the survey work allowed for under the case studies. It also excludes builders work costs associated with plant installation and removal, or the costs to make connection to the TRN
The annual electricity network charge savings will be $72,000 in year 1.
Note: Savings will likely escalate over time; however these have not been presented due to market volatility
In addition to the NABERS Energy rating uplift stated in Table 16, should a low carbon electricity supply be sought from a trigeneration energy centre, this could have the potential to deliver a conditional uplift of 1 star above what has been defined for a TRN connection.
WHEN TO CONNECT
The TRN connection opportunities outlined represents a good practice approach to consolidating/centralising the space heating and domestic hot water services for the shopping centre. A TRN connection should be considered when the public toilet facilities undergo an upgrade/refurbishment works and when each food court outlet operator changes.
FURTHER OPPORTUNITIES
The scope of this study did not allow for analysis of tenant systems, however it should be recognised that there is a significant cooling load within each of the anchor stores. This equipment could be consolidated into a centralised CHW system, with each tenant able to benefit from the zero carbon cooling generated by on site absorption chiller plant powered by a TRN connection. Resiliency would need to be built into the system to ensure it meets tenant demands, but this would be the subject of detailed negotiations with each anchor store.
The retrofit in the retail units and anchor stores for a central CHW supply should be considered when the retail units and anchor stores undergo upgrade/refurbishment works and when each retail operator changes.
TRN CONNECTIONGREENHOUSE GAS (GHG) EMISSIONS SAVINGS ASSOCIATED WITH A TRN CONNECTION
NABERS ENERGY RATING UPLIFT ASSOCIATED WITH TRN CONNECTION
HHW 703 tonnes CO2–e/year
14kg CO2–e/m2/year
4.6% savings in current GHG emissions
No rating uplift from 3 stars
TabLe 16: ghg eMissions saVings and assoCiaTed nabers energy raTing uPLiFT

CITY OF SYDNEY | Decentralised Energy Master Plan—Trigeneration68
8. gAS FeASiBiLiTY STUDY

69City of Sydney | decentralised energy Master Plan—trigeneration
3 THe DeCenTRALiSeD eneRgY neTWoRK
2 Re–THinKing THe URBAn FoRM
4 5
PeRFoRMAnCe
oUTSiDe THe neTWoRK
1 TRigeneRATion
6 enABLing THe MASTeR PLAn
7 CASe STUDieS
8 gAS FeASiBiLiTY STUDY
THIS CHAPTER WAS PREPARED BY JEMENA AT THE REQUEST OF THE CITY OF SYDNEY The City of Sydney (CoS) has identified a desire to reduce greenhouse gas emissions by way of establishing large scale trigeneration systems throughout the CBD.
The Trigeneration master plan is being developed by City of Sydney using consultants Kinesis Pty Ltd to assess its feasibility. The City of Sydney has requested Jemena to provide indicative costs to supply sufficient gas supply capacity to meet demands of the proposed scheme on a staged basis to 2030. Kinesis has provided the proposed incremental load for four low carbon zones and identified the preferred locations for gas supply at a city block level.
The City of Sydney has proposed 14 sites for establishing large scale of trigeneration systems. There are four proposed sites in the CBD north, five in the CBD south, four in Pyrmont–Broadway and one in Green Square.
Sydney City has three levels of pressure system: Secondary Pressure (Operating Pressure 1050 kPa), Medium Pressure (Operating Pressure 210 kPa) and Low Pressure (Operating Pressure 7 kPa) networks. They are supplying residential, commercial and contract customers. Haberfield Primary Regulator Station (PRS), Tempe PRS and Mascot PRS are the main supply sources to the entire Sydney City network.
The current Secondary network has very limited capacity to supply the proposed Trigeneration sites.
Please note that all costs, contributions and charges in this report are indicative and non–binding
inTroduCTion
KeY ASSUMPTionS
• A total of 14 proposed Trigeneration sites have been divided into four zones such as Sydney CBD North (CBDN), Sydney CBD South (CBDS), Pyrmont–Broadway (PB) and Green Square (GS). The proposed peak loads and other inputs were provided by the City of Sydney as per Appendix 1.
• Winter Peak 2009 Primary network modelling was selected for the study and projected to year 2015, 2020, 2025 and 2030.
• The 2008 secondary winter model was projected based on ~2% BAU growth per annum in the Sydney.
• Each Trigeneration site operates 24 hour and supply comes from the Secondary network.
• All economic models are based on the loads for the 7 am to 10 pm operation.
TabLe 17: suMMary oF Four Case sCenarios For TrigeneraTion siTes
SCENARIO/TIMINGTOTAL MW INSTALLED
ACQ (PJ/PA)
MHQ (GJ/HR) ADEQUATE CAPACITY?
sCenario 12015
47 MW (10 siTes) 2.04 380 seCondary reinForCeMenT is reQuired
sCenario 22020
147 MW (13 siTes) 6.59 1,229 PriMary reinForCeMenT is reQuired
sCenario 32025
286 MW (14 siTes) 12.47 2,325 PriMary reinForCeMenT For sCenario 2
has suFFiCienT CaPaCiTy
sCenario 42030
372 MW(14 siTes) 17.22 3,211 PriMary reinForCeMenT For sCenario 2
has suFFiCienT CaPaCiTy

70 City of Sydney | decentralised energy Master Plan—trigeneration
1.
2.
3.
4.
5.
6.
7.
8.
sCenario 1 ALExANDRIA TO DARLINGTON SECONDARY MAIN AUGMENTATION The current city secondary network has insufficient capacity to supply Scenario 1.
Inter–connection of the secondary network will be required between Alexandria and Darlington. The majority of the 2.7 km lay of 200 mm Secondary Steel Main (1050 kPa) is in micro residential and commercial streets.
The selected route will need to cross four major road roads and cross the railway twice. The railway crossings have the potential to delay the inter–connection for 18 months whilst approvals are obtained.
Once the Alexandria and Darlington inter–connection has been completed, there is no other option of augmenting the secondary network to cater for significant increases in loads.
A desktop cost estimation is $6.0 M (±30%) to complete this inter–connection.
sCenario 2 HABERFIELD TO PYRMONT PRIMARY MAINS ExTENSION AND PRS
The city secondary network has insufficient capacity to supply Scenario 2, 3 and 4.
To meet the increased demands of scenario 2, 3 and 4 we will need to (in addition to Scenario 1) extend the Primary Main from Petersham into the City, install a Primary Regulation Station (PRS) and connect into the Secondary Network.
The selected route for the Primary Main will follow a parallel route to Parramatta Road into the city. This route will not would not require any special approvals or easements to be created.
The proposed location for the PRS assumed for this analysis is 14–26 Wattle Street. The City of Sydney recently proposed an alternative location for the PRS on the Wattle Street site of the City of Sydney Bay Street Depot. Jemena has conducted a preliminary review of this site and concluded that it is not likely to result in a material change to the estimate.
Key CosTing assuMPTions
The following assumptions have been considered when calculating the capital cost of the Haberfield to Pyrmont primary mains extension and PRS installation.
• Land Acquisition—City of Sydney will provide the land for the PRS
• Restoration Costs based on Council Rates and Jemena Costs
• Cost estimation based on Emu Plains Primary mains extension and Lane Cove PRS costs
• Preliminary route assessment identified limited opportunities for utilising City of Sydney parklands and West Link corridors
• Desktop Costing ± 50%
Key CosT sensiTiViTies The land acquisition costs have been excluded from our financial models, if land needs to be purchased by Jemena for the PRS it could add a further $7–10 M to Scenario 2.
Included in the current estimates are restoration costs of $4 M. This cost could range between $0–$4 M depending on council completing it own restoration.
An allowance of $100,000 for each trigeneration centre has been included in the current financial models, to cover the connection cost of each site. Depending on the final service and meter location this connection cost will vary.
CosT esTiMaTion
seCondary Main exTension SCENARIO 1Secondary Main Extension
$6.0 M (± 30%)
PriMary Main exTension SCENARIO 2Primary Main Extension $55.0 M*
PRS $10.9 M
ToTAL $66.8 M
* includes $4m in council restoration costs at $400/m2
SUPPLY STRATegY

71City of Sydney | decentralised energy Master Plan—trigeneration
3 THe DeCenTRALiSeD eneRgY neTWoRK
2 Re–THinKing THe URBAn FoRM
4 5
PeRFoRMAnCe
oUTSiDe THe neTWoRK
1 TRigeneRATion
6 enABLing THe MASTeR PLAn
7 CASe STUDieS
8 gAS FeASiBiLiTY STUDY
CoMMerCiaL anaLysisThe following commercial analysis has been based on current reference tariffs and the load scenarios provided be the City of Sydney and Kinesis.
The analysis determined the level of capital investment that Jemena Gas Networks can justify for each option and the level of capital contribution therefore required by Trigeneration Operator. The calculations are based on gas usage levels as specified for each scenario being underwritten by the government or a retailer at reference tariffs.
All costs and charges are in real 2011 dollars.
The costs, contributions and charges are indicative and non–binding.
oPTion 1This option assumes that all four scenarios go ahead at five yearly intervals. The networks revenues will need to be underwritten. These are in 2011–12 dollars.
For a commitment on gas usage covering only the first 10 years based on reference tariffs, an indicative contribution is estimated at $52m.
For a commitment on gas usage that covers the full 20 years (five years at each of the four scenarios), an indicative capital contribution is estimated at $25 million.
oPTion 2Option 2 includes a more conservative level of underwritten revenue than Option 1. The long term commitment for purchase of natural gas is capped at the 147 MW installed generation capacity in Scenario 2.
For a commitment on gas usage covering only the first 10 years (five years at Scenario 1 and five years at Scenario 2) based on reference tariffs, an indicative capital contribution is estimated at $52m.
For a commitment that covers the full 20 years (five years at Scenario 1 and 15 years at Scenario 2), the capital con-tribution is estimated at $37 million.
Note that if only Scenario 1 is required and there is a commitment to an indicative minimum payment of $2m per annum for 10 years then no capital contribution is required.
Key ConsTruCTion TiMeFraMesThe Alexandria and Darlington secondary main extension, may take 18 months for approval from RailCorp, and one year for construction. In order to achieve the completion date of March 2015 for Scenario 1, the project must commence around March 2013.
The Primary Main Extension will take an estimated 5.5 years for completion. In order to achieve the target completion date of March 2020 for Scenarios 2, 3 and 4, the project must commence around March 2014.

CITY OF SYDNEYDecentraliseD energy Master plan2010–2030