city of renton surface water design manual …
TRANSCRIPT

2017 City of Renton Surface Water Design Manual 12/12/2016
CITY OF RENTON
SURFACE WATER DESIGN MANUAL
REFERENCE 1
SURFACE WATER RUNOFF POLICY See Renton Municipal Code (RMC) Section 4-6-030
<http://www.codepublishing.com/WA/Renton/>
REFERENCE 2
ADOPTED CRITICAL DRAINAGE AREAS Does not apply to the City.
REFERENCE 3
OTHER ADOPTED AREA SPECIFIC DRAINAGE REQUIREMENTS Does not apply to the City.
REFERENCE 4
OTHER DRAINAGE RELATED REGULATIONS AND GUIDELINES 4-A GRADING CODE SOIL AMENDMENT STANDARD See Soil Amendment BMP in Appendix C of the City of Renton Surface Water Design Manual
4-B CLEARING AND GRADING SEASONAL LIMITATIONS See RMC Section 4-4-060
<http://www.codepublishing.com/WA/Renton/>.
4-C LANDSCAPE MANAGEMENT PLAN GUIDELINES Does not apply to the City.
CITY OF RENTON SURFACE WATER DESIGN MANUAL: REFERENCES 1, 2, 3, AND 4
12/12/2016 2017 City of Renton Surface Water Design Manual
4-D SHARED FACILITY MAINTENANCE RESPONSIBILITY GUIDANCE
Does not apply to the City.

2017 City of Renton Surface Water Design Manual 12/12/2016
CITY OF RENTON
SURFACE WATER DESIGN MANUAL
REFERENCE 5
WETLAND HYDROLOGY PROTECTION GUIDELINES ECOLOGY Guide Sheets 1 and 2: Stormwater Wetland Assessment Criteria
ECOLOGY Guide Sheets 3a, 3b and 3c: Wetland Protection Guidelines (Volumetric Analysis)
KING COUNTY ALTERNATIVE Guidelines for Protection from Adverse Impacts of Modified Runoff Quantity Discharged to Wetlands (Water Level Fluctuation Analysis)

REFERENCE 5: WETLAND HYDROLOGY PROTECTION GUIDELINES
12/12/2016 2017 City of Renton Surface Water Design Manual
( T h i s p a g e i n t e n t i o n a l l y l e f t b l a n k . )

CITY OF RENTON SURFACE WATER DESIGN MANUAL
2017 City of Renton Surface Water Design Manual 12/12/2016 Ref 5-1
REFERENCE 5 WETLAND HYDROLOGY PROTECTION GUIDELINES
These criteria and guidelines shall be applied when considering natural wetlands for structural or hydrologic modification for runoff quantity/quality control, or for impacts from upstream development.
Guide Sheets 1 and 2 and Information Needed to Apply the Guidelines, provided by WA Ecology and included here, describe criteria that would disqualify a natural wetland for modification, and conditions and limitations for those that would qualify for modification. Guide Sheets 3a, 3b and 3c, also provided by Ecology, describe methodology for a runoff volume analysis approach. The alternative approach, which appeared in the 2009 edition of the King County Surface Water Design Manual and was continued in the 2016 edition of the King County Surface Water Design Manual, describes the methodology for analysis based on water level fluctuations.
The selection of the appropriate approach to use will be determined on a case-by-case basis by CED review staff.
INFORMATION NEEDED TO APPLY THE GUIDELINES Excerpted from Ecology’s Stormwater Management Manual for Western Washington 2014, Volume I – Minimum Technical Requirements, p. D-15.
Each guide sheet requires collecting specific information. The following sections list the basic data needed for applying the Guide Sheets. As a start, obtain the relevant soil survey; the National Wetland Inventory for the watershed, topographic and land use maps, and the results of any local wetland inventory.
DATA NEEDED FOR GUIDE SHEET 1: CRITERIA FOR EXCLUDING WETLANDS AS PART OF A STORMWATER SYSTEM
1. Wetland category Ecology’s “Washington State Wetland Rating System for Western Washington,” available on-line at <http://www.ecy.wa.gov/programs/sea/wetlands/ratingsystems/index.html>.
2. Rare, threatened, or endangered species inhabiting the wetland.
3. Presence or absence of a breeding population of native amphibians. If amphibians are found in the wetland assume they are native unless you can demonstrate the only species present are nonnative.
DATA NEEDED FOR GUIDE SHEET 2: CRITERIA FOR INCLUDING WETLANDS AS PART OF A STORMWATER SYSTEM
1. Hydrologic modeling of the existing flows and predicted flows into the wetland.
2. A characterization of the changes to water quality coming into the wetland from the development.
3. Presence of breeding populations of native amphibian species.
4. Presence of fish species.

REFERENCE 5: WETLAND HYDROLOGY PROTECTION GUIDELINES
12/12/2016 2017 City of Renton Surface Water Design Manual Ref 5-2
DATA NEEDED FOR GUIDE SHEET 3B: PROTECTING WETLANDS FROM IMPACTS OF CHANGES IN WATER FLOWS
The WWHM user manual will have a modeling procedure for estimating water flows to wetlands1. Follow the modeling procedure in WWHM user manual to estimate flows and determine compliance with the wetland Criteria 1 and 2. The information needed to model water flows to a wetland in WWHM includes the following:
1. Location of the development project
4. Land use characteristics before and after development.
a) Soil Type
b) Surface Vegetation
c) Land slope
d) Land area (acres)
5. Land use characteristics between the development project area and the wetland.
1 Refer to MGS Flood user’s guide for modeling procedure with the MGS Flood software program

CITY OF RENTON SURFACE WATER DESIGN MANUAL
2017 City of Renton Surface Water Design Manual 12/12/2016 Ref 5-3
GUIDE SHEETS 1 AND 2: STORMWATER WETLAND ASSESSMENT CRITERIA Excerpted from Ecology’s Stormwater Management Manual for Western Washington 2014, Volume I – Minimum Technical Requirements, pp. D3–D4
Guide Sheet 1: Criteria that excludes wetlands from serving as a treatment, flow control, and/or an on-site BMP/facility
The following types of wetlands are not suitable as a treatment, flow control, and/or on-site BMPs/facilities. Engineering structural or hydrologic changes within the wetland itself to improve stormwater flows and water quality are not allowed. Do not increase or decrease the water regime in these wetlands beyond the limits set in Guide Sheet 3. Provide these wetlands with the maximum protection from urban impacts (see Guide Sheet 3, Wetland Protection Guidelines):
1. The wetland is currently a Category I wetland because of special conditions (forested, bog, estuarine, Natural Heritage, coastal lagoon).
2. The wetland provides a high level of many functions. These are Category I and II wetlands as determined by the Washington State Wetland Rating System of Western Washington.
3. The wetland provides habitat for threatened or endangered species. Determining whether or not the conserved species will be affected by the proposed project requires a careful analysis in relation to the anticipated habitat changes. Consult with the appropriate agencies with jurisdiction over the specific threatened or endangered species on the site.
If a wetland type listed above needs to be included in a stormwater system then this activity is considered an impact. It will be treated as any other impact, and will need to be mitigated according to the rules for wetland mitigation. Project proponents will have to demonstrate that they have done everything to avoid and minimize impacts before proceeding to compensatory mitigation.
The wetlands listed above cannot receive flows from a stormwater system unless the criteria in Guide Sheets 3B and 3C are met.
Guide Sheet 2: Criteria for including wetlands as a treatment, flow control, and/or on-site BMP/facility
A wetland can be physically or hydrologically altered to meet the requirements of a treatment, flow control, and/or on-site BMP/facility if ALL of the following criteria are met:
Modifications that alter the structure of a wetland or its soils will require permits. Existing functions and values that are lost would have to be compensated/replaced.
1. It is classified in Category IV in the “Washington State Wetland Rating System of Western Washington,” or a Category III wetland with a habitat score of 19 points or less.
2. You can demonstrate that there will be “no net loss” of functions and values of the wetland as a result of the structural or hydrologic modifications done to provide control of runoff and water quality. This includes the impacts from the machinery used for the construction. Heavy equipment can often damage the soil structure of a wetland. However, the functions and values of degraded wetlands may sometimes be increased by such alterations and thus would be self-mitigating. Functions and values that are not replaced on site will have to be mitigated elsewhere.
a) Modifications that alter the structure of a wetland or its soils will require permits. Check with the agency(ies) issuing the permits for the modification(s) to determine which method to use to establish “no net loss.”
b) A wetland will usually sustain fewer impacts if the required storage capacity can be met through a modification of the outlet rather than through raising the existing overflow.
3. The wetland does not contain a breeding population of any native amphibian species.

REFERENCE 5: WETLAND HYDROLOGY PROTECTION GUIDELINES
12/12/2016 2017 City of Renton Surface Water Design Manual Ref 5-4
4. The hydrologic functions of the wetland can be improved as outlined in questions 3, 4, and 5 of Chart 4 and questions 2, 3, and 4 of Chart 5 in the “Guide for Selecting Mitigation Sites Using a Watershed Approach,” (available here: <http://www.ecy.wa.gov/biblio/0906032.html>); or the wetland is part of a priority restoration plan that achieves restoration goals identified in a Shoreline Master Program or other local or regional watershed plan.
5. The wetland lies in the natural routing of the runoff, and the discharge follows the natural routing.

CITY OF RENTON SURFACE WATER DESIGN MANUAL
2017 City of Renton Surface Water Design Manual 12/12/2016 Ref 5-5
GUIDE SHEET 3: WETLAND PROTECTION GUIDELINES (VOLUMETRIC ANALYSIS) Excerpted from Ecology’s Stormwater Management Manual for Western Washington 2014, Volume I – Minimum Technical Requirements pp. D4–D9
This guide sheet provides information on ways to protect wetlands from changes to their ecological structure and functions that result from human alterations of the landscape. It also recommends management actions that can avoid or minimize deleterious changes to wetlands.
Although, this guide sheet is intended primarily for the protection of the wetlands listed in Guide Sheet 1; this guidance still should be applied, as practical, for wetlands listed in Guide Sheet 2 when they are modified to meet stormwater requirements.
Guide Sheet 3A: General guidelines for protecting functions and values of wetlands
1. Consult regulations issued under federal and state laws that govern the discharge of pollutants. Wetlands are classified as “Waters of the United States” and “Waters of the State” in Washington.
6. Maintain the wetland buffer required by local regulations.
7. Retain areas of native vegetation connecting the wetland and its buffer with nearby wetlands and other contiguous areas of native vegetation.
8. Avoid compaction of soil and introduction of exotic plant species during any work in a wetland.
9. Take measures to avoid general urban impacts (e. g., littering and vegetation destruction). Examples are protecting existing buffer zones; discouraging access, especially by vehicles, by plantings outside the wetland; and encouragement of stewardship by a homeowners' association.
10. Fences can be useful to restrict dogs and pedestrian access, but they also interfere with wildlife movements. Their use should be very carefully evaluated on the basis of the relative importance of intrusive impacts versus wildlife presence. Fences should generally not be installed when wildlife would be restricted and intrusion is relatively minor. They generally should be used when wildlife passage is not a major issue and the potential for intrusive impacts is high. When wildlife movements and intrusion are both issues, the circumstances will have to be weighed to make a decision about fencing.
11. If the wetland inlet will be modified for the stormwater management project, use a diffuse flow method (e.g., a level spreader swale per SWDM Section 6.2.6, or downspout dispersion systems per SWDM Appendix C, Section C.2.1) to discharge water into the wetland in order to prevent flow channelization.
Guide Sheet 3B: Protecting wetlands from impacts of changes in water flows
Protecting wetland plant and animal communities depends on maintaining the existing wetland’s hydroperiod. This means maintaining the annual fluctuations in water depth and its timing as closely as possible. The risk of impacts to functions and values increases as the changes in water regime deviate more from the existing conditions. These changes often result from development.
Hydrologic modeling is useful to measure or estimate the aspects of the hydroperiod under existing pre-project and anticipated post-project conditions. Post-project estimates of the water regime in a watershed and wetland hydroperiod must include the cumulative effect of all anticipated watershed and wetland modifications. Perform this assessment with the aid of a qualified hydrologist.
Provisions in these guidelines pertain to the full anticipated build-out of the wetland’s watershed as well as changes resulting from an individual development.
Unfortunately, attempts to modify and use the standard hydrologic models for describing the flow and fluctuations of water in a stormwater pond have failed to adequately model the hydrodynamics in

REFERENCE 5: WETLAND HYDROLOGY PROTECTION GUIDELINES
12/12/2016 2017 City of Renton Surface Water Design Manual Ref 5-6
wetlands. It is difficult, to estimate if stormwater discharges to a wetland will meet the criteria for protection developed by the Puget Sound Wetland and Stormwater Research Program. The criteria developed by that program apply only to depressional wetlands. They are not applicable to riverine, slope, or lake-fringe wetlands. Ecology does not have any hydrologic models available to characterize the hydrodynamics in these types of wetlands.
As a result, it is difficult to predict the direct impacts of changes in water flows resulting from a development. In the absence of hydrologic models that characterize all types of wetlands, criteria have to be set using information that is readily available. These criteria are based on risk to the resource rather than an actual understanding of impacts.
The following criteria will provide some protection for the valuable wetland types listed in Guide Sheet 1, but we cannot determine if they result in the complete protection of a wetland’s functions and values. The risk to wetland functions will increase as the water volumes into the wetland diverge from the pre-project conditions. The risk will be decreased if the divergence is smaller.
Use the Western Washington Hydrology Model (WWHM), or other models approved by Ecology, for estimating the increases or decreases in total flows (volume) into a wetland that can result from the development project. These total flows can be modeled for individual days or on a monthly basis. Compare the results from this modeling to the criterion below. WWHM 2012 will have the capability to compare these results with the criterion.
Criterion 1: Total volume of water into a wetland during a single precipitation event should not be more than 20% higher or lower than the pre-project volumes.
Modeling algorithm for Criterion 1
1. Daily Volumes can be calculated for each day over 50 years for Pre- and Post-project scenarios. Volumes are to be calculated at the inflow to the wetland or the upslope edge where surface runoff, interflow, and groundwater are assumed to enter.
12. Calculate the average of Daily Volume for each day for Pre- and Post-project scenarios. There will be 365 values for the Pre-project scenario and 365 for the Post-project.
Example calculation for each day in a year (e.g., April 1):
• If you use 50 years of precipitation data, there will be 50 values for April 1. Calculate the average of the 50, April 1, Daily Volumes for Pre- and Post-project scenarios.
• Compare the average Daily Volumes for Pre- versus Post-project scenarios for each day. The average Post-project Daily Volume for April 1 must be within +/- 20% of the Pre-project Daily Volume for April 1.
13. Check compliance with the 20% criterion for each day of year. Criterion 1 is met/passed if none of the 365 post-project daily volumes varies by more than 20% from the pre-project daily volume for that day.
Criterion 2: Total volume of water into a wetland on a monthly basis should not be more than 15% higher or lower than the pre-project volumes. This needs to be calculated based on the average precipitation for each month of the year. This criterion is especially important for the summer months when a development may reduce the monthly flows rather than increase them because of reduced infiltration and recharging of ground water.
Modeling algorithm for Criterion 2
1. Monthly Volumes can be calculated for each calendar month over 50 years for Pre- and Post-project scenarios. Volumes are to be calculated at the inflow to the wetland or the upslope edge where surface runoff, interflow, and groundwater are assumed to enter.
2. Calculate the average of Monthly Volume for each calendar month for Pre- and Post-project scenarios.
Example calculation for each calendar month in a year (e.g., April):

CITY OF RENTON SURFACE WATER DESIGN MANUAL
2017 City of Renton Surface Water Design Manual 12/12/2016 Ref 5-7
• If you use 50 years of precipitation data, there will be 50 values for the month of April. Calculate the average of the 50, April, Monthly Volumes for Pre- and Post-project scenarios.
• Compare the Monthly Volumes for Pre- versus Post-project scenarios. Post- project Monthly Volume for April must be within +/- 15% of the Pre- project Monthly Volume for April.
14. Check compliance with the 15% criterion for each calendar month of year. Criterion 2 is met/passed if none of the post-project Monthly Volume varies by more than 15% from the pre-project Monthly Volume for every month.
WWHM Modeling Assumption and Approach
Assumption – Flow components feeding the wetland under both Pre- and Post-project scenarios are assumed to be the sum of the surface, interflow, and ground water flows from the project site.
Approach – Assign the wetland a point of compliance #1 (POC) number such as POC1 downstream of the project area.
• Pre-project scenario – Connect all flow components to the wetland/POC1
o Pre-project Total Flows to POC1 = Surface + Interflow + Ground water
• Post-project scenario – Identify flows to the wetland/POC1.
a) Impervious surfaces send flows to wetland via (1) surface flow.
WWHM sub-flows to POC1 = Surface flow (+ Interflow default set in WWHM)
b) Pervious surfaces send flows to wetland via (1) surface, (2) interflow, and (3) ground.
WWHM sub-flows to POC1 = Surface + Interflow + Groundwater
c) Infiltrating facilities send flows to wetland via groundwater and surface overflows.
(1) Groundwater – Connect infiltrated water (Outlet 2) to groundwater component of the area between facility and wetland. Use Lateral Basin downstream of the infiltrating facility and connect Outlet 2 to the groundwater component of the Lateral Basin. If this area is the same area modeled in Step (b) above, use the Lateral Basin element in Step (b).
WWHM sub-flows to POC1 = infiltrated flows
(2) Surface Overflow – Connect the surface flow (Outlet 1) to wetland/POC1
WWHM sub-flows to POC1 = facility surface flows (Outlet 1)
o Post-project Total Flows to POC1 = Sum of flows in (a), (b), and (c).
If it is expected that the limits stated above could be exceeded, consider the following strategies to reduce the volume of surface flows:
• Reducing of the level of development by reducing the amount of impervious surface and/or increasing the retention of natural forest cover.
• Increasing infiltration through the use of LID BMPs and LID principles.
• Increasing storage capacity for surface runoff.
• Using selective runoff bypass around the wetland. Bypassed flow must still comply with other applicable stormwater requirements.
Monitoring – Modifications that alter the structure of a wetland or its soils will require permits. Conduct monitoring as required by local, state, or federal permits.

REFERENCE 5: WETLAND HYDROLOGY PROTECTION GUIDELINES
12/12/2016 2017 City of Renton Surface Water Design Manual Ref 5-8
Guide Sheet 3C: Guidelines for protecting wetlands from pollutants
Protecting a wetland from pollutants generated by a development should include the following measures:
1. Use effective erosion control at construction sites in the wetland's drainage catchment. Refer to SWDM Appendix D.
2. Institute a program of source control BMPs and minimize the pollutants that will enter storm runoff that drains to the wetland.
3. For wetlands the meet the criteria in Guide Sheet 1, provide a water quality facility to treat runoff entering the wetland.
If the wetland is a Category I wetland because of special conditions (forested, bog, estuarine, Natural Heritage, costal lagoon), the facility should include advanced ability to control nutrients.
CITY OF RENTON SURFACE WATER DESIGN MANUAL
2017 City of Renton Surface Water Design Manual 12/12/2016 Ref 5-9
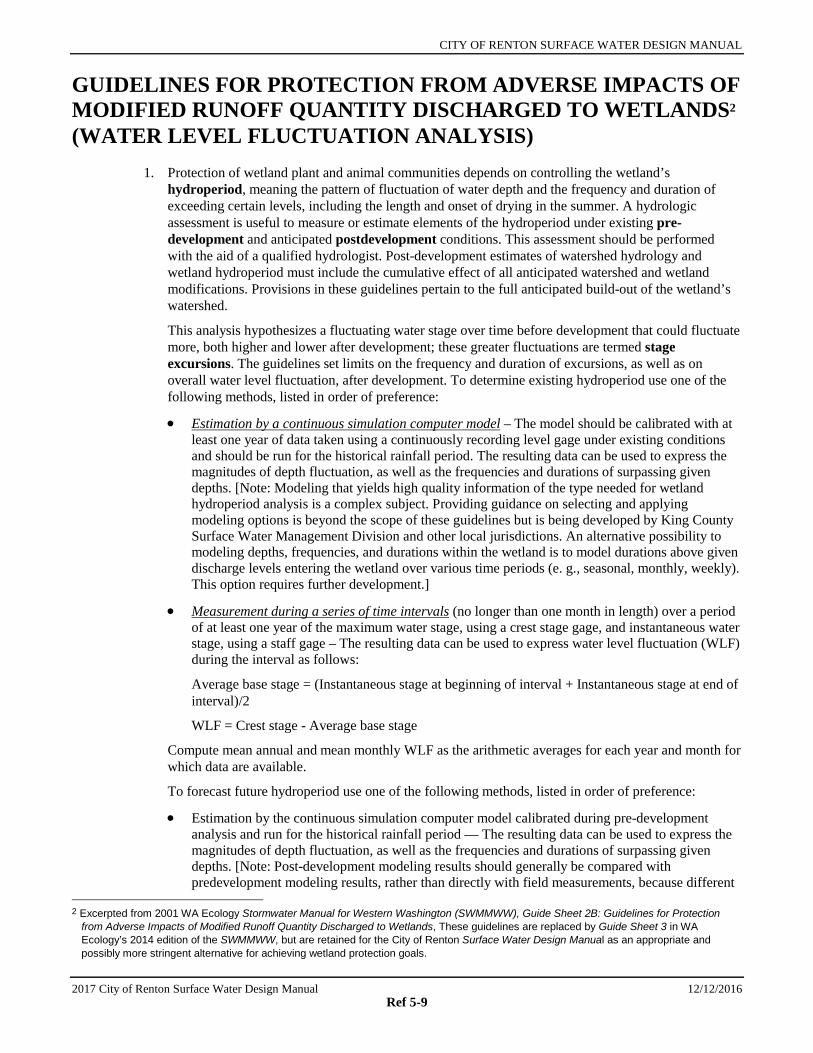
GUIDELINES FOR PROTECTION FROM ADVERSE IMPACTS OF MODIFIED RUNOFF QUANTITY DISCHARGED TO WETLANDS2 (WATER LEVEL FLUCTUATION ANALYSIS)
1. Protection of wetland plant and animal communities depends on controlling the wetland’s hydroperiod, meaning the pattern of fluctuation of water depth and the frequency and duration of exceeding certain levels, including the length and onset of drying in the summer. A hydrologic assessment is useful to measure or estimate elements of the hydroperiod under existing pre-development and anticipated postdevelopment conditions. This assessment should be performed with the aid of a qualified hydrologist. Post-development estimates of watershed hydrology and wetland hydroperiod must include the cumulative effect of all anticipated watershed and wetland modifications. Provisions in these guidelines pertain to the full anticipated build-out of the wetland’s watershed.
This analysis hypothesizes a fluctuating water stage over time before development that could fluctuate more, both higher and lower after development; these greater fluctuations are termed stage excursions. The guidelines set limits on the frequency and duration of excursions, as well as on overall water level fluctuation, after development. To determine existing hydroperiod use one of the following methods, listed in order of preference:
• Estimation by a continuous simulation computer model – The model should be calibrated with at least one year of data taken using a continuously recording level gage under existing conditions and should be run for the historical rainfall period. The resulting data can be used to express the magnitudes of depth fluctuation, as well as the frequencies and durations of surpassing given depths. [Note: Modeling that yields high quality information of the type needed for wetland hydroperiod analysis is a complex subject. Providing guidance on selecting and applying modeling options is beyond the scope of these guidelines but is being developed by King County Surface Water Management Division and other local jurisdictions. An alternative possibility to modeling depths, frequencies, and durations within the wetland is to model durations above given discharge levels entering the wetland over various time periods (e. g., seasonal, monthly, weekly). This option requires further development.]
• Measurement during a series of time intervals (no longer than one month in length) over a period of at least one year of the maximum water stage, using a crest stage gage, and instantaneous water stage, using a staff gage – The resulting data can be used to express water level fluctuation (WLF) during the interval as follows:
Average base stage = (Instantaneous stage at beginning of interval + Instantaneous stage at end of interval)/2
WLF = Crest stage - Average base stage
Compute mean annual and mean monthly WLF as the arithmetic averages for each year and month for which data are available.
To forecast future hydroperiod use one of the following methods, listed in order of preference:
• Estimation by the continuous simulation computer model calibrated during pre-development analysis and run for the historical rainfall period — The resulting data can be used to express the magnitudes of depth fluctuation, as well as the frequencies and durations of surpassing given depths. [Note: Post-development modeling results should generally be compared with predevelopment modeling results, rather than directly with field measurements, because different
2 Excerpted from 2001 WA Ecology Stormwater Manual for Western Washington (SWMMWW), Guide Sheet 2B: Guidelines for Protection
from Adverse Impacts of Modified Runoff Quantity Discharged to Wetlands, These guidelines are replaced by Guide Sheet 3 in WA Ecology’s 2014 edition of the SWMMWW, but are retained for the City of Renton Surface Water Design Manual as an appropriate and possibly more stringent alternative for achieving wetland protection goals.

REFERENCE 5: WETLAND HYDROLOGY PROTECTION GUIDELINES
12/12/2016 2017 City of Renton Surface Water Design Manual Ref 5-10
sets of assumptions underlie modeling and monitoring. Making pre- and post-development comparisons on the basis of common assumptions allows cancellation of errors inherent in the assumptions.]
• Estimation according to general relationships developed from the Puget Sound Wetlands and Stormwater Management Program Research Program, as follows (in part adapted from Chin 1996):
o Mean annual WLF is very likely (100% of cases measured) to be < 20 cm (8 inches or 0.7 ft) if total impervious area (TIA) cover in the watershed is < 6% (roughly corresponding to no more than 15% of the watershed converted to urban land use).
o Mean annual WLF is very likely (89% of cases measured) to be > 20 cm if TIA in the watershed is > 21% (roughly corresponding to more than 30% of the watershed converted to urban land use).
o Mean annual WLF is somewhat likely (50% of cases measured) to be > 30 cm (1.0 ft) if TIA in the watershed is > 21% (roughly corresponding to more than 30% of the watershed converted to urban land use).
o Mean annual WLF is likely (75% of cases measured) to be > 30 cm, and somewhat likely (50% of cases measured) to be 50 cm (20 inches or 1.6 ft) or higher, if TIA in the watershed is > 40% (roughly corresponding to more than 70% of the watershed converted to urban land use).
o The frequency of stage excursions greater than 15 cm (6 inches or 0.5 ft) above or below pre-development levels is somewhat likely (54% of cases measured) to be more than six per year if the mean annual WLF increases to > 24 cm (9.5 inches or 0.8 ft).
o The average duration of stage excursions greater than 15 cm above or below pre-development levels is likely (69% of cases measured) to be more than 72 hours if the mean annual WLF increases to > 20 cm.
15. The following hydroperiod limits characterize wetlands with relatively high vegetation species richness and apply to all zones within all wetlands over the entire year. If these limits are exceeded, then species richness is likely to decline. If the analysis described above forecasts exceedances, one or more of the management strategies listed in step 5 should be employed to attempt to stay within the limits.
• Mean annual WLF (and mean monthly WLF for every month of the year) does not exceed 20 cm. Vegetation species richness decrease is likely with: (1) a mean annual (and mean monthly) WLF increase of more than 5 cm (2 inches or 0.16 ft) if predevelopment mean annual (and mean monthly) WLF is greater than 15 cm, or (2) a mean annual (and mean monthly) WLF increase to 20 cm or more if pre-development mean annual (and mean monthly) WLF is 15 cm or less.
• The frequency of stage excursions of 15 cm above or below predevelopment stage does not exceed an annual average of six. Note: A short-term lagging or advancement of the continuous record of water levels is acceptable. The 15 cm limit applies to the temporary increase in maximum water surface elevations (hydrograph peaks) after storm events and the maximum decrease in water surface elevations (hydrograph valley bottoms) between events and during the dry season.
• The duration of stage excursions of 15 cm above or below predevelopment stage does not exceed 72 hours per excursion.
• The total dry period (when pools dry down to the soil surface everywhere in the wetland) does not increase or decrease by more than two weeks in any year.
• Alterations to watershed and wetland hydrology that may cause perennial wetlands to become vernal are avoided.

CITY OF RENTON SURFACE WATER DESIGN MANUAL
2017 City of Renton Surface Water Design Manual 12/12/2016 Ref 5-11
16. The following hydroperiod limit characterizes priority peat wetlands (bogs and fens as more specifically defined by the Washington Department of Ecology) and applies to all zones over the entire year. If this limit is exceeded, then characteristic bog or fen wetland vegetation is likely to decline. If the analysis described above forecasts exceedance, one or more of the management strategies listed in step 5 should be employed to attempt to stay within the limit.
• The duration of stage excursions above the predevelopment stage does not exceed 24 hours in any year.
• Note: To apply this guideline a continuous simulation computer model needs to be employed. The model should be calibrated with data taken under existing conditions at the wetland being analyzed and then used to forecast post- development duration of excursions.
17. The following hydroperiod limits characterize wetlands inhabited by breeding native amphibians and apply to breeding zones during the period 1 February through 31 May. If these limits are exceeded, then amphibian breeding success is likely to decline. If the analysis described above forecasts exceedances, one or more of the management strategies listed in step 5 should be employed to attempt to stay within the limits.
• The magnitude of stage excursions above or below the pre-development stage does not exceed 8 cm, and the total duration of these excursions does not exceed 24 hours in any 30-day period.
• Note: To apply this guideline a continuous simulation computer model needs to be employed. The model should be calibrated with data taken under existing conditions at the wetland being analyzed and then used to forecast post-development magnitude and duration of excursions.
18. If it is expected that the hydroperiod limits stated above could be exceeded, consider strategies such as:
• Reduction of the level of development;
• Increasing runoff infiltration [Note: Infiltration is prone to failure in many Puget Sound Basin locations with glacial till soils and generally requires pretreatment to avoid clogging. In other situations infiltrating urban runoff may contaminate groundwater. Consult the stormwater management manual adopted by the jurisdiction and carefully analyze infiltration according to its prescriptions.];
• Increasing runoff storage capacity; and
• Selective runoff bypass.
19. After development, monitor hydroperiod with a continuously recording level gauge or staff and crest stage gauges. If the applicable limits are exceeded, consider additional applications of the strategies in step 5 that may still be available. It is also recommended that goals be established to maintain key vegetation species, amphibians, or both, and that these species be monitored to determine if the goals are being met.

REFERENCE 5: WETLAND HYDROLOGY PROTECTION GUIDELINES
12/12/2016 2017 City of Renton Surface Water Design Manual Ref 5-12
( T h i s p a g e i n t e n t i o n a l l y l e f t b l a n k . )

2017 City of Renton Surface Water Design Manual 12/12/2016
CITY OF RENTON
SURFACE WATER DESIGN MANUAL
REFERENCE 6
HYDROLOGIC/HYDRAULIC DESIGN METHODS 6-A INFILTRATION RATE TEST METHODS
6-B POND GEOMETRY CALCULATIONS
6-C INTRODUCTION TO LEVEL POOL ROUTING
6-D SUPPLEMENTAL MODELING GUIDELINES

REFERENCE 6: HYDROLOGIC/HYDRAULIC DESIGN METHODS
12/12/2016 2017 City of Renton Surface Water Design Manual Ref 6-A-2
( T h i s p a g e i n t e n t i o n a l l y l e f t b l a n k . )

CITY OF RENTON SURFACE WATER DESIGN MANUAL
2017 City of Renton Surface Water Design Manual 12/12/2016 Ref 6-A-1
REFERENCE 6-A
INFILTRATION RATE TEST METHODS See the City of Renton Surface Water Design Manual (SWDM) Chapter 5 and Appendix C for applications and limitations for the use of the infiltration rate test methods below.
PILOT INFILTRATION TEST (PIT) Source: Stormwater Management Manual for Western Washington (SMMWW 2014)
In-situ infiltration measurements using the Pilot Infiltration Test (PIT) described below is the preferred method for estimating the measured (initial) saturated hydraulic conductivity (Ksat) of the soil profile beneath the proposed infiltration facility. The larger PIT reduces some of the scale errors associated with relatively small-scale double ring infiltrometer or “stove-pipe” infiltration tests. It is not a standard test but rather a practical field procedure recommended by Ecology’s Technical Advisory Committee.
LARGE-SCALE PILOT INFILTRATION TEST (PIT)
Infiltration Test
• Excavate the test pit to the estimated surface elevation of the proposed infiltration facility. Lay back the slopes sufficiently to avoid caving and erosion during the test. Alternatively, consider shoring the sides of the test pit.
• The horizontal surface area of the bottom of the test pit should be approximately 100 square feet. Accurately document the size and geometry of the test pit.
• Install a vertical measuring rod (minimum 5-ft. long) marked in half-inch increments in the center of the pit bottom.
• Use a rigid 6-inch diameter pipe with a splash plate on the bottom to convey water to the pit and reduce side-wall erosion or excessive disturbance of the pond bottom. Excessive erosion and bottom disturbance will result in clogging of the infiltration receptor and yield lower than actual infiltration rates.
• Add water to the pit at a rate that will maintain a water level between 6 and 12 inches above the bottom of the pit. A rotameter can be used to measure the flow rate into the pit.
Note: The depth should not exceed the proposed maximum depth of water expected in the completed facility. For infiltration facilities serving large drainage areas, designs with multiple feet of standing water can have infiltration tests with greater than 1 foot of standing water.
Every 15–30 min, record the cumulative volume and instantaneous flow rate in gallons per minute necessary to maintain the water level at the same point on the measuring rod.
Keep adding water to the pit until one hour after the flow rate into the pit has stabilized (constant flow rate; a goal of 5% variation or less variation in the total flow) while maintaining the same pond water level. The total of the pre-soak time plus one hour after the flow rate has stabilized should be no less than 6 hours.

REFERENCE 6: HYDROLOGIC/HYDRAULIC DESIGN METHODS
12/12/2016 2017 City of Renton Surface Water Design Manual Ref 6-A-2
• After the flow rate has stabilized for at least one hour, turn off the water and record the rate of infiltration (the drop rate of the standing water) in inches per hour from the measuring rod data, until the pit is empty. Consider running this falling head phase of the test several times to estimate the dependency of infiltration rate with head.
• At the conclusion of testing, over-excavate the pit to see if the test water is mounded on shallow restrictive layers or if it has continued to flow deep into the subsurface. The depth of excavation varies depending on soil type and depth to hydraulic restricting layer, and is determined by the engineer or certified soils professional. Mounding is an indication that a mounding analysis is necessary.
Data Analysis Calculate and record the saturated hydraulic conductivity rate in inches per hour in 30 minutes or one-hour increments until one hour after the flow has stabilized.
Note: Use statistical/trend analysis to obtain the hourly flow rate when the flow stabilizes. This would be the lowest hourly flow rate.
Apply appropriate correction factors to determine the site-specific design infiltration rate. See the discussion of correction factors for infiltration facilities in SWDM Section 5.4.1.
Example The area of the bottom of the test pit is 8.5 feet by 11.5 feet.
Water flow rate was measured and recorded at intervals ranging from 15 to 30 minutes throughout the test. Between 400 minutes and 1,000 minutes the flow rate stabilized between 10 and 12.5 gallons per minute or 600 to 750 gallons per hour, or an average of (9.8 + 12.3) / 2 = 11.1 inches per hour.
SMALL-SCALE PILOT INFILTRATION TEST (PIT) A smaller-scale PIT can be substituted for the large-scale PIT in any of the following instances.
• The drainage area to the infiltration site is less than 1 acre.
• The testing is for LID BMPs that serve small drainage areas and /or are widely dispersed throughout a project site.
• The site has a high infiltration rate, making a large-scale PIT difficult, and the site geotechnical investigation suggests uniform subsurface characteristics.
Infiltration Test
• Excavate the test pit to the estimated surface elevation of the proposed infiltration facility. In the case of bioretention, excavate to the estimated elevation at which the imported soil mix will lie on top of the underlying native soil. For trenches, excavate to the proposed bottom of the trench. For permeable pavements, excavate to the elevation at which the imported subgrade materials, or the pavement itself, will contact the underlying native soil. If the native soils (road subgrade) will have to meet a minimum subgrade compaction requirement, compact the native soil to that requirement prior to testing. Note that the permeable pavement design guidance recommends compaction not exceed 90%–92%. Finally, lay back the slopes sufficiently to avoid caving and erosion during the test. Alternatively, consider shoring the sides of the test pit.
• The horizontal surface area of the bottom of the test pit should be 12 to 32 square feet. It may be circular or rectangular, but accurately document the size and geometry of the test pit.
• Install a vertical measuring rod adequate to measure the ponded water depth and that is marked in half-inch increments in the center of the pit bottom.

REFERENCE 6-A: INFILTRATION RATE TEST METHODS
12/12/2016 2017 City of Renton Surface Water Design Manual Ref 6-A-3
• Use a rigid pipe with a splash plate on the bottom to convey water to the pit and reduce side-wall erosion or excessive disturbance of the pond bottom. Excessive erosion and bottom disturbance will result in clogging of the infiltration receptor and yield lower than actual infiltration rates. Use a 3-inch diameter pipe for pits on the smaller end of the recommended surface area, and a 4-inch pipe for pits on the larger end of the recommended surface area.
• Pre-soak period: Add water to the pit so that there is standing water for at least 6 hours. Maintain the pre-soak water level at least 12 inches above the bottom of the pit.
• At the end of the pre-soak period, add water to the pit at a rate that will maintain a 6-12 inch water level above the bottom of the pit over a full hour. The depth should not exceed the proposed maximum depth of water expected in the completed facility.
• Every 15 minutes, record the cumulative volume and instantaneous flow rate in gallons per minute necessary to maintain the water level at the same point (between 6 inches and 1 foot) on the measuring rod. The specific depth should be the same as the maximum designed ponding depth (usually 6–12 inches).
• After one hour, turn off the water and record the rate of infiltration (the drop rate of the standing water) in inches per hour from the measuring rod data, until the pit is empty.
• A self-logging pressure sensor may also be used to determine water depth and drain-down.
• At the conclusion of testing, over-excavate the pit to see if the test water is mounded on shallow restrictive layers or if it has continued to flow deep into the subsurface. The depth of excavation varies depending on soil type and depth to hydraulic restricting layer, and is determined by the engineer or certified soils professional. The soils professional should judge whether a mounding analysis is necessary.
Data Analysis See the explanation above under the guidance for the large-scale pilot infiltration test.

REFERENCE 6: HYDROLOGIC/HYDRAULIC DESIGN METHODS
12/12/2016 2017 City of Renton Surface Water Design Manual Ref 6-A-4
SINGLE-RING PERCOLATION TEST PROCEDURE (See SWDM Section 5.2 and Appendix C for limitations on the use of this procedure)
Preparation for Test A single ring made of steel or other durable material a minimum of 3 feet in diameter and a minimum of 6 inches high and an adequate supply of clear water is needed. Tests must be performed in undisturbed native soil in suitable locations to determine soil percolation rates for the proposed infiltration facility. The surface of the soil where the test is to be run must be accurately leveled and the ring imbedded and sealed in the soil to prevent water from running under the ring and onto the surface.
Soaking Period The ring shall be carefully filled with at least 6 inches of clear water. The depth of water should be maintained for at least 4 hours and preferably overnight if fine-grained soils are present. Automatic siphons or float valves may be employed to automatically maintain the water level during the soaking period. It is extremely important that the soil be allowed to soak for a sufficiently long period of time to allow the soil to swell if accurate results are to be obtained.
In sandy soils with little or no fines, soaking is not necessary. If, after filling the ring twice with 6 inches of water, the water seeps completely away in less than ten minutes, the test can proceed immediately.
Measurement of the Percolation Rate Except for sandy soils, percolation rate measurements are made 15 hours but no more than 30 hours after the soaking period began. The water level is adjusted to 6 inches above the soil surface and successive measurements are taken to determine the percolation rate. At no time during the test is the water level allowed to rise more than 6 inches above the soil surface.
Immediately after adjustment, the water level is measured from a fixed reference point to the nearest 1/16th inch at 30-minute intervals. The test is continued until two successive water level drops do not vary by more than 1/16 inch within a 90-minute period. After each measurement, the water level is readjusted to the 6-inch level. The last water level drop is used to calculate the percolation rate.
In sandy soils or soils in which the first 6-inch of water added after the soaking period seeps away in less than 30 minutes, water level measurements are made at 10-minute intervals for a 1-hour period. The last water level drop is used to calculate the percolation rate.
Calculation of the Percolation Rate The percolation rate is calculated for each test by dividing the time interval used between measurements by the magnitude of the last water level drop. This calculation results in a percolation rate in terms of minutes/inch. To determine the percolation rate for the area, the rates obtained from each hole are averaged.
Example: If the last measured drop in water level after 30 minutes is 5/8-inch, then:
Percolation rate = (30 minutes)/(5/8 inch) = 48 minutes/inch.
CITY OF RENTON SURFACE WATER DESIGN MANUAL
2017 City of Renton Surface Water Design Manual 12/12/2016 Ref 6-B-1
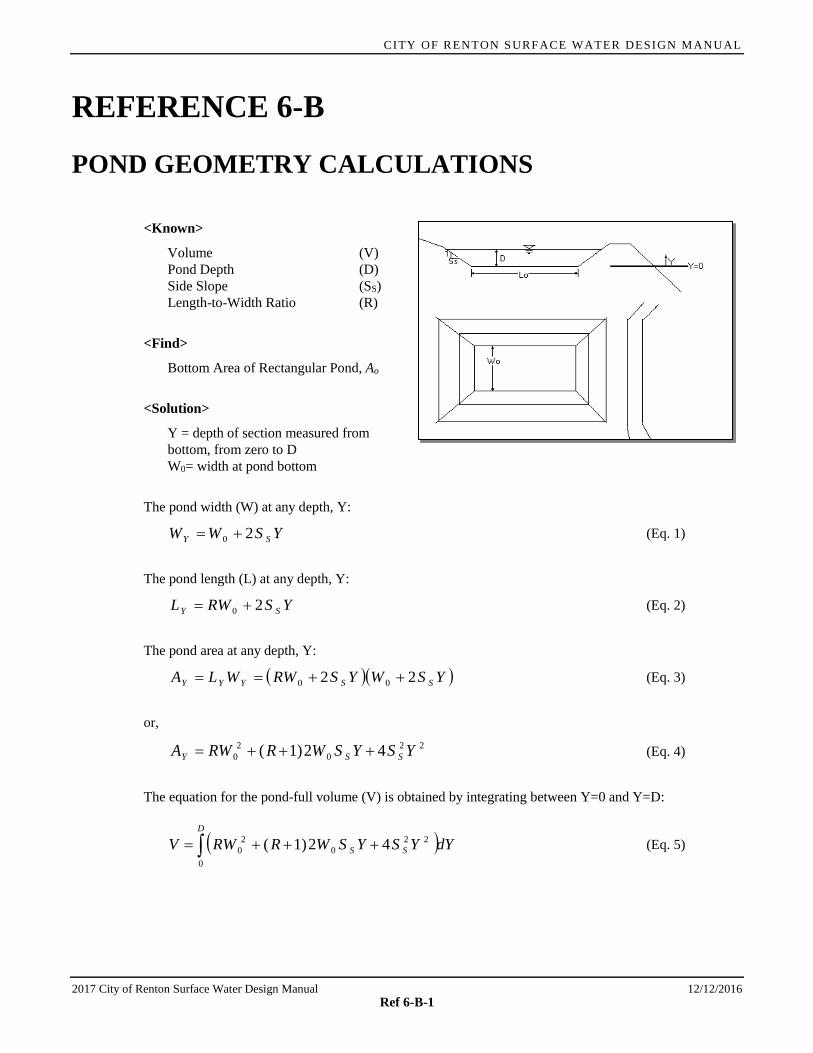
REFERENCE 6-B
POND GEOMETRY CALCULATIONS
<Known>
Volume (V) Pond Depth (D) Side Slope (SS) Length-to-Width Ratio (R)
<Find>
Bottom Area of Rectangular Pond, Ao
<Solution>
Y = depth of section measured from bottom, from zero to D W0= width at pond bottom
The pond width (W) at any depth, Y:
YSWW SY 20 += (Eq. 1)
The pond length (L) at any depth, Y:
YSRWL SY 20 += (Eq. 2)
The pond area at any depth, Y:
( )( )YSWYSRWWLA SSYYY 22 00 ++== (Eq. 3)
or, 22
02
0 42)1( YSYSWRRWA SSY +++= (Eq. 4)
The equation for the pond-full volume (V) is obtained by integrating between Y=0 and Y=D:
( )dYYSYSWRRWVD
SS∫ +++=0
220
20 42)1( (Eq. 5)

REFERENCE 6: HYDROLOGIC/HYDRAULIC DESIGN METHODS
12/12/2016 2017 City of Renton Surface Water Design Manual Ref 6-B-2
or,
( )D
SS YSYSWRYRWV0
3220
20 3
41
+++= (Eq. 6)
or,
( ) 320
220 3
41 DSWRDSRDWV SS +++= (Eq. 7)
Where
V = Volume of rectangular pond D = Depth W0 = Bottom width R = Length-to-width ratio Ss = Side Slope
Rearrange equation to solve for W0 using quadratic equation, cbxax ++= 20 :
( ) VDSWRDSRDW SS −+++= 320
220 3
410 (Eq. 8)
Use Quadratic Equation to solve for positive solution of W0, a
acbbx2
42 −±−= :
( ) ( )[ ]RD
VDSRDRDSRDSW
SSS
234411 32222
0
−−+±+−
= (Eq. 9)
Use Equation 2 for Length of pond at Y=0:
00 RWL =
Use Equation 3 for Area of pond at Y=0:
2000 RWWLAO ==
CITY OF RENTON SURFACE WATER DESIGN MANUAL
2017 City of Renton Surface Water Design Manual 12/12/2016 Ref 6-C-1
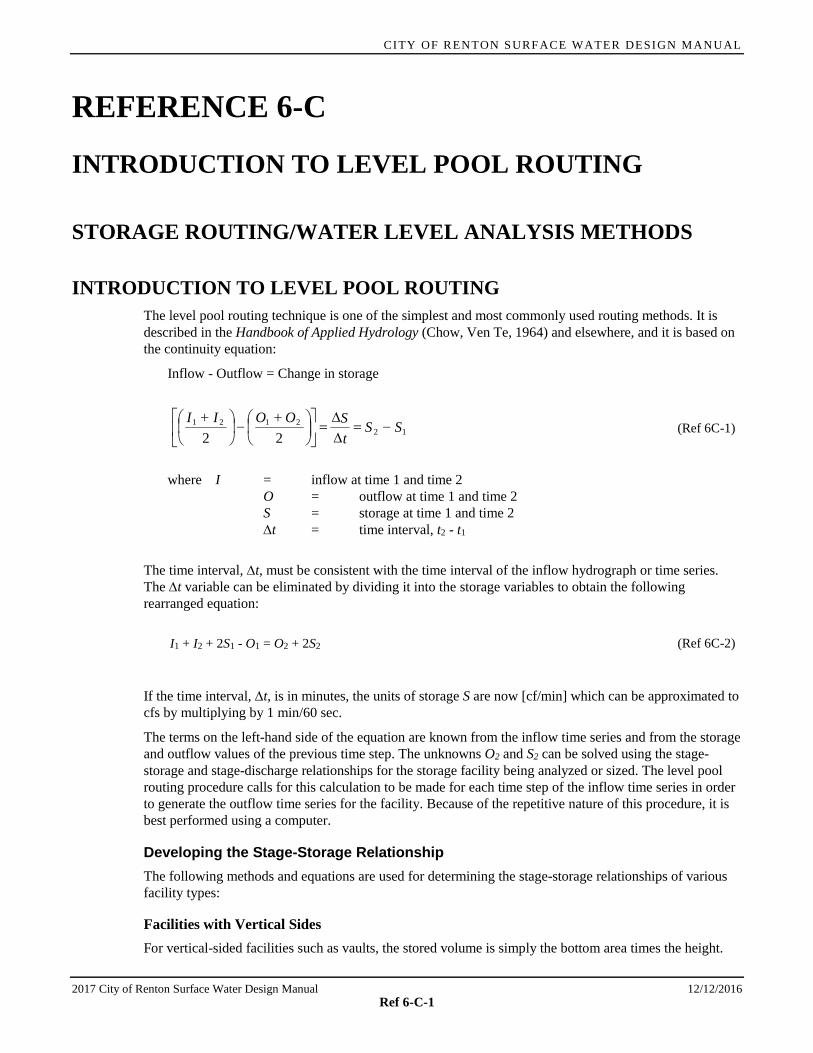
REFERENCE 6-C
INTRODUCTION TO LEVEL POOL ROUTING
STORAGE ROUTING/WATER LEVEL ANALYSIS METHODS
INTRODUCTION TO LEVEL POOL ROUTING The level pool routing technique is one of the simplest and most commonly used routing methods. It is described in the Handbook of Applied Hydrology (Chow, Ven Te, 1964) and elsewhere, and it is based on the continuity equation:
Inflow - Outflow = Change in storage
122121
22SS
tSOOII −=∆∆
=
+−
+ (Ref 6C-1)
where I = inflow at time 1 and time 2 O = outflow at time 1 and time 2 S = storage at time 1 and time 2 ∆t = time interval, t2 - t1
The time interval, ∆t, must be consistent with the time interval of the inflow hydrograph or time series. The ∆t variable can be eliminated by dividing it into the storage variables to obtain the following rearranged equation:
I1 + I2 + 2S1 - O1 = O2 + 2S2 (Ref 6C-2)
If the time interval, ∆t, is in minutes, the units of storage S are now [cf/min] which can be approximated to cfs by multiplying by 1 min/60 sec.
The terms on the left-hand side of the equation are known from the inflow time series and from the storage and outflow values of the previous time step. The unknowns O2 and S2 can be solved using the stage-storage and stage-discharge relationships for the storage facility being analyzed or sized. The level pool routing procedure calls for this calculation to be made for each time step of the inflow time series in order to generate the outflow time series for the facility. Because of the repetitive nature of this procedure, it is best performed using a computer.
Developing the Stage-Storage Relationship The following methods and equations are used for determining the stage-storage relationships of various facility types:
Facilities with Vertical Sides For vertical-sided facilities such as vaults, the stored volume is simply the bottom area times the height.

REFERENCE 6: HYDROLOGIC/HYDRAULIC DESIGN METHODS
12/12/2016 2017 City of Renton Surface Water Design Manual Ref 6-C-2
Ponds with 3:1 Side Slopes For ponds with 3:1 side slopes, the stored volume can be approximated by averaging the pond surface area with the bottom area. The following equation was derived based on this assumption and for a square pond but provides a reasonable trial estimation for typical ponds of other shapes.
S(H) = 12 H3 + 6 H2 + AbH (Ref 6C-3)
where H = stage height (ft) or water depth above pond bottom Ab = area of pond bottom (sf) S(H) = storage (cf) at stage height H
Note: Actual pond volumes and surface areas should be computed based on the methods outlined in Reference Section 6-B, or the following equation:
V = (At + Ab + ) (Ref 6C-4)
where h = depth At = area of top Ab = area of the bottom
Irregularly Shaped Storage Areas The stage-storage relationship for irregularly shaped storage areas may be developed as follows:
1. Obtain topographic contours of an existing or proposed storage facility location and determine (with a planimeter or otherwise) the area enclosed by each contour. For example, in Figure A below, each contour represents a one-foot interval. Contour 71 is the lowest portion of the facility location and represents zero storage. Contour 76 represents a potential stage of 5 feet above the bottom the facility.
2. Calculate the average end area within each set of contours. For the example in Figure A, the average end area between contours 71 and 72 would be:
= 2500 sf
3. Calculate the volume between each set of contours by multiplying the average end area within each set of contours by the difference in elevation. To illustrate, the volume between contours 71 and 72 would be:
(2500 sf)(1 ft) = 2500 cf
Similarly,
Area 72-73 = 6,550 cf Area 73-74 = 10,050 cf Area 74-75 = 12,950 cf Area 75-76 = 16,750 cf
4. Define the total storage below each contour. This is just the sum of the volumes computed in the previous step up to the contour in question. For example, there is no storage below contour 71, 2500 cf below contour 72, and (6550 + 2500) = 9050 cf below contour 73.
Ab
h3
A At b
600 44002+

REFERENCE 6-C: INTRODUCTION TO LEVEL POOL ROUTING
12/12/2016 2017 City of Renton Surface Water Design Manual Ref 6-C-3
In summary,
Contours Stage Sum of Volumes Total Volume
Contours 71-72 1 0 + 2,500 = 2,500 cf Contours 72-73 2 2,500 + 6,500 = 9,050 cf Contours 73-74 3 9,050 + 10,050 = 19,100 cf Contours 74-75 4 19,100 + 12,950 = 32,050 cf Contours 75-76 5 32,050 + 16,750 = 48,800 cf
Figure B below is a plot of the stage-storage relationship for this example.
FIGURE A – STORAGE AREA CONTOURS AT ONE-FOOT INTERVALS
FIGURE B – STAGE-STORAGE RELATIONSHIP
0
1
2
3
4
5
6
0 10 20 30 40 50
STORAGE (cubic feet/1000)
STA
GE (f
eet a
bove
con
tour
71)

REFERENCE 6: HYDROLOGIC/HYDRAULIC DESIGN METHODS
12/12/2016 2017 City of Renton Surface Water Design Manual Ref 6-C-4
Developing the Stage-Discharge Relationship The stage-discharge relationship is determined by computing the peak discharge rate for each stage height used in the stage-storage relationship. Peak discharge rates are computed using the appropriate flow equation(s) or headwater data corresponding to the type of outlet present or proposed.

CITY OF RENTON SURFACE WATER DESIGN MANUAL
2017 City of Renton Surface Water Design Manual 12/12/2016 Ref 6-D-1
REFERENCE 6-D
SUPPLEMENTAL MODELING GUIDELINES Following is a list of approved models and default parameters for use specifically with the City of Renton Surface Water Design Manual (SWDM). For general use of the model(s), including default parameters, assumptions and limitations of the model(s), see the user’s documentation provided with the software.
NOTE: Modification of the default modeling parameters shall only be considered through the adjustment process per Section 1.4.
APPROVED MODELS Note: KCRTS is no longer maintained by King County and is not an approved model for use with the SWDM.
Stormwater Runoff and Water Quality Design
• MGS Flood <http://mgsengr.com/mgsfloodhome.html>
• WWHM2012 The latest update distributed by Ecology is downloadable at: <http://www.ecy.wa.gov/programs/wq/stormwater/wwhmtraining/index.html>
• WWHM 4 <http://www.clearcreeksolutions.info/>
• Hydrologic Simulation Program (Fortran) (HSPF) <http://water.usgs.gov/software/HSPF/>
Groundwater Mounding Evaluation
• MODRET ver. 6.1 or later (Infiltration module ONLY) <http://www.scisoftware.com/environmental_software/product_info.php?cPath=21_27&products_id=93&sessid=7fdd6c978ff1d9ffe506964df530536e>
• MODFLOW <http://water.usgs.gov/ogw/modflow/>
Backwater Analysis • KCBW
<http://www.kingcounty.gov/environment/waterandland/stormwater/documents/surface-water-design-manual/hydrologic-hydraulic-model-software.aspx>
• Several others as accepted during the CED plan review process
• Spreadsheets often used, depending on conveyance network complexity
PARAMETERS USED IN MODELING Follow the guidance in the software user’s documentation except as indicated below. Revision of default or specific parameters requires an approved adjustment per SWDM Section 1.4
REFERENCE 6: HYDROLOGIC/HYDRAULIC DESIGN METHODS
12/12/2016 2017 City of Renton Surface Water Design Manual Ref 6-D-2
General Default Parameters
Pervious and Impervious Land Categories (PERLND and IMPLND parameter values)
• In WWHM, MGS Flood and HSPF, pervious land categories are represented by PERLNDs; impervious land categories by IMPLNDs.
WWHM and MGS Flood provide over 20 unique PERLND parameters that describe various hydrologic factors that influence runoff and 4 parameters to represent IMPLND.
These default values are based on regional parameter values developed by the U.S. Geological Survey for watersheds in western Washington (Dinicola, 1990), and for the WWHM model, additional HSPF modeling work conducted by AQUA TERRA Consultants. A complete description of the PERLND parameters can be found in the HSPF User Manual, 8. The values are not to be revised unless approved through the adjustment process in Section 1.4.
The precipitation stations used to develop the values represent rainfall at elevations below 1,500 feet. WWHM and MGS Flood do not include snowfall and snowmelt in their analyses.
• When sizing flow control facilities, the infiltration needs to be turned off for infiltrative BMPs to avoid double-counting the infiltration/credit benefit in the sizing.
Default Parameters and SWDM-Specific Guidelines by Model (periodically updated)
MGS Flood: <http://mgsengr.com/mgsfloodhome.html>
Applicability and Limitations to MGS Flood1 (See the full discussion of Applications and Limitations in the User’s Documentation)
MGS Flood is intended for the analysis of stormwater detention facilities in the lowlands of western Washington. The program utilizes the HSPF routines for computing runoff from rainfall for pervious and impervious land areas. The program does not include routines for simulating the accumulation and melt of snow and its use should be limited to lowland areas where snowmelt is typically not a major contributor to floods or to the annual runoff volume. In general, these conditions correspond to an elevation below approximately 1,500 feet.
The program is applicable for the analysis of stormwater facilities for small sites (several thousand square feet) to watersheds (10s of square miles). The program includes precipitation timeseries with a 15-minute time step for much of western Washington. For sites outside of the 15-minute time series coverage, precipitation time series with a 1-hour time step are included. Ecology allows the use of a 1-hour time step if the 15-minute step is not available.
As of this writing, the wetland analysis module of MGS Flood does not include methodology added to the 2016 SWDM. The update methodology may be completed using a spreadsheet. The methodology in the 2009 SWDM was retained as a conservative alternative (subject to CED determination) and is supported with the MGS Flood wetland analysis module.
Guidelines for Use of MGS Flood with the SWDM:
5. Use of the Extended Precipitation Timeseries per the general model guidance is required.
6. Use of the 1-hour timestep is only allowed where the 15-minute timestep is not available in the extended precipitation map.
7. Use the flow control exception threshold of 0.1 cfs with the 1-hr timestep. Where the 15-minute timestep is required in design (e.g., water quality facility sizing), multiply the 1-hr timestep peak
1 Source: MGS Flood User’s Manual, Proprietary Version, with references to City of Renton requirements added

REFERENCE 6-D: SUPPLEMENTAL MODELING GUIDELINES
12/12/2016 2017 City of Renton Surface Water Design Manual Ref 6-D-3
value by 1.6 to approximate the 15-min timestep peak value (Reference: SMMWW 2014 BMP T9.10: Basic Biofiltration Swale, Stability Check SC-1).
Western Washington Hydrology Model (WWHM2012, WWHM4): <http://www.ecy.wa.gov/programs/wq/stormwater/wwhmtraining/index.html>
Applicability and Limitations to WWHM2012/WWHM42 (See the full discussion of Applications and Limitations in the User’s Documentation)
Ecology created WWHM for the specific purpose of sizing stormwater control facilities for new developments in western Washington. WWHM can be used for a range of conditions and developments; however, certain limitations are inherent in this software.
WWHM uses the EPA HSPF software program to do all of the rainfall-runoff and routing computations. Therefore, HSPF limitations are included in the approved model. For example, backwater or tailwater control situations are not explicitly modeled by HSPF. This is also true in the approved model.
Earlier versions of WWHM, WWHM1 and WWHM2 had limited routing capabilities. The routing capabilities of WWHM2012 have improved and the user can input multiple stormwater control facilities and runoff is routed through them. If the proposed development site involves routing through a natural lake or wetland in addition to multiple stormwater control facilities, WWHM2012 can be used to do the routing computations and additional analysis.
Routing effects become more important as the drainage area increases. For this reason, Ecology recommends that WWHM not be used for drainage areas greater than one-half square mile (320 acres). WWHM can be used for small drainage areas less than an acre in size.
Guidelines for use of WWHM2012 or WWHM4 with the SWDM:
1. The City allows credit for Basic and Enhanced Basic water quality treatment for flows directed through the Ecology-approved bioretention soil mix. Refer to SWDM Section 6.8 for additional guidance related to using bioretention facilities to provide water quality treatment.
2. Water quality facility sizing: On-site BMPs serving pollution-generating surfaces may require water quality treatment located immediately upstream. These water quality facilities may be sized using the tributary area characterized by BMP flow control credits.
3. Water quality reporting: When using the water quality summary feature, ensure the water quality design meets the water quality sizing requirements in SWDM Chapter 6.
4. Submittals for permit review:
Electronic files – include the following files from the model run(s):
• WWHM2012 binary project file (.WHM file extension)
• WWHM2012 ASCII project file (.WH2 file extension)
• WWHM2012 WDM file (.WDM file extension)
• WWHM2012 report file (Word, Rich Text or PDF file)
o Note: When viewing or printing the project report in text mode, the water quality reporting specific to elements, as selected in the LID Report accessed from the LID icon to the right of the Tools icon, will not display properly unless landscape orientation and legal size paper are selected as viewing/printing options.
2 Source: Stormwater Management Manual for Western Washington (SMMWW), 2014 update

REFERENCE 6: HYDROLOGIC/HYDRAULIC DESIGN METHODS
12/12/2016 2017 City of Renton Surface Water Design Manual Ref 6-D-4
MODRET ver. 6.1 (Infiltration module ONLY): <http://www.scisoftware.com/environmental_software/product_info.php?cPath=21_27&products_id=93&sessid=7fdd6c978ff1d9ffe506964df530536e>
Training available for the software: <www.suncam.com>
Applicability and Limitations for MODRET ver. 6.13
The use of MODRET for SWDM applications is limited to groundwater mounding analyses using the Infiltration module of the model.
MODRET (Computer MODEL to Design RETENTION Ponds) was originally developed in 1990, by Nicolas E. Andreyev, P.E. as a complement to a research and development project for the Southwest Florida Water Management District (SWFWMD), Brooksville, Florida. Since 1990 there have been several revisions to the original model. The user is assumed to be a professional with a background in hydrology and/or hydrogeology, and has a good command in surface runoff and groundwater flow modeling. It is assumed that the user has read the “Stormwater Retention Pond Infiltration Analysis in Unconfined Aquifers” manual (Andreyev, Wiseman, 1989, available from the author or from DNRP) and understands the applicability and limitations of the MODRET program. It is also assumed that the user is familiar with the use of personal computers, Microsoft Windows operating system and its environment.
As a whole, MODRET 6.1 is not compliant with City requirements and SWDM methodologies. The model is tailored around southwest Florida regulatory requirements and methodologies, and allows generation of runoff hydrographs with various methods, calculation of infiltration losses from a retention pond, discharge (overflow) through various types of weirs and orifices, and generation of graphical results. However, the model’s methodology and graphic output closely follow southwest Florida requirements and are not applicable for use in the City. The model’s use with the SWDM is limited to the infiltration module and to the tabular output produced by the module.
Guidelines for use of MODRET 6.1 with the SWDM:
MODRET is a stormwater model based on USGS’s MODFLOW and is fashioned around Florida regulatory requirements for stormwater control and pollution abatement. It is single event-based, thus it is limited in its application to the City’s continuous Runoff Files Method requirements. However, it is a popular tool for evaluating groundwater mounding in infiltration facilities and is mandated by Ecology for the purpose. The Infiltration module in MODRET is the only module to be used with the SWDM.
Due to the model’s event-based limitation, the Infiltration module’s graphics output screens do not provide useful information for mounding analyses conducted under this manual and are not to be used unless justified by the professional preparing the analysis and report. The Input screen is the main entry point for data input. The View screen states the maximum water surface results at the bottom of the screen (scroll down to view), and the time-based results in the View screen allow a check against the seasonal rainfall pattern in the hydrograph file.
Infiltration Module Input Screen
Unsaturated Analysis: Yes/No – The unsaturated analysis in MODRET is an initial transitional stage where the available pore volume fills until the saturated condition is achieved. A conservative approach would not include the unsaturated analysis, ignoring the benefit of the filling of the pore volume.
Runoff Data – (selected when the inputs are completed and RUN is selected) Do not use the MANUAL option in the dropdown. Runoff data shall be prepared per Section 5.4.1, Groundwater Mounding Analysis and selected with the HYDROGRAPH option in the dropdown menu. The data is exported from the approved model and manipulated in a spreadsheet to the format described in the
3 Source: MODRET ver.6.1 Help files, with references to City of Renton requirements added.

REFERENCE 6-D: SUPPLEMENTAL MODELING GUIDELINES
12/12/2016 2017 City of Renton Surface Water Design Manual Ref 6-D-5
MODRET documentation, then saved as a Formatted Text space-delimited file (.PRN file extension). This file is then modified by manually changing its filename extension from .PRN to .SCS. The file is then placed in the MODRET working directory and will appear among the selections when the HYDROGRAPH option is selected.
Design Highwater Elevation, Area at Starting Water Level (area of pond bottom), Elevation of Pond Bottom, Elevation of Starting Water Level (same as pond bottom), Pond Length to Width Ratio – Values are taken or calculated from the design plans for the facility.
Volume Between Starting Water Level and Estimated High Water Level – Enter the calculated net volume of storage, that is, the gross storage volume of the facility multiplied by the calculated Average Effective Storage Coefficient of Pond (1.0 for an open pond, <1 for gravel trenches or tanks bedded in washed rock). The model does not do this calculation.
Average Effective Storage Coefficient of Pond – Calculate from facility design plan.(1.0 for an open pond, < 1.0 for gravel trenches or tanks bedded in washed rock); use 0.35 porosity for typical 2″ washed drain rock, justify any other porosity value.
Elevation of Effective Aquifer Base, Elevation of Seasonal High Groundwater Table – Values determined from subsurface exploration and documented/justified in the geotechnical summary provided with the analysis. Accurate aquifer thickness data (i.e., location of the aquifer base) can be beneficial to the analysis results, but the data is often incomplete, limiting the reportable aquifer thickness to the depth of the exploration.
Average Effective Storage Coefficient of Soil for Unsaturated Analysis, Average Effective Storage Coefficient of Soil for Saturated Analysis – Values determined from subsurface exploration and documented/justified in the geotechnical summary provided with the analysis. The two values are typically not the same and should reflect the specific yield characteristic of the soil (the moisture content of the unsaturated soil left due to capillary forces and surface tension after gravity draining of the saturated soil).
Unsaturated Vertical Hydraulic Conductivity, Saturated Horizontal Hydraulic Conductivity – The infiltration rate entered into the model should be the facility design infiltration rate, adjusted to exclude the geometry reduction factor, fgeometry. This infiltration rate is entered as the Unsaturated Vertical Hydraulic Conductivity (Kvu) and is derived from field or lab tests (field tests include a saturation period for the receptor soils, but the results are assumed to reflect the unsaturated condition unless otherwise justified). The Saturated Horizontal Hydraulic Conductivity is the dominant mechanism behind mounding, being the lateral movement of the inflow volume through the soil when confined by the water table or impervious stratum below, once the pore volume in the vadose zone is filled. It is indirectly related to the Unsaturated Vertical Hydraulic Conductivity and can be approximated per the guidance in Section 5.4.1 or determined though lab tests or field pumping tests.
The effects of the geometry on groundwater mounding are captured by the model in lieu of applying the reduction factor, fgeometry, so accurate determination of the geometrical inputs is necessary for the modeling results to be valid. Geometry influencing the analysis includes length to width ratio (L:W), design pond depth, net storage volume in the facility, separation of the facility bottom from the seasonal high groundwater table and/or impermeable layer, and location and thickness of the underlying aquifer
Factor of Safety for Kvu – A factor of safety of 1.0 for Kvu may be applied when following the guidance for determining the value for Unsaturated Vertical Hydraulic Conductivity above. The input screen for MODRET suggests a value of 2.0; software and supporting documentation indicate the suggestion accounts for plugging by sedimentation and variability of the receptor soil characteristics and field testing results. The reduction factors described in Section 5.4.1 for the Simplified Method achieve this purpose and are to be applied to determine the value for Kvu for MODRET input. Additional factor(s) of safety may be applied according to professional judgment.

REFERENCE 6: HYDROLOGIC/HYDRAULIC DESIGN METHODS
12/12/2016 2017 City of Renton Surface Water Design Manual Ref 6-D-6
Time Increment(s) During/After/Total for Storm Event – Use the program defaults unless otherwise justified by the professional preparing the analysis.
Additional guidance
• Allowable stress periods maximum 400 or so; time steps (aka data points) maximum count 9999 for hydrograph input files.
• The MODRET report printout will be very long (approximately 80 pages) when the water year hydrograph files described above under Input Screen/Runoff Data are applied. The additional pages are largely a printout of the View screen, where the progress of the model run is displayed and the maximum high water elevation information (i.e., the primary result of concern) appears at the end of the table. Consult CED review staff to determine if the intermediate portion is necessary to be included in the review submittal.
• The hydrograph input file format is described in the model appendices. It is helpful to view one of the installed .SCS files as an example for preparing the files. In a spreadsheet (e.g., Microsoft Excel), manipulate the time series file produced by the approved model to the format described in the appendix using Courier font, save as a .PRN file (i.e., Space Delimited). After exiting the spreadsheet program, replace the saved file’s extension with .SCS and move the file to the working folder for MODRET. The file will show in the Hydrograph selection process of the Infiltration module.
• If the Help module in MODRET does not function, open the document(s) directly from the program folder.
Guidance for use of MODRET 6.1 with other software
• MODRET and 64 bit Win 7/8 compatibility:
• MODRET is a 32 bit program that will work on 64 bit operating systems. By default, a 32-bit program will install to the “Program Files (x86)” directory on a 64-bit operating system, which causes problems for MODRET. To work around this, change the install directory to C:\MODRET. (DURING INSTALLATION)
• MODRET and Win 7/8 display compatibility:
• The menus in MODRET appear black in Win 7/8. To work around this, change the display theme to the Classic, High Contrast Black, or High Contrast White theme and the menu text will display properly.
• MODRET and Acrobat for Internet Explorer:
During installation, you may receive an error related to AcroIEHelper.dll. Choose Ignore and continue with the installation. As long as you can continue viewing PDFs in your browser, this should not be an issue.

2017 City of Renton Surface Water Design Manual 12/12/2016
CITY OF RENTON
SURFACE WATER DESIGN MANUAL
REFERENCE 7
ENGINEERING PLAN SUPPORT 7-A KING COUNTY STANDARD MAP SYMBOLS See the King County Department of Transportation CADD Standards Manual (2014) at: <http://kingcounty.gov/depts/transportation/roads/cadd-standards.aspx>
7-B SURFACE WATER STANDARD PLAN NOTES AND EXAMPLE OF CONSTRUCTION SEQUENCE
See the Standard Details section of the City’s website for the current Surface Water Drainage Notes and Specifications and Erosion Control Notes:
<http://rentonwa.gov/business/default.aspx?id=1020>
See attached Example of Construction Sequence.
7-C STORMFILTER FACILITY ACCESS AND CARTRIDGE CONFIGURATION
See Resource Tools at Vendor Website: <http://www.conteches.com/products/stormwater-management/treatment/stormwater-management-stormfilter>

REFERENCE 7: ENGINEERING PLAN SUPPORT
12/12/2016 2017 City of Renton Surface Water Design Manual
( T h i s p a g e i n t e n t i o n a l l y l e f t b l a n k . )
CITY OF RENTON SURFACE WATER DESIGN MANUAL
2017 City of Renton Surface Water Design Manual 12/12/2016
CITY OF RENTON
SURFACE WATER DESIGN MANUAL
REFERENCE 7-B
SURFACE WATER STANDARD PLAN NOTES AND EXAMPLE OF CONSTRUCTION SEQUENCE

REFERENCE 7: ENGINEERING PLAN SUPPORT
12/12/2016 2017 City of Renton Surface Water Design Manual
( T h i s p a g e i n t e n t i o n a l l y l e f t b l a n k . )

CITY OF RENTON SURFACE WATER DESIGN MANUAL
2017 City of Renton Surface Water Design Manual 12/12/2016 Ref 7-B-1
REFERENCE 7-B Surface Water Standard Plan Notes and Example of Construction Sequence. . See the Development Engineering Forms section of the City’s website for the current Surface Water Drainage Notes and Specifications and Erosion Control Notes:
<http://rentonwa.gov/business/default.aspx?id=1020>
EXAMPLE OF CONSTRUCTION SEQUENCE
CONSTRUCTION STORMWATER POLLUTION PREVENTION RECOMMENDED CONSTRUCTION SEQUENCE
1. Pre-construction meeting.
2. Post sign with name and phone number of CSWPP/ESC supervisor (may be consolidated with the required notice of construction sign).
3. Flag or fence clearing limits.
4. Install catch basin protection and stormwater BMP area protection as required.
5. Grade and install construction entrance(s).
6. Install perimeter protection (silt fence, brush barrier, etc.).
7. Construct sediment ponds and traps.
8. Grade and stabilize construction roads.
9. Construct surface water controls (interceptor dikes, pipe slope drains, etc.) simultaneously with clearing and grading for project development. Construct SWPPS controls in anticipation of scheduled construction activity (e.g., concrete-related pH measures for utility, vault or roadway construction)
10. Maintain erosion control measures in accordance with Appendix D of the City of Renton Surface Water Design Manual and manufacturer’s recommendations.
11. Relocate erosion control measures or install new measures so that as site conditions change the erosion and sediment control and pollution prevention is always in accordance with the City’s Erosion and Sediment Control Standards.
12. Cover all areas that will be unworked for more than seven days during the dry season or two days during the wet season with straw, wood fiber mulch, compost, or equivalent.
13. Stabilize all areas that reach final grade within seven days.
14. Seed or sod any areas to remain unworked for more than 30 days.
15. Upon completion of the project, all disturbed areas must be stabilized and BMPs removed if appropriate.

REFERENCE 7: ENGINEERING PLAN SUPPORT
12/12/2016 2017 City of Renton Surface Water Design Manual Ref 7-B-2
( T h i s p a g e i n t e n t i o n a l l y l e f t b l a n k . )

2017 City of Renton Surface Water Design Manual 12/12/2016
CITY OF RENTON
SURFACE WATER DESIGN MANUAL
REFERENCE 8
PLAN REVIEW FORMS AND WORKSHEETS 8-A TECHNICAL INFORMATION REPORT (TIR) WORKSHEET See attached.
8-B OFF-SITE ANALYSIS DRAINAGE SYSTEM TABLE See attached.
8-C WATER QUALITY FACILITY SIZING WORKSHEETS See the City’s Surface Water Design Standards website at:
<http://rentonwa.gov/government/default.aspx?id=7122>
8-D FLOW CONTROL AND WATER QUALITY FACILITY SUMMARY SHEET AND SKETCH
See the City’s Surface Water Design Standards website at:
<http://rentonwa.gov/government/default.aspx?id=7122>
8-E CSWPP WORKSHEET FORMS See attached.
8-F ADJUSTMENT APPLICATION AND PROCESS GUIDELINES Does not apply to the City.
8-G DEDICATION AND INDEMNIFICATION CLAUSE – FINAL RECORDING
Does not apply to the City.
8-H BOND QUANTITIES WORKSHEET See the City’s Surface Water Design Standards website at:
<http://rentonwa.gov/government/default.aspx?id=7122>
8-I MAINTENANCE AND DEFECT AGREEMENT See the City’s Surface Water Design Standards website at:
<http://rentonwa.gov/government/default.aspx?id=7122>

REFERENCE 8: PLAN REVIEW FORMS AND WORKSHEETS
12/12/2016 2017 City of Renton Surface Water Design Manual
8-J DRAINAGE FACILITY COVENANT See the City’s Surface Water Design Standards website at:
<http://rentonwa.gov/government/default.aspx?id=7122>
8-K DRAINAGE RELEASE COVENANT See the City’s Surface Water Design Standards website at:
<http://rentonwa.gov/government/default.aspx?id=7122>
8-L DRAINAGE EASEMENT See the City’s Surface Water Design Standards website at:
<http://rentonwa.gov/government/default.aspx?id=7122>
8-M ON-SITE BMP COVENANT AND MAINTENANCE INSTRUCTIONS (RECORDABLE FORMAT)
See the City’s Surface Water Design Standards website for the covenant:
<http://rentonwa.gov/government/default.aspx?id=7122>
See attached Maintenance Instructions.
8-N IMPERVIOUS SURFACE LIMIT COVENANT See the City’s Surface Water Design Standards website at:
<http://rentonwa.gov/government/default.aspx?id=7122>
8-O CLEARING LIMIT COVENANT See the City’s Surface Water Design Standards website at:
<http://rentonwa.gov/government/default.aspx?id=7122>
8-P RIVER PROTECTION EASEMENT – CITY OF RENTON See the City’s Surface Water Design Standards website at:
<http://rentonwa.gov/government/default.aspx?id=7122>
8-Q LEACHABLE METALS COVENANT See the City’s Surface Water Design Standards website at:
<http://rentonwa.gov/government/default.aspx?id=7122>
8-R AGREEMENT TO CONSTRUCT IMPROVEMENTS See the City’s Surface Water Design Standards website at:
<http://rentonwa.gov/government/default.aspx?id=7122>

2017 City of Renton Surface Water Design Manual 12/12/2016
CITY OF RENTON
SURFACE WATER DESIGN MANUAL
REFERENCE 8-A
TECHNICAL INFORMATION REPORT (TIR) WORKSHEET

REFERENCE 8: PLAN REVIEW FORMS AND WORKSHEETS
12/12/2016 2017 City of Renton Surface Water Design Manual
( T h i s p a g e i n t e n t i o n a l l y l e f t b l a n k . )

CITY OF RENTON SURFACE WATER DESIGN MANUAL
2017 City of Renton Surface Water Design Manual 12/12/2016 8-A-1
REFERENCE 8-A
TECHNICAL INFORMATION REPORT (TIR) WORKSHEET
Part 1 PROJECT OWNER AND PROJECT ENGINEER Part 2 PROJECT LOCATION AND
DESCRIPTION
Project Owner _____________________________ Phone ___________________________________ Address __________________________________ _________________________________________ Project Engineer ___________________________ Company _________________________________ Phone ___________________________________
Project Name __________________________
CED Permit # ________________________
Location Township ________________
Range __________________
Section _________________
Site Address __________________________
_____________________________________
Part 3 TYPE OF PERMIT APPLICATION Part 4 OTHER REVIEWS AND PERMITS
Land Use (e.g., Subdivision / Short Subd.) Building (e.g., M/F / Commercial / SFR) Grading Right-of-Way Use Other _______________________
DFW HPA COE 404 DOE Dam Safety FEMA Floodplain COE Wetlands Other ________
Shoreline Management Structural Rockery/Vault/_____ ESA Section 7
Part 5 PLAN AND REPORT INFORMATION
Technical Information Report Site Improvement Plan (Engr. Plans)
Type of Drainage Review (check one):
Date (include revision dates):
Date of Final:
Full Targeted Simplified Large Project Directed ____________________________________ __________________
Plan Type (check one):
Date (include revision dates):
Date of Final:
Full Modified Simplified
____________________________________ __________________

REFERENCE 8: PLAN REVIEW FORMS AND WORKSHEET
TECHNICAL INFORMATION REPORT (TIR) WORKSHEET
12/12/2016 2017 City of Renton Surface Water Design Manual 8-A-2
Part 6 SWDM ADJUSTMENT APPROVALS
Type (circle one): Standard / Blanket
Description: (include conditions in TIR Section 2)
____________________________________________________________________________________
____________________________________________________________________________________
____________________________________________________________________________________
Approved Adjustment No. ______________________ Date of Approval: _______________________
Part 7 MONITORING REQUIREMENTS
Monitoring Required: Yes / No
Start Date: _______________________
Completion Date: _______________________
Describe: _________________________________
_________________________________________
_________________________________________
Re: SWDM Adjustment No. ________________
Part 8 SITE COMMUNITY AND DRAINAGE BASIN
Community Plan: ____________________________________________________________________
Special District Overlays: ______________________________________________________________
Drainage Basin: _____________________________________________________________________
Stormwater Requirements: _____________________________________________________________
Part 9 ONSITE AND ADJACENT SENSITIVE AREAS
River/Stream ________________________ Lake ______________________________ Wetlands ____________________________ Closed Depression ____________________ Floodplain ___________________________ Other _______________________________
_______________________________
Steep Slope __________________________ Erosion Hazard _______________________ Landslide Hazard ______________________ Coal Mine Hazard ______________________ Seismic Hazard _______________________ Habitat Protection ______________________ _____________________________________
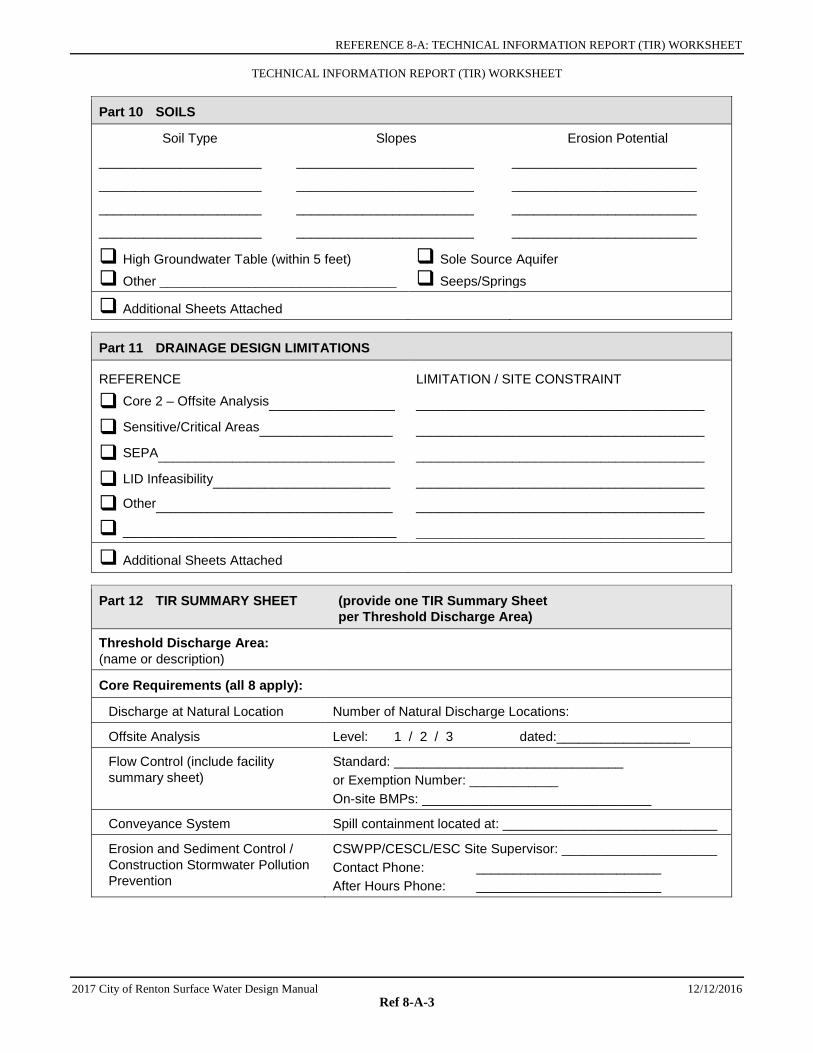
REFERENCE 8-A: TECHNICAL INFORMATION REPORT (TIR) WORKSHEET
TECHNICAL INFORMATION REPORT (TIR) WORKSHEET
2017 City of Renton Surface Water Design Manual 12/12/2016 Ref 8-A-3
Part 10 SOILS
Soil Type
______________________
______________________
______________________
______________________
Slopes
________________________
________________________
________________________
________________________
Erosion Potential
_________________________
_________________________
_________________________
_________________________
High Groundwater Table (within 5 feet) Other ________________________________
Sole Source Aquifer Seeps/Springs
Additional Sheets Attached
Part 11 DRAINAGE DESIGN LIMITATIONS
REFERENCE
Core 2 – Offsite Analysis_________________
Sensitive/Critical Areas__________________
SEPA________________________________
LID Infeasibility________________________
Other________________________________
_____________________________________
LIMITATION / SITE CONSTRAINT
_______________________________________
_______________________________________
_______________________________________
_______________________________________
_______________________________________
_______________________________________
Additional Sheets Attached
Part 12 TIR SUMMARY SHEET (provide one TIR Summary Sheet per Threshold Discharge Area)
Threshold Discharge Area: (name or description)
Core Requirements (all 8 apply):
Discharge at Natural Location Number of Natural Discharge Locations:
Offsite Analysis Level: 1 / 2 / 3 dated:__________________
Flow Control (include facility summary sheet)
Standard: _______________________________ or Exemption Number: ____________ On-site BMPs: _______________________________
Conveyance System Spill containment located at: _____________________________
Erosion and Sediment Control / Construction Stormwater Pollution Prevention
CSWPP/CESCL/ESC Site Supervisor: _____________________ Contact Phone: _________________________ After Hours Phone: _________________________

REFERENCE 8: PLAN REVIEW FORMS AND WORKSHEET
TECHNICAL INFORMATION REPORT (TIR) WORKSHEET
12/12/2016 2017 City of Renton Surface Water Design Manual 8-A-4
Part 12 TIR SUMMARY SHEET (provide one TIR Summary Sheet per Threshold Discharge Area)
Maintenance and Operation Responsibility (circle one): Private / Public If Private, Maintenance Log Required: Yes / No
Financial Guarantees and Liability Provided: Yes / No
Water Quality (include facility summary sheet)
Type (circle one): Basic / Sens. Lake / Enhanced Basic / Bog or Exemption No. _______________________
Special Requirements (as applicable):
Area Specific Drainage Requirements
Type: SDO / MDP / BP / Shared Fac. / None Name: ________________________
Floodplain/Floodway Delineation Type (circle one): Major / Minor / Exemption / None 100-year Base Flood Elevation (or range): _______________ Datum:
Flood Protection Facilities Describe:
Source Control (commercial / industrial land use)
Describe land use: Describe any structural controls:
Oil Control High-Use Site: Yes / No Treatment BMP: _________________________________ Maintenance Agreement: Yes / No with whom? _____________________________________
Other Drainage Structures
Describe:

REFERENCE 8-A: TECHNICAL INFORMATION REPORT (TIR) WORKSHEET
TECHNICAL INFORMATION REPORT (TIR) WORKSHEET
2017 City of Renton Surface Water Design Manual 12/12/2016 Ref 8-A-5
Part 13 EROSION AND SEDIMENT CONTROL REQUIREMENTS
MINIMUM ESC REQUIREMENTS DURING CONSTRUCTION
Clearing Limits Cover Measures Perimeter Protection Traffic Area Stabilization Sediment Retention Surface Water Collection Dewatering Control Dust Control Flow Control Control Pollutants Protect Existing and Proposed
BMPs/Facilities
Maintain Protective BMPs / Manage Project
MINIMUM ESC REQUIREMENTS AFTER CONSTRUCTION
Stabilize exposed surfaces Remove and restore Temporary ESC Facilities Clean and remove all silt and debris, ensure
operation of Permanent BMPs/Facilities, restore operation of BMPs/Facilities as necessary
Flag limits of sensitive areas and open space preservation areas
Other _______________________
Part 14 STORMWATER FACILITY DESCRIPTIONS (Note: Include Facility Summary and Sketch)
Flow Control Type/Description Water Quality Type/Description
Detention
Infiltration
Regional Facility
Shared Facility
On-site BMPs
Other
________________
________________
________________
________________
________________
________________
Vegetated Flowpath
Wetpool
Filtration
Oil Control
Spill Control
On-site BMPs
Other
________________
________________
________________
________________
________________
________________
________________
Part 15 EASEMENTS/TRACTS Part 16 STRUCTURAL ANALYSIS
Drainage Easement Covenant Native Growth Protection Covenant Tract Other ____________________________
Cast in Place Vault Retaining Wall Rockery > 4′ High Structural on Steep Slope Other _______________________________

REFERENCE 8: PLAN REVIEW FORMS AND WORKSHEET
TECHNICAL INFORMATION REPORT (TIR) WORKSHEET
12/12/2016 2017 City of Renton Surface Water Design Manual 8-A-6
Part 17 SIGNATURE OF PROFESSIONAL ENGINEER
I, or a civil engineer under my supervision, have visited the site. Actual site conditions as observed were incorporated into this worksheet and the attached Technical Information Report. To the best of my knowledge the information provided here is accurate.
____________________________________________________________________________________ Signed/Date

CITY OF RENTON SURFACE WATER DESIGN MANUAL
2017 City of Renton Surface Water Design Manual 12/12/2016
CITY OF RENTON
SURFACE WATER DESIGN MANUAL
REFERENCE 8-B
OFF-SITE ANALYSIS DRAINAGE SYSTEM TABLE

REFERENCE 8: PLAN REVIEW FORMS AND WORKSHEET
12/12/2016 2017 City of Renton Surface Water Design Manual
( T h i s p a g e i n t e n t i o n a l l y l e f t b l a n k . )

CITY OF RENTON SURFACE WATER DESIGN MANUAL
2017 City of Renton Surface Water Design Manual 12/12/2016 Ref 8-B-1
REFERENCE 8-B
OFF-SITE ANALYSIS DRAINAGE SYSTEM TABLE CITY OF RENTON SURFACE WATER DESIGN MANUAL, CORE REQUIREMENT #2
Basin: Subbasin Name:
Subbasin Number:
Date
Symbol Drainage Component Type, Name, and Size
Drainage Component Description Slope
Distance from Site Discharge
Existing Problems
Potential Problems
Observations of Field Inspector, Resource
Reviewer, or Resident
See map
Type: sheet flow, swale, stream, channel, pipe,
pond, flow control/ treatment/on-site
BMP/facility Size: diameter, surface
area
drainage basin, vegetation, cover,
depth, type of sensitive area, volume % ¼ ml = 1,320 ft.
Constrictions, under capacity, ponding, overtopping, flooding, habitat or
organism destruction, scouring, bank sloughing, sedimentation, incision,
other erosion
Tributary area, likelihood of problem, overflow pathways,
potential impacts

REFERENCE 8: PLAN REVIEW FORMS AND WORKSHEET
12/12/2016 2017 City of Renton Surface Water Design Manual Ref 8-B-2
( T h i s p a g e i n t e n t i o n a l l y l e f t b l a n k . )

CITY OF RENTON SURFACE WATER DESIGN MANUAL
2017 City of Renton Surface Water Design Manual 12/12/2016
CITY OF RENTON
SURFACE WATER DESIGN MANUAL
REFERENCE 8-E
CSWPP WORKSHEET FORMS

REFERENCE 8: PLAN REVIEW FORMS AND WORKSHEET
12/12/2016 2017 City of Renton Surface Water Design Manual
( T h i s p a g e i n t e n t i o n a l l y l e f t b l a n k . )

CITY OF RENTON SURFACE WATER DESIGN MANUAL
2017 City of Renton Surface Water Design Manual 12/12/2016 8-E-1
REFERENCE 8-E
CSWPP WORKSHEET FORMS E S C M A I N T E N A N C E R E P O R T
Performed By: ___________________________
Date: ___________________________
Project Name: ___________________________
CED Permit #: ___________________________
Clearing Limits Damage OK Problem Visible OK Problem Intrusions OK Problem Other OK Problem
Mulch Rills/Gullies OK Problem Thickness OK Problem Other OK Problem
Nets/Blankets Rills/Gullies OK Problem Ground Contact OK Problem Other OK Problem
Plastic Tears/Gaps OK Problem Other OK Problem
Seeding Percent Cover OK Problem Rills/Gullies OK Problem Mulch OK Problem Other OK Problem
Sodding Grass Health OK Problem Rills/Gullies OK Problem Other OK Problem
Perimeter Protection including Silt Fence Damage OK Problem Sediment Build-up OK Problem Concentrated Flow OK Problem Other OK Problem

REFERENCE 8: PLAN REVIEW FORMS AND WORKSHEET
12/12/2016 2017 City of Renton Surface Water Design Manual Ref 8-E-2
Flow Control, Treatment, and On-site BMP/Facility Protection Damage OK Problem Sedimentation OK Problem Concentrated Flow OK Problem Rills/Gullies OK Problem Intrusions OK Problem Other OK Problem
Brush Barrier Damage OK Problem Sediment Build-up OK Problem Concentrated Flow OK Problem Other OK Problem
Vegetated Strip Damage OK Problem Sediment Build-up OK Problem Concentrated Flow OK Problem Other OK Problem
Construction Entrance Dimensions OK Problem Sediment Tracking OK Problem Vehicle Avoidance OK Problem Other OK Problem
Wheel Wash Dimensions OK Problem Sed build up or tracking OK Problem Other OK Problem
Construction Road Stable Driving Surf. OK Problem Vehicle Avoidance OK Problem Other OK Problem
Sediment Trap/Pond Sed. Accumulation OK Problem Overtopping OK Problem Inlet/Outlet Erosion OK Problem Other OK Problem
Catch Basin/Inlet Protection Sed. Accumulation OK Problem Damage OK Problem Clogged Filter OK Problem Other OK Problem
Interceptor Dike/Swale Damage OK Problem Sed. Accumulation OK Problem Overtopping OK Problem Other OK Problem

REFERENCE 8-E: CSWPP WORKSHEET FORMS
2017 City of Renton Surface Water Design Manual 12/12/2016 8-E-3
Pipe Slope Drain Damage OK Problem Inlet/Outlet OK Problem Secure Fittings OK Problem Other OK Problem
Ditches Damage OK Problem Sed. Accumulation OK Problem Overtopping OK Problem Other OK Problem
Outlet Protection Scour OK Problem Other OK Problem
Level Spreader Damage OK Problem Concentrated Flow OK Problem Rills/Gullies OK Problem Sed. Accumulation OK Problem Other OK Problem
Dewatering Controls Sediment OK Problem
Dust Control Palliative applied OK Problem
Miscellaneous Wet Season Stockpile OK Problem Other OK Problem
Comments:
Actions Taken:
Problems Unresolved:
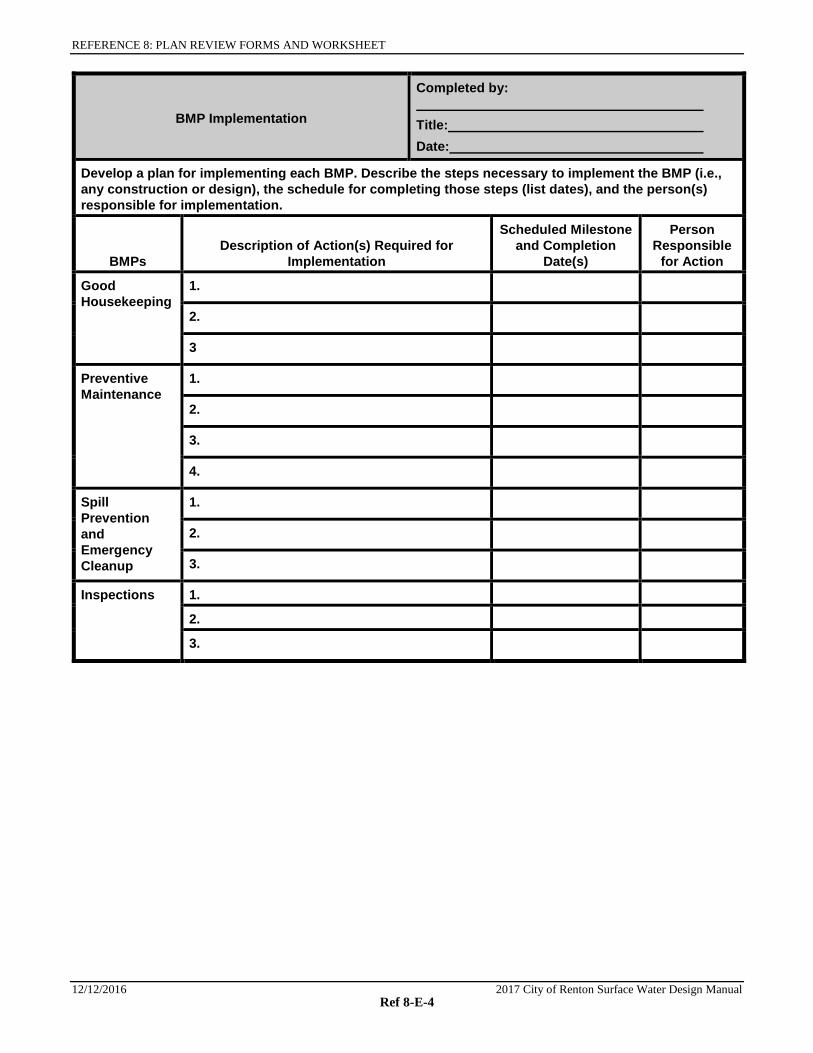
REFERENCE 8: PLAN REVIEW FORMS AND WORKSHEET
12/12/2016 2017 City of Renton Surface Water Design Manual Ref 8-E-4
BMP Implementation
Completed by: Title: Date:
Develop a plan for implementing each BMP. Describe the steps necessary to implement the BMP (i.e., any construction or design), the schedule for completing those steps (list dates), and the person(s) responsible for implementation.
BMPs Description of Action(s) Required for
Implementation
Scheduled Milestone and Completion
Date(s)
Person Responsible
for Action
Good Housekeeping
1.
2.
3
Preventive Maintenance
1.
2.
3.
4.
Spill Prevention and Emergency Cleanup
1.
2.
3.
Inspections 1.
2.
3.

REFERENCE 8-E: CSWPP WORKSHEET FORMS
2017 City of Renton Surface Water Design Manual 12/12/2016 8-E-5
BMPs Description of Action(s) Required for
Implementation
Schedule Milestone and Completion
Date(s)
Person Responsible
for Action
Source Control BMPs
1.
2.
3
4.
5.
6.
7.
8.
Water Quality Facilities
1.
2.
3.
4.
Flow Control Facilities
1.
2.
3.
4.
On-Site BMPs 1.
2.
3.
4.

REFERENCE 8: PLAN REVIEW FORMS AND WORKSHEET
12/12/2016 2017 City of Renton Surface Water Design Manual Ref 8-E-6
Pollution Prevention Team Completed by: ______________________ Title: ______________________________ Date: ______________________________
Responsible Official: Title:
Team Leader: Office Phone:
Cell Phone:
Responsibilities:
(1) Title:
Office Phone:
Cell Phone:
Responsibilities:
(2) Title:
Office Phone:
Cell Phone:
Responsibilities:

REFERENCE 8-E: CSWPP WORKSHEET FORMS
2017 City of Renton Surface Water Design Manual 12/12/2016 8-E-7
Employee Training
Completed by: Title: Date:
Describe the annual training of employees on the SWPPP, addressing spill response, good housekeeping, and material management practices.
Training Topics
1.) LINE WORKERS
Brief Description of Training Program/Materials (e.g., film, newsletter course)
Schedule for Training (list dates)
Attendees
Spill Prevention and Response
Good Housekeeping
Material Management Practices
2.) P2 TEAM:
SWPPP Implementation
Monitoring Procedures

REFERENCE 8: PLAN REVIEW FORMS AND WORKSHEETS
12/12/2016 2017 City of Renton Surface Water Design Manual Ref 8-E-8
List of Significant Spills and Leaks Completed by: Title: Date:
List all spills and leaks of toxic or hazardous pollutants that were significant but are not limited to, release of oil or hazardous substances in excess of reportable quantities. Although not required, we suggest you list spills and leaks of non-hazardous materials.
Date (month/
day/ year)
Location (as
indicated on site map)
Description Response Procedure
Preventive Measure Taken Type of Material Quantity
Source, If Known
Reason for Spill/Leak
Amount of Material
Recovered
Material no longer
exposed to stormwater
(Yes/No)

REFERENCE 8-E: CSWPP WORKSHEET FORMS
2017 City of Renton Surface Water Design Manual 12/12/2016 8-E-9
Potential Pollutant Source Identification
Completed by:
Title:
Date:
List all potential stormwater pollutants from materials handled, treated, or stored onsite.
Potential Stormwater Pollutant Stormwater Pollutant Source Likelihood of pollutant being present in your
stormwater discharge. If yes, explain

REFERENCE 8: PLAN REVIEW FORMS AND WORKSHEETS
12/12/2016 2017 City of Renton Surface Water Design Manual Ref 8-E-10
Material Inventory
Completed by:
Title:
Date:
List materials handled, treated, stored, or disposed of at the project site that may potentially be exposed to precipitation or runoff.
Material Purpose/Location
Quantity (Units) Likelihood of contact with stormwater If Yes, describe reason:
Past Spill or Leak Used Produced Stored
(indicate per wk. or yr.) Yes No

CITY OF RENTON SURFACE WATER DESIGN MANUAL
2017 City of Renton Surface Water Design Manual 12/12/2016
CITY OF RENTON
SURFACE WATER DESIGN MANUAL
REFERENCE 8-M
ON-SITE BMP COVENANT AND MAINTENANCE INSTRUCTIONS (RECORDABLE FORMAT)

REFERENCE 8: PLAN REVIEW FORMS AND WORKSHEETS
12/12/2016 2017 City of Renton Surface Water Design Manual
( T h i s p a g e i n t e n t i o n a l l y l e f t b l a n k . )

MAINTENANCE INSTRUCTIONS FOR FULL DISPERSION Your property contains an on-site BMP (best management practice) called “full dispersion.”
Full dispersion is a strategy for minimizing the area disturbed by development (i.e., impervious or nonnative pervious surfaces, such as concrete areas, roofs, and lawns) relative to native vegetated areas (e.g., forested surface) together with the application of dispersion techniques that utilize the natural capacity of the native vegetated areas to mitigate the stormwater runoff quantity and quality impacts of the developed surfaces.
This on-site BMP has two primary components that must be maintained per Appendix A of the City of Renton’s Surface Water Design Manual:
(1) the devices that disperse runoff from the developed surfaces, and
(2) the native vegetated area and flowpath receiving the dispersed runoff.
Dispersion Devices The dispersion devices used on your property include the following as indicated on the site plan (CHECK THE BOX(ES) THAT APPLY):
splash blocks, rock pads, gravel filled trenches, sheet flow.
MAINTENANCE RESTRICTIONS The size, placement, composition, and downstream flowpaths of these devices as depicted by the site plan and design details must be maintained and may not be changed without written approval from the City of Renton or through a future development permit from the City of Renton.
INSPECTION FREQUENCY AND MAINTENANCE GUIDELINES Dispersion Devices
• Dispersion devices must be inspected annually and after major storm events to identify and repair any physical defects.
• When native soil is exposed or erosion channels are present, the sources of the erosion or concentrated flow need to be identified and mitigated.
• Bare spots should be re-vegetated with native vegetation.
• Concentrated flow can be mitigated by leveling the edge of the pervious area and/or regrading or replenishing the rock in the dispersion device, such as in rock pads and gravel-filled trenches.
Native Growth Retention Area
• The native vegetated surface required for full dispersion is delineated as a “native growth retention area” on the on-site BMP site plan. The trees, vegetation, ground cover, and soil conditions in this area may not be disturbed, except as allowed by the following provisions for that portion of the native growth retention area outside of critical areas and critical area buffers:
1. Individual trees that have a structural defect due to disease or other defects, and which threaten to damage a structure, road, parking area, utility, or place of employment or

public assembly, or block emergency access, may be topped, pruned, or removed as needed to eliminate the threat.
2. Dead or fallen trees, tree limbs within ten feet of the ground, and branches overhanging a residence may be removed to reduce the danger of wildfire.
3. Noxious weeds (i.e., plant species listed on the State noxious weed list in Chapter 16-750 WAC) and invasive vegetation (i.e., plant species listed as obnoxious weeds on the noxious weed list adopted by King County) may be removed.
4. Passive recreation uses and related facilities, including pedestrian, equestrian community and bicycle trails, nature viewing areas, fishing and camping areas, and other similar uses that do not require permanent structures, are allowed if clearing and soil compaction associated with these uses and facilities does not exceed eight percent of the native growth retention area.
RECORDING REQUIREMENT These full dispersion on-site BMP maintenance and operation instructions must be recorded as an attachment to the required declaration of covenant and grant of easement per Requirement 3 of Section C.1.3.4 of the City of Renton Surface Water Design Manual. The intent of these instructions is to explain to future property owners, the purpose of the BMP and how it must be maintained and operated. These instructions are intended to be a minimum; the City of Renton may require additional instructions based on site-specific conditions. See the City of Renton’s Surface Water Design Manual website for additional information and updates.

TYPICAL FULL DISPERSION APPLICATIONS
SIDE VIEWNTS
HOUSE
DOWNSPOUTEXTENSION
SPLASHBLOCK
ROOF DOWNSPOUT
SPLASH BLOCK
100' MIN. VEGETATEDFLOWPATH UNDERFULL DISPERSION,SEE SECTION C.2.1.3

TYPICAL FULL DISPERSION APPLICATIONS

TYPICAL FULL DISPERSION APPLICATIONS
WIDTH = 25 FT FORA 100-FT NVFS
WIDTH = 50 FT FORA 200-FT NVFS
PLAN VIEWNTS
CRUSHED ROCK STRIP2-FT WIDE
= 5%SLOPE
NATIVE VEGETATEDFLOWPATH SEGMENT(NVFS)
=15% SLOPE
100 FT MINIMUM
EDGE OFUNDISTURBED NATIVEVEGETATION
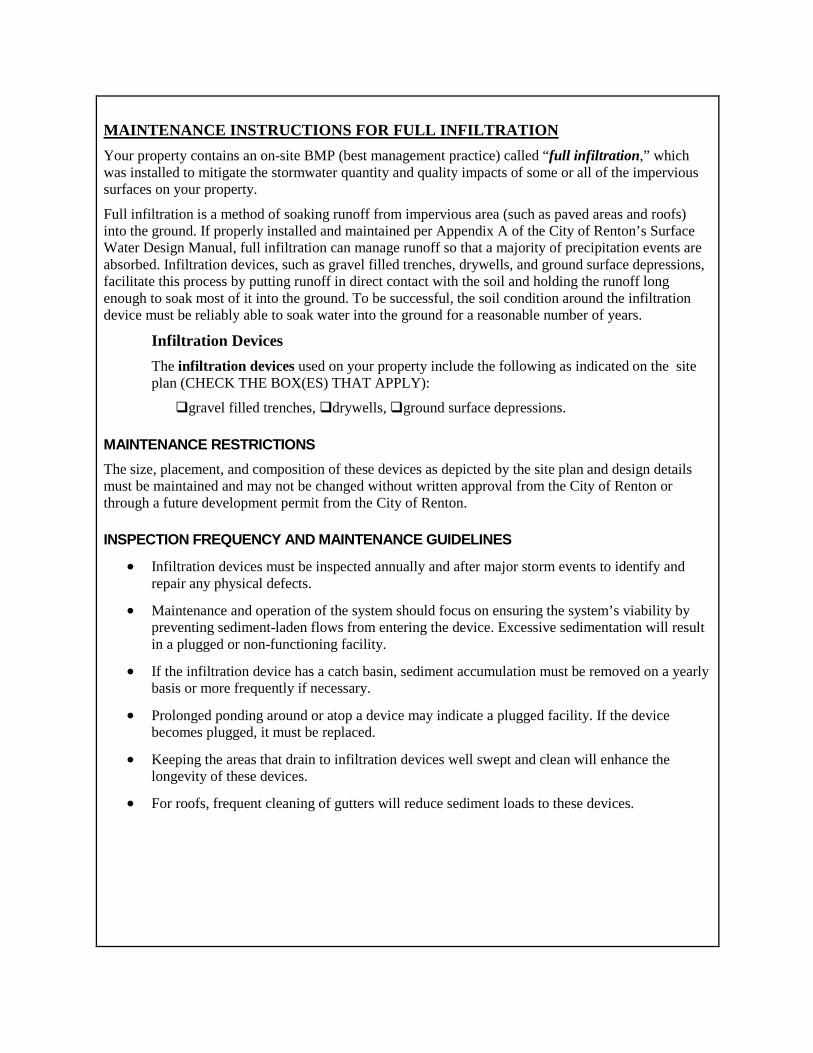
MAINTENANCE INSTRUCTIONS FOR FULL INFILTRATION Your property contains an on-site BMP (best management practice) called “full infiltration,” which was installed to mitigate the stormwater quantity and quality impacts of some or all of the impervious surfaces on your property.
Full infiltration is a method of soaking runoff from impervious area (such as paved areas and roofs) into the ground. If properly installed and maintained per Appendix A of the City of Renton’s Surface Water Design Manual, full infiltration can manage runoff so that a majority of precipitation events are absorbed. Infiltration devices, such as gravel filled trenches, drywells, and ground surface depressions, facilitate this process by putting runoff in direct contact with the soil and holding the runoff long enough to soak most of it into the ground. To be successful, the soil condition around the infiltration device must be reliably able to soak water into the ground for a reasonable number of years.
Infiltration Devices The infiltration devices used on your property include the following as indicated on the site plan (CHECK THE BOX(ES) THAT APPLY):
gravel filled trenches, drywells, ground surface depressions.
MAINTENANCE RESTRICTIONS The size, placement, and composition of these devices as depicted by the site plan and design details must be maintained and may not be changed without written approval from the City of Renton or through a future development permit from the City of Renton.
INSPECTION FREQUENCY AND MAINTENANCE GUIDELINES
• Infiltration devices must be inspected annually and after major storm events to identify and repair any physical defects.
• Maintenance and operation of the system should focus on ensuring the system’s viability by preventing sediment-laden flows from entering the device. Excessive sedimentation will result in a plugged or non-functioning facility.
• If the infiltration device has a catch basin, sediment accumulation must be removed on a yearly basis or more frequently if necessary.
• Prolonged ponding around or atop a device may indicate a plugged facility. If the device becomes plugged, it must be replaced.
• Keeping the areas that drain to infiltration devices well swept and clean will enhance the longevity of these devices.
• For roofs, frequent cleaning of gutters will reduce sediment loads to these devices.

RECORDING REQUIREMENT These full infiltration on-site BMP maintenance and operation instructions must be recorded as an attachment to the required declaration of covenant and grant of easement per Requirement 3 of Section C.1.3.4 of the City of Renton Surface Water Design Manual. The intent of these instructions is to explain to future property owners, the purpose of the BMP and how it must be maintained and operated. These instructions are intended to be a minimum; the City of Renton may require additional instructions based on site-specific conditions. See the City of Renton’s Surface Water Design Manual website for additional information and updates.
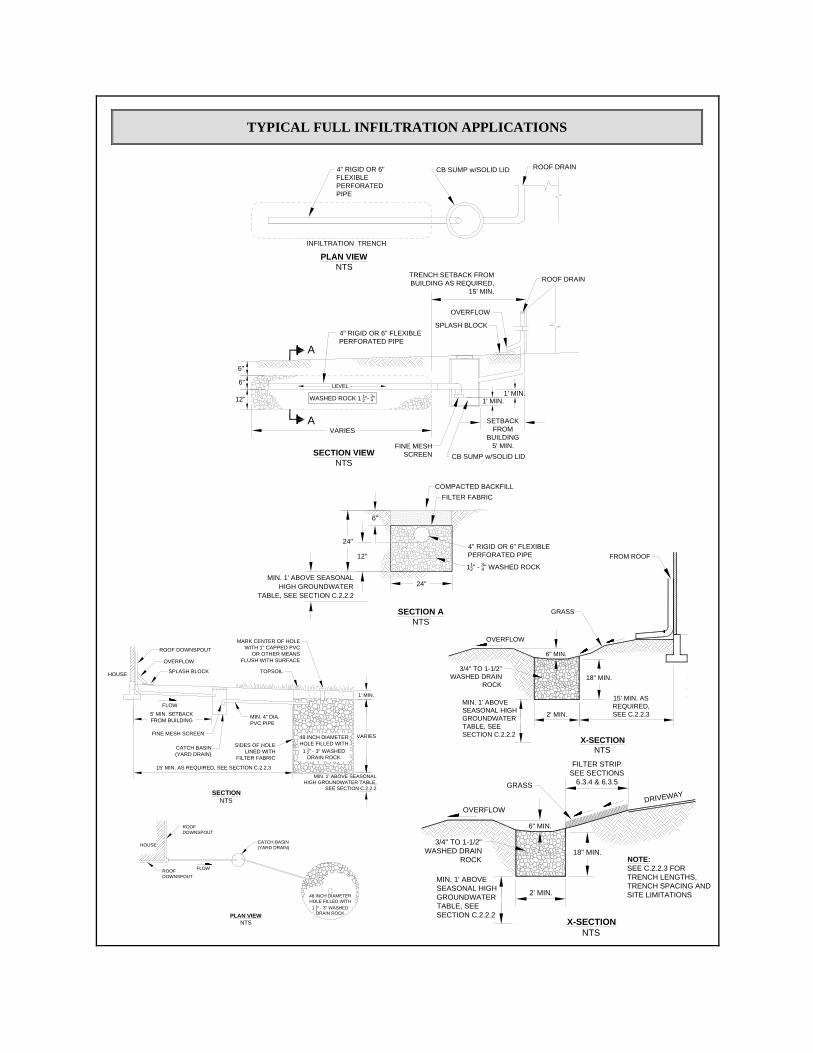
TYPICAL FULL INFILTRATION APPLICATIONS
6"
24"
12"
24"
WASHED ROCK 1 12"- 34"
LEVEL
INFILTRATION TRENCH
SECTION ANTS
PLAN VIEWNTS
SECTION VIEWNTS
VARIES
A
A
6"
6"
4" RIGID OR 6"FLEXIBLEPERFORATEDPIPE
CB SUMP w/SOLID LID ROOF DRAIN
4" RIGID OR 6" FLEXIBLEPERFORATED PIPE
OVERFLOW
SPLASH BLOCK
ROOF DRAIN
CB SUMP w/SOLID LID
12"
FINE MESHSCREEN
SETBACKFROM
BUILDING5' MIN.
1' MIN.1' MIN.
FILTER FABRICCOMPACTED BACKFILL
4" RIGID OR 6" FLEXIBLEPERFORATED PIPE
112" -
34" WASHED ROCK
MIN. 1' ABOVE SEASONALHIGH GROUNDWATER
TABLE, SEE SECTION C.2.2.2
TRENCH SETBACK FROMBUILDING AS REQUIRED,
15' MIN.
DRIVEWAY
X-SECTIONNTS
2' MIN.
FILTER STRIPSEE SECTIONS
6.3.4 & 6.3.5
18" MIN.
6" MIN.
3/4" TO 1-1/2"WASHED DRAIN
ROCK
GRASS
OVERFLOW
NOTE:SEE C.2.2.3 FORTRENCH LENGTHS,TRENCH SPACING ANDSITE LIMITATIONS
MIN. 1' ABOVESEASONAL HIGHGROUNDWATERTABLE, SEESECTION C.2.2.2
X-SECTIONNTS
GRASS
2' MIN.
18" MIN.
6" MIN.
3/4" TO 1-1/2"WASHED DRAIN
ROCK
OVERFLOW
15' MIN. ASREQUIRED,SEE C.2.2.3
FROM ROOF
NS T T S
MIN. 1' ABOVESEASONAL HIGHGROUNDWATERTABLE, SEESECTION C.2.2.2
HOUSE
FLOW
48 INCH DIAMETERHOLE FILLED WITH
1 12" - 3" WASHEDDRAIN ROCK
SECTIONNTS
MARK CENTER OF HOLEWITH 1" CAPPED PVC
OR OTHER MEANSFLUSH WITH SURFACE
ROOF DOWNSPOUT
OVERFLOW
SPLASH BLOCK TOPSOIL
FINE MESH SCREEN
MIN. 4" DIA.PVC PIPE
SIDES OF HOLELINED WITH
FILTER FABRIC
CATCH BASIN(YARD DRAIN)
15' MIN. AS REQUIRED, SEE SECTION C.2.2.3
VARIES
1' MIN.
MIN. 1' ABOVE SEASONALHIGH GROUNDWATER TABLE,
SEE SECTION C.2.2.2
5' MIN. SETBACKFROM BUILDING
FLOW
PLAN VIEWNTS
HOUSE
ROOFDOWNSPOUT
ROOFDOWNSPOUT
CATCH BASIN(YARD DRAIN)
48 INCH DIAMETERHOLE FILLED WITH
1 12" - 3" WASHEDDRAIN ROCK
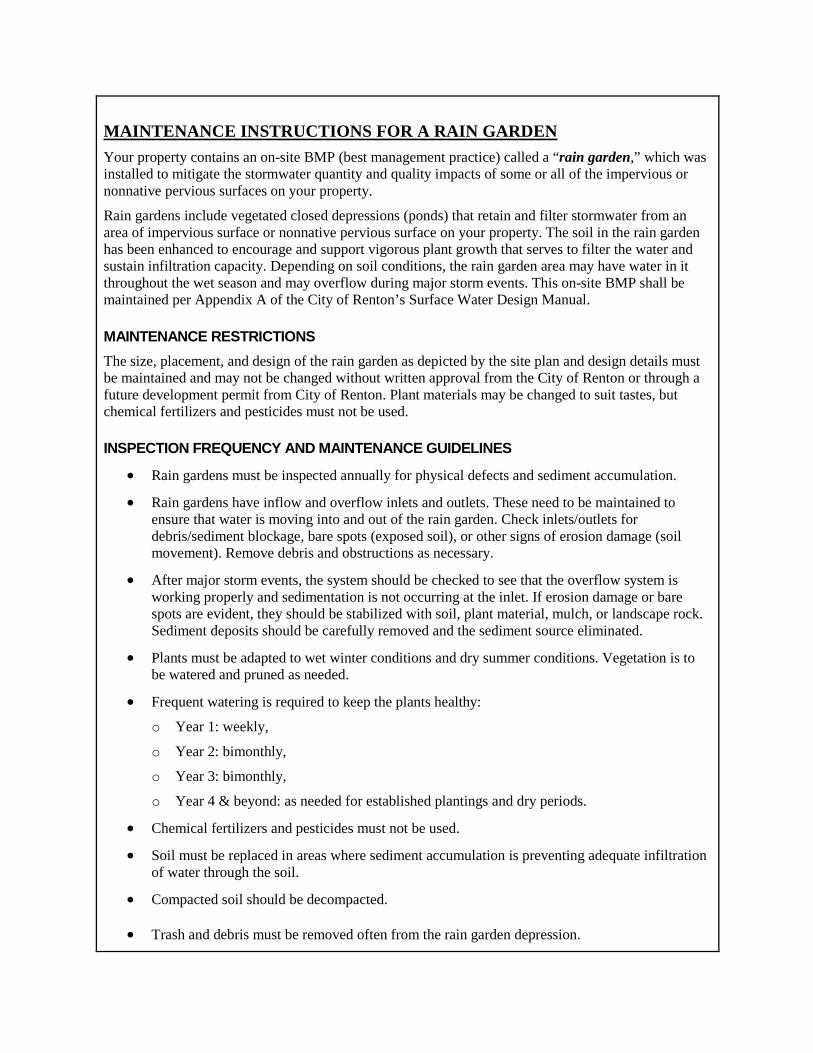
MAINTENANCE INSTRUCTIONS FOR A RAIN GARDEN Your property contains an on-site BMP (best management practice) called a “rain garden,” which was installed to mitigate the stormwater quantity and quality impacts of some or all of the impervious or nonnative pervious surfaces on your property.
Rain gardens include vegetated closed depressions (ponds) that retain and filter stormwater from an area of impervious surface or nonnative pervious surface on your property. The soil in the rain garden has been enhanced to encourage and support vigorous plant growth that serves to filter the water and sustain infiltration capacity. Depending on soil conditions, the rain garden area may have water in it throughout the wet season and may overflow during major storm events. This on-site BMP shall be maintained per Appendix A of the City of Renton’s Surface Water Design Manual.
MAINTENANCE RESTRICTIONS The size, placement, and design of the rain garden as depicted by the site plan and design details must be maintained and may not be changed without written approval from the City of Renton or through a future development permit from City of Renton. Plant materials may be changed to suit tastes, but chemical fertilizers and pesticides must not be used.
INSPECTION FREQUENCY AND MAINTENANCE GUIDELINES
• Rain gardens must be inspected annually for physical defects and sediment accumulation.
• Rain gardens have inflow and overflow inlets and outlets. These need to be maintained to ensure that water is moving into and out of the rain garden. Check inlets/outlets for debris/sediment blockage, bare spots (exposed soil), or other signs of erosion damage (soil movement). Remove debris and obstructions as necessary.
• After major storm events, the system should be checked to see that the overflow system is working properly and sedimentation is not occurring at the inlet. If erosion damage or bare spots are evident, they should be stabilized with soil, plant material, mulch, or landscape rock. Sediment deposits should be carefully removed and the sediment source eliminated.
• Plants must be adapted to wet winter conditions and dry summer conditions. Vegetation is to be watered and pruned as needed.
• Frequent watering is required to keep the plants healthy:
o Year 1: weekly,
o Year 2: bimonthly,
o Year 3: bimonthly,
o Year 4 & beyond: as needed for established plantings and dry periods.
• Chemical fertilizers and pesticides must not be used.
• Soil must be replaced in areas where sediment accumulation is preventing adequate infiltration of water through the soil.
• Compacted soil should be decompacted.
• Trash and debris must be removed often from the rain garden depression.

• Mulch must be applied to bare soil at a minimum of 2 inches to maintain healthy growth.
• Compost may be added if soil nutrients are no longer adequate to support plant growth.
• Vegetation should be maintained as follows:
1) Replace all dead vegetation as soon as possible;
2) Remove fallen leaves and debris as needed;
3) Remove all noxious vegetation when discovered;
4) Manually weed without herbicides or pesticides;
5) To protect infiltration performance, do not compact soils in the bioretention cell with heavy maintenance equipment and/or excessive foot traffic;
6) During drought conditions, use mulch to prevent excess solar damage and water loss.
RECORDING REQUIREMENT These rain garden on-site BMP maintenance and operation instructions must be recorded as an attachment to the required declaration of covenant and grant of easement per Requirement 3 of Section C.1.3.4 of the City of Renton Surface Water Design Manual. The intent of these instructions is to explain to future property owners, the purpose of the BMP and how it must be maintained and operated. These instructions are intended to be a minimum; the City of Renton may require additional instructions based on site-specific conditions. See the City of Renton’s Surface Water Design Manual website for additional information and updates.

TYPICAL RAIN GARDEN (SPILLWAY OR CATCH BASIN OUTLET)
TREES, SHRUBS
GROUND COVER
BIORETENTION AREA
PLAN VIEWNTS
VEGETATEDCOMPACTEDEARTH BERM
ROCKED SPILLWAY, 2'Wx4'L(OR BEYOND BERM IF
LONGER), OVERFLOW TOSUITABLE DISCHARGE AREA
TREES, SHRUBS
GROUND COVER
BIORETENTION AREA
PLAN VIEWNTS
VEGETATEDCOMPACTEDEARTH BERM,TOP WIDTH2' MIN
4" RIGID PIPE OUTLETTO STORM SYSTEM
CATCH BASINw/GRATE
SECTION A-ANTS
BIORETENTION AREA
GROUNDCOVER
TREES TREES
SHRUBS
6" MIN TO 12" MAXWATER DEPTH
OVERFLOW TOSUITABLE SURFACEDISCHARGE AREA
2' MIN TOP WIDTH
COMPACTED EARTHBERM (AS NEEDED)
6" MIN FREEBOARDABOVE OVERFLOW WSTO TOP OF BERM ORADJACENT ROADWAY
BIORETENTIONSOIL MIX PER
REFERENCE 11-C,MIN.18" DEPTH
MAX SLOPE 3H:1V BELOWOVERFLOW WATER
SURFACE ELEVATION (TYP.)

MAINTENANCE INSTRUCTIONS FOR A BIORETENTION CELL Your property contains an on-site BMP (best management practice) called “bioretention,” which was installed to mitigate the stormwater quantity and quality impacts on both the impervious (paved or roof) and pervious surfaces (lawn or landscape) on your property.
Bioretention cells, like rain gardens, are vegetated closed depressions or ponds that retain and filter stormwater from an area of impervious surface or nonnative pervious surface. Bioretention cells rely on effective infiltration performance more so than rain gardens. The soil in the bioretention cell has been enhanced to encourage and support vigorous plant growth that serves to filter the water and sustain a minimum infiltration capacity. Depending on soil conditions, bioretention cells may have water in them throughout the wet season and may overflow during major storm events. However, standing water can also be an indicator that periodic maintenance is required to sustain infiltrative performance. This on-site BMP shall be maintained per Appendix A of the City of Renton’s Surface Water Design Manual.
MAINTENANCE RESTRICTIONS The size, placement, and design of the rain garden as depicted by the site plan and design details must be maintained and may not be changed without written approval from the City of Renton or through a future development permit from the City of Renton. Chemical fertilizers and pesticides must not be used.
INSPECTION FREQUENCY AND MAINTENANCE GUIDELINES
• Bioretention cells must be inspected annually for physical defects and sediment accumulation.
• Bioretention cells have inflow and overflow inlets and outlets. These need to be maintained to ensure that water is moving into and out of the bioretention area. Check inlets/outlets for debris/sediment blockage, bare spots (exposed soil), or other signs of erosion damage (soil movement). Remove debris and obstructions as necessary.
• After major storm events, the bioretention cell should be checked to see that the overflow system is working properly and sedimentation is not occurring at the inlet. If erosion damage or bare spots are evident, they should be stabilized with soil, plant material, mulch, or landscape rock. Sediment deposits should be carefully removed and the sediment source eliminated.
• Plants must be adapted to wet winter conditions and dry summer conditions. Vegetation is to be watered and pruned as needed.
• Frequent watering is required to keep the plants healthy:
o Year 1: weekly,
o Year 2: bimonthly,
o Year 3: bimonthly,
o Year 4 and beyond: as needed for established plantings and dry periods.
• Chemical fertilizers and pesticides must not be used.
• Bioretention soil must be replaced in areas where sediment accumulation is preventing adequate infiltration of water through the soil.
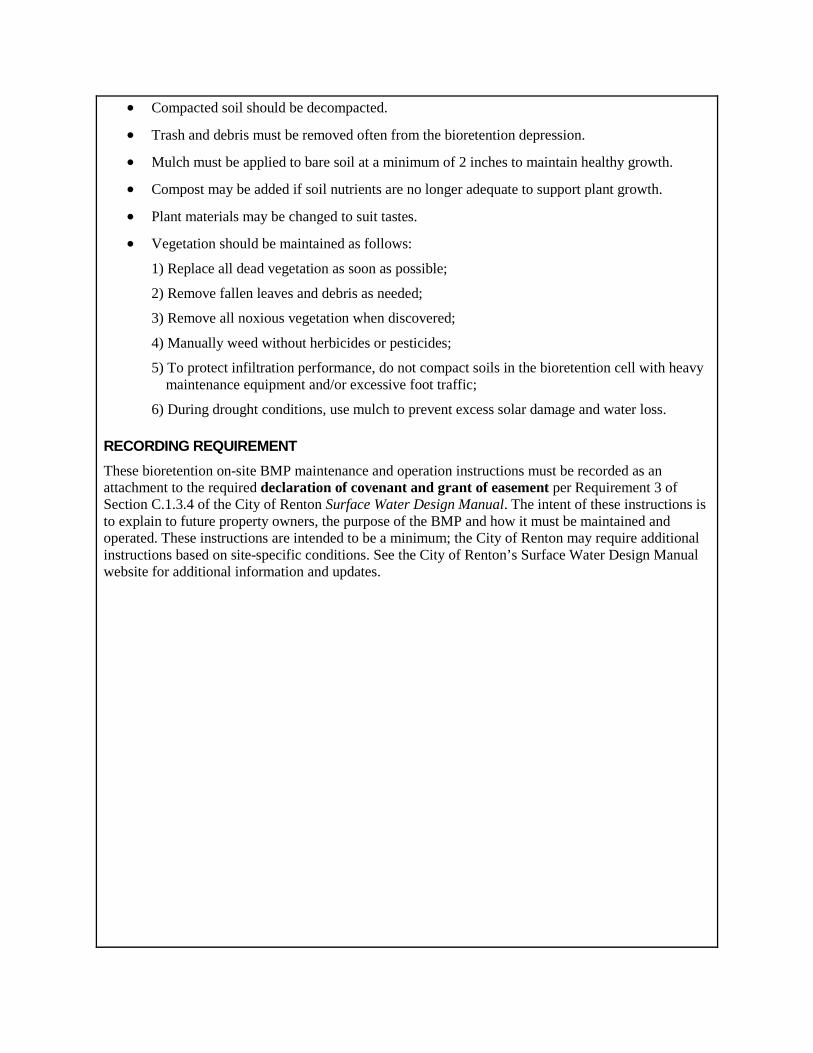
• Compacted soil should be decompacted.
• Trash and debris must be removed often from the bioretention depression.
• Mulch must be applied to bare soil at a minimum of 2 inches to maintain healthy growth.
• Compost may be added if soil nutrients are no longer adequate to support plant growth.
• Plant materials may be changed to suit tastes.
• Vegetation should be maintained as follows:
1) Replace all dead vegetation as soon as possible;
2) Remove fallen leaves and debris as needed;
3) Remove all noxious vegetation when discovered;
4) Manually weed without herbicides or pesticides;
5) To protect infiltration performance, do not compact soils in the bioretention cell with heavy maintenance equipment and/or excessive foot traffic;
6) During drought conditions, use mulch to prevent excess solar damage and water loss.
RECORDING REQUIREMENT These bioretention on-site BMP maintenance and operation instructions must be recorded as an attachment to the required declaration of covenant and grant of easement per Requirement 3 of Section C.1.3.4 of the City of Renton Surface Water Design Manual. The intent of these instructions is to explain to future property owners, the purpose of the BMP and how it must be maintained and operated. These instructions are intended to be a minimum; the City of Renton may require additional instructions based on site-specific conditions. See the City of Renton’s Surface Water Design Manual website for additional information and updates.

TYPICAL BIORETENTION CELL (SPILLWAY OR CATCH BASIN OUTLET)
TREES, SHRUBS
GROUND COVER
BIORETENTION AREA
PLAN VIEWNTS
VEGETATEDCOMPACTEDEARTH BERM
ROCKED SPILLWAY, 2'Wx4'L(OR BEYOND BERM IF
LONGER), OVERFLOW TOSUITABLE DISCHARGE AREA
TREES, SHRUBS
GROUND COVER
BIORETENTION AREA
PLAN VIEWNTS
VEGETATEDCOMPACTEDEARTH BERM,TOP WIDTH2' MIN
4" RIGID PIPE OUTLETTO STORM SYSTEM
CATCH BASINw/GRATE
SECTION A-ANTS
BIORETENTION AREA
GROUNDCOVER
TREES TREES
SHRUBS
6" MIN TO 12" MAXWATER DEPTH
OVERFLOW TOSUITABLE SURFACEDISCHARGE AREA
2' MIN TOP WIDTH
COMPACTED EARTHBERM (AS NEEDED)
6" MIN FREEBOARDABOVE OVERFLOW WSTO TOP OF BERM ORADJACENT ROADWAY
BIORETENTIONSOIL MIX PER
REFERENCE 11-C,MIN.18" DEPTH
MAX SLOPE 3H:1V BELOWOVERFLOW WATER
SURFACE ELEVATION (TYP.)

MAINTENANCE INSTRUCTIONS FOR VEGETATED PERMEABLE PAVEMENT (GRASSED MODULAR GRID PAVEMENT) Your property contains an on-site BMP (best management practice) called “grassed modular grid pavement,” which was installed to minimize the stormwater quantity and quality impacts of some or all of the paved surfaces on your property.
Grassed modular grid pavement has the runoff characteristics of a lawn while providing the weight-bearing capacity of concrete pavement. The grassed surface not only minimizes runoff quantity, it helps to filter pollutants generating by vehicular use of the surface.
MAINTENANCE RESTRICTIONS The composition and area of grassed modular grid pavement as depicted by the site plan and design details must be maintained and may not be changed without written approval from the City of Renton or through a future development permit from the City of Renton.
INSPECTION FREQUENCY AND MAINTENANCE GUIDELINES
• Grassed modular grid pavement must be inspected after one major storm each year to make sure it is working properly. More frequent inspection is recommended.
• Prolonged ponding or standing water on the pavement surface is a sign that the system is defective and may need to be replaced. If this occurs, or if any modification, surface restoration or stabilization is planned (except for mowing and periodic maintenance), contact the pavement installer or the City of Renton for further instructions.
• The grassed surface of the pavement must be regularly mowed and maintained in a good condition. Bare spots must be replanted in the spring or fall.
RECORDING REQUIREMENT These vegetated permeable pavement on-site BMP maintenance and operation instructions must be recorded as an attachment to the required declaration of covenant and grant of easement per Requirement 3 of Section C.1.3.4 of the City of Renton Surface Water Design Manual. The intent of these instructions is to explain to future property owners, the purpose of the BMP and how it must be maintained and operated. These instructions are intended to be a minimum; the City of Renton may require additional instructions based on site-specific conditions. See the City of Renton’s Surface Water Design Manual website for additional information and updates.

MAINTENANCE INSTRUCTIONS FOR PERMEABLE PAVEMENT (NON-VEGETATED) Your property contains an on-site BMP (best management practice) called “permeable pavement,” which was installed to minimize the stormwater quantity and quality impacts of some or all of the paved surfaces on your property.
Permeable pavements reduce the amount of rainfall that becomes runoff by allowing water to seep through the pavement into a free-draining gravel or sand bed, where it can be infiltrated into the ground. This on-site BMP shall be maintained per Appendix A of the City of Renton’s Surface Water Design Manual.
Permeable Pavements The type(s) of permeable pavement used on your property is (CHECK THE BOX(ES) THAT APPLY):
Porous concrete
Porous asphalt
Permeable pavers
Modular grid pavement
MAINTENANCE RESTRICTIONS The area covered by permeable pavement as depicted by the site plan and design details must be maintained as permeable pavement and may not be changed without written approval from the City of Renton or through a future development permit from the City of Renton.
INSPECTION FREQUENCY AND MAINTENANCE GUIDELINES
• Permeable pavements must be inspected after one major storm each year to make sure it is working properly. More frequent inspection is recommended.
• Prolonged ponding or standing water on the pavement surface is a sign that the system is defective and may need to be replaced. If this occurs, contact the pavement installer or the City of Renton for further instructions.
• A typical permeable pavement system has a life expectancy of approximately 25 years. To help extend the useful life of the system, the surface of the permeable pavement should be kept clean, stable and free of leaves, debris, and sediment through regular sweeping or vacuum sweeping. Aggregate fill in modular grid pavement may need periodic surface replenishment.
• The owner is responsible for the repair of all ruts, deformation, and/or broken paving grids or pavers.
• Modular grid pavement and permeable pavers filled with gravel or with gravel in the joints may need to be refilled periodically.

RECORDING REQUIREMENT These permeable pavement on-site BMP maintenance and operation instructions must be recorded as an attachment to the required declaration of covenant and grant of easement per Requirement 3 of Section C.1.3.4 of the City of Renton Surface Water Design Manual. The intent of these instructions is to explain to future property owners, the purpose of the BMP and how it must be maintained and operated. These instructions are intended to be a minimum; the City of Renton may require additional instructions based on site-specific conditions. See the City of Renton’s Surface Water Design Manual website for additional information and updates.

MAINTENANCE INSTRUCTIONS FOR BASIC DISPERSION Your property contains an on-site BMP (best management practice) called “basic dispersion,” which was installed to mitigate the stormwater quantity and quality impacts of some or all of the impervious surfaces or non-native pervious surfaces on your property.
Basic dispersion is a strategy for utilizing any available capacity of onsite vegetated areas to retain, absorb, and filter the runoff from developed surfaces. This on-site BMP has two primary components that must be maintained:
(1) The devices that disperse runoff from the developed surfaces and
(2) The vegetated area over which runoff is dispersed.
Dispersion Devices The dispersion devices used on your property include the following as indicated on the site plan (CHECK THE BOX(ES) THAT APPLY):
splash blocks, rock pads, gravel filled trenches, sheet flow.
MAINTENANCE RESTRICTIONS The size, placement, composition, and downstream flowpaths of these devices as depicted by the site plan and design details must be maintained and may not be changed without written approval from the City of Renton or through a future development permit from the City of Renton.
INSPECTION FREQUENCY AND MAINTENANCE GUIDELINES This on-site BMP has two primary components that must be maintained per Appendix A of the City of Renton’s Surface Water Design Manual:
(1) The devices that disperse runoff from the developed surfaces and
(2) The vegetated flowpath area over which runoff is dispersed.
Maintenance of Dispersion Devices
• Dispersion devices must be inspected annually and after major storm events to identify and repair any physical defects.
• When native soil is exposed or erosion channels are present, the sources of the erosion or concentrated flow need to be identified and mitigated.
• Concentrated flow can be mitigated by leveling the edge of the pervious area and/or realigning or replenishing the rocks in the dispersion device, such as in rock pads and gravel filled trenches.
Maintenance of Vegetated Flowpaths
• The vegetated area over which runoff is dispersed must be maintained in good condition free of bare spots and obstructions that would concentrate flows.

RECORDING REQUIREMENT These basic dispersion on-site BMP maintenance and operation instructions must be recorded as an attachment to the required declaration of covenant and grant of easement per Requirement 3 of Section C.1.3.4 of the City of Renton Surface Water Design Manual. The intent of these instructions is to explain to future property owners, the purpose of the BMP and how it must be maintained and operated. These instructions are intended to be a minimum; the City of Renton may require additional instructions based on site-specific conditions. See the City of Renton’s Surface Water Design Manual website for additional information and updates.

TYPICAL SPLASH BLOCK TYPICAL 10-FOOT DISPERSION TRENCH CROSS-SECTION
TYPICAL DRIVEWAY APPLICATION OF DISPERSION TRENCH AND ROCK PAD
SIDE VIEWNTS
HOUSE
DOWNSPOUTEXTENSION
SPLASHBLOCK
ROOF DOWNSPOUT
SPLASH BLOCK
100' MIN. VEGETATEDFLOWPATH UNDERFULL DISPERSION,SEE SECTION C.2.1.3
10-foot long dispersion trench
Vegetated Flowpath Segment (NVFS)
Slot drain Diagonal asphalt berm – 2 to 4 inches high
PLAN VIEW OF DRIVEWAY NTS
2-ft x 3-ft x 6-inch crushed rock pad
50-foot separation between flowpath segments
Vegetated Flowpath Segment
Edge of undisturbed native vegetation

MAINTENANCE INSTRUCTIONS FOR LIMITED INFILTRATION Your property contains an on-site BMP (best management practice) called “limited infiltration,” which was installed to mitigate the stormwater quantity and quality impacts of some or all of the impervious surfaces on your property.
Limited infiltration is a method of soaking runoff from impervious area (such as paved areas and roofs) into the ground. Infiltration devices, such as gravel filled trenches, drywells, and ground surface depressions, facilitate this process by putting runoff in direct contact with the soil and holding the runoff long enough to soak most of it into the ground. To be successful, the soil condition around the infiltration device must be able to soak water into the ground for a reasonable number of years. This on-site BMP shall be maintained per Appendix A of the City of Renton’s Surface Water Design Manual.
Infiltration Devices The infiltration devices used on your property include the following as indicated on the site plan (CHECK THE BOX(ES) THAT APPLY):
gravel filled trenches, drywells
MAINTENANCE RESTRICTIONS The size, placement, and composition of these devices as depicted by the site plan and design details must be maintained and may not be changed without written approval from the City of Renton or through a future development permit from the City of Renton.
INSPECTION FREQUENCY AND MAINTENANCE GUIDELINES To be successful, the soil condition around the infiltration device must be able to soak water into the ground for a reasonable number of years.
• Infiltration devices must be inspected annually and after major storm events to identify and repair any physical defects.
• Maintenance and operation of the system should focus on ensuring the system's viability by preventing sediment-laden flows from entering the device. Excessive sedimentation will result in a plugged or non-functioning facility.
• If the infiltration device has a catch basin, sediment accumulation must be removed on a yearly basis or more frequently if necessary.
• Prolonged ponding around or atop a device may indicate a plugged facility. If the device becomes plugged, it must be replaced.
• Keeping the areas that drain to infiltration devices well swept and clean will enhance the longevity of these devices.
• For roofs, frequent cleaning of gutters will reduce sediment loads to these devices.

RECORDING REQUIREMENT These limited infiltration on-site BMP maintenance and operation instructions must be recorded as an attachment to the required declaration of covenant and grant of easement per Requirement 3 of Section C.1.3.4 of the City of Renton Surface Water Design Manual. The intent of these instructions is to explain to future property owners, the purpose of the BMP and how it must be maintained and operated. These instructions are intended to be a minimum; the City of Renton may require additional instructions based on site-specific conditions. See the City of Renton’s Surface Water Design Manual website for additional information and updates.

INFILTRATION TRENCH AND DRYWELL SYSTEMS
6"
24"
12"
24"
WASHED ROCK 1 12"- 34"
LEVEL
INFILTRATION TRENCH
SECTION ANTS
PLAN VIEWNTS
SECTION VIEWNTS
VARIES
A
A
6"
6"
4" RIGID OR 6"FLEXIBLEPERFORATEDPIPE
CB SUMP w/SOLID LID ROOF DRAIN
4" RIGID OR 6" FLEXIBLEPERFORATED PIPE
OVERFLOW
SPLASH BLOCK
ROOF DRAIN
CB SUMP w/SOLID LID
12"
FINE MESHSCREEN
SETBACKFROM
BUILDING5' MIN.
1' MIN.1' MIN.
FILTER FABRICCOMPACTED BACKFILL
4" RIGID OR 6" FLEXIBLEPERFORATED PIPE
112" -
34" WASHED ROCK
MIN. 1' ABOVE SEASONALHIGH GROUNDWATER
TABLE, SEE SECTION C.2.2.2
TRENCH SETBACK FROMBUILDING AS REQUIRED,
15' MIN.
DRIVEWAY
X-SECTIONNTS
2' MIN.
FILTER STRIPSEE SECTIONS
6.3.4 & 6.3.5
18" MIN.
6" MIN.
3/4" TO 1-1/2"WASHED DRAIN
ROCK
GRASS
OVERFLOW
NOTE:SEE C.2.2.3 FORTRENCH LENGTHS,TRENCH SPACING ANDSITE LIMITATIONS
MIN. 1' ABOVESEASONAL HIGHGROUNDWATERTABLE, SEESECTION C.2.2.2
X-SECTIONNTS
GRASS
2' MIN.
18" MIN.
6" MIN.
3/4" TO 1-1/2"WASHED DRAIN
ROCK
OVERFLOW
15' MIN. ASREQUIRED,SEE C.2.2.3
FROM ROOF
NS T T S
MIN. 1' ABOVESEASONAL HIGHGROUNDWATERTABLE, SEESECTION C.2.2.2
HOUSE
FLOW
48 INCH DIAMETERHOLE FILLED WITH
1 12" - 3" WASHEDDRAIN ROCK
SECTIONNTS
MARK CENTER OF HOLEWITH 1" CAPPED PVC
OR OTHER MEANSFLUSH WITH SURFACE
ROOF DOWNSPOUT
OVERFLOW
SPLASH BLOCK TOPSOIL
FINE MESH SCREEN
MIN. 4" DIA.PVC PIPE
SIDES OF HOLELINED WITH
FILTER FABRIC
CATCH BASIN(YARD DRAIN)
15' MIN. AS REQUIRED, SEE SECTION C.2.2.3
VARIES
1' MIN.
MIN. 1' ABOVE SEASONALHIGH GROUNDWATER TABLE,
SEE SECTION C.2.2.2
5' MIN. SETBACKFROM BUILDING
FLOW
PLAN VIEWNTS
HOUSE
ROOFDOWNSPOUT
ROOFDOWNSPOUT
CATCH BASIN(YARD DRAIN)
48 INCH DIAMETERHOLE FILLED WITH
1 12" - 3" WASHEDDRAIN ROCK

MAINTENANCE INSTRUCTIONS FOR RAINWATER HARVESTING Your property contains an on-site BMP (best management practice) called “rainwater harvesting,” which was installed to minimize the stormwater runoff impacts of impervious surface on your property.
Rainwater harvesting is a means for the collection and storage of roof runoff for domestic or irrigation use. Rainwater harvesting systems include a collection area, a filtering system, a storage device, and an outflow device. This on-site BMP shall be maintained per Appendix A of the City of Renton’s Surface Water Design Manual.
MAINTENANCE RESTRICTIONS The size, components, and configuration of the rainwater system as depicted by the site plan and design details must be maintained and may not be changed without written approval from the City of Renton or through a future development permit from the City of Renton.
INSPECTION FREQUENCY AND MAINTENANCE GUIDELINES Rainwater harvesting systems include a collection area, a filtering system, a storage device, and an outflow device:
• The collection area (e.g., roof) should be routinely inspected for debris and other material that could impede the entrance and/or exit of surface flows.
• The filtering system should be periodically inspected for effectiveness and replaced or replenished as recommended by the manufacturer.
• The storage device must be drained completely during the dry season (May 1 – September 30) in order to provide the needed capacity for an entire wet season.
• A maintenance log should be kept on site with the aforementioned information and dates of maintenance performance. City of Renton inspection staff may request to view the maintenance log at any time.
RECORDING REQUIREMENT These rainwater harvesting on-site BMP maintenance and operation instructions must be recorded as an attachment to the required declaration of covenant and grant of easement per Requirement 3 of Section C.1.3.4 of the City of Renton Surface Water Design Manual. The intent of these instructions is to explain to future property owners, the purpose of the BMP and how it must be maintained and operated. These instructions are intended to be a minimum; the City of Renton may require additional instructions based on site-specific conditions. See the City of Renton’s Surface Water Design Manual website for additional information and updates.
RAINWATER HARVESTING SYSTEM DESIGN REQUIREMENTS:
• To ensure the system functions as designed and provides the required stormwater management, system-specific maintenance and operation instructions must be submitted with the small project drainage plan and approved by the City of Renton. Such instructions should be prepared by the system’s manufacturer or installer.
• A minimum 5-foot setback shall be maintained between any part of the rainwater harvesting system and any property line.

TYPICAL ABOVE GROUND RESERVOIR CONFIGURATION (STENSROD, 1978)
VARIOUS POSSIBLE CONFIGURATIONS (TYPICAL) (STENSROD, 1978)

MAINTENANCE INSTRUCTIONS FOR VEGETATED ROOFS Your property contains an on-site BMP (best management practice) called a “vegetated roof,” which was installed to minimize the stormwater runoff impacts of the impervious surfaces on your property.
Vegetated roofs (also called green roofs) consist of a pervious growing medium, plants, and a moisture barrier. The benefits of this device are a reduction in runoff peaks and volumes due to the storage capabilities of the soil and increased rate of evapotranspiration. This on-site BMP shall be maintained per Appendix A of the City of Renton’s Surface Water Design Manual.
MAINTENANCE RESTRICTIONS
• The composition and area of vegetated roof as depicted by the site plan and design details must be maintained and may not be changed without written approval from the City of Renton or through a future development permit from the City of Renton.
• Vegetated roofs must not be subject to any use that would significantly compact the soil.
INSPECTION FREQUENCY AND MAINTENANCE GUIDELINES Vegetated roofs (also called green roofs) consist of a pervious growing medium, plants, and a moisture barrier:
• Vegetated roofs must be inspected annually for physical defects and to make sure the vegetation is in good condition.
• If erosion channels or bare spots are evident, they should be stabilized with additional soil similar to the original material.
• A supplemental watering program may be needed the first year to ensure the long-term survival of the roof's vegetation.
• Vegetation should be maintained as follows:
(1) Vegetated roofs must not be subject to any use that would significantly compact the soil;
(2) Replace all dead vegetation as soon as possible;
(3) Remove fallen leaves and debris;
(4) Remove all noxious vegetation when discovered;
(5) Manually weed without herbicides or pesticides
RECORDING REQUIREMENT These vegetated roof on-site BMP maintenance and operation instructions must be recorded as an attachment to the required declaration of covenant and grant of easement per Requirement 3 of Section C.1.3.4 of the City of Renton Surface Water Design Manual. The intent of these instructions is to explain to future property owners, the purpose of the BMP and how it must be maintained and operated. These instructions are intended to be a minimum; the City of Renton may require additional instructions based on site-specific conditions. See the City of Renton’s Surface Water Design Manual website for additional information and updates.

TYPICAL VEGETATED ROOF CROSS-SECTION
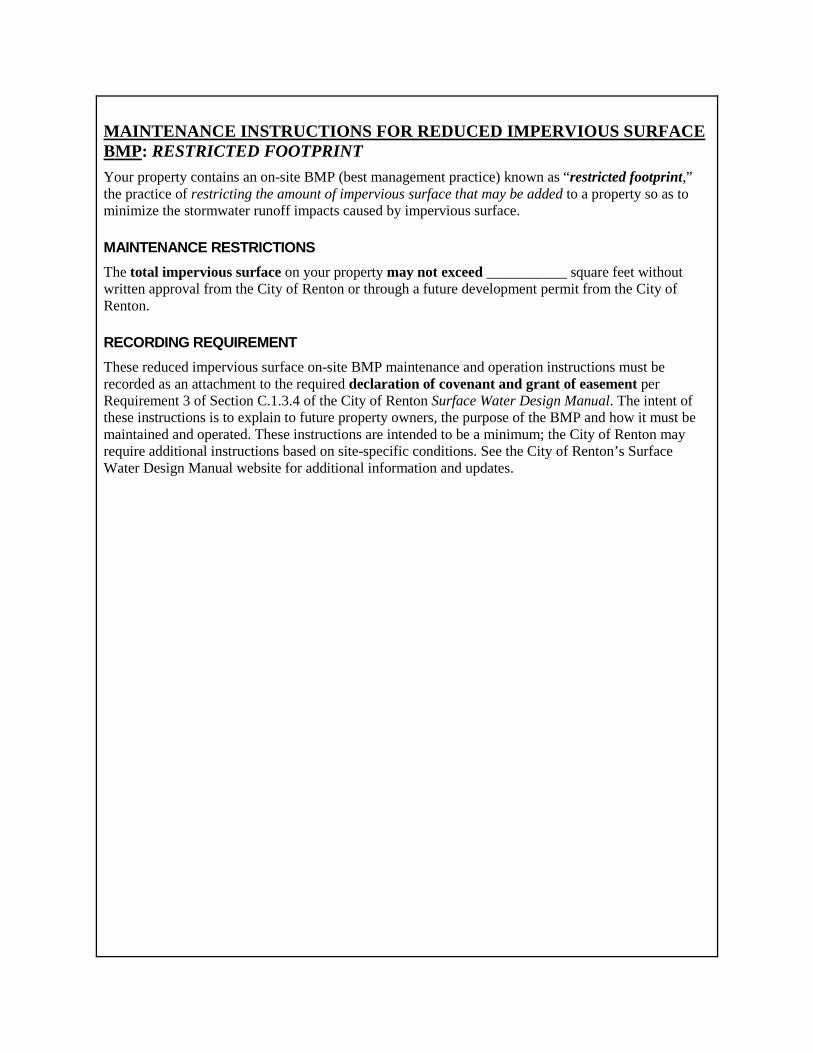
MAINTENANCE INSTRUCTIONS FOR REDUCED IMPERVIOUS SURFACE BMP: RESTRICTED FOOTPRINT Your property contains an on-site BMP (best management practice) known as “restricted footprint,” the practice of restricting the amount of impervious surface that may be added to a property so as to minimize the stormwater runoff impacts caused by impervious surface.
MAINTENANCE RESTRICTIONS The total impervious surface on your property may not exceed ___________ square feet without written approval from the City of Renton or through a future development permit from the City of Renton.
RECORDING REQUIREMENT These reduced impervious surface on-site BMP maintenance and operation instructions must be recorded as an attachment to the required declaration of covenant and grant of easement per Requirement 3 of Section C.1.3.4 of the City of Renton Surface Water Design Manual. The intent of these instructions is to explain to future property owners, the purpose of the BMP and how it must be maintained and operated. These instructions are intended to be a minimum; the City of Renton may require additional instructions based on site-specific conditions. See the City of Renton’s Surface Water Design Manual website for additional information and updates.

MAINTENANCE INSTRUCTIONS FOR REDUCED IMPERVIOUS SURFACE BMP: WHEEL STRIP DRIVEWAY Your property contains an on-site BMP (best management practice) called a “wheel strip driveway,” which was installed to minimize or mitigate for the stormwater runoff impacts of some or all of the impervious surfaces on your property.
MAINTENANCE RESTRICTIONS The placement and composition of the wheel strip driveway as depicted by the site plan and design details must be maintained and may not be changed without written approval from the City of Renton or through a future development permit from the City of Renton.
RECORDING REQUIREMENT These reduced impervious surface on-site BMP maintenance and operation instructions must be recorded as an attachment to the required declaration of covenant and grant of easement per Requirement 3 of Section C.1.3.4 of the City of Renton Surface Water Design Manual. The intent of these instructions is to explain to future property owners, the purpose of the BMP and how it must be maintained and operated. These instructions are intended to be a minimum; the City of Renton may require additional instructions based on site-specific conditions. See the City of Renton’s Surface Water Design Manual website for additional information and updates.
WHEEL STRIP DRIVEWAY DESIGN REQUIREMENTS for the typical 10-foot driveway width:
• The two pavement strips must be no more than 2.5 feet wide.
• At least 4 feet of the 10-foot driveway width must be amended soil planted with grass.
• The amended soil must consist of at least 4 inches of well-rotted compost tilled into the upper 8 inches of the soil between the impervious strips.

MAINTENANCE INSTRUCTIONS FOR REDUCED IMPERVIOUS SURFACE BMP: MINIMUM DISTURBANCE FOUNDATION Your property contains an on-site BMP (best management practice) known as a “minimum disturbance foundation,” which was installed to minimize or mitigate for the stormwater runoff impacts of some or all of the impervious surfaces on your property.
This means that all or a portion of the finished living space in your house is elevated over a pervious surface through the use of piers or piles. The pervious surface is intended to provide additional capacity to absorb and store the stormwater runoff from your roof and surrounding areas.
MAINTENANCE RESTRICTIONS
• The design of this system as depicted by the site plan and design details must be maintained and may not be changed without written approval from the City of Renton or through a future development permit from the City of Renton.
• In addition, the pervious surface beneath the elevated portion of your house must not be used in manner that compacts the soil or provides an opportunity for pollutants to enter the soil or storm runoff.
RECORDING REQUIREMENT These reduced impervious surface on-site BMP maintenance and operation instructions must be recorded as an attachment to the required declaration of covenant and grant of easement per Requirement 3 of Section C.1.3.4 of the City of Renton Surface Water Design Manual. The intent of these instructions is to explain to future property owners, the purpose of the BMP and how it must be maintained and operated. These instructions are intended to be a minimum; City of Renton may require additional instructions based on site-specific conditions. See the City of Renton’s Surface Water Design Manual website for additional information and updates.
MINIMUM DISTURBANCE FOUNDATION DESIGN REQUIREMENTS
• The pervious surface beneath the elevated portion of the structure must be either undisturbed native soil or amended soil. Any amended soil must consist of at least 4 inches of well-rotted compost tilled into the upper 8 inches of the soil.
• Runoff from the structure must be discharged via downspouts or sheet flow onto a vegetated surface or into a 4- to 6-inch gravel bed within close proximity of the elevated structure. Runoff discharging from downspouts onto a vegetated surface must be via splash blocks.
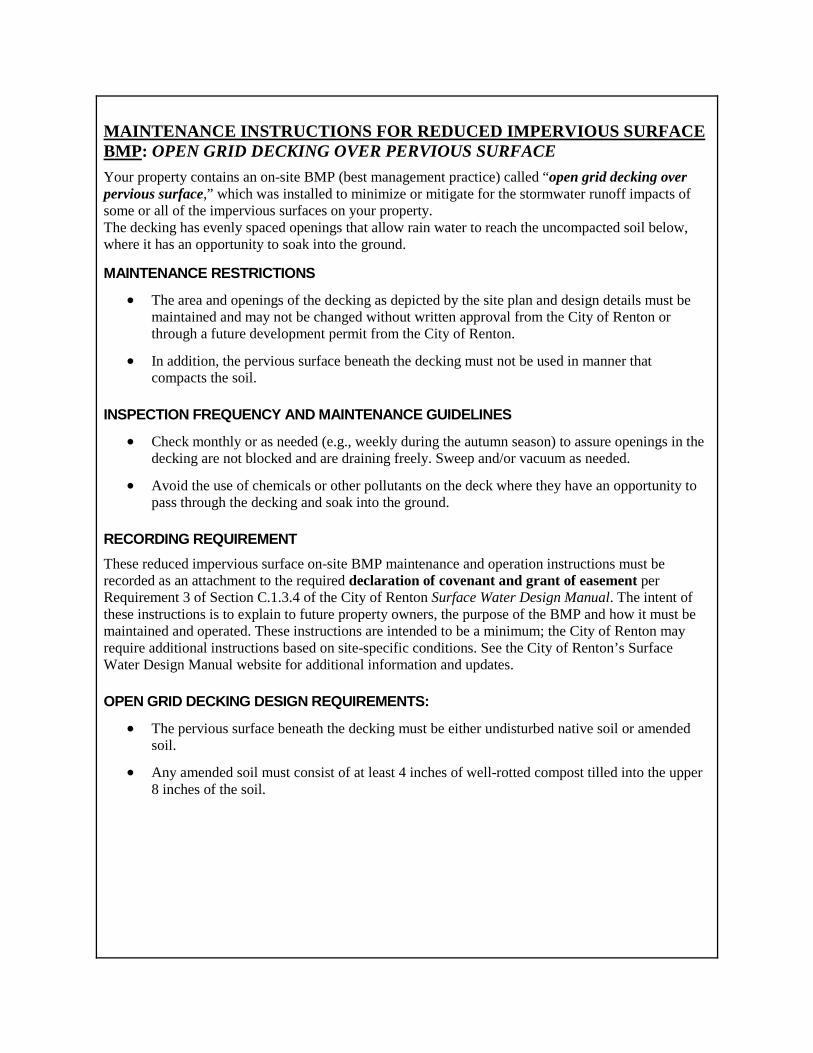
MAINTENANCE INSTRUCTIONS FOR REDUCED IMPERVIOUS SURFACE BMP: OPEN GRID DECKING OVER PERVIOUS SURFACE Your property contains an on-site BMP (best management practice) called “open grid decking over pervious surface,” which was installed to minimize or mitigate for the stormwater runoff impacts of some or all of the impervious surfaces on your property. The decking has evenly spaced openings that allow rain water to reach the uncompacted soil below, where it has an opportunity to soak into the ground.
MAINTENANCE RESTRICTIONS
• The area and openings of the decking as depicted by the site plan and design details must be maintained and may not be changed without written approval from the City of Renton or through a future development permit from the City of Renton.
• In addition, the pervious surface beneath the decking must not be used in manner that compacts the soil.
INSPECTION FREQUENCY AND MAINTENANCE GUIDELINES
• Check monthly or as needed (e.g., weekly during the autumn season) to assure openings in the decking are not blocked and are draining freely. Sweep and/or vacuum as needed.
• Avoid the use of chemicals or other pollutants on the deck where they have an opportunity to pass through the decking and soak into the ground.
RECORDING REQUIREMENT These reduced impervious surface on-site BMP maintenance and operation instructions must be recorded as an attachment to the required declaration of covenant and grant of easement per Requirement 3 of Section C.1.3.4 of the City of Renton Surface Water Design Manual. The intent of these instructions is to explain to future property owners, the purpose of the BMP and how it must be maintained and operated. These instructions are intended to be a minimum; the City of Renton may require additional instructions based on site-specific conditions. See the City of Renton’s Surface Water Design Manual website for additional information and updates.
OPEN GRID DECKING DESIGN REQUIREMENTS:
• The pervious surface beneath the decking must be either undisturbed native soil or amended soil.
• Any amended soil must consist of at least 4 inches of well-rotted compost tilled into the upper 8 inches of the soil.

MAINTENANCE INSTRUCTIONS FOR NATIVE GROWTH RETENTION CREDIT Your property contains an on-site BMP (best management practice) known as “native growth retention,” the practice of preserving a portion of a property in a native vegetated condition (e.g., forest) so as to minimize increases in stormwater runoff from clearing and to offset the stormwater runoff impacts caused by impervious surfaces on your property.
This native vegetated area on your property was set aside by covenant as “native growth retention area.” This on-site BMP shall be maintained per Appendix A of the City of Renton’s Surface Water Design Manual.
MAINTENANCE RESTRICTIONS The “native growth retention area” is delineated on the site plan attached to the covenant. The trees, vegetation, ground cover, and soil conditions in this area may not be disturbed, except as allowed by the following provisions:
1. Trees may be harvested in accordance with a King County-approved forest management plan if approved by King County prior to annexation to the City.
2. Individual trees that have a structural defect due to disease or other defects, and which threaten to damage a structure, road, parking area, utility, or place of employment or public assembly, or block emergency access, may be topped, pruned, or removed as needed to eliminate the threat.
3. Dead or fallen trees, tree limbs within ten feet of the ground, and branches overhanging a residence may be removed to reduce the danger of wildfire.
4. Noxious weeds (i.e., plant species listed on the State noxious weed list in Chapter 16-750 WAC) and invasive vegetation (i.e., plant species listed as obnoxious weeds on the noxious weed list adopted by King County) may be removed.
5. Passive recreation uses and related facilities, including pedestrian, equestrian community and bicycle trails, nature viewing areas, fishing and camping areas, and other similar uses that do not require permanent structures, are allowed if clearing and soil compaction associated with these uses and facilities does not exceed eight percent of the native growth retention area.
RECORDING REQUIREMENT These native growth retention credit on-site BMP maintenance and operation instructions must be recorded as an attachment to the required declaration of covenant and grant of easement per Requirement 3 of Section C.1.3.4 of the City of Renton Surface Water Design Manual. The intent of these instructions is to explain to future property owners, the purpose of the BMP and how it must be maintained and operated. These instructions are intended to be a minimum; the City of Renton) may require additional instructions based on site-specific conditions. See the City of Renton’s Surface Water Design Manual website for additional information and updates.
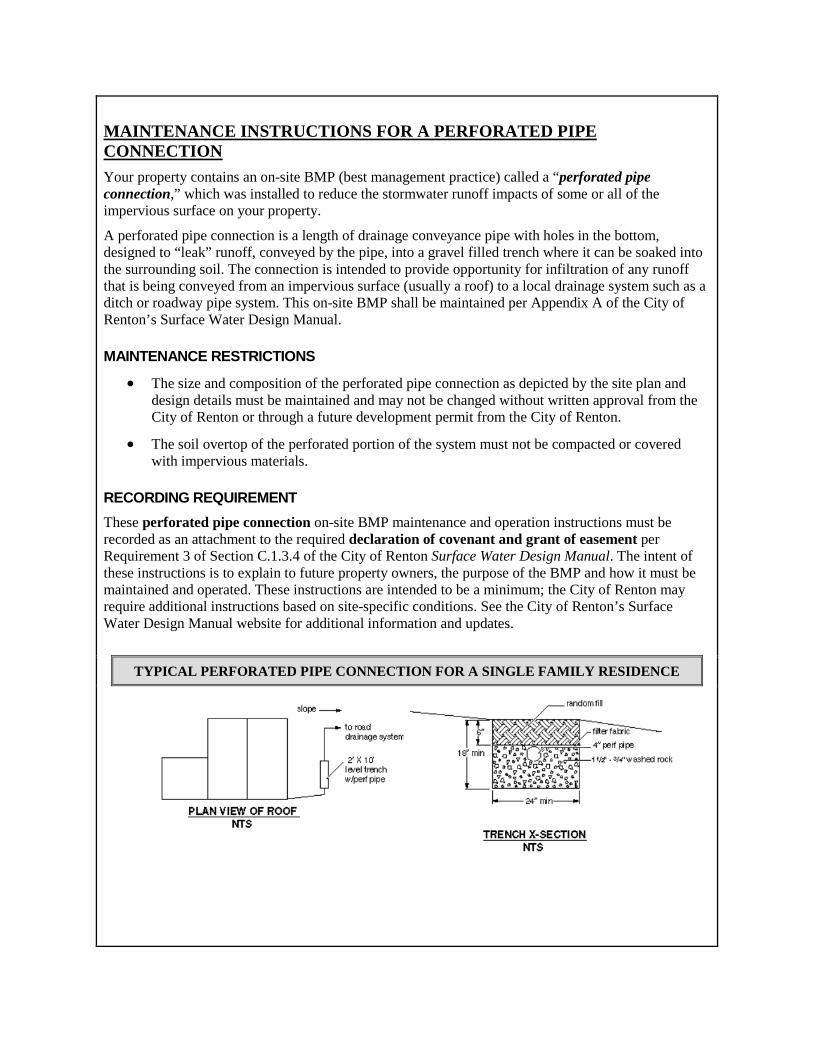
MAINTENANCE INSTRUCTIONS FOR A PERFORATED PIPE CONNECTION Your property contains an on-site BMP (best management practice) called a “perforated pipe connection,” which was installed to reduce the stormwater runoff impacts of some or all of the impervious surface on your property.
A perforated pipe connection is a length of drainage conveyance pipe with holes in the bottom, designed to “leak” runoff, conveyed by the pipe, into a gravel filled trench where it can be soaked into the surrounding soil. The connection is intended to provide opportunity for infiltration of any runoff that is being conveyed from an impervious surface (usually a roof) to a local drainage system such as a ditch or roadway pipe system. This on-site BMP shall be maintained per Appendix A of the City of Renton’s Surface Water Design Manual.
MAINTENANCE RESTRICTIONS
• The size and composition of the perforated pipe connection as depicted by the site plan and design details must be maintained and may not be changed without written approval from the City of Renton or through a future development permit from the City of Renton.
• The soil overtop of the perforated portion of the system must not be compacted or covered with impervious materials.
RECORDING REQUIREMENT These perforated pipe connection on-site BMP maintenance and operation instructions must be recorded as an attachment to the required declaration of covenant and grant of easement per Requirement 3 of Section C.1.3.4 of the City of Renton Surface Water Design Manual. The intent of these instructions is to explain to future property owners, the purpose of the BMP and how it must be maintained and operated. These instructions are intended to be a minimum; the City of Renton may require additional instructions based on site-specific conditions. See the City of Renton’s Surface Water Design Manual website for additional information and updates.
TYPICAL PERFORATED PIPE CONNECTION FOR A SINGLE FAMILY RESIDENCE

MAINTENANCE INSTRUCTIONS FOR SOIL AMENDMENT Your property contains an on-site BMP (best management practice) called “soil amendment,” which was installed to mitigate the stormwater quantity and quality impacts of some or all of the pervious surfaces on your property.
Soil amendment is a method of regaining greater stormwater functions in the post development landscape by increasing treatment of pollutants and sediments, and minimizing the need for some landscaping chemicals. To be successful, the soil condition must be able to soak water into the ground for a reasonable number of years. This on-site BMP shall be maintained per Appendix A of the City of Renton’s Surface Water Design Manual.
MAINTENANCE RESTRICTIONS The size, placement, and composition of these devices as depicted by the site plan and design details must be maintained and may not be changed without written approval from the City of Renton or through a future development permit from the City of Renton.
INSPECTION FREQUENCY AND MAINTENANCE GUIDELINES To be successful, the soil must be able to soak water into the ground for a reasonable number of years.
• Return leaf fall and shredded woody materials from the landscape to the site when possible in order to replenish soil nutrients and structure.
• On turf areas, “grasscycle” (mulch-mow or leave the clippings) to build turf health.
• Maintain 2 to 3 inches of mulch over bare areas in landscape beds.
• Re-seed bare turf areas until the vegetation fully covers the ground surface.
• Avoid using pesticides (bug and weed killers) which damage the soil.
• Where fertilization is needed (mainly turf and annual flower beds), a moderate fertilization program should be used which relies on compost, natural fertilizers, or slow-release synthetic balanced fertilizers.
RECORDING REQUIREMENT These on-site BMP maintenance and operation instructions must be recorded as an attachment to the required declaration of covenant and grant of easement per Requirement 3 of Section C.1.3.4 of the City of Renton Surface Water Design Manual. The intent of these instructions is to explain to future property owners, the purpose of the BMP and how it must be maintained and operated. These instructions are intended to be a minimum; the City of Renton may require additional instructions based on site-specific conditions. See the City of Renton’s Surface Water Design Manual website for additional information and updates.

MAINTENANCE INSTRUCTIONS FOR TREE RETENTION Your property contains an on-site BMP (best management practice) called “tree retention,” which was installed to mitigate the stormwater quantity and quality impacts of some or all of the impervious surfaces on your property.
Tree retention provides flow control via interception, transpiration, and increased infiltration. This on-site BMP shall be maintained per Appendix A of the City of Renton’s Surface Water Design Manual.
MAINTENANCE RESTRICTIONS The size, placement, and composition of these devices as depicted by the site plan and design details must be maintained and may not be changed without written approval from the City of Renton or through a future development permit from the City of Renton.
INSPECTION FREQUENCY AND MAINTENANCE GUIDELINES To be successful, the soil must be able to soak water into the ground for a reasonable number of years.
• Trees should be pruned in an appropriate manner for each species.
• Pruning should be performed by landscape professionals familiar with proper pruning techniques.
• Dead trees shall be replaced with like species within 30 days (as practical depending on weather/planting season).
RECORDING REQUIREMENT These on-site BMP maintenance and operation instructions must be recorded as an attachment to the required declaration of covenant and grant of easement per Requirement 3 of Section C.1.3.4 of the City of Renton Surface Water Design Manual. The intent of these instructions is to explain to future property owners, the purpose of the BMP and how it must be maintained and operated. These instructions are intended to be a minimum; the City of Renton may require additional instructions based on site-specific conditions. See the City of Renton’s Surface Water Design Manual website for additional information and updates.

( T h i s p a g e i n t e n t i o n a l l y l e f t b l a n k . )

2017 City of Renton Surface Water Design Manual 12/12/2016
CITY OF RENTON
SURFACE WATER DESIGN MANUAL
REFERENCE 9
INTERIM CHANGES TO REQUIREMENTS 9-A BLANKET ADJUSTMENTS None at this time.
9-B ADMINISTRATIVE CHANGES Does not apply to the City.

REFERENCE 9: INTERIM CHANGES TO REQUIREMENTS
12/12/2016 2017 City of Renton Surface Water Design Manual
( T h i s p a g e i n t e n t i o n a l l y l e f t b l a n k . )

2017 City of Renton Surface Water Design Manual 12/12/2016
CITY OF RENTON
SURFACE WATER DESIGN MANUAL
REFERENCE 10
KING COUNTY-IDENTIFIED WATER QUALITY PROBLEMS Does not apply to the City.

REFERENCE 10: KING COUNTY-IDENTIFIED WATER QUALITY PROBLEMS
12/12/2016 2017 City of Renton Surface Water Design Manual
( T h i s p a g e i n t e n t i o n a l l y l e f t b l a n k . )

2017 City of Renton Surface Water Design Manual 12/12/2016
CITY OF RENTON
SURFACE WATER DESIGN MANUAL
REFERENCE 11 MATERIALS 11-A VACANT No text association with this section.
11-B VACANT No text association with this section.
11-C BIORETENTION SOIL MEDIA STANDARD SPECIFICATIONS See attached.
11-D VACANT No text association with this section.
11-E ROOFING ERODIBLE OR LEACHABLE MATERIALS See attached.

REFERENCE 11: MATERIALS
12/12/2016 2017 City of Renton Surface Water Design Manual 11-E-2
( T h i s p a g e i n t e n t i o n a l l y l e f t b l a n k . )

CITY OF RENTON SURFACE WATER DESIGN MANUAL
2017 City of Renton Surface Water Design Manual 12/12/2016
CITY OF RENTON
SURFACE WATER DESIGN MANUAL
REFERENCE 11-C BIORETENTION SOIL MEDIA STANDARD SPECIFICATIONS

REFERENCE 11: MATERIALS
12/12/2016 2017 City of Renton Surface Water Design Manual
( T h i s p a g e i n t e n t i o n a l l y l e f t b l a n k . )

CITY OF RENTON SURFACE WATER DESIGN MANUAL
2017 City of Renton Surface Water Design Manual 12/12/2016 11-C-1
REFERENCE 11-C
BIORETENTION SOIL MEDIA STANDARD SPECIFICATIONS
11-C.1 COMPOST Compost products shall be the result of the biological degradation and transformation of uncontaminated biological organic materials under controlled conditions designed to promote aerobic decomposition. Compost shall be stable with regard to oxygen consumption, carbon dioxide generation, and seed germination and seedling vigor. Compost shall be mature with regard to its suitability for use in stormwater facilities and BMPs, post-construction soil amendment, general landscaping, or an erosion control BMP as defined below.
Compost shall be tested at a minimum in accordance with the U.S. Composting Council “Testing Methods for the Examination of Compost and Composting” (TMECC), as established in the Composting Council’s “Seal of Testing Assurance” (STA) program. Most Washington compost facilities now use these tests. All tests must be done on compost screened to specification for its intended use.
11-C.1.A SPECIFICATION 1 COMPOST 1. Compost must be produced at a facility that is permitted by the jurisdictional health authority.
Permitted compost facilities in Washington are included on a list available at <http://www.ecy.wa.gov/programs/swfa/organics/soil.html>.
2. Compost must meet the definition of “composted material” in WAC 173-350-100, and must comply with testing parameters and other standards including not exceeding contaminant limits identified in Table 220-B. Testing Parameters, in WAC 173-350-220; and “Physical contaminants” (as defined in WAC 173-350-100) content less than 1% by weight (TMECC 03.08-A) total, not to exceed 0.25 percent film plastic by dry weight.
3. The compost product must originate a minimum of 65 percent by volume from recycled plant waste comprised of “yard debris,” “crop residues,” and “bulking agents” as those terms are defined in WAC 173-350-100. A maximum of 35 percent by volume of “post-consumer food waste” as defined in WAC 173-350-100 may be substituted for recycled plant waste. Biosolids, manure, and/or bedding straw or wood chips or shavings containing animal excreta are not allowed.
4. Wood waste from chemically treated lumber and manufactured wood products containing adhesives or any other chemical is not allowed; painted and stained wood are not allowed; and only sawdust from virgin lumber allowed. No other toxic or otherwise harmful materials are allowed.
5. For high-density residential subdivision development, multi-family, commercial, and industrial projects, and road projects considered high ADT projects,1 the Manufacturer or Vendor shall provide to the end buyer a list of feedstock sources by percentage by volume in the final compost product.
6. Compost shall have a moisture content that has no visible free water or dust produced when handling the material.
1 Land uses as described in Bullets 1, 2, and 3, SWDM Section 1.2.8.1, Subsection A “Basic WQ Treatment Areas, Required Treatment
Menu.”

REFERENCE 11: MATERIALS
12/12/2016 2017 City of Renton Surface Water Design Manual 11-C-2
7. Compost shall have an organic matter content of 40 percent to 65 percent by dry weight as determined by loss of ignition test method ASTM D 2974, or by U.S. Composting Council TMECC 05.07A “Loss-On-Ignition Organic Matter Method (LOI).”
8. Compost shall have a carbon to nitrogen ratio below 25:1, although the carbon to nitrogen ratio may be as high as 35:1 for plantings composed entirely of plants native to the Puget Sound Lowlands region. The carbon to nitrogen ratio shall be calculated on a dry weight basis using TMECC 5.02A (“Carbon to Nitrogen Ratio”), which uses TMECC 04.01A, “Organic Carbon” divided by the dry weight of “Total N” (TMECC 04.02D).
9. Compost pH shall be between 6.0 and 8.5 when tested in accordance with U.S. Composting Council TMECC 04.11-A, “1:5 Slurry pH.”
10. Soluble salt content shall be less than 4.0 dS/m (mmhos/cm) when tested in accordance with U.S. Composting Council TMECC 04.10 “Electrical Conductivity, 1:5 Slurry Method, Mass Basis.”
11. Compost maturity indicators from a cucumber bioassay (TMECC 05.05-A “Germination Seedling Emergence and Relative Growth) must be greater than 80% for both emergence and vigor”).
12. Stability shall be 7-mg CO2 – C/g OM/day or below in as determined by U.S. Composting Council TMECC 05.08-B “Carbon Dioxide Evolution Rate,” to establish low oxygen use and low CO2 generation rates.
Compost shall be screened to the Fine Compost size gradation specification in Section 11-C.1.C of this Reference.
11-C.1.B SPECIFICATION 2 COMPOST 1. Specification 2 Compost manufacturing, feedstocks, and testing are all identical to Specification 1
Compost except that:
a) A maximum of 35 percent by volume of biosolids or manure may be substituted for recycled plant waste.
b) Compost may be fine or coarse gradation depending on use and need to meet other screened material quality criteria.
c) Carbon to Nitrogen ratio may be up to 40:1 for coarse compost to be used as a surface mulch (not in a soil mix).
11-C.1.C COMPOST SCREENING SIZE GRADATIONS Where compost gradation is specified, it must meet the following size gradations when tested in accordance with the U.S. Composting Council “Test Methods for the Examination of Compost and Composting” (TMECC) Test Method 02.02-B.
Fine Compost shall meet the following gradation by dry weight: Minimum percent passing 2″ sieve 100% Minimum percent passing 1″ sieve 99% Minimum percent passing 5/8″ sieve 90% Minimum percent passing 1/4″ sieve 75%
Coarse Compost shall meet the following gradation by dry weight: Minimum Percent passing 3″ sieve 100% Minimum Percent passing 1″ sieve 90% Minimum Percent passing 3/4″ sieve 70% Minimum Percent passing 1/4″ sieve 40%

REFERENCE 11-C: BIORETENTION SOIL MEDIA STANDARD SPECIFICATIONS
2017 City of Renton Surface Water Design Manual 12/12/2016 11-C-3
11-C.1.D COMPOST ACCEPTANCE REQUIREMENTS The Contractor shall submit the following information to the King County Department of Permitting and Environmental Review (DPER) Engineer for approval:
1. If the manufacturer is not exempt under Table 220-A, “Terms and Conditions for Solid Waste Permit Exemptions,” a copy of the Solid Waste Handling Permit issued to the compost manufacturer by the Jurisdictional Health Department in accordance with WAC 173-350 (Minimum Functional Standards for Solid Waste Handling) or for biosolids composts a copy of the Coverage Under the General Permit for Biosolids Management issued to the manufacturer by the Department of Ecology in accordance with WAC 173-308 (Biosolids Management).
2. The Applicant shall provide written verification and lab analyses that the material complies with the processes, testing, and standards specified in WAC 173-350 and these Specifications. An independent Seal of Testing Assurance (STA) Program certified laboratory2 or a laboratory accredited by WA Ecology3 for the specified methods shall perform the analyses. Lab analysis shall be for the compost delivered on site for project use.
3. A copy of the STA laboratory’s Seal of Testing Assurance STA certification as issued by the U.S. Composting Council, or a copy of the Ecology-certified laboratory’s accreditation for the specified methods.
11-C.2 BIORETENTION SOIL MIX SPECIFICATIONS Follow the specification below for the approved default bioretention soil mix. Alterations to this specification require an approved adjustment.
11-C.2.A DEFAULT BIORETENTION SOIL MIX Bioretention Soil Mix (BSM) shall be a well-blended homogeneous mixture of Bioretention Mineral Aggregate and Bioretention Compost measured on a volume basis composed of:
• 35 to 40 percent by volume Specification 1 Compost per Section 11-C.1.A above and Section 11-C.2.B below.
• 60 to 65 percent by volume Bioretention Mineral Aggregate per Section 11-C.2.C below.
Projects which prefer to create a custom Bioretention Soil Mix rather than using the default requirement above must demonstrate compliance with criteria as described in Ecology’s Stormwater Management Manual for Western Washington (2014) Volume V – Runoff Treatment BMPs, except that any more stringent compost criteria required by this Reference 11-C are applicable.
11-C.2.B BIORETENTION COMPOST Bioretention Compost shall be Specification 1, Fine Compost per Sections 11-C.1.A and 11-C.1.C of this Reference. Fine Specification 1 Compost shall be used for Bioretention Soil Mix and for any compost used to amend bioretention cell soil.
2 A list of STA certified laboratories can be found at <http://compostingcouncil.org/labs/>. 3 A list of WA Ecology accredited laboratories can be found at <http://www.ecy.wa.gov/programs/eap/labs/>. Only laboratories
certified for the specified methods may be used for compost testing.

REFERENCE 11: MATERIALS
12/12/2016 2017 City of Renton Surface Water Design Manual 11-C-4
11-C.2.C BIORETENTION SOIL MIX AGGREGATE
Aggregate Gradation The following table provides a gradation guideline for the aggregate component of a Bioretention Soil Mix specification in western Washington. This sand gradation is often supplied as a well-graded utility or screened. With compost, this blend provides enough fines for adequate water retention, hydraulic conductivity within recommended range (see below), pollutant removal capability, and plant growth characteristics for meeting design guidelines and objectives.
TABLE 11-C.2.A BIORETENTION SOIL MIX MINERAL AGGREGATE GRADATION
Sieve Size Percent Passing 3/8″ 100 #4 95–100
#10 75–90 #40 25–40
#100 4–10 #200 2–4
Where existing soils meet the above aggregate gradation, those soils may be amended rather than importing mineral aggregate.
11-C.3 BIORETENTION MULCH Mulch may only be composed of either chipped wood as defined in Section 11-C.3.A, or compost as defined in Section 11-C.3.B. Mulch may not be made of synthetic materials including but not limited to recycled tire material, virgin rubber material, plastics; or pre-or post-consumer cardboard.
11-C.3.A ARBORIST’S WOOD CHIP MULCH Arborist Wood Chip Mulch shall be coarse ground wood chips (approximately 1/2″ to 6″ along the longest dimension) derived from the mechanical grinding or shredding of the above-ground portions of trees. It may contain wood, wood fiber, bark, branches, and leaves, but may not contain visible amounts of soil. It shall be free of weeds and weed seeds including but not limited to plants on the King County Noxious Weed list available at: <www.kingcounty.gov/weeds>, and shall be free of invasive plant portions capable of re-sprouting, including but not limited to horsetail, ivy, clematis, knotweed, etc. It may not contain more than 0.5% by dry weight of manufactured inert material (plastic, concrete, ceramics, metal, etc.).
Arborist Wood Chip Mulch, when tested, shall meet the following loose volume gradation:
TABLE 11-C.3.A ARBORIST WOOD MULCH GRADATION
Sieve Size Percent Passing 1 inch 100 2″ 95–100 1″ 70–100 5/8 0–50
No. 4 0 – 30
REFERENCE 11-C: BIORETENTION SOIL MEDIA STANDARD SPECIFICATIONS
2017 City of Renton Surface Water Design Manual 12/12/2016 11-C-5
Prior to delivery, the Applicant shall provide the following:
1. The source of the product and species of trees included in it;
2. A sieve analysis verifying the product meets the above size gradation requirement;
3. A representative sample of the product for County approval.
11-C.3.B COMPOST MULCH SPECIAL REQUIREMENTS • Compost Mulch for Bioretention must meet the Specification 1 compost requirements of
Section 11-C.1.A, except that the gradation must be Coarse Compost per Section 11-C.1.C
• Compost Mulch for other facilities and BMPs must meet either Specification 1 or Specification 2 compost of Section 11-C.1.A or 11-C.1.B respectively, except that the gradation must be Coarse Compost per Section 11-C.1.C.

REFERENCE 11: MATERIALS
12/12/2016 2017 City of Renton Surface Water Design Manual 11-C-6
( T h i s p a g e i n t e n t i o n a l l y l e f t b l a n k . )

CITY OF RENTON SURFACE WATER DESIGN MANUAL
2017 City of Renton Surface Water Design Manual 12/12/2016
CITY OF RENTON
SURFACE WATER DESIGN MANUAL
REFERENCE 11-E ROOFING ERODIBLE OR LEACHABLE MATERIALS

REFERENCE 11: MATERIALS
12/12/2016 2017 City of Renton Surface Water Design Manual
( T h i s p a g e i n t e n t i o n a l l y l e f t b l a n k . )

CITY OF RENTON SURFACE WATER DESIGN MANUAL
2017 City of Renton Surface Water Design Manual 12/12/2016 11-E-1
REFERENCE 11-E
ROOFING ERODIBLE OR LEACHABLE MATERIALS
METAL ROOFING COATING: INERT, NON-LEACHABLE MATERIAL Metal roofs are considered to be pollution generating impervious surface unless they are coated with PVDF (Polyvinylidene Fluoride) with a manufacturer’s 25-year or better guarantee of no metals leaching, and are not subject to venting significant amounts of dusts, mists, or fumes from manufacturing, commercial, or other indoor activities.
NON-METAL ROOFING TYPES THAT MAY POSE RISK BUT ARE NOT CURRENTLY REGULATED The following roof types are currently not regulated as pollution generating surfaces, but there is some evidence that they may pose risks to water quality. This information is provided to assist the public in making more informed choices.
These roof types include any roofing manufactured or treated with biocides for moss, algae, rot, or plant control; i.e., those containing any heavy metal such as copper, lead, zinc, silver, or arsenic, or organic biocides such as (R,S)-mecoprop bi-ester4 and terbutryn, carbendazim, and Irgarol 10515.
Other roof types that may pose risk include synthetic roofing materials that use zinc or any other leachable heavy metal as a manufacturing catalyst or for any other purpose, any roofing material containing any heavy metal as a UV stabilizer or for pigmentation6. Phthalates have also been noted as leaching from some synthetic roofing.
SPECIFIC EXAMPLES OF NON-METAL AND COATED METAL ROOFS FOR WHICH THERE IS DOCUMENTED EVIDENCE, OF SOME RUNOFF RISK
Roofs with Potential Risk Based on Regional Monitoring of Regionally Supplied Materials7,8
• Asphalt shingles with algae resistance (AR)
• EPDM (ethylene propylene diene monomer)
4 Bucheli, Thomas D., Stephan R. Müller, Andreas Voegelin, and René P. Schwarzenbach. 1998. Bituminous Roof Sealing Membranes as
Major Sources of the Herbicide (R,S)-Mecoprop in Roof Runoff Waters: Potential Contamination of Groundwater and Surface Waters. Environmental Science & Technology 32 (22):3465-3471.
5 Background literature review in support of the regional study by Ecology. Winters, Nancy. 2013. Quality Assurance Project Plan. Roofing Materials Assessment: Investigation of Toxic Chemicals in Roof Runoff. Publication No. 13-03-105. Lacey, WA: Washington State Department of Ecology.
6 Polybrominated diphenyl ethers (PBDE) or other fire retardants may be an issue in Central and Eastern Washington, but according to manufacturers on Ecology’s Roofing Task Force, these are not applied in Western Washington.
7 Materials provided by Western Washington manufacturers and/or vendors. First year of study. Winters, Nancy, and Kyle Graunke. 2014. Roofing Materials Assessment – Investigation of Toxic Chemicals in Roof Runoff. Lacey, WA. <https://fortress.wa.gov/ecy/publications/SummaryPages/1403003.html>.
8 Materials provided by Western Washington manufacturers and/or vendors. Winters, Nancy, Melissa McCall, and Allison Kingfisher. 2014. Roofing Materials Assessment – Investigation of Toxic Chemicals in Roof Runoff from Constructed Panels in 2013 and 2014. Publication No. 14-03-033. Lacey, WA.

REFERENCE 11: MATERIALS
12/12/2016 2017 City of Renton Surface Water Design Manual 11-E-2
• Manufacturer-painted galvanized steel, painted with silicone-modified polyester paint9,7
• PVC (polyvinyl chloride)
• Treated wood shakes
Roofs with Potential Risk Based on Other Studies9
• Asphalt shingles
• Asphalt fiberglass shingles
• Asphalt (residential)
• Asphalt impregnated with copper
• Asphalt roofs with moss-control zinc strips
• Bituminous roof sealing membrane for green roof, treated to inhibit root penetration
• Built-up commercial
• Built-up with coal tar
• Cedar shakes
• Ceramic tile
• Clay tile
• Concrete tile
• Ethylene propylene diene monomer (EPDM or rubber roofing)
• Galfan (aluminum-coated)
• Gravel
• Impregnated wood
• Ondura
• Painted steel
• Pressure treated/water sealed wood
• Polyester
• Polyvinyl Chloride (PVC)
• Synthetic roofing materials, e.g., thermoplastic olefin (TPO)
• Rubber
• Treated roofing materials (non-specific as cited)
• Vegetated roof
• Wood shingle
9 Background literature review in support of the regional study by Ecology. Winters, Nancy. 2013. Quality Assurance Project Plan. Roofing
Materials Assessment: Investigation of Toxic Chemicals in Roof Runoff. Publication No. 13-03-105. Lacey, WA: Washington State Department of Ecology.

2017 City of Renton Surface Water Design Manual 12/12/2016
CITY OF RENTON
SURFACE WATER DESIGN MANUAL
REFERENCE 12
VACANT No text associated with this section.

REFERENCE 12: VACANT
12/12/2016 2017 City of Renton Surface Water Design Manual
( T h i s p a g e i n t e n t i o n a l l y l e f t b l a n k . )

2017 City of Renton Surface Water Design Manual 12/12/2016
CITY OF RENTON
SURFACE WATER DESIGN MANUAL
REFERENCE 13
VACANT No text associated with this section.

REFERENCE 13: VACANT
12/12/2016 2017 City of Renton Surface Water Design Manual
( T h i s p a g e i n t e n t i o n a l l y l e f t b l a n k . )

2017 City of Renton Surface Water Design Manual 12/12/2016
CITY OF RENTON
SURFACE WATER DESIGN MANUAL
REFERENCE 14
SUPPLEMENTAL APPROVED FACILITIES 14-A CITY OF RENTON APPROVED PROPRIETARY FACILITIES
FOR USE ON PRIVATE DEVELOPMENT PROJECTS
14-B CITY OF RENTON APPROVED PROPRIETARY FACILITIES FOR USE IN PUBLIC PROJECTS

REFERENCE 14: SUPPLEMENTAL APPROVED FACILITIES
12/12/2016 2017 City of Renton Surface Water Design Manual
( T h i s p a g e i n t e n t i o n a l l y l e f t b l a n k . )

CITY OF RENTON SURFACE WATER DESIGN MANUAL
2017 City of Renton Surface Water Design Manual 12/12/2016 Ref 14-A-1
REFERENCE 14-A
CITY OF RENTON APPROVED PROPRIETARY FACILITIES FOR USE ON PRIVATE DEVELOPMENT PROJECTS The proprietary facilities summarized in Table 14.A are approved by the City for use on private development projects. The General Use Level Designation (GULD) letters for each of the approved facilities listed in Table 14.A are included in this reference section. These GULD letters outline the sizing requirements and maintenance requirements for each approved proprietary facility. Appendix A also includes more detailed maintenance information for the proprietary facilities listed in Reference Section 14-B.
TABLE 14.A PROPRIETARY FACILITIES- CURRENT APPROVALS
Proprietary Facility Name Basic WQ Enhanced Basic WQ
Lake Protection High-Use Pretreatment
BayFilter X MWS-Linear Modular Wetland
X X X
Filterra System X X X X Filterra Bioscape X X X X Media Filtration System X StormFilter using PhosphoSorb Media
X X
StormFilter using ZPG Media
X
FloGard Perk Filter X X ecoStorm plus X Aqua-Swirl System X CDS Stormwater Treatment System
X
Vortechs System X Downstream Defender X Stormceptor X Other Facilities with a General Use Level Designation (GULD)
X X X X X

REFERENCE 14: SUPPLEMENTAL APPROVED FACILITIES
12/12/2016 2017 City of Renton Surface Water Design Manual Ref 14-A-2
( T h i s p a g e i n t e n t i o n a l l y l e f t b l a n k . )

May 2016
GENERAL USE LEVEL DESIGNATION FOR PRETREATMENT
CONDITIONAL USE LEVEL DESIGNATION FOR BASIC TREATMENT
For
AquaShieldTM, Inc.’s Aqua-Swirl® Stormwater Treatment System
Ecology’s Decision:
Based on AquaShieldTM, Inc. application submissions, Ecology hereby issues the following
use level designations:
1. General Use Level Designation (GULD) for the Aqua-Swirl® for pretreatment use (a)
ahead of infiltration treatment, or (b) to protect and extend the maintenance cycle of a
Basic or Enhanced Treatment device (e.g., sand or media filter). This GULD applies to
Aqua-SwirlTM units sized at water quality design flow rate of no more than 23 GPM/sf
at the Water Quality design flow rate.
2. Conditional Use Level Designation (CULD) for the Aqua-Swirl® for standalone Basic (TSS)
treatment, sized at a water quality design flow rate of rate of no more than 23 GPM/sf.
3. The water quality design flow rates are calculated using the following procedures:
Western Washington: for treatment installed upstream of detention or retention,
the water quality design flow rate is the peak 15-minute flow rate as calculated using
the latest version of the Western Washington Hydrology Model or other Ecology-
approved continuous runoff model.
Eastern Washington: For treatment installed upstream of detention or retention,
the water quality design flow rate is the peak 15-minute flow rate as calculated using
one of the three methods described in Chapter 2.2.5 of the Stormwater Management
Manual for Eastern Washington (SWMMEW) or local manual.
Entire State: For treatment installed downstream of detention, the water quality
design flow rate is the full 2-year release rate of the detention facility.

Table 1 lists the Standard Aqua-Swirl® Models available. The model designated AS-XX
allows for custom designs including multiple (twin) units.
Table 1. Standard Aqua-Swirl® Models
Model Swirl Chamber
Diameter (ft)
Area
(ft2)
AS-2 2.5 4.9
AS-3 3.3 8.6
AS-4 4.3 14.5
AS-5 5.0 19.6
AS-6 6.0 28.3
AS-7 7.0 38.5
AS-8 8.0 50.3
AS-9 9.0 63.6
AS-10 10.0 78.5
AS-11 11.0 95.0
AS-12 12.0 113.1
AS-13 13.0 132.7
AS-XX* Custom
* Custom designs to meet site-specific water quality treatment flow.
Can include multiple (twin) and custom units.
The GULD designation has no expiration date but it may be amended or revoked by
Ecology and is subject to the conditions specified below.
The CULD expires on November 1, 2018 unless extended by Ecology, and is subject to the
conditions specified below.
Ecology’s Conditions of Use:
1. Design, assemble, install, operate, and maintain Aqua-Swirl® units in accordance with
AquaShieldTM, Inc.’s applicable manuals and documents and the Ecology Decision.
2. AquaShieldTM, Inc. commits to submitting a QAPP for Ecology review and approval by
October 1, 2017 that meets the TAPE requirements for attaining a GULD for basic
treatment. The selected field-testing site(s) should reflect the product’s treatment intent.
3. AquaShieldTM, Inc. shall complete all required testing and submit a TER for Ecology
review by August 1, 2018.
4. AquaShieldTM, Inc. may request Ecology to grant deadline or expiration date
extensions, upon showing cause for such extensions.
5. Discharges from the Aqua-Swirl® shall not cause or contribute to water quality
standards violations in receiving waters.

Applicant: AquaShieldTM, Inc.
Applicant’s Address: 2719 Kanasita Drive
Chattanooga, TN 37343
Application Documents:
Aqua-Filter™ Stormwater Treatment System, Application for Stormwater Quality
Treatment Pilot Use Designation (Short-Term) for Basic, Enhanced, Oil, and Treatment
Train Treatment in Western Washington submitted to Stan Ciuba, Washington State
Department of Ecology (August 21, 2003)
NJCAT Technology Verification: Aqua-Swirl™ Concentrator and Aqua-Filter™
Stormwater Treatment System (September 2005)
NJCAT Technology Verification. Aqua-Swirl® Model AS-5 Stormwater Treatment
System, AquaShield™, Inc. November 2012
NJCAT Field Test Verification Report Letter, Aqua-Swirl® Model AS-5, February 15,
2013.
Applicant’s Use Level Request:
General Use Level Designation as a Basic Treatment device in accordance with Ecology’s 2012
Stormwater Management Manual for Western Washington.
Applicant’s Performance Claims:
Based on laboratory studies, the Aqua-Swirl® Model AS-3, has been shown to have a total
suspended solids removal efficiency (measured as suspended sediment concentration) of 60%
when operated at 60% of its water quality treatment flow using OK-110 silica with a d50 particle
size of 110 microns, and average influent of 320 mg/L and zero initial sediment loading.
Ecology’s Recommendations:
Ecology finds that:
AquaShieldTM, Inc. qualifies for the opportunity to demonstrate, through field-testing in
the Pacific Northwest, whether the Aqua-Swirl® can attain Ecology’s Basic treatment
goals. The GULD approval for Pre-Treatment using the Aqua-Swirl® remains in effect.

Findings of Fact:
1. The Aqua-Swirl®, sized at no more than 23 GPM/sf, should provide equivalent performance
to a presettling basin as defined in the most recent version of Stormwater Management
Manual for Western Washington, Volume V, Chapter 6 (BMP T6.10). Note: This reference
applies to use in Eastern Washington as well.
2. Tennessee Tech University completed laboratory testing for removal of US Silica OK-110
silica using an Aqua-Swirl® Model AS-3. Laboratory results for this 50 to 125-micron silica
showed 80% removal at about 23 GPM/sf operating rate. Estimated annual TSS removal
efficiency, based on Portland, ME rainfall, is 91%.
3. Findings from the NJCAT Technology Verification report for field testing an Aqua-Swirl®
Model AS-5 include:
a. Aqua-Swirl® monitored 18 storm events in Maryland from 2009 through 2011.
b. Influent TSS was greater than 100 mg/L for 8 events. Average annual TSS removal
was 86.6 percent.
c. Influent TSS was less than 100 mg/L for 10 events. Effluent TSS for all 10 events
was less than 20 mg/L.
d. Influent particle size was 72 percent silt (based on three samples).
e. Aqua-Swirl® monitored the system up to a maximum of 41.2 GPM/sf. They
maintained an 80 percent removal of TSS per storm event up to approximately 23
GPM/sf.
Other Aqua-Swirl® Related Issues to be Addressed By the Company:
1. Resuspension: The Aqua-Swirl® Model AS-5 field test included 16 storm events at less than
23 GPM/sf. Effluent TSS for these 16 storms was less than 20 mg/L and averaged 7.9 mg/L.
Influent TSS ranged from 27.8 to 266.3 mg/L and averaged 125.3 mg/L. Given the lack of
resuspension at less than 23 GPM/sf, users can install the Aqua-Swirl® off-line or on-line.
2. AquaShield should test the system under normal operating conditions, such as partially
filling the swirl concentrator with pollutants. Results obtained for “clean” systems may not
be representative of typical performance.
Technology Description: Download at http://www.aquashieldinc.com
Contact Information:
Applicant: Mark B. Miller
AquaShieldTM, Inc.
888-344-9044
Applicant website: http://www.aquashieldinc.com

Ecology web link: http://www.ecy.wa.gov/programs/wq/stormwater/newtech/index.html
Ecology: Douglas C. Howie, P.E.
Department of Ecology
Water Quality Program
(360) 407-6444
Revision History
Date Revision
November 2006 GULD for Pre-Treatment
August 2007 Document updated
December 2012 Modified Design Storm Description, added Revision Table
October 2013 CULD for Basic Treatment
February 2014 Modified due dates for QAPP and TER, changed expiration date
August 2014 Modified due dates for QAPP and TER, changed expiration date
May 2016 Modified due dates for QAPP and TER, changed expiration date

Note: Some pages in this document have been purposely skipped or blank pages inserted so that this document will copy correctly when duplexed.

January 2016
GENERAL USE LEVEL DESIGNATON FOR BASIC TREATMENT
CONDITIONAL USE LEVEL DESIGNATION FOR ENHANCED, AND
PHOSPHORUS TREATMENT
For
BaySaver Technologies, LLC BayFilter™
Ecology’s Decision:
1. Based on BaySaver Technologies’ application submissions, Ecology hereby issues a
Basic Treatment General Use Level Designation (GULD) for the BayFilter™.
As a stormwater treatment device for Basic treatment (TSS) removal.
The Basic Treatment GULD is for both the BayFilter Cartridge (BFC) and
Enhanced Media Cartridge (EMC) and limited to the following maximum flow
rates:
a. BFC Cartridge maximum flow rate of 0.70 gpm/sq ft
o 30 gpm (0.067 cfs) per cartridge (example dimensions: 26-inches in diameter,
29-inches tall (43 sq ft filter area))
Canisters that provide 0.70 gpm per sq ft filter area, regardless of
dimensions meet this requirement
o Media Blend of Silica Sand, Perlite, and Activated Alumina
b. EMC Cartridge maximum flow rate of 0.50 gpm/sq ft
o 45 gpm (0.10 cfs) per cartridge (example dimensions 30-inch diameter, 30-
inches tall (90 sq ft filter area))
Canisters that provide 0.50 gpm per sq ft filter area, regardless of
dimensions meet this requirement
o 75 gpm (0.167 cfs) per cartridge (example dimensions 39-inch diameter, 30-
inches tall) (150 sq ft filter area))
Canisters that provide 0.50 gpm per sq ft filter area, regardless of
dimensions meet this requirement
o Media Blend of Zeolite, Perlite, and Activated Alumina

2. Based on BaySaver Technologies’ application submissions, Ecology hereby issues a
Enhanced and Phosphorus Conditional Use Level Designation (CULD) for the
BayFilter™ cartridges.
As a stormwater treatment device for Enhanced treatment (dissolved Cu and
dissolved Zn removal) and Phosphorus treatment.
Sized at a design rates no greater than those listed above (GULD (Basic) Flow
rates).
3. Ecology approves use of BayFilter™ Cartridges for treatment at the above flow rates
per cartridge. Designers shall calculate the water quality design flow rates using the
following procedures:
Western Washington: For treatment installed upstream of detention or retention,
the water quality design flow rate is the peak 15-minute flow rate as calculated using
the latest version of the Western Washington Hydrology Model or other Ecology-
approved continuous runoff model.
Eastern Washington: For treatment installed upstream of detention or retention,
the water quality design flow rate is the peak 15-minute flow rate as calculated using
one of the three methods described in Chapter 2.2.5 of the Stormwater Management
Manual for Eastern Washington (SWMMEW) or local manual.
Entire State: For treatment installed downstream of detention, the water quality
design flow rate is the full 2-year release rate of the detention facility.
4. The CULDs expire on December 31, 2016 unless extended by Ecology, and are subject
to the conditions specified below.
5. The GULD has no expiration date, but it may be amended or revoked by Ecology, and
is subject to the conditions specified below.
Ecology’s Conditions of Use:
BayFilter™ units shall comply with these conditions:
1. Design, assemble, install, operate, and maintain BayFilter™ units in accordance with
BaySaver Technologies’ applicable manuals and documents and the Ecology Decision.
2. Maintenance: The required inspection/maintenance interval for stormwater treatment
devices is often dependent upon the efficiency of the device and the degree of pollutant
loading from a particular drainage basin. Therefore, Ecology does not endorse or
recommend a “one size fits all” maintenance cycle for a particular model/size of
manufactured filter treatment device.

BaySaver recommends that the following be considered during the design
application of the BayFilter Cartridge systems:
o Water Quality Flow Rate
o Anticipated Pollutant Load
o Maintenance Frequency
A BayFilter System tested adjacent to construction activity required maintenance
after 4-months of operation. Monitoring personnel observed construction washout
in the device during the testing period; the construction activity may have resulted
in a shorter maintenance interval.
Ecology has found that pre-treatment device prior to the BayFilter system can
provide a reduction in pollutant loads on these systems, thereby extending the
maintenance interval.
Test results provided to Ecology from other BayFilter Systems, including the above
mentioned system that was evaluated again after construction activities had been
completed, have indicated the BayFilter System typically has longer maintenance
intervals, sometimes exceeding 12-months.
The BayFilter system contains filter fabric that is highly oleophilic (oil absorptive).
When sufficient quantities of oils are present in the runoff, the oil and subsequent
sediment particles may become attached to the fabric. As a result, it may
compromise the maintenance interval of the BayFilter system. Oil control BMP’s
should be installed upstream of BayFilter installations if warranted, and/or the
BayFilter system should be inspected after any known oil spill or release.
Owners/operators must inspect BayFilter systems for a minimum of twelve months
from the start of post-construction operation to determine site-specific
inspection/maintenance schedules and requirements. Owners/operators must
conduct inspections monthly during the wet season, and every other month during
the dry season. (According to the SWMMWW, the wet season in western
Washington is October 1 to April 30. According to SWMMEW, the wet season in
eastern Washington is October 1 to June 30.) After the first year of operation,
owners/operators must conduct inspections based on the findings during the first
year of inspections or the manufacturer’s anticipated maintenance interval,
whichever is more frequent.
Conduct inspections by qualified personnel, follow manufacturer’s guidelines, and
must use methods capable of determining either a decrease in treated effluent
flowrate and/or a decrease in pollutant removal ability.

3. When inspections are performed, the following findings typically serve as maintenance
triggers:
Accumulated vault sediment depths exceed an average of 2 inches, or
Accumulated sediment depths on the tops of the cartridges exceed an average of 0.5
inches, or
Standing water remains in the vault between rain events.
Bypass during storms smaller than the design storm.
Note: If excessive floatables (trash and debris) are present, perform minor
maintenance consisting of gross solids removal, not cartridge replacement.
4. BaySaver Technologies Inc. commits to submitting a QAPP for Ecology approval by
February 1, 2015 that meets the TAPE requirements for attaining a GULD for
enhanced and phosphorus treatment. The monitoring site(s) chosen should be
reflective of the product’s treatment intent. BaySaver shall monitor sites prior to
installation of the canister to ensure concentrations of the monitored constituents are
within TAPE guidelines.
5. BaySaver Technologies Inc. shall complete all required testing and submit a TER for
enhanced and phosphorus treatment for Ecology review by April 30, 2015.
6. BaySaver Technologies Inc. may request Ecology to grant deadline or expiration date
extensions, upon showing cause for such extensions.
7. Discharges from the BayFilter™ units shall not cause or contribute to water quality
standards violations in receiving waters.
Applicant: Advanced Drainage Systems - BaySaver
Applicant’s Address: 4640 Trueman Blvd
Hilliard, Ohio 43065
Application Documents:
Technical Evaluation Report BayFilter System, Grandview Place Apartments, Vancouver,
Washington and Appendices A through O (May 18, 2011)
Washington State Department of Ecology Technology Assessment Protocol –
Environmental BayFilter™ Conditional Use Designation Application (March 2007)
BaySaver Technologies, Inc. BayFilter™ System Washington State Technical and Design
Manual, Version 1.1 (December 2006)
Efficiency Assessment of BaySeparator and Bay filter Systems in the Richard Montgomery
High School January 6.2009.
Evaluation of MASWRC Sample Collection, Sample Analysis, and Data Analysis,
December 27, 2008
Letter from Mid-Atlantic Stormwater Research Center to BaySaver Technologies, In.
dated October 22, 2009.

Letter from Mid-Atlantic Stormwater Research Center to BaySaver Technologies, In.
dated November 5, 2009.
Maryland Department of the Environment letter to BaySaver Technologies dated Jan. 13,
2008 regarding approval of BayFilter as a standalone BMP for Stormwater treatment.
NJCAT letter to BaySaver Technologies dated June 18, 2009 regarding Interim
Certification.
Applicant’s Use Level Request:
General use level designation as a basic, enhanced, and phosphorus treatment device in
accordance with Ecology’s Stormwater Management Manual for Western Washington.
Applicant’s Performance Claims:
Removes and retains 80% of TSS based on laboratory testing using Sil-Co-Sil 106 as a
laboratory stimulant.
Removes 42% of dissolved Copper and 38% of dissolved Zinc.
Expected to remove 50% of the influent phosphorus load.
Ecology’s Recommendations:
Ecology finds that:
Ecology should provide BaySaver Technologies, Inc. with the opportunity to demonstrate,
through additional laboratory and field-testing, whether the BayFilter™ system (as a
single treatment facility) can attain Ecology’s Enhanced Treatment and Phosphorus
removal goals.
Findings of Fact:
Based on field testing in Vancouver, WA, at a flow rate less than or equal to 30 gpm per
canister, the BayFilter™ system demonstrated a total suspended solids removal efficiency
of greater than 80% for influent concentrations between 100 and 200 mg/l and an effluent
concentration < 20 mg/l for influent concentration < 100 mg/l.
Based on laboratory testing, at a flowrate of 30 GPM per filter, the BayFilter™ system
demonstrated a total suspended solids removal efficiency of 81.5% using Sil-Co-Sil 106
with an average influent concentration of 268 mg/L and zero initial sediment loading.
Based on laboratory testing, at a flowrate of 30 GPM per filter, the BayFilter™ system
demonstrated a dissolved phosphorus removal efficiency of 55% using data from the
Richard Montgomery High School field-testing. The average influent concentration was
0.31 mg/L phosphorus and zero initial sediment loading.

Based on data from field-testing at Richard Montgomery High School in Rockville, MD
the BayFilter system demonstrated a Cu removal efficiency of 51% and 41% for total and
dissolved Cu respectively. Average influent concentrations are 41.6 µg/l total and 17.5
µg/l dissolved.
Based on data from field-testing at Richard Montgomery High School in Rockville, MD
the BayFilter system demonstrated a Zn removal efficiency of 45% and 38% for total and
dissolved Cu, respectively. Average influent concentrations are 354 µg/l total and 251
µg/l dissolved, respectively.
Other BayFilter™ Related Issues to be Addressed By the Company:
1. The Washington State field test results submitted in the TER do not yet show whether the
BayFilter™ system can reliably attain 30% removal of dissolved Cu, 60% removal of
dissolved Zn, or 50% removal of Total Phosphorus found on local highways, parking lots,
and other high-use areas at the design operating rate.
2. BaySaver Technologies, Inc. should test a variety of operating rates to establish conservative
design flow rates.
3. The manufacturer should continue to monitor the system to measure bypass and to calculate
if the system treats 91% of the volume of the total annual runoff volume.
4. The manufacturer should test the system under normal operating conditions, with a partially
pollutant filled settling basin. Results obtained for “clean” systems may not be representative
of typical performance.
5. Conduct field-testing at sites that are indicative of the treatment goals.
6. BaySaver should continue monitoring the system for a longer period to help establish a
maintenance period and to obtain data from additional qualified storms. Conduct testing to
obtain information about maintenance requirements in order to come up with a maintenance
cycle.
7. Conduct loading tests on the filter to determine maximum treatment life of the system.
8. Conduct testing to determine if oils and grease affect the treatment ability of the filter. This
should include a determination of how oil and grease may affect the ion-exchange capacity of
the system if BaySaver wishes to make claims for phosphorus removal.
9. BaySaver should develop easy-to-implement methods of determining when a BayFilter system
requires maintenance (cleaning and filter replacement).
10. BaySaver must update their O&M documents to include information and instructions on the
“24-hour draw-down” method to determine if cartridges need replacing.

Technology Description: Download at www.BaySaver.com
Contact Information:
Applicant: Daniel Figola
Advanced Drainage Systems - BaySaver
4640 Trueman Blvd
Hilliard, Ohio 43065
(614) 658-0265
Applicant website: www.BaySaver.com
Ecology web link: http://www.ecy.wa.gov/programs/wq/stormwater/newtech/index.html
Ecology: Douglas C. Howie, P.E.
Department of Ecology
Water Quality Program
(360) 407-6444
Revision History
Date Revision
April 2008 Original use-level-designation document
February 2010 Revision
August 2011 GULD awarded for Basic Treatment
April 2012 Maintenance requirements updated.
August 2012 Revised design storm criteria
December 2012 Revised contact information and document formatting
December 2013 Revised expiration and submittal dates
December 2014 Revised Inspection/maintenance discussion, Updated cartridge
descriptions
January 2015 Revised discussion for flow rate controls
December 2015 Revised Expiration date
January 2016 Revised Manufacturer Contact Information and expiration date

Note: Some pages in this document have been purposely skipped or blank pages inserted so that this document will copy correctly when duplexed.

July 2016
GENERAL USE LEVEL DESIGNATION FOR PRETREATMENT (TSS) AND
CONDITIONAL USE LEVEL DESIGNATION FOR OIL CONTROL
For
CONTECH Engineered Solutions CDS® System
Ecology’s Decision:
Based on the CONTECH Engineered Solutions (CONTECH) application submissions for
the CDS® System, Ecology hereby issues the following use designations for the CDS storm
water treatment system:
1. General Use Level Designation (GULD) for pretreatment use, as defined in Ecology’s
2011 Technical Guidance Manual for Evaluating Emerging Stormwater Treatment
Technologies Technology Assessment Protocol – Ecology (TAPE) Table 2, (a) ahead of
infiltration treatment, or (b) to protect and extend the maintenance cycle of a basic,
enhanced, or phosphorus treatment device (e.g., sand or media filter). This GULD
applies to 2,400 micron screen CDS® units sized per the table below.
2. Conditional Use Level Designation (CULD) for oil and grease treatment. This CULD
applies to 2400 micron screen CDS units sized per the table above at the water quality
design flowrate as determined using the Western Washington Hydrology Model
(WWHM).
3. The following table shows flowrates associated with various CDS models:
CDS Model Water Quality Flow
cfs L/s
Pre
cast
**
Inlin
e o
r O
fflin
e
CDS 2015-4 0.7 19.8
CDS 2015-5 0.7 19.8
CDS 2020-5 1.1 31.2
CDS2025-5 1.6 45.3
CDS3020-6 2 56.6
CDS3030-6 3 85.0
CDS3035-6 3.8 106.2
CDS4030-8 4.5 127.4
CDS4040-8 6 169.9
CDS4045-8 7.5 212.4
CDS5640-10 9 254.9
CDS5653-10 14 396.5
CDS5668-10 19 538.1

CDS5678-10 25 7.08
Off
line
On
ly
CDS3030-V 3 85
Pre
cast
**
CDS4030-7 4.5 127.4
CDS4040-7 6 169.9
CDS4045-7 7.5 212.4
CDS5640-8 9 254.9
CDS5653-8 14 396.5
CDS5668-8 19 538.1
CDS5678-8 25 708
CDS5042 9 254.9
CDS5050 11 311.5
CDS7070 26 736.3
CDS10060 30 849.6
CDS10080 50 1416
CDS100100 64 1812.5
Cast In
Place
CDS150134-22 148 4191.4
CDS200164-26 270 7646.6
CDS240160-32 300 8496.2
*Specially Designed CDS Units may be approved by Ecology on a on a site-by-site basis.
**Contact Contech for updated model numbers if PMIU, PMSU, PSW, PSWC are specified.
4. The water quality design flow rates are calculated using the following procedures:
Western Washington: For treatment installed upstream of detention or retention,
the water quality design flow rate is the peak 15-minute flow rate as calculated using
the latest version of the Western Washington Hydrology Model or other Ecology-
approved continuous runoff model.
Eastern Washington: For treatment installed upstream of detention or retention,
the water quality design flow rate is the peak 15-minute flow rate as calculated using
one of the three methods described in Chapter 2.2.5 of the Stormwater Management
Manual for Eastern Washington (SWMMEW) or local manual.
Entire State: For treatment installed downstream of detention, the water quality
design flow rate is the full 2-year release rate of the detention facility.
5. The pretreatment GULD has no expiration date; however, Ecology may amend or
revoke the designation.
6. The oil and grease CULD expires on December 31, 2017 unless extended by Ecology.
7. All designations are subject to the conditions specified below.

8. Properly designed and operated CDS systems may also have applicability in other
situations (example: low-head situations such as bridges or ferry docks), for TSS and
oil/grease removal where, on a case-by-case basis, it is found to be infeasible or
impracticable to use any other approved practice. Jurisdictions covered under the
Phase I or II municipal stormwater permits should use variance/exception procedures
and criteria as required by their NPDES permit.
9. Ecology finds that the CDS, sized according to the table above, could also provide water
quality benefits in retrofit situations.
Ecology’s Conditions of Use:
CDS systems shall comply with these conditions:
1. Design, assemble, install, operate, and maintain CDS Systems in accordance with
Contech’s applicable manuals and documents and the Ecology decision and conditions
specified herein. Ecology recommends use of the inspection and maintenance schedule
included as Attachment 1.
2. Discharges from the CDS System shall not cause or contribute to water quality
standards violations in receiving waters.
3. Contech commits to testing the QAPP accepted by Ecology on September 17, 2014 for
attaining a GULD for Oil Treatment. Ecology must review and approve additional
QAPPs for each CULD field site in Washington State. Choose sites to reflect the
product’s treatment intent.
4. Contech shall complete all required testing and submit a TER on pretreatment and oil
and grease removal for Ecology review by September 15, 2017.
5. Contech may request Ecology to grant deadline or expiration date extensions, upon
showing cause for such extensions.
Applicant: Contech Engineered Solutions
Applicant’s Address: 11835 NE Glen Widing Drive
Portland, OR 97220
Application Documents:
Contech Stormwater Solutions Application to: Washington State Department of Ecology
Water Quality Program for General Use Level Designation – Pretreatment Applications
and Conditional Use Level Designation – Oil Treatment of the Continuous Deflective
Separation (CDS™) Technology (June 2007)

Strynchuk, Royal, and England, The Use of a CDS Unit for Sediment Control in Brevard
County.
Walker, Allison, Wong, and Wootton, Removal of Suspended Solids and Associated
Pollutants by a CDS Gross Pollutant Trap, Cooperative Research Centre for Catchment
Hydrology, Report 99/2, February 1999
Allison, Walker, Chiew, O’Neill, McMahon, From Roads to Rivers Gross Pollutant
Removal from Urban Waterways, Cooperative Research Centre for Catchment Hydrology,
Report 98/6, May 1998
Quality Assurance Project Plan CDS® for Oil Treatment Performance Evaluation received
by Ecology January 15th 2013.
CDS with Sorbents Preliminary Report received by Ecology October 15, 2015.
Applicant’s Use Level Request:
General use level designation as a pretreatment device and conditional use level
designation as an oil and grease device in accordance with Ecology’s Stormwater
Management Manual for Western Washington.
Applicant’s Performance Claims:
Based on laboratory trials, the CDS™ System will achieve 50% removal of total suspended
solids with d50 of 50-μm and 80% removal of total suspended solids with d50 of 125-μm at 100%
design flowrate with typical influent concentration of 200-mg/L.
Contech can design the CDS™ system to achieve the effluent concentration less than 10 mg/L
for total petroleum hydrocarbons.
The CDS system equipped with standard oil baffle and addition of oil sorbent is effective in
control of oil and maintain the TPH level below the Ecology-specified level (<10-mg/L) for
applications in typical urban runoff pollution control.
Ecology’s Recommendation:
Ecology finds that:
The CDS™ system, sized per the table above, should provide, at a minimum, equivalent
performance to a presettling basin as defined in the most recent Stormwater Management
Manual for Western Washington, Volume V, Chapter 6.

Findings of Fact:
1. Laboratory testing was completed on a CDS 2020 unit equipped with 2400-m screen using
OK-110 sand (d50 of 106-μm) at flowrates ranging from 100 to 125% of the design flowrate
(1.1 cfs) with a target influent of 200 mg/L. Laboratory results for the OK-110 sand showed
removal rates from about 65% to 99% removal with 80% removal occurring near 70% of the
design flowrate.
2. Laboratory testing was completed on a CDS 2020 unit equipped with 2400-m screen using
“UF” sediment (d50 of 20 to 30-μm) at flowrates ranging from 100 to 125% of the design
flowrate (1.1 cfs) with a target influent of 200 mg/L. Laboratory results for the “UF”
sediment showed removal rates from about 42% to 94% removal with 80% removal
occurring at 5% of the design flowrate.
3. Laboratory testing was completed on a CDS 2020 unit equipped with 4700-m screen using
OK-110 sand (d50 of 106-μm) at flowrates ranging from 100 to 125% of the design flowrate
(1.1 cfs) with a target influent of 200 mg/L. Laboratory results for the OK-110 sand showed
removal rates from about 45% to 99% removal with an average removal of 83.1%.
4. Laboratory testing was completed on a CDS 2020 unit equipped with 4700-m screen using
“UF” sediment (d50 of 20 to 30-μm) at flowrates ranging from 100 to 125% of the design
flowrate (1.1 cfs) with a target influent of 200 mg/L. Laboratory results for the “UF”
sediment showed removal rates from about 39% to 88% removal with an average removal of
56.1%.
5. Contech completed laboratory testing on a CDS2020 unit using motor oil at flowrates
ranging from 25% to 75% of the design flowrate (1.1 cfs) with influents ranging from 7 to 47
mg/L. Laboratory results showed removal rates from 27% to 92% removal. A spill test was
also run at 10% of the design flowrate with an influent of 82,000 mg/L with an average
percent capture of 94.5%
6. Independent parties in California, Florida, and Australia completed various field studies.
Field studies showed the potential for the unit to remove oils and grease and total suspended
solids, and capture 100% gross solids greater than the aperture size of the screen under
treatment flow rate.
7. Contech is conducting a field evaluation of a CDS2015 with Sorbents for oil and grease
removal. To date, the unit has been evaluated at flow rates ranging from 42% to 119% of the
design flow rate (0.28cfs) with influent motor oil concentrations ranging from 0.46 to 64.8
mg/L (median of 4.5 mg/L; mean of 12.6 mg/L). A preliminary report showed a mean motor
oil removal efficiency of 72%, with a UCL95 for effluent concentration of 0.75 mg/L.
8. CDS Technology has been widely accepted with over 6,200 installations in the United States
and Canada. There are over 1,380 installations in Washington and Oregon.

Technology Description:
Engineers can download a technology description from the company’s website.
www.conteches.com
Recommended Research and Development:
Ecology encourages Contech to pursue continuous improvements to the CDS system. To that
end, Ecology makes the following recommendations:
1. Conduct testing to quantify the flowrate at which resuspension occurs.
2. Conduct testing on various sized CDS units to verify the sizing technique is appropriate.
3. Test the system under normal operating conditions, pollutants partially filling the swirl
concentrator. Results obtained for “clean” systems may not be representative of typical
performance.
Contact Information:
Applicant Contact: Sean Darcy
Contech Engineered Solutions
(800) 548-4667
Applicant website: http://www.conteches.com/

Ecology web link: http://www.ecy.wa.gov/programs/wq/stormwater/newtech/index.html
Ecology: Douglas C. Howie. P.E.
Department of Ecology
Water Quality Program
(360) 407-6444
Revision History
Date Revision
July 2008 Original use-level-designation document
February 2010 Reinstate Contech’s Oil Control PULD
August 2012 Revised design storm criteria, revised oil control QAPP, TER, and
Expiration dates
December 2012 Revised Contech Engineered Solutions Contact Information; Added
QAPP for Oil Treatment
May 2013 Revised model numbers in Attachment 1
April 2014 Revised Due dates for QAPP and TER and changed Expiration date
August 2014 Revised Due dates for QAPP and TER and changed Expiration date
July 2016 Updated Oil Control PULD to a CULD based on preliminary field
monitoring results

Attachment 1 CDS Stormwater Treatment Unit Checklist
Frequency Drainage
System Feature Problem Conditions to Check For Recommended Action
Date Inspected*
J F M A M J J A S O N D
M & S Inlet Chamber
Accumulation of trash, debris and sediment
Trash blocking inlet throat opening & sediment accumulation exceeds 2 inches
Remove trash, debris, and sediments. Inlet throat opening should not be blocked by any materials.
A Screen Blockage/Damage
Biological growth on the surface of the screen; broken screen or loose screen
Powerwash screen to clean the surface and Contact CSS for screen repair (broken or loose)
M Separation Chamber
Trash and floatable debris accumulation
Excessive trash and floatable debris accumulation on the surface in separation chamber
Remove trash or other floatable debris in separation chamber to minimum level
A Oil Baffle** Damaged
Baffles corroding, cracking, warping, and/or showing signs of failure as determined by maintenance/inspection person.
Baffles repaired or replaced to design specifications.
M & S Oil sorbent** Consumed
Change of color in sorbents (fresh sorbents typically appears to be white or light yellow)
Remove spent oil sorbent and replace with new sorbent
M Sediment Depth in the Sump
Sediment accumulation
Sediment accumulation exceeds 75-85% sump depth (varies depending on the Model, see attached Table)
Sediment in sump should be removed using vactor truck.
M
Sediment Depth behind the screen
Sediment accumulation
Sediment accumulation exceeds 2 inches behind the screen
Sediment behind the screen should be removed using vactor truck.

Frequency Drainage
System Feature Problem Conditions to Check For Recommended Action
Date Inspected*
J F M A M J J A S O N D
M
Access Cover (MH, Grate, cleanout)
Access cover Damaged/ Not working
One maintenance person cannot remove lid after applying 80 pounds of lift, corrosion of deformation of cover.
Cover repaired to proper working specifications or replaced.
A Inlet and Outlet Piping
Damaged Piping/Leaking
Any part of the pipes are crushed or damaged due to corrosion and/or settlement. Pipe repaired or replaced.
A Concrete Structure
Concrete structure (MH or diversion vault) has cracks in wall, bottom, and damage to frame and/or top slab.
Cracks wider than ½ inch or evidence of soil particles entering the structure through the cracks, or maintenance/inspection personnel determine that the structure is not structurally sound.
Structure repaired so that no cracks exist wider than 0.25 inch at the joint of inlet/outlet pipe.
A Access Ladder Ladder rungs unsafe
Maintenance person judges that ladder is unsafe due to missing rungs, misalignment, rust, or cracks. Ladder must be fixed or secured immediately.
Ladder meets design standards and allows maintenance persons safe access.
*Note dates when maintenance was performed and type of maintenance performed in notes section below. **May not be present on all units. (M) Monthly from November through April. (A) Once in late summer (preferable September) (S) After any major storm (use 1-inch in 24 hours as a guideline).
If you are unsure whether a problem exists, please contact a Professional Engineer. Notes: Maintenance of CDS stormwater treatment unit typically does not require confined space entry. Visual inspections should be performed above ground. If entry is required, it should be performed by qualified personnel.
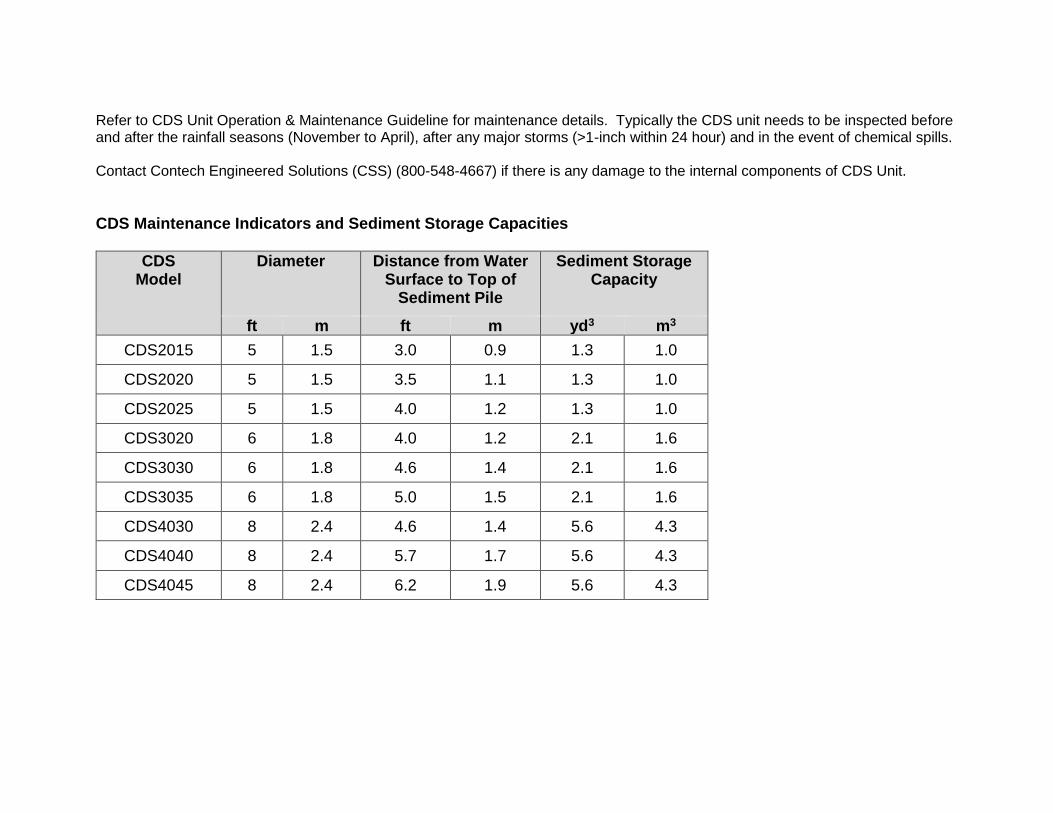
Refer to CDS Unit Operation & Maintenance Guideline for maintenance details. Typically the CDS unit needs to be inspected before and after the rainfall seasons (November to April), after any major storms (>1-inch within 24 hour) and in the event of chemical spills. Contact Contech Engineered Solutions (CSS) (800-548-4667) if there is any damage to the internal components of CDS Unit. CDS Maintenance Indicators and Sediment Storage Capacities
CDS Model
Diameter Distance from Water Surface to Top of
Sediment Pile
Sediment Storage Capacity
ft m ft m yd3 m3 CDS2015 5 1.5 3.0 0.9 1.3 1.0
CDS2020 5 1.5 3.5 1.1 1.3 1.0
CDS2025 5 1.5 4.0 1.2 1.3 1.0
CDS3020 6 1.8 4.0 1.2 2.1 1.6
CDS3030 6 1.8 4.6 1.4 2.1 1.6
CDS3035 6 1.8 5.0 1.5 2.1 1.6
CDS4030 8 2.4 4.6 1.4 5.6 4.3
CDS4040 8 2.4 5.7 1.7 5.6 4.3
CDS4045 8 2.4 6.2 1.9 5.6 4.3

February 2005
(Updated November 2007)
GENERAL USE LEVEL DESIGNATION FOR PRETREATMENT (TSS) For
Hydro International’s Downstream Defender®
Ecology’s Decision: Based on Hydro International’s application submissions and recommendations by the Technical Review Committee (TRC), Ecology hereby issues the following Use Level Designation for the Hydro International Downstream Defender®: 1. General Use Level Designation (GULD) for pretreatment, as defined in the Ecology
Manual Volume I, (a) ahead of infiltration treatment, or (b) to protect and extend the maintenance cycle of a Basic or Enhanced Treatment device (e.g., sand or media filter). This GULD applies to Downstream Defender units sized in accordance with the following table at the Water Quality design flow rate as determined using the Western Washington Hydrology Model (WWHM).
Downstream Defender System Sizing
Unit Diameter (ft) Flowrate (cfs) Q=583 (D/4)2.85
4 1.36 4.18 9.4
10 17.7 2. The pretreatment GULD designation has no expiration date, but it may be amended or
revoked by Ecology. 3. The GULD is subject to the conditions specified below. 4. Properly designed and operated Downstream Defender systems may also have
applicability in other situations (example: low-head situations such as bridges or ferry docks), for TSS and oil/grease removal where, on a case-by-case basis, it is found to be infeasible or impracticable to use any other approved practice. Local jurisdictions should follow established variance or exception procedures in approving such applications.
5. Ecology finds that the Downstream Defender, sized in accordance with the above table
could also provide:

o Water quality benefits in retrofit situations. o The first component in a treatment train. o Effective removal of deicing grit/sand.
Ecology’s Conditions of Use: Downstream Defenders shall be designed, installed, and maintained to comply with these conditions: 1. Downstream Defender systems must be designed, assembled, installed, operated, and
maintained in accordance with Hydro International’s applicable manuals and documents and the Ecology Decision and Conditions specified herein.
2. Discharges from the Downstream Defender system shall not cause or contribute to
water quality standards violations in receiving waters. Applicant: Hydro International.
Applicant’s Address: 94 Hutchins Drive Portland, Maine 04102 (207) 756-6200 ext. 226 Application Documents:
• Application letter from Ms. Deahl dated November 23, 2004 • “Downstream Defender-Submittal to WA State Department of Ecology”, Hydro
International, November 2004. Note: This submittal includes reports on 7 studies on the Downstream Defender reported from 1997-2002.
• “Downstream Defender Testing Using Feed Sand with Mean Particle Size of 50
microns”, Hydro International, December 2004
• “Comparison: Downstream Defender and Vortechs”, Hydro International, November 2004
• “The Development of a Mathematical Model for the Prediction of the Residence Time
Distribution of a Vortex Hydrodynamic Separator,” R.M. Alkhaddar et. al., 2001. A CD-ROM of the submittal reports may be requested from Hydro International.
2

Applicant’s Use Level Requests:
• Functional equivalence of the Downstream Defender to other vortex enhanced sedimentation technologies.
• General Use Level Designation (GULD) for pretreatment. Applicant’s Performance Claims: Based on full-scale laboratory trials, a 4-ft diameter Downstream Defender will achieve at least an 80% TSS removal efficiency for 125-micron mean particle size sand, at an operating flow rate of 583 gpm and 50% TSS removal efficiency for 50 micron mean particle size sand at an operating flow rate of 980 gpm. Based on full-scale laboratory trials, a 4-ft. diameter Downstream Defender will achieve at least 80% TSS removal efficiency for 50-micron mean particle size sand at an operating flow rate of 400 gpm. The Downstream Defender increases retention time and removal efficiency compared to a simple swirl-type device. Its three-dimensional geometry and internal components decrease turbulence and ensure that any fluid element passes through an extended flow path to get from the inlet to the outlet. This geometry is increased proportionately in all three dimensions, as units get larger In addition, the components create isolated zones outside of the separation chamber where solids are directed and stored and are protected from re-entrainment. These areas also increase in all three dimensions as the units get larger but are kept separate from the treatment volume. Therefore, the removal efficiency of any size cannot be accurately predicted by simply applying the same surface-loading rate of another size. When scaling up to larger units, residence times must be maintained in order to achieve consistent solids removal. An independent peer-reviewed study concludes that the appropriate scaling law for Hydro International’s separators approaches theoretical volumetric loading and can be calculated by: Q = Qtest (D/ Dtest)2.85, where: Q = flow rate at which a different sized device achieves the same performance Qtest = flow rate of tested device (583 gpm) D = internal diameter in feet of the different sized device Dtest = diameter of the tested device (4 feet) The maximum pretreatment flow rates for Downstream Defenders are based on 80% removal of 125-micron mean particle size sand. Technical Review Committee Recommendations: The TRC, based on the weight of the evidence and using its best professional judgment, finds that: • Pretreatment guidelines are needed to assess facilities performing at less-than-Basic
treatment levels, but adequate to serve as presettling facilities ahead of infiltration treatment.
3

The TRC recommends guidelines be set at 50% removal of 50-micron particles and 80% removal of 125-micron particles. The TRC further recommends these guidelines be applied uniformly to this and all future technology submissions.
• The Downstream Defender system, sized in accordance with the table above should provide, at a minimum, equivalent performance to a presettling basin as defined in the most recent Stormwater Management Manual for Western Washington, Volume V, Chapter 6.
Findings of Fact: • Full-scale laboratory test have been conducted on a 4-ft diameter Downstream Defender.
Appendix 5 of the submittal includes independent Maine DEP OK-110 laboratory results verifying the company’s performance claim. The submittal also documents the removal of portions of heavy metals and nutrients associated with fine particles.
• The submittals also demonstrate that the Downstream Defender provides significantly better protection from pollutant re-entrainment compared to simple swirl-type devices (SVS). Therefore, Hydro International considers the Downstream Defender to be an advanced vortex separator (AVS).
• Full-scale laboratory test have been conducted on a 4-ft diameter Downstream Defender verifying the company’s performance claim on material with a mean particle size of 50 microns.
• Laboratory testing using 15 and 30-inch diameter systems derived a scaling factor of 2.85, which is used to determine flow rates for untested models.
• The system is easily maintained using a vacuum truck. • There are over 2000 Downstream Defender systems installed nationwide, with over 150 in
the Pacific Northwest. Technology Description: Design Manual and technical bulletins can be downloaded from company's web site.
Contact Information:
Applicant: Mr. John MacKinnon Hydro International (207) 756-6200 ext. 250 [email protected] Applicant website: http://www.hydro-international.biz
Ecology web link: http://www.ecy.wa.gov/programs/wq/stormwater/newtech/index.html
Ecology Contact: Mieke Hoppin Water Quality Program
[email protected] (360) 407-6435
4


Note: Some pages in this document have been purposely skipped or blank pages inserted so that this document will copy correctly when duplexed.

January 2013
GENERAL USE LEVEL DESIGNATION FOR BASIC TREATMENT
For
Royal Environmental Systems, Inc. ecoStorm/ecoStorm plus Treatment Train
Ecology’s Decision:
1. Based on Royal Environmental’s application submissions, including the Final Technical
Evaluation Report (TER) dated July 2012, and recommendations by the Board of
External Reviewers (BER), Ecology hereby issues a general use level designation
(GULD) for the ecoStorm/ecoStorm plus treatment train:
As a basic stormwater treatment device for total suspended solids (TSS) removal,
Using the Standard concrete filter for the ecoStorm plus,
As part of a treatment train that includes an upstream ecoStorm unit.
2. Ecology approves the ecoStorm/ecoStorm plus treatment train units using the Standard
concrete filter for treatment at the water quality design flow rate per filter listed below.
The water quality design flow rates are calculated using the following procedures:
Western Washington: For treatment installed upstream of detention or retention,
the water quality design flow rate is the peak 15-minute flow rate as calculated using
the latest version of the Western Washington Hydrology Model or other Ecology-
approved continuous runoff model.
Eastern Washington: For treatment installed upstream of detention or retention,
the water quality design flow rate is the peak 15-minute flow rate as calculated using
one of the three methods described in Chapter 2.2.5 of the Stormwater Management
Manual for Eastern Washington (SWMMEW) or local manual.
Entire State: For treatment installed downstream of detention, the water quality
design flow rate is the full 2-year release rate of the detention facility.
3. This designation has no expiration date, but Ecology may amend or revoke it, and it is
subject to the conditions specified below.
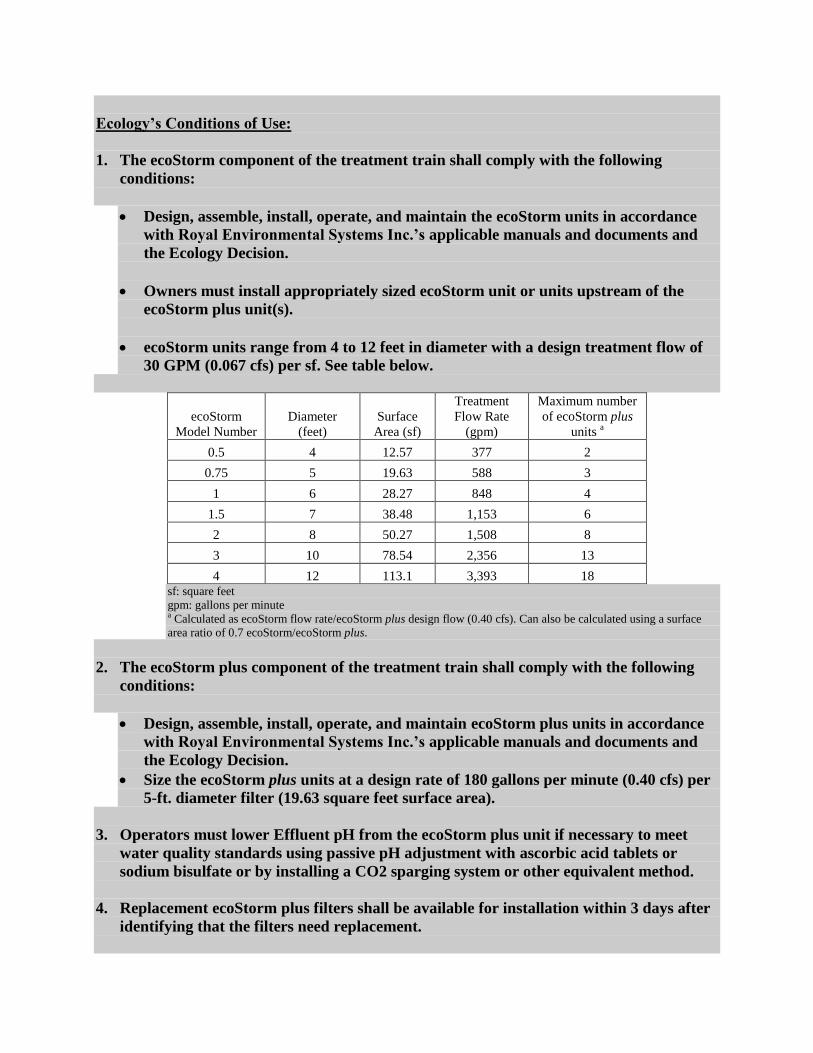
Ecology’s Conditions of Use:
1. The ecoStorm component of the treatment train shall comply with the following
conditions:
Design, assemble, install, operate, and maintain the ecoStorm units in accordance
with Royal Environmental Systems Inc.’s applicable manuals and documents and
the Ecology Decision.
Owners must install appropriately sized ecoStorm unit or units upstream of the
ecoStorm plus unit(s).
ecoStorm units range from 4 to 12 feet in diameter with a design treatment flow of
30 GPM (0.067 cfs) per sf. See table below.
ecoStorm
Model Number
Diameter
(feet)
Surface
Area (sf)
Treatment
Flow Rate
(gpm)
Maximum number
of ecoStorm plus
units a
0.5 4 12.57 377 2
0.75 5 19.63 588 3
1 6 28.27 848 4
1.5 7 38.48 1,153 6
2 8 50.27 1,508 8
3 10 78.54 2,356 13
4 12 113.1 3,393 18 sf: square feet
gpm: gallons per minute a Calculated as ecoStorm flow rate/ecoStorm plus design flow (0.40 cfs). Can also be calculated using a surface
area ratio of 0.7 ecoStorm/ecoStorm plus.
2. The ecoStorm plus component of the treatment train shall comply with the following
conditions:
Design, assemble, install, operate, and maintain ecoStorm plus units in accordance
with Royal Environmental Systems Inc.’s applicable manuals and documents and
the Ecology Decision.
Size the ecoStorm plus units at a design rate of 180 gallons per minute (0.40 cfs) per
5-ft. diameter filter (19.63 square feet surface area).
3. Operators must lower Effluent pH from the ecoStorm plus unit if necessary to meet
water quality standards using passive pH adjustment with ascorbic acid tablets or
sodium bisulfate or by installing a CO2 sparging system or other equivalent method.
4. Replacement ecoStorm plus filters shall be available for installation within 3 days after
identifying that the filters need replacement.

The following conditions apply to the combined treatment system (ecoStorm/ecoStorm plus
treatment train):
1. To determine site-specific maintenance schedules for installed ecoStorm/ecoStorm plus
treatment trains, the presence and frequency of all system bypasses shall be monitored
by a water sensor (presence/absence or level) and logging device.
2. The required maintenance interval for stormwater treatment devices is often dependent
upon the degree of pollutant loading from a particular drainage basin. Therefore,
Ecology does not endorse or recommend a “one size fits all” maintenance cycle for a
particular model/size of manufactured treatment device.
Testing results provided to Ecology for the Basic Treatment GULD approval
indicate that the treatment system required backflushing on average every 1.3
months and filter replacement after 9.3 months on average at the specific test
installation. Indicators of the need for maintenance included:
o Decreased flow through filter
o Increased incidence of bypass
o Visual build-up of material on surface of filter
This particular maintenance interval does not necessarily determine the overall
maintenance frequency for all ecoStorm/ecoStorm plus treatment trains.
Owners/operators must inspect ecoStorm/ecoStorm plus treatment trains systems
for a minimum of twelve months from the start of post-construction operation to
determine site-specific maintenance schedules and requirements. Inspection
frequency shall be as stated below. After the first year of operation,
owners/operators must conduct inspections based on the findings during the first
year of inspections.
Conduct inspections by qualified personnel pursuant to manufacturer’s guidelines,
and use methods capable of determining either a decrease in treated effluent
flowrate and/or a decrease in pollutant removal ability.
3. Records of maintenance, bypass flows, and local rain gage data shall be submitted to
Ecology on a quarterly basis until site-specific maintenance schedules for the installed
ecoStorm/ecoStorm plus treatment train can be determined. Bypass data must be
downloaded at least monthly to evaluate system performance relative to the goal of
treating 91 percent of the average annual runoff volume.
4. Owners of ecoStorm/ecoStorm plus treatment trains shall submit a letter to Ecology
committing to a schedule of required maintenance inspections as follows:
From October 1st to April 30
th: inspections shall occur once every two weeks or after
every 2 inches of rainfall, whichever occurs first.

From May 1st to September 30
th inspections shall occur at least monthly and/or in
conjunction with a storm event of > 0.5 inches in 24 hours.
5. Discharges from the ecoStorm/ecoStorm plus treatment train shall not cause or
contribute to water quality standards violations in receiving waters.
Applicant: Royal Environmental Systems Inc.
Applicant’s Address: 30622 Forest Blvd, PO Box 430
Stacy, MN, 55079
Application Documents:
Draft ecoStorm/ecoStorm plus Treatment Train Evaluation Technical Evaluation Report,
Herrera Environmental Consultants (October 2011)
Final ecoStorm/ecoStorm plus Treatment Train Evaluation Technical Evaluation Report,
Herrera Environmental Consultants (August 2012)
Responses to BER comments, Water Tectonics and Herrera Environmental Consultants
(August 2012)
ecoStorm plus CULD Request: Supplemental information/clarification as requested in
Ecology’s December 21, 2010 letter and use level designation extension request.
Memorandum prepared by WaterTectonics (January 19, 2011).
Request for Conditional Use Level Designation for the ecoStorm plus™ unit,
memorandum prepared by Royal Environmental Systems, Inc. (October 21, 2010).
a. ecoStorm plus™ Product Information for Washington State Department of
Ecology Use Designation Determination (September 29, 2010)
b. Herrera Environmental Consultants Memorandum – Update on Water Tectonics
TAPE process for the ecoStorm plus filter system (September 8, 2010)
c. Water Tectonics, Inc. – Internal Memorandum McRedmond ecoStorm plus Data
Collection, (October 5, 2010)
d. Herrera Environmental Consultants – McRedmond TSS Discrete Analysis (2010
Data)
e. Herrera Environmental Consultants – McRedmond TSS Composite Analysis (2010
Data)
f. Herrera Environmental Consultants – Third Party Technical Review City of
Redmond ecoStorm plus Monitoring Project, January 8, 2010 (2009 Data)
QAPP ecoStorm plus™ McRedmond RWQF – Addendum 4 (March 1, 2010)
QAPP ecoStorm plus™ McRedmond RWQF – Addendum 3 (September 1, 2009)
QAPP ecoStorm plus™ McRedmond RWQF – Addendum 2 (August 1, 2009)
QAPP ecoStorm plus™ McRedmond RWQF – Addendum 1 (April 8, 2009)

Quality Assurance Project Plan (QAPP) ecoStorm plus™ McRedmond Regional Water
Quality Facility (RWQF), prepared by Water Tectonics and Royal Environmental
Systems, Inc. (March 18, 2008)
ecoStorm plus™ Quality Assurance Project Plan (QAPP) for Basic, Enhanced &
Phosphorus Treatment (Rev04), prepared by Water Tectonics and Royal Environmental
Systems, Inc. (August, 28, 2007)
Product Information for Washington State Department of Ecology Use Designation
Determination, prepared by Water Tectonics (July 2006)
ecoStorm plus Lab Scale Testing Final Report, prepared by Water Tectonics (July 2006)
Report on investigations into retention of pollutants in rainfall runoff from a concrete plant
using a ecoStorm plus filter pit prepared by: Dr. Dierkes (August 2004)
Applicant’s Use Level Request:
General Use Level Designation as a Basic Treatment device.
Applicant’s Performance Claims:
Average of 80% removal of TSS.
Findings of Fact:
1. Monitoring for this project occurred at the McRedmond Regional Water Quality Facility
(McRedmond Facility) installed in 2007 at the Luke McRedmond Park in Redmond,
Washington.
2. WaterTectonics collected water quality data from 31 storm events (15 composite
sampling events and 16 discrete sampling events) over a 27-month period (March 2009
through June 2011).
3. WaterTectonics collected a total of 15 valid TSS composite samples: 10 samples were in
the 20 to 99 mg/L influent TSS range, 3 samples were in the 100 to 200 mg/L influent
TSS range, and 2 samples were in the > 200 mg/L TSS range. Since a majority of the
samples were in the 20 to less than 100 mg/L influent range, this was the only
performance goal statistically evaluated.
4. To evaluate this goal, WaterTectonics computed a bootstrapped estimate of the upper 95
percent confidence limit around the mean from the 10 valid samples in the 20 to less than
100 mg/L influent TSS range; they compared this value (9.7 mg/L) to the 20 mg/L
effluent goal. Because the upper confidence limit is lower than the effluent goal of 20
mg/L, it can be concluded that the ecoStorm/ecoStorm plus treatment train met the basic
treatment goal with a confidence level of 95 percent.
5. Although there were not enough samples in the other two size ranges to demonstrate
statistical significance, the mean TSS percent removal was 84 percent in the 100 to 200
mg/L influent TSS range and 85 percent in the > 200 mg/L TSS range.

6. In order to evaluate pollutant removal performance as a function of flow rate,
WaterTectonics performed a regression analysis using pooled effluent TSS concentration
data from composite and discrete samples collected from the ecoStorm/ecoStorm plus
treatment train. Aliquot-weighted flow rates for the composite sampling ranged from 39.3
to 318 gpm. Instantaneous flow rates for the discrete sampling ranged from 12.3 to 257
gpm. This analysis showed there was no significant relationship between flow rate and
effluent TSS concentrations, demonstrating that the measured pollutant removal
performance can be applied to the range of flow rates monitored during this study (12.3
to 318 gpm).
7. WaterTectonics evaluated data from the continuous pH record to determine if there were
differences in average daily pH influent and effluent values before and after initiation of
CO2 sparging. The average daily influent pH value was 6.85 before and after sparging.
However, the average daily effluent pH value was reduced from 9.25 before CO2
sparging to 8.01 after CO2 sparging.
Other ecoStorm/ecoStorm plus Treatment Train Related Issues to be Addressed By the
Company:
1. Develop easy-to-implement methods of determining when an ecoStorm/ecoStorm plus
treatment train requires maintenance (cleaning and filter replacement).
Technology Description: Download at www.royalenterprises.net
Contact Information:
Applicant: Liisa Doty
WaterTectonics, Inc.
6300 Merrill Creek Parkway
Suite C-100
Everett, WA, 98203
425-349-4200
Applicant website: www.royalenterprises.net
Ecology web link: http://www.ecy.wa.gov/programs/wq/stormwater/newtech/index.html
Ecology: Douglas C. Howie, P.E.
Department of Ecology
Water Quality Program
(360) 407-6444
Revision History
Date Revision
December 2009 PULD granted
February 2011 CULD granted
July 2012 GULD granted for Basic Treatment, added Revision Table
January 2013 Modified Design Storm Description, revised format to match Ecology
standard

1
June 2016
GENERAL USE LEVEL DESIGNATION FOR BASIC (TSS), ENHANCED,
PHOSPHORUS & OIL TREATMENT
For
Americast Filterra®
Ecology’s Decision:
Based on Americast’s submissions, including the Final Technical Evaluation Reports, dated
March 27, 2014 and December 2009, and additional information provided to Ecology dated
October 9, 2009, Ecology hereby issues the following use level designations:
1. A General Use Level Designation for Basic, Enhanced, Phosphorus, and Oil Treatment at the
following water quality design hydraulic loading rates:
Treatment Hydraulic Conductivity*
(in/hr) for use in Western
Washington Sizing
Infiltration Rate (in/hr) for
use in eastern Washington
Sizing
Basic 70.92 100
Phosphorus 70.92 100
Oil 35.46 50
Enhanced 24.82 35
*calculated based on listed infiltration rate and a hydraulic gradient of 1.41 inch/inch (2.55 ft
head with 1.80 ft media).
2. The Filterra® unit is not appropriate for oil spill-control purposes.
3. Ecology approves the Filterra® units for treatment at the hydraulic loading rates listed above,
to achieve the maximum water quality design flow rate. Calculate the water quality design
flow rates using the following procedures:
Western Washington: for treatment installed upstream of detention or retention, the water
quality design flow rate is the peak 15-minute flow rate as calculated using the sand filter
module in the latest version of the Western Washington Hydrology Model or other
Ecology-approved continuous runoff model. The model must indicate the unit is capable
of processing 91 percent of the influent runoff file.
Eastern Washington: For treatment installed upstream of detention or retention, the water
quality design flow rate is the peak 15-minute flow rate as calculated using one of the
three flow rate based methods described in Chapter 2.2.5 of the Stormwater Management
Manual for Eastern Washington (SWMMEW) or local manual.

2
Entire State: For treatment installed downstream of detention, the water quality design
flow rate is the full 2-year release rate of the detention facility.
4. This General Use Level Designation has no expiration date but Ecology may revoke or
amend the designation, and is subject to the conditions specified below.
Ecology’s Conditions of Use:
Filterra® units shall comply with these conditions shall comply with the following conditions:
1. Design, assemble, install, operate, and maintain the Filterra® units in accordance with
applicable Americast Filterra® manuals, document, and the Ecology Decision.
2. Each site plan must undergo Americast Filterra® review before Ecology can approve the unit
for site installation. This will ensure that site grading and slope are appropriate for use of a
Filterra® unit.
3. Filterra® media shall conform to the specifications submitted to and approved by Ecology.
4. Maintenance includes removing trash, degraded mulch, and accumulated debris from the
filter surface and replacing the mulch layer. Use inspections to determine the site-specific
maintenance schedules and requirements. Follow maintenance procedures given in the most
recent version of the Filterra® Operation and Maintenance Manual.
5. Maintenance: The required maintenance interval for stormwater treatment devices is often
dependent upon the degree of pollutant loading from a particular drainage basin. Therefore,
Ecology does not endorse or recommend a “one size fits all” maintenance cycle for a
particular model/size of manufactured filter treatment device.
Filterra® designs their systems for a target maintenance interval of 6 months.
Maintenance includes removing accumulated sediment and trash from the surface area of
the media, removing the mulch above the media, replacing the mulch, providing plant
health evaluation, and pruning the plant if deemed necessary.
Conduct maintenance following manufacturer’s guidelines.
6. Filterra® units come in standard sizes.
7. The minimum size filter surface-area for use in western Washington is determined by using
the sand filter module in the latest version of WWHM or other Ecology approved continuous
runoff model for western Washington. Model inputs include
a) Filter media depth: 1.8 feet
b) Effective Ponding Depth: 0.75 feet (This is equivalent to the 6-inch clear zone
between the top of the mulch and the bottom of the slab plus 3-inches of mulch.)
c) Side slopes: Vertical
d) Riser height: 0.70 feet
e) Filter Hydraulic Conductivity: Use the Hydraulic Conductivity as listed in the table
above (use the lowest applicable hydraulic conductivity depending on the level of
treatment required) under Ecology’s Decision, above.

3
8. The minimum size filter surface-area for use in eastern Washington is determined by using
the design water quality flow rate (as determined in item 3, above) and the Infiltration Rate
from the table above (use the lowest applicable Infiltration Rate depending on the level of
treatment required). Calculate the required area by dividing the water quality design flow rate
(cu-ft/sec) by the Infiltration Rate (converted to ft/sec) to obtain required surface area (sq ft)
of the Filterra unit.
9. Discharges from the Filterra® units shall not cause or contribute to water quality standards
violations in receiving waters.
Approved Alternate Configurations
Filterra® Internal Bypass - Pipe (FTIB-P)
1. The Filterra® Internal Bypass – Pipe allows for piped-in flow from area drains, grated inlets,
trench drains, and/or roof drains. Design capture flows and peak flows enter the structure
through an internal slotted pipe. Filterra® inverted the slotted pipe to allow design flows to
drop through to a series of splash plates that then disperse the design flows over the top
surface of the Filterra® planter area. Higher flows continue to bypass the slotted pipe and
convey out the structure.
2. To select a FTIB-P unit, the designer must determine the size of the standard unit using the
sizing guidance described above.
Filterra® Internal Bypass – Curb (FTIB-C)
1. The Filterra® Internal Bypass –Curb model (FTIB-C) incorporates a curb inlet, biofiltration
treatment chamber, and internal high flow bypass in one single structure. Filterra® designed
the FTIB-C model for use in a “Sag” or “Sump” condition and will accept flows from both
directions along a gutter line. An internal flume tray weir component directs treatment flows
entering the unit through the curb inlet to the biofiltration treatment chamber. Flows in
excess of the water quality treatment flow rise above the flume tray weir and discharge
through a standpipe orifice; providing bypass of untreated peak flows. Americast
manufactures the FTIB-C model in a variety of sizes and configurations and you may use the
unit on a continuous grade when a single structure providing both treatment and high flow
bypass is preferred. The FTIB-C model can also incorporate a separate junction box chamber
to allow larger diameter discharge pipe connections to the structure.
2. To select a FTIB-C unit, the designer must determine the size of the standard unit using the
sizing guidance described above.
Filterra® Shallow
1. The Filterra® Shallow provides additional flexibility for design engineers and designers in
situations where there is limited depth and various elevation constraints to applying a
standard Filterra® configuration. Engineers can design this system up to six inches shallower
than any of the previous Filterra unit configurations noted above.

4
2. Ecology requires that the Filterra® Shallow provide a contact time equivalent to that of the
standard unit. This means that with a smaller depth of media, the surface area must increase.
3. To select a Filterra® Shallow System unit, the designer must first identify the size of the
standard unit using the modeling guidance described above.
4. Once you establish the size of the standard Filterra® unit using the sizing technique described
above, use information from the following table to select the appropriate size Filterra®
Shallow System unit.
Shallow Unit Basic, Enhanced, and Oil Treatment Sizing
Standard Depth Equivalent Shallow Depth
4x4 4x6 or 6x4
4x6 or 6x4 6x6
4x8 or 8x4 6x8 or 8x6
6x6 6x10 or 10x6
6x8 or 8x6 6x12 or 12x6
6x10 or 10x6 13x7 Notes:
1. Shallow Depth Boxes are less than the standard depth of 3.5 feet but no less
than 3.0 feet deep (TC to INV).
Applicant: Filterra® Bioretention Systems, division of Contech
Engineered Solutions, LLC.
Applicant’s Address: 11815 NE Glenn Widing Drive
Portland, OR 97220
Application Documents:
State of Washington Department of Ecology Application for Conditional Use
Designation, Americast (September 2006)
Quality Assurance Project Plan Filterra® Bioretention Filtration System Performance
Monitoring, Americast (April 2008)
Quality Assurance Project Plan Addendum Filterra® Bioretention Filtration System
Performance Monitoring, Americast (June 2008)
Draft Technical Evaluation Report Filterra® Bioretention Filtration System Performance
Monitoring, Americast (August 2009)
Final Technical Evaluation Report Filterra® Bioretention Filtration System Performance
Monitoring, Americast (December 2009)
Technical Evaluation Report Appendices Filterra® Bioretention Filtration System
Performance Monitoring, Americast, August 2009
Memorandum to Department of Ecology Dated October 9, 2009 from Americast, Inc. and
Herrera Environmental Consultants

5
Quality Assurance Project Plan Filterra® Bioretention System Phosphorus treatment and
Supplemental Basic and Enhanced Treatment Performance Monitoring, Americast
(November 2011)
Filterra® letter August 24, 2012 regarding sizing for the Filterra® Shallow System.
University of Virginia Engineering Department Memo by Joanna Crowe Curran, Ph. D
dated March 16, 2013 concerning capacity analysis of Filterra® internal weir inlet tray.
Terraphase Engineering letter to Jodi Mills, P.E. dated April 2, 2013 regarding
Terraflume Hydraulic Test, Filterra® Bioretention System and attachments.
Technical Evaluation Report, Filterra® System Phosphorus Treatment and Supplemental
Basic Treatment Performance Monitoring. March 27th, 2014.
Applicant’s Use Level Request:
General Level Use Designation for Basic, Enhanced, Phosphorus, and Oil Treatment.
Applicant’s Performance Claims:
Field-testing and laboratory testing show that the Filterra® unit is promising as a stormwater
treatment best management practice and can meet Ecology’s performance goals for basic,
enhanced, phosphorus, and oil treatment.
Findings of Fact:
Field Testing 2013
1. Filterra® completed field-testing of a 6.5 ft x 4 ft. unit at one site in Bellingham,
Washington. Continuous flow and rainfall data collected from January 1, 2013 through
July 23, 2013 indicated that 59 storm events occurred. The monitoring obtained water
quality data from 22 storm events. Not all the sampled storms produced information that
met TAPE criteria for storm and/or water quality data.
2. The system treated 98.9 percent of the total 8-month runoff volume during the testing
period. Consequently, the system achieved the goal of treating 91 percent of the volume
from the site. Stormwater runoff bypassed during four of the 59 storm events.
3. Of the 22 sampled events, 18 qualified for TSS analysis (influent TSS concentrations
ranged from 25 to 138 mg/L). The data were segregated into sample pairs with influent
concentration greater than and less than 100 mg/L. The UCL95 mean effluent
concentration for the data with influent less than 100 mg/L was 5.2 mg/L, below the 20-
mg/L threshold. Although the TAPE guidelines do not require an evaluation of TSS
removal efficiency for influent concentrations below 100 mg/L, the mean TSS removal
for these samples was 90.1 percent. Average removal of influent TSS concentrations
greater than 100 mg/L (three events) was 85 percent. In addition, the system consistently
exhibited TSS removal greater than 80 percent at flow rates at a 100 inches per hour
[in/hr] infiltration rate and was observed at 150 in/hr.

6
4. Ten of the 22 sampled events qualified for TP analysis. Americast augmented the dataset
using two sample pairs from previous monitoring at the site. Influent TP concentrations
ranged from 0.11 to 0.52 mg/L. The mean TP removal for these twelve events was 72.6
percent. The LCL95 mean percent removal was 66.0, well above the TAPE requirement
of 50 percent. Treatment above 50 percent was evident at 100 in/hr infiltration rate and as
high as 150 in/hr. Consequently, the Filterra® test system met the TAPE Phosphorus
Treatment goal at 100 in/hr. Influent ortho-P concentrations ranged from 0.005 to 0.012
mg/L; effluent ortho-P concentrations ranged from 0.005 to 0.013 mg/L. The reporting
limit/resolution for the ortho-P test method is 0.01 mg/L, therefore the influent and
effluent ortho-P concentrations were both at and near non-detect concentrations.
Field Testing 2008-2009
1. Filterra® completed field-testing at two sites at the Port of Tacoma. Continuous flow and
rainfall data collected during the 2008-2009 monitoring period indicated that 89 storm
events occurred. The monitoring obtained water quality data from 27 storm events. Not
all the sampled storms produced information that met TAPE criteria for storm and/or
water quality data.
2. During the testing at the Port of Tacoma, 98.96 to 99.89 percent of the annual influent
runoff volume passed through the POT1 and POT2 test systems respectively. Stormwater
runoff bypassed the POT1 test system during nine storm events and bypassed the POT2
test system during one storm event. Bypass volumes ranged from 0.13% to 15.3% of the
influent storm volume. Both test systems achieved the 91 percent water quality treatment-
goal over the 1-year monitoring period.
3. Consultants observed infiltration rates as high as 133 in/hr during the various storms.
Filterra® did not provide any paired data that identified percent removal of TSS, metals,
oil, or phosphorus at an instantaneous observed flow rate.
4. The maximum storm average hydraulic loading rate associated with water quality data is
<40 in/hr, with the majority of flow rates < 25 in/hr. The average instantaneous hydraulic
loading rate ranged from 8.6 to 53 inches per hour.
5. The field data showed a removal rate greater than 80% for TSS with an influent
concentration greater than 20 mg/l at an average instantaneous hydraulic loading rate up
to 53 in/hr (average influent concentration of 28.8 mg/l, average effluent concentration of
4.3 mg/l).
6. The field data showed a removal rate generally greater than 54% for dissolved zinc at an
average instantaneous hydraulic loading rate up to 60 in/hr and an average influent
concentration of 0.266 mg/l (average effluent concentration of 0.115 mg/l).
7. The field data showed a removal rate generally greater than 40% for dissolved copper at
an average instantaneous hydraulic loading rate up to 35 in/hr and an average influent
concentration of 0.0070 mg/l (average effluent concentration of 0.0036 mg/l).
8. The field data showed an average removal rate of 93% for total petroleum hydrocarbon
(TPH) at an average instantaneous hydraulic loading rate up to 53 in/hr and an average
influent concentration of 52 mg/l (average effluent concentration of 2.3 mg/l). The data
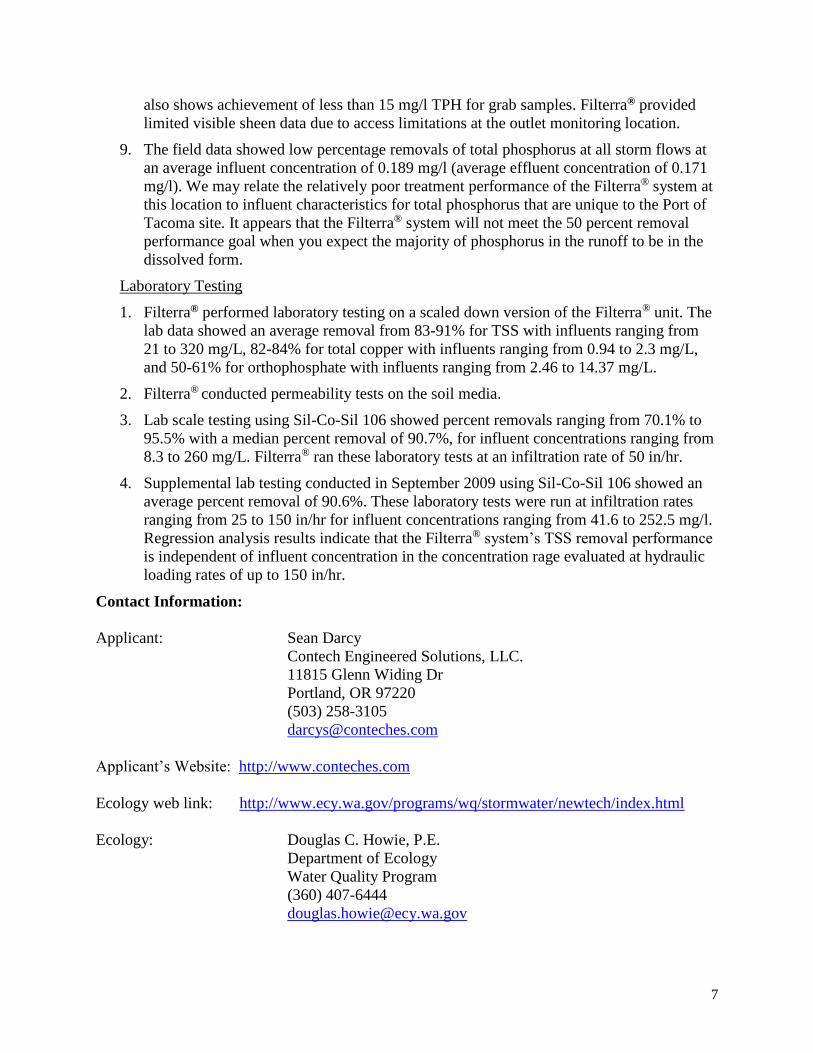
7
also shows achievement of less than 15 mg/l TPH for grab samples. Filterra® provided
limited visible sheen data due to access limitations at the outlet monitoring location.
9. The field data showed low percentage removals of total phosphorus at all storm flows at
an average influent concentration of 0.189 mg/l (average effluent concentration of 0.171
mg/l). We may relate the relatively poor treatment performance of the Filterra® system at
this location to influent characteristics for total phosphorus that are unique to the Port of
Tacoma site. It appears that the Filterra® system will not meet the 50 percent removal
performance goal when you expect the majority of phosphorus in the runoff to be in the
dissolved form.
Laboratory Testing
1. Filterra® performed laboratory testing on a scaled down version of the Filterra® unit. The
lab data showed an average removal from 83-91% for TSS with influents ranging from
21 to 320 mg/L, 82-84% for total copper with influents ranging from 0.94 to 2.3 mg/L,
and 50-61% for orthophosphate with influents ranging from 2.46 to 14.37 mg/L.
2. Filterra® conducted permeability tests on the soil media.
3. Lab scale testing using Sil-Co-Sil 106 showed percent removals ranging from 70.1% to
95.5% with a median percent removal of 90.7%, for influent concentrations ranging from
8.3 to 260 mg/L. Filterra® ran these laboratory tests at an infiltration rate of 50 in/hr.
4. Supplemental lab testing conducted in September 2009 using Sil-Co-Sil 106 showed an
average percent removal of 90.6%. These laboratory tests were run at infiltration rates
ranging from 25 to 150 in/hr for influent concentrations ranging from 41.6 to 252.5 mg/l.
Regression analysis results indicate that the Filterra® system’s TSS removal performance
is independent of influent concentration in the concentration rage evaluated at hydraulic
loading rates of up to 150 in/hr.
Contact Information:
Applicant: Sean Darcy
Contech Engineered Solutions, LLC.
11815 Glenn Widing Dr
Portland, OR 97220
(503) 258-3105
Applicant’s Website: http://www.conteches.com
Ecology web link: http://www.ecy.wa.gov/programs/wq/stormwater/newtech/index.html
Ecology: Douglas C. Howie, P.E.
Department of Ecology
Water Quality Program
(360) 407-6444

8
Date Revision
December 2009 GULD for Basic, Enhanced, and Oil granted, CULD for Phosphorus
September 2011 Extended CULD for Phosphorus Treatment
September 2012 Revised design storm discussion, added Shallow System.
January 2013 Revised format to match Ecology standards, changed Filterra contact
information
February 2013 Added FTIB-P system
March 2013 Added FTIB-C system
April 2013 Modified requirements for identifying appropriate size of unit
June 2013 Modified description of FTIB-C alternate configuration
March 2014 GULD awarded for Phosphorus Treatment. GULD updated for a
higher flow-rate for Basic Treatment.
June 2014 Revised sizing calculation methods
March 2015 Revised Contact Information
June 2015 CULD for Basic and Enhanced at 100 in/hr infiltration rate
November 2015 Removed information on CULD (created separate CULD document
for 100 in/hr infiltration rate)
June 2016 Revised text regarding Hydraulic conductivity value
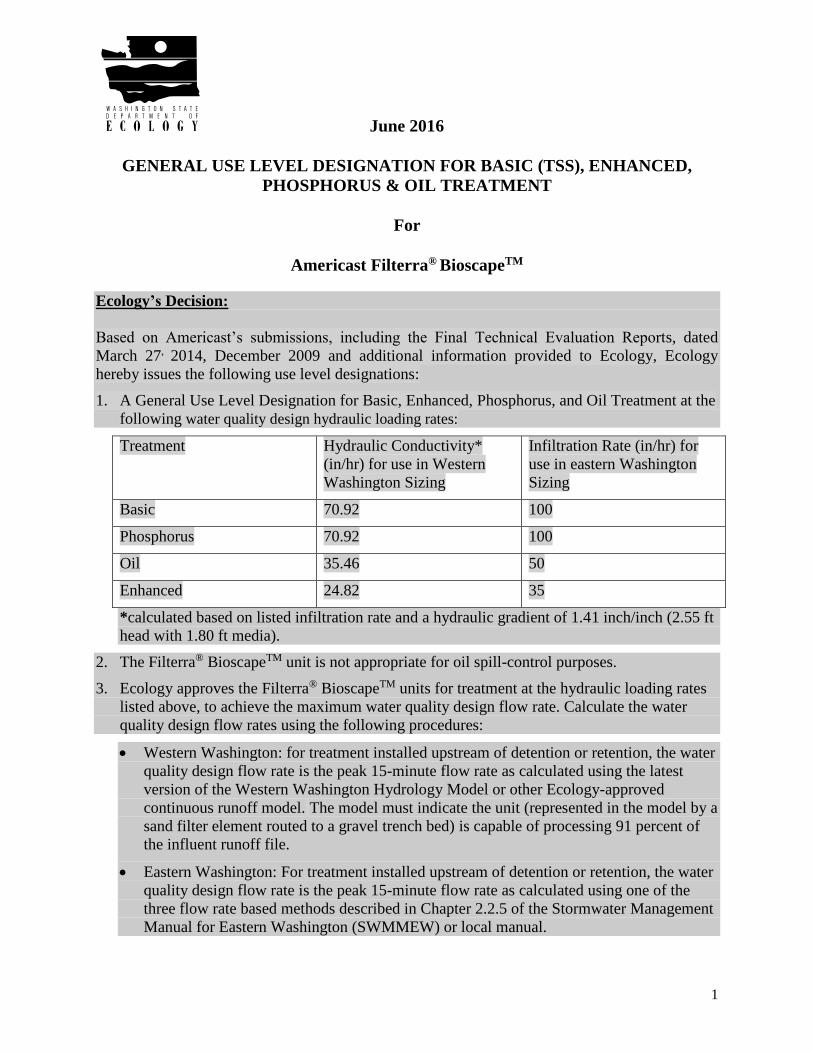
1
June 2016
GENERAL USE LEVEL DESIGNATION FOR BASIC (TSS), ENHANCED,
PHOSPHORUS & OIL TREATMENT
For
Americast Filterra® BioscapeTM
Ecology’s Decision:
Based on Americast’s submissions, including the Final Technical Evaluation Reports, dated
March 27, 2014, December 2009 and additional information provided to Ecology, Ecology
hereby issues the following use level designations:
1. A General Use Level Designation for Basic, Enhanced, Phosphorus, and Oil Treatment at the
following water quality design hydraulic loading rates:
Treatment Hydraulic Conductivity*
(in/hr) for use in Western
Washington Sizing
Infiltration Rate (in/hr) for
use in eastern Washington
Sizing
Basic 70.92 100
Phosphorus 70.92 100
Oil 35.46 50
Enhanced 24.82 35
*calculated based on listed infiltration rate and a hydraulic gradient of 1.41 inch/inch (2.55 ft
head with 1.80 ft media).
2. The Filterra® BioscapeTM unit is not appropriate for oil spill-control purposes.
3. Ecology approves the Filterra® BioscapeTM units for treatment at the hydraulic loading rates
listed above, to achieve the maximum water quality design flow rate. Calculate the water
quality design flow rates using the following procedures:
Western Washington: for treatment installed upstream of detention or retention, the water
quality design flow rate is the peak 15-minute flow rate as calculated using the latest
version of the Western Washington Hydrology Model or other Ecology-approved
continuous runoff model. The model must indicate the unit (represented in the model by a
sand filter element routed to a gravel trench bed) is capable of processing 91 percent of
the influent runoff file.
Eastern Washington: For treatment installed upstream of detention or retention, the water
quality design flow rate is the peak 15-minute flow rate as calculated using one of the
three flow rate based methods described in Chapter 2.2.5 of the Stormwater Management
Manual for Eastern Washington (SWMMEW) or local manual.

2
Entire State: For treatment installed downstream of detention, the water quality design
flow rate is the full 2-year release rate of the detention facility.
4. This General Use Level Designation has no expiration date but Ecology may revoke or
amend the designation, and is subject to the conditions specified below.
Ecology’s Conditions of Use:
Filterra® units shall comply with the following conditions:
1. Design, assemble, install, operate, and maintain the Filterra® BioscapeTM units in accordance
with applicable Americast Filterra® manuals, document, and the Ecology Decision.
2. Each site plan must undergo Americast Filterra® review before Ecology can approve the unit
for site installation. This will ensure that site grading and slope are appropriate for use of a
Filterra® BioscapeTM unit.
3. Filterra® BioscapeTM media shall conform to the specifications submitted to and approved by
Ecology. The media shall not differ from the media used in the standard Filterra unit and as
approved by Ecology.
4. Maintenance includes removing trash, degraded mulch, and accumulated debris from the
filter surface and replacing the mulch layer. Use inspections to determine the site-specific
maintenance schedules and requirements. Follow maintenance procedures given in the most
recent version of the Filterra® BioscapeTM Operation and Maintenance Manual.
5. Maintenance: The required maintenance interval for stormwater treatment devices is often
dependent upon the degree of pollutant loading from a particular drainage basin. Therefore,
Ecology does not endorse or recommend a “one size fits all” maintenance cycle for a
particular model/size of manufactured filter treatment device.
Filterra designs their systems for a target maintenance interval of 6 months.
Maintenance includes removing accumulated sediment and trash from the surface
area of the media, removing the mulch above the media, replacing the mulch,
providing plant health evaluation, and pruning the plant if deemed necessary.
Conduct maintenance following manufacturer’s guidelines.
6. The minimum size filter surface-area for use in western Washington is determined by using
the sand filter element connected to a gravel trench bed element in the latest version of
WWHM or other Ecology approved continuous runoff model.
Sand Filter element model inputs include
a. Filter media depth: 1.8 feet
b. Effective Ponding Depth: 0.75 feet (This is equivalent to the 6-inch clear zone
between the top of the mulch and the bottom of the slab plus 3-inches of mulch.)
c. Side slopes: Vertical
d. Riser height: 0.70 feet
e. Filter Hydraulic Conductivity: Use the Hydraulic Conductivity as listed in the table
above (use the lowest applicable hydraulic conductivity depending on the level of
treatment required) under Ecology’s Decision, above.

3
Gravel Trench Bed element model inputs include:
a. Outlet 2 (discharge through the bottom of the sand filter element) should be
connected to the gravel trench bed
b. Outlet 1 (surface discharge from the sand filter element) represents the overflow
(bypass through the Terraflume weir tray in the flow splitter) and should not be
connected to the gravel trench bed
c. Trench length and width: same as the Filterra® Bioscape™ unit (modeled in the sand
filter element)
d. Effective total depth: 1.167 feet (includes 1 foot of freeboard)
e. Bottom slope: 0.001 ft/ft (must be a non-zero input)
f. Riser height: 0.167 feet (depth of aggregate layer below underdrain pipe)
g. Layer 1 thickness: 0.167 feet
h. Layer 1 porosity: 0.3
i. Infiltration: yes, if native soil infiltration is possible. Use short-term native soil
infiltration rate with a safety factor of 4.
7. The minimum size filter surface-area for use in eastern Washington is determined by using
the design water quality flow rate (as determined in item 3, above) and the Infiltration Rate
from the above table (use the lowest applicable Infiltration Rate depending on the level of
treatment required). Calculate the required area by dividing the water quality design flow rate
(cu ft/sec) by the Infiltration Rate (converted to ft/sec) to obtain required surface area (sq ft)
of the Filterra unit.
8. The distance from the point of entry of water to the most distant point on the surface of the
Filterra® BioscapeTM treatment media shall not exceed 12-feet. The Filterra® BioscapeTM
requires water to flow across the entire surface area to obtain optimal performance.
9. Users can design the Filterra® BioscapeTM units without an underdrain. Users shall design the
system with a temporary water storage area beneath the treatment media to provide a
detention reservoir. Water shall not saturate the treatment media at any time.
10. Discharges from the Filterra® units shall not cause or contribute to water quality standards
violations in receiving waters.
Applicant: Filterra® Bioretention Systems, division of Americast, Inc.
Applicant’s Address: 11352 Virginia Precast Road
Ashland, VA, 23005
Application Documents:
State of Washington Department of Ecology Application for Conditional Use
Designation, Americast (September 2006)
Quality Assurance Project Plan Filterra® Bioretention Filtration System Performance
Monitoring, Americast (April 2008)
Quality Assurance Project Plan Addendum Filterra® Bioretention Filtration System
Performance Monitoring, Americast (June 2008)

4
Draft Technical Evaluation Report Filterra® Bioretention Filtration System Performance
Monitoring, Americast (August 2009)
Final Technical Evaluation Report Filterra® Bioretention Filtration System Performance
Monitoring, Americast (December 2009)
Technical Evaluation Report Appendices Filterra® Bioretention Filtration System
Performance Monitoring, Americast (August 2009)
Memorandum to Department of Ecology Dated October 9, 2009 from Americast, Inc. and
Herrera Environmental Consultants
Quality Assurance Project Plan Filterra® Bioretention System Phosphorus treatment and
Supplemental Basic and Enhanced Treatment Performance Monitoring, Americast
(November 2011)
Filterra® letter August 24, 2012 regarding sizing for the Filterra® Shallow System.
University of Virginia Engineering Department Memo by Joanna Crowe Curran, Ph. D
dated March 16, 2013 concerning capacity analysis of Filterra® internal weir inlet tray.
Filterra® BioscapeTM Bioretention System Model Configuration Approval Request,
January 2014
Terraphase Engineering letter to Jodi Mills, P.E. dated April 2, 2013 regarding
Terraflume Hydraulic Test, Filterra® Bioretention System and attachments.
Technical Evaluation Report, Filterra® System Phosphorus Treatment and Supplemental
Basic Treatment Performance Monitoring. March 27th, 2014.
Applicant’s Use Level Request:
General Level Use Designation for Basic, Enhanced, Phosphorus, and Oil Treatment.
Applicant’s Performance Claims:
Field-testing and laboratory testing show that the Filterra® unit is promising as a stormwater
treatment best management practice and can meet Ecology’s performance goals for basic,
enhanced, phosphorus, and oil treatment.
Findings of Fact:
Field Testing 2013
1. Filterra® completed field-testing of a 6.5 ft x 4 ft. unit at one site in Bellingham,
Washington. Continuous flow and rainfall data collected from January 1, 2013 through
July 23, 2013 indicated that 59 storm events occurred. The monitoring obtained water
quality data from 22 storm events. Not all the sampled storms produced information that
met TAPE criteria for storm and/or water quality data.
2. The system treated 98.9 percent of the total 8-month runoff volume during the testing
period. Consequently, the system achieved the goal of treating 91 percent of the volume
from the site. Stormwater runoff bypassed during four of the 59 storm events.

5
3. Of the 22 sampled events, 18 qualified for TSS analysis (influent TSS concentrations
ranged from 25 to 138 mg/L). The data were segregated into sample pairs with influent
concentration greater than and less than 100 mg/L. The UCL95 mean effluent
concentration for the data with influent less than 100 mg/L was 5.2 mg/L, below the 20-
mg/L threshold. Although the TAPE guidelines do not require an evaluation of TSS
removal efficiency for influent concentrations below 100 mg/L, the mean TSS removal
for these samples was 90.1 percent. Average removal of influent TSS concentrations
greater than 100 mg/L (three events) was 85 percent. In addition, the system consistently
exhibited TSS removal greater than 80 percent at flow rates at a 100 inches per hour
[in/hr] infiltration rate and was observed at 150 in/hr.
4. Ten of the 22 sampled events qualified for TP analysis. Americast augmented the dataset
using two sample pairs from previous monitoring at the site. Influent TP concentrations
ranged from 0.11 to 0.52 mg/L. The mean TP removal for these twelve events was 72.6
percent. The LCL95 mean percent removal was 66.0, well above the TAPE requirement
of 50 percent. Treatment above 50 percent was evident at 100 in/hr infiltration rate and as
high as 150 in/hr. Consequently, the Filterra® test system met the TAPE Phosphorus
Treatment goal at 100 in/hr. Influent ortho-P concentrations ranged from 0.005 to 0.012
mg/L; effluent ortho-P concentrations ranged from 0.005 to 0.013 mg/L. The reporting
limit/resolution for the ortho-P test method is 0.01 mg/L, therefore the influent and
effluent ortho-P concentrations were both at or near non-detect concentrations.
Field Testing 2008-2009
1. Filterra® completed field-testing at two sites at the Port of Tacoma. Continuous flow and
rainfall data collected during the 2008-2009 monitoring period indicated that 89 storm
events occurred. The monitoring obtained water quality data from 27 storm events. Not
all the sampled storms produced information that met TAPE criteria for storm and/or
water quality data.
2. During the testing at the Port of Tacoma, 98.96 to 99.89 percent of the annual influent
runoff volume passed through the POT1 and POT2 test systems respectively.
Stormwater runoff bypassed the POT1 test system during nine storm events and bypassed
the POT2 test system during one storm event. Bypass volumes ranged from 0.13% to
15.3% of the influent storm volume. Both test systems achieved the 91 percent water
quality treatment-goal over the 1-year monitoring period.
3. Consultants observed infiltration rates as high as 133 in/hr during the various storms.
Filterra® did not provide any paired data that identified percent removal of TSS, metals,
oil, or phosphorus at an instantaneous observed flow rate.
4. The maximum storm average hydraulic loading rate associated with water quality data is
<40 in/hr, with the majority of flow rates < 25 in/hr. The average instantaneous hydraulic
loading rate ranged from 8.6 to 53 inches per hour.
5. The field data showed a removal rate greater than 80% for TSS with an influent
concentration greater than 20 mg/l at an average instantaneous hydraulic loading rate up
to 53 in/hr (average influent concentration of 28.8 mg/l, average effluent concentration of
4.3 mg/l).

6
6. The field data showed a removal rate generally greater than 54% for dissolved zinc at an
average instantaneous hydraulic loading rate up to 60 in/hr and an average influent
concentration of 0.266 mg/l (average effluent concentration of 0.115 mg/l).
7. The field data showed a removal rate generally greater than 40% for dissolved copper at
an average instantaneous hydraulic loading rate up to 35 in/hr and an average influent
concentration of 0.0070 mg/l (average effluent concentration of 0.0036 mg/l).
8. The field data showed an average removal rate of 93% for total petroleum hydrocarbon
(TPH) at an average instantaneous hydraulic loading rate up to 53 in/hr and an average
influent concentration of 52 mg/l (average effluent concentration of 2.3 mg/l). The data
also shows achievement of less than 15 mg/l TPH for grab samples. Filterra® provided
limited visible sheen data due to access limitations at the outlet monitoring location.
9. The field data showed low percentage removals of total phosphorus at all storm flows at
an average influent concentration of 0.189 mg/l (average effluent concentration of 0.171
mg/l). We may relate the relatively poor treatment performance of the Filterra® system at
this location to influent characteristics for total phosphorus that are unique to the Port of
Tacoma site. It appears that the Filterra® system will not meet the 50 percent removal
performance goal when you expect the majority of phosphorus in the runoff to be in the
dissolved form.
Laboratory Testing
1. Filterra® performed laboratory testing on a scaled down version of the Filterra® unit. The
lab data showed an average removal from 83-91% for TSS with influents ranging from
21 to 320 mg/L, 82-84% for total copper with influents ranging from 0.94 to 2.3 mg/L,
and 50-61% for orthophosphate with influents ranging from 2.46 to 14.37 mg/L.
2. Filterra® conducted permeability tests on the soil media.
3. Lab scale testing using Sil-Co-Sil 106 showed percent removals ranging from 70.1% to
95.5% with a median percent removal of 90.7%, for influent concentrations ranging from
8.3 to 260 mg/L. Filterra® ran these laboratory tests at an infiltration rate of 50 in/hr.
4. Supplemental lab testing conducted in September 2009 using Sil-Co-Sil 106 showed an
average percent removal of 90.6%. These laboratory tests were run at infiltration rates
ranging from 25 to 150 in/hr for influent concentrations ranging from 41.6 to 252.5 mg/l.
Regression analysis results indicate that the Filterra® system’s TSS removal performance
is independent of influent concentration in the concentration rage evaluated at hydraulic
loading rates of up to 150 in/hr.

7
Contact Information:
Applicant: Sean Darcy
Contech Engineered Solutions, LLC.
11815 Glenn Widing Dr
Portland, OR 97220
(503) 258-3105 [email protected]
Applicant’s Website: http://www.conteches.com
Ecology web link: http://www.ecy.wa.gov/programs/wq/stormwater/newtech/index.html
Ecology: Douglas C. Howie, P.E.
Department of Ecology
Water Quality Program
(360) 407-6444
Date Revision
July 2014 GULD for Basic, Enhanced, Phosphorus and Oil granted
March 2015 Revised Contact Information
December 2015 Revised device name from Filterra® BoxlessTM to Filterra®BioscapeTM
June 2016 Revised text regarding Hydraulic conductivity value

Note: Some pages in this document have been purposely skipped or blank pages inserted so that this document will copy correctly when duplexed.
1
February 2013
GENERAL USE LEVEL DESIGNATION FOR BASIC (TSS) TREATMENT
For
CONTECH Engineered Solutions
Media Filtration System (MFS)
Ecology’s Decision:
1. Based on the Contech’s application submissions and recommendations by the
Technical Review Committee (TRC), Ecology hereby issues a General Use Level
Designation (GULD) for the Media Filtration System (MFS):
As a basic stormwater treatment practice for total suspended solids (TSS)
removal,
Using perlite media, with the size distribution described below,
Sized for a range of cartridge sizes from 12-inches to 22-inches tall assuming
a constant unit flow rate of 1-gpm for every 2.44 inches of height. This
results in an allowable operating rate of 4.9 gpm for the 12-inch tall cartridge
and 9.0 gpm for the 22-inch tall cartridge (except as stated in Condition #1,
below), and
Internal bypassing needs to be consistent with the design guidelines in
Contech’s current product design manual. Off-line configurations allow for
easy identification of maintenance needs.
2. Ecology approved MFS systems containing perlite for treatment at 9.0 GPM for
22-inch tall cartridges and 4.9 gpm for 12-inch tall cartridges per 18-inch
diameter cartridge. Designers shall calculate the water quality design flow rates
using the following procedures:
Western Washington: For treatment installed upstream of detention or
retention, the water quality design flow rate is the peak 15-minute flow rate
as calculated using the latest version of the Western Washington Hydrology
Model or other Ecology-approved continuous runoff model.
Eastern Washington: For treatment installed upstream of detention or
retention, the water quality design flow rate is the peak 15-minute flow rate
as calculated using one of the three methods described in Chapter 2.2.5 of the

2
Stormwater Management Manual for Eastern Washington (SWMMEW) or
local manual.
Entire State: For treatment installed downstream of detention, the water
quality design flow rate is the full 2-year release rate of the detention facility.
3. This designation has no expiration date, but it may be amended or revoked by
Ecology, and is subject to the conditions specified below.
Ecology’s Conditions of Use:
The MFS shall comply with these conditions:
1. Design, assemble, install, operate, and maintain the MFS system in accordance
with applicable Contech Engineered Solutions manuals, documents and the
Ecology Decision.
2. Install the MFS in such a manner that you bypass flows exceeding 9.0
gpm/cartridge or you will not re-suspend previously captured sediments. Design
MFS in accordance with the performance goals in Ecology's most recent
Stormwater Manual. The design, pretreatment, land use application, and
maintenance criteria must follow the MFS design requirements.
3. Maintenance: The required maintenance interval for stormwater treatment
devices is often dependent upon the degree of pollutant loading from a particular
drainage basin. Therefore, Ecology does not endorse or recommend a “one size
fits all” maintenance cycle for a particular model/size of manufactured filter
treatment device.
Typically, CONTECH designs the MFS for a target filter media replacement
interval of 12 months. Maintenance includes removing accumulated sediment
from the vault, and replacing spent cartridges with recharged cartridges.
Testing results provided to Ecology for the Basic GULD approval indicate:
o At one site, filter cartridges were still in operation after
approximately ten months of monitoring and 35.6 inches of rainfall,
with no apparent decrease in performance.
o At a second site, Contech ceased monitoring before the hydraulic
capacity decreased. Contech replaced cartridges after approximately
four months of monitoring and 20.4 inches of rainfall to conduct a
loading mass balance of the system. The loading mass balance of the
entire system resulted in 51 lbs of sediment per cartridge.
o Blockage or occlusion of the media did not occur as evidenced by lack
of a decrease in TSS treatment or by elevated vault water levels
during monitored storm events at either site. Contech analyzed spent
cartridges and determined the cartridges were at full capacity for the
3
theoretical maximum allowable amount of solids capture.
o The above particular maintenance intervals do not necessarily
determine the overall maintenance frequency for all Media Filtration
Systems.
Owners/operators must inspect the MFS for a minimum of twelve months
from the start of post-construction operation to determine site-specific
maintenance schedules and requirements. You must conduct inspections
monthly during the wet season, and every other month during the dry
season. (According to the SWMMWW, the wet season in western
Washington is October 1 to April 30. According to SWMMEW, the wet
season in eastern Washington is October 1 to June 30). After the first year of
operation, owners/operators must conduct inspections based on the findings
during the first year of inspections.
Conduct inspections by qualified personnel, follow manufacturer’s
guidelines, and you must use methods capable of determining either a
decrease in treated effluent flowrate and/or a decrease in pollutant removal
ability.
When inspections are performed, the following findings typically serve as
maintenance triggers:
o Accumulated vault sediment depths exceed an average of 12 inches, or
o Accumulated sediment depths on the tops of the cartridges exceed an
average of 0.5 inches, or
o If excessive floatables (trash and debris) are present, perform a minor
maintenance consisting of gross solids removal, not cartridge
replacement.
o Bypass during storms smaller than the design storm.
4. Contech shall maintain readily available those reports listed under “Application
Documents” as public, as well as the documentation submitted with its previous
conditional use designation application. Contech shall make this information
available upon request, at no cost and in a timely manner.
5. The perlite media used shall conform with the following specifications:
The size of the media ranges from 0.125 to 0.375 inches. The dry bulk
density ranges from 4.5 to 6.5 lbs per cubic foot. The following table shows a
typical particle size distribution of the perlite media

4
Sieve Analysis of the perlite media:
US Sieve No. Sieve Opening (μm) % Retained by Volume
4 4760 35-50
8 2360 75-99
16 1180 98-100
30 600 99-100
50 300 99-100
100 150 99-100
Each 22 inch cartridge contains a total of approximately 3.14 cubic feet of media.
Applicant: Contech Engineered Solutions
Applicant’s Address: Contech Engineered Solutions
11835 NE Glen Widing Drive
Portland, OR 97220
Application Documents:
“Application to Washington Department of Ecology Water Control Program for General
Use Level Designation of Media Filtration System – Technical Evaluation Engineering
Report”, Contech Engineered Solutions, July 2006. It includes the following public
report:
(Public) “Evaluation of the Media Filtration System: Data Validation Report and
Summary of the Technical Evaluation Engineering Report (TEER)”, Water
Resources Management, June 2006.
Ecology’s technology assessment protocol requires the applicant to hire an
independent consultant to complete the following work:
1. Complete the data validation report.
2. Prepare a TEER summary, including a testing summary and conclusions
compared with the supplier’s performance claims.
3. Provide a recommendation of the appropriate technology use level.
4. Ecology recommends you post relevant information on Ecology’s website.
5. Provide additional testing recommendations, if needed.”
This report, authored by Roger B. James, P.E., Water Resources Management,
satisfies the Ecology requirement.
Above-listed document noted as “public” is available by contacting Contech.

5
Applicant's Use Level Request:
General Use Level Designation for Basic Treatment for the MFS using perlite at 9.0
GPM/filter (18-in diameter, 22-in tall) in accordance with Ecology's most recent
stormwater management manual.
Applicant's Performance Claim:
The combined data from the two field sites reported in this TEER (Silverton Highway,
Hillsboro, OR and Lolo Pass, Zigzag, OR) indicate that the performance of a MFS
configured for inline bypass with perlite media and a 9.0 GPM filtration rate per 22-inch
tall cartridge meets Ecology performance goals for Basic Treatment.
Technical Review Committee Recommendations:
The TRC, based on the weight of the evidence and using its best professional judgment,
finds that:
The MFS, using perlite media and operating at no more than 9.0 GPM per 22-inch tall
cartridge is expected to provide effective stormwater treatment achieving Ecology’s
basic treatment removal goals, as demonstrated by field and laboratory testing
performed in accordance with the protocol; and
Ecology deems the MFS satisfactory with respect to factors other than treatment
performance.
Findings of Fact:
Influent TSS concentrations and particle size distributions were generally within the
range of “typical” concentrations for western Washington (silt to silt loam).
Contech sampled storm events at two monitoring sites for storms from December
2005 to April 2006, and deemed twenty nine (29) as “qualified” and were therefore
included in the data evaluation. Both sites were located on roadways.
Statistical analysis of these 29 storm events verifies the data set’s adequacy.
For the ten (10) qualifying events with influent TSS concentrations greater than 100
mg/L but less than 300 mg/L, the average influent concentration, average effluent
concentration, and average pollutant reduction were 151.70 mg/L, 24.81 mg/L, and
83.6%, respectively.
For the nineteen (19) qualifying events with influent TSS concentrations less than 100
mg/L, the average influent concentration, average effluent concentration, and average
pollutant reduction were 61.42 mg/L, 19.09 mg/L, and 68.9%, respectively.
The float control valve operated as designed according to the inflow, outflow and
water elevation measurements in the vault.
Laboratory testing using U.S. Sil-Co-Sil 106 showed removal rates around 85% for
flowrates 10 GPM or below, and between 72% and 81% for flowrates at or above 15
GPM.

6
At the Silverton site, flows ranged between 19.6% and 304.5% of the water quality
design flowrate, and averaged 138% of the water quality design flowrate.
At the Lolo Pass site, flows ranged between 7.8% and 150.9% of the water quality
design flowrate, and averaged 57.4% of the water quality design flowrate.
Analyzing the individual storm events at Lolo Pass, Zigzag (20 storms) and Silverton
Highway, Hillsboro site (11 storms), the average removal of total chromium ranged
from 62.1% to 62.9%, the average removal of total zinc ranged from 51.9% to 63.5%,
the average removal of total copper ranged from 57.2% to 61.3%, and the average
removal of total lead ranged from 69.4% to 70.9%. These removals do not qualify for
an enhanced treatment designation.
Analyzing the individual storm events at Lolo Pass, Zigzag (17 storms) and Silverton
Highway, Hillsboro site (11 storms) the removal of total phosphorus was 67%. These
removals do not qualify for phosphorus treatment designations.
The Contech application included a satisfactory discussion for the “Factors other than
Treatment Performance” section.
Note: Ecology’s 80% TSS removal goal applies to 100 mg/l and greater influent TSS.
Below 100 mg/L influent TSS, the goal is 20 mg/L effluent TSS.

7
Technology Description and System Operation:
A weir diverts stormwater runoff entering the system and water flows to the portion of
the vault beneath the cartridge where the system settles and captures larger solids. The
system operates by filtering the stormwater through media filled cartridges. The system
is designed to allow approximately 3 GPM or less to flow through each cartridge while
the water level is rising in the vault (slide gate is in the closed position).
Filtered water enters a perforated drain tube located in the center of the cartridge and
flows to the collector manifold through a flexible pipe. Contech plumbed the manifold to
a float controlled slide gate that sets the overall operational control of the Media
Filtration System to achieve a balance between flow and driving head level. Contech
designed the float to fully open the slide gate as the water level reaches the top of the
cartridges. The float control valve ensures that the system develops a uniform vertical
pressure distribution from the bottom to the top of each cartridge, which ensures even
hydraulic loading and maximum exposure of the perlite media within each cartridge filter
at the same time and hydraulic loading rate.
After the storm event has ended, the remaining water is slowly released at less than or
equal to 3GPM through each cartridge and the slide gate until the vault is drained to the
outlet pipe’s invert level. This less than or equal to 3 GPM/cartridge drain down is an
engineered process that has been designed into the slide gate and is referred as the
“leakage”. This operation of the slide gate assures that the system doesn’t expose media
to artificial shocking flows or abrupt hammering hydraulic forces that can destabilize
and/or induce channelization through the media. When stormwater runoff flows recede,
the float controlled slide gate will close until the next triggering runoff event.
Contech positions cartridges 21 inches above the vault floor providing an underbay
(forebay) volume for settling larger, heavier sediments below the cartridges preventing
occlusion of the media resulting from sediment buildup. When the system is operating at
a 9GPM/cartridge design loading rate, the maximum upflow velocity in the vault is
approximately 2 mm/sec. At this upflow velocity, particles in the 45 to 50 micron size
range with a specific gravity of 2.65 may settle in the area beneath the cartridges
removing the majority of the mass of suspended solids found in stormwater runoff. This
presettling design feature makes for long filter bed run times, reduces the frequency of
maintenance, and negates the need to thoroughly clean the entire vault structure each time
you exchange or recharge media cartridges.

8
Figure 1 - Image of a MFS cartridge
MFS Configurations:
Contech offers the MFS in four basic configurations: precast manhole, trench catchbasin,
and vault or cast-in-place vault form. The precast models use pre-manufactured units to
ease the design and installation process. Contech can customize cast-in-place units for
larger flows and may be either uncovered or covered underground units.
Figure 2 - The Precast Media Filtration System

9
Recommended Research and Development:
Ecology encourages Contech to pursue continuous improvements to the MFS. To that
end, Ecology recommends the following actions:
Conduct a hydraulic analysis of units that require complete drawdown of water
between events. Conduct a hydraulic analysis to discover the percent of untreated
water that is lost during drawdown and operation of these units.
Continue work on developing best operation and maintenance practices. Contech is
encouraged to update Ecology and the TRC of their operation and maintenance
experiences.
As you gain experience on operation and maintenance, Contech is encouraged to
update their O&M manual to reflect learned knowledge.
Contact Information:
Applicant Contact: Sean Darcy
Contech Engineered Solutions
11835 NE Glenn Widing Drive
Portland, OR, 97220
503-258-3105
Applicant Web link: www.conteches.com
Ecology web link: www.ecy.wa.gov/programs/wq/stormwater/newtech/index.html
Ecology Contact: Douglas C. Howie, P.E.
Water Quality Program
(360) 407-6444
Revision History
Date Revision
November 2006 GULD for Basic Treatment
December 2011 Updated information on cartridge heights and flows
February 2013 Maintenance requirements updated, design storm discussion
revised

Note: Some pages in this document have been purposely skipped or blank pages inserted so that this document will copy correctly when duplexed.

December 2015
GENERAL USE LEVEL DESIGNATION FOR BASIC, ENHANCED, AND
PHOSPHORUS TREATMENT
For the
MWS-Linear Modular Wetland
Ecology’s Decision:
Based on Modular Wetland Systems, Inc. application submissions, including the Technical
Evaluation Report, dated April 1, 2014, Ecology hereby issues the following use level
designation:
1. General use level designation (GULD) for the MWS-Linear Modular Wetland Stormwater
Treatment System for Basic treatment
Sized at a hydraulic loading rate of 1 gallon per minute (gpm) per square foot (sq ft) of
wetland cell surface area. For moderate pollutant loading rates (low to medium density
residential basins), size the Prefilters at 3.0 gpm/sq ft of cartridge surface area. For high
loading rates (commercial and industrial basins), size the Prefilters at 2.1 gpm/sq ft of
cartridge surface area.
2. General use level designation (GULD) for the MWS-Linear Modular Wetland Stormwater
Treatment System for Phosphorus treatment
Sized at a hydraulic loading rate of 1 gallon per minute (gpm) per square foot (sq ft) of
wetland cell surface area. For moderate pollutant loading rates (low to medium density
residential basins), size the Prefilters at 3.0 gpm/sq ft of cartridge surface area. For high
loading rates (commercial and industrial basins), size the Prefilters at 2.1 gpm/sq ft of
cartridge surface area.
3. General use level designation (GULD) for the MWS-Linear Modular Wetland Stormwater
Treatment System for Enhanced treatment
Sized at a hydraulic loading rate of 1 gallon per minute (gpm) per square foot (sq ft) of
wetland cell surface area. For moderate pollutant loading rates (low to medium density
residential basins), size the Prefilters at 3.0 gpm/sq ft of cartridge surface area. For high
loading rates (commercial and industrial basins), size the Prefilters at 2.1 gpm/sq ft of
cartridge surface area.

4. Ecology approves the MWS - Linear Modular Wetland Stormwater Treatment System units
for Basic, Phosphorus, and Enhanced treatment at the hydraulic loading rate listed above.
Designers shall calculate the water quality design flow rates using the following procedures:
Western Washington: For treatment installed upstream of detention or retention, the
water quality design flow rate is the peak 15-minute flow rate as calculated using the
latest version of the Western Washington Hydrology Model or other Ecology-approved
continuous runoff model.
Eastern Washington: For treatment installed upstream of detention or retention, the
water quality design flow rate is the peak 15-minute flow rate as calculated using one of
the three methods described in Chapter 2.2.5 of the Stormwater Management Manual
for Eastern Washington (SWMMEW) or local manual.
Entire State: For treatment installed downstream of detention, the water quality design
flow rate is the full 2-year release rate of the detention facility.
5. These use level designations have no expiration date but may be revoked or amended by
Ecology, and are subject to the conditions specified below.
Ecology’s Conditions of Use:
Applicants shall comply with the following conditions:
1. Design, assemble, install, operate, and maintain the MWS – Linear Modular Wetland
Stormwater Treatment System units, in accordance with Modular Wetland Systems, Inc.
applicable manuals and documents and the Ecology Decision.
2. Each site plan must undergo Modular Wetland Systems, Inc. review and approval before
site installation. This ensures that site grading and slope are appropriate for use of a MWS
– Linear Modular Wetland Stormwater Treatment System unit.
3. MWS – Linear Modular Wetland Stormwater Treatment System media shall conform to the
specifications submitted to, and approved by, Ecology.
4. The applicant tested the MWS – Linear Modular Wetland Stormwater Treatment System
with an external bypass weir. This weir limited the depth of water flowing through the
media, and therefore the active treatment area, to below the root zone of the plants. This
GULD applies to MWS – Linear Modular Wetland Stormwater Treatment Systems whether
plants are included in the final product or not.
5. Maintenance: The required maintenance interval for stormwater treatment devices is often
dependent upon the degree of pollutant loading from a particular drainage basin. Therefore,
Ecology does not endorse or recommend a “one size fits all” maintenance cycle for a
particular model/size of manufactured filter treatment device.
Typically, Modular Wetland Systems, Inc. designs MWS - Linear Modular Wetland
systems for a target prefilter media life of 6 to 12 months.
Indications of the need for maintenance include effluent flow decreasing to below the
design flow rate or decrease in treatment below required levels.
Owners/operators must inspect MWS - Linear Modular Wetland systems for a minimum
of twelve months from the start of post-construction operation to determine site-specific

maintenance schedules and requirements. You must conduct inspections monthly during
the wet season, and every other month during the dry season. (According to the
SWMMWW, the wet season in western Washington is October 1 to April 30. According
to SWMMEW, the wet season in eastern Washington is October 1 to June 30). After the
first year of operation, owners/operators must conduct inspections based on the findings
during the first year of inspections.
Conduct inspections by qualified personnel, follow manufacturer’s guidelines, and use
methods capable of determining either a decrease in treated effluent flowrate and/or a
decrease in pollutant removal ability.
When inspections are performed, the following findings typically serve as maintenance
triggers:
Standing water remains in the vault between rain events, or
Bypass occurs during storms smaller than the design storm.
If excessive floatables (trash and debris) are present (but no standing water or
excessive sedimentation), perform a minor maintenance consisting of gross solids
removal, not prefilter media replacement.
Additional data collection will be used to create a correlation between pretreatment
chamber sediment depth and pre-filter clogging (see Issues to be Addressed by the
Company section below)
6. Discharges from the MWS - Linear Modular Wetland Stormwater Treatment System units
shall not cause or contribute to water quality standards violations in receiving waters.
Applicant: Modular Wetland Systems, Inc. Applicant's Address: PO. Box 869
Oceanside, CA 92054
Application Documents:
Original Application for Conditional Use Level Designation, Modular Wetland System,
Linear Stormwater Filtration System Modular Wetland Systems, Inc., January 2011
Quality Assurance Project Plan: Modular Wetland system – Linear Treatment System
performance Monitoring Project, draft, January 2011.
Revised Application for Conditional Use Level Designation, Modular Wetland System,
Linear Stormwater Filtration System Modular Wetland Systems, Inc., May 2011
Memorandum: Modular Wetland System-Linear GULD Application Supplementary Data,
April 2014
Technical Evaluation Report: Modular Wetland System Stormwater Treatment System
Performance Monitoring, April 2014.

Applicant's Use Level Request:
General use level designation as a Basic, Enhanced, and Phosphorus treatment device in
accordance with Ecology’s Guidance for Evaluating Emerging Stormwater Treatment
Technologies Technology Assessment Protocol – Ecology (TAPE) January 2011 Revision.
Applicant's Performance Claims:
The MWS – Linear Modular wetland is capable of removing a minimum of 80-percent
of TSS from stormwater with influent concentrations between 100 and 200 mg/l.
The MWS – Linear Modular wetland is capable of removing a minimum of 50-percent
of Total Phosphorus from stormwater with influent concentrations between 0.1 and 0.5
mg/l.
The MWS – Linear Modular wetland is capable of removing a minimum of 30-percent
of dissolved Copper from stormwater with influent concentrations between 0.005 and
0.020 mg/l.
The MWS – Linear Modular wetland is capable of removing a minimum of 60-percent
of dissolved Zinc from stormwater with influent concentrations between 0.02 and 0.30
mg/l.
Ecology Recommendations:
Modular Wetland Systems, Inc. has shown Ecology, through laboratory and field-
testing, that the MWS - Linear Modular Wetland Stormwater Treatment System filter
system is capable of attaining Ecology's Basic, Total phosphorus, and Enhanced
treatment goals.
Findings of Fact:
Laboratory Testing
The MWS-Linear Modular wetland has the:
Capability to remove 99 percent of total suspended solids (using Sil-Co-Sil 106) in a
quarter-scale model with influent concentrations of 270 mg/L.
Capability to remove 91 percent of total suspended solids (using Sil-Co-Sil 106) in
laboratory conditions with influent concentrations of 84.6 mg/L at a flow rate of 3.0
gpm per square foot of media.
Capability to remove 93 percent of dissolved Copper in a quarter-scale model with
influent concentrations of 0.757 mg/L.
Capability to remove 79 percent of dissolved Copper in laboratory conditions with
influent concentrations of 0.567 mg/L at a flow rate of 3.0 gpm per square foot of
media.
Capability to remove 80.5-percent of dissolved Zinc in a quarter-scale model with
influent concentrations of 0.95 mg/L at a flow rate of 3.0 gpm per square foot of media.
Capability to remove 78-percent of dissolved Zinc in laboratory conditions with influent
concentrations of 0.75 mg/L at a flow rate of 3.0 gpm per square foot of media.

Field Testing
Modular Wetland Systems, Inc. conducted monitoring of an MWS-Linear (Model
# MWS-L-4-13) from April 2012 through May 2013, at a transportation maintenance
facility in Portland, Oregon. The manufacturer collected flow-weighted composite
samples of the system’s influent and effluent during 28 separate storm events. The
system treated approximately 75 percent of the runoff from 53.5 inches of rainfall
during the monitoring period. The applicant sized the system at 1 gpm/sq ft. (wetland
media) and 3gpm/sq ft. (prefilter).
Influent TSS concentrations for qualifying sampled storm events ranged from 20 to 339
mg/L. Average TSS removal for influent concentrations greater than 100 mg/L (n=7)
averaged 85 percent. For influent concentrations in the range of 20-100 mg/L (n=18),
the upper 95 percent confidence interval about the mean effluent concentration was
12.8 mg/L.
Total phosphorus removal for 17 events with influent TP concentrations in the range of
0.1 to 0.5 mg/L averaged 65 percent. A bootstrap estimate of the lower 95 percent
confidence limit (LCL95) of the mean total phosphorus reduction was 58 percent.
The lower 95 percent confidence limit of the mean percent removal was 60.5 percent for
dissolved zinc for influent concentrations in the range of 0.02 to 0.3 mg/L (n=11).
The lower 95 percent confidence limit of the mean percent removal was 32.5 percent for
dissolved copper for influent concentrations in the range of 0.005 to 0.02 mg/L (n=14)
at flow rates up to 28 gpm (design flow rate 41 gpm). Laboratory test data augmented
the data set, showing dissolved copper removal at the design flow rate of 41 gpm (93
percent reduction in influent dissolved copper of 0.757 mg/L).
Issues to be addressed by the Company:
1. Modular Wetland Systems, Inc. should collect maintenance and inspection data for the
first year on all installations in the Northwest in order to assess standard maintenance
requirements for various land uses in the region. Modular Wetland Systems, Inc. should
use these data to establish required maintenance cycles.
2. Modular Wetland Systems, Inc. should collect pre-treatment chamber sediment depth
data for the first year of operation for all installations in the Northwest. Modular
Wetland Systems, Inc. will use these data to create a correlation between sediment depth
and pre-filter clogging.
Technology Description:
Download at http://www.modularwetlands.com/
Contact Information:
Applicant: Greg Kent
Modular Wetland Systems, Inc.
P.O. Box 869
Oceanside, CA 92054

Applicant website: http://www.modularwetlands.com/
Ecology web link: http://www.ecy.wa.gov/programs/wg/stormwater/newtech/index.html
Ecology: Douglas C. Howie, P.E.
Department of Ecology
Water Quality Program
(360) 407-6444
Revision History
Date Revision
June 2011 Original use-level-designation document
September 2012 Revised dates for TER and expiration
January 2013 Modified Design Storm Description, added Revision Table, added
maintenance discussion, modified format in accordance with Ecology
standard
December 2013 Updated name of Applicant
April 2014 Approved GULD designation for Basic, Phosphorus, and Enhanced
treatment
December 2015 Updated GULD to document the acceptance of MWS-Linear
Modular Wetland installations with or without the inclusion of plants.

June 2016
GENERAL USE LEVEL DESIGNATION FOR BASIC AND PHOSPHORUS
TREATMENT
For
Kristar/Oldcastle Precast, Inc. FloGard Perk Filter™ (using ZPC Filter Media)
Ecology’s Decision:
Based on Kristar/Oldcastle’s application submissions, including the Draft Technical
Evaluation Report, dated April 2010, Ecology hereby issues the following use level
designations:
1. General use level designation (GULD) for the Perk Filter™ for basic treatment:
Using a zeolite-perlite-carbon (ZPC) filter media as specified by Kristar/Oldcastle.
Sized at hydraulic loading rate of no more than 1.5 gpm/ft² of media surface area,
per Table 1.
Table 1. Design Flowrate per Cartridge
Effective Cartridge Height (inches) 12 18
Cartridge Flowrate (gpm/cartridge) 6.8 10.2
2. General use level designation (GULD) for the Perk Filter™ for phosphorus treatment:
Using a zeolite-perlite-carbon (ZPC) filter media as specified by Kristar/Oldcastle.
Sized at hydraulic loading rate of no more than 1.5 gpm/ft² of media surface area,
per Table 1.
3. Ecology approves Perk Filter™ units for treatment at the hydraulic loading rates
shown in Table 1, and sized based on the water quality design flow rate for an off-line
system. The internal weir in the inlet chamber functions as a bypass to route flow in
excess of the water quality design flow rate around the treatment chamber. Calculate
the water quality design flow rate using the following procedures:
Western Washington: For treatment installed upstream of detention or retention,
the water quality design flow rate is the peak 15-minute flow rate as calculated using
the latest version of the Western Washington Hydrology Model or other Ecology-
approved continuous runoff model.
Eastern Washington: For treatment installed upstream of detention or retention,
the water quality design flow rate is the peak 15-minute flow rate as calculated using
one of the three methods described in Chapter 2.2.5 of the Stormwater Management
Manual for Eastern Washington (SWMMEW) or local manual.
Entire State: For treatment installed downstream of detention, the water quality
design flow rate is the full 2-year release rate of the detention facility.
4. These General Use Level Designations have no expiration date but may be revoked or
amended by Ecology, and are subject to the conditions specified below.
Ecology’s Conditions of Use:
Perk Filter™ units shall comply with the following conditions:
1. Design, assemble, install, operate, and maintain Perk Filter™ units in accordance with
Kristar/Oldcastle’s applicable manuals and documents and the Ecology Decision.
2. Each site plan must undergo Kristar/Oldcastle review and approval before site
installation. This ensures that site grading and slope are appropriate for use of a Perk
Filter™ unit.
3. Perk Filter™media shall conform to the specifications submitted to, and approved by,
Ecology.
4. Maintenance: The required maintenance interval for stormwater treatment devices is
often dependent upon the degree of pollutant loading from a particular drainage basin.
Therefore, Ecology does not endorse or recommend a “one size fits all” maintenance
cycle for a particular model/size of manufactured filter treatment device.
Typically, Kristar/Oldcastle designs PerkFilter systems for a target filter media
replacement interval of 12 months. Maintenance includes removing accumulated
sediment from the vault, and replacing spent cartridges with recharged cartridges.
Indications of the need for maintenance include effluent flow decreasing to below
the design flow rate, as indicated by the scumline above the shoulder of the
cartridge.
Owners/operators must inspect PerkFilter for a minimum of twelve months from
the start of post-construction operation to determine site-specific maintenance
schedules and requirements. You must conduct inspections monthly during the wet
season, and every other month during the dry season. (According to the
SWMMWW, the wet season in western Washington is October 1 to April 30.
According to SWMMEW, the wet season in eastern Washington is October 1 to
June 30). After the first year of operation, owners/operators must conduct
inspections based on the findings during the first year of inspections.

Conduct inspections by qualified personnel, follow manufacturer’s guidelines, and
use methods capable of determining either a decrease in treated effluent flowrate
and/or a decrease in pollutant removal ability.
When inspections are performed, the following findings typically serve as
maintenance triggers:
Accumulated vault sediment depths exceed an average of 2 inches, or
Accumulated sediment depths on the tops of the cartridges exceed an average of
0.5 inches, or
Standing water remains in the vault between rain events, or
Bypass occurs during storms smaller than the design storm.
Note: If excessive floatables (trash and debris) are present, perform a minor
maintenance consisting of gross solids removal, not cartridge replacement.
5. Discharges from the Perk Filter™ units shall not cause or contribute to water quality
standards violations in receiving waters.
Applicant: Kristar/Oldcastle Precast, Inc.
Applicant’s Address: 360 Sutton Place
Santa Rosa, California 95407
Application Documents:
Perk Filter™ Final Report, prepared by: Office of Water Programs, California State
University, Sacramento (September 2007)
Verification Phase of Perk Filter™ Tests with Zeolite-Perlite-Carbon Media and Zeolite-
Carbon Media (August 2007)
Quality Assurance Project Plan KriStar Perk Filter™ Stormwater Treatment Performance
Monitoring Project, October 2008 Draft
Technical Evaluation Report Volume 1: KriStar Perk Filter™ Stormwater Treatment
System Performance Monitoring, April 2010
Technical Evaluation Report Volume 2 - Appendices: KriStar Perk Filter™ Stormwater
Treatment System Performance Monitoring, April 2010.
Applicant’s Use Level Request:
General use level designation as a basic and Phosphorus treatment device in accordance
with Ecology’s Guidance for Evaluating Emerging Stormwater Treatment Technologies
Technology Assessment Protocol – Ecology (TAPE) January 2011 Revision.

Applicant’s Performance Claims:
Capability to remove 80% of total suspended solids from stormwater runoff from sites
with influent concentrations between 100 mg/L and 200 mg/L and provide effluent
concentrations of 20 mg/L or less with influent concentrations less than 100 mg/L given a
typical particle size distribution.
Capability to remove 50% of Total Phosphorus from stormwater runoff from sites with
influent concentrations between 0.1 mg/l and 0.5 mg/l.
Findings of Fact:
Based on laboratory testing at a flowrate of 12 GPM per filter, the Perk Filter™
containing ZPC media had an average total suspended solids removal efficiency of 82%
using Sil-Co-Sil 106 with an average influent concentration of 102 mg/L and zero initial
sediment loading.
Based on field-testing at a flowrate of 0.57 GPM/inch of cartridge height (17.25 inch
diameter cartridge) (1.5 gpm per sq ft filter surface area), the Perk Filter™ containing
ZPC media had an average total suspended solids removal efficiency of 82.4% for an
influent concentration between 20 mg/L and 200 mg/l. The Perk Filter™ containing ZPC
media had an average removal efficiency of 85.2% for an influent concentration between
100 mg/l and 200 mg/l. Removal rates fell over time and dropped below 80% after
approximately 10 months.
Based on field testing at a flowrate of 0.57 GPM/inch of cartridge height (17.25 inch
diameter cartridge) (1.5 gpm per sq ft filter surface area), the Perk Filter™ containing
ZPC media had an average total Phosphorus removal efficiency of 62.4% for an influent
concentration between 0.1 mg/L and 0.5 mg/l. Removal rates tended to remain relatively
constant during the 10 months of monitoring.
Field Testing indicates that sediment accumulation in the Sediment Gallery during the 10
months of sampling was within the available volume for sediment. Thus, maintenance at
a 6-month frequency (vacuuming of sediment from Inlet Gallery) as suggested by the
manufacturer is sufficient.
Filter flows during bypass events utilize the full 30-inch height of the filter. Without
bypass, an unknown amount of filter is used. Comparing the flow through the filter
during bypass events with the design flow rate shows that the Kristar/Oldcastle system
falls below the design flow rate after approximately 10 months of operation.
Percent removal of TSS falls below 80% after approximately 10 months. There are
earlier data points below 80% but these are from low influent concentration storms

Other Perk Filter™ Related Issues to be Addressed By the Company:
1. Kristar/Oldcastle may perform additional monitoring to better determine the maintenance
frequency for the filters with respect to design flow rate and Total Suspended Solids removal.
Presentation of additional data may result in a modification to the requirements in this Use
Level designation document.
Technology Description: Download at www.kristar.com
Contact Information:
Applicant: Jay Holtz, P.E.
Engineering Manager
Kristar/Oldcastle Precast, Inc.
360 Sutton Place
Santa Rosa, CA, 95407
(800) 579-8819 [email protected]
Applicant website: www.kristar.com
Ecology web link: http://www.ecy.wa.gov/programs/wq/stormwater/newtech/index.html
Ecology: Douglas C. Howie, P.E.
Department of Ecology
Water Quality Program
(360) 407-6444
Revision History
Date Revision
March 2008 Original Draft use-level-designation document
June 2010 Revise Use Level to General
January 2013 Modified Design Storm Description, added Revision Table, formatted
document to match Ecology standard
May 2014 Revised Company name and contact information
June 2016 Designated device for off-line sizing

Note: Some pages in this document have been purposely skipped or blank pages inserted so that this document will copy correctly when duplexed.

December 2012
GENERAL USE LEVEL DESIGNATION FOR PRETREATMENT (TSS)
For
Stormceptor System
Ecology’s Decision:
Based on Imbrium Systems Corporation’s application submissions, Ecology hereby issues
the following Use Level Designation for the Imbrium Systems Corporation Stormceptor
System:
1. General Use Level Designation (GULD) for pretreatment, as defined in Ecology’s 2011
Technical Guidance Manual for Evaluating Emerging Stormwater Treatment
Technologies Technology Assessment Protocol – Ecology (TAPE) Table 2, (a) ahead of
infiltration treatment, or (b) to protect and extend the maintenance cycle of a basic or
enhanced treatment device (e.g., sand or media filter). This GULD applies to
Stormceptor System units sized in accordance with Table 1 (below) at the water
quality design flowrate.
Table 1
Unit
Treatment Flowrate
(gpm)
STC 450i 143
STC 900 285
STC 1200 285
STC 1800 285
STC 2400 476
STC 3600 476
STC 4800 793
STC 6000 793
STC 7200 1110
STC 11000 1585
STC 13000 1585
STC 16000 2220
2. Ecology approves Stormceptor systems for treatment at the hydraulic loading rates
shown in Table 1, and sized based on the water quality design flow rate. Calculate the
water quality design flow rate using the following procedures:
2
Western Washington: For treatment installed upstream of detention or retention,
the water quality design flow rate is the peak 15-minute flow rate as calculated using
the latest version of the Western Washington Hydrology Model or other Ecology-
approved continuous runoff model.
Eastern Washington: For treatment installed upstream of detention or retention,
the water quality design flow rate is the peak 15-minute flow rate as calculated using
one of the three methods described in Chapter 2.2.5 of the Stormwater Management
Manual for Eastern Washington (SWMMEW) or local manual.
Entire State: For treatment installed downstream of detention, the water quality
design flow rate is the full 2-year release rate of the detention facility.
3. The GULD has no expiration date, but Ecology may amend or revoke the designation at
any time.
4. All designations are subject to the conditions specified below.
5. Properly designed and operated Stormceptor Systems may also have applicability in
other situations (example: low-head situations such as bridges or ferry docks), for TSS
removal where, on a case-by-case basis, the permittee finds it infeasible or
impracticable to use any other approved practice. Jurisdictions covered under the
Phase I or II municipal stormwater permits should use variance/exception procedures
and criteria as required by their NPDES permit.
6. Ecology finds that the Stormceptor System could also provide water quality benefits in
retrofit situations.
Ecology’s Conditions of Use:
Stormceptor Systems shall comply with these conditions:
1. Design, assemble, install, operate, and maintain Stormceptor Systems in accordance
with Imbrium Systems Corporation’s applicable manuals and documents and the
Ecology decision and conditions specified herein. Ecology recommends the inspection
and maintenance schedule included as Attachment 1:
2. Discharges from the Stormceptor System shall not cause or contribute to water
quality standards violations in receiving waters.

3
Applicant: Dan Nason
Imbrium Systems Corporation Applicant Address: 100 Grove Street
Worcester, MA, 01605
Application Documents:
Submission for Verification Acceptance, State of Washington Department of Ecology
(WADOE), dated May 2005. This document contains the following elements:
o Submission for Verification Acceptance, including an abridged version of the
application and a technical manual
o Field data, Westwood, MA, 1997
o Field data, Seatac, WA, 1999
o Testing summary, Como Park, MN, 1998
o Testing summary, Edmonton, AB, 1994-6
o Wisconsin DNR/USGS report, conference paper, and monitoring summary, 1998
o Laboratory evaluation, done for NJDEP, 2004
o Coventry University laboratory study, 1996
o Stormwater hydrology report, Bryant et. al.
o Canada Environmental Technology Verification report, 2003
o Massachusetts Strategic Envirotechnology Partnership report, 1998
o NJCAT certification report, 2005
A Review of Stormceptor™ - In Contrast to Other Wet Vaults that have Received
Certification under the Washington State Department of Ecology’s TAPE Program for
Rinker Materials, Gary Minton, July 10, 2007
With the exception of any files identified as confidential, you may obtain a CD-ROM containing
these submittal documents by contacting Imbrium Systems Corporation.
Applicant’s Use Level Requests:
General Use Level Designation (GULD) for pretreatment.
Applicant’s Performance Claims:
Imbrium Systems demonstrated the ability of the Stormceptor System to meet the State of
Washington’s pretreatment (TSS) criteria based on analyses of data from field and
laboratory studies. Laboratory studies utilized both OK-110 sand and the NJDEP particle
size distribution...
Imbrium Systems demonstrated the ability of the Stormceptor System to remove material
finer than 500 microns. Imbrium did not design the Stormceptor System to remove litter
and debris.

4
The Stormceptor System removes large portions of sand and silt from stormwater on a
long-term basis, thereby preventing material from entering a downstream treatment
facility, thus extending the maintenance cycle of the downstream facility.
Imbrium Systems demonstrated through field performance and laboratory studies the
scour prevention capability of the Stormceptor System. The system’s unique design
prevents loss of previously captured pollutants during periods with higher flowrates.
The Stormceptor System is an easy-to-maintain device that is much more cost-effective
to maintain/clean than many alternative methods such as filtration systems and detention
ponds.
Imbrium Systems demonstrated through field and laboratory study Stormceptor’s
capability to function as an effective spill capture device for petroleum hydrocarbon
spills, thereby preventing potentially catastrophic environmental damage from such
spills.
The Stormceptor System is an effective treatment measure for retrofit and other space-
constrained or infrastructure-constrained applications that preclude the use of other
approved treatment systems.
Ecology’s Recommendations: Based on the weight of the evidence and using its best
professional judgment, Ecology finds that:
The Stormceptor System, sized according to Table 1 (above) should provide, at a
minimum, equivalent performance to a presettling basin as defined in the most recent
Stormwater Management Manual for Western Washington, Volume V, Chapter 6.
Ecology should provide Imbrium Systems Corporation with the opportunity to demonstrate,
through additional laboratory and field testing, whether the Stormceptor System can attain
Ecology’s Basic (TSS) Treatment performance goal. Findings of Fact:
Imbrium Systems Corporation submitted laboratory data for its Stormceptor System STC-
900, testing silica material prepared to satisfy New Jersey Department of Environmental
Protection (NJDEP) standards (mean particle size 97 microns; range 1 to 1000 microns).
Weighted TSS removal rates averaged 75% across a range of operating rates (25% to 125%
of the design rate), with TSS influent concentrations (97 micron mean particle size)
averaging 295 mg/L. Unweighted TSS removal rates averaged 74%, and the removal rate at
285 gpm was 73%.
Imbrium Systems ran scour tests at 125% of the design flowrate with initial sediment loading
of 50% and 100% in the lower chamber of the unit. No scouring occurred at 50% loading
and minimal scouring occurred at 100% loading.
Imbrium System submitted several substantial field data sets. However, most data do not
represent flow-weighted composite samples for individual storms, which Ecology protocol
requires. The Madison site used flow-weighted composites, and TSS removal rates were in
the 20% to 30% range. The Madison site is a maintenance yard with dirt and salt piles and
Imbrium Systems believes the results do not represent typical system performance.
Owners can readily maintain the system using a vacuum truck.

5
There are approximately 15,000 Stormceptor systems in use nationwide and 510 in the
Pacific Northwest.
Technology Description:
You can download design manual and technical bulletins from company's web site. Recommended Research and Development:
Ecology encourages Imbrium Systems Corporation to pursue continuous improvements to the
Stormceptor System. To that end, Ecology recommends the following actions are:
No field-testing data are currently available to reliably ascertain the Stormceptor
System’s ability to remove the finer particles (typically represented by Sil-Co-Sil 106 in
laboratory testing) comprising TSS found on local highways, parking lots, and other
high-use areas. Design of future facilities should consider:
a. Provide sizing for specific applications based on actual particle size distribution in the
target runoff. Imbrium can use Ecology’s TAPE Guidance
(https://fortress.wa.gov/ecy/publications/summarypages/1110061.html) on the
expected particle size distributions for Basic Treatment.
b. Performing laboratory and field testing to evaluate whether the Stormceptor System
can reliably achieve Basic Treatment criteria.
Contact Information:
Applicant: Pete Van Tilburg
Stormceptor® Engineering, Sales, & Distribution
Pacific Stormwater Consulting
Phone: (503) 572-9894
Corky Lambert
Regional Sales Manager
Imbrium Systems
Phone: (503) 302-1186
Joel Garbon
Regulatory & Technical Specialist
Imbrium Systems
Phone: (503) 706-6193
Applicant website: www.stormceptor.com

6
Ecology web link: http://www.ecy.wa.gov/programs/wq/stormwater/new_tech/
Ecology Contact: Douglas C. Howie, P.E.
Department of Ecology
Water Quality Program
(360) 407-6444
Revision History
Date Revision
April 2006 Original Draft Pilot Use Level Designation document: for pretreatment
September 2007 Update to GULD
January 2013 Modified Design Storm Description, added Revision Table, reformatted
document, revised contact information

Stormceptor System Checklist
Frequency
Drainage System Feature Problem Conditions to Check For
Recommended Action
Date Inspected*
J F M A M J J A S O N D
M & S Settling chamber
Sediment accumulation
Sediment capacity reached (varies depending on the model, see attached table)
Sediment should be removed using vactor truck
M & S Settling Chamber
Trash and floatable debris accumulation
Excessive trash and floatable debris accumulation.
Remove trash or other floatable debris
M & S Settling chamber
Excessive oil accumulation
Oil exceeds 6” in depth or evidence of a spill Clean out Oil.
M Manhole Cover Cover Damaged/ Not working
Corrosion of deformation of cover. (One maintenance person cannot remove lid after applying 80 pounds of lift.)
Repair cover to proper working specifications or replaced.
M Disk Insert Disk insert inlet/ outlet obstructed
Inlet or outlet piping obstructed
Remove obstruction blocking inlet or outlet piping.
A Structure
Structure has cracks in wall, bottom, and damage to frame and/or top slab.
Cracks wider than ½ inch or evidence of soil particles entering the structure through the cracks, or maintenance/inspection personnel determine that the vault is not structurally sound.
Repair or replace vault to meet design specifications and is structurally sound.
A Structure Joints
Structure has cracks at the joint of any inlet/ outlet pipe.
Cracks wider than 0.5 inch at the joint of any inlet/outlet pipe or evidence of soil particles entering through the cracks
Repair vault so that no cracks exist wider than 0.25 inch at the joint of inlet/outlet pipe.

*Note dates when you performed maintenance and type of maintenance performed in notes section below. (M) Monthly from November through April. (A) Once in late summer (preferable September) (S) After any major storm (use 1-inch in 24 hours as a guideline). If you are unsure whether a problem exists, please contact a Professional Engineer or the manufacturer’s representative. Refer to Stormceptor Owner’s Manual for maintenance details. Notes:
Page | 1
November 2015
GENERAL USE LEVEL DESIGNATION FOR BASIC (TSS) AND
PHOSPHORUS TREATMENT
For
CONTECH Engineered Solutions
Stormwater Management StormFilter®
with PhosphoSorb® media
Ecology’s Decision:
1. Based on Contech Engineered Solutions application, Ecology hereby issues the
following use level designation for the Stormwater Management StormFilter® using
PhosphoSorb® media cartridges:
General Use Level Designation (GULD) for Basic Treatment (total suspended solids)
and for Phosphorus (total phosphorus) treatment.
o Sized at a hydraulic loading rate of no greater than 1.67 gallon per minute
(gpm) per square foot (sq ft.) of media surface, per Table 1.
o Using Contech’s PhosphoSorb media. Specifications for the media shall
match the specifications provided by the manufacturer and approved by
Ecology.
Table 1. StormFilter cartridge design flow rates
for 18-inch diameter cartridges with PhosphoSorb media operating at 1.67 gpm/sq ft.
Effective cartridge
height (in)
Cartridge flow rate
(gpm/cartridge)
12 8.35
18 12.53
27 18.79

Page | 2
2. Ecology approves StormFilter systems containing PhosphoSorb media for treatment at
the cartridge flow rate shown in Table 1, to achieve the maximum water quality design
flow rate. Calculate the water quality design flow rates using the following procedures:
Western Washington: For treatment installed upstream of detention or retention,
the water quality design flow rate is the peak 15-minute flow rate as calculated using
the latest version of the Western Washington Hydrology Model or other Ecology-
approved continuous runoff model.
Eastern Washington: For treatment installed upstream of detention or retention,
the water quality design flow rate is the peak 15-minute flow rate as calculated using
one of the three methods described in Chapter 2.2.5 of the Stormwater Management
Manual for Eastern Washington (SWMMEW) or local manual.
Entire State: For treatment installed downstream of detention, the water quality
design flow rate is the full 2-year release rate of the detention facility.
3. The GULD designation has no expiration date but it may be amended or revoked by
Ecology and is subject to the conditions specified below.
Ecology’s Conditions of Use:
StormFilter systems containing PhosphoSorb media shall comply with these conditions:
1. Design, assemble, install, operate, and maintain StormFilter systems containing
PhosphoSorb media in accordance with applicable Contech Engineered Solutions
manuals, documents, and the Ecology Decision.
2. Use sediment loading capacity, in conjunction with the water quality design flow rate,
to determine the target maintenance interval.
3. Owners shall install StormFilter systems in such a manner that bypass flows exceeding
the water quality treatment rate or flows through the system will not re-suspend
captured sediments.
4. Pretreatment of TSS and oil and grease may be necessary, and designers shall provide
pre-treatment in accordance with the most current versions of the CONTECH Product
Design Manual or the applicable Ecology Stormwater Manual. Design pre-treatment
using the performance criteria and pretreatment practices provided in the Stormwater
Management Manual for Western Washington (SWMMWW), the Stormwater
Management Manual for Eastern Washington (SWMMEW), or on Ecology’s
“Evaluation of Emerging Stormwater Treatment Technologies” website.
5. Maintenance: The required maintenance interval for stormwater treatment devices is
often dependent upon the degree of pollutant loading from a particular drainage basin.
Therefore, Ecology does not endorse or recommend a “one size fits all” maintenance
cycle for a particular model/size of manufactured filter treatment device.
Typically, CONTECH designs StormFilter systems for a target filter media
replacement interval of 12 months. Maintenance includes removing accumulated
sediment from the vault, and replacing spent cartridges with recharged
cartridges.

Page | 3
Indications of the need for maintenance include the effluent flow decreasing to
below the design flow rate, as indicated by the scumline above the shoulder of
the cartridge.
Owners/operators must inspect StormFilter with PhosphoSorb media for a
minimum of twelve months from the start of post-construction operation to
determine site-specific maintenance schedules and requirements. You must
conduct inspections monthly during the wet season, and every other month
during the dry season. (According to the SWMMWW, the wet season in western
Washington is October 1 to April 30. According to SWMMEW, the wet season in
eastern Washington is October 1 to June 30). After the first year of operation,
owners/operators must conduct inspections based on the findings during the first
year of inspections.
Conduct inspections by qualified personnel, follow manufacturer’s guidelines,
and use methods capable of determining either a decrease in treated effluent
flowrate and/or a decrease in pollutant removal ability.
When inspections are performed, the following findings typically serve as
maintenance triggers:
Accumulated vault sediment depths exceed an average of 2 inches, or
Accumulated sediment depths on the tops of the cartridges exceed an
average of 0.5 inches, or
Standing water remains in the vault between rain events, or
Bypass during storms smaller than the design storm.
Note: If excessive floatables (trash and debris) are present, perform a minor
maintenance consisting of gross solids removal, not cartridge replacement.
6. Discharges from the StormFilter systems containing PhosphoSorb media shall not cause
or contribute to water quality standards violations in receiving waters.
Applicant: CONTECH Engineered Solutions
Applicant’s Address: 11835 NE Glenn Widing Dr.
Portland, OR 97220

Page | 4
Application Documents:
The Stormwater Management StormFilter, PhosphoSorb at a Specific Flow Rate of 1.67
gpm/ft2, Conditional Use Level Designation Application. August 2012.
Quality Assurance Project Plan The Stormwater Management StormFilter®
PhosphoSorb® at a Specific Flow Rate of 1.67 gpm/ft2 Performance Evaluation. August
2012.
The Stormwater Management StormFilter® PhosphoSorb® at a Specific Flow Rate of
1.67 gpm/ft2, General Use Level Designation, Technical Evaluation Report. October
2015.
Applicant’s Use Level Request:
General use level designation as a basic (TSS) and phosphorus (total phosphorus)
treatment device in accordance with Table 2 of Ecology’s 2011 Technical Guidance
Manual for Evaluating Emerging Stormwater Treatment Technologies Technology
Assessment Protocol – Ecology (TAPE).
Applicant’s Performance Claims:
Based on results from laboratory and field-testing, the applicant claims:
The Stormwater Management StormFilter® with PhosphoSorb® media operating at 1.67
gpm/ft2 is able to remove 80% of Total Suspended Solids (TSS) for influent
concentrations greater than 100 mg/L, is able to remove greater than 80% TSS for
influent concentrations greater than 200 mg/L, and achieve a 20 mg/L effluent for
influent concentrations less than 100 mg/L.
The StormFilter with PhosphoSorb media is able to remove 50% or greater total
phosphorus for influent concentrations between 0.1 to 0.5 mg/L.
Recommendations:
Ecology finds that:
CONTECH Engineered Solutions has shown Ecology, through laboratory and field
testing, that the Stormwater Management StormFilter® with PhosphoSorb® media is
capable of attaining Ecology’s Basic and Total Phosphorus treatment goals.
Findings of Fact:
Laboratory testing
A Phosphosorb StormFilter cartridge test unit, operating at 28 L/min (equivalent to 1.0
gpm/ sq. ft.), and subject to SSC with a silt loam texture (25% sand, 65% silt, and 10%
clay by mass) originating from SCS 106 provides a mean SSC removal efficiency of
88%;
A Phosphosorb StormFilter cartridge test unit, operating at 56 L/min (equivalent to 2.0
gpm/sq. ft.), and subject to SSC with a silt loam texture (25% sand, 65% silt, and 10%
clay by mass) originating from SCS 106 provides a mean turbidity reduction of 82%;

Page | 5
Laboratory testing of PhosphoSorb media in a Horizontal Flow Column (HFC; a 1/24th
scale of a full cartridge) resulted in 50 percent dissolved phosphorus removal for the first
1,000 bed volumes. Granular activated carbon (GAC) tested under the same conditions
resulted in 30 percent removal of dissolved phosphorus.
Field testing
Contech conducted monitoring of a StormFilter® with PhosphoSorb® media at a site
along Lolo Pass Road in Zigzag, Oregon between February 2012 and February 2015. The
manufacturer collected flow-weighted influent and effluent composite samples during 17
separate storm events. The system treated approximately 96 percent of the flows recorded
during the monitoring period. The applicant sized the system at 1.67 gpm/sq. ft.
o Influent TSS concentrations for qualifying sampled storm events ranged from 40
to 780 mg/L. For influent concentrations less than 100 mg/L (n=2) the effluent
concentration was less than 10 mg/L. For influent concentrations greater than 100
mg/L the bootstrap estimate of the lower 95 percent confidence limit (LCL95) of
the mean TSS reduction was 85%.
Total phosphorus removal for 16 events with influent TP concentrations in the
range of 0.1 to 0.5 mg/L averaged 75 percent. A bootstrap estimate of the lower
95 percent confidence limit (LCL95) of the mean total phosphorus reduction was
67 percent.
Other StormFilter system with PhosphoSorb media items the Company should address:
1. Conduct testing to obtain information about maintenance requirements in order to come up
with a maintenance cycle.
2. Conduct loading tests on the filter to determine maximum treatment life of the system.
Technology Description: Download at: http://www.conteches.com/Products/Stormwater-
Management/Treatment/Stormwater-Management-StormFilter®.aspx
Contact Information:
Applicant: Sean Darcy
Contech Engineered Solutions
11815 NE Glenn Widing Drive
Portland, OR, 97220
503-258-3105
Applicant website: www.conteches.com

Page | 6
Ecology web link: http://www.ecy.wa.gov/programs/wq/stormwater/newtech/index.html
Ecology: Douglas C. Howie, P.E.
Department of Ecology
Water Quality Program
(360) 407-6444
Revision History
Date Revision
December 2012 Original use-level-designation document: CULD for basic and
phosphorus treatment.
January 2013 Revised document to match standard formatting
August 2014 Revised TER and expiration dates
November 2015 Approved GULD designation for Basic and Phosphorus treatment

CONTECH - StormFilter® GULD Maintenance Update (November 2012) P a g e | 1
September 2014
GENERAL USE LEVEL DESIGNATION FOR BASIC (TSS) TREATMENT
For
CONTECH Engineered Solutions
Stormwater Management StormFilter®
With ZPG Media at 1 gpm/sq ft media surface area
Ecology’s Decision:
Based on the CONTECH Engineered Solutions’ (CONTECH) application
submissions, Ecology hereby issues a General Use Level Designation (GULD) for the
Stormwater Management StormFilter® (StormFilter):
1. As a basic stormwater treatment practice for total suspended solids (TSS)
removal,
Using ZPG™ media (zeolite/perlite/granular activated carbon), with the size
distribution described below,
Sized at a hydraulic loading rate of 1 gpm/ft2 of media surface area, per
Table 1, and
Internal bypassing needs to be consistent with the design guidelines in
CONTECH’s current product design manual.
Table 1. StormFilter Design Flow Rates per Cartridge
2. Ecology approves StormFilter systems containing ZPG™ media for treatment at
the hydraulic loading rates shown in Table 1, to achieve the maximum water
quality design flow rate. The water quality design flow rates are calculated using
the following procedures:
Western Washington: For treatment installed upstream of detention or
retention, the water quality design flow rate is the peak 15-minute flow rate
as calculated using the latest version of the Western Washington Hydrology
Model or other Ecology-approved continuous runoff model.
Effective Cartridge Height (inches) 12 18 27
Cartridge Flow Rate (gpm/cartridge) 5 7.5 11.3

CONTECH - StormFilter® GULD Maintenance Update (November 2012) P a g e | 2
Eastern Washington: For treatment installed upstream of detention or
retention, the water quality design flow rate is the peak 15-minute flow rate
as calculated using one of the three methods described in Chapter 2.2.5 of the
Stormwater Management Manual for Eastern Washington (SWMMEW) or
local manual.
Entire State: For treatment installed downstream of detention, the water
quality design flow rate is the full 2-year release rate of the detention facility.
3. This designation has no expiration date, but Ecology may amend or revoke it.
Ecology’s Conditions of Use:
The StormFilter with ZPG media shall comply with the following conditions:
1. Design, install, operate, and maintain the StormFilter with ZPG media in
accordance with applicable Contech Engineered Solutions manuals,
documents, and the Ecology Decision.
2. Install StormFilter systems to bypass flows exceeding the water quality
treatment rate. Additionally, high flows will not re-suspend captured
sediments. Design StormFilter systems in accordance with the performance
goals in Ecology's most recent Stormwater Manual and CONTECH’s
Product Design Manual Version 4.1 (April 2006), or most current version,
unless otherwise specified.
3. Owners must follow the design, pretreatment, land use application, and
maintenance criteria in CONTECH’s Design Manual.
4. Pretreatment of TSS and oil and grease may be necessary, and designers
shall provide pre-treatment in accordance with the most current versions of
the CONTECH’s Product Design Manual (April 2006) or the applicable
Ecology Stormwater Manual. Design pre-treatment using the performance
criteria and pretreatment practices provided on Ecology’s “Evaluation of
Emerging Stormwater Treatment Technologies” website.
5. Maintenance: The required maintenance interval for stormwater treatment
devices is often dependent upon the degree of pollutant loading from a
particular drainage basin. Therefore, Ecology does not endorse or
recommend a “one size fits all” maintenance cycle for a particular model/size
of manufactured filter treatment device.
Typically, CONTECH designs StormFilter systems for a target filter
media replacement interval of 12 months. Maintenance includes
removing accumulated sediment from the vault, and replacing spent
cartridges with recharged cartridges.

CONTECH - StormFilter® GULD Maintenance Update (November 2012) P a g e | 3
Indications of the need for maintenance include effluent flow decreasing
to below the design flow rate, as indicated by the scumline above the
shoulder of the cartridge.
Owners/operators must inspect StormFilter with ZPG media for a
minimum of twelve months from the start of post-construction operation
to determine site-specific maintenance schedules and requirements. You
must conduct inspections monthly during the wet season, and every other
month during the dry season. (According to the SWMMWW, the wet
season in western Washington is October 1 to April 30. According to
SWMMEW, the wet season in eastern Washington is October 1 to June
30). After the first year of operation, owners/operators must conduct
inspections based on the findings during the first year of inspections.
Conduct inspections by qualified personnel, follow manufacturer’s
guidelines, and use methods capable of determining either a decrease in
treated effluent flowrate and/or a decrease in pollutant removal ability.
When inspections are performed, the following findings typically serve as
maintenance triggers:
Accumulated vault sediment depths exceed an average of 2 inches, or
Accumulated sediment depths on the tops of the cartridges exceed an
average of 0.5 inches, or
Standing water remains in the vault between rain events, or
Bypass occurs during storms smaller than the design storm.
Note: If excessive floatables (trash and debris) are present, perform a
minor maintenance consisting of gross solids removal, not cartridge
replacement.
6. CONTECH shall maintain readily available reports listed under
“Application Documents” (above) as public, as well as the documentation
submitted with its previous conditional use designation application.
CONTECH shall provide links to this information from its corporate
website, and make this information available upon request, at no cost and in
a timely manner.
7. ZPG™ media used shall conform with the following specifications:
Each cartridge contains a total of approximately 2.6 cubic feet of media.
The ZPG™ cartridge consists of an outer layer of perlite that is
approximately 1.3 cubic feet in volume and an inner layer, consisting of a
mixture of 90% zeolite and 10% granular activated carbon, which is
approximately 1.3 cubic feet in volume.
Perlite Media: Perlite media shall be made of natural siliceous volcanic
rock free of any debris or foreign matter. The expanded perlite shall

CONTECH - StormFilter® GULD Maintenance Update (November 2012) P a g e | 4
have a bulk density ranging from 6.5 to 8.5 lbs per cubic foot and particle
sizes ranging from 0.09” (#8 mesh) to 0.38” (3/8” mesh).
Zeolite Media: Zeolite media shall be made of naturally occurring
clinoptilolite. The zeolite media shall have a bulk density ranging from
44 to 50 lbs per cubic foot and particle sizes ranging from 0.13” (#6 mesh)
to 0.19” (#4 mesh). Additionally, the cation exchange capacity (CEC) of
zeolite shall range from approximately 1.0 to 2.2 meq/g.
Granular Activated Carbon: Granular activated carbon (GAC) shall be
made of lignite coal that has been steam-activated. The GAC media shall
have a bulk density ranging from 28 to 31 lbs per cubic foot and particle
sizes ranging from a 0.09” (#8 mesh) to 0.19” (#4 mesh).
Approved Alternate Configurations
Peak Diversion StormFilter
1. The Peak Diversion StormFilter allows for off-line bypass within the StormFilter
structure. Design capture flows and peak flows enter the inlet bay which contains an
internal weir. The internal weir allows design flows to enter the cartridge bay through
a transfer hole located at the bottom of the inlet bay while the unit routs higher flows
around the cartridge bay.
2. To select the size of the Peak Diversion StormFilter unit, the designer must determine
the number of cartridges required and size of the standard StormFilter using the site-
specific water quality design flow and the StormFilter Design Flow Rates per
Cartridge as described above.
3. New owners may not install the Peak Diversion StormFilter at an elevation or in a
location where backwatering may occur.
Applicant: Contech Engineered Solutions
Applicant’s Address: 11835 NE Glenn Widing Dr.
Portland, OR 97220
Application Documents:
The applicant’s master report, titled, “The Stormwater Management StormFilter
Basic Treatment Application for General Use Level Designation in Washington”,
Stormwater Management, Inc., November 1, 2004, includes the following reports:
(Public) Evaluation of the Stormwater Management StormFilter Treatment
System: Data Validation Report and Summary of the Technical Evaluation
Engineering Report (TEER) by Stormwater Management Inc., October 29, 2004
Ecology’s technology assessment protocol requires the applicant to hire an
independent consultant to complete the following work:

CONTECH - StormFilter® GULD Maintenance Update (November 2012) P a g e | 5
1. Complete the data validation report.
2. Prepare a TEER summary, including a testing summary and conclusions
compared with the supplier’s performance claims.
3. Provide a recommendation of the appropriate technology use level.
4. Work with Ecology to post recommend relevant information on Ecology’s
website.
5. Provide additional testing recommendations, if needed.”
6. This report, authored by Dr. Gary Minton, Ph. D., P.E., Resource Planning
Associates, satisfies the Ecology requirement.
(Public) “Performance of the Stormwater Management StormFilter Relative to the
Washington State Department of Ecology Performance Goals for Basic
Treatment,” is a summary of StormFilter performance that strictly adheres to the
criteria listed in the Guidance for Evaluating Emerging Stormwater Treatment
Technologies, Technology Assessment Protocol – Ecology (TAPE).
“Heritage Marketplace Field Evaluation: Stormwater Management StormFilter
with ZPG™ Media,” is a report showing all of the information collected at Site A
as stated in the SMI Quality Assurance Project Plan (QAPP). This document
contains detailed information regarding each storm event collected at this site, and
it provided a detailed overview of the data and project.
“Lake Stevens Field Evaluation: Stormwater Management StormFilter with
ZPG™ Media,” is a report that corresponds to Site E as stated in the SMI QAPP.
This document contains detailed information regarding each storm collected at
this site, and includes a detailed overview of the data and project.
(Public) “Evaluation of the Stormwater Management StormFilter for the removal
of SIL-CO-SIL 106, a standardized silica product: ZPG™ at 7.5 GPM” is a report
that describes laboratory testing at full design flow.
“Factors Other Than Treatment Performance.”
“State of Washington Installations.”
“Peak Diversion StormFilter” is a technical document demonstrating the Peak
Diversion StormFilter system complies with the Stormwater Management Manual
for Western Washington Volume V Section 4.5.1.
Above-listed documents noted as “public” are available by contacting CONTECH.
Applicant's Use Level Request:
That Ecology grant a General Use Level Designation for Basic Treatment for the
StormFilter using ZPG™ media (zeolite/perlite/granular activated carbon) at a hydraulic
loading rate of 1 gpm/ft2 of media surface area in accordance with Ecology's 2011
Technical Guidance Manual for Evaluating Emerging Stormwater Treatment
Technologies Technology Assessment Protocol – Ecology (TAPE).
CONTECH - StormFilter® GULD Maintenance Update (November 2012) P a g e | 6
Applicant's Performance Claim:
The combined data from the two field sites reported in the TER (Heritage Marketplace
and Lake Stevens) indicate that the performance of a StormFilter system configured for
inline bypass with ZPG™ media and a hydraulic loading rate of 1 gpm/ft2 of media
surface area meets Ecology performance goals for Basic Treatment.
Ecology’s Recommendations:
Based on the weight of the evidence and using its best professional judgment, Ecology
finds that:
StormFilter, using ZPG™ media and operating at a hydraulic loading rate of no more
than 1 gpm/ft2 of media surface area, is expected to provide effective stormwater
treatment achieving Ecology’s Basic Treatment (TSS removal) performance goals.
Contech demonstrated this is through field and laboratory testing performed in
accordance with the approved protocol. StormFilter is deemed satisfactory with
respect to factors other than treatment performance (e.g., maintenance; see the
protocol’s Appendix B for complete list).
Findings of Fact:
Influent TSS concentrations and particle size distributions were generally within the
range of what Ecology considers “typical” for western Washington (silt-to-silt loam).
Contech sampled thirty-two (32) storm events at two sites for storms from April 2003
to March 2004, of which Contech deemed twenty-two (22) as “qualified” and were
therefore included in the data analysis set.
Statistical analysis of these 22 storm events verifies the data set’s adequacy.
Analyzing all 22 qualifying events, the average influent and effluent concentrations
and aggregate pollutant load reduction are 114 mg/L, 25 mg/L, and 82%,
respectively.
Analyzing all 22 qualifying events based on the estimated average flow rate during
the event (versus the measured peak flow rate), and more heavily weighting those
events near the design rate (versus events either far above or well below the design
rate) does not significantly affect the reported results.
For the 7 qualifying events with influent TSS concentrations greater than 100 mg/L,
the average influent and effluent concentrations and aggregate pollutant load
reduction are 241 mg/L, 34 mg/L, and 89%, respectively. If we exclude the 2 of 7
events that exceed the maximum 300 mg/L specified in Ecology’s guidelines, the
average influent and effluent concentrations and aggregate pollutant load reduction
are 158 mg/L, 35 mg/L, and 78%, respectively.
For the 15 qualifying events with influent TSS concentrations less than 100 mg/L, the
average influent and effluent concentrations and aggregate pollutant load reduction
are 55 mg/L, 20 mg/L, and 61%, respectively. If the 6 of 15 events that fall below the
minimum 33 mg/L TSS specified in Ecology’s guidelines are excluded, the average

CONTECH - StormFilter® GULD Maintenance Update (November 2012) P a g e | 7
influent and effluent concentrations and aggregate pollutant load reduction are 78
mg/L, 26 mg/L, and 67%, respectively.
For the 8 qualifying events with peak discharge exceeding design flow (ranging from
120 to 257% of the design rate), results ranged from 52% to 96% TSS removal, with
an average of 72%.
Due to the characteristics of the hydrographs, the field results generally reflect flows
below (ranging between 20 and 60 percent of) the tested facilities’ design rate.
During these sub-design flow rate periods, some of the cartridges operate at or near
their individual full design flow rate (generally between 4 and 7.5 GPM for an 18”
cartridge effective height) because their float valves have opened. Float valves
remain closed on the remaining cartridges, which operate at their base “trickle” rate
of 1 to 1.5 GPM.
Laboratory testing using U.S. Silica’s Sil-Co-Sil 106 fine silica product showed an
average 87% TSS removal for testing at 7.5 GPM per cartridge (100% design flow
rate).
Other relevant testing at I-5 Lake Union, Greenville Yards (New Jersey), and Ski Run
Marina (Lake Tahoe) facilities shows consistent TSS removals in the 75 to 85%
range. Note that the evaluators operated the I-5 Lake Union at 50%, 100%, and
125% of design flow.
SMI’s application included a satisfactory “Factors other than treatment performance”
discussion.
Note: Ecology’s 80% TSS removal goal applies to 100 mg/l and greater influent TSS.
Below 100 mg/L influent TSS, the goal is 20 mg/L effluent TSS.
Technology Description:
The Stormwater Management StormFilter® (StormFilter), a flow-through stormwater
filtration system, improves the quality of stormwater runoff from the urban environment
by removing pollutants. The StormFilter can treat runoff from a wide variety of sites
including, but not limited to: retail and commercial development, residential streets,
urban roadways, freeways, and industrial sites such as shipyards, foundries, etc.
Operation:
The StormFilter is typically comprised of a vault that houses rechargeable, media-filled,
filter cartridges. Various media may be used, but this designation covers only the zeolite-
perlite-granulated activated carbon (ZPG™) medium. Stormwater from storm drains
percolates through these media-filled cartridges, which trap particulates and may remove
pollutants such as dissolved metals, nutrients, and hydrocarbons. During the filtering
process, the StormFilter system also removes surface scum and floating oil and grease.
Once filtered through the media, the treated stormwater is directed to a collection pipe or
discharged to an open channel drainage way.
This document includes a bypass schematic for flow rates exceeding the water quality
design flow rate on page 8.

CONTECH - StormFilter® GULD Maintenance Update (November 2012) P a g e | 8
StormFilter Configurations:
Contech offers the StormFilter in multiple configurations: precast, high flow, catch basin,
curb inlet, linear, volume, corrugated metal pipe, drywell, and CON/Span form. Most
configurations use pre-manufactured units to ease the design and installation process.
Systems may be either uncovered or covered underground units.
The typical precast StormFilter unit is composed of three sections: the energy dissipater,
the filtration bay, and the outlet sump. As Stormwater enters the inlet of the StormFilter
vault through the inlet pipe, piping directs stormwater through the energy dissipater into
the filtration bay where treatment will take place. Once in the filtration bay, the
stormwater ponds and percolates horizontally through the media contained in the
StormFilter cartridges. After passing through the media, the treated water in each
cartridge collects in the cartridge’s center tube from where piping directs it into the outlet
sump by a High Flow Conduit under-drain manifold. The treated water in the outlet
sump discharges through the single outlet pipe to a collection pipe or to an open channel
drainage way. In some applications where you anticipate heavy grit loads, pretreatment
by settling may be necessary.

CONTECH - StormFilter® GULD Maintenance Update (November 2012) P a g e | 9
Figure 1. Stormwater Management StormFilter Configuration with Bypass
CONTECH - StormFilter® GULD Maintenance Update (November 2012) P a g e | 10
Figure 2. The StormFilter Cartridge
Cartridge Operation:
As the water level in the filtration bay begins to rise, stormwater enters the StormFilter
cartridge. Stormwater in the cartridge percolates horizontally through the filter media
and passes into the cartridge’s center tube, where the float in the cartridge is in a closed
(downward) position. As the water level in the filtration bay continues to rise, more
water passes through the filter media and into the cartridge’s center tube. Water
displaces the air in the cartridge and it purges from beneath the filter hood through the
one-way check valve located in the cap. Once water fills the center tube there is enough
buoyant force on the float to open the float valve and allow the treated water to flow into
the under-drain manifold. As the treated water drains, it tries to pull in air behind it. This
causes the check valve to close, initiating a siphon that draws polluted water throughout
the full surface area and volume of the filter. Thus, water filters through the entire filter
cartridge throughout the duration of the storm, regardless of the water surface elevation in
the filtration bay. This continues until the water surface elevation drops to the elevation
of the scrubbing regulators. At this point, the siphon begins to break and air quickly
flows beneath the hood through the scrubbing regulators, causing energetic bubbling
between the inner surface of the hood and the outer surface of the filter. This bubbling
agitates and cleans the surface of the filter, releasing accumulated sediments on the
surface, flushing them from beneath the hood, and allowing them to settle to the vault
floor.
Adjustable cartridge flow rate:
Inherent to the design of the StormFilter is the ability to control the individual cartridge
flow rate with an orifice-control disc placed at the base of the cartridge. Depending on
the treatment requirements and on the pollutant characteristics of the influent stream as
CONTECH - StormFilter® GULD Maintenance Update (November 2012) P a g e | 11
specified in the CONTECH Product Design Manual, operators may adjust the flow rate
through the filter cartridges. By decreasing the flow rate through the filter cartridges, the
influent contact time with the media is increased and the water velocity through the
system is decreased, thus increasing both the level of treatment and the solids removal
efficiencies of the filters, respectively (de Ridder, 2002).
Recommended research and development:
Ecology encourages CONTECH to pursue continuous improvements to the StormFilter.
To that end, CONTECH recommends the following actions:
Determine, through laboratory testing, the relationship between accumulated solids
and flow rate through the cartridge containing the ZPG™ media. Completed 11/05.
Determine the system’s capabilities to meet Ecology’s enhanced, phosphorus, and oil
treatment goals.
Develop easy-to-implement methods of determining that a StormFilter facility
requires maintenance (cleaning and filter replacement).
Contact Information:
Applicant Contact: Sean Darcy
Contech Engineered Solutions
11835 NE Glenn Widing Drive
Portland, OR, 97220
503-258-3105
Applicant Web link http://www.conteches.com/
Ecology web link: http://www.ecy.wa.gov/programs/wq/stormwater/newtech/index.html
Ecology Contact: Douglas C. Howie, P.E.
Department of Ecology
Water Quality Program
(360) 407-6444
Revision History
Date Revision
Jan 2005 Original Use Level Designation
Dec 2007 Revision
May 2012 Maintenance requirements updated
November 2012 Design Storm and Maintenance requirements updated
January 2013 Updated format to match Ecology standard format
September 2014 Added Peak Diversion StormFilter Alternate Configuration

Note: Some pages in this document have been purposely skipped or blank pages inserted so that this document will copy correctly when duplexed.

January 2013
GENERAL USE LEVEL DESIGNATION FOR PRETREATMENT (TSS)
For
Contech Engineered Solutions Inc. Vortechs® System
Ecology’s Decision:
Based on the CONTECH Engineered Solutions Inc. (CONTECH) application submissions
for the Vortechs® System, Ecology hereby issues the following use designations for the
Vortechs technology:
1. General Use Level Designation (GULD) for pretreatment use, as defined in the
Ecology’s 2011 Technical Guidance Manual for Evaluating Emerging Stormwater
Treatment Technologies Technology Assessment Protocol – Ecology (TAPE) Table 2, (a)
ahead of infiltration treatment, or (b) to protect and extend the maintenance cycle of a
Basic, Enhanced, or Phosphorus Treatment device.
2. This GULD applies to Vortechs units sized at an operating rate of no more than 35
gpm/sf of grit chamber area at the Water Quality design flow rate. The following table
shows flow rates associated with various grit chamber sizes:
Washington State Vortechs System Sizing
Vortechs
System
Grit Chamber
Diameter
35 gpm/ft2 Flow
Rate
Model ID ft cfs
1000 3 0.55
2000 4 1.0
3000 5 1.5
4000 6 2.2
5000 7 3.0
7000 8 3.9
9000 9 5.0
11000 10 6.1
16000 12 8.8

3. Ecology approves Vortechs units for treatment at the hydraulic loading rates shown in
the above Table, and sized based on the water quality design flow rate. Calculate the
water quality design flow rate using the following procedures:
Western Washington: For treatment installed upstream of detention or retention,
the water quality design flow rate is the peak 15-minute flow rate as calculated using
the latest version of the Western Washington Hydrology Model or other Ecology-
approved continuous runoff model.
Eastern Washington: For treatment installed upstream of detention or retention,
the water quality design flow rate is the peak 15-minute flow rate as calculated using
one of the three methods described in Chapter 2.2.5 of the Stormwater Management
Manual for Eastern Washington (SWMMEW) or local manual.
Entire State: For treatment installed downstream of detention, the water quality
design flow rate is the full 2-year release rate of the detention facility.
4. Properly designed and operated Vortechs systems may also have applicability in other
situations (example: low-head situations such as bridges or ferry docks), for TSS and
oil/grease removal where, on a case-by-case basis, it is found to be infeasible or
impracticable to use any other approved practice. Local jurisdictions should follow
established variance or exception procedures in approving such applications.
5. Ecology finds that the Vortechs, sized at an operating rate of 35 GPM/sf, could also
provide:
Water quality benefits in retrofit situations.
Provide the first component in a treatment train.
Provide effective removal of deicing grit/sand.
Vortechs units are applicable for low head situations and/or utility conflicts where
the designer finds other approved practices o to be infeasible or impractical to use.
Ecology’s Conditions of Use:
Vortechs systems shall comply with these conditions:
1. Design, assemble, install, operate, and maintain Vortechs Systems in accordance with
applicable CONTECH Product Design Manual Version 4.1 (April 2006) or most current
versions, and the Ecology Decision.
2. Discharges from the Vortechs System shall not cause or contribute to water quality
standards violations in receiving waters.

Applicant: CONTECH Engineered Solutions LLC,
Applicant’s Address: 11835 NE Glen Widing Drive
Portland, OR 97220
Application Documents:
Vortechs System Conditional Use Approval Application Letter to the Washington State
Department of Ecology (June 25, 2003)
Vortechs Stormwater Treatment System Technology Report, June 2003 Technical
Appendices 1 through 16
Applicant’s Use Level Request:
Conditional Use Designation as a Basic Treatment device in accordance with Ecology’s
2001 stormwater manual.
Applicant’s Performance Claims:
Based on laboratory trials, the Vortechs System will achieve an 80% TSS removal
efficiency for sediment particles ranging from 38 to 75 microns at an operating rate of 13
gallons per minute per square foot (GPM/sf) at the peak flow for the Ecology water quality
design storm.
The system is recommended only for sites likely to produce relatively high TSS
concentrations (above 100 mg/L), where TSS is primarily composed of 50 microns and
larger particles. Potentially appropriate sites include parking lots, highways and urban
streets, material transfer sites, hydrocarbon transfer sites, retrofits, steep/erosive sites, and
space-limited sites.
Ecology’s Recommendation:
Ecology finds that:
The Vortechs system, sized at 35 GPM/sf, should provide, at a minimum, equivalent
performance to a presettling basin as defined in the most recent Stormwater Management
Manual for Western Washington), Volume V, Chapter 6.
Findings of Fact:
1. Contech completed laboratory testing for sieved sand using a Vortechs Model 2000.
Laboratory results for the “50 micron” particle range (included particles ranging from 38 to
75 microns) showed 80% removal at 13 GPM/sf operating rate.

2. Contech completed abbreviated laboratory testing for Sil-Co-Sil 106, a ground silica product
with a mean particle size of about 20 microns. Removal rates at 5 to 10 GPM/sf were around
40%.
3. Various independent parties in the eastern and northeastern United States (Lake George, NY;
South Windsor, CT; Yarmouth, ME; Harding Township, NJ; Lexington, MA; Burlington,
VT; and Charlottesville, VA completed field studies. Contech provides study details in the
technical appendices. These studies generally show above 80% TSS removal rates.
However, the results from a particle size distribution analysis on sediment captured in the
Lake George Vortechs System indicate that mainly coarse particles were present. Because
the influent particle size distribution was not measured removal efficiency of specific particle
sizes could not be determined.
4. Independent parties in the Pacific Northwest (WSDOT SR-405; Buffalo Slough/City of
Portland; Unified Sewerage Agency, Oregon) completed three field studies. Study details
were not included in CONTECH submissions. These studies generally show TSS removal
rates to support a 40% pretreatment rating by Ecology for systems in the PNW, where soils
range from silt to silt-loam.
5. Use of a vacuum truck can easily maintain this system.
6. There are over 4,400 and 100 Vortechs systems installed nationwide and in the Pacific
Northwest, respectively.
Technology Description:
Download at:
http://www.conteches.com/Products/Stormwater-management/Treatment/Vortechs.aspx
Contact Information:
Applicant Contact: Sean Darcy
Applicant website: www.conteches.com
Ecology web link: http://www.ecy.wa.gov/programs/wq/stormwater/newtech/index.html
Ecology: Douglas C. Howie, P.E.
Department of Ecology
Water Quality Program
(360) 407-6444
Revision History
Date Revision
November 2003 Original Draft use-level-designation document: GULD for pretreatment.
August 2007 Revised contact information
January 2013 Modified Design Storm Description, added Revision Table

CITY OF RENTON SURFACE WATER DESIGN MANUAL
2017 City of Renton Surface Water Design Manual 12/12/2016 Ref 14-B-1
REFERENCE 14-B
CITY OF RENTON APPROVED PROPRIETARY FACILITIES FOR USE IN PUBLIC PROJECTS The proprietary facilities summarized in Table 14.B are approved by the City for use in public projects. The General Use Level Designation (GULD) letters for each of the approved facilities listed in Table 14.B are included in Reference Section 14-A. These GULD letters outline the sizing requirements and maintenance requirements for each approved proprietary facility. Appendix A also includes more detailed maintenance information for the proprietary facilities listed in Table 14.B.
TABLE 14.B PROPRIETARY FACILITIES AND APPLICABILITY
Proprietary Facility Name Basic WQ Enhanced Basic WQ
Lake Protection High-Use Pretreatment
BayFilter X
Filterra System X X X X
StormFilter using ZPG Media X
FloGard Perk Filter X X

REFERENCE 14: SUPPLEMENTAL APPROVED FACILITIES
12/12/2016 2017 City of Renton Surface Water Design Manual Ref 14-B-2
( T h i s p a g e i n t e n t i o n a l l y l e f t b l a n k . )

2017 City of Renton Surface Water Design Manual 12/12/2016
CITY OF RENTON
SURFACE WATER DESIGN MANUAL
REFERENCE 15
REFERENCE MAPS 15-A FLOW CONTROL APPLICATION MAP
15-B GROUNDWATER PROTECTION AREAS
15-C SOIL SURVEY

REFERENCE 15: REFERENCE MAPS
12/12/2016 2017 City of Renton Surface Water Design Manual
( T h i s p a g e i n t e n t i o n a l l y l e f t b l a n k . )

LakeDesire
ShadyLake (Mud
Lake)
PantherLake Lake
Youngs
LakeWashington
Bl ac k R i ver
G
r eenRiver C edar R i v er
UV900
UV167
UV515
UV169
UV900
UV169
UV167
BN
Inc
BN
Inc
BBNN
IInncc
SSEE RReennttoonn IIssssaaqquuaahh RRdd
RReenn ttoonn MMaappllee VVaalllleeyy RRdd
MMaappll ee VVaall lleeyy HHwwyy
1 10 08 8t t
h hA A
v ve eS S
E E
SSWW SSuunnsseett BBllvvdd
RRaa ii nn ii ee rr AAvv ee
NN
NE 3rd StNE 3rd St
SW 43rd StSW 43rd StSSEE CCaarrrr RR
dd
NE 4th StNE 4th St
SSEE RReennttoonn MMaappllee VVaalllleeyy RRdd
LLooggaa
nnAA
v veeNN
SR 515
SR 515
P Pa ar r
k kA A
v ve eN N
O Oa ak k
e es sd da a
l le eA A
v ve eS S
W W
SSuunnss
eettBBll
vvdd
NNEE
DDu uv v
a al ll lA A
v ve eN N
E E
I-405 FWYI-405 FWY
I I- -440055
FFWW
YY
SR 1
67SR
167
11 4400tthh WWaayy SSEE
NN EE 2277tthh SStt
1 15 56 6t t
h hA A
v ve eS S
E E
U Un ni i
o on nA A
v ve eN N
E E
1 11 16 6t t
h hA A
v ve eS S
E E
SW 7th StSW 7th St
N 8th StN 8th St
PPuuggeett
DDrr SSEE
RReenn tt oo nn AAvvee SS
SSWW 2277tthh SStt
BBee nn ss oo nn
RRdd
SS
W Wi il ll l
i ia am m
s sA A
v ve eS S
M Mo on n
r ro oe e
A Av ve e
N NE E
SE 128th StSE 128th St
II nn tt ee rr uu rr bb aa nnAA vvee SS
H Ho oq q
u ui ia am m
A Av ve e
N NE E
8 84 4t th h
A Av ve e
S SSS EE
PP ee tt rr oo vv ii tt ss kk yyRR
dd
EEVVaa
lllleeyy
HHwwyy
SE 192nd StSE 192nd St
SE 60th StSE 60th St
TTaal lbb
o ot tR R
ddSS
RReenn ttoo nnAA vvee
SS
1 16 64 4t t
h hA A
v ve eS S
E E
SE 208th StSE 208th St
SE 72nd StSE 72nd St
RRaaiinn iieerr AAvvee SS
1 11 16 6t t
h hA A
v ve eS S
E E
S 128th StS 128th St
NNeewwccaassttllee WWaayy
SS 221122tthh SStt
SS 118800tthh SStt
CCoo aa ll CC
rr ee ee kkPP kk ww
yySSEE
SW 41st StSW 41st St
114 40 0t t
h hA A
v ve eS S
E E
1 12 28 8t t
h hA A
v ve eS S
E E
6 68 8t th h
A Av ve e
S S
SSEE 116688tthh SStt
NE 12th StNE 12th St
BBee aa cc oonn AAvvee SS
FFoorreesstt DDrr SSEE
SSEE 116644tthh SStt
1 14 48 8t t
h hA A
v ve eS S
E E
SSEE MMaayy VVaalllleeyy RRdd
SSEE JJoonneess RRdd
SSEE 220044tthh WW
aayy
SW 34th StSW 34th St
SE 144th StSE 144th St
1 14 48 8t t
h hA A
v ve eS S
E E
115544tt
hhPPll SS
EE
LLaakkeeWW
aass hh ii nn gg tt oo nnBB ll vv dd
NN
E Ed dm m
o on nd ds s
A Av ve e
N NE E
A Ab be e
r rd de ee e
n nA A
v ve eN N
E E
EE
MMeerrccee
rrWW
aay y
W Weess
tt VVaal ll le e
y yH H
w wy y
East
Val
ley
Rd
East
Val
ley
Rd
,§-405
,§-405
,§-405
µ 0 1 2Miles
Flow Control Application Map
Reference 15-A
Date: 01/09/2014
Flow Control StandardsPeak Rate Flow Control Standard (Existing Site Conditions)
Flow Control Duration Standard (Existing Site Conditions)
Flow Control Duration Standard (Forested Conditions)
Flood Problem Flow
Unincorporated King County Flow Control Standards
Renton City Limits
Potential Annexation Area

(This page intentionally left blank.)

!!!
!
!
!!! !!
!
!
!!
!
!
!!!
!!
PW-12PW-11PW-17
PW-4
PW-9
PW-8RW-3
RW-2
EW-3
PW-5A
PW-12
PW-10
,§-405
,§-405
115544tt
hhPPll
SSEE
SW 34th StSW 34th St East
Val
ley
Rd
East
Val
ley
Rd
1 14 48 8t t
h hA A
v ve eS S
E E
140t
h Av
e SE
140t
h Av
e SE
164t
h Av
e SE
164t
h Av
e SE
Talbot Rd S
Talbot Rd S
N 30th StN 30th St
68th
Ave
S68
th A
ve S
Rainier Ave S
Rainier Ave S
SE 192nd StSE 192nd St
SE May Valley Rd
SE May Valley Rd
E Va
lley H
wy
E Va
lley H
wy SE Petrovitsky Rd
SE Petrovitsky Rd
Forest Dr SEForest Dr SE
S 128th StS 128th St
112t
h Av
e S
E11
2th
Ave
SE
84th
Ave
S84
th A
ve S
SE 168th StSE 168th St
S 55th StS 55th St
N 10th StN 10th St
NE 2nd StNE 2nd St
SW 41st StSW 41st St
116t
h Av
e S
E11
6th
Ave
SE
140t
h Av
e SE
140t
h Av
e SE
SE 192nd StSE 192nd St
148t
h Av
e SE
148t
h Av
e SE
114400tthhAAvvee SSEE
SW 27th StSW 27th St
Benson Rd S
Benson Rd S
Houser W
ay N
Houser W
ay N
Lind
Ave
SW
Lind
Ave
SW
N 8th StN 8th St
PPuuggee tt DDrr SSEE
RReennttoonn AA vvee SS
SW 7th StSW 7th St
I-405
FW
YI-4
05 F
WY
Rainier Ave N
Rainier Ave N
NNEE PP aarrkk DDrr
NE 4th StNE 4th St
SW 43rd StSW 43rd St SE Carr RdSE Carr Rd
NE 3rd StNE 3rd StLo
gan
Ave
NLo
gan
Ave
N
Duv
all A
ve N
ED
uval
l Ave
NE
I-405
FW
YI-4
05 F
WY
I-405 FWY
I-405 FWY
I-405 FWYI-405 FWY
I-405
FW
YI-4
05 F
WY
NE 4th StNE 4th St
I-405
FW
YI-4
05 F
WY
II--4400
55FF
WWY Y
I-405
FW
YI-4
05 F
WY
I-405 FWYI-405 FWY
I-405
FW
YI-4
05 F
WY
I-405 FWYI-405 FWY
NE 4th StNE 4th St
BN
IncB
N Inc
BN Inc
BN Inc
BN IncBN Inc
BN Inc
BN Inc
BN IncBN Inc
BN
Inc
BN
Inc
BN IncBN Inc
BN
IncB
N Inc
BB NN IInncc
BN IncBN Inc
BN In
cBN
Inc
BN IncBN Inc
BN In
cBN
Inc
Cedar River
Green River
Black River
May Creek
Duwamish Waterway
Springbrook Creek
Lake Washington
Lake YoungsPanther Lake
Lake Boren
Reference 15-BWellfield Capture Zones
One Year Capture Zone
Five Year Capture Zone
Ten Year Capture Zone
Cedar Valley Sole SourceAquifer Project Review Area
Streamflow Source Area
Cedar Valley Sole Source Aquifer
Aquifer Protection Area ZonesZone 1
Zone 1 Modified
Zone 2
Network Structure! Production Well
! Springbrook Springs
Renton City Limits
Potential Annexation Area
Groundwater Protection Areas Date: 01/09/2014
µ 0 1 2Miles

(This page intentionally left blank.)

BeD
BeD
BeC
AkF
AmC
KpD
AmB
AmB
AgC
AgC
AgCKpB
AgC
AkF
BeD
AgC
KpD
AgCKpBKpB AgD
EvC
BhBeC
AgB
KpBAgD UrEwC
EvB
AmC
Or
AgC
BeC
BeD
BeDBeC
AgC
KpD
BeC
KpCKpB
SkAmC BeC
UrBeC
Ur
AgD
KpBUr
AgC
EvC
KpC
AgC
OvD
SkAgB
AgB
AgD
EvCW
OvD
OvD
NoAgC
AgD
EvCRdC
Sk
KpB
No
AgCRdE
AgC EvC
BeC
InC
Bh
BeDRdC
AkF
AgD
BeD
BhSm
AgC
RdE
AgC AgDEvC
Sh
Sh
PITS
PyAgC
AgD
AgC EvC
PITS
EvBBeC
OvC
PITS
EvB AgCInA
AgD
AgD
Ur
Bh
AgC
RdCEvC EvD
AmB
AmC
AgD
BeD
EvC
AkF
AgDAgC
Sm
AgD
AmC
EvB
AgD
Sm
AgC
EwC
PITSPu
BhBh
AgC
KpD
Tu
AgC
EvC
EvC
Ur
RdC
KpB
RdCRdE
W
AgD
AgD
No
AgB
AgC
No
An
AkF
EvBInD
AgD
EvDInC
SkBeC
PITS
Ur
WBeC W
BeD
An EvC
BeC
PcEvC
Rh
AmC
BeCBeD BeD
Ur
BeC
Ur
W
W
Rh EvC
AkF
PITS
AgD
AmCPITS
Wo
Py
Tu
BeD
EvB
Py
AmC
Py
An
InC
Ng
AgC
AgC
W
EvB
AgD
AgCWo
Ur W
Ur RdC
Ur
Ur
EvC
Rh
Pc
PyPy
AgD
AmC
AgD MaRh
Pc
BeDPy
Ng AmCNg
BeC
AgC
Rh
AgD
PyMa PyRh Rh
RhPu
Pu
Ur
Pu
PITS
BeD
Rh
EvC
Py
Wo
Wo
AgC MaAgD
AgB
So
Ng
AgD
Tu
Py
AgC
AgC
AgC
AgC
NgUr
AgD
Sk AmB
AgB
AgD
PuUr
Py
Sk
Ur
No
AgB
MaBeC
W
AkFBeDPu
Py
NoNo
AmC
AgCEvC
Ma
Sk
EvC AgB
Py
InCSkAmCAmC
AgC
AgB SkAgBPITS
AgC
No
Pu AmB
EvC
PITS
AmB
AgB
AkFAkF
Ng
AgD
AgD
AgB
EvBAmBAmC
AmCWo
Ng
PITS
NkAgD
SkNk SkAgB
Ur AgD
Wo
AmC No
AgD
NoUr
AgB
UrBr
PyOs So
EvB
Ur
Nk WoAmB
WPc
OsRe
UrAmB
Sk
W
AmC
Tu
No
Pu AgDAmBAkF AgC
No
UrPk
AgB
AgC
Ur
AmBNoAmC
NoAmC
AmB PITS UrSk AgCAgB
AgC
Re
AgB
W
InC No
AgC
Wo
EvCNo
AmC
Wo
AgB
AgB
Ur
Ng SkAmB
ReOs AgCNo
AgD
No
UrNo
InC
AgDEvC
Tu
AmBEvB
AgD
PuInC
EvCAmC NoEvC
Ur
EvBAkF
Br
Os
AgDAmC
AgB
AgD
AmBOs
OsNo
AmC
Pk AkF No
AmC
EvCNo
No
AgDBrAgBAgC
AgBAmC
ReRe
KpBAmBNo
PyPy Sk
Ng AgB EvC
EvC Sk NoEvBNoPu Br
PuOsOs Wo AmC
PantherLake
LakeYoungs
LakeWashington
Bl ac k R i ver
Gree n R i v er
Ced a r R ive
r
Duwam i sh Water w a y
UV167
UV900
UV515
UV169
UV900
UV167
BN
Inc
BN
Inc
BBNN
IInncc
SSEE RReenntt oonn IIssssaa qq uu aahh RRdd
S 2nd StS 2nd St
RReennttoonn MMaappllee VVaalllleeyy RRdd
MMaapp llee VVaall lleeyy HHwwyy
1 10 08 8t t
h hA A
v ve eS S
E E
MMa ai i
n nA A
v ve eS S
MMaarr tt ii nnLL
KK ii nn gg JJrr WWaayy SSSSWW SSuunnsseett BBll vvdd
RRaa ii nn ii ee rr AAvv ee
NN
NE 3rd StNE 3rd St
II--440055
FFWWYY
SW 43rd StSW 43rd StSSEE CCaarrrr
RRdd
NE 4th StNE 4th St
SS GGrraaddyy WWaayy
SSEE RReennttoonn MMaappllee VVaalllleeyy RRdd
LLo og ga a
nnAA
v ve eNN
SR 515
SR 515
P Pa ar r
k kA A
v ve eN N
BBee nn ss oo nn
DDrr SS
SSuunn
sseett BB
llvvddNN
OOa ak k
e es sd da a
l le eA A
v ve eS S
W W
SSuunnss
eettBBll
vvdd
NNEE
DDu uv v
a al ll lA A
v ve eN N
E E
SR 1
67SR
167
11 4400tthh WWaayy SSEE
WWaattee rrss AAvvee SS
NNEE 2277tthh SStt
HHoouu ss ee rr WWaa yy
NN
1 15 56 6t t
h hA A
v ve eS S
E E
U Un ni i
o on nA A
v ve eN N
E E
1 11 16 6t t
h hA A
v ve eS S
E E
SW 7th StSW 7th St
PPuuggeett
DDrr SSEE
RReenn tt oonn AAvvee SS
GGa ar r
d de en n
A Av ve e
N N
SSWW 2277tthh SStt
BB ee nn ss oo nnRR
ddSS
W Wi il ll l
i ia am m
s sA A
v ve eS S
M Mo on n
r ro oe e
A Av ve e
N NE E
II nn tt ee rr uu rr bb aa nnAA vv ee
SS
H Ho oq q
u ui ia am m
A Av ve e
N NE E
8 84 4t th h
A Av ve e
S S
SSEE PPeettrroovvii tt sskkyy RRdd
SSoouutthhcc ee nntteerr BBllvvdd
EEVVaa
lllleeyy
HHwwyy
SSh ha at t
t tu uc ck k
A Av ve e
S S
RRaaiinn iieerr AAvvee SS
TTaal lbb
o ot tR R
d dSS
RRee nn tt oonnAAvvee
SS1 16 6
4 4t th h
A Av ve e
S SE E
SE 208th StSE 208th St
SSWW LLaannggssttoonn RRdd
SE 72nd StSE 72nd St
SE 128th StSE 128th St
1 12 24 4t t
h hA A
v ve eS S
E E
S 128th StS 128th St
NNeewwccaassttllee WWaayy
SS 221122tthh SStt
SS 118800tthh SStt
CCooaall
CC rr eeee kkPP
kk wwyy
SSEE
SW 41st StSW 41st St
N 30th StN 30th St
Taylor Pl NW
Taylor Pl NW1 14 4
0 0t th h
A Av ve e
S SE E
1 12 28 8t t
h hA A
v ve eS S
E E
1 11 16 6t t
h hA A
v ve eS S
E E
6 68 8t th h
A Av ve e
S S
SSEE 116688tthh SStt
NE 12th StNE 12th St
BBeeaaccoonn AAvv eeSS
FFoorreesstt DDrr SSEE
UUn ni i
o on nA A
v ve eS S
E E
SE 164th StSE 164th St
N Ni il le e
A Av ve e
N NE E
1 14 48 8t t
h hA A
v ve eS S
E E
SSEE MMaayy VVaalllleeyy RRdd
SSEE 220044tthh WWaayy
SW 34th StSW 34th St
SSEE JJoonneess RRdd
SE 144th StSE 144th St
EEMM
eerrcc
eerrWW
aayy
1 14 48 8t t
h hA A
v ve eS S
E E
WW
MM
eerrccee
rr
WWaayy
115544tt
hhPPll
SSEE
E Ed dm m
o on nd ds s
A Av ve e
N NE E
A Ab be e
r rd de ee e
n nA A
v ve eN N
E E
W Weess
tt VVaal ll le e
y yH H
w wy y
East
Val
ley
Rd
East
Val
ley
Rd
,§-405
,§-405
Reference 15-CRenton City Limits
Potential Annexation Area
Groundwater Protection Area Boundary
Aquifer Protection Area Zone 1
Aquifer Protection Area Zone 1 Modified
Soil TypeAgB
AgC
AgD
AkF
AmB
AmC
An
BeC
BeD
Bh
Br
EvB
EvC
EvD
EwC
InA
InC
InD
KpB
KpC
KpD
Ma
Ng
Nk
No
Or
Os
OvC
OvD
PITS
Pc
Pk
Pu
Py
RdC
RdE
Re
Rh
Sh
Sk
Sm
So
Tu
Ur
W
Wo
Date: 01/09/2014
0 1 2Milesµ
Soil Survey

(This page intentionally left blank.)