city of phoenix street transportation department 1 7 th avenue and 7 th street reverse lanes reverse...
TRANSCRIPT

1 City of PhoenixStreet Transportation Department
7th Avenue and 7th Street Reverse Lanes7th Avenue and 7th Street Reverse Lanes
Reverse Lane Public HearingSunnyslope Community Center
October 6, 2010 Kerry Wilcoxon, P.E.
Reverse Lane Public HearingSunnyslope Community Center
October 6, 2010 Kerry Wilcoxon, P.E.
•OverviewOverview•Operational AnalysisOperational Analysis•Public OpinionPublic Opinion

2 City of PhoenixStreet Transportation Department
Reverse Lane Overview
Reverse Lane Study Technical Analysis by Street
Transportation Current studies
Quality-of-life analysis by ASU PURL Including differences among neighborhoods
Operational Alternatives

3 City of PhoenixStreet Transportation Department
Background
Mayor Hance identified traffic congestion as #1 concern for Phoenicians in 1979
Mayor/Council directed staff to develop low-cost solutions
Widening or building new streets was not an option
Reverse lane selected to accommodate growth in Central Core

4 City of PhoenixStreet Transportation Department
7th Street started in 1982 Adams to Dunlap Ave Now McDowell to Dunlap
(7 miles)
7th Avenue &7th Street Central Phoenix
7th Avenue started in 1979 McDowell to Northern Ave.
(6 miles)

5 City of PhoenixStreet Transportation Department
³7TH AVE
³7TH ST
Without Reverse Lanes3 Lanes NB each street650 Vehicles/Hour/Lane
Without Reverse Lanes2 Lanes SB each street650 Vehicles/Hour/Lane
7T
H S
T
SR
51
7T
H A
VE
19
TH
AV
E
16
TH
ST1
5T
H A
VE
12
TH
ST
CE
NT
RA
L A
VE
27
TH
AV
E
3R
D S
T
THOMAS RD
OSBORN RD
20
TH
ST
VAN BUREN ST
BL
AC
K C
AN
YO
N F
WY
(I-
17
)
MC DOWELL RD
OAK ST
GLENDALE AVE
DUNLAP AVE
NORTHERN AVE
INDIAN SCHOOL RD
PAPAGO FWY (I-10)
MARYLAND AVE
BETHANY HOME RD
PEORIA AVE
23
RD
AV
E
BUTLER DR
ROOSEVELT ST
3R
D A
VE
ADAMS ST
25
TH
AV
E
CAVE CR
EEK R
D
18
TH
ST
2N
D S
T
BUTLER DR
2N
D S
T

6 City of PhoenixStreet Transportation Department
³7TH AVE
³7TH ST
With Reverse Lanes4 Lanes NB
33% Capacity Increase750 Vehicles/Hour/Lane
With Reverse Lanes3 Lanes SB
50% Capacity Increase 750 Vehicles/Hour/Lane
7T
H S
T
SR
51
7T
H A
VE
19
TH
AV
E
16
TH
ST1
5T
H A
VE
12
TH
ST
CE
NT
RA
L A
VE
27
TH
AV
E
3R
D S
T
THOMAS RD
OSBORN RD
20
TH
ST
VAN BUREN ST
BL
AC
K C
AN
YO
N F
WY
(I-
17
)
MC DOWELL RD
OAK ST
GLENDALE AVE
DUNLAP AVE
NORTHERN AVE
INDIAN SCHOOL RD
PAPAGO FWY (I-10)
MARYLAND AVE
BETHANY HOME RD
PEORIA AVE
23
RD
AV
E
BUTLER DR
ROOSEVELT ST
3R
D A
VE
ADAMS ST
25
TH
AV
E
CAVE CR
EEK R
D
18
TH
ST
2N
D S
T
BUTLER DR
2N
D S
T

7 City of PhoenixStreet Transportation Department
Original Issues Dilemma:
Benefit – Increased north/south traffic flow Detriment – Limited turning movements
Concerns: Neighborhood cut-through Safety Access (to businesses and neighborhoods)
Questions: Are they still needed?If yes, can they work better?If no, what are the consequences (costs) of removal?

8 City of PhoenixStreet Transportation Department
Study Approach
EngineeringStreet Transportation Department
Review current conditions Forecast future demand
Public PerceptionPhoenix Urban Research Lab (PURL) ASU
Survey stakeholders

9 City of PhoenixStreet Transportation Department
Street Transportation Dept Crash Rates
Comparison – 7th Ave to 19th Ave
7th St to 16th St Lane Utilization
Percentage of reverse lane utilizationTraffic speeds
Capacity AnalysesTraffic flow modeling

10 City of PhoenixStreet Transportation Department
Crash Rate Comparison Methodology
Study Period 2003-2005 (pre-LRT)Streets Examined - 19th Ave, 7th Ave, 7th St,
16th StCrashes involving at least one north/south
vehicle Calculation
Crash Rate = Crashes by Hours
Hourly Traffic Volumes x Length

11 City of PhoenixStreet Transportation Department
Crash Rates AM Reverse Lane Hours
Northern Av
Glendale Av
Bethany Home Rd
Camelback Rd
Indian School Rd
Thomas Rd
McDowell Rd
16th
St
7th
St
7th
Av
19th
Av
HI
Segment
Intersection
12 City of PhoenixStreet Transportation Department
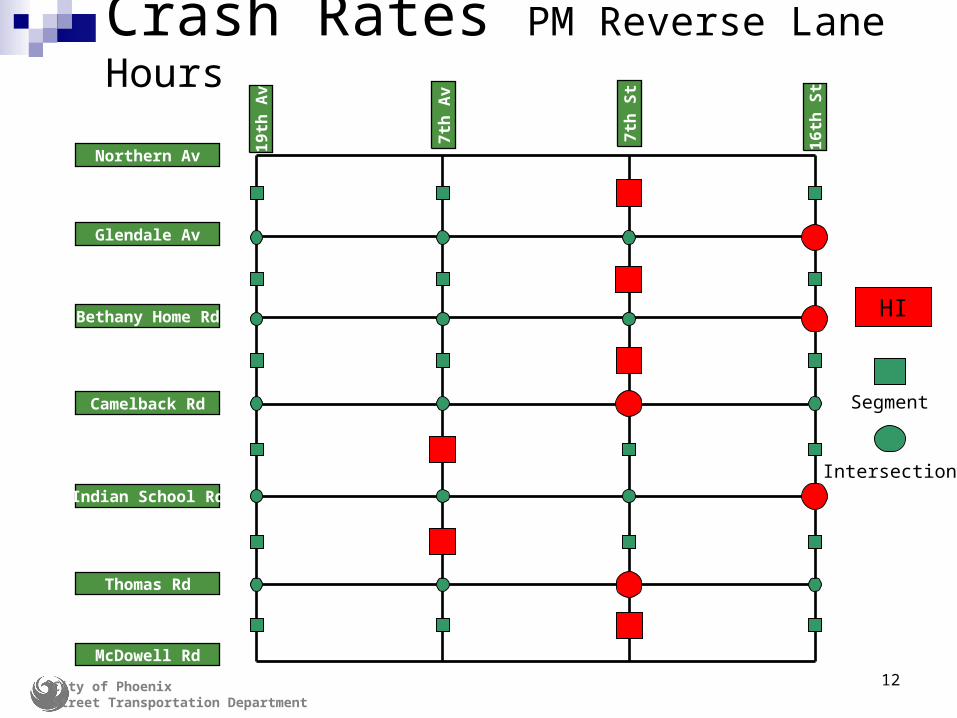
Northern Av
Glendale Av
Bethany Home Rd
Camelback Rd
Indian School Rd
Thomas Rd
McDowell Rd
16th
St
7th
St
7th
Av
19th
Av
HI
Segment
Intersection
Crash Rates PM Reverse Lane Hours

13 City of PhoenixStreet Transportation Department
Northern Av
Glendale Av
Bethany Home Rd
Camelback Rd
Indian School Rd
Thomas Rd
McDowell Rd
16th
St
7th
St
7th
Av
19th
Av
HI
Segment
Intersection
Crash Rates Non-Reverse Lane Hours

14 City of PhoenixStreet Transportation Department
Common Type of Crashes2001-2005
Most Common:
All Four Streets Rear End
Most Severe:19th Av Angle 7th Av Angle 7th St Angle/Left Turn16th St Left Turn

15 City of PhoenixStreet Transportation Department
Annualized Head-On Crashes2001-2005
16th St – 5.4
crashes/year
7th St – 4.4
19th Ave – 3.4
7th Ave – 1.8

16 City of PhoenixStreet Transportation Department
19th Ave – 11.4
crashes/year
7th St – 11.2
16th St – 10.4
7th Ave – 6.0
Annualized Pedestrian Crashes2001-2005

17 City of PhoenixStreet Transportation Department
2007 Reverse Lane UtilizationAM Peak Hours
GLENDALE AV
INDIAN SCHOOL RD
27%
25%
THOMAS RD
23%
CAMELBACK RD
28%
BETHANY HOME RD
27%NORTHERN AV
7TH
ST
24%
GLENDALE AV
INDIAN SCHOOL RD
23%
25%
THOMAS RD
18%
CAMELBACK RD
BETHANY HOME RD
N/A
25%
NORTHERN AV
7TH
AV
N
26%
30%
30%

18 City of PhoenixStreet Transportation Department
N/A
GLENDALE AV
INDIAN SCHOOL RD
12%
9%
THOMAS RD
6%
CAMELBACK RD
14%
BETHANY HOME RD
N/A
14%
NORTHERN AV
7TH
AV
15%
GLENDALE AV
INDIAN SCHOOL RD
15%
11%
THOMAS RD
9%
CAMELBACK RD
17%
BETHANY HOME RD
16%
18%
NORTHERN AV
7TH
ST
2007Reverse Lane UtilizationPM Peak Hours
N

19 City of PhoenixStreet Transportation Department
CurrentAverageSpeedsSouthbound AM
N
GLENDALE AV
INDIAN SCHOOL RD
THOMAS RD
CAMELBACK RD
BETHANY HOME RD
NORTHERN AV
7TH
ST
44MPH
41MPH
40MPH
44MPH
GLENDALE AV
INDIAN SCHOOL RD
THOMAS RD
CAMELBACK RD
BETHANY HOME RD
NORTHERN AV
41MPH
38MPH
42MPH
7TH
AVE

20 City of PhoenixStreet Transportation Department
GLENDALE AV
INDIAN SCHOOL RD
THOMAS RD
CAMELBACK RD
BETHANY HOME RD
NORTHERN AV
7TH
ST
GLENDALE AV
INDIAN SCHOOL RD
THOMAS RD
CAMELBACK RD
BETHANY HOME RD
NORTHERN AV
7TH
AVE
CurrentAverageSpeedsNorthbound PM
45MPH
43MPH
41MPH
41MPH
44MPH
41MPH
40MPH
40MPH

21 City of PhoenixStreet Transportation Department
Capacity Analysis
Traffic Modeling Existing reverse lanes vs. Hypothetical
conditions Input
Traffic Volume Lane Configuration Signal Timing
Output Travel Time Comparison

22 City of PhoenixStreet Transportation Department
0
5
10
15
20
25
30
35
40
45
Min
ute
s
AM Peak Hour Travel Times PM Peak Hour Travel TimesMorning Peak Hour
7:15 – 8:15Afternoon Peak Hour
4:30 – 5:30
Travel Times - 7th AvenueMcDowell to Northern - Actual and Predicted
15
ActualPredicted w/oReverse Lane
29
11
ActualPredicted w/oReverse Lane
19

23 City of PhoenixStreet Transportation Department
0
5
10
15
20
25
30
35
40
45
Min
ute
s
AM Peak Hour Travel Times PM Peak Hour Travel TimesMorning Peak Hour7:15 – 8:15
Afternoon Peak Hour4:30 – 5:30
25
44
2030
ActualPredicted w/oReverse Lane Actual
Predicted w/oReverse Lane
Travel Times - 7th Street McDowell to Northern - Actual and Predicted

24 City of PhoenixStreet Transportation Department
0
5
10
15
20
25
30
Min
ute
s
Morning Peak Hour7:15 – 8:15
14 min.
SR-51 16th St
11 min.
I-17
25 min.
7th St
15 min.
7th Av
Travel Time ComparisonMorning Peak HourNorthern to McDowell Alignments
10 min.

25 City of PhoenixStreet Transportation Department
0
5
10
15
20
25
30
Min
ute
s
Afternoon Peak Hour4:30 – 5:30
15 min.
Travel Time ComparisonAfternoon Peak HourMcDowell to Northern Alignments
SR-51 16th St
12 min.
I-17
20 min.
7th St
11 min.
7th Av
15 min.

26 City of PhoenixStreet Transportation Department
Estimated Future Traffic - 2030(thousands of vehicles per day)
Source: City of Phoenix Traffic Volume Map Source: MAG Model

27 City of PhoenixStreet Transportation Department
85308
85032
85253
85027
85028
85022
85050
85020
8500885009
85301
85018
85043
85029
85024
85
016
85
254
85023
85021
85051
85302
85034
85304
85306
85310
85033
85
303
853
45
8505
38
50
17
85
054
85
015
85035
85
01 4
85
013
85006
85031
85
019
8538
1
85
007
85
012
85382
vw101
Union Hills DrUnion Hills Dr
Glendale AvGlendale Av
Reverse Lane Users(Driver Home Zip Code)

28 City of PhoenixStreet Transportation Department
Neighborhood Cut Thru AnalysisCurrent: Left-turn generated cut-thru
Cause: Left-turn restrictions at signals
Occurs: Downstream of signals• Primarily left turns into neighborhoods
Predicted:Congestion generated cut-thru
Cause: Low capacity at signals
Occurs: Upstream and downstream of signals• Includes left and right turns into neighborhoods

29 City of PhoenixStreet Transportation Department
Reverse Lane UsageBefore and After Light RailDecember 2008
Peak Hour
Before After
Morning 26% 29%
Afternoon 14% 16%

30 City of PhoenixStreet Transportation Department
Traffic CountsDuring Recession
14% reduction in Average Daily Traffic (ADT) at city-wide count stations from 2005 to 2009
30% reduction in ADT on the reverse lane streets from 2005 to 2009

31 City of PhoenixStreet Transportation Department
Engineering Findings• Traffic safety on 7th Avenue and 7th Street Traffic safety on 7th Avenue and 7th Street similar to other arterial streetssimilar to other arterial streets
•Reverse lanes carry a substantial amount of Reverse lanes carry a substantial amount of rush hour trafficrush hour traffic
•Removal would result in loss of capacity with Removal would result in loss of capacity with same demandsame demand
•Neighborhood cut-thru routes may shiftNeighborhood cut-thru routes may shift

32 City of PhoenixStreet Transportation Department
ASU Phoenix Urban Research Lab (PURL) – Stakeholder Survey
Goal: Determine how stakeholders view the lanes and how they would change them (improve, eliminate, preserve)?
Process Identify stakeholders
(drivers, peds, bicyclists, residents, business owners, etc.)
Conduct sample-based surveys of stakeholders Conduct focus groups of stakeholder groups Analyze survey and focus group responses

33 City of PhoenixStreet Transportation Department
Very few satisfied with business-as-usual Main quality-of-life concerns:
Reverse lanes inhibit access Most feel lanes are unsafe Driver confusion
Would recommend: Keep the lanes & add electronic signage Eliminate the reverse lane on 7th Street/7th Avenue Little support to keep lanes with no changes
Quality-of-Life Study Results Central Phoenix Neighborhoods

34 City of PhoenixStreet Transportation Department
Quality-of-Life Study Results North Central Neighborhoods
More satisfied with operation than other stakeholders More than 50% say:
Lanes are safe and reduce travel time Reverse lane signs are understandable
Would recommend: Enforcement and more left turn opportunities Sign upgrades e.g., electronic signs

35 City of PhoenixStreet Transportation Department
Operational Alternatives
Scenarios:1. Maintain Reverse Lanes as is
2. Permanently Remove Reverse Lanes
3. Maintain Reverse Lane; a. add flashing lights to existing signs
b. add electronic lane control beacons
4. Temporarily remove Reverse Lanes as test

36 City of PhoenixStreet Transportation Department
Maintain existing reverse lane operation- Continue to optimize- Continue enforcement
Estimated Cost: $0
Scenario 1 – Keep Reverse Lanes No Change of Operation

37 City of PhoenixStreet Transportation Department
Remove reverse lanes on both streets- Remove existing signs and mast arms
- Install new turn arrows at major intersections
- Re-evaluate signal timing
- Public education campaign
Estimated Total Cost:
Without sign pole removal $630,000
With sign pole removal $955,000
Scenario 2 – Permanently remove Reverse Lane operation

38 City of PhoenixStreet Transportation Department
Scenario 3a – Keep Reverse Lanes Add flashing lights to existing signs
Install flashing lights to existing overhead signs- Supply power to existing sign poles- Install flashing beacons and wireless
communication equipment- Public education campaign
Estimated Total Cost: $3,850,000

39 City of PhoenixStreet Transportation Department
Install additional new red X – Green Circle lane control signals, additional poles and new signs
- Install additional signs and sign posts- Supply power to mast arms- Install supporting control equipment- Public education campaignEstimated Total Cost: $24,510,000
Scenario 3b – Keep Reverse Lanes Add electric lane control signals

40 City of PhoenixStreet Transportation Department
Remove reverse lanes on 7th Avenue or 7th Street- Remove existing signs
- Public education campaign
Estimated Total Cost:
7th Avenue: $65,000
7th Street: $70,000
Scenario 4 – Temporarily remove Reverse Lane as test

41 City of PhoenixStreet Transportation Department
Ad-Hoc Committee Schedule Aug - Sept Task Force Meetings Sept - Oct Public Meetings
Reverse lane survey on-line (until 10/31/2010) November Task Force Meeting
Develop Recommendations December Presentation to City Council
Reverse Lane Survey: http://lists.phoenix.gov/subscribe/survey?f=217
