city of newton, north carolina sheet - governmental ... management of the city of newton, north...
TRANSCRIPT

CITY OF NEWTON, NORTH CAROLINA
COMPREHENSIVE ANNUAL FINANCIAL REPORT
FOR THE FISCAL YEAR ENDED JUNE 30, 2013
PREPARED BY CITY OF NEWTON FINANCE DEPARTMENT


Exhibit PageIntroductory Section
Letter of Transmittal 1-12Certificate of Achievement for Excellence in Financial Reporting 13Organizational Chart 14List of Principal Officials 15-16
Financial Section
Independent Auditor’s Report 17-19
Management’s Discussion and Analysis 20-31
Basic Financial Statements:
Government-Wide Financial Statements:A Statement of Net Position 32
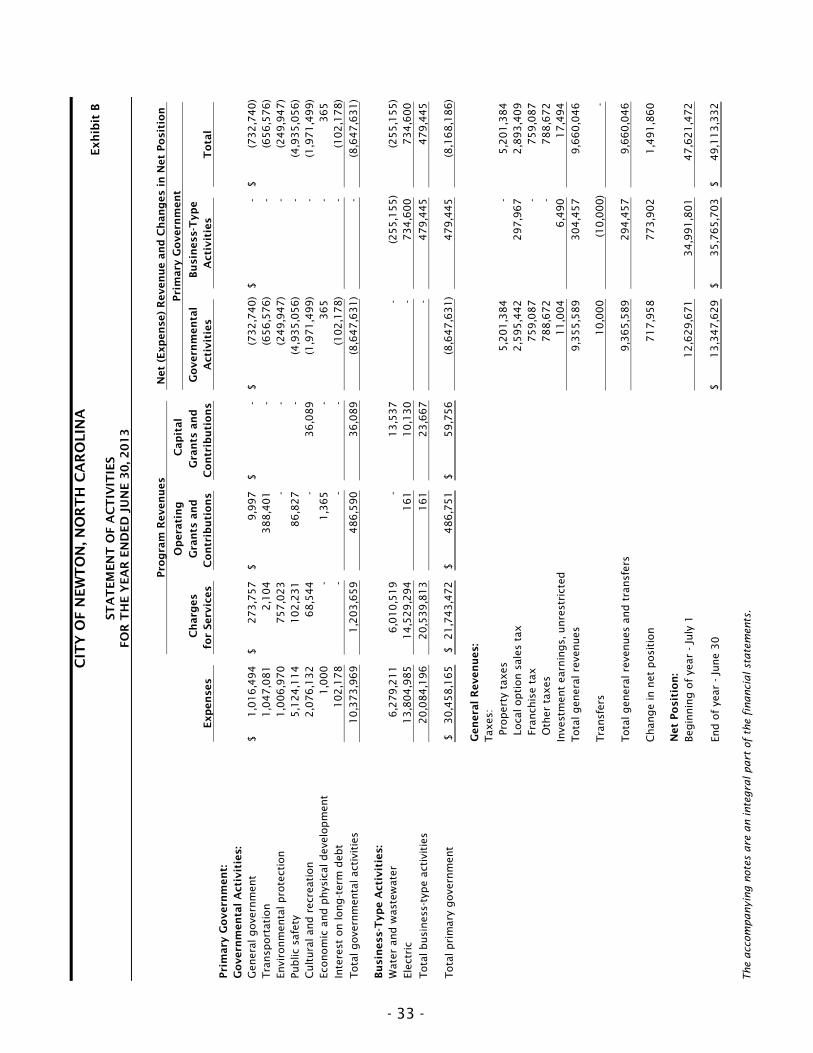
B Statement of Activities 33
Fund Financial Statements:C Balance Sheet - Governmental Funds 34
D Statement of Revenues, Expenditures, and Changesin Fund Balances - Governmental Funds 35
E Reconciliation of the Statement of Revenues,Expenditures, and Changes in Fund Balances -Governmental Funds to the Statement of Activities 36
F General Fund - Statement of Revenues, Expenditures,and Changes in Fund Balance - Budget and Actual 37
G Statement of Net Position - Proprietary Funds 38
H Statement of Revenues, Expenses, and Changesin Fund Net Position - Proprietary Funds 39
I Statement of Cash Flows - Proprietary Funds 40
Notes to the Financial Statements 41-76
ScheduleRequired Supplemental Financial Data:
A-1 Law Enforcement Officers’ Special SeparationAllowance - Required Supplemental Information 77
A-2 Other Post-Employment Benefits - RetireeHealth Plan - Required Supplementary Information -Schedule of Funding Progress 78
CITY OF NEWTON, NORTH CAROLINA
TABLE OF CONTENTS
FINANCIAL STATEMENTSFOR THE YEAR ENDED JUNE 30, 2013

CITY OF NEWTON, NORTH CAROLINA
TABLE OF CONTENTS
FINANCIAL STATEMENTSFOR THE YEAR ENDED JUNE 30, 2013
Schedule PageSupplementary Information:
Governmental Activities:
General Fund:1 Schedule of Revenues, Expenditures, and Changes
in Fund Balance - Budget and Actual 79-82
Nonmajor Governmental Funds:2 Combining Balance Sheet 83
3 Combining Statement of Revenues, Expenditures, and Changes in Fund Balances 84
CDBG Moretz Industry Access Road Special Revenue Fund4 Schedule of Revenues, Expenditures, and Changes
in Fund Balance - Budget and Actual 85
Main Street Energy Grant Fund5 Schedule of Revenues, Expenditures, and Changes
in Fund Balance - Budget and Actual 86
Special Revenue Fund - General6 Schedule of Revenues, Expenditures, and Changes
in Fund Balance - Budget and Actual 87
General Capital Projects Fund7 Schedule of Revenues, Expenditures, and Changes
in Fund Balance - Budget and Actual 88
Supplementary Information:
Business-Type Activities:
Water and Wastewater Fund:8 Schedule of Revenues and Expenditures - 89-90
Budget and Actual (Non-GAAP)
Water and Wastewater Capital Project Fund:9 Schedule of Revenues and Expenditures -
Budget and Actual (Non-GAAP)CDBG-ED Target Distribution Project 91
10 Schedule of Revenues and Expenditures -Budget and Actual (Non-GAAP) - Burris Road Pump Station 92

CITY OF NEWTON, NORTH CAROLINA
TABLE OF CONTENTS
FINANCIAL STATEMENTSFOR THE YEAR ENDED JUNE 30, 2013
Schedule PageSupplementary Information: (continued)
Business-Type Activities: (continued)
11 Schedule of Revenues and Expenditures -Budget and Actual (Non-GAAP) - 93
12 Schedule of Revenues and Expenditures -Budget and Actual (Non-GAAP)Snow Creek Sewer Outfall Rehabilitation 94
Electric Enterprise Fund13 Schedule of Revenues and Expenditures -
Budget and Actual (Non-GAAP) 95-96
Electric Fund Capital Projects14 Schedule of Revenues and Expenditures -
Budget and Actual (Non-GAAP) 97
Health Insurance Internal Service Fund15 Schedule of Revenues and Expenditures -
Budget and Actual (Non-GAAP) 99
Other Supplemental Schedules:
16 Schedule of Ad Valorem Taxes Receivable 99
17 Analysis of Current Tax Levy 100
Statistical Section (Unaudited) 101-124
Compliance Section
Report On Internal Control Over Financial ReportingAnd On Compliance And Other Matters Based OnAn Audit Of Financial Statements Performed In
Accordance With Government Auditing Standards 125-126
Schedule of Findings and Questioned Costs 127
Summary Schedule of Prior Year’s Audit Findings 128


INTRODUCTORY SECTION
• Letter of Transmittal • GOFA Certificate of Achievement
• Organizational Chart
• List of Principal Officials


October 1, 2013 The Honorable Mayor, Members of the City Council and the Citizens of the City of Newton, North Carolina The Comprehensive Annual Financial Report (CAFR) of the City of Newton, North Carolina for the fiscal year ended June 30, 2013 is hereby submitted. North Carolina General Statutes require that every local government publish within four months after the close of each fiscal year a complete set of audited financial statements presented in conformity with generally accepted accounting principles. This report is published to fulfill that requirement for the fiscal year ended June 30, 2013. Management of the City of Newton, North Carolina, assumes full responsibility for the completeness and reliability of the information contained in this report, based upon a comprehensive framework of internal control that management has established for this purpose. Because the cost of internal control should not exceed anticipated benefits, the objective is to provide reasonable, rather than absolute, assurance that the financial statements are free of any material misstatements. The City of Newton’s financial statements have been audited by Martin Starnes and Associates, CPAs, P.A. The objective of the independent audit was to provide reasonable assurance that the financial statements of the City of Newton for the fiscal year ended June 30, 2013, are free from material misstatement. The independent audit involved examining, on a test basis, evidence supporting the amounts and disclosures in the financial statements and assessing the accounting principles used and significant estimates made by management, as well as evaluating the overall financial statement presentation. The independent auditor concluded, based upon the audit, that there was a reasonable basis for rendering an unqualified opinion that the financial statements of the City of Newton for the fiscal year ended June 30, 2013 are presented in conformity with Generally Accepted Accounting Principles (GAAP). The report of the independent auditors is presented as the first component of the financial section of this report. GAAP requires that management provide a narrative introduction, overview, and analysis to accompany the basic financial statements in the form of Management’s Discussion and Analysis (MD&A). This Letter of Transmittal is

- 2 -
designed to complement the MD&A and should be read in conjunction with it. The City of Newton’s MD&A is presented immediately following the independent auditors’ report. Profile of the City The City of Newton, founded in 1843 and incorporated in 1855, is the County seat of Catawba (“the County”). It is located in the western part of the Piedmont section of the State, approximately 39 miles northwest of Charlotte and 10 miles southeast of Hickory. Evidence of our long and distinguished history abounds throughout the stately streets of the City. The State of North Carolina has erected several historical markers to honor some of the important events, landmarks, and distinguished people in Newton’s past. The City currently occupies approximately thirteen square miles and serves a population of 12,961. The City is empowered by State Statute to levy an ad valorem property tax on the appraised value of all real and tangible personal property located within the City. The City is also empowered to extend its corporate limits by annexation. The Council is required by State Statute to adopt a budget by July 1 of each year. The City is empowered to levy a property tax on both real and personal property located within its boundaries. The City’s budget ordinance creates a legal limit on spending authorizations and serves as the foundation for the City’s financial planning and control. The budget is prepared by fund and department. Appropriations are authorized by department totals. The Finance Director is authorized to reallocate departmental appropriations among line item objects of expenditures as necessary during the budget year. Form of Government The City of Newton is one of several incorporated municipalities in the County and operates under the Council-Manager form of government. The Mayor is elected at large for a four-year term. The council is composed of seven members including the Mayor. The Mayor votes only to break tie votes. The City Council has policy making and legislative authority. Members are elected at large on a staggered basis in a city-wide election. Three members of the City Council are elected every two years, serving four year terms. The City Council is responsible for the City’s annual budget and any amendments thereto, approving economic development plans and incentives, zoning and planning issues, and other matters related to the health and welfare of the City. The City Council also appoints the City Manager and City Attorney. The City Manager works at the pleasure of the

- 3 -
City Council and is responsible for implementing Council policies and City ordinances, managing daily operations, and acts on all recommendations of employment for the City. Quality of Life The gently rolling terrain blends into the foothills of the Blue Ridge Mountains offering residents and visitors an abundance of scenic attractions, a wealth of recreational options, and a temperate climate with four seasons that are as distinct as they are mild. The City has a wide array of advantages – large range of employment opportunities, low cost of living, diverse cultures, a vast array of recreational opportunities, arts and culture, and an unparalleled lifestyle. The City of Newton provides a full range of services, including planning and zoning, police and fire protection, solid waste and recycling services, the construction and maintenance of streets, curbs, gutters, sidewalks, and other infrastructure, parks, recreation and cultural activities, electric, water and sewer service. This report includes all of the City’s activities in delivering and administering these services. The City also extends financial support to certain boards, agencies, and commissions to assist in their efforts in serving citizens of the City of Newton. Among these are the Catawba Arts Council, the Catawba County Library, the Newton-Conover Auditorium Authority, the Old Post Office Playhouse, the Historical Association, and the Newton Depot Authority. Because City allocations do not constitute a major portion of their revenue, and because the City has no authority to designate their management, none of these organizations have been included in this report. The City of Newton can point to a variety of elements that contribute to and enhance the desirability and livability of its citizens. Examples of cultural amenities are the Old Post Office Playhouse in downtown which opened in 2010 and provides a modern venue for the performing arts, the Newton-Conover Auditorium provides a place for artists to thrive in terms of music, sculpture, painting and the theatrical arts, and the Catawba County Museum of History located in downtown provides a significant collection of the county’s history from early settlers, to the furniture, textile, telecommunications industries that have thrived in the area. The City has six parks, two recreation centers, a large pool, one and one-half miles of greenway, two and one-half miles of mountain bike trails and an amphitheatre in terms of recreation facilities. Soldiers Reunion The most popular event each and every year is the Soldiers Reunion Parade.

- 4 -
The annual Soldiers Reunion celebration is believed to be the longest-running patriotic celebration not based on a holiday. Soldiers Reunion is a week-long event which includes Cruisin’ and Car Show, Gospel Music Night, Beach Music Night, two patriotic services, 5K/one-Mile Fun Run, 30-60-100 Mile Century Bike Ride and of course the ever popular Soldiers Reunion Parade which typically runs for about one and one-half hours through the downtown area. Newton Downtown Historic District On May 11, 2012 the Newton Downtown Historic District was officially listed in the National Register of Historic Places by the National Park Service. The Newton Downtown Historic District is anchored by the 1924 Courthouse, which now serves as the home of the Catawba County Museum of History, and is comprised of 58 buildings. Newton also is home to the North Main Avenue Historic District, which was listed in 1986, and to eight other historic properties listed on the National Register. Wi-Fi The City provides free outdoor Wi-Fi Internet Service in the downtown business district, City facilities and City parks in an effort to attract more customers to the downtown business district, to encourage the use of public parks and facilities, and to enable citizens to access City services online. Heritage Trail Greenway The Heritage Trail Greenway, approximately one and one-half miles in length, was planned and created for the purpose of exercise, a mode of alternative travel, and connectivity of neighborhoods. The Greenway allows residents to enjoy the sounds and beauty of nature while spending time outdoors with family and friends. Woodland Loop Trail The Woodland Loop Trail at Jacob Fork Park offers fun and adventure for hikers, trail runners and mountain bikers alike. The intermediate level trail is two and one-half (2.5) miles long. The trail which was completed in 2013 was a collaborative effort between the City of Newton, Catawba Valley Heritage Alliance and Lightning Cycles with financial support from North Carolina Division of Parks & Recreation and Specialized Bikes. Trail Dynamics designed the trail to have minimal impact on the local ecosystem. The Western Piedmont Council of Governments organized volunteer groups to help build the trail. The Woodland Loop Trail complements the 100-acre park that marks the convergence of the Jacob Fork and Henry Fork Rivers into the South Fork River. The park serves as an example of a state of the

- 5 -
art, environmentally sensitive, low-maintenance park facility. Newton Depot The Newton Depot, constructed in 1924, was relocated to its present site, restored and opened to the public in September 2006 and houses a railroad museum and model railroad club, as well as a banquet room available for public and civic rentals. On September 5, 2012, the Newton Depot Authority held a groundbreaking ceremony which took place to symbolize the start of construction on a $750,000 outdoor museum, the Southeastern Narrow Gauge and Shortline Museum. The Newton Depot is the only railroad museum in the S.E. United States that focuses on narrow gauge and shortline aspects of railroad history. As a result, this project has become key to the local economy as it will entice railroad enthusiasts around the U.S. and beyond to visit Newton. Business and Economic Development Business Advisory Committee Newton City Council established a Business Advisory Committee (BAC) in the fall of 2011 to encourage and cultivate commercial economic development in all areas of Newton, including but not limited to the downtown area. The BAC has initiated meetings between developers, property owners, architects, and regulators to facilitate new business development and real estate investment. The BAC has been instrumental in developing an incentive plan for new and expanding small businesses, initiating a study of the City’s branding and marketing efforts, and developing a database of existing business to be used for retail leakage (supply/demand) studies and for recruiting new businesses. City Council’s approved budget for 2013-2014 includes funding for wayfinding implementation, a BAC-supported project and an economic development tool which should help attract new residents and businesses to the City. The design phase of the wayfinding project is already underway. The City of Newton, with the support of the Business Advisory Committee, is taking a fresh look at marketing the outstanding opportunities and the rich lifestyle the City has to offer. The first two steps in this process will be the completion of the wayfinding signage project and the re-branding of Newton. The branding effort will provide the material for a future marketing effort, and the new wayfinding signage will insure that visitors to our City can easily navigate our streets to their intended destination, that they are made aware of other attractions along the way, and that their visit to Newton is an enjoyable experience.

- 6 -
Downtown Newton Development Association The Downtown Newton Development Association (DNDA) has been active in promoting interest and investment in downtown Newton. The DNDA worked with the City to gain a listing for downtown Newton in the National Register of Historic Places. The DNDA renovated two downtown facades in the last four years using volunteer labor, donated materials, and grant funding. The DNDA also administers the City’s façade grant program. The City of Newton is one of sixty-one North Carolina Main Street Communities, an organization within the North Carolina Department of Commerce entrusted with the revitalization of the downtown areas of member communities. North Carolina Main Street Center provides education and guidance to help member communities maintain and grow a thriving downtown economy in the context of historic preservation. In 2011, the City of Newton applied for a Main Street Solutions Fund grant to assist with the renovation and preservation of a downtown building and to aid a new business owner with establishing a wine bar in downtown Newton. A grant of $80,830 was awarded to the City of Newton on behalf of Carolina Vines Wine Bar, and that construction project was completed in the spring of 2013. Carolina Vines opened in downtown Newton on May 18th, 2013. Business Expansions Technibilt/Cari-All (Technibilt, Ltd.), a manufacturer of shopping carts, recently purchased an existing manufacturing facility in Newton for their new office, showroom, and research facility. This late-2012 project represents a $1 million new investment in Newton. Current plans call for an additional $3 million investment within the next year. Industrial and commercial expansions are continuing into 2013, with WJB Automotive, Inc. leasing a 100,000 square foot distribution facility that will eventually bring 50 new employees and an investment in inventory and equipment of approximately $5 million. United Franchise Group is making a $750,000 investment in a vacant distribution center for their sign operations. They will be creating 47 new jobs. Dollar General built two new stand-alone stores in Newton during 2013, representing a new investment of $1.3 million. The City’s downtown area has continued to enjoy a low vacancy rate, with a

- 7 -
vibrant mix of local businesses, in spite of a slowly recovering economy. Three downtown buildings were renovated for new businesses within the last year – The Blue Moon Tavern, Marie and Twannettes Bakery, and Carolina Vines Wine Bar. The Carolina Vines project represents a $320,000 investment in the downtown area. Turning Point Services built a new $180,000 office facility in downtown Newton during the first half of 2013. Local Economy Over the past several years, the City has sought to diversify and balance its threatened traditional manufacturing base. A productive partnership with the County and regional Economic Development Corporation has produced a comprehensive methodology for identifying and recruiting new business and industry, both manufacturing and non-manufacturing. The City has transitioned from a traditional manufacturing economy to a more sustainable, diversified structure. Major industries located within the City and its environs include manufacturers of consumables for the field of medicine and research, automotive suspension components, baked foods, primary metal products, defense related communications equipment as well as traditional furniture and textiles. Upholstered furniture manufacturers are still a significant part of the Newton employment base, with Bassett Furniture and Lee Industries employing over 1,000 people. The City has very favorable water, sewer and electrical rate structures as well as an aggressive and innovative approach to economic development incentives which has enabled the City to be competitive and attractive to prospective industries seeking to build new facilities. In addition to its manufacturing sector, the City enjoys a diversity of non-industrial employers including the Catawba County Administrative and Justice Center Complex, administrative offices of the Newton-Conover and the Catawba County School systems, United Church Homes and Services, Target Distribution Center, and the North American headquarters of Sarstedt Corporation. Two of the top five employers in Catawba County are within the City of Newton. These two employers, Catawba County Schools and Catawba County Government, employ 3,070 employees. The City of Newton has had tremendous success over the past several years with announcements of new company locations including General Dynamics, Target Distribution Center, Flowers Baking, and ZF Lemforder. The City actively works with the County Economic Development Corporation to recruit and retain significant business assets in terms of employment, tax base and utility usage. As a testament to the City Council’s desire to enhance the business climate of Newton it recently appointed a Business Advisory
- 8 -
Committee to guide and direct non-industrial business growth in the City. Unemployment The Nation, as well as North Carolina, is slowly showing signs of economic recovery following the recession. Economists claim this to be the slowest recovering recession since World War II. The county, State, and national unemployment rates as of June 30, 2013 were 10.8%, 8.8%, and 7.6%, respectively. A year earlier, June 30, 2012, the rates were 11.3%, 9.5%, and 8.2%, respectively. Even though North Carolina’s unemployment rate is above the national level, North Carolina seems to be minimizing the unemployment gap at a faster rate. Long-term Financial Planning and Major Initiatives The City seeks to consistently maintain a strong financial position. A key financial goal of the City for many years has been the maintenance of a 21% undesignated fund balance level in the General Fund which is above the required 8 percent established by the State of North Carolina. Another goal of the City is to avoid budgeting recurring expenses with one-time revenue sources. Implementing a mix of pay-as-you-go with long-term debt funding for capital needs is yet another goal of the City. 5-Year Capital Improvement Plan (CIP) The City adopted a 5-Year Capital Improvement Plan for fiscal years 2014 - 2018 which encompasses $19.8 million in long-range capital improvements over a five year period and coordinates community infrastructure needs with the financial capacity of the City.
• The City has approved the construction of a new Fire Station Headquarters costing $3 million. The purchase of land is also included in this cost.
• The City, in collaboration with Catawba County, will be completing a $2.6 million project to extend 42,000 linear ft. of 12” water line from South Highway 16 to Buffalo Shoals Road. Once completed this project will improve water quality in that area as well as provide a second source of water supply. This project will be completed in three phases.
• The City of Newton is considering a $3.5 million Smart Grid project
that will modernize the City’s electric and water grids using the latest Advanced Metering Infrastructure (AMI) technology. The Smart Grid system will increase accuracy, reduce operating costs, improve efficiency, and enhance customer service. Like all major assets, the

- 9 -
electric and water systems must be maintained and improved to ensure our customers receive the best service and value. The Smart Grid will include the installation of more than 10,000 smart meters at every home and business in the city. The City’s Customer Service Reps would then have the ability to instantly read, disconnect or reconnect meters without having to send someone to the service location. The same system would also pin point outages, leaks, tampering, and other events. This leads to faster restoration of service and improved customer satisfaction.
• The City has plans to invest $1.5 million in a back-up transformer for the Jacob Fork Electric SubStation which will provide redundancy in the event of an emergency in that specific area and for industrial development in the area of the Highway 10 and Highway 321 intersection.
• Due to mandatory requirements established by the FCC for radio
frequency rebanding, the City will upgrade the Police Department’s radio system to an 800 MHz system. This is a $305,000 project.
• The City has completed $228,000 in stormwater infrastructure
improvements from fiscal years 2010 through 2013 to replace deteriorated infrastructure. The City will begin improvements in fiscal year 2014 for the South Caldwell Street Culvert which will entail replacing approximately 80’ of metal culvert with a box culvert.
• The City has completed $3.2 million in water and wastewater infrastructure improvements from fiscal year 2010 through 2013 to replace deteriorated infrastructure due to age. These improvements will provide better water flows and water pressure to specific areas and reduce infiltration and inflow into the sewer system. The City will continue infrastructure improvements in other areas over the next 5 years in the amount of $1.6 million.
• In 2004 the City committed to a 7 year $7.7 million Master Plan for the City’s electrical utility. The City is completing its final phase in converting all of the forty (40) to sixty (60) year old primary circuit conductors, transformers, and equipment from 4kv to 24kv in the downtown area, southern area, western area and the final phase in the northern area of the City. The cost of the final phase of this project is $650,000.

- 10 -
Downtown Streetscape Master Plan Newton City Council adopted a Downtown Streetscape Master Plan in 2010. The Streetscape Master Plan was developed by a team of City staff members and downtown committee members, utilizing input from earlier citizen participation “visioning studies”. The area covered by the Streetscape Master Plan is a 17 to 20 square block area anchored by the centrally-located “Courthouse Square”. The Streetscape Master Plan includes recommendations and concepts for street trees, bump-outs, sidewalk and sidewalk border configurations as well as suggestions for streetscape elements such as signs, streetlight, streetlight and sign poles, street furniture, crosswalk treatments, and public art. Citizens who participated in the 2008 Vision Forum spoke of a desire for a variety of downtown amenities, shops, artisans, and pedestrian features that would create a thriving, pedestrian-oriented community center. At present, the City of Newton is working towards the goal of funding the advanced project planning needed for major downtown infrastructure and streetscape improvements. While the funding and scheduling for the overall plan is being considered, the City has been able to incorporate some of the recommendations from the Downtown Streetscape Master Plan during sidewalk repair projects. Brick paver borders have been added to the sidewalks on one block of East 1st Street, one block of West 2nd Street, and on the sidewalks around the Old Post Office Playhouse community theater. By the end of calendar year 2013, City staff will be posting a Request for Qualifications for a consultant to complete the overall design for the Downtown Streetscape Plan. The City expects to have a design plan, cost estimate, and phased implementation plan completed during 2014 for the complete Downtown Streetscape Plan. Green Challenge The City is a recognized leader in terms of going green by virtue of receiving the highest award of the NC League of Municipalities for being at an Advanced level in the organization’s Green Challenge, with the award of two state grants which funded energy efficiency projects at city facilities, by offering a Rebate Program to Commercial and Industrial electric customers to make energy efficient lighting improvements to their facilities and by providing peak-shaving and standby generators at eight industrial customer sites. Awards The Government Finance Officers Association (GFOA) awarded a Certificate of Achievement for Excellence in Financial Reporting to the City of Newton for its Comprehensive Annual Financial Report (CAFR) for the fiscal year

- 11 -
ended June 30, 2012. This marked the twenty-eighth consecutive year that the City has achieved this prestigious award. In order to be awarded a Certificate of Achievement, a government unit must publish an easily readable and efficiently organized Comprehensive Annual Financial Report that satisfy both generally accepted accounting principles and applicable legal requirements. A Certificate of Achievement is valid for a period of one year only. We believe that our current CAFR continues to meet the Certificate of Achievement Program's requirements, and we are submitting it to the GFOA to determine its eligibility for another certificate. The Catawba County Historical Association (CCHA) awarded the City of Newton with the Becky Hart Preservation Award. This award was based on the City’s efforts on obtaining the Newton Downtown Historic District’s listing in the National Register of Historic Places as well as the City’s assistance with electrical work within the Museum of History. This is the first time the CCHA has presented the Becky Hart Preservation Award to a community instead of an individual. The City has earned the national honor of being named a Tree City USA community for its commitment to urban forestry for the second consecutive year by the Arbor Day Foundation, the nation’s largest nonprofit organization dedicated to planting trees. The City was recognized by ElectriCities for the third consecutive year for five Public Power Awards of Excellence in the following areas: Competitive Business Environment, Energy Efficiency, Financial Stability, Legislative Involvement and Service Excellence. For the eleventh consecutive year, the City has earned the Area Wide Optimization Program Award (AWOP) presented by the North Carolina Department of Environment and Natural Resources (NCDENR). The City was also the recipient of awards that are indicative of safety for our citizens and employees. Public Utilities (Water and Sewer, Water Treatment Plant and Electric) and Public Works (Administration, Garage, Street and Sanitation) earned the Silver Safety Award. The Police Department and Wastewater Treatment Plant earned the Gold Safety Award for the second consecutive year and the Parks and Recreation Department earned the Gold Safety Award for the first time. These awards were presented from the N.C. Department of Labor. Acknowledgements The preparation of this report could not have been accomplished without the

- 12 -
efficient and dedicated efforts of the City of Newton Finance Department and our independent auditors, Martin Starnes and Associates, CPAs, P.A. We wish to express our appreciation to all who assisted and contributed to the preparation of this report. In closing, we would like to express our appreciation to the Mayor and City Council for their leadership, interest, and unfailing support for maintaining the highest standards of professionalism in the management of the City of Newton’s finances. Respectfully submitted,
E. Todd Clark Serina T. Hinson City Manager Finance Director

- 13 -

CIT
Y O
F N
EW
TON
OR
GA
NIZ
ATIO
NA
L C
HA
RT
IND
EPEN
DEN
T A
UD
ITO
RS
PUB
LIC
WO
RK
S &
U
TILI
TIES
FIN
AN
CE
PAR
KS
&
REC
REA
TIO
N
MAY
OR
&
CIT
Y C
OU
NC
IL
INFO
RM
ATIO
N
SYST
EMS
CIT
Y M
AN
AG
ER
POLI
CE
FIR
E
PLA
NN
ING
CIT
Y A
TTO
RN
EY
HU
MA
N
RES
OU
RC
ES
CIT
IZEN
S O
F N
EWTO
N
AD
MIN
ISTR
ATIO
N
ASS
ISTA
NT
CIT
Y M
AN
AG
ER
- 14 -

CITY OF NEWTON, NORTH CAROLINA
LIST OF PRINCIPAL OFFICIALS
CITY COUNCIL
ANNE P. STEDMAN
Mayor
WAYNE DELLINGER WES WEAVER H. TOM ROWE
MARY BESS LAWING BILL LUTZ ROBERT C. ABERNETHY JR.
Mayor Pro Tem
- 15 -

CITY OF NEWTON, NORTH CAROLINA
LIST OF PRINCIPAL OFFICIALS
CITY ADMINISTRATION
E. TODD CLARK
City Manager
DONALD G. BROWN II KEVIN L. YODER
Police Chief SEAN A. HOVIS Fire Chief
Assistant City Manager
SERINA T. HINSON TERESA B. LAFFON
Finance Director AMY S. FALOWSKI Human Resources Director
City Clerk
WILCE MARTIN SANDRA A. WATERS
Public Works/Utilities Director JASON CLAY Parks and Recreation Director
Information Systems Director
JOHN CILLEY IV
City Attorney
- 16 -
FINANCIAL SECTION
• Independent Auditor’s Report • Management’s Discussion and
Analysis
• Basic Financial Statements
• Notes to the Financial Statements
• Required Supplementary
Information
• Combining, Individual Fund Financial Statements and Schedules


730 13th Avenue Drive SE ♦ Hickory, North Carolina 28602 ♦ Phone 828-327-2727 ♦ Fax 828-328-2324 13 South Center Street ♦ Taylorsville, North Carolina 28681 ♦ Phone 828-632-9025 ♦ Fax 828-632-9085
Toll Free Both Locations 1-800-948-0585 ♦ Website: www.martinstarnes.com
Independent Auditor’s Report To the Honorable Mayor and Members of the City Council City of Newton, North Carolina
Report on the Financial Statements
We have audited the accompanying financial statements of the governmental activities, the business-type activities, each major fund, and the aggregate remaining fund information of the City of Newton, North Carolina, as of and for the year ended June 30, 2013, and the related notes to the financial statements, which collectively comprise the City’s basic financial statements as listed in the table of contents.
Management’s Responsibility for the Financial Statements
Management is responsible for the preparation and fair presentation of these financial statements in accordance with accounting principles generally accepted in the United States of America; this includes the design, implementation, and maintenance of internal control relevant to the preparation and fair presentation of financial statements that are free from material misstatement, whether due to fraud or error.
Auditor’s Responsibility
Our responsibility is to express opinions on these financial statements based on our audit. We conducted our audit in accordance with auditing standards generally accepted in the United States of America and the standards applicable to financial audits contained in Government Auditing Standards, issued by the Comptroller General of the United States. Those standards require that we plan and perform the audit to obtain reasonable assurance about whether the financial statements are free from material misstatement.
An audit involves performing procedures to obtain audit evidence about the amounts and disclosures in the financial statements. The procedures selected depend on the auditor’s judgment, including the assessment of the risks of material misstatement of the financial statements, whether due to fraud or error. In making those risk assessments, the auditor considers internal control relevant to the entity’s preparation and fair presentation of the financial statements in order to design audit procedures
- 17 -

that are appropriate in the circumstances, but not for the purpose of expressing an opinion on the effectiveness of the entity’s internal control. Accordingly, we express no such opinion. An audit also includes evaluating the appropriateness of accounting policies used and the reasonableness of significant accounting estimates made by management, as well as evaluating the overall presentation of the financial statements.
We believe that the audit evidence we have obtained is sufficient and appropriate to provide a basis for our audit opinions.
Opinions
In our opinion, the financial statements referred to above present fairly, in all material respects, the respective financial position of the governmental activities, the business-type activities, each major fund, and the aggregate remaining fund information of the City of Newton, North Carolina, as of June 30, 2013, and the respective changes in financial position and, where applicable, cash flows thereof and the respective budgetary comparison for the General Fund for the year then ended in accordance with accounting principles generally accepted in the United States of America.
Other Matters
Required Supplementary Information
Accounting principles generally accepted in the United States of America require that the Management’s Discussion and Analysis, the Law Enforcement Officers’ Special Separation Allowance, and the Other Post-Employment Benefits’ Schedules of Funding Progress and Schedules of Employer Contributions, be presented to supplement the basic financial statements. Such information, although not a part of the basic financial statements, is required by the Governmental Accounting Standards Board who considers it to be an essential part of financial reporting for placing the basic financial statements in an appropriate operational, economic, or historical context. We have applied certain limited procedures to the required supplementary information in accordance with auditing standards generally accepted in the United States of America, which consisted of inquiries of management about the methods of preparing the information and comparing the information for consistency with management’s responses to our inquiries, the basic financial statements, and other knowledge we obtained during our audit of the basic financial statements. We do not express an opinion or provide any assurance on the information because the limited procedures do not provide us with sufficient evidence to express an opinion or provide any assurance.
Supplementary and Other Information
Our audit was conducted for the purpose of forming opinions on the financial statements that collectively comprise the City of Newton’s basic financial statements. The introductory information, combining and individual fund financial statements, budget and actual schedules, supplemental ad valorem tax schedules, and statistical tables are presented for purposes of additional analysis and are not a required part of the basic financial statements.
- 18 -

The combining and individual fund financial statements, budget and actual schedules, and supplemental ad valorem tax schedules are the responsibility of management and were derived from, and relate directly to, the underlying accounting and other records used to prepare the basic financial statements. Such information has been subjected to the auditing procedures applied in the audit of the basic financial statements and certain additional procedures; including comparing and reconciling such information directly to the underlying accounting and other records used to prepare the basic financial statements or to the basic financial statements themselves, and other additional procedures in accordance with auditing standards generally accepted in the United States of America. In our opinion, the combining and individual fund financial statements, budget and actual schedules, and supplemental ad valorem tax schedules are fairly stated, in all material respects, in relation to the basic financial statements as a whole.
The introductory information and the statistical tables have not been subjected to the auditing procedures applied in the audit of basic financial statements; and accordingly, we do not express an opinion or provide assurance on them.
Other Reporting Required by Government Auditing Standards
In accordance with Government Auditing Standards, we have also issued our report dated October 1, 2013 on our consideration of the City of Newton’s internal control over financial reporting and on our tests of its compliance with certain provisions of laws, regulations, contracts, grant agreements, and other matters. The purpose of that report is to describe the scope of our testing of internal control over financial reporting and compliance and the results of that testing, and not to provide an opinion on internal control over financial reporting or on compliance. That report is an integral part of an audit performed in accordance with Government Auditing Standards in considering the City of Newton’s internal control over financial reporting and compliance.
Martin Starnes & Associates, CPAs, P.A. Hickory, North Carolina October 1, 2013
- 19 -


Management’s Discussion and Analysis As management of the City of Newton, we offer readers of the City of Newton’s financial statements this narrative overview and analysis of the financial activities of the City of Newton for the fiscal year ended June 30, 2013. We encourage readers to read the information presented here in conjunction with additional information that we have furnished in the City’s financial statements which follow this narrative. Financial Highlights • The assets of the City of Newton exceeded its liabilities and deferred inflows of
resources at the close of the fiscal year by $49,113,332 (net position). Of this amount, $8,865,622 (unrestricted net position) may be used to meet the City’s ongoing obligations to citizens and creditors.
• The government’s total net position increased by $1,491,860 due to increases in both governmental activities and business-type activities net position.
• As of the close of the current fiscal year, the City of Newton’s governmental funds reported combined ending fund balances of $5,450,989 with a net change of ($381,202) in fund balance. Approximately 49.36% of this total amount, or $2,690,429, is non-spendable or restricted.
• At the end of the current fiscal year, unassigned fund balance for the General Fund was $2,636,680, or 21.96% of total General Fund expenditures and transfers out for the fiscal year.
• The City of Newton’s total debt decreased by $323,300, or 1.5%, which includes unfunded law enforcement officers’ pension liability, other post-retirement benefits, and compensated absences liabilities required to be included in this report by GASB Statement 34. The City’s total indebtedness is $21,481,606.
• The City’s legal debt limit is $86,684,391 (8% of assessed valuation), and the City’s legal debt margin is $66,218,862. The total legal indebtedness of the City is $20,465,529, which represents 1.89% of assessed valuation.
Overview of the Financial Statements This discussion and analysis are intended to serve as an introduction to the City of Newton’s basic financial statements. The City’s basic financial statements consist of three components: 1) government-wide financial statements, 2) fund financial statements, and 3) notes to the financial statements (see Figure 1). The basic financial statements present two different views of the City through the use of government-wide statements and fund financial statements. In addition to the basic financial statements, this report contains other supplemental information that will enhance the reader’s understanding of the financial condition of the City of Newton.
- 20 -

Required Components of Annual Financial Report
Figure 1
Summary Detail
Basic Financial Statements The first two statements (Exhibits A and B) in the basic financial statements are the Government-Wide Financial Statements. They provide both short and long-term information about the City’s financial status. The next statements (Exhibits C through I) are Fund Financial Statements. These statements focus on the activities of the individual parts of the City’s government. These statements provide more detail than the government-wide statements. There are three parts to the fund financial statements: 1) the governmental funds statements, 2) the budgetary comparison statements, and 3) the proprietary fund statements. The next section of the basic financial statements is the notes. The Notes to the Financial Statements explain in detail some of the data contained in those statements. After the notes, supplemental information is provided to show details about the City’s individual funds. Budgetary information required by the General Statutes also can be found in this part of the statements.
Management’s Discussion and
Analysis
Basic Financial
Statements
Government-Wide Financial
Statements
Fund Financial
Statements
Notes to the Financial
Statements
- 21 -

Government-Wide Financial Statements The government-wide financial statements are designed to provide the reader with a broad overview of the City’s finances, similar in format to a financial statement of a private-sector business. The government-wide statements provide short and long-term information about the City’s financial status as a whole. The two government-wide statements report the City’s net position and how it has changed. Net position is the difference between the City’s total assets and total liabilities and deferred inflows of resources. Measuring net position is one way to gauge the City’s financial condition. The government-wide statements are divided into two categories: 1) governmental activities and 2) business-type activities. The governmental activities include most of the City’s basic services such as public safety, parks and recreation, and general administration. Property taxes and Federal and State grant funds finance most of these activities. The business-type activities are those that the City charges customers to provide. These include the water, wastewater, and electric utility services offered by the City of Newton. The government-wide financial statements are on Exhibits A and B of this report. Fund Financial Statements The fund financial statements (see Figure 1) provide a more detailed look at the City’s most significant activities. A fund is a grouping of related accounts that is used to maintain control over resources that have been segregated for specific activities or objectives. The City of Newton, like all other governmental entities in North Carolina, uses fund accounting to ensure and reflect compliance (or non-compliance) with finance-related legal requirements, such as the General Statutes or the City’s budget ordinance. All of the funds of the City of Newton can be divided into two categories: governmental funds and proprietary funds. Governmental Funds. Governmental funds are used to account for those functions reported as governmental activities in the government-wide financial statements. Most of the City’s basic services are accounted for in governmental funds. These funds focus on how assets can readily be converted into cash flow in and out and what monies are left at year-end that will be available for spending in the next year. Governmental funds are reported using an accounting method called modified accrual accounting which provides a short-term spending focus. As a result, the governmental fund financial statements give the reader a detailed short-term view that helps him or her determine if there are more or less financial resources available to finance the City’s programs. The relationship between government activities (reported in the Statement of Net Position and the Statement of Activities) and governmental funds is described in a reconciliation that is a part of the fund financial statements.
- 22 -

The City of Newton adopts an annual budget for its General Fund as required by the General Statutes. The budget is a legally adopted document that incorporates input from the citizens of the City, the management of the City, and the decisions of the City Council about which services to provide and how to pay for them. It also authorizes the City to obtain funds from identified sources to finance these current period activities. The budgetary statement provided for the General Fund demonstrates how well the City complied with the budget ordinance and whether or not the City succeeded in providing the services as planned when the budget was adopted. The budgetary comparison statement uses the budgetary basis of accounting and is presented using the same format, language, and classifications as the legal budget document. The statement shows four columns: 1) the original budget as adopted by the Board; 2) the final budget as amended by the Board; 3) the actual resources, charges to appropriations, and ending balances in the General Fund; and 4) the difference or variance between the final budget and the actual resources and charges. Proprietary Funds. The City of Newton has two different kinds of proprietary funds: enterprise funds and an Internal Service Fund. Enterprise funds are used to report the same functions presented as business-type activities in the government-wide financial statements. The City of Newton uses enterprise funds to account for its water and wastewater activities and for its electric operations. These funds are the same as those functions shown in the business-type activities in the Statement of Net Position and the Statement of Activities. Internal service funds are an accounting device used to accumulate and allocate costs internally among the functions of the City of Newton. The City uses an Internal Service Fund to account for one activity - health insurance. Because this operation benefits predominantly governmental rather than business-type activities, the Internal Service Fund has been included within the governmental activities in the government-wide financial statements. Notes to the Financial Statements. The notes provide additional information that is essential to a full understanding of the data provided in the government-wide and fund financial statements. The Notes to the Financial Statements are on pages 41-76 of this report. Other Information. In addition to the basic financial statements and accompanying notes, this report includes certain required supplementary information concerning the City of Newton’s progress in funding its obligation to provide pension benefits and other post-employment benefits to its employees. Required supplementary information can be found beginning on page 77 of this report. The individual and combining statements of the General Fund, the other governmental funds, the enterprise funds, and Internal Service Fund are presented immediately following the required supplementary information on pensions. Combining and individual fund statements and schedules can be found on pages 79-99 of this report. Interdependence with Other Entities. The City depends on financial resources flowing from, or associated with, the State of North Carolina. Because of this dependency, the City is subject to changes in specific flows of intergovernmental revenues based on modifications to State laws and State appropriations.
- 23 -

Government-Wide Financial Analysis
City of Newton’s Net Position
Figure 2
Government al Act ivit ies Business-Type Act ivit ies Tot al
2013 2012 2013 2012 2013 2012
Asset s:Current and other assets 7,132,689$ 7,146,397$ 9,924,630$ 9,481,760$ 17,057,319$ 16,628,157$ Capital assets 11,451,942 11,133,251 44,339,749 44,092,531 55,791,691 55,225,782
Total assets 18,584,631 18,279,648 54,264,379 53,574,291 72,849,010 71,853,939
Liabilit ies:Long-term liabilities 3,731,855 4,070,219 14,657,653 14,684,279 18,389,508 18,754,498 Other liabilities 1,494,041 1,579,758 3,841,023 3,898,211 5,335,064 5,477,969
Total liabilities 5,225,896 5,649,977 18,498,676 18,582,490 23,724,572 24,232,467
Deferred Inflowsof Resources:
Prepaid taxes 11,106 - - - 11,106 -
Total liabilities and deferredinflows of resources 5,237,002 5,649,977 18,498,676 18,582,490 23,735,678 24,232,467
Net Posit ion:Net investmentin capital assets 7,819,537 7,704,679 30,063,136 30,854,510 37,882,673 38,559,189
Restricted 2,365,037 2,141,848 - - 2,365,037 2,141,848 Unrestricted 3,163,055 2,783,144 5,702,567 4,137,291 8,865,622 6,920,435
Total net position 13,347,629$ 12,629,671$ 35,765,703$ 34,991,801$ 49,113,332$ 47,621,472$
As noted earlier, net position may serve over time as one useful indicator of a government’s financial condition. The assets of the City of Newton exceeded liabilities and deferred inflows by $49,113,332 as of June 30, 2013. The City’s net position increased by $1,491,860 for the fiscal year ended June 30, 2013. However, the largest portion is $37,882,673, or 77.13%, which reflects the City’s net investment in capital assets (e.g., land, buildings, machinery, and equipment). The City of Newton uses these capital assets to provide services to citizens; consequently, these assets are not available for future spending. Although the City’s net investment in capital assets is reported net of the outstanding related debt, the resources needed to repay that debt must be provided by other sources, since the capital assets cannot be used to liquidate these liabilities. An additional portion of the City of Newton’s net position, $2,365,037 or 4.82%, represents resources that are subject to external restrictions on how they may be used. The remaining balance of $8,865,622 is unrestricted. Several particular aspects of the City’s financial operations influenced the total unrestricted governmental net position: • Increase of $181,956 in refuse collection revenues as a result of a $3 rate increase. • Tax revenues were up slightly by $109,470, or 2%. • Controlled spending also contributed to the increase in the net position.
- 24 -

City of Newton’s Changes in Net Position
Figure 3
2013 2012
Government al Business-Type Government al Business-TypeAct ivit ies Act ivit ies Tot al Act ivit ies Act ivit ies Tot al
Revenues:Program revenues:Charges for services 1,203,659$ 20,539,813$ 21,743,472$ 972,137$ 19,772,074$ 20,744,211$ Operating grants and contributions 486,590 161 486,751 482,714 - 482,714 Capital grants and contributions 36,089 23,667 59,756 1,364,849 1,039,758 2,404,607
General revenues:Property taxes 5,201,384 - 5,201,384 5,091,914 - 5,091,914 Other taxes 4,143,201 297,967 4,441,168 4,173,402 277,993 4,451,395
Unrestricted investmentearnings 11,004 6,490 17,494 7,498 7,177 14,675
Total revenues 11,081,927 20,868,098 31,950,025 12,092,514 21,097,002 33,189,516
Expenses:General government 1,016,494 - 1,016,494 1,313,202 - 1,313,202 Public safety 1,047,081 - 1,047,081 4,917,591 - 4,917,591 Transportation 1,006,970 - 1,006,970 954,979 - 954,979 Environmental protection 5,124,114 - 5,124,114 938,935 - 938,935 Culture and recreation 2,076,132 - 2,076,132 2,089,168 - 2,089,168 Economic development 1,000 - 1,000 - - - Operations 19,657,184 19,657,184 - 19,017,509 19,017,509 Interest on long-term debt:Governmental 102,178 - 102,178 151,154 - 151,154 Water and wastewater - 257,808 257,808 - 336,843 336,843 Electric - 169,204 169,204 - 230,050 230,050
Total expenses 10,373,969 20,084,196 30,458,165 10,365,029 19,584,402 29,949,431
Increase in net positionbefore transfers 707,958 783,902 1,491,860 1,727,485 1,512,600 3,240,085
Transfers 10,000 (10,000) - 3,350 (3,350) -
Increase in net position 717,958 773,902 1,491,860 1,730,835 1,509,250 3,240,085
Net Posit ion:Beginning of year - July 1 12,629,671 34,991,801 47,621,472 10,898,836 33,482,551 44,381,387
End of year - June 30 13,347,629$ 35,765,703$ 49,113,332$ 12,629,671$ 34,991,801$ 47,621,472$
- 25 -

Governmental Activities. Governmental activities increased the City’s net position by $717,958, accounting for a 48.13% increase in the net position of the City of Newton. Key elements of this increase are as follows: • Increase of $181,956 in refuse collection revenues as a result of a $3 rate increase. • Tax revenues were up slightly by $109,470, or 2%. • Controlled spending also contributed to the increase in the net position.
Property Taxes5,201,384
Local Option Sales Tax
2,595,442
Grants and Contributions
522,679
Other Taxes788,672
Charges for Services1,203,659
Franchise Tax759,087
Investment Earnings11,004
Revenues by Source - Governmental Activities
- 26 -

Business-Type Activities. Business-type activities increased the City of Newton’s net position by $773,902, accounting for a 51.87% increase of the total growth in the net position of the City of Newton. Key elements of this increase are as follows: • The City recognized a change in net position of $773,902 in the proprietary funds,
primarily due to controlled spending within both the Water and Wastewater Fund and the Electric Fund.
• A 6.2% rate increase was adopted to offset an increase in purchase power costs in the Electric Fund.
Charges for Service20,539,813
Investment Earnings6,490
Sales Tax297,967
Grants and Contributions
23,828
Revenues by Source - Business-Type Activities
Financial Analysis of the City’s Funds
As noted earlier, the City of Newton uses fund accounting to ensure and demonstrate compliance with finance-related legal requirements. Governmental Funds. The focus of the City of Newton’s governmental funds is to provide information on near-term inflows, outflows, and balances of usable resources. Such information is useful in assessing the City of Newton’s financing requirements. Specifically, available fund balance can be a useful measure of a government’s net resources available for spending at the end of the fiscal year.
- 27 -

The General Fund is the chief operating fund of the City of Newton. At the end of the current fiscal year, available fund balance of the General Fund was $4,426,109, while total fund balance was $5,223,961. As a measure of the General Fund’s liquidity, it may be useful to compare both available fund balance and total fund balance to total fund expenditures. Available fund balance represents 36.86% of the total General Fund expenditures and transfers out, while total fund balance represents 43.50% of that same amount. At June 30, 2013, the governmental funds of the City of Newton reported a combined fund balance of $5,450,989 with a net decrease in fund balance of $381,202. Included in this change is a decrease of $516,448 in fund balance in the General Fund and increases of $135,246 in fund balance in the Special Revenue Fund and the Capital Project Fund. Key factors in these changes are as follows: • Ad valorem taxes increased by $90,347 above the prior fiscal year. • Sales and services increased by $201,328 above the prior year primarily due to a $3
rate increase on refuse collection fees. • The $516,448 decrease in fund balance in the General Fund is mainly due to
utilization of fund balance for one-time capital needs while still remaining above the 21% assigned fund balance that the City utilizes as a benchmark.
General Fund Budgetary Highlights. During the fiscal year, the City revised the budget on several occasions. Generally, budget amendments fall into one of three categories: 1) amendments made to adjust the estimates that are used to prepare the original budget ordinance once exact information is available; 2) amendments made to recognize new funding amounts from external sources, such as Federal and State grants; and 3) increases in appropriations that become necessary to maintain services.
Revenues were less than budgeted amounts primarily because the rate of growth on retail sales which impacts the City’s Local Option Sales Tax was at a slower rate than forecasted. General Fund expenditures were under budget by $1,180,847, a variance of 9.2% from the final budget. All departments were conservative in their spending due to the slow recovering economy. The most significant savings were realized due to deferred capital projects. Proprietary Funds. The City of Newton’s proprietary funds provide the same type of information found in the government-wide statements but in more detail. Unrestricted net position of the Water and Wastewater Fund at the end of the fiscal year amounted to $1,842,484 and for the Electric Fund amounted to $3,670,262. The total change in net position for the Water and Wastewater Fund and the Electric Fund was ($295,905) and $982,197, respectively. The change in net position in the Water and Wastewater Fund is a result of revenues received is less than projected due to little to no growth in water and wastewater services provided. The change in net position in the Electric Fund is a result of controlled spending.
- 28 -

Capital Asset and Debt Administration Capital Assets. The City of Newton’s investment in capital assets for its governmental and business-type activities as of June 30, 2013 totals $55,791,691 (net of accumulated depreciation). These assets include buildings and system improvements, land, machinery and equipment, park facilities, roads, highways, and bridges. Major capital asset transactions during the fiscal year included the following: • Various equipment and vehicle replacement purchases for governmental and
business-type activities of $753,242 and $614,237, respectively. • Completed several wastewater infrastructure projects with total costs of $517,567
to replace deteriorated infrastructure. • Construction related to numerous water infrastructure projects were completed
with total costs of $1,279,901 in an effort to provide better water flows and water pressure to those specific areas.
• Continuation of conversion of the electrical system from 4KV to 24KV with total costs on the final phase of $587,945 with $145,273 of construction still in progress.
• Construction in progress for governmental-type activities of $388,297, largely in part due to a stormwater project.
• Construction in progress for business-type activities includes $548,184 for water and wastewater infrastructure improvements and $500,372 for electric improvements which includes $355,099 for generator modifications.
Additional information on the City’s capital assets can be found beginning on page 40 of this report.
City of Newton’s Capital Assets (net of depreciation)
Figure 4
Government al Act ivit ies Business-Type Act ivit ies Tot al
2013 2012 2013 2012 2013 2012
Land 2,007,259$ 2,007,259$ 215,332$ 215,332$ 2,222,591$ 2,222,591$ Buildings and improvements 2,946,427 2,925,630 7,350,403 7,889,160 10,296,830 10,814,790 Distribution systems - - 32,520,799 29,864,102 32,520,799 29,864,102 Public domain infrastructure 3,592,981 3,734,652 - - 3,592,981 3,734,652 Equipment 1,085,332 1,237,925 2,164,813 2,288,276 3,250,145 3,526,201 Vehicles 1,431,646 1,136,881 1,039,846 651,498 2,471,492 1,788,379 Construction in progress 388,297 90,904 1,048,556 3,184,163 1,436,853 3,275,067
Total 11,451,942$ 11,133,251$ 44,339,749$ 44,092,531$ 55,791,691$ 55,225,782$
Long-Term Debt. Gross debt obligations of the City are $20,465,530 as of June 30, 2013, which solely consists of notes payable.
- 29 -

City of Newton’s Outstanding Debt
Figure 5
Government al Act ivit ies Business-Type Act ivit ies Tot al
2013 2012 2013 2012 2013 2012
Accrued law enforcementofficers' unfundedretirement contribution 316,570$ 304,341$ -$ -$ 316,570$ 304,341$
Compensated absences 416,569 414,715 104,249 116,870 520,818 531,585 Other post-employmentbenefits 135,928 130,332 42,760 41,000 178,688 171,332
Loans payable 3,894,050 4,329,031 16,571,480 16,468,617 20,465,530 20,797,648
Total 4,763,117$ 5,178,419$ 16,718,489$ 16,626,487$ 21,481,606$ 21,804,906$
The City of Newton’s total debt decreased by $323,300, or 1.5%, due to $2,725,153 reduction of existing debt due to principal payments and new debt acquired during the past fiscal year in the amount of $2,393,035. New debt resulted from installment purchase agreements for equipment; replacement vehicles; and stormwater, water, wastewater, and electric infrastructure. North Carolina General Statutes limit the amount of general obligation debt that a unit of government can issue to 8% of the total assessed value of taxable property located within that government’s boundaries. The legal debt margin for the City of Newton is $66,218,862. Additional information regarding the City of Newton’s long-term debt can be found beginning on page 67 of this report. Economic Factors and Next Year’s Budgets and Rates The City of Newton continuously strives to provide a high level of municipal service to our citizens and utility customers. Management has taken great care to evaluate a number of conditions and variables when developing the Fiscal Year 2013-2014 budget. These include a review of local and national economic conditions, forecasted economic changes over the course of the next fiscal year, inflation, and intergovernmental revenues. Unfortunately, forecasts concerning economic growth in the U.S. and the State of North Carolina do not show signs of significant recovery over the next twelve months.
- 30 -

Economic Factors • New Jobs/Property Tax Base
o WJB Automotive, Inc. will bring 50 new jobs to Newton and add an investment of $5 million in inventory and equipment.
o United Franchise Group will be investing $750,000 in a vacant distribution center and creating 47 new jobs.
o Dollar General will be investing $1.3 million in two new stores in Newton. o Carolina Vines Wine Bar and Turning Point Services will be adding
approximately $320,000 and $180,000, respectively, to the tax base. • Unemployment – the County, State and national unemployment rates as of June 30,
2013 were 10.8%, 8.8%, and 7.6%, respectively. A year earlier, June 30, 2012, the rates were 11.3%, 9.5%, and 8.2%, respectively. North Carolina seems to be minimizing the unemployment gap at a faster rate than at the national level.
Budget Highlights for the Fiscal Year Ending June 30, 2014
Governmental Activities. The Fiscal Year 2013-2014 budget was balanced without a property tax rate increase and without service reductions. The budget maintains the City’s high level of services as in prior years at a prudent cost to our citizens and utility customers. The property tax rate remains at 48 cents per $100 of assessed value. The City’s residential refuse collection fee will increase by $2 resulting in additional revenues of $111,500. The Fiscal Year 2013-2014 includes $1,173,000 for proceeds from borrowed funds for capital improvements approved as part of the 5-Year Capital Improvement Plan. Revenue from other sources in the General Fund is expected to remain at or slightly above the same level as in Fiscal Year 2012-2013. Business-Type Activities. The water and wastewater rates will remain unchanged for Fiscal Year 2013-2014. With the retirement of a portion of the City’s total indebtedness during recent prior fiscal years, the City will be able to utilize the reduction in debt service to offset debt service in Fiscal Year 2013-2014. The budget includes $1,445,200 in capital improvement projects which consists mainly of water and wastewater infrastructure improvements. Electric rates were increased by 5.6% to residential, commercial, coincident peak, and industrial customers, to cover a 6.3% increase in wholesale rates from the North Carolina Municipal Power Agency. The increase in wholesale power cost is a result of lower energy demands from municipal agencies and sales on the open market. Also increases in wholesale energy costs are related to capital improvement expenses associated with the operation and maintenance of the Catawba Nuclear Station. The budget includes $1,184,300 in capital improvement projects mainly consist of electric infrastructure improvements. Requests for Information
This report is designed to provide an overview of the City’s finances for those with an interest in this area. Questions concerning any information found in this report or requests for additional information should be directed to the Finance Director, City of Newton, P.O. Box 550, Newton, North Carolina 28658. You can also call (828) 695-4258, visit our website www.newtonnc.gov, or send an email to [email protected] for more information.
- 31 -
BASIC FINANCIAL STATEMENTS
The Basic Financial Statements present a condensed overview of the financial position and results of operations of the City as a whole. They also serve as an introduction to the more detailed statements and schedules that follow.


The accompanying notes are an integral part of the financial statements.
Exhibit A
Governmental Business-TypeActivities Activities Total
Assets:Current assets:Cash and short-term investments 4,229,384$ 4,470,485$ 8,699,869$ Taxes receivable, net 650,693 - 650,693 Accounts receivable, net 540,698 1,978,044 2,518,742 Interest receivable, net 631 181 812 Due from other governments 74,789 121,178 195,967 Internal balances (189,821) 189,821 - Inventories 62,836 555,135 617,971 Restricted cash and cash equivalents 1,763,479 2,609,786 4,373,265
Total current assets 7,132,689 9,924,630 17,057,319 Capital assets:Land, non-depreciable assets, and construction in progress 2,395,556 1,263,888 3,659,444 Other capital assets, net of depreciation 9,056,386 43,075,861 52,132,247
Total capital assets 11,451,942 44,339,749 55,791,691 Total assets 18,584,631 54,264,379 72,849,010
Liabilities: Current liabilities: Accounts payable and other current liabilities 462,779 1,428,735 1,891,514 Due to other governments - 38,936 38,936 Unearned revenue - 1,920 1,920 Payable from restricted assets - 310,596 310,596 Compensated absences 263,015 102,233 365,248 Current portion of long-term liabilities 768,247 1,958,603 2,726,850
Total current liabilities 1,494,041 3,841,023 5,335,064 Long-term liabilities:Compensated absences, non-current 153,554 2,016 155,570 Unfunded pension obligation 316,570 - 316,570 Unfunded other post-employment benefits 135,928 42,760 178,688 Due in more than one year 3,125,803 14,612,877 17,738,680
Total long-term liabilities 3,731,855 14,657,653 18,389,508
Total liabilities 5,225,896 18,498,676 23,724,572
Deferred Inflows of Resources:Prepaid taxes 11,106 - 11,106
Net Position:Net investment in capital assets 7,819,537 30,063,136 37,882,673 Restricted for stabilization by State statute 862,380 - 862,380 Restricted for transportation 294,595 - 294,595 Restricted for cultural and recreational 1,206,328 - 1,206,328 Restricted for economic and physical development 1,734 - 1,734 Unrestricted 3,163,055 5,702,567 8,865,622
Total net position 13,347,629$ 35,765,703$ 49,113,332$
Primary Government
STATEMENT OF NET POSITIONJUNE 30, 2013
CITY OF NEWTON, NORTH CAROLINA
- 32 -
The
acc
ompanyi
ng n
otes
are
an inte
gra
l part
of
the
financi
al st
ate
men
ts.
Exh
ibit
B
Op
era
tin
g
Cap
ital
Ch
arg
es
Gra
nts
an
d G
ran
ts a
nd
Go
vern
men
tal
Bu
sin
ess
-Typ
eExp
en
ses
for
Serv
ices
Co
ntr
ibu
tio
ns
Co
ntr
ibu
tio
ns
Act
ivit
ies
Act
ivit
ies
To
tal
Pri
mary
Go
vern
men
t:G
overn
men
tal
Act
ivit
ies:
Gen
eral
gove
rnm
ent
1,0
16,4
94
$
273,7
57
$
9,9
97
$
-$
(732,7
40)
$
-
$
(732,7
40)
$
Tra
nsp
ort
atio
n1,0
47,0
81
2,1
04
388,4
01
-
(6
56,5
76)
-
(656,5
76)
Envi
ronm
enta
l pro
tect
ion
1,0
06,9
70
757,0
23
-
-
(2
49,9
47)
-
(249,9
47)
Public
saf
ety
5,1
24,1
14
102,2
31
86,8
27
-
(4,9
35,0
56)
-
(4
,935,0
56)
C
ult
ura
l an
d r
ecre
atio
n2,0
76,1
32
68,5
44
-
36,0
89
(1
,971,4
99)
-
(1
,971,4
99)
Ec
onom
ic a
nd p
hys
ical
dev
elopm
ent
1,0
00
-
1,3
65
-
365
-
365
Inte
rest
on long-t
erm
deb
t102,1
78
-
-
-
(102,1
78)
-
(102,1
78)
Tota
l gove
rnm
enta
l ac
tivi
ties
10,3
73,9
69
1,2
03,6
59
486,5
90
36,0
89
(8
,647,6
31)
-
(8
,647,6
31)
Bu
sin
ess
-Typ
e A
ctiv
itie
s:W
ater
and w
aste
wat
er6,2
79,2
11
6,0
10,5
19
-
13,5
37
-
(255,1
55)
(2
55,1
55)
Elec
tric
13,8
04,9
85
14,5
29,2
94
161
10,1
30
-
734,6
00
734,6
00
Tota
l busi
nes
s-ty
pe
acti
viti
es20,0
84,1
96
20,5
39,8
13
161
23,6
67
-
479,4
45
479,4
45
Tota
l pri
mar
y gove
rnm
ent
30,4
58,1
65
$
21,7
43,4
72
$
486,7
51
$
59,7
56
$
(8
,647,6
31)
479,4
45
(8,1
68,1
86)
Gen
era
l R
even
ues:
Tax
es:
Pr
oper
ty t
axes
5,2
01,3
84
-
5,2
01,3
84
Loca
l opti
on s
ales
tax
2,5
95,4
42
297,9
67
2,8
93,4
09
Fran
chis
e ta
x759,0
87
-
759,0
87
Oth
er t
axes
788,6
72
-
788,6
72
In
vest
men
t ea
rnin
gs,
unre
stri
cted
11,0
04
6,4
90
17,4
94
Tota
l gen
eral
rev
enues
9,3
55,5
89
304,4
57
9,6
60,0
46
Tra
nsf
ers
10,0
00
(1
0,0
00)
-
Tota
l gen
eral
rev
enues
and t
ransf
ers
9,3
65,5
89
294,4
57
9,6
60,0
46
Chan
ge
in n
et p
osi
tion
717,9
58
773,9
02
1,4
91,8
60
Net
Po
siti
on
:Beg
innin
g o
f ye
ar -
July
112,6
29,6
71
34,9
91,8
01
47,6
21,4
72
End o
f ye
ar -
June
30
13,3
47,6
29
$
35,7
65,7
03
$
49,1
13,3
32
$
Pro
gra
m R
even
ues
Pri
mary
Go
vern
men
t
Net
(Exp
en
se)
Reven
ue a
nd
Ch
an
ges
in N
et
Po
siti
on
CIT
Y O
F N
EW
TO
N, N
OR
TH
CA
RO
LIN
A
ST
AT
EM
EN
T O
F A
CT
IVIT
IES
FO
R T
HE Y
EA
R E
ND
ED
JU
NE 3
0, 2
01
3
- 33 -

The accompanying notes are an integral part of the financial statements.
Exhibit C
NonmajorMajor Funds Funds
OtherGeneral Governmental
Fund Funds TotalAssets:Cash and short-term investments 2,924,529$ 336,797$ 3,261,326$ Taxes receivable, net 650,693 - 650,693 Accounts receivable, net 540,698 - 540,698 Interest receivable 596 - 596 Due from other governments 72,625 2,164 74,789 Inventories 62,836 - 62,836 Restricted cash and cash equivalents 1,763,479 - 1,763,479
Total assets 6,015,456$ 338,961$ 6,354,417$
Liabilities:Accounts payable and other current liabilities 129,696$ 111,933$ 241,629$
Deferred Inflows of Resources:Unavailable revenue - property taxes 650,693 - 650,693 Prepaid taxes 11,106 - 11,106
Total deferred inflows of resources 661,799 - 661,799
Fund Balances:Non-spendable - inventory 62,836 - 62,836 Restricted - stabilization by State statute 735,016 127,364 862,380 Restricted 1,763,479 1,734 1,765,213 Committed - 97,930 97,930 Assigned 47,490 - 47,490 Unassigned 2,615,140 - 2,615,140
Total fund balances 5,223,961 227,028 5,450,989
Total liabilities, deferred inflows of resources, and fund balances 6,015,456$ 338,961$
Amounts reported for governmental activities in the Statement of Net Positionare different because:
Capital assets, net of accumulated depreciation, used in governmental activities are not current financial resources and, therefore, are not reported in the funds. 11,451,942
Liabilities for earned revenues considered deferred inflows of resources infund statements. 650,693
Internal service funds are used by management to charge the costs of certain activities,such as insurance, to individual funds. The assets and liabilities of the Internal Service Fund are included in governmental activities in the Statement of Net Position. 620,749
Long-term liabilities, compensated absences, unfunded pension obligations, accrued interest, and unfunded other post-employment benefits are not due and payable in the current period and, therefore, are not reported in the funds. (4,826,744)
Net position of governmental activities 13,347,629$
CITY OF NEWTON, NORTH CAROLINA
BALANCE SHEET - GOVERNMENTAL FUNDSJUNE 30, 2013
- 34 -

The accompanying notes are an integral part of the financial statements.
Exhibit D
NonmajorMajor Fund Funds
OtherGeneral Governmental
Fund Funds Total
Revenues:Ad valorem taxes 5,136,073$ -$ 5,136,073$ Other taxes and licenses 2,961,194 - 2,961,194 Unrestricted intergovernmental 1,182,007 - 1,182,007 Restricted intergovernmental 495,228 - 495,228 Permits and fees 120,130 - 120,130 Sales and services 869,564 - 869,564 Investment earnings 10,271 - 10,271 Other revenues 240,051 1,365 241,416
Total revenues 11,014,518 1,365 11,015,883
Expenditures:Current:General government 1,190,651 - 1,190,651 Transportation 1,106,278 - 1,106,278 Environmental protection 1,276,480 - 1,276,480 Public safety 4,942,898 - 4,942,898 Cultural and recreational 2,080,553 - 2,080,553 Economic and physical development - 1,000 1,000 Capital outlay - 251,314 251,314 Debt service:Principal retirement 878,663 - 878,663 Interest and fees 122,930 - 122,930
Total expenditures 11,598,453 252,314 11,850,767
Revenues over (under) expenditures (583,935) (250,949) (834,884)
Other Financing Sources (Uses):Issuance of debt 443,682 - 443,682 Transfers from other funds 34,611 410,806 445,417 Transfers to other funds (410,806) (24,611) (435,417)
Total other financing sources (uses) 67,487 386,195 453,682
Net change in fund balances (516,448) 135,246 (381,202)
Fund Balances:Beginning of year - July 1 5,724,128 91,782 5,815,910 Increase (decrease) in reserve for inventory 16,281 - 16,281
End of year - June 30 5,223,961$ 227,028$ 5,450,989$
CITY OF NEWTON, NORTH CAROLINA
STATEMENT OF REVENUES, EXPENDITURES, AND CHANGESIN FUND BALANCES - GOVERNMENTAL FUNDS
FOR THE YEAR ENDED JUNE 30, 2013
- 35 -
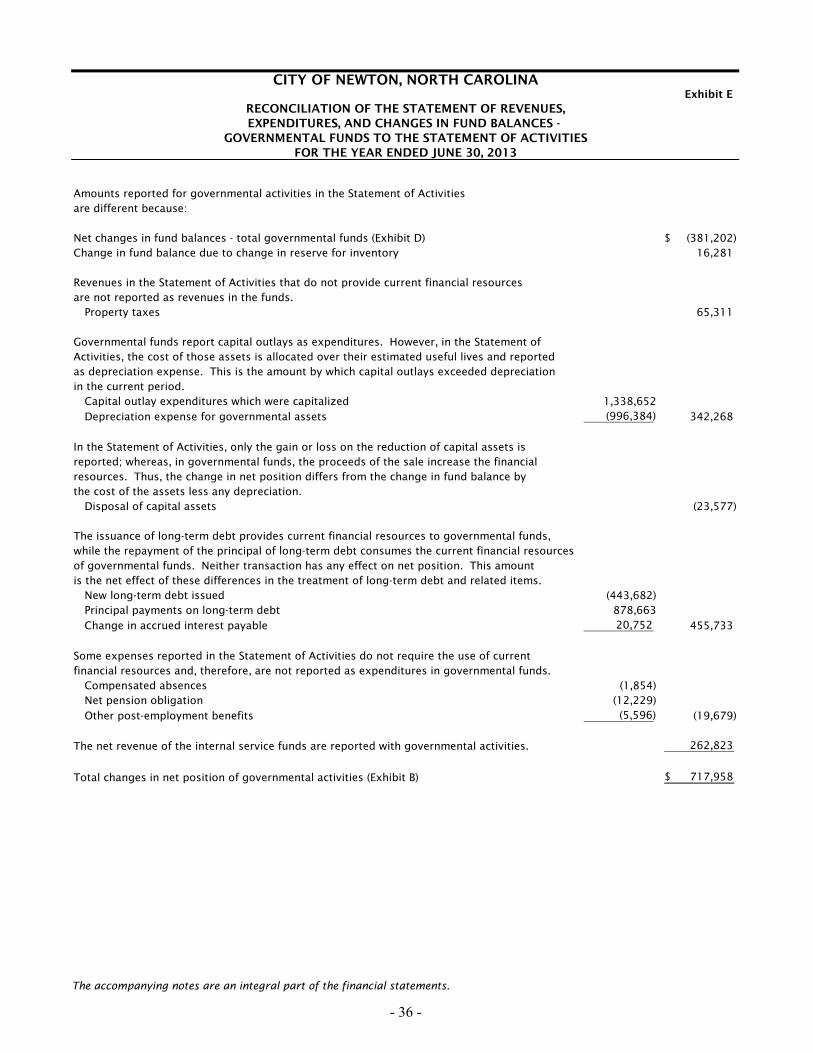
The accompanying notes are an integral part of the financial statements.
Exhibit E
Amounts reported for governmental activities in the Statement of Activitiesare different because:
Net changes in fund balances - total governmental funds (Exhibit D) (381,202)$ Change in fund balance due to change in reserve for inventory 16,281
Revenues in the Statement of Activities that do not provide current financial resourcesare not reported as revenues in the funds.
Property taxes 65,311
Governmental funds report capital outlays as expenditures. However, in the Statement ofActivities, the cost of those assets is allocated over their estimated useful lives and reportedas depreciation expense. This is the amount by which capital outlays exceeded depreciation in the current period.
Capital outlay expenditures which were capitalized 1,338,652
Depreciation expense for governmental assets (996,384) 342,268
In the Statement of Activities, only the gain or loss on the reduction of capital assets isreported; whereas, in governmental funds, the proceeds of the sale increase the financialresources. Thus, the change in net position differs from the change in fund balance bythe cost of the assets less any depreciation.
Disposal of capital assets (23,577)
The issuance of long-term debt provides current financial resources to governmental funds,while the repayment of the principal of long-term debt consumes the current financial resourcesof governmental funds. Neither transaction has any effect on net position. This amountis the net effect of these differences in the treatment of long-term debt and related items.
New long-term debt issued (443,682)Principal payments on long-term debt 878,663
Change in accrued interest payable 20,752 455,733
Some expenses reported in the Statement of Activities do not require the use of currentfinancial resources and, therefore, are not reported as expenditures in governmental funds.
Compensated absences (1,854)Net pension obligation (12,229)
Other post-employment benefits (5,596) (19,679)
The net revenue of the internal service funds are reported with governmental activities. 262,823
Total changes in net position of governmental activities (Exhibit B) 717,958$
CITY OF NEWTON, NORTH CAROLINA
RECONCILIATION OF THE STATEMENT OF REVENUES,EXPENDITURES, AND CHANGES IN FUND BALANCES -
GOVERNMENTAL FUNDS TO THE STATEMENT OF ACTIVITIESFOR THE YEAR ENDED JUNE 30, 2013
- 36 -

The accompanying notes are an integral part of the financial statements.
Exhibit F
Variance with
Final BudgetOriginal Final Actual Over/Under
Revenues:Ad valorem taxes 5,109,900$ 5,109,900$ 5,136,073$ 26,173$ Other taxes and licenses 3,192,050 3,192,050 2,961,194 (230,856) Unrestricted intergovernmental 1,233,250 1,233,250 1,182,007 (51,243) Restricted intergovernmental 427,000 427,000 495,228 68,228 Permits and fees 91,400 212,400 120,130 (92,270) Sales and services 839,350 839,350 869,564 30,214 Investment earnings 6,300 6,300 10,271 3,971
Other revenues 118,650 172,750 240,051 67,301
Total revenues 11,017,900 11,193,000 11,014,518 (178,482)
Expenditures:Current:General government 1,592,600 1,469,700 1,190,651 279,049 Transportation 1,099,200 1,167,150 1,106,278 60,872 Environmental protection 971,050 1,338,650 1,276,480 62,170 Public safety 5,258,250 5,446,050 4,942,898 503,152 Cultural and recreation 2,095,350 2,351,350 2,080,553 270,797 Debt service:Principal retirement 880,800 880,800 878,663 2,137
Interest and fees 125,600 125,600 122,930 2,670
Total expenditures 12,022,850 12,779,300 11,598,453 1,180,847
Revenues over (under) expenditures (1,004,950) (1,586,300) (583,935) 1,002,365
Other Financing Sources (Uses):Issuance of debt 608,200 608,200 443,682 (164,518) Transfers from other funds - 34,650 34,611 (39) Transfers to other funds - (410,850) (410,806) 44
Appropriated fund balance 396,750 1,354,300 - (1,354,300)
Total other financing sources (uses) 1,004,950 1,586,300 67,487 (1,518,813)
Net change in fund balance -$ -$ (516,448) (516,448)$
Fund Balance:Beginning of year - July 1 5,724,128
Increase (decrease) in reserve for inventory 16,281
End of year - June 30 5,223,961$
Budgeted Amounts
General Fund
CITY OF NEWTON, NORTH CAROLINA
GENERAL FUNDSTATEMENT OF REVENUES, EXPENDITURES, AND
CHANGES IN FUND BALANCES - BUDGET AND ACTUALFOR THE YEAR ENDED JUNE 30, 2013
- 37 -

The accompanying notes are an integral part of the financial statements.
Exhibit G
Water and Internal Wastewater Electric Service
Fund Fund Total Fund
Assets:Current assets: Cash and cash equivalents 1,493,090$ 2,977,395$ 4,470,485$ 968,058$ Accounts receivable, net 672,098 1,305,946 1,978,044 - Interest receivable 60 121 181 35 Due from other governments 55,002 66,176 121,178 - Inventories 102,493 452,642 555,135 - Restricted cash and cash equivalents 1,578,951 1,030,835 2,609,786 -
Total current assets 3,901,694 5,833,115 9,734,809 968,093
Capital assets:Non-depreciable capital assets 758,516 505,372 1,263,888 - Depreciable capital assets, net 32,361,401 10,714,460 43,075,861 -
Total capital assets, net 33,119,917 11,219,832 44,339,749 -
Total assets 37,021,611 17,052,947 54,074,558 968,093
Liabilities:Current liabilities:Accounts payable and other current liabilities 199,764 977,154 1,176,918 157,523 Accrued interest payable 132,080 119,737 251,817 - Due to other government 38,936 - 38,936 - Unearned revenues - prepaid fees 1,920 - 1,920 - Accrued compensated absences - current 76,851 25,382 102,233 - Installment loans payable - current 1,154,977 803,626 1,958,603 - Liabilities to be paid from restricted assets:
Customer deposits 79,182 231,414 310,596 -
Total current liabilities 1,683,710 2,157,313 3,841,023 157,523
Non-current liabilities: Accrued compensated absences 2,016 - 2,016 - Long-term installment loans payable 9,094,290 5,518,587 14,612,877 -
Other post-employment benefits obligation 32,074 10,686 42,760 -
Total non-current liabilities 9,128,380 5,529,273 14,657,653 -
Total liabilities 10,812,090 7,686,586 18,498,676 157,523
Net Position:Net investment in capital assets 24,367,037 5,696,099 30,063,136 -
Unrestricted 1,842,484 3,670,262 5,512,746 810,570
Total net position 26,209,521$ 9,366,361$ 35,575,882 810,570$
Internal balance due from (to) governmental activities
due to consolidation of Internal Service Fund 189,821
Business-type activities net position (Exhibit A) 35,765,703$
Major
CITY OF NEWTON, NORTH CAROLINA
STATEMENT OF NET POSITIONPROPRIETARY FUNDS
JUNE 30, 2013
- 38 -

The accompanying notes are an integral part of the financial statements.
Exhibit H
Water and InternalWastewater Electric Service
Fund Fund Total Fund
Operating Revenues:Charges for services 5,512,943$ 13,995,890$ 19,508,833$ 1,544,822$
Other operating revenues 389,179 454,718 843,897 -
Total operating revenues 5,902,122 14,450,608 20,352,730 1,544,822
Operating Expenses:Administration 866,103 787,093 1,653,196 9,880 Power for resale - 10,478,526 10,478,526 - Operations 2,350,613 1,828,332 4,178,945 1,185,242 Maintenance 1,061,194 - 1,061,194 -
Depreciation 1,787,298 585,635 2,372,933 -
Total operating expenses 6,065,208 13,679,586 19,744,794 1,195,122
Operating income (loss) (163,086) 771,022 607,936 349,700
Non-Operating Revenues (Expenses):Sales tax - 297,967 297,967 - Investment earnings 3,055 3,435 6,490 733 Interest expense (257,808) (169,204) (427,012) - Rental income and other non-operating items 84,426 71,861 156,287 - Non-capital contributions - 161 161 -
Gain (loss) on disposal of capital assets 23,971 6,825 30,796 -
Total non-operating revenues (expenses) (146,356) 211,045 64,689 733
Income (loss) before transfers and capital contributions (309,442) 982,067 672,625 350,433 Transfers to other funds - (10,000) (10,000) - Capital contributions 13,537 10,130 23,667 -
Change in net position (295,905) 982,197 686,292 350,433
Net Position:
Beginning of year - July 1 26,505,426 8,384,164 460,137
End of year - June 30 26,209,521$ 9,366,361$ 810,570$
Internal service activities allocated to business-type activities 87,610
Change in net position-business type activities (Exhibit B) 773,902$
Major
CITY OF NEWTON, NORTH CAROLINA
STATEMENT OF REVENUES, EXPENSES, AND CHANGES IN FUND NET POSITION - PROPRIETARY FUNDS
FOR THE YEAR ENDED JUNE 30, 2013
- 39 -

The accompanying notes are an integral part of the financial statements.
Exhibit I
Water and InternalWastewater Electric Service
Fund Fund Total Fund
Cash Flows from Operating Activities:Cash received from customers and users 6,157,324$ 14,446,866$ 20,604,190$ 1,544,822$ Cash paid for goods and services (2,878,568) (12,378,058) (15,256,626) (1,266,783)
Cash paid to or on behalf of employees for services (1,586,092) (717,645) (2,303,737) -
Net cash provided (used) by operating activities 1,692,664 1,351,163 3,043,827 278,039
Cash Flows from Non-Capital Financing Activities:Non-capital contributions - grants - 161 161 -
Transfers to (from) other funds - (10,000) (10,000) -
Net cash provided (used) by non-capital financing activities - (9,839) (9,839) -
Cash Flows from Capital and Related Financing Activities: Acquisition and construction of capital assets (1,461,269) (1,158,882) (2,620,151) - Capital contributions - grants 13,537 10,130 23,667 - Proceeds from sale of capital assets 23,971 6,825 30,796 - Sales tax - 297,967 297,967 - Payments of installment loans payable (1,094,004) (752,486) (1,846,490) - Interest paid on general obligation bonds and loans payable (236,131) (192,140) (428,271) -
Proceeds from issuance of general obligation bonds and loans payable 1,135,174 814,179 1,949,353 -
Net cash provided (used) by capital and related financing activities (1,618,722) (974,407) (2,593,129) -
Cash Flows from Investing Activities:
Interest on investments 3,080 3,627 6,707 772
Net Increase (Decrease) in Cash and Cash Equivalents 77,022 370,544 447,566 278,811
Cash and Cash Equivalents:
Beginning of Year - July 1 2,995,019 3,637,686 6,632,705 689,247
End of Year - June 30 3,072,041$ 4,008,230$ 7,080,271$ 968,058$
Reconciliation of Operating Income (Loss) to Net CashProvided (Used) by Operating Activities:Operating income (loss) (163,086)$ 771,022$ 607,936$ 349,700$
Adjustments to reconcile operating income (loss) to:Depreciation 1,787,298 585,635 2,372,933 - Rental income and other non-operating revenues 84,426 71,861 156,287 Change in assets and liabilities:(Increase) decrease in accounts receivable 166,744 (82,364) 84,380 - (Increase) decrease in due from other governmental agencies 44,791 (23,534) 21,257 (Increase) decrease in inventories (15,993) (12,220) (28,213) - (Increase) decrease in prepaid items 14,666 - 14,666 - Increase (decrease) in due to other governmental agencies (349) - (349) - Increase (decrease) in accounts payable and accrued expenses (232,083) 26,907 (205,176) (71,661) Increase (decrease) in unearned revenue 1,920 - 1,920 - Increase (decrease) in accrued vacation pay (4,383) (8,237) (12,620) - Increase (decrease) in other post-employment benefits 1,320 440 1,760 -
Increase (decrease) in customer deposits 7,393 21,653 29,046 -
Net cash provided (used) by operating activities 1,692,664$ 1,351,163$ 3,043,827$ 278,039$
Supplemental Schedule of Non-Cash Financing Activities:
Water Fund disposed of capital assets with historical cost of $209,378 andaccumulated depreciation of $209,378 during the year ended June 30, 2013.
Water Fund transferred capital assets to General Fund with cost of $61,393and accumulated depreciation of $61,393 at June 30, 2013. NBV was $-0-.
General Fund transferred capital assets to Water Fund with cost of $24,271and accumulated depreciation of $24,271 at June 30, 2013. NBV was $-0-.
Electric Fund disposed of capital assets with historical cost of $61,393 andaccumulated depreciation of $61,393 during the year ended June 30, 2013.
Electric Fund transferred capital assets to General Fund with cost of $203,048 and accumulated depreciation of $203,048 at June 30, 2013. NBV was $-0-.
Major
CITY OF NEWTON, NORTH CAROLINA
STATEMENT OF CASH FLOWSPROPRIETARY FUNDS
FOR THE YEAR ENDED JUNE 30, 2013
- 40 -


NOTES TO THE FINANCIAL STATEMENTS
These notes are intended to communicate information necessary for a fair presentation of financial position and results of operations that are not readily apparent from, or cannot be included in, the financial statements themselves. The notes supplement the financial statements, are an integral part thereof, and are intended to be read in conjunction with the financial statements.


CITY OF NEWTON, NORTH CAROLINA
NOTES TO THE FINANCIAL STATEMENTS FOR THE YEAR ENDED JUNE 30, 2013
1. Summary of Significant Accounting Policies
The accounting policies of the City of Newton (the “City”) conform to generally accepted accounting principles as applicable to governments. The following is a summary of the more significant accounting policies:
A. Reporting Entity
The City is a municipal corporation which is governed by an elected Mayor and a six-member Council.
B. Basis of Presentation
Government-Wide Statements. The Statement of Net Position and the Statement of Activities display information about the primary government. These statements include the financial activities of the overall government. Eliminations have been made to minimize the effect of internal activities upon revenues and expenses. However, interfund services provided and used are not eliminated in the process of consolidation. These statements distinguish between the governmental and business-type activities of the City. Governmental activities generally are financed through taxes, intergovernmental revenues, and non-exchange transactions. Business-type activities are financed, in whole or in part, by fees charged to external parties. The Statement of Activities presents a comparison between direct expenses and program revenues for the different business-type activities of the City and for each function of the City’s governmental activities. Direct expenses are those that are specifically associated with a program or function and, therefore, are clearly identifiable to a particular function. Indirect expense allocations that have been made in the funds have been reversed for the Statement of Activities. Program revenues include: (a) fees and charges paid by the recipients of goods or services offered by the programs and (b) grants and contributions that are restricted to meeting the operational or capital requirements of a particular program. Revenues that are not classified as program revenues, including all taxes, are presented as general revenues. The effects of interfund activity have been eliminated from the government-wide financial statements. Fund Financial Statements. The fund financial statements provide information about the City’s funds. Separate statements for each fund category – governmental and proprietary – are presented. The emphasis of fund financial statements is on major governmental and enterprise funds, each displayed in a separate column. All remaining governmental and enterprise funds are aggregated and reported as nonmajor funds.
- 41 -

CITY OF NEWTON, NORTH CAROLINA
NOTES TO THE FINANCIAL STATEMENTS FOR THE YEAR ENDED JUNE 30, 2013
Proprietary fund operating revenues, such as charges for services, result from exchange transactions associated with the principal activity of the fund. Exchange transactions are those in which each party receives and gives up essentially equal values. Non-operating revenues, such as subsidies and investment earnings, result from non-exchange transactions or ancillary activities. The City reports the following major governmental fund: General Fund. The General Fund is the general operating fund of the City. It is used to account for all financial resources except those required to be accounted for in another fund. The primary revenue sources are ad valorem taxes, State grants, and various other taxes and licenses. The primary expenditures are for public safety, street maintenance and construction, and sanitation services. The City reports the following nonmajor governmental funds: Special Revenue Funds. Special revenue funds are used to account for the proceeds of specific revenue sources that are legally restricted to specified purposes. The CDBG–Moretz Industrial Access Road Fund, Main Street Energy Grant Fund, and Special Revenue Fund - General are special revenue funds of the City. Capital Projects Fund. This fund is used to account for the acquisition or construction of major capital facilities (other than those financed by enterprise funds). The City reports the following major enterprise funds: Electric Fund. This fund is used to account for the City’s electric fund operations. Water and Wastewater Fund. This fund is used to account for the City’s water and wastewater operations. The City reports the following fund type: Internal Service Fund. The Health Insurance Fund is used to account for the payment of medical claims of the City’s employees and their covered dependents.
- 42 -

CITY OF NEWTON, NORTH CAROLINA
NOTES TO THE FINANCIAL STATEMENTS FOR THE YEAR ENDED JUNE 30, 2013
C. Measurement Focus and Basis of Accounting In accordance with North Carolina General Statutes, all funds of the City are maintained during the year using the modified accrual basis of accounting. Government-Wide and Proprietary Fund Financial Statements. The government-wide and proprietary statements are reported using the economic resources measurement focus. The government-wide and proprietary fund financial statements are reported using the accrual basis of accounting. Revenues are recorded when earned and expenses are recorded at the time liabilities are incurred, regardless of when the related cash flows take place. Non-exchange transactions, in which the City gives (or receives) value without directly receiving (or giving) equal value in exchange, include property taxes, grants, and donations. On an accrual basis, revenue from property taxes is recognized in the fiscal year for which the taxes are levied. Revenue from grants and donations is recognized in the fiscal year in which all eligibility requirements have been satisfied. Amounts reported as program revenues include: 1) charges to customers or applicants for goods, services, or privileges provided; 2) operating grants and contributions; and 3) capital grants and contributions. Internally dedicated resources are reported as general revenues rather than as program revenues. Likewise, general revenues include all taxes. Proprietary funds distinguish operating revenues and expenses from non-operating items. Operating revenues and expenses generally result from providing services and producing and delivering goods in connection with a proprietary fund’s principal ongoing operations. The principal operating revenues of the City’s enterprise funds are charges to customers for sales and services. The City also recognizes as operating revenue the portion of tap fees intended to recover the cost of connecting new customers to the water and sewer system. Operating expenses for enterprise funds include the cost of sales and services, administrative expenses, and depreciation on capital assets. All revenues and expenses not meeting this definition are reported as non-operating revenues and expenses. Governmental Fund Financial Statements. Governmental funds are reported using the current financial resources measurement focus and the modified accrual basis of accounting. Under this method, revenues are recognized when measurable and available. Expenditures are recorded when the related fund liability is incurred, except for principal and interest on general long-term debt, claims and judgments, and compensated absences, which are recognized as expenditures to the extent they have matured. General capital asset acquisitions are reported as expenditures in governmental funds. Proceeds of general long-term debt and acquisitions under capital leases are reported as other financing sources.
- 43 -

CITY OF NEWTON, NORTH CAROLINA
NOTES TO THE FINANCIAL STATEMENTS FOR THE YEAR ENDED JUNE 30, 2013
The City considers all revenues available if they are collected within 90 days after year-end, except for property taxes. Ad valorem taxes receivable are not accrued as revenue because the amount is not susceptible to accrual. At June 30, taxes receivable are materially past due and are not considered to be an available resource to finance the operations of the subsequent year. Also, as of January 1, 1993, State law altered the procedures for the assessment and collection of property taxes on registered motor vehicles in North Carolina. Effective with this change in the law, Catawba County is responsible for billing and collecting the property taxes on registered motor vehicles on behalf of all municipalities and special tax districts in the County, including the City. For motor vehicles, property taxes are due the first day of the fourth month after the vehicles are registered. The billed taxes are applicable to the fiscal year in which they become due. Therefore, the City’s vehicle taxes for vehicles registered in Catawba County from March 2012 through February 2013 apply to the fiscal year ended June 30, 2013. Uncollected taxes that were billed during this period are shown as a receivable in these financial statements and offset by deferred inflows of resources. Sales taxes and certain intergovernmental revenues, such as the utilities franchise tax, collected and held by the State at year-end on behalf of the City, are recognized as revenue. Intergovernmental revenues and sales and services are not susceptible to accrual because generally they are not measurable until received in cash. Grant revenues, which are unearned at year-end, are recorded as unearned revenues. Expenditure-driven grants are recognized as revenue when the qualifying expenditures have been incurred and all other grant requirements have been satisfied. Under the terms of grant agreements, the City funds certain programs by a combination of specific cost-reimbursement grants, categorical block grants, and general revenues. Thus, when program expenses are incurred, there are both restricted and unrestricted net position available to finance the program. It is the City’s policy to first apply cost-reimbursement grant resources to such programs, followed by categorical block grants, and then by general revenues.
- 44 -

CITY OF NEWTON, NORTH CAROLINA
NOTES TO THE FINANCIAL STATEMENTS FOR THE YEAR ENDED JUNE 30, 2013
D. Budgetary Data The City’s budgets are adopted as required by the North Carolina General Statutes. An annual budget is adopted for the General Fund and the enterprise funds. All annual appropriations lapse at the fiscal year-end. Project ordinances are adopted for the capital projects funds, special revenue funds, and the enterprise capital projects funds, which are consolidated with the operating funds for reporting purposes. The City’s Health Insurance Fund, an Internal Service Fund, operates under a financial plan that was adopted by the governing Board at the time the City’s budget ordinance was approved, as is required by the General Statutes. All budgets are prepared using the modified accrual basis of accounting. Expenditures may not legally exceed appropriations at the functional level for all annually budgeted funds and at the object level for the multi-year funds. Amendments are required for any revisions that alter the total expenditures of any fund or that change functional appropriations by more than $2,500. All amendments must be approved by the governing Board. During the year, several immaterial amendments to the original budget were necessary. The budget ordinance must be adopted by July 1 of the fiscal year or the governing Board must adopt an interim budget that covers that time until the annual ordinance can be adopted. Budget transfers are approved by the City Council as follows: 1) The Director of Finance is hereby authorized to approve transfers of
appropriations between line items within a division budget. 2) In accordance with G.S. 159-13(b)(3), each expenditure to be charged
against a contingency appropriation shall be authorized only by resolution of the City Council. In an emergency situation, the City Manager may approve an expenditure to be charged to a contingency account provided that such emergency expenditure is reported to the City Council at its next meeting.
3) The City Manager is hereby authorized to approve budget transfers within a department from one division to another.
4) Transfers from one fund to another shall not be allowed except as is authorized by the Budget and Fiscal Control Act and such transfers shall be approved by the City Council prior to transfer.
5) All transfers as authorized hereinabove shall be reported monthly to the City Council and included in the minutes of the Board.
6) The Director of Finance shall prepare forms necessary to document each budget transfer and comply with the reporting of the budget transfers as specified hereinabove.
- 45 -

CITY OF NEWTON, NORTH CAROLINA
NOTES TO THE FINANCIAL STATEMENTS FOR THE YEAR ENDED JUNE 30, 2013
E. Estimates
The preparation of financial statements in conformity with generally accepted accounting principles requires management to make estimates and assumptions that affect certain reported amounts and disclosures. Accordingly, actual results could differ from those estimates. Significant areas where estimates are made are allowance for doubtful accounts and depreciation lives.
F. Assets, Liabilities, Deferred Outflows/Inflows of Resources, and Fund
Equity
Deposits and Investments
All deposits of the City are made in Board-designated official depositories and are secured as required by State law [G.S. 159-31]. The City may designate, as an official depository, any bank or savings association whose principal office is located in North Carolina. Also, the City may establish time deposit accounts such as NOW and SuperNOW accounts, money market accounts, and certificates of deposit. State law [G.S. 159-30(c)] authorizes the City to invest in obligations of the United States or obligations fully guaranteed both as to principal and interest by the United States, obligations of the State of North Carolina, bonds and notes of any North Carolina local government or public authority, obligations of certain non-guaranteed Federal agencies, certain high-quality issues of commercial paper and bankers’ acceptances, the North Carolina Capital Management Trust (“NCCMT”), and the North Carolina State Treasurer’s Short-Term Investment Fund (STIF). The STIF consists of an internal portion and an external portion in which the Board participates. Investments are restricted to those enumerated in [G.S. 147-69.1]. The City’s investments are reported at fair value as determined by quoted market prices. The securities of the NCCMT Cash Portfolio, an SEC-registered (2a-7) money market mutual fund, are valued at fair value, which is the NCCMT’s share price. The NCCMT Term Portfolio’s securities are valued at fair value. In accordance with State law, the City has invested in securities which are callable and which provide for periodic interest rate increases in specific increments until maturity. These investments are reported at fair value as determined by quoted market prices.
Cash and Cash Equivalents The City pools monies from several funds to facilitate disbursement and investment and to maximize investment income. Therefore, all cash and investments are essentially demand deposits and are considered to be cash and cash equivalents.
- 46 -

CITY OF NEWTON, NORTH CAROLINA
NOTES TO THE FINANCIAL STATEMENTS FOR THE YEAR ENDED JUNE 30, 2013
Restricted Assets The unexpended loan proceeds plus interest of $262,556 and $2,299,190 in the General Fund and Enterprise Fund, respectively, are classified as restricted assets, because their use is completely restricted to the purpose for which the financing was originally issued. Customer deposits of $79,182 and $231,414 held by the Water and Wastewater Fund and the Electric Fund, respectively, before any services are supplied are restricted to the service for which the deposit was collected. Powell Bill funds of $294,595 are also classified as restricted cash, because it can be expended only for the purposes of maintaining, repairing, constructing, reconstructing, or widening of local streets per G.S. 136-41.1 through 136-41.4. In addition, $1,206,328 held in the General Fund is classified as restricted assets because the contributor placed a restriction that the principal only be utilized for capital costs of recreational facilities. Ad Valorem Taxes Receivable In accordance with State law [G.S. 105-347 and G.S. 159-13(a)], the City levies ad valorem taxes on property other than motor vehicles on July 1, the beginning of the fiscal year. These taxes are due on September 1 (lien date); however, interest does not accrue until the following January 6. Liens are placed on these taxes as of March 1 each year. These taxes are based on the assessed values as of January 1, 2012. Allowance for Doubtful Accounts All receivables that historically experience uncollectible accounts are shown net of an allowance for doubtful accounts. This amount is estimated by analyzing the percentage of receivables that were written off in prior years. Inventory The inventories of the City are valued at cost (on a moving average basis), which approximates market. Inventories of governmental funds are recorded as expenditures when consumed, rather than when purchased. The inventories of the City’s enterprise funds consist of materials and supplies held for consumption. The cost of these inventories is recorded as an expense as the inventories are consumed or sold.
- 47 -

CITY OF NEWTON, NORTH CAROLINA
NOTES TO THE FINANCIAL STATEMENTS FOR THE YEAR ENDED JUNE 30, 2013
Capital Assets Capital assets are defined by the government as assets with an initial, individual cost of more than a $5,000 amount and an estimated useful life in excess of one year. Purchased or constructed capital assets are reported at cost or estimated historical cost. Donated capital assets are recorded at their estimated fair value at the date of donation. General infrastructure assets acquired prior to July 1, 2003, consist of the road network and water and sewer system assets that were acquired or that received substantial improvements subsequent to July 1, 1980, and are reported at estimated historical cost using deflated replacement cost. The cost of normal maintenance and repairs that do not add to the value of the asset or materially extend asset lives are not capitalized. Capital assets are depreciated using the straight-line method over the following estimated useful lives:
Estimated
Asset Class Useful Life Infrastructure 15-50 yearsBuildings and improvements 20-50 yearsVehicles and equipment 5-20 yearsDistribution system - electric 20-30 yearsDistribution system - water and wastewater 20-40 years
Deferred Outflows/Inflows of Resources In addition to assets, the statement of financial position will sometime report a separate section for deferred outflows of resources. This separate financial statement element, Deferred Outflows of Resources, represents a consumption of net position that applies to a future period and so will not be recognized as an expense or expenditure until then. In addition to liabilities, the statement of financial position will sometimes report a separate section for deferred inflows of resources. This separate financial statement element, Deferred Inflows of Resources, represents an acquisition of net position that applies to a future period and so will not be recognized as revenue until then. The City has only two items that meet this criterion for this category – prepaid taxes and property taxes receivable.
- 48 -

CITY OF NEWTON, NORTH CAROLINA
NOTES TO THE FINANCIAL STATEMENTS FOR THE YEAR ENDED JUNE 30, 2013
Long-Term Obligations
In the government-wide financial statements and proprietary fund type financial statements, long-term debt and other long-term obligations are reported as liabilities in the applicable governmental activities, business-type activities, or proprietary fund type Statement of Net Position. Bond premiums and discounts are deferred and amortized over the life of the bonds using the straight-line method which approximates the effective interest method. Bonds payable are reported net of the applicable bond premiums or discount. Bond issuance costs, except for prepaid insurance costs, are expensed in the reporting period in which they are incurred. Prepaid insurance costs are expensed over the life of the debt. In the fund financial statements, governmental fund types recognize bond premiums and discounts, as well as bond issuance costs, during the current period. The face amount of debt issued is reported as other financing sources. Premiums received on debt issuances are reported as other financing sources while discounts on debt issuances are reported as other financing uses. Issuance costs, whether or not withheld from the actual debt proceeds received, are reported as debt service expenditures. Compensated Absences
The vacation policies of the City provide for the accumulation of up to 240 hours earned vacation leave, with such leave being fully vested when earned. For the City’s government-wide and proprietary funds, an expense and a liability for compensated absences and the salary related payments are recorded as the leave is earned on a first-in, first-out basis. The portion of time estimated to be used in the next fiscal year has been designated as a current liability in the government-wide financial statements. The City’s sick leave policy provides for an unlimited amount of earned sick leave. Sick leave does not vest, but unused sick leave accumulated at the time of retirement may be used in the determination of length of service for retirement benefit purposes. Since the City does not have any obligation for accumulated sick leave until it is actually taken, no accrual for sick leave has been made.
Net Position Net position in government-wide and proprietary fund financial statements are classified as net investment in capital assets, restricted, and unrestricted. Restricted net position represent constraints on resources that are either: (a) externally imposed by creditors, grantors, contributors, or laws or regulations of other governments or (b) imposed by law through State statute.
- 49 -

CITY OF NEWTON, NORTH CAROLINA
NOTES TO THE FINANCIAL STATEMENTS FOR THE YEAR ENDED JUNE 30, 2013
Fund Balances In the governmental fund financial statements, fund balance is composed of five classifications designed to disclose the hierarchy of constraints placed on how fund balance can be spent. The governmental fund types classify fund balances as follows: Non-Spendable Fund Balance. This classification includes amounts that cannot be spent because they are either (a) not in spendable form or (b) legally or contractually required to be maintained intact. Inventory - portion of fund balance that is not an available resource because it represents the year-end balance of inventory, which are not spendable resource. Restricted Fund Balance. This classification includes revenue sources that are restricted to specific purposes externally imposed by creditors or imposed by law. Restricted fund balance is summarized as follows:
General
Fund
Special
Revenue
Capital
Projects Total
Restricted for Stabilization by StateStatute - portion of fund balance that isrestricted by State statute [G.S. 159-8(a)]. 735,016$ -$ 127,364$ 862,380$
Restricted for Transportation - portionof fund balance that is restricted byrevenue source for Powell Bill (street)expenditures. 294,595$ -$ -$ 294,595$
Restricted for Transportation - portionof fund balance that is restricted byrevenue source (unspent debt proceeds)for streets. 144,371 - - 144,371
Restricted for Environmental Protection - portion of fund balance that is restrictedby revenue source (unspent debtproceeds) for sanitation. 9,683 - - 9,683
Other Governmental
- 50 -

CITY OF NEWTON, NORTH CAROLINA
NOTES TO THE FINANCIAL STATEMENTS FOR THE YEAR ENDED JUNE 30, 2013
General
Fund
Special
Revenue
Capital
Projects Total
Restricted for Public Safety - portion offund balance that is restricted byrevenue source (unspent debt proceeds)for general public safety. 108,502 - - 108,502
Restricted for Cultural and Recreational -portion of fund balance that is restrictedby revenue source for the Frank and SueJones Recreation Fund expenditures.
1,206,328 - - 1,206,328
Restricted for Economic and PhysicalDevelopment - portion of fund balancethat is restricted by revenue source forcommunity development. - 1,734 - 1,734
Total restricted fund balance (Exhibit C) 1,763,479$ 1,734$ -$ 1,765,213$
Other Governmental
Committed Fund Balance. The portion of fund balance that can only be used for specific purpose imposed by majority vote of the City’s governing body. The City Council is the highest level of decision-making authority for the government that can, by adoption of an ordinance prior to the end of the fiscal year, commit fund balance. Any changes or removal of specific purposes requires majority action by the Council through another ordinance. Committed fund balance is summarized as follows:
Other Governmental
General
Fund
Special
Revenue
Capital
Projects Total
Committed for Economic Development -portion of fund balance that can onlybe used for economic development. -$ -$ 97,930$ 97,930$
- 51 -

CITY OF NEWTON, NORTH CAROLINA
NOTES TO THE FINANCIAL STATEMENTS FOR THE YEAR ENDED JUNE 30, 2013
Assigned Fund Balance. The portion of fund balance that the City of Newton has budgeted or earmarked to use for specific purposes. The City’s governing body has the authority to assign fund balance.
Other Governmental
General
Fund
Special
Revenue
Capital
Projects Total
Assigned for Cultural and Recreational -portion of fund balance that has beenearmarked by the governing body forcemetery perpetual care. Utilization ofthese funds are made at the discretion ofthe City Manager. $ 21,540 $ - $ - 21,540$
Subsequent Year’s Expenditures - portion offund balance that is not already classifiedin restricted or committed. The governingbody approves the appropriation. 25,950 - - 25,950
Total assigned fund balance (Exhibit C) 47,490$ -$ -$ 47,490$
Unassigned Fund Balance. The portion of fund balance that has not been restricted, committed, or assigned to specific purposes or other funds. Fund Balance Available for Appropriation The following schedule provides management and citizens with information on the portion of General Fund balance that is available for appropriation:
Total fund balance - General Fund 5,223,961$ Less:Inventory (62,836) Stabilization by State statute (735,016)
Fund balance available for appropriation 4,426,109$
The City has a revenue spending policy that provides guidance for programs with multiple revenue sources. The Finance Officer will use resources in the following hierarchy: bond proceeds, Federal funds, State funds, local non-City funds, and County funds. For purposes of fund balance classification, expenditures are to be spent from restricted fund balance first, followed in order by committed fund balance, assigned fund balance, and lastly,
- 52 -

CITY OF NEWTON, NORTH CAROLINA
NOTES TO THE FINANCIAL STATEMENTS FOR THE YEAR ENDED JUNE 30, 2013
unassigned fund balance. The Finance Officer has the authority to deviate from this policy if it’s in the best interest of the City. The City has not adopted a formal fund balance policy. The outstanding encumbrances represent amounts needed to pay any commitments related to purchase orders and contracts that remain unperformed at year end. Encumbrances in the General Fund at June 30, 2013 were $121,097.
2. Detail Notes On All Funds
A. Assets
Deposits All of the deposits of the City are either insured or collateralized by using one of two methods. Under the Dedicated Method, all deposits that exceed the Federal depository insurance coverage level are collateralized with securities held by the City’s agent in the respective unit’s name. Under the Pooling Method, which is a collateral pool, all uninsured deposits are collateralized with securities held by the State Treasurer’s agent in the name of the State Treasurer. Since the State Treasurer is acting in a fiduciary capacity for the City, these deposits are considered to be held by the City’s agent in their name. The amount of the pledged collateral is based on an approved averaging method for non-interest-bearing deposits and the actual current balance for interest-bearing deposits. Depositories using the Pooling Method report to the State Treasurer the adequacy of their pooled collateral covering uninsured deposits. The State Treasurer does not confirm this information with the City or the escrow agent. Because of the inability to measure the exact amounts of collateral pledged for the City under the Pooling Method, the potential exists for under-collateralization, and this risk may increase in periods of high cash flows. However, the State Treasurer of North Carolina enforces strict standards of financial stability for each depository that collateralizes public deposits under the Pooling Method. The City has no formal policy regarding custodial credit risk for deposits, but relies on the State Treasurer to enforce standards of minimum capitalization for all pooling method financial institutions and to monitor them for compliance. The City complies with the provisions of G.S. 159-31 when designating official depositories and verifying that deposits are properly secured. At June 30, 2013, the City’s deposits had a carrying amount of $7,559,850 and a bank balance of $8,137,069. The City also had petty cash and cash on hand of $1,328. Of the bank balance, $500,000 was covered by Federal depository insurance and the remainder was covered by collateral held under the Pooling Method.
- 53 -

CITY OF NEWTON, NORTH CAROLINA
NOTES TO THE FINANCIAL STATEMENTS FOR THE YEAR ENDED JUNE 30, 2013
Investments At June 30, 2013, the City had $5,511,956 invested with the North Carolina Capital Management Trust’s Cash Portfolio, which carried a credit rating of AAAm by Standard and Poor’s. Interest Rate Risk. The City has no formal investment policy regarding interest rate risk. As a means of limiting its exposure to fair value losses arising from rising interest rates, the City purchases certificates of deposit with an average maturity of 120 days. Also, the City purchases certificates of deposit to be laddered with staggered maturity dates and limits all securities to a final maturity of no more than two years. Credit Risk. The City has no policy regarding credit risk, but has internal management procedures that limits the City’s investments to the provisions of G.S. 159-30 and restricts the purchase of securities to the highest possible ratings whenever particular types of securities are rated. The City’s investment in the NC Capital Management Trust Cash Portfolio carried a rating of AAAm by Standard and Poor’s as of June 30, 2013. Receivables Receivables at the government-wide level at June 30, 2013 were as follows:
Due fromOther
Accounts Taxes Governments TotalGovernmental Activities:General 540,698$ 688,193$ 72,625$ 1,301,516$ Other governmental - - 2,164 2,164 Allowance for doubtful accounts - (37,500) - (37,500)
Total receivables 540,698$ 650,693$ 74,789$ 1,266,180$
Business-Type Activities:Water and wastewater 680,298$ -$ 55,002$ 735,300$ Electric 1,320,446 - 66,176 1,386,622 Allowance for doubtful accounts (22,700) - - (22,700)
Total receivables 1,978,044$ -$ 121,178$ 2,099,222$
- 54 -

CITY OF NEWTON, NORTH CAROLINA
NOTES TO THE FINANCIAL STATEMENTS FOR THE YEAR ENDED JUNE 30, 2013
Capital Assets Capital asset activity for the year ended June 30, 2013 was as follows:
July 1, 2012 Increases Disposals
Adjust/
Transfers June 30, 2013
Governmental activities:Capital assets not being depreciated:Land 2,007,259$ -$ -$ -$ 2,007,259$ Construction in progress 90,904 585,410 - (288,017) 388,297 Total assets not being depreciated 2,098,163 585,410 - (288,017) 2,395,556
Capital assets being depreciated:Buildings and improvements 7,745,368 144,358 - 37,857 7,927,583 Equipment 3,026,230 169,453 (14,583) 45,564 3,226,664 Vehicles 6,250,816 439,431 (440,897) 438,636 6,687,986 Infrastructure 5,773,178 - - 4,184 5,777,362 Total assets being depreciated 22,795,592 753,242 (455,480) 526,241 23,619,595
Less accumulated depreciation:Buildings and improvements (4,819,738) (161,418) - - (4,981,156) Equipment (1,788,305) (322,046) 14,583 (45,564) (2,141,332) Vehicles (5,113,935) (367,065) 417,320 (192,660) (5,256,340) Infrastructure (2,038,526) (145,855) - - (2,184,381) Total accumulated depreciation (13,760,504) (996,384) 431,903 (238,224) (14,563,209)
Total assets being depreciated, net 9,035,088 (243,142) (23,577) 288,017 9,056,386
Governmental activities capital assets, net 11,133,251$ 342,268$ (23,577)$ -$ 11,451,942$
Depreciation was charged to functions/programs of the primary government as follows:
General government 217,059$ Public safety 344,480 Transportation 252,374 Environmental protection 91,947 Cultural and recreation 90,524
Total depreciation expense - governmental activities 996,384$
- 55 -

CITY OF NEWTON, NORTH CAROLINA
NOTES TO THE FINANCIAL STATEMENTS FOR THE YEAR ENDED JUNE 30, 2013
July 1, 2012 Increases Disposals
Adjust/
Transfers June 30, 2013
Business-Type Activities:Electric Fund:Capital assets not being depreciated:Land 5,000$ -$ -$ -$ 5,000$ Construction in progress 327,878 998,117 - (825,623) 500,372 Total assets not being depreciated 332,878 998,117 - (825,623) 505,372
Capital assets being depreciated:Buildings and improvements 500,567 - - - 500,567 Equipment 4,605,741 - (46,849) (45,564) 4,513,328 Vehicles 912,182 95,938 (14,544) (157,484) 836,092 Distribution systems 12,998,780 64,827 - 825,623 13,889,230 Total assets being depreciated 19,017,270 160,765 (61,393) 622,575 19,739,217
Less accumulated depreciation:Buildings and improvements (433,579) (9,257) - - (442,836) Equipment (2,669,446) (168,311) 46,849 45,564 (2,745,344) Vehicles (680,168) (51,271) 14,544 157,484 (559,411) Distribution systems (4,920,370) (356,796) - - (5,277,166) Total accumulated depreciation (8,703,563) (585,635) 61,393 203,048 (9,024,757)
Total assets being depreciated, net 10,313,707 (424,870) - 825,623 10,714,460
Electric Fund capital assets, net 10,646,585 573,247 - - 11,219,832
Water and Wastewater Fund:Capital assets not being depreciated:Land 210,332 - - - 210,332 Construction in progress 2,856,285 1,007,797 - (3,315,898) 548,184 Total assets not being depreciated 3,066,617 1,007,797 - (3,315,898) 758,516
Capital assets being depreciated:Buildings and improvements 22,530,122 63,257 - - 22,593,379 Equipment 992,293 104,500 (115,800) - 980,993 Vehicles 936,704 285,715 (93,578) 112,819 1,241,660 Distribution systems 34,175,575 - - 3,167,903 37,343,478 Total assets being depreciated 58,634,694 453,472 (209,378) 3,280,722 62,159,510
Less accumulated depreciation:Buildings and improvements (14,707,950) (592,757) - - (15,300,707) Equipment (640,312) (59,652) 115,800 - (584,164) Vehicles (517,220) (90,029) 93,578 35,176 (478,495) Distribution systems (12,389,883) (1,044,860) - - (13,434,743) Total accumulated depreciation (28,255,365) (1,787,298) 209,378 35,176 (29,798,109)
Total assets being depreciated, net 30,379,329 (1,333,826) - 3,315,898 32,361,401
Water and Wastewater Fund capital assets, net 33,445,946 (326,029) - - 33,119,917
Business-type activities capital assets, net 44,092,531$ 247,218$ -$ -$ 44,339,749$
- 56 -

CITY OF NEWTON, NORTH CAROLINA
NOTES TO THE FINANCIAL STATEMENTS FOR THE YEAR ENDED JUNE 30, 2013
Net Investment in Capital Assets The total net investment in capital assets at June 30, 2013 is composed of the following elements:
Governmental Business-TypeActivities Activities
Capital assets 11,451,942$ 44,339,749$ Long-term debt (4,763,117) (16,718,489) Accrued compensated absences, OPEB, LEO 869,067 147,009 Unspent debt proceeds 261,645 2,294,867
Net investment in capital assets 7,819,537$ 30,063,136$
Construction Commitments The government has active construction projects as of June 30, 2013. The government’s commitments with contractors are as follows:
Spent to RemainingDate Commitment
General Capital Projects:AC Little Culvert Replacement 173,604$ 96,396$ N. Ashe Storm Water Drainage - 125,200 New Fire Headquarters 9,163 3,040,837
Water and Wastewater Capital Projects:Water Rehabilitation Projects 200,001 408,749 Sewer Rehabilitation Projects 190,521 433,079 Water Filtration 8.0 MGD Pump 86,224 513,776 Snow Creek Sewer Outfall Rehabilitation 71,438 1,327,562
Electric Capital Projects:Conversion from 4KV to 24KV 145,274 504,726 Generator Modifications 355,099 23,251
Total 1,231,324$ 6,473,576$
Project
- 57 -

CITY OF NEWTON, NORTH CAROLINA
NOTES TO THE FINANCIAL STATEMENTS FOR THE YEAR ENDED JUNE 30, 2013
B. Liabilities
Accounts Payable
Vendors Benefits Interest BalancesGovernmental activities 255,866$ 143,286$ 63,627$ 462,779$
Business-type activities 1,176,918$ -$ 251,817$ 1,428,735$
Pension Plan Obligations Local Governmental Employees’ Retirement System Plan Description. The City contributes to the State-Wide Local Governmental Employees’ Retirement System (LGERS), a cost-sharing, multiple-employer defined benefit pension plan administered by the State of North Carolina. LGERS provides retirement and disability benefits to plan members and beneficiaries. Article 3 of G.S. Chapter 128 assigns the authority to establish and amend benefit provisions to the North Carolina General Assembly. The LGERS is included in the Comprehensive Annual Financial Report (CAFR) for the State of North Carolina. The State’s CAFR includes financial statements and required supplementary information for LGERS. That report may be obtained by writing to the Office of the State Controller, 1410 Mail Service Center, Raleigh, North Carolina 27699-1410, or by calling (919) 981-5454. Funding Policy. Plan members are required to contribute 6.0% of their annual covered salary. The City is required to contribute at an actuarially determined rate. For the City, the current rate for employees not engaged in law enforcement and for law enforcement officers is 7.07% and 7.28%, respectively, of annual covered payroll. The contribution requirements of members and of the City are established and may be amended by the North Carolina General Assembly. The City’s contributions to LGERS for the years ended June 30, 2013, 2012, and 2011 were $468,456, $484,523, and $462,053, respectively. The contributions made by the City equaled the required contributions for each year.
- 58 -

CITY OF NEWTON, NORTH CAROLINA
NOTES TO THE FINANCIAL STATEMENTS FOR THE YEAR ENDED JUNE 30, 2013
Law Enforcement Officers’ Special Separation Allowance Plan Description. The City administers a public employee retirement system (the “Separation Allowance”), a single-employer defined benefit pension plan that provides retirement benefits to the City’s qualified sworn law enforcement officers. The Separation Allowance is equal to 0.85% of the annual equivalent of the base rate of compensation most recently applicable to the officer for each year of creditable service. The retirement benefits are not subject to any increases in salary or retirement allowances that may be authorized by the General Assembly. Article 12D of G.S. Chapter 143 assigns the authority to establish and amend benefit provisions to the North Carolina General Assembly.
All full-time law enforcement officers of the City are covered by the Separation Allowance. At December 31, 2012, the Separation Allowance’s membership consisted of:
Retirees receiving benefits 3 Terminated plan members entitled to, but not yet receiving, benefits - Active plan members 35 Total 38
A separate report was not issued for the plan. Summary of Significant Accounting Policies Basis of Accounting. The City has chosen to fund the Separation Allowance on a pay-as-you-go basis. Pension expenditures are made from the General Fund, which is maintained on the modified accrual basis of accounting. Method Used to Value Investments. No funds are set aside to pay benefits and administration costs. These expenditures are paid as they come due. Contributions. The City is required by Article 12D of G.S. Chapter 143 to provide these retirement benefits and has chosen to fund the benefit payments on a pay-as-you-go basis through appropriations made in the General Fund operating budget. The City’s obligation to contribute to this plan is established and may be amended by the North Carolina General Assembly. No contributions were made by employees.
- 59 -
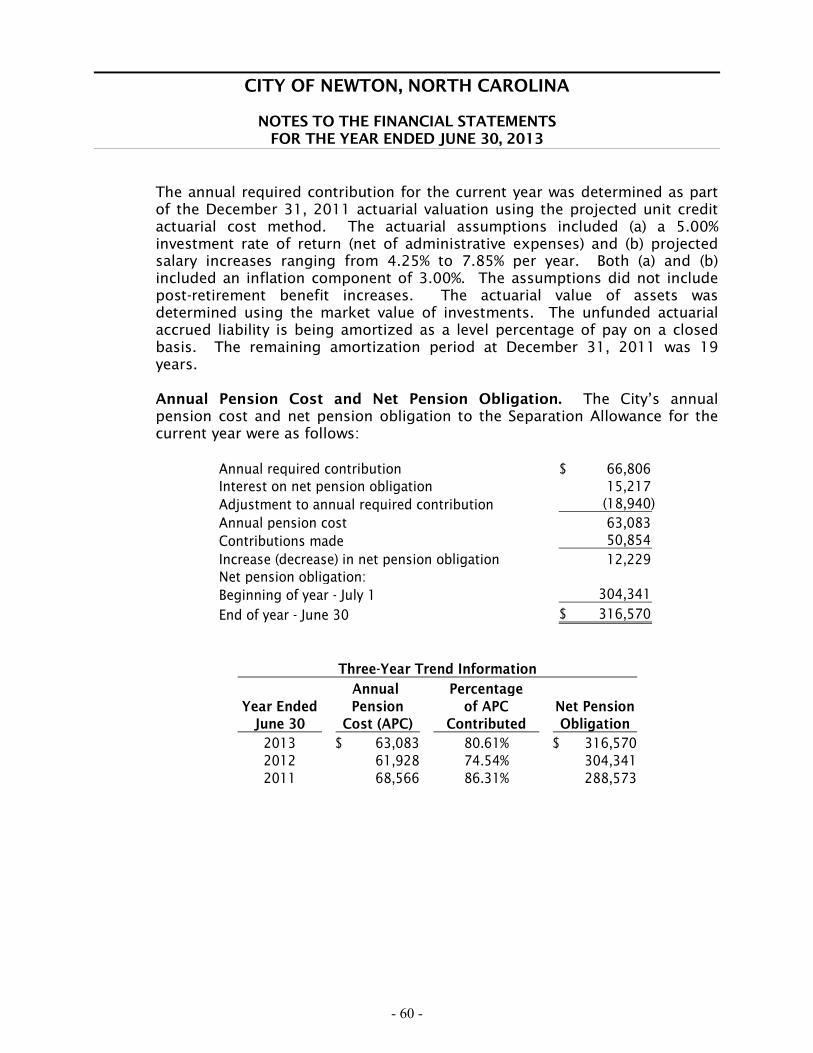
CITY OF NEWTON, NORTH CAROLINA
NOTES TO THE FINANCIAL STATEMENTS FOR THE YEAR ENDED JUNE 30, 2013
The annual required contribution for the current year was determined as part of the December 31, 2011 actuarial valuation using the projected unit credit actuarial cost method. The actuarial assumptions included (a) a 5.00% investment rate of return (net of administrative expenses) and (b) projected salary increases ranging from 4.25% to 7.85% per year. Both (a) and (b) included an inflation component of 3.00%. The assumptions did not include post-retirement benefit increases. The actuarial value of assets was determined using the market value of investments. The unfunded actuarial accrued liability is being amortized as a level percentage of pay on a closed basis. The remaining amortization period at December 31, 2011 was 19 years. Annual Pension Cost and Net Pension Obligation. The City’s annual pension cost and net pension obligation to the Separation Allowance for the current year were as follows:
Annual required contribution 66,806$ Interest on net pension obligation 15,217 Adjustment to annual required contribution (18,940) Annual pension cost 63,083 Contributions made 50,854 Increase (decrease) in net pension obligation 12,229 Net pension obligation:Beginning of year - July 1 304,341
End of year - June 30 316,570$
Annual PercentageYear Ended Pension of APC Net Pension
June 30 Cost (APC) Contributed Obligation2013 63,083$ 80.61% 316,570$ 2012 61,928 74.54% 304,341 2011 68,566 86.31% 288,573
Three-Year Trend Information
- 60 -

CITY OF NEWTON, NORTH CAROLINA
NOTES TO THE FINANCIAL STATEMENTS FOR THE YEAR ENDED JUNE 30, 2013
Funding Status and Funding Progress As of December 31, 2012, the most recent actuarial valuation date, the plan was not funded. The actuarial accrued liability for benefits and the unfunded actuarial accrued liability (UAAL) was $588,037. The covered payroll (annual payroll of active employees covered by the plan) was $1,343,895, and the ratio of the UAAL to the covered payroll was 43.76%. The Schedule of Funding Progress, presented as required supplementary information following the Notes to the Financial Statements, presents multi-year trend information about whether the actuarial value of plan assets are increasing or decreasing over time, relative to the actuarial accrued liability for benefits. Supplemental Retirement Income Plan for Law Enforcement Officers Plan Description. The City contributes to Supplemental Retirement Income Plans (Plan), a defined contribution pension plan administered by the Department of State Treasurer and a Board of Trustees. The plan provides retirement benefits to law enforcement officers employed by the City. Article 5 of G. S. Chapter 135 assigns the authority to establish and amend benefit provisions to the North Carolina General Assembly. The Supplemental Retirement Income Plan for Law Enforcement Officers is included in the CAFR for the State of North Carolina. The State’s CAFR includes the pension trust fund financial statements for the Internal Revenue Code Section 401(k) plan that includes the Supplemental Retirement Income Plan for Law Enforcement Officers. That report may be obtained by writing to the Office of the State Comptroller, 1410 Mail Service Center, Raleigh, North Carolina 27699-1410, or by calling (919) 981-5454. Funding Policy. Article 12E of G.S. Chapter 143 requires the City to contribute each month an amount equal to 5% of each officer’s salary, and all amounts contributed are vested immediately. Also, the law enforcement officers may make voluntary contributions to their plan. Contributions for the year ended June 30, 2013 were $87,206, which consisted of $69,513 from the City and $17,693 from the law enforcement officers.
- 61 -

CITY OF NEWTON, NORTH CAROLINA
NOTES TO THE FINANCIAL STATEMENTS FOR THE YEAR ENDED JUNE 30, 2013
Firemen’s and Rescue Squad Workers’ Pension Fund Plan Description. The State of North Carolina contributes, on behalf of the City of Newton, to the Firemen’s and Rescue Squad Workers’ Pension Fund (Fund), a cost-sharing, multiple-employer defined benefit pension plan with a special funding situation administered by the State of North Carolina. The fund provides pension benefits for eligible fire and rescue squad workers who have elected to become members of the fund. Article 86 of G.S. Chapter 58 assigns the authority to establish and amend benefit provisions to the North Carolina General Assembly. The Firemen’s and Rescue Squad Workers’ Pension Fund is included in the Comprehensive Annual Financial Report (CAFR) for the State of North Carolina. The State’s CAFR includes financial statements and required supplementary information for the Firemen’s and Rescue Squad Workers’ Pension Fund. That report may be obtained by writing to the Office of the State Controller, 1410 Mail Service Center, Raleigh, North Carolina 27699-1410, or by calling (919) 981-5454. Funding Policy. Plan members are required to contribute $10 per month to the fund. The State, a non-employer contributor, funds the plan through appropriations. The City does not contribute to the fund. Contribution requirements of plan members and the State of North Carolina are established and may be amended by the North Carolina General Assembly. Other Post-Employment Benefits - Healthcare Benefits Plan Description. The City administers a single–employer defined benefit Healthcare Benefits Plan. According to the City of Newton Personnel Policy, the City provides post-employment healthcare benefits up to age 65 to retirees of the City, provided they meet the retirement qualifications outlined by the North Carolina Local Government Employees Retirement System, they are at least 55 years of age, and their last 20 full-time consecutive creditable years of service were with the City. This benefit will not be offered to any employee hired on or after July 1, 2006. Also, the City’s retirees can purchase coverage for their dependents at the City’s group rates. Currently eight retirees can purchase coverage for post-employment health benefits. For the fiscal year ended June 30, 2013, the City made payments for post-retirement health benefit premiums of $104,631. The City purchases insurance from a private carrier for healthcare coverage. A separate report was not issued for the plan.
- 62 -

CITY OF NEWTON, NORTH CAROLINA
NOTES TO THE FINANCIAL STATEMENTS FOR THE YEAR ENDED JUNE 30, 2013
Membership of the HCB Plan consisted of the following at December 31, 2011, the date of the latest actuarial valuation:
Law General Enforcement
Employees OfficersRetirees and dependents receiving benefits 4 4 Terminated plan members entitled to, but not yet receiving, benefits - - Active plan members 92 17
Total 96 21
Funding Policy. The City pays the full cost of coverage for the healthcare benefits paid to qualified retirees having 30 or more creditable years of service under a City resolution that can be amended by the City Council. The City’s members pay the City’s group rate for qualified retirees having 20 full-time consecutive creditable years of service. The City’s members pay the City’s group rates for dependent coverage, if enrolled in dependent coverage at the time of retirement. The City has chosen to fund the healthcare benefits on a pay-as-you-go basis. The current ARC rate is 2.72% of annual covered payroll. For the current year, the City contributed $104,631, or 2.5% of annual covered payroll. The City’s required contributions, under a City resolution, for employees not engaged in law enforcement and for law enforcement officers represented 0.6% and 0.7% of covered payroll, respectively. There were no contributions made by employees, except for dependent coverage in the amount of $226,926. Retirees are responsible for the difference between the amount charged for an active employee and the retiree rate, which is paid on a monthly basis. The City self-insures health and dental coverage for employees and retirees, which is administered by a third-party administrator. The City’s obligation to contribute to the HCB Plan is established and may be amended by the City Council. Summary of Significant Accounting Policies Post-employment expenditures are made from the General Fund, which is maintained on the modified accrual basis of accounting. No funds are set aside to pay benefits and administration costs. These expenditures are paid as they come due.
- 63 -

CITY OF NEWTON, NORTH CAROLINA
NOTES TO THE FINANCIAL STATEMENTS FOR THE YEAR ENDED JUNE 30, 2013
Annual OPEB Cost and Net Obligation The City’s annual OPEB cost (expense) is calculated based on the annual required contribution of the employer (ARC), an amount actuarially determined in accordance with the parameters of GASB Statement 45. The ARC represents a level of funding that, if paid on an ongoing basis, is projected to cover normal cost each year and amortize any unfunded actuarial liabilities (or funding excess) over a period not to exceed thirty years. The following table shows the components of the City’s annual OPEB cost for the year, the amount actually contributed to the plan, and changes in the City’s net OPEB obligation for the healthcare benefits:
Annual required contribution 114,661$ Interest on net OPEB obligation 6,853 Adjustments to annual required contribution (9,527) Annual OPEB cost (expense) 111,987 Contributions made (104,631) Increase (decrease) in net OPEB obligation 7,356 Net OPEB obligation:Beginning of year - July 1 171,332
End of year - June 30 178,688$ The City’s annual OPEB cost, the percentage of annual OPEB cost contributed to the Plan, and the net OPEB obligation for 2013 were as follows:
Percentage ofYear Ended Annual Annual OPEB Net OPEB
June 30 OPEB Cost Cost Contributed Obligation2013 111,987$ 93.4% 178,688$ 2012 99,221 141.9% 171,332 2011 91,852 119.8% 212,899
Fund Status and Funding Progress As of December 31, 2011, the most recent actuarial valuation date, the plan was not funded. The actuarial accrued liability for benefits and, thus, the unfunded actuarial accrued liability (UAAL) was $1,240,188. The covered payroll (annual payroll of active employees covered by the plan) was $4,214,285, and the ratio of the UAAL to the covered payroll was 29.4%. Actuarial valuations of an ongoing plan involve estimates of the value of reported amounts and assumptions about the probability of occurrence of events far into the future. Examples include assumptions about future employment, mortality, and healthcare trends. Amounts determined regarding the funded status of the plan and the annual required contributions of the
- 64 -

CITY OF NEWTON, NORTH CAROLINA
NOTES TO THE FINANCIAL STATEMENTS FOR THE YEAR ENDED JUNE 30, 2013
employer are subject to continual revision as actual results are compared with past expectations and new estimates are made about the future. The Schedule of Funding Progress, presented as required supplementary information following the Notes to the Financial Statements, presents multi-year trend information about whether the actuarial accrued liabilities for benefits. Actuarial Methods and Assumptions Projections of benefits for financial reporting purposes are based on the substantive plan (the plan as understood by the employer and the plan members) and include the types of benefits provided at the time of each valuation and the historical pattern of sharing of benefit costs between the employer and plan members at that point. The actuarial methods and assumptions used include techniques that are designed to reduce the effects of short-term volatility in actuarial accrued liabilities and the actuarial value assets, consistent with the long-term perspective of the calculations. In the December 31, 2011 actuarial valuation, the projected unit credit actuarial cost method was used. The actuarial assumptions included a 4.00% investment rate of return (net of administrative expenses), which is the expected long-term investment returns on the employer’s own investments calculated based on the funded level of the plan at the valuation date and an annual medical cost trend increase of 9.50 to 5.00% annually. Both rates included a 3.00% inflation assumption. The actuarial value of assets, if any, was determined using techniques that spread the effects of short-term volatility in the market value of investments over a five-year period. The UAAL is being amortized as a level percentage of projected payroll on an open basis. The remaining amortization period at December 31, 2011, was 30 years. Other Employment Benefits
The City has elected to provide death benefits to employees through the Death Benefit Plan for members of the Local Governmental Employees’ Retirement System (Death Benefit Plan), a multiple-employer, State-administered, cost-sharing plan funded on a one-year term cost basis. The beneficiaries of those employees who die in active service after one year of contributing membership in the System, or who die within 180 days after retirement or termination of service, and have at least one year of contributing membership service in the System at the time of death, are eligible for death benefits. Lump-sum death benefit payments to beneficiaries are equal to the employee’s 12 highest months’ salary in a row during the 24 months prior to the employee’s death, but the benefit may not exceed $50,000 or be less than $25,000. All death benefit payments are made from the Death Benefit Plan. The City has no liability beyond the payment of monthly contributions. The contributions to the Death Benefit Plan cannot be separated between the post-employment benefit amount and the other benefit amount. The City considers these contributions to be immaterial.
- 65 -

CITY OF NEWTON, NORTH CAROLINA
NOTES TO THE FINANCIAL STATEMENTS FOR THE YEAR ENDED JUNE 30, 2013
Deferred Inflows of Resources The balance in deferred inflows of resources for the City at year-end is composed of the following elements:
Unavailable Unearned
General Fund Revenue RevenuePrepaid assessments not yet earned -$ 11,106$ Taxes receivable, (net) 650,693 -
Total deferred/unearned revenues 650,693$ 11,106$
Risk Management The City is exposed to various risks of loss related to torts; theft of, damage to, and destruction of assets; errors and omissions; injuries to employees; and natural disaster for which the City carries commercial insurance. The City has workers’ compensation coverage up to statutory limits; law enforcement officers’ liability and public official liability of $1 million per occurrence, with a $2 million umbrella policy; auto liability of $1 million per accident; public entity general liability of $1 million per occurrence, $3 million aggregate; commercial inland marine of $1,407,125. There have been no significant reductions in insurance coverage in the prior year, and settled claims have not exceeded coverage in any of the past three fiscal years. In accordance with G.S. 159-29, the City’s employees that have access to $100 or more at any given time of the City’s funds are performance bonded through a commercial surety bond. The Finance Officer and the Tax Collector are each individually bonded for $250,000 and $150,000, respectively. The remaining employees that have access to funds are bonded under a blanket plan for $100,000 each. The City’s commercial property policy provides broad form flood coverage for specifically scheduled locations. These scheduled locations involve City physical assets located outside of any traditional 100-year flood zone. The City does have a limited number of physical assets located within 100-year flood zones. For these assets, the City has chosen to assume the risk of flood loss without the purchase of flood insurance either due to cost or the lack of availability of such insurance.
- 66 -

CITY OF NEWTON, NORTH CAROLINA
NOTES TO THE FINANCIAL STATEMENTS FOR THE YEAR ENDED JUNE 30, 2013
Deferred Compensation Plan The City offers its employees a deferred compensation plan created in accordance with Internal Revenue Code Section 457. The plan, available to all City employees, permits them to defer a portion of their salary until future years. The deferred compensation is available to participants in accordance with the plan document. All amounts of compensation deferred under the plan are held in trust for the exclusive benefit of plan participants and their beneficiaries. It is the opinion of the City’s legal counsel that the City has no liability for losses under the plan but does have the duty of due care that would be required of an ordinary prudent administrator. The plan is administered by the International City Management Association. Investments are managed by the plan trustee under several investment options or a combination thereof. The choice of the investment option(s) is made by the participants. Self-Insurance The City is self-insured for health and dental coverage for all full-time employees. Funding is provided by charges to various funds of the City and employee contributions based upon estimated claims and employee participation. The claims administrator determines estimated claims annually. Aggregate and specific stop-loss insurance coverage is provided annually by Blue Cross Blue Shield of North Carolina, who also provides contracted third-party claims administration. The City has recognized a provision of $139,623 for claims incurred but not reported, in the accompanying financial statements. This provision is estimated upon analysis of historical claims experience reviewed by the City’s third party administrator. Changes in the balances of claims liability during the past two fiscal years are as follows:
2013 2012Claims liability, beginning of year 229,184$ 283,230$ Claims incurred 872,165 1,305,477 Payments on claims (943,826) (1,359,523)
Claims liability, end of year 157,523$ 229,184$
- 67 -

CITY OF NEWTON, NORTH CAROLINA
NOTES TO THE FINANCIAL STATEMENTS FOR THE YEAR ENDED JUNE 30, 2013
Long-Term Obligations
Loans Payable The loans payable are for the acquisition of land, vehicles, equipment and various capital, electric, and water and wastewater projects. Principal and interest requirements are appropriated when due. Loans payable at June 30, 2013 are comprised of the following:
Water andGeneral Wastewater Electric
Fund Fund Fund
$184,730, 1994, McKay Road project non-interestloan payable to Catawba County, due in annualinstallments of $9,237 through July 2014 -$ 18,473$ -$
$213,393, 2006, Balls Creek Sewer non-interest loanpayable to Catawba County, due in annualinstallments of $16,908 through January 2017 - 67,631 -
$367,000, 2005, 3.07% loan payable to bank inannual installments of $43,096 for vehicles andequipment, due in 2014 82,379 - -
$2,702,929, 2005, 2.59% loan payable to bank inannual installments of $239,684 for water andwastewater capital projects, due in 2018 - 1,316,246 -
$1,766,543, 2005, 3.07% loan payable to bank inannual installments of $207,442 for electric systemimprovements, due in 2014 - - 396,531
$370,000, 2005, 3.97% loan payable to bank inannual installments of $33,208 for fire truck, due in2019 199,540 - -
$2,300,000, 2005, 2.63% loan payable to bank inannual installments of $193,614 for water andwastewater capital improvements, due in 2019 - 1,223,269 -
$2,500,000, 2005, 2.73% loan payable to bank inannual installments of $214,606 for water andwastewater capital improvements, due in 2020 - 1,350,769 -
Services By:
- 68 -
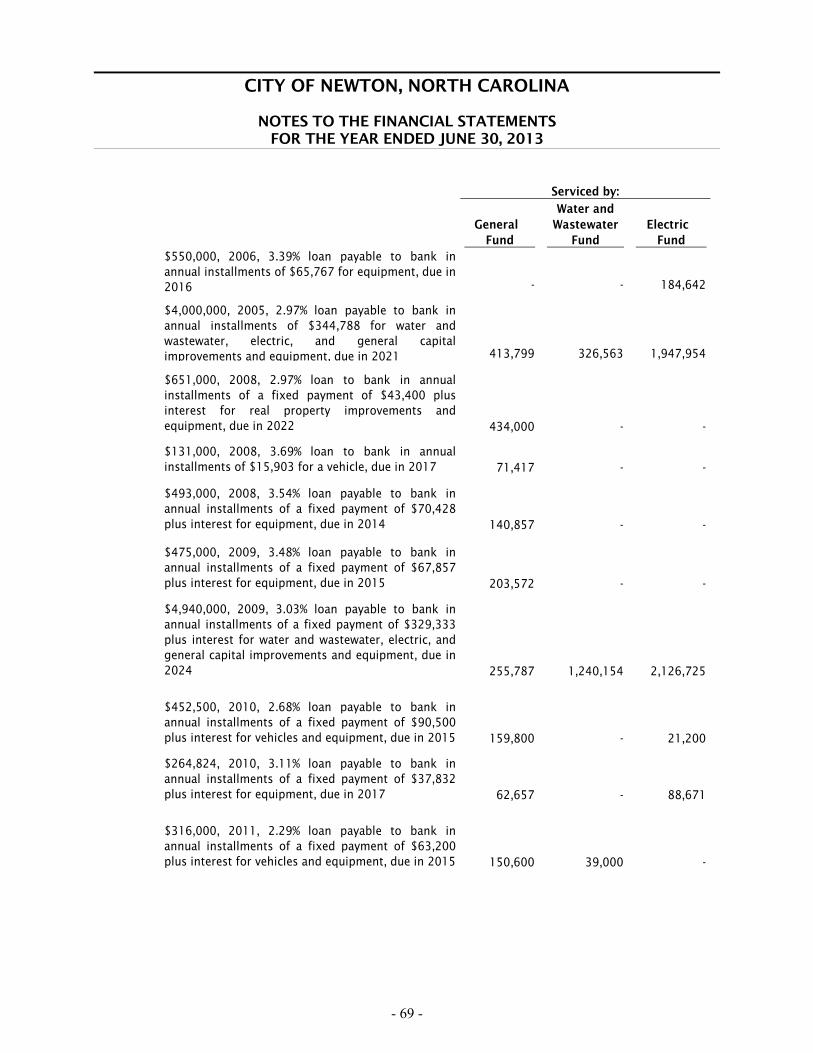
CITY OF NEWTON, NORTH CAROLINA
NOTES TO THE FINANCIAL STATEMENTS FOR THE YEAR ENDED JUNE 30, 2013
Water andGeneral Wastewater Electric
Fund Fund Fund$550,000, 2006, 3.39% loan payable to bank inannual installments of $65,767 for equipment, due in 2016 - - 184,642
$4,000,000, 2005, 2.97% loan payable to bank inannual installments of $344,788 for water andwastewater, electric, and general capitalimprovements and equipment, due in 2021 413,799 326,563 1,947,954
$651,000, 2008, 2.97% loan to bank in annualinstallments of a fixed payment of $43,400 plusinterest for real property improvements andequipment, due in 2022 434,000 - -
$131,000, 2008, 3.69% loan to bank in annualinstallments of $15,903 for a vehicle, due in 2017 71,417 - -
$493,000, 2008, 3.54% loan payable to bank inannual installments of a fixed payment of $70,428plus interest for equipment, due in 2014 140,857 - -
$475,000, 2009, 3.48% loan payable to bank inannual installments of a fixed payment of $67,857plus interest for equipment, due in 2015 203,572 - -
$4,940,000, 2009, 3.03% loan payable to bank inannual installments of a fixed payment of $329,333plus interest for water and wastewater, electric, andgeneral capital improvements and equipment, due in2024 255,787 1,240,154 2,126,725
$452,500, 2010, 2.68% loan payable to bank inannual installments of a fixed payment of $90,500plus interest for vehicles and equipment, due in 2015 159,800 - 21,200
$264,824, 2010, 3.11% loan payable to bank inannual installments of a fixed payment of $37,832plus interest for equipment, due in 2017 62,657 - 88,671
$316,000, 2011, 2.29% loan payable to bank inannual installments of a fixed payment of $63,200plus interest for vehicles and equipment, due in 2015 150,600 39,000 -
Serviced by:
- 69 -

CITY OF NEWTON, NORTH CAROLINA
NOTES TO THE FINANCIAL STATEMENTS FOR THE YEAR ENDED JUNE 30, 2013
Water andGeneral Wastewater Electric
Fund Fund Fund
$250,000, 2011, 2.65% loan payable to bank inannual installments of a fixed payment of $35,714plus interest for street/sidewalk infrastructure, duein 2018 178,571 - -
$469,000, 2012, 1.61% loan payable to bank inannual installments of a fixed payment of $94,079plus interest for vehicles and equipment, due in 2016 214,241 160,681 -
$1,742,775, 2012, 1.91% loan payable to bank inannual installments of a fixed payment of $248,968plus interest for vehicles and equipment, due in 2019 883,148 529,965 80,694
$3,256,225, 2012, 3.11% loan payable to bank inannual installments of a fixed payment of $217,082plus interest for water and wastewater, and electriccapital improvements and equipment, due in 2027 - 2,377,527 661,617
$498,921, 2012, 2.22% loan payable to the State inannual installments of a fixed payment of $29,259plus interest for wastewater capital improvements,due in 2031 - 472,662 -
$432,763, 2013, 1.56% loan payable to bank inannual installments of a fixed payment of $86,553plus interest for vehicles and equipment, due in 2018 236,982 195,781 -
$207,369, 2013, 1.78% loan payable to bank inannual installments of a fixed payment of$29,624.14 plus interest for an electrical vehicle, duein 2020 - - 207,369
$403,790, 2013, 2.60% loan payable to bank inannual installments of a fixed payment of$26,919.33 plus interest for street and water capitalimprovements, due in 2028 206,700 197,090 -
$1,340,265, 2013, 2.58% loan payable to bank inannual installments of a fixed payment of $89,351plus interest for water and wastewater and electriccapital improvements, due in 2028 - 733,456 606,810
3,894,050$ 10,249,267$ 6,322,213$
Serviced by:
- 70 -

CITY OF NEWTON, NORTH CAROLINA
NOTES TO THE FINANCIAL STATEMENTS FOR THE YEAR ENDED JUNE 30, 2013
Annual debt service requirements to maturity for the City’s long-term obligations are as follows:
Year EndedJune 30 Principal Interest
Governmental Activities:2014 768,247$ 101,821$ 2015 772,198 81,375 2016 582,855 61,026 2017 466,898 46,447 2018 401,267 35,325
2019-2023 808,432 69,075 2024-2028 94,153 6,073 2029-2031 - -
Total governmental activities 3,894,050 401,142
Business-Type Activities:Water and Wastewater Fund:
2014 1,154,977 275,626 2015 1,170,356 246,112 2016 1,176,908 216,167 2017 1,179,522 185,800 2018 1,139,535 155,371
2019-2023 3,117,880 400,686 2024-2028 1,231,311 97,774 2029-2031 78,778 3,498
Total Water and Wastewater Fund 10,249,267 1,581,034
Electric Fund:2014 803,626 185,510 2015 817,340 161,647 2016 613,434 137,404 2017 555,869 119,357 2018 539,927 103,288
2019-2023 2,407,175 282,191 2024-2028 584,842 36,211 2029-2031 - -
Total Electric Fund 6,322,213 1,025,608
Total business-type activities 16,571,480 2,606,642
Total all activities 20,465,530$ 3,007,784$
Loans Payable
At June 30, 2013, the City of Newton had a legal debt margin of $66,218,862.
- 71 -

CITY OF NEWTON, NORTH CAROLINA
NOTES TO THE FINANCIAL STATEMENTS FOR THE YEAR ENDED JUNE 30, 2013
Changes in Long-Term Liabilities The following is a summary of changes in long-term debt for the year ended June 30, 2013.
CurrentPortion of
July 1, 2012 Increases Decreases June 30, 2013 BalanceGovernmental Activities:
Loans payable 4,329,031$ 443,682$ 878,663$ 3,894,050$ 768,247$ Compensated absences 414,715 270,315 268,461 416,569 263,015 Other post-employment benefits 130,332 85,188 79,592 135,928 - Net pension benefit obligation 304,341 63,083 50,854 316,570 -
Total governmental activities 5,178,419$ 862,268$ 1,277,570$ 4,763,117$ 1,031,262$
Business-Type Activities:Water and Wastewater Fund:Loans payable 10,208,097$ 1,135,174$ 1,094,004$ 10,249,267$ 1,154,977$ Compensated absences 83,250 78,310 82,693 78,867 76,851 Other post-employment benefits 30,754 20,102 18,782 32,074 - Total Water and Wastewater Fund 10,322,101 1,233,586 1,195,479 10,360,208 1,231,828
Electric Fund:Loans payable 6,260,520 814,179 752,486 6,322,213 803,626 Compensated absences 33,620 32,066 40,304 25,382 25,382 Other post-employment benefits 10,246 6,697 6,257 10,686 - Total Electric Fund 6,304,386 852,942 799,047 6,358,281 829,008
Total business-type activities 16,626,487$ 2,086,528$ 1,994,526$ 16,718,489$ 2,060,836$
Compensated absences, OPEB, and net pension obligation for governmental activities typically have been liquidated in the General Fund.
C. Interfund Balances and Activity
Transfers are used to: 1) move unrestricted General Fund revenues to finance various programs that the government must account for in other funds in accordance with budgetary authorizations, including amounts provided as subsidies or matching funds for various grant programs and 2) move funds from the fund with collection authorization to other funds to stabilize rates.
- 72 -

CITY OF NEWTON, NORTH CAROLINA
NOTES TO THE FINANCIAL STATEMENTS FOR THE YEAR ENDED JUNE 30, 2013
Transfers to/from other funds at June 30, 2013 consist of the following:
From the General Fund to the General Capital Projects Fund for capital project expenditures 410,806$
From the CDBG-Moretz Industry Access Road Fund to the General Fund for return of unspent project funding 2,511
From the Main Street Energy Grant Fund to the General Fund for return of unspent project funding 84
From the General Capital Projects Fund to the General Fund for return of unspent project funding 22,016
From the Electric Fund to the General Fund for local contribution 10,000
Total 445,417$ Interfund loans are summarized as follows:
Fund Name Due From Due To Purpose
Business-type activities 189,821$
Governmental activities 189,821$ Allocation of Internal Service Fund equity
D. Revenues, Expenditures, and Expenses On-Behalf Payments for Fringe Benefits and Salaries For the fiscal year ended June 30, 2013, the City of Newton has recognized on-behalf payments for pension contributions made by the State as a revenue and an expenditure of $15,129 for the 51 employed firemen who perform firefighting duties for the City. The employees elected to be members of the Firemen and Rescue Squad Workers’ Pension Fund, a cost-sharing, multiple employer public employee retirement system established and administered by the State of North Carolina. The plan is funded by a $10 monthly contribution paid by each member, investment income, and a State appropriation.
- 73 -

CITY OF NEWTON, NORTH CAROLINA
NOTES TO THE FINANCIAL STATEMENTS FOR THE YEAR ENDED JUNE 30, 2013
Also, the City has recognized as a revenue and an expenditure on-behalf payment for fringe benefits and salaries of $10,812 for the salary supplement and stipend benefits paid to eligible firemen by the local Board of Trustees of the Firemen’s Relief Fund during the fiscal year ended June 30, 2013. Under State law, the local Board of Trustees for the fund receives an amount each year, which the Board may use at its own discretion for eligible firemen or their departments.
3. Jointly Governed Organization North Carolina Municipal Power Agency Number 1 (NCMPA1) The City, in conjunction with eighteen other local governments in the Piedmont and Foothills Region of North Carolina, is a member of the North Carolina Municipal Power Agency Number 1 (NCMPA1). The NCMPA1 has 75% ownership interest in Catawba Nuclear Station Unit 2, located in York County, South Carolina, which is operated by Duke Energy. It also has an agreement with Duke Energy that provides for electric power via McGuire Nuclear Station and Catawba Unit 1 should Catawba Nuclear Station Unit 2 be unavailable for service. NCMPA1 is governed by a Board of Commissioners, which consists of fourteen members elected throughout North Carolina. Each participating government appoints one Commissioner and an alternate Commissioner to the Board. The nineteen members, who receive power from the NCMPA1, have signed power sales agreements to purchase a specified share of the power generated by the NCMPA1. NCMPA1 revenues derived from the Power Sales Agreement are pledged as security for the Power Agency bonds outstanding. The City’s purchase of power for the fiscal year ended June 30, 2013 was $10,422,957. Newton-Conover Auditorium Authority The Newton-Conover Auditorium Authority was organized and incorporated by the Secretary of State of North Carolina as a non-profit corporation on December 27, 1990. It is composed of a Board of Directors including members appointed by the City of Newton (four members), Newton-Conover School Board (three members), and the Catawba County Board of Commissioners (three members). The Authority’s responsibilities include the restoration and renovation of the former Newton-Conover High School auditorium for use as a civic auditorium for a wide range of community activities. This community auditorium is available for use by individuals, civic groups, the schools, and the local community theater group. The City funded $25,000 to the Newton-Conover Auditorium Authority during fiscal year ended June 30, 2013.
- 74 -

CITY OF NEWTON, NORTH CAROLINA
NOTES TO THE FINANCIAL STATEMENTS FOR THE YEAR ENDED JUNE 30, 2013
Western Piedmont Council of Governments The Western Piedmont Council of Governments (WPCOG) is a regional planning organization. It consists of twenty-four municipalities and four counties within western North Carolina. The WPCOG’s governing Board is comprised of one elected official from each of these local governments and seven at-large citizen members. Each local government has one vote. The City paid membership dues of $12,545 during fiscal year ended June 30, 2013. Western Piedmont Regional Transit Authority Western Piedmont Regional Transit Authority (WPRTA) is the first regional public transportation authority with consolidated urban-rural transit service in North Carolina. Alexander, Burke, Caldwell, and Catawba Counties in conjunction with the municipalities of Conover, Hickory, and Newton each appoint one member to the governing board of the WPRTA. The City paid $29,578 to WPRTA during fiscal year ended June 30, 2013.
4. Related Party Transaction The City entered into a transaction to rent a facility owned by a member of the City Council. The amount paid for rent was $200. Prior to the rental of the facility, the City adopted resolution #9-2012, exempting the City of Newton from North Carolina General Statute 14-234.
5. Summary Disclosure of Significant Contingencies Federal and State-Assisted Programs The City has received proceeds from several Federal and State grants. Periodic audits of these grants are required and certain costs may be questioned as not being appropriate expenditures under the grant agreements. Such audits could result in the refund of grant monies to the grantor agencies. Management believes that any required refunds will be immaterial. No provision has been made in the accompanying financial statements for the refund of grant monies.
- 75 -

CITY OF NEWTON, NORTH CAROLINA
NOTES TO THE FINANCIAL STATEMENTS FOR THE YEAR ENDED JUNE 30, 2013
6. Change in Accounting Principles The City implemented Governmental Accounting Standards Board (GASB) Statement 63, Financial Reporting of Deferred Outflows of Resources, Deferred Inflows of Resources, and Net Position, and Statement 65, Items Previously Reported as Assets and Liabilities, in the fiscal year ending June 30, 2013. In accordance with GASB Statement 63, the Statement of Net Assets has been replaced with the Statement of Net Position. Items on the Statement of Net Position are now classified into Assets, Deferred Outflows of Resources, Liabilities, Deferred Inflows of Resources, and Net Position. Additionally, GASB Statement 65 requires that deferred costs from the refunding of debt, which were previously deferred and amortized, be presented as deferred outflows of resources.
7. Significant Effects of Subsequent Events On July 27, 2013, the City was subject to a devastating flood that damaged storm water, water, wastewater and electric infrastructure as well as damage to the City’s greenway and various parks. The City estimates that damage, with a recorded value of approximately $762,300, was caused by the flood. While the exact amount of the loss is not currently determinable, the City has recovered $45,173 of the value through insurance proceeds. Catawba County has filed a request for aid from the Federal Emergency Management Agency (FEMA) for 75% of eligible costs on behalf of Catawba County and each respective municipality for disaster relief. On September 25, 2013, Governor Pat McCrory received a Federal disaster declaration which did not include Catawba County. The State is appealing to FEMA to reconsider their decision.
- 76 -
REQUIRED SUPPLEMENTARY INFORMATION
This section contains additional information required by generally accepted accounting principles
• Schedule of Funding Progress for the Law Enforcement Officers’ Special Separation Allowance.
• Schedule of Employer Contributions for the Law Enforcement Officers’ Special Separation Allowance.
• Notes to the Required Schedules for the Law
Enforcement Officers’ Special Separation Allowance.
• Schedule of Funding Progress for the Other
Post-Employment Benefits.
• Schedule of Employer Contributions for the Other Post-Employment Benefits.
• Notes to the Required Schedules for the
Other Post-Employment Benefits.


Schedule A-1
ActuarialAccrued
Actuarial Liability (AAL) UAAL as aActuarial Value of Projected Unit Unfunded Funded Covered % of CoveredValuation Assets Credit AAL (UAAL) Ratio Payroll Payroll
Date (A) (B) (B-A) (A/B) (C) ((B-A)/C)
12/31/2012 -$ 588,037$ 588,037$ 0.00% 1,343,895$ 43.76%12/31/2011 - 605,427 605,427 0.00% 1,386,990 43.65%12/31/2010 - 603,280 603,280 0.00% 1,351,119 44.65%12/31/2009 - 690,159 690,159 0.00% 1,487,330 46.40%12/31/2008 - 596,166 596,166 0.00% 1,331,679 44.77%12/31/2007 - 571,026 571,026 0.00% 1,289,622 44.28%12/31/2006 - 553,357 553,357 0.00% 1,327,546 41.68%12/31/2005 - 519,076 519,076 0.00% 1,290,773 40.21%12/31/2004 - 522,202 522,202 0.00% 1,335,544 39.10%12/31/2003 - 440,375 440,375 0.00% 1,226,127 35.92%12/31/2002 - 449,478 449,478 0.00% 1,202,209 37.39%12/31/2001 - 385,678 385,678 0.00% 1,178,694 32.72%12/31/2000 - 332,747 332,747 0.00% 1,120,483 29.70%
AnnualRequired Percentage
Year Ended Contribution of ARCJune 30 (ARC) Contributed
2013 66,806$ 76.12%2012 64,714 71.33%2011 69,554 4.67%2010 58,869 4.42%2009 55,205 4.28%2008 53,341 3.87%2007 50,760 3.79%2006 56,192 4.13%2005 49,590 3.97%2004 49,724 4.06%
Notes to the Required Schedules:
The information presented in the required supplementary schedules was determined as part of the actuarialat the dates indicated. Additional information as valuation of the latest actuarial valuation follows:
Valuation date December 31, 2011Actuarial cost method Projected unit creditAmortization method Level percent of pay, closedRemaining amortization period 19 yearsAsset valuation method Market valueActuarial assumptions:Investment rate of return 5.00%Projected salary increases 4.25% to 7.85%Includes inflation at 3.00%Cost of living adjustments N/A
Schedule of Funding Progress
Schedule of Employer Contributions
CITY OF NEWTON, NORTH CAROLINA
LAW ENFORCEMENT OFFICERS' SPECIAL SEPARATION ALLOWANCEREQUIRED SUPPLEMENTARY INFORMATION
FOR THE YEAR ENDED JUNE 30, 2013
- 77 -

Schedule A-2
ActuarialAccrued
Actuarial Liability (AAL) UAAL as aActuarial Value of Projected Unit Unfunded Funded Covered % of CoveredValuation Assets Credit AAL (UAAL) Ratio Payroll Payroll
Date (A) (B) (B-A) (A/B) (C) ((B-A)/C)
12/31/2011 -$ 1,240,188$ 1,240,188$ 0.00% 4,214,285$ 29.43%12/31/2010 - 1,124,469 1,124,469 0.00% 4,555,127 24.69%12/31/2009 - 998,624 998,624 0.00% 5,112,117 19.53%12/31/2008 - 1,789,597 1,789,597 0.00% 5,694,669 31.43%
Note: The City of Newton implemented GASB Statement No. 45 for the fiscal year ended June 30, 2009. As the City has additional actuary valuations performed, previous years information will be added to this schedule.
AnnualRequired Percentage
Year Ended Contribution of ARCJune 30 (ARC) Contributed
2013 114,661$ 91.25%2012 102,543 137.30%2011 95,458 115.25%2010 187,915 47.32%2009 197,926 28.60%
Notes to the Required Schedules:
The information presented in the required supplementary schedules was determined as part of the actuarial valuationsat the dates indicated. Additional information as of the latest actuarial valuation follows:
Valuation date December 31, 2011Actuarial cost method Projected unit creditAmortization method Level dollar amount, openRemaining amortization period 30 yearsAsset valuation method Market value of assetsActuarial assumptionsInvestment rate of return* 4.00%Medical trend rate 9.50% - 5.00%Year of ultimate trend rate 2018* Includes inflation of 3.00%
Schedule of Employer Contributions
Schedule of Funding Progress
CITY OF NEWTON, NORTH CAROLINA
OTHER POST-EMPLOYMENT BENEFITS - RETIREE HEALTH PLAN
REQUIRED SUPPLEMENTARY INFORMATIONSCHEDULE OF FUNDING PROGRESS
FOR THE YEAR ENDED JUNE 30, 2013
- 78 -

GOVERNMENTAL ACTIVITIES
MAJOR FUNDS
GENERAL FUND
The General Fund is used to account for resources traditionally associated with government which are not required legally or by sound financial management to be accounted for in another fund.


Schedule 1Page 1 of 4
Final Variance 2012Budget Actual Over/Under Actual
Revenues:Ad Valorem Taxes:Current year 4,949,900$ 4,964,241$ 14,341$ 4,857,198$ Prior years 125,000 171,696 46,696 158,838 Refunds - (39,233) (39,233) - Penalties and interest 35,000 39,369 4,369 29,690
Total 5,109,900 5,136,073 26,173 5,045,726
Other Taxes and Licenses:Local option sales tax 2,810,000 2,595,442 (214,558) 2,580,288 Solid waste disposal tax 9,300 7,307 (1,993) 8,873 Other taxes and licenses 19,000 4,681 (14,319) 29,370 Rural fire district tax 353,750 353,764 14 351,316
Total 3,192,050 2,961,194 (230,856) 2,969,847
Unrestricted Intergovernmental Revenues:Payments in lieu of taxes 370,550 370,550 - 365,550Utility franchise tax 800,000 759,087 (40,913) 781,701Beer and wine tax 62,700 52,370 (10,330) 56,304
Total 1,233,250 1,182,007 (51,243) 1,203,555
Restricted Intergovernmental Revenues:Federal grants 24,500 63,147 38,647 178,713Federal asset seizure allocation 5,000 15,163 10,163 2,244Other 15,000 2,576 (12,424) 26,668 On-behalf payments - fire - 25,941 25,941 26,213 Powell Bill State street aid allocation 382,500 388,401 5,901 379,971
Total 427,000 495,228 68,228 613,809
Permits and Fees:Privilege and peddler's license 121,400 40,730 (80,670) 360 Local franchise - cable tv 91,000 79,400 (11,600) 84,662
Total 212,400 120,130 (92,270) 85,022
Sales and Services:Supportive court services 4,500 5,613 1,113 5,295Refuse collection fees 717,050 738,498 21,448 555,234Recreation fees and concessions 70,800 61,184 (9,616) 59,263Other 47,000 64,269 17,269 48,444
Total 839,350 869,564 30,214 668,236
Investment Earnings 6,300 10,271 3,971 6,751
Miscellaneous:Rentals and sale of property 72,200 100,623 28,423 82,340 Other 100,550 139,428 38,878 1,315,621 Total 172,750 240,051 67,301 1,397,961
Total revenues 11,193,000 11,014,518 (178,482) 11,990,907
Expenditures:General Government:Governing body:Salaries and employee benefits 50,000 48,881 43,167Other operating expenditures 8,950 6,559 23,863Interdepartmental charges (37,700) (37,700) (39,300)
Total 21,250 17,740 3,510 27,730
2013
CITY OF NEWTON, NORTH CAROLINA
GENERAL FUNDSCHEDULE OF REVENUES, EXPENDITURES, AND CHANGES
IN FUND BALANCE - BUDGET AND ACTUALFOR THE YEAR ENDED JUNE 30, 2013
WITH COMPARATIVE ACTUAL AMOUNTS FOR THE YEAR ENDED JUNE 30, 2012
- 79 -

Schedule 1Page 2 of 4
Final Variance 2012Budget Actual Over/Under Actual
2013
CITY OF NEWTON, NORTH CAROLINA
GENERAL FUNDSCHEDULE OF REVENUES, EXPENDITURES, AND CHANGES
IN FUND BALANCE - BUDGET AND ACTUALFOR THE YEAR ENDED JUNE 30, 2013
WITH COMPARATIVE ACTUAL AMOUNTS FOR THE YEAR ENDED JUNE 30, 2012
Administration:Salaries and employee benefits 317,700 315,978 248,484Other operating expenditures 133,000 107,387 91,014Capital outlay - - 9,722 Interdepartmental charges (281,300) (281,300) (200,450)
Total 169,400 142,065 27,335 148,770
Finance:Salaries and employee benefits 450,400 446,606 410,806 Other operating expenditures 198,400 163,552 159,733 Interdepartmental charges (534,400) (534,400) (476,250)
Total 114,400 75,758 38,642 94,289
Purchasing/Warehouse:Salaries and employee benefits 103,550 102,906 100,624 Other operating expenditures 17,300 11,860 11,227 Capital outlay - - 23,662 Interdepartmental charges (107,600) (107,600) (103,750)
Total 13,250 7,166 6,084 31,763
Technology/MIS:Salaries and employee benefits 132,450 131,630 128,970Other operating expenditures 160,350 156,451 169,738Capital outlay 16,400 16,356 33,184Interdepartmental charges (180,200) (180,200) (195,650)
Total 129,000 124,237 4,763 136,242
Human Resources:Salaries and employee benefits 298,800 266,664 293,386Other operating expenditures 167,350 142,413 132,703Interdepartmental charges (92,700) (92,700) (58,400)
Total 373,450 316,377 57,073 367,689
Planning:Salaries and employee benefits 180,600 122,586 252,674Other operating expenditures 40,700 25,068 61,091Capital outlay 27,200 26,168 7,295 Interdepartmental charges (47,900) (47,900) (226,950)
Total 200,600 125,922 74,678 94,110
Municipal Building:Other operating expenditures 179,850 131,875 135,639Capital outlay 93,300 94,872 13,472
Total 273,150 226,747 46,403 149,111
Public Works Administration:Salaries and employee benefits 145,950 134,722 138,705Other operating expenditures 62,300 56,944 73,693 Capital outlay - - 7,295 Interdepartmental charges (150,700) (150,700) (152,400)
Total 57,550 40,966 16,584 67,293
Garage:Salaries and employee benefits 105,300 103,709 97,952 Other operating expenditures 49,250 47,380 48,366 Capital outlay 16,450 16,424 - Interdepartmental charges (59,400) (59,400) (42,650)
Total 111,600 108,113 3,487 103,668
- 80 -

Schedule 1Page 3 of 4
Final Variance 2012Budget Actual Over/Under Actual
2013
CITY OF NEWTON, NORTH CAROLINA
GENERAL FUNDSCHEDULE OF REVENUES, EXPENDITURES, AND CHANGES
IN FUND BALANCE - BUDGET AND ACTUALFOR THE YEAR ENDED JUNE 30, 2013
WITH COMPARATIVE ACTUAL AMOUNTS FOR THE YEAR ENDED JUNE 30, 2012
Downtown Public Parking:Other operating expenditures 6,050 5,560 490 5,414
Total general government 1,469,700 1,190,651 279,049 1,226,079
Transportation:Streets:Salaries and employee benefits 281,300 278,330 257,435Other operating expenditures 136,400 133,904 188,792Capital outlay 302,350 302,316 188,271
Total 720,050 714,550 5,500 634,498
Powell Bill:Salaries and employee benefits 133,650 128,251 129,322Other operating expenditures 313,450 263,477 169,388
Total 447,100 391,728 55,372 298,710
Total transportation 1,167,150 1,106,278 60,872 933,208
Environmental Protection:Sanitation:Salaries and employee benefits 573,000 511,458 506,953Other operating expenditures 409,600 409,101 380,024Capital outlay 356,050 355,921 12,538
Total 1,338,650 1,276,480 62,170 899,515
Total environmental protection 1,338,650 1,276,480 62,170 899,515
Public Safety:Police Department:Salaries and employee benefits 2,492,200 2,379,963 2,349,384Other operating expenditures 499,150 453,115 392,474Capital outlay 363,500 178,846 562,724Interdepartmental charges (2,250) (2,250) (2,200)
Total 3,352,600 3,009,674 342,926 3,302,382
Fire Department:Salaries and employee benefits 1,722,750 1,676,535 1,648,937Other operating expenditures 370,000 362,789 326,746Capital outlay 106,800 - 202,112Interdepartmental charges (106,100) (106,100) (102,350)
Total 2,093,450 1,933,224 160,226 2,075,445
Total public safety 5,446,050 4,942,898 503,152 5,377,827
Cultural and Recreational:Administration:Salaries and employee benefits 558,000 540,422 543,297Other operating expenditures 120,750 107,003 123,247
Total 678,750 647,425 31,325 666,544
Central Recreation Center:Salaries and employee benefits 30,600 21,071 21,235Other operating expenditures 33,700 27,937 41,106
Total 64,300 49,008 15,292 62,341
Swimming Pool:Salaries and employee benefits 30,250 28,637 22,035 Other operating expenditures 47,850 46,964 34,490
Total 78,100 75,601 2,499 56,525
- 81 -

Schedule 1Page 4 of 4
Final Variance 2012Budget Actual Over/Under Actual
2013
CITY OF NEWTON, NORTH CAROLINA
GENERAL FUNDSCHEDULE OF REVENUES, EXPENDITURES, AND CHANGES
IN FUND BALANCE - BUDGET AND ACTUALFOR THE YEAR ENDED JUNE 30, 2013
WITH COMPARATIVE ACTUAL AMOUNTS FOR THE YEAR ENDED JUNE 30, 2012
Parks:Salaries and employee benefits 52,300 33,749 49,730Other operating expenditures 89,900 85,484 82,694 Capital outlay 90,550 89,910 -
Total 232,750 209,143 23,607 132,424
Cemeteries:Salaries and employee benefits 162,600 151,006 156,030Other operating expenditures 26,800 25,148 23,225Capital outlay 6,600 6,525 -
Total 196,000 182,679 13,321 179,255
Special Appropriations:Other operating expenditures 1,101,450 916,697 184,753 911,809
Total cultural and recreational 2,351,350 2,080,553 270,797 2,008,898
Debt Service:Principal paid on installment purchase 880,800 878,663 777,353 Interest and fees 125,600 122,930 136,849
Total debt service 1,006,400 1,001,593 4,807 914,202
Total expenditures 12,779,300 11,598,453 1,180,847 11,359,729
Revenues over (under) expenditures (1,586,300) (583,935) 1,002,365 631,178
Other Financing Sources (Uses):Issuance of debt 608,200 443,682 (164,518) 1,298,339 Transfers from other governmental funds 24,650 24,611 (39) - Transfers from Electric Fund 10,000 10,000 - 3,350 Transfers to other governmental funds (410,850) (410,806) 44 (174,335) Appropriated fund balance 1,354,300 - (1,354,300) -
Total other financing sources (uses) 1,586,300 67,487 (1,518,813) 1,127,354
Net change in fund balance -$ (516,448) (516,448)$ 1,758,532$
Fund Balance:Beginning of year - July 1 5,724,128 Increase (decrease) in reserve for inventory 16,281
End of year - June 30 5,223,961$
- 82 -

GOVERNMENTAL ACTIVITIES
NONMAJOR FUNDS
SPECIAL REVENUE FUNDS
Special revenue funds account for the proceeds of special revenue sources that are legally restricted to the expenditure for special purposes. CDBG-Moretz Industry Access Road Special Revenue Fund – This fund is used to account for financial resources to be used to construct an access road. Main Street Energy Special Revenue Fund – This fund is used to account for financial resources to provide energy efficient lighting to City facilities. Special Revenue Fund - General - This fund is used to account for financial resources that are legally restricted for special purposes not accounted for by an individual fund.
CAPITAL PROJECTS FUND
Capital projects funds account for funds to be used for the acquisition or construction of major capital facilities other than those financed by propriety funds. General Capital Projects Fund - This fund is used to account for financial resources to be used for the acquisition or construction of general capital projects not accounted for by an individual fund.


Sch
ed
ule
2
Cap
ital
Pro
ject
Fu
nd
CD
BG
-Mo
retz
Ind
ust
ryM
ain
Str
eet
Sp
eci
al
Gen
era
l T
ota
lA
ccess
Ro
ad
En
erg
yR
even
ue
Cap
ital
No
nm
ajo
rSp
eci
al
Gra
nt
Fu
nd
-Pro
ject
Go
vern
men
tal
Reven
ue F
un
dFu
nd
Gen
era
lFu
nd
Fu
nd
s
Ass
ets
:C
urr
ent
asse
ts:
Cas
h a
nd
inve
stm
ents
-$
-$
1,7
34
$
33
5,0
63
$
33
6,7
97
$
Due
from
oth
er g
ove
rnm
ents
-
-
-
2,1
64
2,1
64
Tota
l as
sets
-
$
-$
1,7
34
$
33
7,2
27
$
33
8,9
61
$
Lia
bil
itie
s an
d F
un
d B
ala
nce
:Lia
bil
itie
s:A
ccounts
pay
able
-$
-$
-$
11
1,9
33
$
11
1,9
33
$
Fu
nd
Bala
nce
s:Res
tric
ted
- s
tab
iliz
atio
n
b
y St
ate
stat
ute
-
-
-
12
7,3
64
12
7,3
64
Res
tric
ted
-
-
1,7
34
-
1,7
34
Com
mit
ted
-
-
-
97
,93
0
97
,93
0
Tota
l net
ass
ets
-
-
1,7
34
22
5,2
94
22
7,0
28
Tota
l liab
ilit
ies
and
fund
bal
ance
s-
$
-$
1,7
34
$
33
7,2
27
$
33
8,9
61
$
Sp
eci
al
Reven
ue F
un
ds
JUN
E 3
0, 2
013
CO
MBIN
ING
BA
LA
NC
E S
HEET
NO
NM
AJO
R G
OV
ER
NM
EN
TA
L F
UN
DS
CIT
Y O
F N
EW
TO
N, N
OR
TH
CA
RO
LIN
A
- 83 -

Sch
ed
ule
3
Cap
ital
Pro
ject
Fu
nd
CD
BG
-Mo
retz
Ind
ust
ryM
ain
Str
eet
Sp
eci
al
Gen
era
l T
ota
lA
ccess
Ro
ad
En
erg
yR
even
ue
Cap
ital
No
nm
ajo
rSp
eci
al
Gra
nt
Fu
nd
-Pro
ject
sG
overn
men
tal
Reven
ue F
un
dFu
nd
Gen
era
lFu
nd
Fu
nd
s
Reven
ues:
Mis
cella
neous
reve
nue
-$
-$
1,3
65
$
-$
1,3
65
$
Exp
en
dit
ure
s:C
urr
ent:
Econom
ic a
nd p
hys
ical
deve
lopm
ent
-
-
1,0
00
-
1,0
00
Cap
ital
outl
ay-
-
-
251,3
14
251,3
14
Tota
l expendit
ure
s-
-
1,0
00
251,3
14
252,3
14
Reve
nues
ove
r (u
nder)
expendit
ure
s-
-
365
(251,3
14)
(250,9
49)
Oth
er
Fin
an
cin
g S
ou
rces
(Use
s):
Tra
nsf
ers
fro
m o
ther
funds
-
-
-
410,8
06
410,8
06
Tra
nsf
ers
to o
ther
funds
(2,5
11)
(84)
-
(22,0
16)
(24,6
11)
Tota
l oth
er
finan
cing s
ourc
es
(use
s)(2
,511)
(84)
-
388,7
90
386,1
95
Net
chan
ge in f
und b
alan
ces
(2,5
11)
(84)
365
137,4
76
135,2
46
Fu
nd
Bala
nce
s:Begin
nin
g o
f ye
ar -
July
12,5
11
84
1,3
69
87,8
18
91,7
82
End o
f ye
ar -
June 3
0-
$
-$
1,7
34
$
225,2
94
$
227,0
28
$
Sp
eci
al R
even
ue F
un
ds
CIT
Y O
F N
EW
TO
N, N
OR
TH
CA
RO
LIN
A
NO
NM
AJO
R G
OV
ER
NM
EN
TA
L F
UN
DS
CO
MBIN
ING
ST
AT
EM
EN
T O
F R
EV
EN
UES, E
XPEN
DIT
UR
ES ,
AN
D C
HA
NG
ES I
N F
UN
D B
ALA
NC
ES
FO
R T
HE Y
EA
R E
ND
ED
JU
NE 3
0, 2
01
3
- 84 -

Schedule 4
Project Prior Current Closed TotalAuthorization Years Year Projects to Date
Revenues:Restricted intergovernmental revenue 450,000$ -$ -$ -$ -$ Project contributions 100,000 - - - -
Total revenues 550,000 - - - -
Expenditures:Construction 1,055,450 - - - -
Revenues over (under) expenditures (505,450) - - - -
Other Financing Sources (Uses):Transfers from - General Fund 508,000 2,511 - (2,511) - Transfers to - General Fund (2,550) - (2,511) 2,511 -
Total other financing sources (uses) 505,450 2,511 (2,511) - -
Net change in fund balance -$ 2,511$ (2,511)$ -$ -$
Actual
CITY OF NEWTON, NORTH CAROLINA
CDBG-MORETZ INDUSTRY ACCESS ROAD SPECIAL REVENUE FUND
IN FUND BALANCE - BUDGET AND ACTUALSCHEDULE OF REVENUES, EXPENDITURES, AND CHANGES
FROM INCEPTION AND FOR THE YEAR ENDED JUNE 30, 2013
- 85 -

Schedule 5
Project Prior Current Closed TotalAuthorization Years Year Projects to Date
Revenues:Restricted intergovernmental revenue 6,310$ -$ -$ -$ -$
Expenditures:Construction 15,650 - - - -
Revenues over (under) expenditures (9,340) - - - -
Other Financing Sources (Uses):Transfers from - General Fund 9,440 84 - (84) - Transfers to - General Fund (100) - (84) 84 -
Total other financing sources (uses) 9,340 84 (84) - -
Net change in fund balance -$ 84$ (84)$ -$ -$
Actual
CITY OF NEWTON, NORTH CAROLINA
MAIN STREET ENERGY GRANT FUNDSCHEDULE OF REVENUES, EXPENDITURES, AND CHANGES
IN FUND BALANCE - BUDGET AND ACTUALFROM INCEPTION AND FOR THE YEAR ENDED JUNE 30, 2013
- 86 -

Schedule 6
Project Prior Current Closed TotalAuthorization Years Year Projects to Date
Revenues:Restricted intergovernmental revenue 80,830$ -$ -$ -$ -$ Miscellaneous 2,750 1,369 1,365 - 2,734
Total revenues 83,580 1,369 1,365 - 2,734
Expenditures:Economic and physical developmentMain Street Solutions Fund Grant 80,830 - - - - CDBG Rehabilitation 2,750 - 1,000 - 1,000
Total expenditures 83,580 - 1,000 - 1,000
Net change in fund balance -$ 1,369$ 365$ -$ 1,734$
CITY OF NEWTON, NORTH CAROLINA
SPECIAL REVENUE FUND - GENERALSCHEDULE OF REVENUES, EXPENDITURES, AND CHANGES
IN FUND BALANCE - BUDGET AND ACTUALFROM INCEPTION AND FOR THE YEAR ENDED JUNE 30, 2013
Actual
- 87 -

Schedule 7
Project Prior Current Closed TotalAuthorization Years Year Projects to Date
Expenditures:Capital Outlay:Culvert replacement projects 4,200$ 4,184$ -$ (4,184)$ -$ N. Ashe storm water drainage replacement 137,750 - - - - AC Little Culvert 270,000 - 173,604 - 173,604 Startown Fire Station renovations 119,350 50,492 68,547 - 119,039 New fire headquarters 3,050,000 - 9,163 - 9,163
Total expenditures 3,581,300 54,676 251,314 (4,184) 301,806
Revenues over (under) expenditures (3,581,300) (54,676) (251,314) 4,184 (301,806)
Other Financing Sources (Uses):Issuance of long-term debt 3,050,000 - - - - Transfers from General Fund 553,300 142,494 410,806 (26,200) 527,100 Transfers to General Fund (22,000) - (22,016) 22,016 -
Total other financing sources (uses) 3,581,300 142,494 388,790 (4,184) 527,100
Net change in fund balance -$ 87,818$ 137,476$ -$ 225,294$
Actual
CITY OF NEWTON, NORTH CAROLINA
GENERAL CAPITAL PROJECTS FUNDSCHEDULE OF REVENUES, EXPENDITURES, AND CHANGES
IN FUND BALANCE - BUDGET AND ACTUALFROM INCEPTION AND FOR THE YEAR ENDED JUNE 30, 2013
- 88 -

BUSINESS-TYPE ACTIVITIES
ENTERPRISE FUNDS
Enterprise funds are used to account for operations that are financed and operated in a manner similar to private business enterprises - where the intent of the government’s governing body is that the costs of providing goods or services to the general public on a continuing basis be financed or recovered primarily through user charges or where the government’s governing body has decided that periodic determination of net income is appropriate for accountability purposes.
Water and Wastewater Fund - This fund is used to account for the activities associated with the production, distribution and transmission of potable water by the City to its users and for the operation and maintenance of the City’s sewer and surface drainage systems.
Electric Fund - This fund is used to account for the activities associated with the distribution and transmission of electricity by the City to its users.
INTERNAL SERVICE FUND
Internal service funds are used to account for the financing of goods or services provided by one department or agency to other departments or agencies of the City on a cost-reimbursement basis.
Health Insurance Fund – This fund is used to account for the medical claims of the City’s employees and their covered dependents.


Page 1 of 2
Schedule 8
VarianceBudget Actual Over/Under
Revenues:Operating revenues:Charges for services 5,739,800$ 5,512,943$ (226,857)$ Other 412,700 389,179 (23,521)
Total operating revenues 6,152,500 5,902,122 (250,378)
Non-operating revenues:Other non-operating revenue 83,750 84,426 676 Interest earned 2,500 3,055 555
Total non-operating revenues 86,250 87,481 1,231
Total revenues 6,238,750 5,989,603 (249,147)
Expenditures:Operations 2,716,700 2,358,027 358,673 Maintenance 1,161,150 1,056,842 104,308 Administration 867,550 866,103 1,447 Capital outlay 1,729,450 599,883 1,129,567 Debt principal 1,096,650 1,094,007 2,643 Interest and fees 252,150 257,808 (5,658)
Total expenditures 7,823,650 6,232,670 1,590,980
Revenues over (under) expenditures (1,584,900) (243,067) 1,341,833
Other Financing Sources (Uses):Issuance of long-term debt 2,342,050 1,126,326 (1,215,724) Proceeds from sale of capital assets - 23,971 23,971 Intrafund transfers from - Water and Wastewater Capital Project Fund 70,050 69,983 (67) Intrafund transfers to - Water and Wastewater Capital Project Fund (1,134,150) (1,134,150) - Appropriated fund balance 306,950 - (306,950)
Total other financing sources (uses) 1,584,900 86,130 (1,498,770)
Revenues and other financing sources over (under)expenditures and other financing uses -$ (156,937)$ (156,937)$
CITY OF NEWTON, NORTH CAROLINA
WATER AND WASTEWATER FUNDSCHEDULE OF REVENUES AND EXPENDITURES -
BUDGET AND ACTUAL (NON-GAAP)FOR THE YEAR ENDED JUNE 30, 2013
- 89 -

Page 2 of 2
Schedule 8
VarianceBudget Actual Over/Under
CITY OF NEWTON, NORTH CAROLINA
WATER AND WASTEWATER FUNDSCHEDULE OF REVENUES AND EXPENDITURES -
BUDGET AND ACTUAL (NON-GAAP)FOR THE YEAR ENDED JUNE 30, 2013
Reconciliation from Budgetary Basis (Modified Accrual to Full Accrual):Revenues and other financing sources over (under) expenditures and other financing uses (156,937)$ Reconciling items:Capital project income 13,537 Capital project expenditures (861,386) Capital project expenditures capitalized to CIP 861,386 Transfers to (from) - capital project funds 1,064,167 Depreciation (1,787,298) Capital outlay capitalized 599,883 Payment of debt principal 1,094,007 (Increase) decrease in other post-employment benefit accrual (1,320) (Increase) decrease in compensated absences 4,382 Issuance of long-term debt (1,126,326)
Change in net position (295,905)$
- 90 -

Schedule 9
Project Prior Current Closed TotalAuthorization Years Year Projects to Date
Revenues:Restricted intergovernmental 1,900,000$ 386,200$ -$ (386,200)$ -$
Expenditures:Capital outlay:CDBG-ED Target Distribution 1,513,800 - - - -
Revenues over (under) expenditures 386,200 386,200 - (386,200) -
Other Financing Sources (Uses):Transfers to - Water and Wastewater Fund (1,200) - (1,200) 1,200 - Transfers to - Electric Fund (385,000) (385,000) - 385,000 -
Total other financing sources (uses) (386,200) (385,000) (1,200) 386,200 -
Revenues and other financing sources over (under) expenditures and otherfinancing uses -$ 1,200$ (1,200)$ -$ -$
Actual
CITY OF NEWTON, NORTH CAROLINA
WATER AND WASTEWATER CAPITAL PROJECT FUNDCDBG-ED TARGET DISTRIBTUTION PROJECT
SCHEDULE OF REVENUES AND EXPENDITURES -BUDGET AND ACTUAL (NON-GAAP)
FROM INCEPTION AND FOR THE YEAR ENDED JUNE 30, 2013
- 91 -

Schedule 10
Project Prior Current Closed TotalAuthorization Years Year Projects to Date
Revenues:Restricted intergovernmental 852,900$ 696,778$ 13,537$ (710,315)$ -$
Expenditures:Capital outlay:Burris Road Pump Station 1,559,350 1,362,564 7,871 (1,370,435) -
Revenues over (under) expenditures (706,450) (665,786) 5,666 660,120 -
Other Financing Sources (Uses):Issuance of long-term debt 545,300 490,073 8,848 (498,921) - Transfers from - General Fund 215,000 215,000 - (215,000) - Transfers from - Water and Wastewater Fund 225,950 225,950 - (225,950) - Transfers to - Water and Wastewater Fund (64,800) - (64,751) 64,751 - Transfers to - General Fund (215,000) (215,000) - 215,000 -
Total other financing sources (uses) 706,450 716,023 (55,903) (660,120) -
Revenues and other financing sources over (under) expenditures and otherfinancing uses -$ 50,237$ (50,237)$ -$ -$
Actual
CITY OF NEWTON, NORTH CAROLINA
WATER AND WASTEWATER CAPITAL PROJECT FUNDBURRIS ROAD PUMP STATION
SCHEDULE OF REVENUES AND EXPENDITURES -BUDGET AND ACTUAL (NON-GAAP)
FROM INCEPTION AND FOR THE YEAR ENDED JUNE 30, 2013
- 92 -

Schedule 11
Project Prior Current Closed TotalAuthorization Years Year Projects to Date
Expenditures:Capital outlay:Water rehabilitation projects: Shannonbrook 233,650$ 175,882$ 57,787$ (233,669)$ -$ Highway 70 W to Conover 115,000 114,996 - (114,996) - North College 42,600 4,015 38,601 (42,616) - Ervin Ave - B St to Caldwell 54,300 49,102 5,211 (54,313) - Davis Ave - B St to Caldwell 111,800 119,114 (7,309) (111,805) - East E St - Ervin to Saunders 234,300 206,901 27,362 (234,263) - Boundary 31,500 31,301 235 (31,536) - S Brady - 4th to D St 178,200 170,067 8,116 (178,183) - S Brady - N St to K St 149,450 139,857 9,593 (149,450) - College St - E St to K St 129,100 119,835 9,235 (129,070) - E 18th from Davis to E 17th 83,800 - 78,465 - 78,465 McDaniels Circle 132,750 - 100,739 - 100,739 Shannonbrook Phase II 392,200 - 20,797 - 20,797 Sewer rehabilitation projects: Snow Creek to Fall Line 244,000 195,862 48,153 (244,015) - S Cline to S Main Ave 111,450 110,646 801 (111,447) - N Frye Ave - 13th to 15th 162,100 5,919 156,186 (162,105) - Southfork Drive 98,200 - 7,092 - 7,092 Rear of High School to NW Blvd 525,400 - 183,429 - 183,429 Water Filtration Plant 8.0 MGD Pump 600,000 48,640 37,584 - 86,224
Total expenditures 3,629,800 1,492,137 782,077 (1,797,468) 476,746
Revenues over (under) expenditures (3,629,800) (1,492,137) (782,077) 1,797,468 (476,746)
Other Financing Sources (Uses):Transfers from - Water and Wastewater Fund 3,633,850 2,499,700 1,134,150 (1,801,500) 1,832,350 Transfers to - Water and Wastewater Fund (4,050) - (4,032) 4,032 -
Total other financing sources (uses) 3,629,800 2,499,700 1,130,118 (1,797,468) 1,832,350
Revenues and other financing sources over (under) expenditures and otherfinancing uses -$ 1,007,563$ 348,041$ -$ 1,355,604$
Actual
CITY OF NEWTON, NORTH CAROLINA
WATER AND WASTEWATER CAPITAL PROJECTS FUNDSCHEDULE OF REVENUES AND EXPENDITURES -
BUDGET AND ACTUAL (NON-GAAP)FROM INCEPTION AND FOR THE YEAR ENDED JUNE 30, 2013
- 93 -

Schedule 12
Project Prior Current Closed TotalAuthorization Years Year Projects to Date
Expenditures:Capital outlay:Administration 67,000$ -$ 870$ -$ 870$ Engineering 142,150 - 70,568 - 70,568 Construction 1,081,900 - - - - Contingency 107,950 - - - -
Revenues over (under) expenditures 1,399,000 - 71,438 - 71,438
Other Financing Sources (Uses):Issuance of long-term debt 1,399,000 - - - -
Revenues and other financing sources over (under) expenditures -$ -$ (71,438)$ -$ (71,438)$
Actual
CITY OF NEWTON, NORTH CAROLINA
WATER AND WASTEWATER CAPITAL PROJECT FUNDSNOW CREEK SEWER OUTFALL REHABILITATIONSCHEDULE OF REVENUES AND EXPENDITURES -
BUDGET AND ACTUAL (NON-GAAP)FROM INCEPTION AND FOR THE YEAR ENDED JUNE 30, 2013
- 94 -

Schedule 13Page 1 of 2
VarianceBudget Actual Over/Under
Revenues:Operating revenuesCharges for services 14,151,200$ 13,995,890$ (155,310)$ Other 340,000 454,718 114,718
Total operating revenues 14,491,200 14,450,608 (40,592)
Non-operating revenues:Contributions 20,150 10,291 (9,859) Other non-operating revenue 45,000 71,861 26,861 Interest earned 4,000 3,435 (565) Sales tax 295,000 297,967 2,967
Total non-operating revenues 364,150 383,554 19,404
Total revenues 14,855,350 14,834,162 (21,188)
Expenditures:Power for resale 10,650,350 10,422,957 227,393 Renewable energy 55,600 55,569 31 Operations 2,471,000 1,836,130 634,870 Administration 788,900 787,093 1,807 Capital outlay 367,300 160,764 206,536 Debt principal 760,200 752,486 7,714 Interest and fees 194,600 169,204 25,396
Total expenditures 15,287,950 14,184,203 1,103,747
Revenues over (under) expenditures (432,600) 649,959 1,082,559
Other Financing Sources (Uses):Issuance of long-term debt 939,000 814,179 (124,821) Proceeds from sale of capital assets 500 6,825 6,325 Intrafund transfers from - Electric Capital Project 269,150 269,152 2 Intrafund transfers to - Electric Capital Project (1,234,250) (1,234,232) 18 Transfers to - General Fund (10,000) (10,000) - Appropriated fund balance 468,200 - (468,200)
Total other financing sources (uses) 432,600 (154,076) (586,676)
Revenues and other financing sources over (under) expenditures and other financing uses -$ 495,883$ 495,883$
CITY OF NEWTON, NORTH CAROLINA
ELECTRIC ENTERPRISE FUNDSCHEDULE OF REVENUES AND EXPENDITURES -
BUDGET AND ACTUAL (NON-GAAP)FOR THE YEAR ENDED JUNE 30, 2013
- 95 -

Schedule 13Page 2 of 2
VarianceBudget Actual Over/Under
CITY OF NEWTON, NORTH CAROLINA
ELECTRIC ENTERPRISE FUNDSCHEDULE OF REVENUES AND EXPENDITURES -
BUDGET AND ACTUAL (NON-GAAP)FOR THE YEAR ENDED JUNE 30, 2013
Reconciliation from Budgetary Basis (Modified Accrual) to Full Accrual:
Revenues and other financing sources over(under) expenditures and other financing uses 495,883$
Reconciling items:Capital project expenditures (998,117) Capital project expenditures capitalized to CIP 998,117 Transfers to (from) - capital project fund 965,080 Capital outlay capitalized 160,764 Payment of debt principal 752,486 Depreciation (585,635) (Increase) decrease in other post-employment benefit accrual (440) (Increase) decrease in compensated absences 8,238 Issuance of long-term debt (814,179)
Change in net position 982,197$
- 96 -

Schedule 14
Project Prior Current Closed TotalAuthorization Years Year Projects to Date
Expenditures:Electric system distribution conversion 1,276,000$ 249,285$ 483,934$ (587,945)$ 145,274$ 336 ACSR line extension 72,550 26,362 46,167 (72,529) - Reconductor electric line 165,150 52,232 112,917 (165,149) - Generator modifications 378,350 - 355,099 - 355,099
Total expenditures 1,892,050 327,879 998,117 (825,623) 500,373
Other Financing Sources (Uses):Transfers from - Electric Fund 1,984,900 888,893 1,057,952 (918,495) 1,028,350 Transfers to - Electric Fund (92,850) - (92,872) 92,872 -
Total other financing sources (uses) 1,892,050 888,893 965,080 (825,623) 1,028,350
Revenues and other financing sources over (under) expenditures and otherfinancing uses -$ 561,014$ (33,037)$ -$ 527,977$
Actual
CITY OF NEWTON, NORTH CAROLINA
ELECTRIC FUND CAPITAL PROJECTSSCHEDULE OF REVENUES AND EXPENDITURES -
BUDGET AND ACTUAL (NON-GAAP)FROM INCEPTION AND FOR THE YEAR ENDED JUNE 30, 2013
- 97 -

Schedule 15
VariancePlan Actual Over/Under
Operating Revenues:Charges for services 1,621,250$ 1,544,822$ (76,428)$
Operating Expenditures - Group Insurance:Claims paid 1,342,300 943,826 398,474 Claims incurred but not reported - 2,133 (2,133) Stop-loss insurance fees 270,950 239,283 31,667 Administrative charges 10,000 9,880 120
Total operating expenditures 1,623,250 1,195,122 428,128
Operating income (loss) (2,000) 349,700 351,700
Non-Operating Revenues:Investment earnings 2,000 733 (1,267)
Change in net position -$ 350,433$ 350,433$
CITY OF NEWTON, NORTH CAROLINA
HEALTH INSURANCE INTERNAL SERVICE FUNDSCHEDULE OF REVENUES AND EXPENDITURES -
PLAN AND ACTUAL (NON-GAAP)FOR THE YEAR ENDED JUNE 30, 2013
- 98 -

OTHER SCHEDULES
This section contains additional information required on property taxes and transfers. • Schedule of Ad Valorem Taxes Receivable
• Analysis of Current Tax Levy


Schedule 16
Uncollected UncollectedBalance Collections Balance
Fiscal Year July 1, 2012 Additions and Credits June 30, 2013
2012-2013 -$ 5,225,531$ 4,951,737$ 273,794$ 2011-2012 241,754 - 124,832 116,922 2010-2011 98,524 - 30,231 68,293 2009-2010 62,952 - 11,319 51,633 2008-2009 52,578 - 8,380 44,198 2007-2008 39,135 - 4,688 34,447 2006-2007 38,783 - 1,321 37,462 2005-2006 22,417 - 1,280 21,137 2004-2005 20,822 - 822 20,000 2003-2004 21,262 - 955 20,307 2002-2003 21,730 - 21,730 -
Total 619,957$ 5,225,531$ 5,157,295$ 688,193
Less allowance for uncollectible ad valorem taxes receivable 37,500
Ad valorem taxes receivable, net 650,693$
Ad Valorem Taxes Receivable, NetGeneral Fund 650,693$
Reconcilement with Revenues:Ad valorem taxes - General Fund 5,136,073$ Amounts written off per statute limitations 20,144 Miscellaneous 1,214 Refunds 39,233 Interest and penalties collected (39,369)
Total collections and credits 5,157,295$
CITY OF NEWTON, NORTH CAROLINA
SCHEDULE OF AD VALOREM TAXES RECEIVABLEJUNE 30, 2013
- 99 -

Schedule 17
PropertyExcludingRegistered Registered
Property Total Motor MotorValuation Rate Levy Vehicles Vehicles
Original Levy:Total property taxed at current year's rate 994,383,392$ 0.48$ 4,773,040$ 4,773,040$ -$ Registered motor vehicles taxed at current year’s tax rate 71,119,869 0.48 341,375 - 341,375 Penalties - 1,159 1,159 -
Total 1,065,503,261 5,115,574 4,774,199 341,375
Discoveries:Current year taxes 18,247,244 87,587 87,587 - Prior year taxes 3,120,461 14,830 14,830 - Penalties - 23,444 23,444 -
Total 21,367,705 125,861 125,861 -
Releases:Property:Current year taxes (897,913) (4,310) (4,310) - Prior year taxes (52,793) (253) (253) - Motor Vehicles:Current year taxes (1,630,283) (7,825) - (7,825) Prior year taxes (735,086) (3,509) - (3,509) Penalties - (7) (7) -
Total (3,316,075) (15,904) (4,570) (11,334)
Total property valuation 1,083,554,891$
Net Levy 5,225,531 4,895,490 330,041
Less uncollected taxes at June 30, 2013 273,794 194,926 78,868
Current Year's Taxes Collected 4,951,737$ 4,700,564$ 251,173$
Current Levy Collection Percentage 94.76% 96.02% 76.10%
City-Wide
Total Levy
CITY OF NEWTON, NORTH CAROLINA
ANALYSIS OF CURRENT TAX LEVYFOR THE YEAR ENDED JUNE 30, 2013
- 100 -
STATISTICAL SECTION (Unaudited)
This part of the City of Newton’s Comprehensive Annual Financial Report presents detailed information as a context for understanding what the information in the financial statements, note disclosures, and required supplementary information says about the government’s overall financial health. Contents Financial Trends
These schedules contain trend information to help the reader understand how the government’s financial performance and well-being have changed over time.
Revenue Capacity These schedules contain information to help the reader assess the government’s most significant local revenue source, the property tax.
Debt Capacity
These schedules present information to help the reader assess the affordability of the government’s current levels of outstanding debt and the government’s ability to issue additional debt in the future.
Demographic and Economic Information
These schedules offer demographic and economic indicators to help the reader understand the environment within which the government’s financial activities take place.
Revenue Capacity
These schedules contain information to help the reader assess the government’s most significant local revenue source, the property tax.
Operating Information
These schedules contain service and infrastructure data to help the reader understand how the information in the government’s financial report relates to the services the government provides and the activities it performs.
Sources: Unless otherwise noted, the information in these schedules is derived from the Comprehensive Annual Financial Reports for the relevant year.


CIT
Y O
F N
EW
TO
N, N
OR
TH
CA
RO
LIN
AT
ab
le 1
Net
Posi
tion
by C
om
pon
en
tLast
Ten
Fis
cal
Years
(Acc
rual
Basi
s of
Acc
ou
nti
ng
)(U
nau
dit
ed
)
Fisc
al
Year
20
04
20
05
20
06
20
07
2008
2009
2010
2011
2012
2013
Govern
men
tal
Act
ivit
ies:
Net
inve
stm
ent
in c
apit
al a
sset
s3
,76
4,8
19
$
4
,14
3,2
27
$
4
,92
6,6
32
$
5
,71
6,9
32
$
6,
427,
305
$
6,
559,
160
$
7,
025,
672
$
7,
130,
316
$
7,
704,
679
$
7,
819,
537
$
Res
tric
ted
77
2,9
89
8
1,2
84
29
2,4
58
1
31
,23
4
250,
152
159,
090
393,
488
1,12
7,79
0
2,14
1,84
8
2,36
5,03
7
Unre
stri
cted
3,1
46
,36
2
4,5
37
,61
7
4,0
34
,29
5
4,6
75
,32
9
4,20
0,62
8
4,13
6,96
2
3,38
1,05
9
2,64
0,73
0
2,78
3,14
4
3,16
3,05
5
Tota
l gove
rnm
enta
l ac
tivi
ties
net
posi
tion
7,6
84
,17
0$
8,7
62
,12
8$
9,2
53
,38
5$
10
,52
3,4
95
$
10
,87
8,0
85
$
10
,85
5,2
12
$
10
,80
0,2
19
$
10
,89
8,8
36
$
12
,62
9,6
71
$
13
,34
7,6
29
$
Bu
sin
ess
-Typ
e A
ctiv
itie
s:N
et inve
stm
ent
in c
apit
al a
sset
s2
2,4
70
,30
6$
2
4,9
86
,71
0$
2
5,0
61
,49
7$
2
5,4
36
,72
8$
28
,311
,430
$
28
,914
,131
$
29
,030
,185
$
29
,078
,708
$
30
,854
,510
$
30
,063
,136
$
Res
tric
ted
-
-
-
-
-
-
-
-
-
-
Unre
stri
cted
2,1
47
,52
7
3,2
50
,49
9
2,9
35
,05
7
2,6
36
,12
2
1,01
2,07
4
1,62
0,54
1
3,12
8,65
1
4,40
3,84
3
4,13
7,29
2
5,70
2,56
7
Tota
l busi
nes
s-ty
pe
acti
viti
es n
et p
osi
tion
24
,61
7,8
33
$
28
,23
7,2
09
$
27
,99
6,5
54
$
28
,07
2,8
50
$
29
,32
3,5
04
$
30
,53
4,6
72
$
32
,15
8,8
36
$
33
,48
2,5
51
$
34
,99
1,8
02
$
35
,76
5,7
03
$
Pri
mary
Govern
men
t:N
et inve
stm
ent
in c
apit
al a
sset
s2
6,2
35
,12
5$
2
9,1
29
,93
7$
2
9,9
88
,12
9$
3
1,1
53
,66
0$
34
,738
,735
$
35
,473
,291
$
36
,055
,857
$
36
,209
,024
$
38
,559
,189
$
37
,882
,673
$
Res
tric
ted
77
2,9
89
8
1,2
84
29
2,4
58
1
31
,23
4
250,
152
159,
090
393,
488
1,12
7,79
0
2,14
1,84
8
2,36
5,03
7
Unre
stri
cted
5,2
93
,88
9
7,7
88
,11
6
6,9
69
,35
2
7,3
11
,45
1
5,21
2,70
2
5,75
7,50
3
6,50
9,71
0
7,04
4,57
3
6,92
0,43
6
8,86
5,62
2
Tota
l pri
mar
y gove
rnm
ent
net
posi
tion
32
,30
2,0
03
$
36
,99
9,3
37
$
37
,24
9,9
39
$
38
,59
6,3
45
$
40
,20
1,5
89
$
41
,38
9,8
84
$
42
,95
9,0
55
$
44
,38
1,3
87
$
47
,62
1,4
73
$
49
,11
3,3
32
$
- 101 -

CIT
Y O
F N
EW
TO
N, N
OR
TH
CA
RO
LIN
AT
ab
le 2
, pag
e 1
of
3C
han
ge i
n N
et
Posi
tion
Last
Ten
Fis
cal
Years
(Acc
rual
Basi
s of
Acc
ou
nti
ng
)(U
nau
dit
ed
)
Fis
cal
Year
20
04
20
05
20
06
20
07
20
08
20
09
20
10
20
11
20
12
20
13
Exp
en
ses:
Gove
rnm
enta
l ac
tivi
ties
:G
ener
al g
ove
rnm
ent
1,2
34,0
61
$
1,4
26,5
33
$
1,4
24,3
97
$
1,3
85,6
40
$
1,6
61,5
43
$
1,6
78,4
11
$
1,5
91,7
39
$
1,9
46,7
52
$
1,3
13,2
02
$
1,0
16,4
94
$
Public
safe
ty3,8
85,2
86
4,1
65,1
36
4,7
31,3
04
4,6
26,0
04
4,7
14,2
27
4,9
82,3
26
4,7
70,6
52
4,7
76,7
14
4,9
17,5
91
5,1
24,1
14
Tra
nsp
ort
atio
n902,6
04
823,5
58
681,9
82
857,3
63
976,9
90
1,0
04,2
58
839,0
25
975,9
76
954,9
79
1,0
47,0
81
Envi
ronm
enta
l pro
tect
ion
836,7
48
799,8
23
781,4
33
874,1
93
901,9
85
935,1
90
927,3
44
917,1
24
938,9
35
1,0
06,9
70
Cult
ura
l an
d r
ecre
atio
nal
946,7
86
1,2
79,2
95
1,4
65,1
94
1,3
12,9
00
1,4
51,5
56
1,5
26,2
25
2,1
08,5
51
2,0
76,6
73
2,0
89,1
68
2,0
76,1
32
Econom
ic a
nd p
hys
ical
dev
elopm
ent
108,2
02
-
2,2
06
-
3,0
00
271,6
59
105,6
99
42,6
98
-
1,0
00
Inte
rest
on long-t
erm
deb
t90,2
50
115,8
69
105,5
13
97,6
10
170,5
15
173,0
87
150,3
24
98,7
94
151,1
54
102,1
78
Tota
l gove
rnm
enta
l ac
tivi
ties
expen
ses
8,0
03,9
37
8,6
10,2
14
9,1
92,0
29
9,1
53,7
10
9,8
79,8
16
10,5
71,1
56
10,4
93,3
34
10,8
34,7
31
10,3
65,0
29
10,3
73,9
69
Busi
nes
s-ty
pe
acti
viti
es:
Wat
er a
nd W
aste
wat
er4,8
94,8
91
4,6
39,0
00
4,5
04,1
22
5,2
00,1
44
5,7
48,1
55
5,6
95,1
33
5,6
96,9
45
5,7
51,9
98
6,1
65,3
78
6,2
79,2
11
Elec
tric
9,4
93,8
67
9,5
65,7
17
10,4
57,5
59
11,5
14,3
75
11,7
01,1
13
12,0
39,4
36
12,0
55,7
54
13,0
80,4
53
13,4
19,0
24
13,8
04,9
85
Tota
l busi
nes
s-ty
pe
acti
viti
es e
xpen
ses
14,3
88,7
58
14,2
04,7
17
14,9
61,6
81
16,7
14,5
19
17,4
49,2
68
17,7
34,5
69
17,7
52,6
99
18,8
32,4
51
19,5
84,4
02
20,0
84,1
96
Tota
l pri
mar
y gove
rnm
ent
expen
ses
22,3
92,6
95
$
22,8
14,9
31
$
24,1
53,7
10
$
25,8
68,2
29
$
27,3
29,0
84
$
28,3
05,7
25
$
28,2
46,0
33
$
29,6
67,1
82
$
29,9
49,4
31
$
30,4
58,1
65
$
Pro
gra
m R
even
ues:
Gove
rnm
enta
l ac
tivi
ties
:C
har
ges
for
serv
ices
Gen
eral
gove
rnm
ent
531,0
06
$
634,6
35
$
609,3
35
$
488,6
84
$
520,4
56
$
499,3
68
$
505,9
82
$
219,0
66
$
208,6
00
$
273,7
57
$
Public
safe
ty45,4
72
76,6
22
95,9
49
117,4
18
120,3
37
205,2
68
178,4
50
86,7
06
119,9
09
102,2
31
Tra
nsp
ort
atio
n5,4
23
2,8
68
12,7
49
19,4
37
13,4
94
4,5
14
488
-
-
2,1
04
Envi
ronm
enta
l pro
tect
ion
350,3
76
418,2
24
366,5
93
487,7
72
476,2
22
587,0
51
578,1
62
574,8
46
575,0
67
757,0
23
Cult
ura
l an
d r
ecre
atio
nal
59,6
59
69,6
86
86,3
69
92,4
69
87,9
59
119,8
93
110,7
32
83,6
28
68,5
61
68,5
44
Econom
ic a
nd p
hys
ical
dev
elopm
ent
10,6
66
17,1
60
18,5
17
17,3
55
20,8
83
14,8
89
14,2
73
-
-
-
Oper
atin
g g
rants
and c
ontr
ibuti
ons
468,5
93
435,1
84
432,5
63
425,4
14
477,9
79
479,8
68
447,9
73
30,8
79
482,7
14
486,5
90
Cap
ital
gra
nts
and c
ontr
ibuti
ons
371,6
76
388,7
24
704,0
64
722,6
33
13,9
38
31,5
08
105,5
22
448,3
57
1,3
64,8
49
36,0
89
Tota
l gove
rnm
enta
l ac
tivi
ties
pro
gra
m r
even
ues
1,8
42,8
71
2,0
43,1
03
2,3
26,1
39
2,3
71,1
82
1,7
31,2
68
1,9
42,3
59
1,9
41,5
82
1,4
43,4
82
2,8
19,7
00
1,7
26,3
38
con
tin
ued
- 102 -

CIT
Y O
F N
EW
TO
N, N
OR
TH
CA
RO
LIN
AT
ab
le 2
, pag
e 2
of
3C
han
ge i
n N
et
Posi
tion
Last
Ten
Fis
cal
Years
(Acc
rual
Basi
s of
Acc
ou
nti
ng
)(U
nau
dit
ed
)
Fis
cal
Year
20
04
20
05
20
06
20
07
20
08
20
09
20
10
20
11
20
12
20
13
Busi
nes
s-ty
pe
acti
viti
es:
Char
ges
for
serv
ices
- W
ater
and W
aste
wat
er3,6
83,4
06
5,2
74,5
09
3,8
90,3
43
4,3
52,8
66
4,4
33,8
87
5,0
94,6
20
5,6
99,7
45
6,0
94,1
48
5,9
70,5
45
6,0
10,5
19
Char
ges
for
serv
ices
- E
lect
ric
8,8
31,4
84
9,0
71,5
78
9,6
54,2
66
10,8
19,7
57
11,3
23,1
52
11,7
96,0
63
12,5
36,1
24
13,7
21,1
07
13,8
01,5
29
14,5
29,2
94
Oper
atin
g g
rants
and c
ontr
ibuti
ons
-
-
-
-
-
-
-
-
-
161
Cap
ital
gra
nts
and c
ontr
ibuti
ons
174,9
79
3,4
63,7
31
289,5
00
277,1
15
2,0
50,2
76
1,1
79,5
15
(3,8
68)
52,8
15
1,0
39,7
58
23,6
67
Tota
l busi
nes
s-ty
pe
acti
viti
es p
rogra
m r
even
ues
12,6
89,8
69
17,8
09,8
18
13,8
34,1
09
15,4
49,7
38
17,8
07,3
15
18,0
70,1
98
18,2
32,0
01
19,8
68,0
70
20,8
11,8
32
20,5
63,6
41
Tota
l pri
mar
y gove
rnm
ent
pro
gra
m r
even
ues
14,5
32,7
40
$
19,8
52,9
21
$
16,1
60,2
48
$
17,8
20,9
20
$
19,5
38,5
83
$
20,0
12,5
57
$
20,1
73,5
83
$
21,3
11,5
52
$
23,6
31,5
32
$
22,2
89,9
79
$
Net
rev
enue
(expen
se)
Gove
rnm
enta
l ac
tivi
ties
(6,1
61,0
66)
$
(6,5
67,1
12)
$
(6,8
65,8
90)
$
(6,7
82,5
28)
$
(8,1
48,5
50)
$
(8,6
28,7
97)
$
(8,5
51,7
52)
$
(9,3
91,2
48)
$
(7,5
45,3
29)
$
(8,6
47,6
31)
$
Busi
nes
s-ty
pe
acti
viti
es(1
,698,8
89)
3,6
05,1
00
(1,1
27,5
72)
(1,2
64,7
81)
358,0
46
335,6
28
479,3
03
1,0
35,6
19
1,2
27,4
30
479,4
45
Tota
l pri
mar
y gove
rnm
ent
net
expen
se(7
,859,9
55)
$
(2,9
62,0
12)
$
(7,9
93,4
62)
$
(8,0
47,3
09)
$
(7,7
90,5
04)
$
(8,2
93,1
69)
$
(8,0
72,4
49)
$
(8,3
55,6
29)
$
(6,3
17,8
99)
$
(8,1
68,1
86)
$
Gen
era
l R
even
ues
an
d O
ther
Ch
an
ges
in N
et
Posi
tion
:G
ove
rnm
enta
l ac
tivi
ties
:A
d v
alore
m t
axes
3,7
78,5
14
$
3,6
98,0
01
$
3,7
20,6
68
$
4,1
13,4
59
$
4,4
72,1
39
$
4,7
68,7
07
$
5,0
80,4
56
$
5,1
75,5
40
$
5,0
91,9
14
$
5,2
01,3
84
$
Loca
l opti
on s
ales
tax
2,4
09,6
06
2,5
53,8
73
2,6
40,6
48
2,9
06,0
30
2,9
79,0
05
2,7
17,3
47
2,4
57,6
45
2,5
66,4
00
2,5
80,2
88
2,5
95,4
42
Fran
chis
e ta
x646,6
46
695,3
51
676,4
25
707,5
27
735,3
24
768,9
77
776,1
81
785,7
73
781,7
01
759,0
87
Oth
er t
axes
and lic
ense
s219,6
16
245,0
99
291,7
83
295,1
32
332,7
67
354,5
49
390,1
37
948,1
39
811,4
13
788,6
72
Unre
stri
cted
inve
stm
ent
earn
ings
46,3
39
55,4
01
151,2
92
211,6
44
144,0
14
37,4
02
6,9
13
9,0
13
7,4
98
11,0
04
Mis
cellan
eous
177,8
66
(88,8
07)
77,9
79
98,7
48
(16,6
10)
173,9
43
252,3
47
-
-
-
Tra
nsf
ers
(602,4
00)
486,1
50
(201,6
50)
(279,9
00)
(143,5
00)
(215,0
00)
(466,9
21)
5,0
00
3,3
50
10,0
00
Tota
l gove
rnm
enta
l ac
tivi
ties
6,6
76,1
87
7,6
45,0
68
7,3
57,1
45
8,0
52,6
40
8,5
03,1
39
8,6
05,9
25
8,4
96,7
58
9,4
89,8
65
9,2
76,1
64
9,3
65,5
89
con
tin
ued
- 103 -

CIT
Y O
F N
EW
TO
N, N
OR
TH
CA
RO
LIN
AT
ab
le 2
, pag
e 3
of
3C
han
ge i
n N
et
Posi
tion
Last
Ten
Fis
cal
Years
(Acc
rual
Basi
s of
Acc
ou
nti
ng
)(U
nau
dit
ed
)
Fis
cal
Year
20
04
20
05
20
06
20
07
20
08
20
09
20
10
20
11
20
12
20
13
Busi
nes
s-ty
pe
acti
viti
es:
Oth
er t
axes
and lic
ence
s245,6
31
257,2
35
272,6
19
302,4
26
293,8
24
285,3
11
293,3
52
286,1
81
277,9
93
297,9
67
Unre
stri
cted
inve
stm
ent
earn
ings
42,1
65
116,6
62
122,9
10
156,1
35
91,8
99
20,6
00
8,4
64
6,9
15
7,1
77
6,4
90
Mis
cellan
eous
188,5
64
126,5
29
289,7
39
602,6
15
363,3
83
354,6
28
376,1
24
-
-
-
Tra
nsf
ers
602,4
00
(486,1
50)
201,6
50
279,9
00
143,5
00
215,0
00
466,9
21
(5,0
00)
(3,3
50)
(10,0
00)
Tota
l busi
nes
s-ty
pe
acti
viti
es1,0
78,7
60
14,2
76
886,9
18
1,3
41,0
76
892,6
06
875,5
39
1,1
44,8
61
288,0
96
281,8
20
294,4
57
Tota
l pri
mar
y gove
rnm
ent
7,7
54,9
47
$
7,6
59,3
44
$
8,2
44,0
63
$
9,3
93,7
16
$
9,3
95,7
45
$
9,4
81,4
64
$
9,6
41,6
19
$
9,7
77,9
61
$
9,5
57,9
84
$
9,6
60,0
46
$
Ch
an
ge i
n N
et
Posi
tion
:G
ove
rnm
enta
l ac
tivi
ties
515,1
21
$
1,0
77,9
57
$
491,2
56
$
1,2
70,1
10
$
354,5
89
$
(22,8
73)
$
(54,9
93)
$
98,6
17
$
1,7
30,8
35
$
717,9
58
$
Busi
nes
s-ty
pe
acti
viti
es(6
20,1
29)
3,6
19,3
76
(240,6
54)
76,2
96
1,2
50,6
54
1,2
11,1
68
1,6
24,1
65
1,3
23,7
15
1,5
09,2
50
773,9
02
Tota
l pri
mar
y gove
rnm
ent
(105,0
08)
$
4,6
97,3
33
$
250,6
02
$
1,3
46,4
06
$
1,6
05,2
43
$
1,1
88,2
95
$
1,5
69,1
72
$
1,4
22,3
32
$
3,2
40,0
85
$
1,4
91,8
60
$
- 104 -

CITY OF NEWTON, NORTH CAROLINATable 3
Governmental Activities Tax Revenues By SourceLast Ten Fiscal Years
(Accrual Basis of Accounting)(Unaudited)
Local OtherFiscal Property Option Franchise Taxes andYear Tax Sales Tax Tax Licenses Total2004 3,778,514$ 2,409,606$ 646,646$ 219,616$ 7,054,382$ 2005 3,698,001 2,553,873 695,351 245,099 7,192,324 2006 3,720,668 2,640,648 676,425 291,783 7,329,524 2007 4,113,459 2,906,030 707,527 295,132 8,022,148 2008 4,472,139 2,979,005 735,324 332,767 8,519,235 2009 4,768,707 2,717,347 768,977 354,549 8,609,580 2010 5,080,456 2,457,645 776,181 390,137 8,704,419 2011 5,175,540 2,566,400 785,773 948,139 9,475,852 2012 5,091,914 2,580,288 781,701 811,413 9,265,316 2013 5,201,384 2,595,441 759,087 788,672 9,344,584
$0
$1,000,000
$2,000,000
$3,000,000
$4,000,000
$5,000,000
$6,000,000
2004 2005 2006 2007 2008 2009 2010 2011 2012 2013
Property Tax Local Option Sales Tax Franchise Tax Other Taxes and Licenses
- 105 -
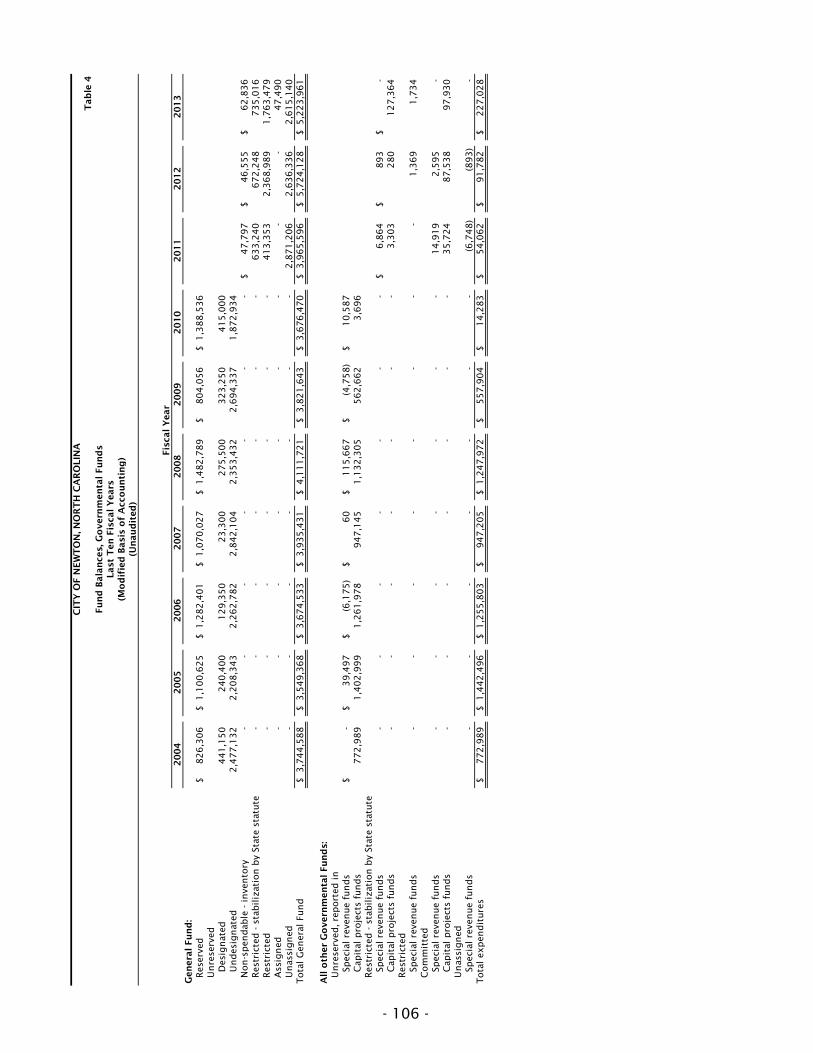
CIT
Y O
F N
EW
TO
N, N
OR
TH
CA
RO
LIN
AT
ab
le 4
Fu
nd
Bala
nce
s, G
overn
men
tal Fu
nd
sLast
Ten
Fis
cal Y
ears
(Mo
dif
ied
Basi
s o
f A
cco
un
tin
g)
(Un
au
dit
ed
)
Fis
cal Y
ear
2004
2005
2006
2007
2008
2009
2010
2011
2012
2013
Gen
era
l Fu
nd
:Res
erve
d826,3
06
$
1,1
00,6
25
$
1,2
82,4
01
$
1,0
70,0
27
$
1,4
82,7
89
$
804,0
56
$
1,3
88,5
36
$
Un
rese
rved
Des
ign
ated
441,1
50
240,4
00
129,3
50
23,3
00
275,5
00
323,2
50
415,0
00
Un
des
ign
ated
2,4
77,1
32
2,2
08,3
43
2,2
62,7
82
2,8
42,1
04
2,3
53,4
32
2,6
94,3
37
1,8
72,9
34
Non
-spen
dab
le - in
ven
tory
-
-
-
-
-
-
-
47,7
97
$
46,5
55
$
62,8
36
$
Res
tric
ted - s
tabiliz
atio
n b
y St
ate
stat
ute
-
-
-
-
-
-
-
633,2
40
672,2
48
735,0
16
Res
tric
ted
-
-
-
-
-
-
-
413,3
53
2,3
68,9
89
1,7
63,4
79
Ass
ign
ed-
-
-
-
-
-
-
-
-
47,4
90
Un
assi
gn
ed-
-
-
-
-
-
-
2,8
71,2
06
2,6
36,3
36
2,6
15,1
40
Tota
l G
ener
al F
un
d3,7
44,5
88
$
3,5
49,3
68
$
3,6
74,5
33
$
3,9
35,4
31
$
4,1
11,7
21
$
3,8
21,6
43
$
3,6
76,4
70
$
3,9
65,5
96
$
5,7
24,1
28
$
5,2
23,9
61
$
All o
ther
Go
vern
men
tal Fu
nd
s:U
nre
serv
ed, re
port
ed in
Spec
ial re
ven
ue
fun
ds
-$
39,4
97
$
(6,1
75)
$
60
$
115,6
67
$
(4,7
58)
$
10,5
87
$
Cap
ital
pro
ject
s fu
nds
772,9
89
1,4
02,9
99
1,2
61,9
78
947,1
45
1,1
32,3
05
562,6
62
3,6
96
Res
tric
ted - s
tabiliz
atio
n b
y St
ate
stat
ute
Spec
ial re
ven
ue
fun
ds
-
-
-
-
-
-
-
6,8
64
$
893
$
-$
Cap
ital
pro
ject
s fu
nds
-
-
-
-
-
-
-
3,3
03
280
127,3
64
Res
tric
ted
Spec
ial re
ven
ue
fun
ds
-
-
-
-
-
-
-
-
1,3
69
1,7
34
Com
mit
ted
Spec
ial re
ven
ue
fun
ds
-
-
-
-
-
-
-
14,9
19
2,5
95
-
Cap
ital
pro
ject
s fu
nds
-
-
-
-
-
-
-
35,7
24
87,5
38
97,9
30
Un
assi
gn
edSp
ecia
l re
ven
ue
fun
ds
-
-
-
-
-
-
-
(6,7
48)
(893)
-
Tota
l ex
pen
dit
ure
s772,9
89
$
1,4
42,4
96
$
1,2
55,8
03
$
947,2
05
$
1,2
47,9
72
$
557,9
04
$
14,2
83
$
54,0
62
$
91,7
82
$
227,0
28
$
- 106 -

CIT
Y O
F N
EW
TO
N, N
OR
TH
CA
RO
LIN
AT
ab
le 5
Ch
an
ges
in F
un
d B
ala
nce
s, G
overn
men
tal
Fu
nd
sLast
Ten
Fis
cal
Years
(Mo
dif
ied
Basi
s o
f A
cco
un
tin
g)
(Un
au
dit
ed
)
Fis
cal
Year
20
04
20
05
20
06
20
07
20
08
20
09
20
10
20
11
20
12
20
13
Reven
ues:
Ad
val
ore
m t
axes
3,8
29
,54
0$
3
,66
4,6
45
$
3,6
70
,35
6$
4
,05
0,2
91
$
4,4
38
,51
0$
4
,77
8,0
68
$
5,0
55
,13
0$
5
,12
2,7
13
$
5,0
45
,72
6$
5
,13
6,0
73
$
Oth
er t
axes
an
d lic
ense
s2
,62
9,2
22
2,7
98
,97
2
2,9
32
,43
1
3,2
01
,16
2
3,3
11
,77
2
3,0
78
,20
4
2,8
57
,09
8
2,9
30
,53
5
2,9
69
,84
7
2,9
61
,19
4
Un
rest
rict
ed in
terg
ove
rnm
enta
l1
,00
1,6
80
1,0
20
,83
1
1,1
85
,50
6
1,1
64
,63
7
1,1
18
,05
0
1,1
91
,91
0
1,2
04
,60
8
1,3
69
,77
7
1,2
03
,55
5
1,1
82
,00
7
Res
tric
ted
in
terg
ove
rnm
enta
l6
54
,86
2
45
4,4
22
72
4,4
77
67
9,6
78
52
9,1
44
51
3,0
78
59
7,2
64
47
4,8
51
66
7,1
12
49
5,2
28
Perm
its
and
fee
s8
2,7
83
79
,22
7
81
,69
2
99
,34
7
96
,38
9
93
,68
9
93
,51
4
89
,95
3
85
,02
2
12
0,1
30
Sale
s an
d s
ervi
ces
40
9,0
77
50
9,6
50
49
9,6
19
59
0,3
02
58
5,7
53
69
5,1
15
67
8,9
66
68
8,1
34
66
8,2
36
86
9,5
64
Inve
stm
ent
earn
ing
s4
6,3
39
55
,40
4
15
1,2
92
21
1,6
44
14
4,0
14
37
,58
1
6,9
34
7,2
44
6,7
51
10
,27
1
Oth
er r
even
ues
22
1,3
45
67
4,3
19
51
1,2
70
46
2,2
32
16
5,0
48
21
9,5
41
13
4,0
51
19
0,5
44
1,3
99
,33
0
24
1,4
16
Tota
l re
ven
ues
8,8
74
,84
8
9,2
57
,47
0
9,7
56
,64
3
10
,45
9,2
93
1
0,3
88
,68
0
10
,60
7,1
86
1
0,6
27
,56
5
10
,87
3,7
51
1
2,0
45
,57
9
11
,01
5,8
83
Exp
en
dit
ure
s:C
urr
ent:
Gen
eral
gove
rnm
ent
1,2
36
,80
4
1,3
97
,38
5
1,3
47
,98
7
1,3
40
,14
7
1,6
53
,31
1
1,5
09
,01
6
1,4
73
,65
2
1,4
21
,95
0
1,2
26
,07
9
1,1
90
,65
1
Pub
lic
safe
ty3
,59
9,4
05
3,8
04
,08
3
4,3
76
,59
3
4,2
51
,03
2
4,3
17
,74
3
4,6
13
,88
9
4,5
12
,69
2
4,6
07
,75
7
5,3
77
,82
7
4,9
42
,89
8
Tra
nsp
ort
atio
n8
14
,60
5
73
7,0
15
59
7,8
20
75
9,7
44
87
2,6
92
89
3,1
55
70
5,4
17
86
0,2
36
99
0,9
18
1,1
06
,27
8
Envi
ron
men
tal p
rote
ctio
n7
95
,52
9
73
3,4
62
71
6,2
24
79
0,9
97
81
9,7
16
84
8,5
60
85
3,4
62
85
3,9
54
89
9,5
15
1,2
76
,48
0
Cult
ura
l an
d r
ecre
atio
nal
98
6,7
40
1,2
40
,12
4
1,4
42
,36
7
1,2
72
,11
8
1,4
11
,03
7
1,4
80
,70
8
2,0
72
,17
2
2,0
09
,88
6
2,0
08
,89
8
2,0
80
,55
3
Econ
om
ic a
nd
ph
ysic
al d
evel
op
men
t2
41
,68
7
79
7,3
00
78
8,3
36
1,0
07
,04
1
90
8,0
77
92
0,1
26
17
0,2
16
39
1,0
90
13
3,5
77
1,0
00
Cap
ital
outl
ay9
77
,60
6
1,0
84
,98
1
69
2,7
65
56
1,3
23
67
3,5
91
1,0
02
,27
9
71
2,1
86
-
-
25
1,3
14
Deb
t se
rvic
e:P
rinci
pal
54
8,1
13
1,8
13
,79
7
44
9,6
70
48
6,4
07
56
6,6
92
79
2,7
08
74
8,6
59
77
2,0
42
77
7,3
53
87
8,6
63
Inte
rest
68
,49
5
87
,24
9
10
2,5
07
10
6,2
65
12
5,2
70
16
1,9
82
17
8,7
38
13
3,9
30
13
6,8
49
12
2,9
30
Tota
l ex
pen
dit
ure
s9
,26
8,9
84
11
,69
5,3
96
1
0,5
14
,26
9
10
,57
5,0
74
1
1,3
48
,12
9
12
,22
2,4
23
1
1,4
27
,19
4
11
,05
0,8
45
1
1,5
51
,01
6
11
,85
0,7
67
Rev
enues
ove
r (u
nd
er)
exp
end
iture
s(3
94
,13
6)
(2,4
37
,92
6)
(75
7,6
26
)
(11
5,7
81
)
(95
9,4
49
)
(1,6
15
,23
7)
(79
9,6
29
)
(17
7,0
94
)
49
4,5
63
(83
4,8
84
)
Oth
er
Fin
an
cin
g S
ou
rces
(Use
s):
Issu
ance
of
deb
t1
,46
7,8
50
2,3
99
,11
2
90
6,7
00
24
7,6
00
1,5
54
,75
0
82
3,0
00
50
9,1
50
50
1,0
00
1,2
98
,33
9
44
3,6
82
Oth
er m
isce
llan
eous
rece
ipts
-
-
-
10
0,0
00
-
57
,62
6
45
,63
1
-
-
-
Tra
nsf
ers
from
oth
er f
un
ds
15
8,2
00
1,5
86
,00
0
46
5,7
94
40
4,9
00
1,2
08
,84
3
21
5,6
50
41
8,1
36
37
5,3
30
17
7,6
85
44
5,4
17
Tra
nsf
ers
to o
ther
fun
ds
(76
0,6
00
)
(1,0
99
,85
0)
(66
7,4
44
)
(68
4,8
00
)
(1,3
52
,34
3)
(43
0,6
50
)
(88
5,0
57
)
(37
0,3
30
)
(17
4,3
35
)
(43
5,4
17
)
Cap
ital
con
trib
uti
on
s1
21
,67
6
-
-
-
-
-
-
-
-
-
Tota
l oth
er f
inan
cin
g s
ourc
es (
use
s)9
87
,12
6
2,8
85
,26
2
70
5,0
50
67
,70
0
1,4
11
,25
0
66
5,6
26
87
,86
0
50
6,0
00
1,3
01
,68
9
45
3,6
82
Net
ch
ang
e in
fun
d b
alan
ces
59
2,9
90
$
44
7,3
36
$
(52
,57
6)
$
(48
,08
1)
$
45
1,8
01
$
(94
9,6
11
)$
(71
1,7
69
)$
32
8,9
06
$
1,7
96
,25
2$
(3
81
,20
2)
$
Deb
t se
rvic
e as
a p
erce
nta
ge
of
non
-cap
ital
exp
end
iture
s7
.7%
19
.4%
6.1
%6
.6%
7.1
%9
.0%
8.7
%8
.7%
8.9
%9
.5%
- 107 -

CITY OF NEWTON, NORTH CAROLINATable 6
Assessed Valuation of PropertyLast Ten Fiscal Years
(Unaudited)
Assessed Value (1)
Fiscal Year Real Property
Personal
Property (3)Public Service
Companies Total
Property Tax Rate (Per $100 Assessed
Value
Percent Increase in
Value (2)
2004 (2) 633,344,247$ 207,284,243$ 19,638,863$ 860,267,353$ 0.44$ 7.6%2005 643,469,380 190,257,576 18,612,781 852,339,737 0.44 -0.9%2006 653,098,799 185,603,814 18,714,292 857,416,905 0.44 0.6%2007 672,011,755 201,670,887 20,704,568 894,387,210 0.46 4.3%2008 (2) 696,935,560 238,549,720 20,026,093 955,511,373 0.48 6.8%2009 706,624,707 248,484,115 20,151,953 975,260,775 0.48 2.1%2010 769,143,484 277,326,569 22,460,684 1,068,930,737 0.48 9.6%2011 (2) 773,519,907 279,668,240 21,178,162 1,074,366,309 0.48 0.5%2012 767,118,238 273,986,190 19,646,031 1,060,750,459 0.48 -1.3%2013 770,022,896 293,650,012 19,881,983 1,083,554,891 0.48 2.1%
NOTES:
(1) Assessed value is established by Catawba County Assessor’s office.
(2) North Carolina General Statutes require that a reappraisal of real property be conducted every eight years. A revaluation of real property is conducted every four years for the City of Newton.
(3) Includes vehicles.
Personal Property293,650,012
Public Service Companies19,881,983
Real Property770,022,896
- 108 -

CITY OF NEWTON, NORTH CAROLINATable 7
Property Tax Rates-Direct and Overlapping GovernmentsLast Ten Fiscal Years
(Unaudited)
TotalFiscal City of Catawba City and Year Newton County County Rate 2004 0.44$ 0.480$ 0.920$ 2005 0.44 0.480 0.920 2006 0.44 0.490 0.930 2007 0.46 0.490 0.950 2008 0.48 0.535 1.015 2009 0.48 0.535 1.015 2010 0.48 0.535 1.015 2011 0.48 0.530 1.010 2012 0.48 0.530 1.010 2013 0.48 0.530 1.010
Other Tax Data:
Tax rates are established on a per $100 valuation basis and are levied on July 1, the first day of the fiscal year.
There is a State statutory tax rate limit of $1.50 per hundred dollars valuation for operating expenses, but nolimitation on the rate of tax, which may be levied for debt service.
The City has no financial responsibility for the public school system. The school system is funded with revenue derived from the County, State, and Federal governments.
- 109 -

CIT
Y O
F N
EW
TO
N, N
OR
TH
CA
RO
LIN
AT
ab
le 8
Pri
nci
pal
Pro
pert
y T
axp
ayers
Nin
e Y
ears
Ag
o a
nd
Cu
rren
t Y
ear
(Un
au
dit
ed
)
20
13
20
04
Perc
en
tag
ePerc
en
tag
eT
ota
l of
Tota
lT
ota
l of
Tota
lA
ssess
ed
Ass
ess
ed
Ass
ess
ed
Ass
ess
ed
Taxp
ayer
Typ
e o
f En
terp
rise
Valu
ati
on
Ran
kV
alu
ati
on
Valu
ati
on
Ran
kV
alu
ati
on
Tar
get
Corp
.D
istr
ibuti
on C
ente
r110,5
92,2
54
$
110.2
1%
ZF
Lem
ford
er
Corp
.A
uto
moti
ve P
rod M
fg.
39,0
59,7
60
23.6
0%
Flow
ers
Bak
ing C
o.
Bre
ad &
Pas
trie
s25,3
61,3
55
32.3
4%
Sars
tedt,
Inc.
Phar
mac
euti
cal Pl
asti
cs21,4
46,2
64
41.9
8%
7,8
20,2
20
$
80.9
2%
Renw
ood M
ills
Flour
Mill
13,2
72,5
23
51.2
2%
Tech
nib
ilt,
Ltd
.Sh
oppin
g C
art
Man
ufa
cturi
ng
12,3
00,8
77
61.1
4%
9,1
99,5
00
61.0
8%
Inte
rnat
ional
Pap
er
Co.
Paper
Product
s9,5
60,8
38
70.8
8%
People
s Ban
kBan
kin
g9,5
17,1
02
80.8
8%
8,7
76,1
39
71.0
3%
Bas
sett
Furn
iture
Indust
ries
Furn
iture
7,9
36,4
36
90.7
3%
10,0
75,8
40
41.1
8%
Com
mSc
ope, In
c.Fi
ber
6,9
40,8
00
10
0.6
4%
32,6
20,4
56
13.8
3%
Willa
mett
e Indust
ries
Paper
Product
s11,3
96,9
31
21.3
4%
Mid
stat
e M
ills
, In
c.Fl
our
Mill
10,8
30,3
82
31.2
7%
BellSo
uth
Tele
phone C
o.
Uti
lity
9,3
42,2
14
51.1
0%
Car
olina
Mills
Texti
les
7,4
46,2
83
90.8
7%
Hic
kory
Spri
ngs
Mfg
. C
o.
Foam
Man
ufa
cture
r7,0
57,4
62
10
0.8
3%
T
ota
ls255,9
88,2
09
$
23.6
2%
114,5
65,4
27
$
13.4
5%
- 110 -

Tab
le 9
Perc
en
tag
e o
fT
ota
l T
ax
Cu
rren
t Y
ear'
sPerc
en
tag
e C
ollect
ion
s in
T
ota
lT
ota
l T
ax
Taxes
Rece
ivab
leFis
cal
Levy f
or
Taxes
of
Levy
Su
bse
qu
en
tC
ollect
ion
sC
ollect
ion
s B
ala
nce
-Y
ear
Fis
cal
Year
Co
llect
ed
/Cre
dit
ed
Co
llect
ed
Y
ears
an
d C
red
its
To
Net
Levy
Jun
e 3
0 (
1)
2004
3,7
51,6
55
$
3,6
17,2
33
$
96.4
%114,1
15
$
3,7
31,3
48
$
99.5
%20,3
07
$
2005
3,6
99,1
09
3,5
58,5
06
96.2
%120,6
03
3,6
79,1
09
99.5
%20,0
00
2006
3,7
01,5
19
3,5
39,8
81
95.6
%140,5
01
3,6
80,3
82
99.4
%21,1
37
2007
4,0
90,4
45
3,9
09,6
86
95.6
%143,2
97
4,0
52,9
83
99.1
%37,4
62
2008
4,4
45,5
86
4,2
63,2
76
95.9
%147,8
63
4,4
11,1
39
99.2
%34,4
47
2009
4,7
27,7
21
4,5
43,9
83
96.1
%139,5
40
4,6
83,5
23
99.1
%44,1
98
2010
5,1
60,6
38
4,9
83,4
52
96.6
%125,5
53
5,1
09,0
05
99.0
%51,6
33
2011
5,1
62,4
00
4,9
45,3
69
95.8
%148,7
38
5,0
94,1
07
98.7
%68,2
93
2012
5,0
95,3
09
4,8
53,5
55
95.3
%124,8
32
4,9
78,3
87
97.7
%116,9
22
2013
5,2
25,5
31
4,9
51,7
37
94.8
%-
4,9
51,7
37
94.8
%273,7
94
NO
TES
:
(1) Incl
udes
curr
ent
port
ion o
nly
of
taxes
rec
eiva
ble
.
CIT
Y O
F N
EW
TO
N, N
OR
TH
CA
RO
LIN
A
Pro
pert
y T
ax L
evie
s an
d C
ollect
ion
sLast
Ten
Fis
cal
Years
(Un
au
dit
ed
)
- 111 -

CITY OF NEWTON, NORTH CAROLINATable 10
Electricity Sold by Type of CustomerLast Ten Fiscal Years(in millions of kWh)
(Unaudited)
Fiscal Type of CustomerYear Residential Industrial Commercial Total2004 43.3 32.3 39.8 115.4 2005 41.4 32.8 40.4 114.6 2006 44.8 35.0 40.7 120.5 2007 45.8 49.2 41.4 136.4 2008 47.5 52.9 40.6 141.0 2009 47.9 50.7 42.6 141.2 2010 45.9 52.0 53.2 151.1 2011 51.8 55.1 51.8 158.7 2012 46.9 56.3 47.4 150.6 2013 47.4 55.0 46.9 149.3
Source: City of Newton Utility Billing
- 112 -

CIT
Y O
F N
EW
TO
N, N
OR
TH
CA
RO
LIN
AT
ab
le 1
1Ele
ctri
city
Rate
sLast
Ten
Fis
cal
Years
(Un
au
dit
ed
)
Resi
den
tial
Ind
ust
rial
Rate
per
Rate
per
Rate
per
Dem
an
dR
ate
per
Rate
per
Rate
per
Fis
cal
Basi
ckW
hkW
hkW
hBasi
c over
30 K
WkW
hkW
hkW
hY
ear
Faci
liti
es
1st
350
next
950
over
1300
Faci
liti
es
(per
KW
)1st
3000
next
9000
over
12000
20
04
8.6
2$
0.0
72
88
0$
0.0
81
91
4$
0.0
73
73
3$
17
.85
$
5.7
6$
0.1
01
70
7$
0.0
55
61
3$
0.0
48
73
4$
20
05
8.8
0
0.0
74
33
8
0.0
83
55
2
0.0
75
20
8
18
.20
5.9
0
0.1
03
74
1
0.0
56
72
5
0.0
49
70
9
20
06
8.8
9
0.0
75
08
1
0.0
84
38
8
0.0
75
96
0
18
.38
5.9
6
0.1
04
77
8
0.0
57
29
2
0.0
50
20
6
20
07
9.0
8
0.0
76
66
0
0.0
86
16
0
0.0
77
55
6
18
.77
6.0
9
0.1
06
98
0
0.0
58
49
6
0.0
51
26
1
20
08
9.3
5
0.0
78
96
0
0.0
88
74
5
0.0
79
88
3
19
.15
6.1
8
0.1
09
12
0
0.0
59
66
6
0.0
52
28
6
20
09
9.6
3
0.0
81
32
9
0.0
91
40
7
0.0
82
27
9
19
.53
6.3
0
0.1
11
30
2
0.0
60
85
9
0.0
53
33
2
20
10
10
.02
0.0
84
58
2
0.0
95
06
3
0.0
85
57
0
20
.12
6.4
9
0.1
14
64
1
0.0
62
68
5
0.0
54
93
2
20
11
10
.52
0.0
88
81
1
0.0
99
81
6
0.0
89
84
9
21
.13
6.8
1
0.1
20
37
3
0.0
65
81
9
0.0
57
67
9
20
12
11
.10
0.0
93
69
6
0.1
05
30
6
0.0
94
79
1
22
.29
7.1
8
0.1
26
99
4
0.0
69
43
9
0.0
60
85
1
20
13
11
.79
0.0
99
50
5
0.1
11
83
5
0.1
00
66
8
23
.67
7.6
3
0.1
34
86
8
0.0
73
74
4
0.0
64
62
4
Com
merc
ial
Rate
per
Rate
per
Rate
per
Basi
c D
em
an
dkW
hkW
hkW
hFaci
liti
es
over
30 K
W1st
3000
next
9000
over
12000
20
04
11
.58
$
6.3
2$
0.1
02
39
6$
0.0
53
77
7$
0.0
48
50
2$
20
05
11
.81
6.4
5
0.1
04
44
4
0.0
54
85
3
0.0
49
47
2
20
06
11
.93
6.5
1
0.1
05
48
8
0.0
55
40
2
0.0
49
96
7
20
07
12
.18
6.6
5
0.1
07
70
5
0.0
56
56
5
0.0
51
01
6
20
08
12
.55
6.8
5
0.1
10
93
6
0.0
58
26
2
0.0
52
54
6
20
09
12
.93
7.0
5
0.1
14
26
4
0.0
60
01
0
0.0
54
12
2
20
10
13
.45
7.3
3
0.1
18
83
5
0.0
62
41
0
0.0
56
28
7
20
11
14
.12
7.7
0
0.1
24
77
7
0.0
65
53
1
0.0
59
10
1
20
12
14
.90
8.1
2
0.1
31
64
0
0.0
69
13
5
0.0
62
35
2
20
13
15
.82
8.6
3
0.1
39
80
2
0.0
73
42
1
0.0
66
21
8
Sourc
e: C
ity
of
New
ton
Uti
lity
Billin
g
- 113 -

CIT
Y O
F N
EW
TO
N, N
OR
TH
CA
RO
LIN
AT
ab
le 1
2R
ati
os
of
Ou
tsta
nd
ing
Deb
t b
y T
yp
eLast
Ten
Fis
cal
Years
(Un
au
dit
ed
)
Go
vern
men
tal
Act
ivit
ies
Bu
sin
ess
-typ
e A
ctiv
itie
sG
en
era
lG
en
era
lPerc
en
tag
eFis
cal
Ob
lig
ati
on
Lo
an
sO
blig
ati
on
Lo
an
sT
ota
lo
f Pers
on
al
Per
Year
Bo
nd
sPayab
leB
on
ds
Payab
leG
overn
men
tIn
com
e (1
)C
ap
ita (1
)
2004
228,7
04
$
2,2
68,0
05
$
3,1
66,2
96
$
10,1
00,8
57
$
15,7
63,8
62
$
4.3
8%
1,2
18
2005
179,9
45
2,7
05,0
77
2,7
05,0
55
14,5
08,9
04
20,0
98,9
81
5.4
1%
1,5
48
2006
132,0
76
3,4
06,9
78
2,2
52,9
24
17,2
72,8
16
23,0
64,7
94
5.8
7%
1,7
64
2007
98,1
02
3,2
02,1
44
1,8
21,8
98
16,4
28,1
41
21,5
50,2
85
5.2
5%
1,6
29
2008
74,0
88
4,2
14,2
17
1,3
75,9
12
14,8
56,8
31
20,5
21,0
48
4.7
6%
1,5
14
2009
50,3
29
4,2
68,2
68
934,6
71
17,7
49,5
55
23,0
02,8
23
5.4
2%
1,6
83
2010
27,0
80
4,0
52,0
08
502,9
20
15,9
39,6
00
20,5
21,6
08
4.5
7%
1,4
85
2011
4,3
43
3,8
03,7
02
80,6
57
13,9
23,7
27
17,8
12,4
29
4.1
1%
1,3
71
2012
-
4,3
29,0
31
-
16,4
68,6
17
20,7
97,6
48
N/A
1,6
03
2013
-
3,8
94,0
50
-
16,5
71,4
80
20,4
65,5
30
N/A
1,5
79
Note
: D
etai
ls r
egar
din
g t
he
Cit
y’s
outs
tandin
g d
ebt
can b
e fo
und in t
he
Note
s to
the
Finan
cial
Sta
tem
ents
.
(1) S
ee S
ched
ule
of
Dem
ogra
phic
and E
conom
ic S
tati
stic
s.
- 114 -

CIT
Y O
F N
EW
TO
N, N
OR
TH
CA
RO
LIN
AT
ab
le 1
3R
ati
os
of
Gen
era
l B
on
ded
Deb
t O
uts
tan
din
gLast
Ten
Fis
cal
Years
(Un
au
dit
ed
)
Perc
en
tag
e o
fEst
imate
dT
ota
lG
ross
A
ctu
al
Taxab
lePerc
en
tag
eFis
cal
Ass
ess
ed
Bo
nd
ed
V
alu
e o
f o
f Pers
on
al
Per
Year
Po
pu
lati
on
(1)
Valu
eD
eb
tPro
pert
yIn
com
eC
ap
ita
2004
12,9
39
860,2
67,3
53
$
3,3
95,0
00
$
0.3
9%
0.9
4%
262
2005
12,9
86
852,3
39,7
37
2,8
85,0
00
0.3
4%
0.7
8%
222
2006
13,0
75
857,4
16,9
05
2,3
85,0
00
0.2
8%
0.6
1%
182
2007
13,2
29
894,3
87,2
10
1,9
20,0
00
0.2
1%
0.4
7%
145
2008
13,5
54
955,5
11,3
73
1,4
50,0
00
0.1
5%
0.3
4%
107
2009
13,6
70
975,2
60,7
75
985,0
00
0.1
0%
0.2
3%
72
2010
13,8
19
1,0
68,9
30,7
37
530,0
00
0.0
5%
0.1
2%
38
2011
12,9
95
1,0
74,3
66,3
09
85,0
00
0.0
1%
0.0
2%
72012
12,9
71
1,0
60,7
50,4
59
-
0.0
0%
N/A
02013
12,9
61
1,0
83,5
54,8
91
-
0.0
0%
N/A
0
Note
: D
etai
ls r
egar
din
g t
he
Cit
y’s
outs
tandin
g d
ebt
can b
e fo
und in t
he
Note
s to
the
Finan
cial
Sta
tem
ents
.
(1) S
ee S
ched
ule
of
Dem
ogra
phic
and E
conom
ic S
tati
stic
s.
- 115 -

CITY OF NEWTON, NORTH CAROLINATable 14
Direct and Overlapping Government Activities Debt
June 30, 2013
(Unaudited)
Estimated
Estimated Share ofDebt Percentage Overlapping
Outstanding Applicable Debt
Debt repaid with property taxes:County of Catawba 154,634,710$ 6.76% 10,453,306$
Subtotal, overlapping debt 10,453,306 City of Newton direct debt 3,894,050 Total 14,347,356$
Note: The percentage of overlapping debt is based on the June 30, 2013 assessed valuation of the County of Catawba of $16,027,884,358 as compared to the June 30, 2013 assessed valuation for the City of Newton of $1,083,554,891.
- 116 -

CIT
Y O
F N
EW
TO
N, N
OR
TH
CA
RO
LIN
AT
ab
le 1
5Leg
al D
eb
t M
arg
in I
nfo
rmati
on
Last
Ten
Fis
cal Y
ears
(Un
au
dit
ed
)
Fis
cal Y
ear
2004
2005
2006
2007
2008
2009
2010
2011
2012
2013
Ass
ess
ed
val
ue o
f ta
xab
le p
ropert
y8
60
,25
7,3
53
$
8
52
,33
9,7
37
$
8
57
,41
6,9
05
$
8
94
,38
7,2
10
$
9
55
,51
1,3
73
$
9
75
,26
0,7
75
$
1
,06
8,9
30
,73
7$
1,0
74
,36
6,3
09
$
1
,06
0,7
50
,45
9$
1,0
83
,55
4,8
91
$
Debt
lim
it,
8%
of
asse
ssed
val
ue
(s
tatu
tory
lim
itat
ion)
68
,82
0,5
88
$
68
,18
7,1
79
$
68
,59
3,3
52
$
71
,55
0,9
77
$
76
,44
0,9
10
$
78
,02
0,8
62
$
85
,51
4,4
59
$
8
5,9
49
,30
5$
84
,86
0,0
37
$
8
6,6
84
,39
1$
Debt
applica
ble
to
lim
it:
Genera
l o
bligat
ion b
ond
s3
,39
5,0
00
2,8
85
,00
0
2
,38
5,0
00
1,9
20
,00
0
1
,45
0,0
00
98
5,0
00
53
0,0
00
85
,00
0
-
-
Loan
s pay
able
12
,36
8,8
63
1
7,4
10
,98
4
20
,67
9,7
93
1
9,6
30
,28
5
19
,07
1,0
48
2
2,0
17
,82
3
19
,99
1,6
08
1
7,7
27
,42
9
20
,79
7,6
48
2
0,4
65
,53
0
To
tal net
debt
applica
ble
to
lim
it1
5,7
63
,86
3
20
,29
5,9
84
2
3,0
64
,79
3
21
,55
0,2
85
2
0,5
21
,04
8
23
,00
2,8
23
2
0,5
21
,60
8
17
,81
2,4
29
2
0,7
97
,64
8
20
,46
5,5
30
Legal
debt
mar
gin
53
,05
6,7
25
$
47
,89
1,1
95
$
45
,52
8,5
59
$
50
,00
0,6
92
$
55
,91
9,8
62
$
55
,01
8,0
39
$
64
,99
2,8
51
$
6
8,1
36
,87
6$
64
,06
2,3
89
$
6
6,2
18
,86
1$
To
tal net
debt
applica
ble
to
the
lim
it a
s a
perc
enta
ge o
f as
sess
ed
pro
pert
y ta
x v
alu
e1
.83
%2
.38
%2
.69
%2
.41
%2
.15
%2
.36
%1
.92
%1
.66
%1
.96
%1
.89
%
No
te:
No
rth C
aro
lina
Genera
l St
atu
te 1
59
-55
lim
its
the C
ity’
s o
uts
tand
ing d
ebt
to 8
% o
f th
e a
ppra
ised
val
ue o
f pro
pert
y su
bje
ct t
o t
axat
ion.
- 117 -

CIT
Y O
F N
EW
TO
N, N
OR
TH
CA
RO
LIN
AT
ab
le 1
6D
em
og
rap
hic
an
d E
con
om
ic S
tati
stic
sLast
Ten
Fis
cal
Years
(Un
au
dit
ed
)
Pers
on
al
In
com
ePer
Cap
ita
Fis
cal
(am
ou
nts
exp
ress
ed
Pers
on
al
Med
ian
Sch
oo
lU
nem
plo
ym
en
tY
ear
Po
pu
lati
on
(1)
in t
ho
usa
nd
s)(5
)In
com
e(2
)(5)
Ag
e(1
)En
rollm
en
t(3)
Rate
(4)
2004
12,9
39
360,0
79
$
27,8
29
$
36.4
2,7
98
7.2
%2005
12,9
86
371,3
74
28,5
98
36.6
2,8
15
6.6
%2006
13,0
75
393,2
18
30,0
74
36.7
2,9
01
5.4
%2007
13,2
29
410,7
74
31,0
51
36.7
2,8
52
5.6
%2008
13,5
54
431,3
29
31,8
23
37.0
2,8
63
7.2
%2009
13,6
70
424,4
81
31,0
52
38.1
2,8
08
15.5
%2010
13,8
19
449,1
73
32,5
04
38.2
2,8
61
13.0
%2011
12,9
95
432,9
93
33,3
20
39.6
2,8
63
12.1
%2012
12,9
71
N
/A N
/A40.0
2,8
89
11.3
%2013
12,9
61
N
/A N
/A40.3
2,9
77
10.8
%
Dat
a so
urc
es(1
) N
ort
h C
arolina
Off
ice
of
Stat
e Budget
and M
anag
emen
t(2
) U
.S. D
epar
tmen
t of
Com
mer
ce, Bure
au o
f Ec
onom
ic A
nal
ysis
(3) N
ort
h C
arolina
Dep
artm
ent
of
Public
Inst
ruct
ion
(4) N
ort
h C
arolina
Dep
artm
ent
of
Com
mer
ce(5
) In
form
atio
n n
ot
avai
lable
for
som
e ye
ars
Note
: Se
par
ate
dat
a fo
r th
e C
ity
of
New
ton in n
ot
avai
lable
exce
pt
for
the
popula
tion a
mounts
and s
chool
enro
llm
ent.
C
ataw
ba
County
dat
a w
as p
rovi
ded
. P
erso
nal
inco
me
info
rmat
ion is
a to
tal fo
r th
e pre
vious
year
. U
nem
plo
ymen
t ra
te info
rmat
ion is
an a
dju
sted
yea
rly
aver
age.
Sc
hool en
rollm
ent
is b
ased
on t
he
censu
s at
the
end o
f th
e sc
hool ye
ar.
- 118 -

CIT
Y O
F N
EW
TO
N, N
OR
TH
CA
RO
LIN
AT
ab
le 1
7Pri
nci
pal
Em
plo
yers
Cu
rren
t Y
ear
an
d N
ine Y
ears
Ag
o(U
nau
dit
ed
)
20
13
20
04
(1)
Perc
en
tag
ePerc
en
tag
eo
f T
ota
l
of
To
tal
C
ou
nty
Co
un
tyEm
plo
yer
Em
plo
yees
Ran
kEm
plo
ym
en
tEm
plo
yees
Ran
kEm
plo
ym
en
tC
ataw
ba
County
Sch
ools
1,9
86
12.7
0%
Cat
awba
County
Gove
rnm
ent
1,0
84
21.5
0%
McC
rear
y M
oder
n628
30.9
0%
Lee
Indust
ries
500
40.7
0%
Tar
get
Dis
trib
uti
on C
ente
r500
50.7
0%
New
ton-C
onove
r C
ity
Schools
500
60.7
0%
Tec
hnib
ilt
360
70.5
0%
Unit
ed C
hurc
h H
om
es &
Ser
vice
s (A
ber
net
hy
Laure
ls)
328
80.4
0%
Gen
eral
Dyn
amic
s250
90.3
0%
Flow
ers
Bak
ing C
om
pan
y234
10
0.3
0%
T
ota
l6,3
70
8.7
0%
Tota
l C
ivilia
n L
abor
Forc
e73,0
38
Sourc
e: C
ity
of
New
ton P
ublic
Info
rmat
ion O
ffic
e(1
) Info
rmat
ion n
ot
avai
lable
for
Fisc
al Y
ear
2003-2
004.
- 119 -

CIT
Y O
F N
EW
TO
N, N
OR
TH
CA
RO
LIN
AT
ab
le 1
8Fu
ll-T
ime E
qu
ivale
nt
Cit
y G
overn
men
t Em
plo
yees
by F
un
ctio
nLast
Ten
Fis
cal
Years
(Un
au
dit
ed
)
Fis
cal
Year
20
04
20
05
20
06
20
07
20
08
20
09
20
10
20
11
20
12
20
13
Fu
nct
ion
Gen
eral
Gove
rnm
ent
Cit
y M
anag
er4
33
33
33
33
4H
um
an r
esourc
es2
22
22
22
22
2Fi
nan
ce12
13
12
12
12
13
11
11
11
11
Info
rmat
ion s
yste
ms
22
22
Public
Saf
ety
Polic
eO
ffic
ers
36
35
35
35
35
35
34
35
35
35
Civ
ilian
s8
88
88
89
88
9Fi
re Fire
fighte
rs a
nd o
ffic
ers
16
16
25
25
25
26
25
26
26
26
Rec
reat
ion
Adm
inis
trat
ion
11
11
11
11
11
11
11
10
10
10
Com
munit
y ap
pea
rance
4
44
44
44
44
4Pu
blic
Work
sA
dm
inis
trat
ion
3
33
3
23
32
22
Stre
et10
99
910
10
10
99
9Eq
uip
men
t se
rvic
es3
22
22
22
22
2En
viro
nm
enta
l Pr
ote
ctio
nSo
lid w
aste
13
12
12
12
13
13
13
13
13
13
Econom
ic &
Phys
ical
Dev
elopm
ent
Plan
nin
g &
zonin
g4
44
44
55
44
3W
ater
and S
ewer
Wat
er T
reat
men
t Pl
ant
8
88
88
88
89
9D
istr
ibuti
on &
colle
ctio
n10
11
11
12
11
10
10
10
11
11
Was
tew
ater
Tre
atm
ent
Plan
t13
13
13
13
13
13
13
12
12
12
Elec
tric
11
12
14
15
15
15
15
15
15
15
Tota
l168
166
176
178
178
181
180
176
178
179
Sourc
e: B
udget
ed p
erso
nnel
rec
ord
s
- 120 -

CIT
Y O
F N
EW
TO
N, N
OR
TH
CA
RO
LIN
AT
ab
le 1
9, p
ag
e 1
of
2O
pera
tin
g I
nd
icato
rs B
y F
un
ctio
nLast
Ten
Fis
cal
Years
(Un
au
dit
ed
)
Fis
cal
Year
Fu
nct
ion
20
04
20
05
20
06
20
07
20
08
20
09
20
10
20
11
20
12
20
13
Polic
e**
Cal
ls f
or
serv
ice
19,1
22
21,3
41
20,3
36
19,5
87
17,8
12
22,7
20
25,0
78
26,5
17
23,6
09
22,2
65
Arr
est
s754
653
731
680
712
739
599
601
742
659
Tra
ffic
sto
ps
3,4
61
3,3
30
2,7
19
2,5
18
1,8
01
2,1
69
1,5
80
2,9
03
2,7
79
2,5
96
Cit
atio
ns
3,4
39
3,6
11
3,0
75
2,4
91
1,6
77
1,9
45
1,4
35
2,6
65
2,5
61
1,7
97
Propert
y ch
eck
s*413
663
442
235
347
5,5
54
8,6
11
8,6
69
6,1
48
4,6
56
Inci
dents
2,2
25
2,1
33
2,2
96
2,2
75
2,0
97
2,1
45
1,9
44
2,0
03
1,8
23
1,8
17
Fire Em
erg
ency
inci
dents
(ca
lls)
619
665
823
689
828
806
826
883
911
1110
Fire
insp
ect
ions
com
ple
ted
715
756
801
529
546
601
543
492
575
535
Fire
pre
venti
on p
rogra
ms
98
153
172
442
265
237
257
176
244
131
Perm
its
issu
ed
9121
56
40
51
39
28
40
42
42
Tra
inin
g h
ours
com
ple
ted
4,7
88
7,9
22
9,2
48
8,2
18
10,1
81
7,8
29
8,7
21
9,2
82
10,4
53
8,6
38
Hig
hw
ays
& S
treets
Pave
d/r
esu
rfac
ed (m
iles)
2.0
50.0
02.0
90.0
01.3
93
22
1.2
71.0
4Po
thole
s re
pai
red
30
26
43
53
65
11
69
72
28
35
Sanit
atio
nResi
denti
al c
olle
ctio
ns
(tons)
7,9
85
7,4
59
6,4
93
4,7
11
4,4
95
4,1
14
4,2
63
4,3
43
4,2
81
4,2
60
Recy
clab
les
(tons)
633
564
531
422
418
472
464
418
439
418
Yar
dw
aste
colle
cted (to
ns)
1,7
64
1,9
47
2,0
09
717
279
440
733
1,9
40
994
2,1
15
House
hold
s se
rved**
5,0
37
5,0
37
5,0
77
5,0
77
5,3
68
5,3
68
5,3
68
5,4
40
5,4
40
4,6
32
- 121 -

CIT
Y O
F N
EW
TO
N, N
OR
TH
CA
RO
LIN
AT
ab
le 1
9, p
ag
e 2
of
2O
pera
tin
g I
nd
icato
rs B
y F
un
ctio
nLast
Ten
Fis
cal
Years
(Un
au
dit
ed
)
Fis
cal
Year
Fu
nct
ion
20
04
20
05
20
06
20
07
20
08
20
09
20
10
20
11
20
12
20
13
Cult
ure
& R
ecr
eat
ion (par
tici
pan
ts)
Cente
r ac
tivi
ties
6,7
25
8,0
00
9,7
13
17,6
91
18,0
11
19,2
52
21,1
26
23,3
51
24,1
23
24,1
50
Ath
leti
c19,8
86
20,9
84
21,0
22
34,0
86
36,2
50
56,2
05
58,0
93
60,8
74
70,3
26
65,9
87
Fitn
ess
room
390
909
1,7
61
1,9
01
2,5
65
3,5
75
3,7
21
3,2
50
3,2
00
1,2
00
Swim
min
g p
ool
1,5
65
4,2
40
3,8
37
5,3
00
5,6
11
6,5
71
0983
3,1
06
3,2
27
Shelt
ers
483
500
607
750
842
1,0
85
1,7
50
2,3
45
2,5
14
3,2
55
Cem
ete
ry b
uri
als
67
63
55
61
60
50
59
48
46
57
Wat
er
New
connect
ion
139
156
47
59
83
38
28
21
15
20
Wat
er
mai
n b
reak
s14
18
15
22
44
46
32
33
23
12
Ave
rage d
aily
consu
mpti
on (M
GD
)2.1
82.0
22.3
63.2
93.4
3.4
3.6
3.8
3.6
3.7
Num
ber
of
cust
om
ers
5,7
71
5,9
27
5,9
74
5,9
50
6,0
07
6010
5,9
89
5,9
56
5,9
77
5,9
65
Was
tew
ater
Ave
rage d
aily
usa
ge (M
GD
)3.3
63.6
92.4
02.0
31.6
41.6
41.9
1.8
1.7
1.8
Num
ber
of
cust
om
ers
4,5
00
4,5
87
4,6
68
4,6
53
4,6
82
4,6
81
4,6
63
4,6
79
4,6
53
4,6
56
Elect
ric
Ave
rage d
aily
usa
ge (K
wh)
316,2
34
314,2
63
325,4
66
394,8
07
386,5
53
387,3
14
411,8
50
434,4
21
436,3
51
431,1
98
Pe
ak d
em
and
24,2
21
24,9
41
26,9
44
29,7
48
31,0
33
28,9
69
33,7
58
35,3
94
32,2
21
31,0
76
Num
ber
of
cust
om
ers
4,3
36
4,3
99
4,4
43
4,4
65
4,5
71
4,5
60
4,5
26
4,4
28
4,4
28
4,4
25
Sourc
es:
V
ario
us
gove
rnm
ent
depar
tments
.N
ote
: Indic
ators
are
not
avai
lable
for
the g
enera
l gove
rnm
ent
funct
ion.
*
Subst
anti
al incr
eas
e b
egin
nin
g in F
isca
l Year
2008-2
009 is
due t
o incl
udin
g c
hurc
hes
as p
art
of
dai
ly p
ropert
y ch
eck
s.**
Begin
nin
g in F
isca
l Year
2012-2
013 t
rack
ing w
as c
om
ple
ted t
hro
ugh t
he u
se o
f updat
ed c
om
pute
r so
ftw
are p
rogra
ms.
- 122 -

CIT
Y O
F N
EW
TO
N, N
OR
TH
CA
RO
LIN
AT
ab
le 2
0, p
ag
e 1
of
2C
ap
ital
Ass
et
Sta
tist
ics
by F
un
ctio
nLast
Ten
Fis
cal
Years
(Un
au
dit
ed
)
Fis
cal
Year
Fu
nct
ion
20
04
20
05
20
06
20
07
20
08
20
09
20
10
20
11
20
12
20
13
Polic
ePo
lice s
tati
ons
22
24
33
33
33
Polic
e p
atro
l ve
hic
les
36
36
36
28
29
30
35
30
31
30
Oth
er
polic
e v
ehic
les
12
12
12
19
19
18
18
18
22
16
Fire Fi
re s
tati
ons
33
33
33
33
33
Fire
suppre
ssio
n v
ehic
les
99
99
99
99
910
Oth
er
fire
vehic
les
55
56
77
77
77
Hig
hw
ays
& S
treets
Stre
ets
mai
nta
ined (m
iles)
76.8
376.8
376.8
377.2
277.3
977.3
976.3
476.5
877.3
977.3
9St
orm
sew
er
(mile
s)25.8
326.1
926.1
926.4
626.5
226.5
256.4
856.5
365.3
665.4
Sidew
alk (m
iles)
27.5
027.5
027.5
027.8
427.8
427.8
427.8
427.8
427.8
427.8
4C
atch
bas
in inle
ts1,3
60
1,3
62
1,3
64
1,3
77
1,3
80
1,3
80
1,3
80
1,3
80
1,3
80
1,3
80
Pow
ell
Bill
equip
ment
17
17
15
15
15
15
15
15
15
9St
reet
equip
ment
17
18
18
18
18
18
18
18
18
28
Sanit
atio
nResi
denti
al t
ruck
s2
22
22
22
22
2D
um
pst
er
truck
s2
21
11
11
11
2O
ther
equip
ment
11
11
11
11
11
11
11
11
11
10
- 123 -

CIT
Y O
F N
EW
TO
N, N
OR
TH
CA
RO
LIN
AT
ab
le 2
0, p
ag
e 2
of
2C
ap
ital
Ass
et
Sta
tist
ics
by F
un
ctio
nLast
Ten
Fis
cal
Years
(Un
au
dit
ed
)
Fis
cal
Year
Fu
nct
ion
20
04
20
05
20
06
20
07
20
08
20
09
20
10
20
11
20
12
20
13
Cult
ure
& R
ecr
eat
ion
Recr
eat
ion c
ente
rs2
22
22
22
22
2Pa
rks
55
55
55
55
55
Park
acr
eag
e63.5
63.5
63.5
63.5
63.5
63.5
153.5
153.5
153.5
153.5
Swim
min
g p
ool
11
11
11
11
11
Tennis
court
s8
88
88
88
88
8C
em
ete
ries
33
33
33
33
33
Wat
er
Wat
er
lines
(mile
s)165.0
178.5
178.5
175.7
182.9
182.9
182.9
182.9
182.5
182.5
Fire
hyd
rants
1,0
49
1,0
61
1,0
67
1,0
70
1,0
75
1,0
75
1,0
77
1,0
77
1,0
77
1,0
22
Max
dai
ly c
apac
ity
(MG
D)
8.0
8.0
8.0
8.0
8.0
8.0
8.0
8.0
8.0
8.0
Was
tew
ater
Max
dai
ly c
apac
ity
(MG
D)
5.0
5.0
5.0
5.0
5.0
5.0
5.0
5.0
5.0
5.2
Sanit
ary
sew
er
lines
(mile
s)123
125
127
119
130.5
132.5
132.5
132.5
134.7
132
Elect
ric
Subst
atio
ns
55
55
55
55
32
Serv
ice lin
es
(mile
s)107
107
110
125
125
125
125
125
125
125
Sourc
es:
V
ario
us
gove
rnm
ent
depar
tments
.N
ote
: Indic
ators
are
not
avai
lable
for
the g
enera
l gove
rnm
ent
funct
ion.
- 124 -

COMPLIANCE SECTION
Report On Internal Control Over Financial Reporting And On Compliance And Other Matters Based On An Audit of Financial Statements Performed In Accordance With Government Auditing Standards Schedule of Findings and Questioned Costs Summary Schedule of Prior Year’s Audit Findings


730 13th Avenue Drive SE ♦ Hickory, North Carolina 28602 ♦ Phone 828-327-2727 ♦ Fax 828-328-2324 13 South Center Street ♦ Taylorsville, North Carolina 28681 ♦ Phone 828-632-9025 ♦ Fax 828-632-9085
Toll Free Both Locations 1-800-948-0585 ♦ Website: www.martinstarnes.com
Report On Internal Control Over Financial Reporting And On Compliance And Other Matters Based On An Audit of Financial Statements Performed In
Accordance With Government Auditing Standards
Independent Auditor’s Report
To the Honorable Mayor and Members of the City Council City of Newton, North Carolina We have audited, in accordance with the auditing standards generally accepted in the United States of America and the standards applicable to financial audits contained in Government Auditing Standards issued by the Comptroller General of the United States, the accompanying financial statements of the governmental activities, the business-type activities, each major fund, and the aggregate remaining fund information of the City of Newton, North Carolina, as of and for the year ended June 30, 2013, and the related notes to the financial statements, which collectively comprise the City’s basic financial statements, and have issued our report thereon dated October 1, 2013. Internal Control Over Financial Reporting In planning and performing our audit of the financial statements, we considered the City of Newton’s internal control over financial reporting (internal control) to determine the audit procedures that are appropriate in the circumstances for the purpose of expressing our opinions on the financial statements, but not for the purpose of expressing an opinion on the effectiveness of the City of Newton’s internal control. Accordingly, we do not express an opinion on the effectiveness of the City of Newton’s internal control. A deficiency in internal control exists when the design or operation of a control does not allow management or employees, in the normal course of performing their assigned functions, to prevent, or detect and correct, misstatements on a timely basis. A material weakness is a deficiency, or a combination of deficiencies, in internal control, such that there is a reasonable possibility that a material misstatement of the City’s financial statements will not be prevented, or detected and corrected, on a timely basis. A significant deficiency is a deficiency, or a combination of deficiencies, in internal control that is less severe than a material weakness, yet important enough to merit attention by those charged with governance.
- 125 -

Our consideration of internal control was for the limited purpose described in the first paragraph of this section and was not designed to identify all deficiencies in internal control that might be material weaknesses or significant deficiencies. Given these limitations, during our audit we did not identify any deficiencies in internal control that we consider to be material weaknesses. However, material weaknesses may exist that have not been identified. Compliance and Other Matters As part of obtaining reasonable assurance about whether the City of Newton’s financial statements are free of material misstatement, we performed tests of its compliance with certain provisions of laws, regulations, contracts, and grant agreements, non-compliance with which could have a direct and material effect on the determination of financial statement amounts. However, providing an opinion on compliance with those provisions was not an objective of our audit and, accordingly, we do not express such an opinion. The results of our tests disclosed no instances of non-compliance or other matters that are required to be reported under Government Auditing Standards. Purpose of This Report The purpose of this report is solely to describe the scope of our testing of internal control and compliance and the result of that testing, and not to provide and opinion on the effectiveness of the City’s internal control or compliance. This report is an integral part of an audit performed in accordance with Government Auditing Standards in considering the City’s internal control and compliance. Accordingly, this communication is not suitable for any other purpose.
Martin Starnes & Associates, CPAs, P.A. Hickory, NC October 1, 2013
- 126 -

CITY OF NEWTON, NORTH CAROLINA
SCHEDULE OF FINDINGS AND QUESTIONED COSTS FOR THE YEAR ENDED JUNE 30, 2013
1. Summary of Auditor’s Results Financial Statements
Type of auditor’s report issued Unmodified
Internal control over financial reporting:
• Material weakness identified? No • Significant deficiency identified not considered To be material weaknesses? None reported
Non-compliance material to financial statements noted? No 2. Financial Statements Findings
None
- 127 -

CITY OF NEWTON, NORTH CAROLINA
SUMMARY SCHEDULE OF PRIOR YEAR’S AUDIT FINDINGS FOR THE YEAR ENDED JUNE 30, 2013
None noted.
- 128 -