city of melbourne, florida - florida auditor general rpts/2016 melbourne.pdf · 900 e. strawbridge...
TRANSCRIPT

CITY OF MELBOURNE, FLORIDA
COMPREHENSIVE ANNUAL FINANCIAL REPORT
FOR THE FISCAL YEAR ENDED SEPTEMBER 30, 2016

CITY OF MELBOURNE, FLORIDA
Comprehensive Annual Financial Report For The Fiscal Year Ended September 30, 2016
CITY COUNCIL
Kathleen H. Meehan. ........................................................ Mayor Dan Porsi .................................................. Vice Mayor, District 3 Mike Nowlin ..............................................................…District 1 Betty Moore .................................................................. District 2 Debbie Thomas ............................................................ District 4 Molly J. Tasker ............................................................. District 5 Teresa Lopez ............................................................... District 6
CITY OFFICIALS
Michael A. McNees. ............................................... City Manager Cathleen A. Wysor ...................................................... City Clerk Alison Dawley ........................................................ City Attorney Sondra L. D’Angelo,CGFO, CPA ....... Assistant Finance Director
Prepared by: Financial Services Department

INTRODUCTORY SECTION
This section contains the following subsections:
• Table of Contents
• Letter of Transmittal
• Certificate of Achievement for Excellencein Financial Reporting
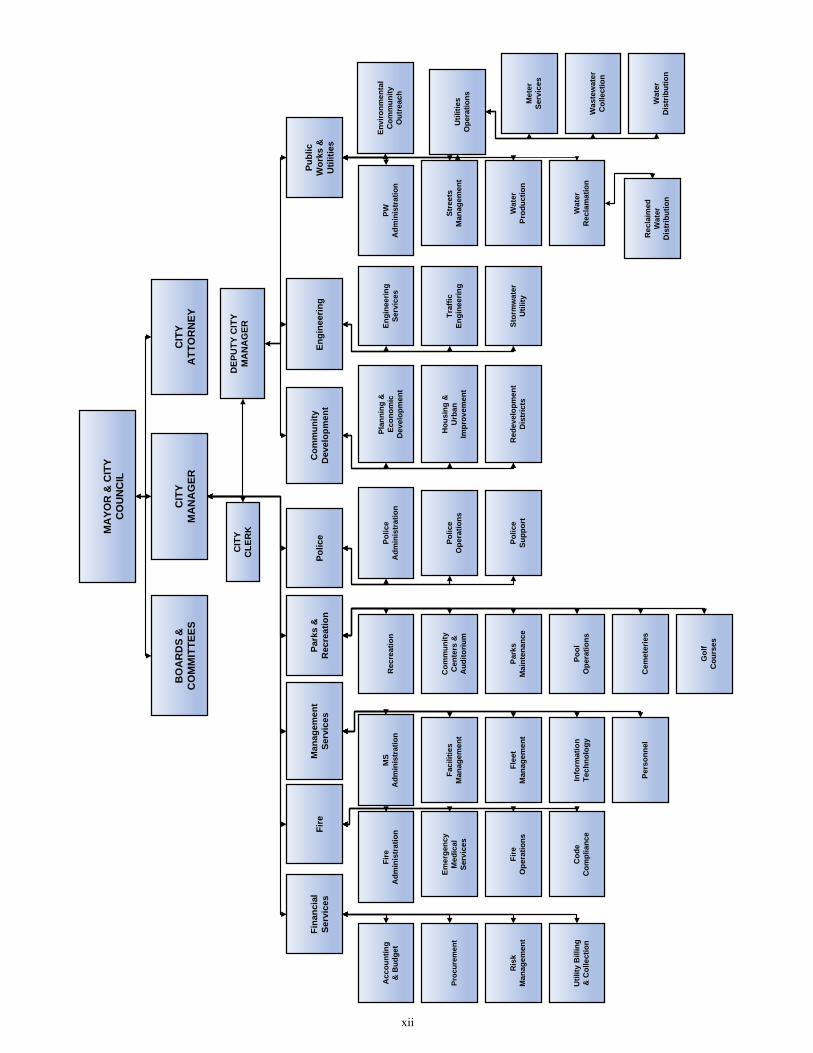
• Organizational Chart


CITY OF MELBOURNE, FLORIDA COMPREHENSIVE ANNUAL FINANCIAL REPORT
SEPTEMBER 30, 2016 TABLE OF CONTENTS
INTRODUCTORY SECTION
Page Title Page ............................................................................................................................................................. i Table of Contents................................................................................................................................................. ii Letter of Transmittal ............................................................................................................................................ vii Certificate of Achievement for Excellence in Financial Reporting ..................................................................... xi Organizational Chart ............................................................................................................................................ xii
FINANCIAL SECTION
Independent Auditors’ Report ............................................................................................................................. 1
Management’s Discussion and Analysis ............................................................................................................. 4
Basic Financial Statements
Government-wide Financial Statements: Statement of Net Position ............................................................................................................................ 14
Statement of Activities ................................................................................................................................. 16
Fund Financial Statements: Balance Sheet – Governmental Funds ......................................................................................................... 18
Reconciliation of the Balance Sheet of the Governmental Funds to the Statement of Net Position .................................................................................................... 20
Statement of Revenues, Expenditures and Changes in Fund Balances - Governmental Funds ..................................................................................................... 21
Reconciliation of the Statement of Revenues, Expenditures and Changes in Fund Balances of Governmental Funds to the Statement of Activities ................................................ 23
Statement of Net Position – Proprietary Funds ............................................................................................ 24
Statement of Revenues, Expenses and Changes in Fund Net Position – Proprietary Funds .................................................................................................... 26
Statement of Cash Flows – Proprietary Funds ............................................................................................. 27
Statement of Fiduciary Net Position – Fiduciary Funds .............................................................................. 29
Statement of Changes in Fiduciary Net Position – Fiduciary Funds ........................................................... 30
ii
Notes to the Financial Statements ....................................................................................................................... 31
Required Supplementary Information
Schedule of Revenues, Expenditures and Changes in Fund Balance – Budget and Actual – General Fund .................................................................................... 83
Schedule of Revenues, Expenditures and Changes in Fund Balance – Budget and Actual – Downtown Redevelopment Special Revenue Fund .................................................. 84
Schedule of Revenues, Expenditures and Changes in Fund Balance – Budget and Actual – Babcock Street Redevelopment Special Revenue Fund ............................................. 85
Schedule of Revenues, Expenditures and Changes in Fund Balance – Budget and Actual – Olde Eau Gallie Redevelopment Special Revenue Fund ........................................... 86
Budgetary Notes to Required Supplementary Information ............................................................................. 87
Schedule of Changes in Net Pension Liability and Related Ratios – Firefighters Pension ............................. 89
Schedule of City Contributions – Firefighters Pension .................................................................................. 90
Schedule of Changes in Net Pension Liability and Related Ratios – Police Officers Pension ........................ 91
Schedule of City Contributions – Police Officers Pension ............................................................................. 92
Schedule of Changes in Net Pension Liability and Related Ratios – General Employees Pension ................. 93
Schedule of City Contributions – General Employees Pension ....................................................................... 95
Schedules of Investment Returns .................................................................................................................... 96
Schedule of Proportionate Share of the Net Pension Liability – Florida Retirement System .......................... 97
Schedule of Proportionate Share of the Net Pension Liability – Health Insurance Subsidy Program ............. 97
Schedule of Contributions – Florida Retirement System ................................................................................ 98
Schedule of Contributions – Health Insurance Subsidy Program .................................................................... 98
Schedule of Funding Progress (OPEB) ........................................................................................................... 99
Combining and Individual Fund Statements and Schedules
Nonmajor Governmental Funds
Combining Balance Sheet – Nonmajor Governmental Funds ......................................................................... 100
Combining Statement of Revenues, Expenditures and Changes in Fund Balances – Nonmajor Governmental Funds ....................................................................................... 101
Combining Balance Sheet – Nonmajor Special Revenue Funds ..................................................................... 102
Combining Statement of Revenues, Expenditures and Changes in Fund Balances – Nonmajor Special Revenue Funds ................................................................................... 103
iii
Schedules of Revenues, Expenditures and Changes in Fund Balances – Budget and Actual (Budgetary Basis):
Community Development Block Grant Special Revenue Fund ................................................................... 104
State Housing Initiative Partnership Program Special Revenue Fund ......................................................... 105
Home Investment Partnership Program Special Revenue Fund .................................................................. 106
Neighborhood Stabilization Program 3 Special Revenue Fund ................................................................... 107
Combining Balance Sheet – Nonmajor Capital Projects Funds ...................................................................... 108
Combining Statement of Revenues, Expenditures and Changes in Fund Balances – Nonmajor Capital Projects Funds ..................................................................................... 109
Nonmajor Enterprise Funds
Combining Statement of Net Position – Nonmajor Enterprise Funds ............................................................. 110
Combining Statement of Revenues, Expenses and Changes in Fund Net Position – Nonmajor Enterprise Funds ........................................................................................ 112
Combining Statement of Cash Flows – Nonmajor Enterprise Funds .............................................................. 113
Internal Service Funds
Combining Statement of Net Position – Internal Service Funds ..................................................................... 115
Combining Statement of Revenues, Expenses and Changes in Fund Net Position – Internal Service Funds ................................................................................................ 116
Combining Statement of Cash Flows – Internal Service Funds ...................................................................... 117
Fiduciary Funds
Statement of Fiduciary Net Position – Performance Deposits Agency Fund .................................................. 118
Statement of Changes in Assets and Liabilities – Performance Deposits Agency Fund ................................. 119
Discretely Presented Component Unit
Statement of Net Position – International Airport ........................................................................................... 120
Statement of Revenues, Expenses and Changes in Fund Net Position – International Airport .................................................................................................................................... 122
Statement of Cash Flows – International Airport ............................................................................................ 123
STATISTICAL SECTION (Unaudited) Schedule
Net Position by Component – Last Ten Fiscal Years ................................................................................. 1 125
Changes in Net Position – Last Ten Fiscal Years ....................................................................................... 2 127
Fund Balances, Governmental Funds – Last Ten Fiscal Years .................................................................. 3 131
Changes in Fund Balances, Governmental Funds – Last Ten Fiscal Years ................................................ 4 133
iv
Schedule Assessed Value and Estimated Actual Value of Taxable Property –
Last Ten Fiscal Years.............................................................................................................................. 5 135
Direct and Overlapping Property Tax Rates – Last Ten Fiscal Years ............................................................ 6 136
Principal Property Taxpayers – Current Year and Nine Years Ago ............................................................... 7 137
Property Tax Levies and Collections – Last Ten Fiscal Years....................................................................... 8 138
Water & Sewer Consumption, Rates and Revenue – Last Ten Fiscal Years ................................................. 9 139
Principal Water & Sewer Customers, Current Year and Nine Years Ago ..................................................... 10 140
Ratios of Outstanding Debt by Type – Last Ten Fiscal Years ....................................................................... 11 141
Ratio of General Bonded Debt Outstanding – Last Ten Fiscal Years ............................................................ 12 143
Legal Debt Margin Information – Last Ten Fiscal Years .............................................................................. 13 143
Direct and Overlapping Governmental Activities Debt - As of September 30, 2016 .......................................................................................................................... 14 144
Pledged Revenue Coverage – Last Ten Fiscal Years .................................................................................... 15 145
Demographic and Economic Statistics – Last Ten Fiscal Years .................................................................... 16 148
Principal Employers – Current Year and Nine Years Ago ............................................................................. 17 149
Full-Time Equivalent City Government Employees by Function/Program – Last Ten Fiscal Years ................................................................................................................................. 18 150
Operating Indicators by Function/Program – Last Ten Fiscal Years ............................................................. 19 151
Capital Asset Statistics by Function/Program – Last Ten Fiscal Years ......................................................... 20 153
SINGLE AUDIT SECTION
Independent Auditors’ Report on Internal Control Over Financial Reporting and on Compliance and Other Matters Based on an Audit of Financial Statements Performed in Accordance with Government Auditing Standards .................................................................... 154
Independent Auditors’ Report on Compliance For Each Major Federal Program and State Project; Report on Internal Control Over Compliance; and Report on the Schedule of Expenditures of Federal Awards and State Financial Assistance Required by the Uniform Guidance and Chapter 10.550, Rules of the Florida Auditor General .............................................................................................................. 156
Schedule of Expenditures of Federal Awards and State of Florida Financial Assistance ........................................................................................................................................ 159
Schedule of Findings and Questioned Costs ....................................................................................................... 161
Summary of Prior Audit Findings ....................................................................................................................... 164
City of Melbourne Corrective Action Plan ......................................................................................................... 165
Independent Auditors’ Management Letter ........................................................................................................ 167
v

Independent Accountant’s Report on Compliance with Local Government Investment Policies ...................... 170
Affidavit per Section 163.31801, Florida Statutes .............................................................................................. 171
SECONDARY MARKET DISCLOSURE SECTION (Unaudited)
Water and Sewer System .................................................................................................................................... 172
vi


City of Melbourne Financial Services Department
900 E. Strawbridge Avenue Melbourne, FL 32901 (321) 608-7010 Fax (321) 608-7048
March 3, 2017
Honorable Mayor and City Council and Concerned Citizens City of Melbourne, Florida
We are submitting the Comprehensive Annual Financial Report of the City of Melbourne, Florida (the City) for the fiscal year ended September 30, 2016, as prepared by the City's Financial Services department. The report fulfills the requirements set forth in the City Charter, Section 3.20, Florida Statutes, Chapter 166.241; Chapter 218.39 and the Rules of the Auditor General, Chapter 10.550; and Rule 15c2-12 promulgated by the Securities and Exchange Commission.
This report consists of management's representations concerning the finances of the City. Consequently, management assumes full responsibility for the completeness and reliability of all of the information presented in this report. To provide a reasonable basis for making these representations, management of the City has established a comprehensive internal control framework that is designed both to protect the government's assets from loss, theft, or misuse and to compile sufficient reliable information for the preparation of the City's financial statements in conformity with generally accepted accounting principles (GAAP). Because the cost of internal controls should not outweigh their benefits, the City's comprehensive framework of internal controls has been designed to provide reasonable rather than absolute assurance that the financial statements will be free from material misstatement. As management, we assert that, to the best of our knowledge and belief, this financial report is complete and reliable in all material respects.
The City's financial statements have been audited by the City's independent Certified Public Accountants, Carr, Riggs & Ingram, LLC. The goal of the independent audit was to provide reasonable assurance that the financial statements of the City for the year ended September 30, 2016, are free of material misstatement. The independent audit involved examining, on a test basis, evidence supporting the amounts and disclosures in the financial statements; assessing the accounting principles used and significant estimates made by management; and evaluating the overall financial statement presentation. The independent auditors concluded, based upon the audit, that there was a reasonable basis for rendering an unmodified opinion that the City's financial statements for the fiscal year ended September 30, 2016, are fairly presented in conformity with GAAP. The independent auditors’ report is presented as the first component of the financial section of this report.
The independent audit of the financial statements of the City was part of a broader, federally and state mandated "Single Audit" designed to meet the special needs of federal and state grantor agencies. The standards governing Single Audit engagements require the independent auditor to report not only on the fair presentation of the financial statements, but also on the audited government's internal controls and compliance with legal requirements, with special emphasis on internal controls and legal requirements involving the administration of federal and state awards. The independent auditors’ reports on internal controls and compliance issued in connection with the Federal and State Single Audits are included in the Single Audit Section of this report.
GAAP require that management provide a narrative introduction, overview, and analysis to accompany the basic financial statements in the form of Management's Discussion and Analysis (MD&A). This letter of transmittal is designed to complement the MD&A and should be read in conjunction with it. The City's MD&A can be found immediately following the report of the independent auditors.
vii
Profile of the Government
The City is located on the central east coast of Florida in Brevard County. The City currently occupies a land area of 51.3 square miles and serves a population of 80,419. The City is empowered to levy a property tax on both real and personal properties located within its boundaries. It is also empowered by state statute to extend its corporate limits by annexation, which occurs periodically when deemed appropriate by the governing council.
The City operates under the Council–City Manager form of government. The City of Melbourne has operated under the council–manager form of government since January 12, 1926. This is the date the voters in the old City of Melbourne approved the referendum called for in the special act adopted by the legislature in December 1925. When the former City of Eau Gallie and the old City of Melbourne merged in 1969, the council–manager form of government continued. Policy–making and legislative authority are vested in the city council, which consists of a mayor and six council members. The city council is responsible for passing ordinances, adopting the budget, appointing committee members and hiring the city manager and city attorney. The city manager is responsible for carrying out the policies and ordinances of the city council, for overseeing the day to day operations of the city and for appointing the heads of the various departments.
The city council is elected on a non-partisan basis. Council members serve four-year staggered terms with three council members elected during an even year and mayor and three council members elected during the next even year. The six council members represent districts and must reside in their respective districts; however, they are elected at large. The mayor may reside anywhere within the city and is elected at large.
The City provides a full range of services including general government administration; police and fire protection; public works; water and sewer service; a stormwater utility; recreational activities, including two golf courses; and an airport. This report includes all funds of the City. In evaluating the City as a reporting entity, we have included all component units for which the City Council is financially accountable.
With the exception of the Melbourne International Airport (the "Airport"), the component units have been blended with the financial statements presented for the Primary Government because the component unit's governing body is the same as the City Council or because the component unit exclusively serves the City. The blended component units are the Downtown Community Redevelopment Agency, the Babcock Street Community Redevelopment Agency, the Olde Eau Gallie Riverfront Community Redevelopment Agency, the Firefighters' Retirement System, the Melbourne Police Officers’ Retirement System, and the General Employees’ and Special Risk Class Employees’ Pension Plan. Additional information on the City's component units can be found in Note (1)A in the notes to the financial statements. The Airport is presented in the financial statements as a discretely presented component unit to emphasize that it is legally separate from the City. Financial statements for the Melbourne International Airport may be obtained from the Executive Director, Melbourne International Airport, One Air Terminal Parkway, Suite 220, Melbourne, FL 32901.
The annual budget serves as the foundation for the City of Melbourne’s financial planning and control. The City Council is required to adopt a final budget no later than September 30. The appropriated budget is prepared by fund (e.g., General), function (e.g., Public Safety), and department (e.g., Police). The City Manager may make transfers of appropriations within a fund as long as the total budget of the fund is not increased. City Council action is required for the approval of a supplemental budget.
Factors Affecting Financial Condition
The information presented in the financial statements is perhaps best understood when it is considered from the broader perspective of the specific environment within which the City operates.
Local Economy. Melbourne has a diverse local economy featuring cutting edge communications, electronics, aerospace, advanced security, emerging technologies, medical and service industries, as well as tourism. Melbourne is home to such progressive companies as Northrop Grumman, Harris Corporation, Rockwell Collins, GE Transportation, Embraer Air, and DRS Technologies. Health First Holmes Regional Medical Center, South Brevard County’s major hospital, is located in Melbourne along with Wuesthoff Medical Center. Melbourne continues to be a hub for a variety of medical services as specialists and affiliated businesses are located in close proximity to the hospitals.
viii
Facilities for higher education include: Florida Institute of Technology (FIT), Eastern Florida State College (EFSC), Barry University, Embry-Riddle Aeronautical University, Everest University, Keiser University, Warner Southern College and Webster University.
Northrop Grumman revealed an expansion of their Melbourne campus, located at the Melbourne International Airport. The expansion is to accommodate the production of the Air Force’s next-generation Long Range Strike Bomber, a $20-billion-plus contract with Northrop Grumman officials expecting to add 1,500 jobs averaging $100,000 in earnings per year.
Embraer opened its newest facility in 2016 for the assembly, painting, and delivery of its latest executive jet aircraft, the Legacy 450 and 500. Embraer already produces the Phenom 100 and 300 at its Melbourne facilities and have built 170 jets valued at over $1 billion. This newest expansion plans for another 600 jobs within the next four years.
Brevard County’s robust aerospace and aviation industry has attracted French-headquartered Axyal, a supplier of technical plastics and composites, to plan for an expansion of their Melbourne sales office to include a full scale design and manufacturing facility. Axyal’s expansion further develops a local supply chain for multiple industries making Brevard County an inviting site for aviation and aerospace industry leaders.
The number of building permits increased in the past year as the City experienced a rise in building activity. The number of new residential permits increased 29% this year, the value of new residential construction increased 34%; and the overall residential property value within the City increased 10% for the fiscal year ending September 30, 2016. The number of new commercial permits increased 9%; and, total commercial property values are 2% higher than the previous year. The population increased slightly this year, and the local unemployment rate decreased from 5.3% to 5.1%.
Pursuant to Ch. 200.065(5)(a), F.S. the maximum millage rate that the City may levy is a rolled-back rate based on the amount of taxes which would have been levied in the prior year if the maximum millage rate had been applied, adjusted for the change in per capita Florida personal income, unless a higher rate is adopted, in which case the maximum is the adopted rate. The Melbourne City Council levy for the fiscal year ended September 30, 2016 was 7.6886 mills, which is greater than the computed rolled back rate of 6.9899.
Long-term financial planning. Assigned and unassigned fund balance in the General fund is 28% of total fiscal year 2016 General fund expenditures and 26% of fiscal 2017 appropriations. The General fund policy adopted by the City Council requires all excess funds be transferred to assigned and unassigned fund balance until assigned and unassigned fund balance equals 25% of the general fund operating budget excluding operating transfers. Thereafter, any remaining excess funds shall be identified by the City Manager as available to fund capital purchases, capital construction, non-recurring expenditures, or to establish additional assignments of fund balance. At September 30, 2016 there is $2,243,403 in excess funds available for assignment.
The Water and Sewer System fund Utility Rate of Return Policy requires excess funds to be transferred to the working capital reserve of the Water and Sewer System until that amount equals 25% of Water and Sewer System operating revenues. At September 30, 2016 the working capital reserves were 55% of fiscal year 2016 operating revenues. The remaining excess funds shall be transferred to the Water and Sewer System Capital Construction Reserve until that amount equals $1,000,000. Once these two requirements are met, any excess funds shall be split evenly and distributed between the Water and Sewer System Working Capital and the Capital Construction Reserve. A transfer of $2,190,817 to the Capital Construction Reserve was made which decreased the working capital reserves to 51% of the fiscal 2016 operating revenues. This is a 1% increase from the previous year, primarily due to the rate increase being deferred at October 1, 2015. The Water and Sewer System fund transferred $3,062,936 to the General fund, which represented 5.9% of sales as defined in the policy.
Major Initiatives. The South Sarno Area Drainage project includes five phases: construction of a stormwater pond treatment system construction of culverts, under the Florida East Coast Railway (FECR) railroad, Apollo Boulevard, and Croton Road to enlarge the canal to provide storage and treatment of stormwater. These improvements will primarily be funded by the Stormwater operating funds.
Construction at the D.B. Lee Water Reclamation Facility includes energy efficiency and facility improvements that will improve treatment processes, as well as install new facilities based on regulatory requirements and reduce operating costs through the use of new technology. A State Revolving Fund loan from the Florida Department of Environmental Protection will fund this project.
ix

Relevant Financial Policies. The City of Melbourne has adopted a comprehensive set of financial policies. During the current year, one of these policies was particularly relevant. The City of Melbourne has a policy that requires the adoption of a balanced annual operating budget (i.e., estimated revenues equal to or in excess of appropriations). However, as a result of committed support to the Embraer facilities being constructed at the Melbourne International Airport and golf course equipment replacement, the original budget estimated revenues were less than appropriations ($75,981,593 vs $76,614,926). In such cases, the policy allows for the appropriation of fund balance to close the gap. The amount necessary for this purpose in the original budget was $633,333, which increased to $1,919,012 in the final amended budget. However, thanks to slightly higher than anticipated revenues and measures taken during the year to control expenditures, the City of Melbourne ultimately experienced no operating deficit for the year.
Awards and Acknowledgments
The Government Finance Officers Association of the United States and Canada (GFOA) awarded a Certificate of Achievement for Excellence in Financial Reporting to the City of Melbourne for its comprehensive annual financial report (CAFR) for the fiscal year ended September 30, 2015. In order to be awarded a Certificate of Achievement, the government must publish an easily readable and efficiently organized CAFR. This report must satisfy both GAAP and applicable legal requirements.
A Certificate of Achievement is valid for a period of one year only. The City of Melbourne has received a Certificate of Achievement for 29 years. We believe that our current CAFR continues to meet the Certificate of Achievement Program's requirements and we are submitting it to the GFOA to determine its eligibility for another certificate.
The preparation of the Comprehensive Annual Financial Report was made possible by the dedicated service of the Financial Services staff under my direction as Interim Director of Finance. Sincere appreciation is expressed to Linda Drake, who served as Acting Assistant Finance Director during this time and made significant contributions to this report. Appreciation is also expressed to the Mayor and Council for their unfailing support for maintaining the highest standards of professionalism in the management of the City of Melbourne’s finances.
Respectfully submitted,
Sondra L. D’Angelo Assistant Finance Director
Michael A. McNees City Manager
x
xi
MA
YOR
& C
ITY
CO
UN
CIL
BO
AR
DS
&
CO
MM
ITTE
ESC
ITY
ATT
OR
NEY
CIT
Y M
AN
AG
ER
CIT
Y C
LER
KD
EPU
TY C
ITY
MA
NA
GER
Com
mun
ity
Dev
elop
men
t
Hou
sing
&
Urb
an
Impr
ovem
ent
Plan
ning
&
Econ
omic
D
evel
opm
ent
Red
evel
opm
ent
Dis
tric
ts
Engi
neer
ing
Engi
neer
ing
Serv
ices
Stor
mw
ater
U
tility
Traf
fic
Engi
neer
ing
Publ
ic
Wor
ks &
U
tiliti
es
Envi
ronm
enta
l C
omm
unity
O
utre
ach
PW
Adm
inis
trat
ion
Stre
ets
Man
agem
ent
Util
ities
O
pera
tions Met
er
Serv
ices
Was
tew
ater
C
olle
ctio
n
Wat
er
Dis
trib
utio
n
Wat
er
Prod
uctio
n
Wat
er
Rec
lam
atio
n
Rec
laim
ed
Wat
er
Dis
trib
utio
n
Fina
ncia
l Se
rvic
es
Acc
ount
ing
& B
udge
t
Proc
urem
ent
Ris
k M
anag
emen
t
Util
ity B
illin
g &
Col
lect
ion
Fire
Cod
e C
ompl
ianc
e
Emer
genc
y M
edic
al
Serv
ices
Fire
A
dmin
istr
atio
n
Fire
O
pera
tions
Man
agem
ent
Serv
ices
Faci
litie
s M
anag
emen
t
Flee
t M
anag
emen
t
Info
rmat
ion
Tech
nolo
gy
MS
Adm
inis
trat
ion
Pers
onne
l
Park
s &
R
ecre
atio
n
Cem
eter
ies
Com
mun
ity
Cen
ters
&
Aud
itoriu
m
Gol
f C
ours
es
Park
s M
aint
enan
ce
Pool
O
pera
tions
Rec
reat
ion
Polic
e Polic
e A
dmin
istr
atio
n
Polic
e O
pera
tions
Polic
e Su
ppor
t
xii
FINANCIAL SECTION
This section contains the following subsections:
• Independent Auditors’ Report
• Management’s Discussion and Analysis
• Basic Financial Statements
• Required Supplementary Information
• Combining and Individual Fund Statementsand Schedules


INDEPENDENT AUDITORS' REPORT
Honorable Mayor and Members of the City Council City of Melbourne, Florida
Report on the Financial Statements
We have audited the accompanying financial statements of the governmental activities, the business-type activities, the aggregate discretely presented component unit, each major fund, and the aggregate remaining fund information of the City of Melbourne, Florida, as of and for the year ended September 30, 2016, and the related notes to the financial statements, which collectively comprise the City of Melbourne, Florida’s basic financial statements as listed in the table of contents.
Management’s Responsibility for the Financial Statements
Management is responsible for the preparation and fair presentation of these financial statements in accordance with accounting principles generally accepted in the United States of America; this includes the design, implementation, and maintenance of internal control relevant to the preparation and fair presentation of financial statements that are free from material misstatement, whether due to fraud or error.
Auditors’ Responsibility
Our responsibility is to express opinions on these financial statements based on our audit. We conducted our audit in accordance with auditing standards generally accepted in the United States of America and the standards applicable to financial audits contained in Government Auditing Standards, issued by the Comptroller General of the United States. Those standards require that we plan and perform the audit to obtain reasonable assurance about whether the financial statements are free from material misstatement.
An audit involves performing procedures to obtain audit evidence about the amounts and disclosures in the financial statements. The procedures selected depend on the auditor’s judgment, including the assessment of the risks of material misstatement of the financial statements, whether due to fraud or error. In making those risk assessments, the auditor considers internal control relevant to the entity’s preparation and fair presentation of the financial statements in order to design audit procedures that are appropriate in the circumstances, but not for the purpose of expressing an opinion on the effectiveness of the entity’s internal control. Accordingly, we express no such opinion. An audit also includes evaluating the appropriateness of accounting policies used and the reasonableness of significant accounting estimates made by management, as well as evaluating the overall presentation of the financial statements.
We believe that the audit evidence we have obtained is sufficient and appropriate to provide a basis for our audit opinions.
Carr, Riggs & Ingram, LLC 215 Baytree Drive Melbourne, Florida 32940
(321) 255-0088 (321) 259-8648 (fax) www.cricpa.com
1
Honorable Mayor and Members of the City Council City of Melbourne, Florida Page Two
Opinions
In our opinion, the financial statements referred to above present fairly, in all material respects, the respective financial position of the governmental activities, the business-type activities, the aggregate discretely presented component unit, each major fund, and the aggregate remaining fund information of the City of Melbourne, Florida, as of September 30, 2016, and the respective changes in financial position and, where applicable, cash flows thereof for the year then ended in conformity with accounting principles generally accepted in the United States of America.
Other Matters
Required Supplementary Information
Accounting principles generally accepted in the United States of America require that the management’s discussion and analysis, budgetary comparison information and other required supplementary information on pages 4-13, and pages 83-99 be presented to supplement the basic financial statements. Such information, although not a part of the basic financial statements, is required by the Governmental Accounting Standards Board who considers it to be an essential part of financial reporting for placing the basic financial statements in an appropriate operational, economic or historical context. We have applied certain limited procedures to the required supplementary information in accordance with auditing standards generally accepted in the United States of America, which consisted of inquiries of management about the methods of preparing the information and comparing the information for consistency with management’s responses to our inquiries, the basic financial statements, and other knowledge we obtained during our audit of the basic financial statements. We do not express an opinion or provide any assurance on the information because the limited procedures do not provide us with sufficient evidence to express an opinion or provide any assurance.
Other Information
Our audit was conducted for the purpose of forming opinions on the financial statements that collectively comprise the City of Melbourne, Florida’s basic financial statements. The introductory section, combining and individual nonmajor fund financial statements, budgetary schedules of special revenue funds, statistical section, and secondary market disclosures are presented for purposes of additional analysis and are not a required part of the basic financial statements. The schedule of expenditures of federal awards and State of Florida financial assistance, as required by Title 2 U.S. Code of Federal Regulations Part 200, Uniform Administration Requirements, Cost Principles, and Audit Requirements for Federal Awards, and Chapter 10.550 Rules of the Florida Auditor General is also not a required part of the basic financial statements.
2

Honorable Mayor and Members of the City Council City of Melbourne, Florida Page Three
The combining and individual nonmajor fund financial statements, budgetary schedules of special revenue funds, and schedule of expenditures of federal awards and State of Florida financial assistance is the responsibility of management and was derived from and relates directly to the underlying accounting and other records used to prepare the basic financial statements. Such information has been subjected to the auditing procedures applied in the audit of the basic financial statements and certain additional procedures, including comparing and reconciling such information directly to the underlying accounting and other records used to prepare the basic financial statements or to the basic financial statements themselves, and other additional procedures in accordance with auditing standards generally accepted in the United States of America. In our opinion, the combining and individual nonmajor fund financial statements, budgetary schedules of special revenue funds, and schedule of expenditures of federal awards and State of Florida financial assistance are fairly stated in all material respects in relation to the financial statements as a whole.
The introductory section, statistical section and secondary market disclosures have not been subjected to the auditing procedures applied in the audit of the basic financial statements, and accordingly, we do not express an opinion or provide any assurance on them.
Other Reporting Required by Government Auditing Standards
In accordance with Government Auditing Standards, we have also issued our report dated March 3, 2017 on our consideration of the City of Melbourne, Florida’s internal control over financial reporting and on our tests of its compliance with certain provisions of laws, regulations, contracts, and grant agreements and other matters. The purpose of that report is to describe the scope of our testing of internal control over financial reporting and compliance and the results of that testing, and not to provide an opinion on internal control over financial reporting or on compliance. That report is an integral part of an audit performed in accordance with Government Auditing Standards in considering City of Melbourne’s internal control over financial reporting and compliance.
Melbourne, Florida March 3, 2017
3


Management's Discussion and Analysis
As management of the City of Melbourne (the City), we offer readers of the City's financial statements this narrative overview and analysis of the financial activities of the City for the fiscal year ended September 30, 2016. We encourage readers to consider the information presented here in conjunction with additional information that we have furnished in our letter of transmittal, which can be found on pages vii-x of this report.
Financial Highlights
• The assets and deferred outflows of the City of Melbourne exceeded its liabilities and deferred inflows atSeptember 30, 2016 by $196,317,926. Of this amount $9,454,148 may be used to meet the City's ongoingobligations to citizens and creditors.
• The City's total net position increased by $13,612,233, $3,920,690 in governmental activities and$9,691,543 in business-type activities.
• As of September 30, 2016, the City's governmental funds reported combined ending fund balances of$51,363,068 an increase of $4,353,457 in comparison with the prior year. Approximately 33% of thisamount ($16,987,905) is available for spending at the government’s discretion (unassigned fund balance).
• At the end of the current fiscal year, unrestricted fund balance (the total of assigned and unassignedcomponents of fund balance) in the General fund was $20,174,537 or 28% of total General fundexpenditures for fiscal year 2016.
• The City's total debt decreased $7,837,022 during the current fiscal year. This reflects increases of$58,558 for net accretion on the Water and Sewer Refunding Revenue Bonds, Series 2002B, and$5,004,810 for funds from the State Revolving Fund loan, and $542,445 for new golf cart andequipment leases, offset by $6,885,000 in savings from refunding of the Water and Sewer RevenueBonds, Series 2007A and Water and Sewer Improvement Bonds Series 2007B and the normal reductionsresulting from annual debt service and lease payments of $6,557,835.
Overview of the Financial Statements
The discussion and analysis are intended to serve as an introduction to the City's basic financial statements. The City's basic financial statements comprise three components: 1) government-wide financial statements, 2) fund financial statements, and 3) notes to the financial statements. The report also contains other supplementary information in addition to the basic financial statements themselves.
Government-wide financial statements. The government-wide financial statements are designed to provide readers with a broad overview of the City's finances, in a manner similar to a private-sector business.
The statement of net position presents information on all of the City's assets, deferred outflows of resources, liabilities and deferred inflows of resources, with the difference between the four reported as net position. Over time, increases or decreases in net position may serve as a useful indicator of whether the financial position of the City is improving or deteriorating.
The statement of activities presents information showing how the government's net position changed during the most recent fiscal year. All changes in net position are reported as soon as the underlying event giving rise to the change occurs, regardless of the timing of related cash flows. Thus, revenues and expenses are reported in this statement for some items that will only result in cash flows in future fiscal periods (e.g., earned but unused vacation leave).
Both of the government-wide financial statements distinguish functions of the City that are principally supported by taxes and intergovernmental revenues (governmental activities) from other functions that are intended to recover all or a significant portion of their costs through user fees and charges (business-type activities). The governmental activities of the City include general government, public safety, public works, parks and recreation, and housing and urban improvement. The business-type activities of the City include a water and sewer system, golf courses, and a stormwater utility.
4
The government-wide financial statements include not only the City itself (known as the primary government), but also a legally separate Melbourne International Airport, governed by the Melbourne Airport Authority, for which the City is financially accountable. Financial information for this component unit is reported separately from the financial information presented for the primary government itself.
The government-wide financial statements can be found on pages 14-17 of this report.
Fund financial statements. A fund is a grouping of related accounts that is used to maintain control over resources that have been segregated for specific activities or objectives. The City, like other state and local governments, uses fund accounting to ensure and demonstrate compliance with finance-related legal requirements. All of the funds of the City can be divided into three categories: governmental funds, proprietary funds, and fiduciary funds.
Governmental funds. Governmental funds are used to account for essentially the same functions reported as governmental activities in the government-wide statements. However, unlike the government-wide financial statements, governmental fund financial statements focus on near-term inflows and outflows of spendable resources, as well as on balances of spendable resources available at the end of the fiscal year. Such information may be useful in evaluating a government's near-term financing requirements.
Because the focus of governmental funds is narrower than that of the government-wide financial statements, it is useful to compare the information presented for governmental funds with similar information presented for governmental activities in the government-wide financial statements. By doing so, readers may better understand the long-term impact of the government's near-term financing decisions. Both the governmental fund balance sheet and the governmental fund statement of revenues, expenditures, and changes in fund balances provide a reconciliation to facilitate this comparison between governmental funds and governmental activities. The City maintains sixteen individual governmental funds. Information is presented separately in the governmental fund balance sheet and in the governmental fund statement of revenues, expenditures, and changes in fund balances for the General fund, three community redevelopment funds, and one capital projects fund. The redevelopment funds do not qualify as major funds but have been shown as such to comply with Chapter 163.387(8), Florida Statutes that requires these funds be separately audited. Data from the other four governmental fund types are combined into a single, aggregated presentation. Individual fund data for each of these nonmajor governmental funds is provided in the form of combining statements elsewhere in this report.
The City adopts an annual appropriated budget for its general fund and three community redevelopment funds. A budgetary comparison statement has been provided for the General fund and Community Redevelopment funds as part of Required Supplementary Information, to demonstrate compliance with this budget.
The basic governmental fund financial statements can be found on pages 18-23 of this report.
Proprietary funds. The City maintains two different types of proprietary funds. Enterprise funds are used to report the same functions presented as business-type activities in the government-wide financial statements. The City uses enterprise funds to account for its water and sewer system, two golf courses and a stormwater utility. Internal Service funds are an accounting device used to accumulate and allocate costs internally among the City's various functions. The City uses internal service funds to account for its workers compensation and insurance costs. Because both of these services benefit governmental and business-type functions, they have been allocated accordingly in the government-wide financial statements and are consolidated into governmental activities.
Proprietary funds provide the same type of information as the government-wide financial statements, only in more detail. The proprietary fund financial statements provide separate information for the water and sewer system, which is considered to be a major fund of the City. Conversely, the golf courses and stormwater utility are combined into a single, aggregated presentation in the proprietary fund financial statements. Individual fund data for the golf courses, stormwater utility and internal service funds is provided in the form of combining statements elsewhere in this report.
The basic proprietary fund financial statements can be found on pages 24-28 of this report.
5
Fiduciary funds. Fiduciary funds are used to account for resources held for the benefit of parties outside the government. Fiduciary funds are not reflected in the government-wide financial statement because the resources of those funds are not available to support the City's own programs. The accounting used for fiduciary funds is much like that used for proprietary funds.
The basic fiduciary fund financial statements can be found on pages 29-30 of this report.
Notes to the financial statements. The notes provide additional information that is essential to a full understanding of the data provided in the government-wide and fund financial statements. The notes to the financial statements can be found on pages 31-82 of this report.
Other information. In addition to the basic financial statements and accompanying notes, this report also presents certain required supplementary information concerning the City's progress in funding its obligation to provide pension benefits to its employees. Required supplementary information (RSI) can be found on pages 83-99 of this report.
The combining statements referred to earlier in connection with nonmajor governmental funds, nonmajor enterprise funds, and internal service funds are presented immediately following the required supplementary information on pensions. Combining and individual fund statements and schedules can be found on page 100-124 of this report.
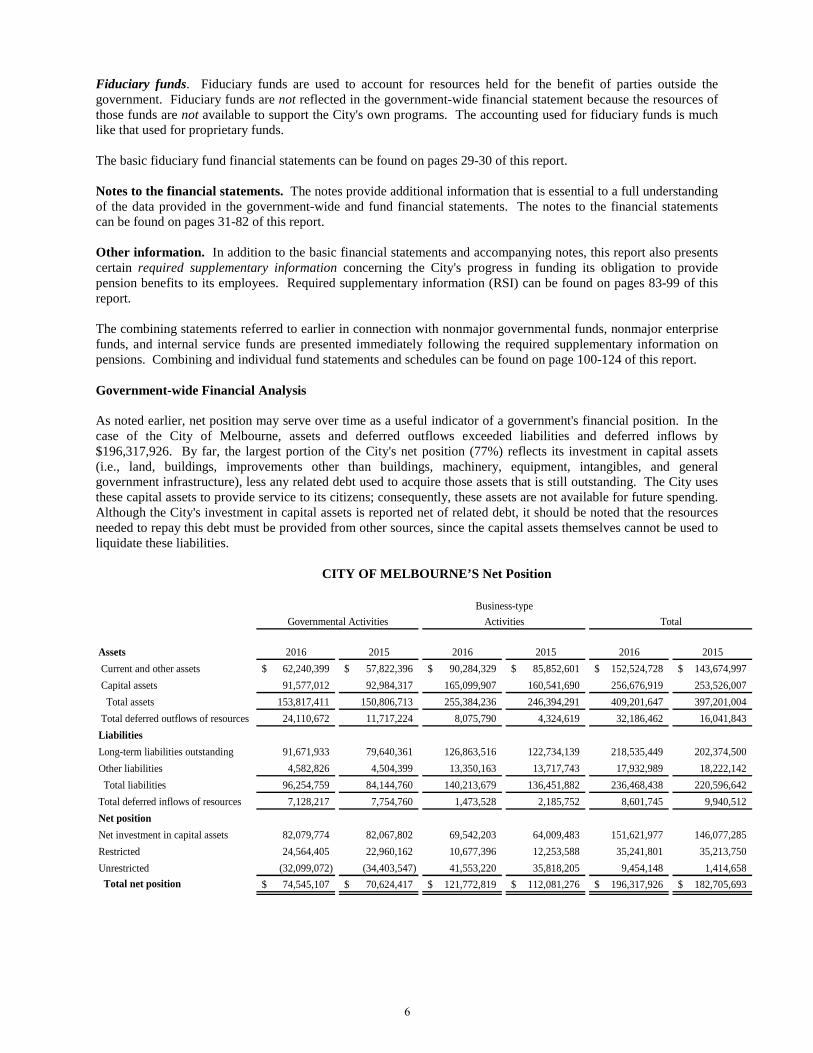
Government-wide Financial Analysis
As noted earlier, net position may serve over time as a useful indicator of a government's financial position. In the case of the City of Melbourne, assets and deferred outflows exceeded liabilities and deferred inflows by $196,317,926. By far, the largest portion of the City's net position (77%) reflects its investment in capital assets (i.e., land, buildings, improvements other than buildings, machinery, equipment, intangibles, and general government infrastructure), less any related debt used to acquire those assets that is still outstanding. The City uses these capital assets to provide service to its citizens; consequently, these assets are not available for future spending. Although the City's investment in capital assets is reported net of related debt, it should be noted that the resources needed to repay this debt must be provided from other sources, since the capital assets themselves cannot be used to liquidate these liabilities.
CITY OF MELBOURNE’S Net Position
2016 2015 2016 2015 2016 201562,240,399$ 57,822,396$ 90,284,329$ 85,852,601$ 152,524,728$ 143,674,997$ 91,577,012 92,984,317 165,099,907 160,541,690 256,676,919 253,526,007
153,817,411 150,806,713 255,384,236 246,394,291 409,201,647 397,201,004 Total deferred outflows of resources 24,110,672 11,717,224 8,075,790 4,324,619 32,186,462 16,041,843
91,671,933 79,640,361 126,863,516 122,734,139 218,535,449 202,374,500 4,582,826 4,504,399 13,350,163 13,717,743 17,932,989 18,222,142
96,254,759 84,144,760 140,213,679 136,451,882 236,468,438 220,596,642 Total deferred inflows of resources 7,128,217 7,754,760 1,473,528 2,185,752 8,601,745 9,940,512
82,079,774 82,067,802 69,542,203 64,009,483 151,621,977 146,077,285 24,564,405 22,960,162 10,677,396 12,253,588 35,241,801 35,213,750
(32,099,072) (34,403,547) 41,553,220 35,818,205 9,454,148 1,414,658 74,545,107$ 70,624,417$ 121,772,819$ 112,081,276$ 196,317,926$ 182,705,693$
Assets Current and other assets
Total net position
Net investment in capital assetsRestrictedUnrestricted
Long-term liabilities outstanding
Capital assets
Other liabilities
Net position
Business-typeActivities Total
Liabilities
Governmental Activities
Total liabilities
Total assets
6
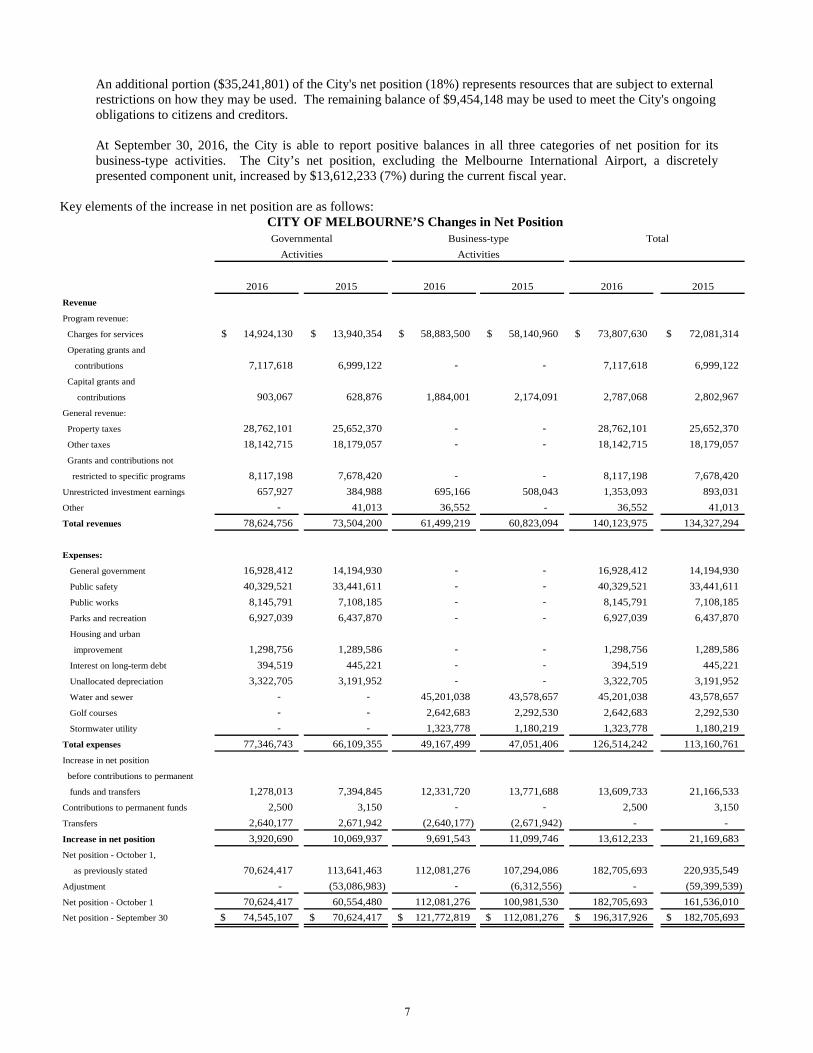
An additional portion ($35,241,801) of the City's net position (18%) represents resources that are subject to external restrictions on how they may be used. The remaining balance of $9,454,148 may be used to meet the City's ongoing obligations to citizens and creditors.
At September 30, 2016, the City is able to report positive balances in all three categories of net position for its business-type activities. The City’s net position, excluding the Melbourne International Airport, a discretely presented component unit, increased by $13,612,233 (7%) during the current fiscal year.
Key elements of the increase in net position are as follows: CITY OF MELBOURNE’S Changes in Net Position
2016 2015 2016 2015 2016 2015
14,924,130$ 13,940,354$ 58,883,500$ 58,140,960$ 73,807,630$ 72,081,314$
7,117,618 6,999,122 - - 7,117,618 6,999,122
903,067 628,876 1,884,001 2,174,091 2,787,068 2,802,967
28,762,101 25,652,370 - - 28,762,101 25,652,370 18,142,715 18,179,057 - - 18,142,715 18,179,057
restricted to specific programs 8,117,198 7,678,420 - - 8,117,198 7,678,420 657,927 384,988 695,166 508,043 1,353,093 893,031
- 41,013 36,552 - 36,552 41,013 78,624,756 73,504,200 61,499,219 60,823,094 140,123,975 134,327,294
16,928,412 14,194,930 - - 16,928,412 14,194,930 40,329,521 33,441,611 - - 40,329,521 33,441,611
8,145,791 7,108,185 - - 8,145,791 7,108,185 6,927,039 6,437,870 - - 6,927,039 6,437,870
1,298,756 1,289,586 - - 1,298,756 1,289,586 394,519 445,221 - - 394,519 445,221
3,322,705 3,191,952 - - 3,322,705 3,191,952 - - 45,201,038 43,578,657 45,201,038 43,578,657 - - 2,642,683 2,292,530 2,642,683 2,292,530 - - 1,323,778 1,180,219 1,323,778 1,180,219
77,346,743 66,109,355 49,167,499 47,051,406 126,514,242 113,160,761
1,278,013 7,394,845 12,331,720 13,771,688 13,609,733 21,166,533 2,500 3,150 - - 2,500 3,150
2,640,177 2,671,942 (2,640,177) (2,671,942) - - 3,920,690 10,069,937 9,691,543 11,099,746 13,612,233 21,169,683
as previously stated 70,624,417 113,641,463 112,081,276 107,294,086 182,705,693 220,935,549 - (53,086,983) - (6,312,556) - (59,399,539)
70,624,417 60,554,480 112,081,276 100,981,530 182,705,693 161,536,010 74,545,107$ 70,624,417$ 121,772,819$ 112,081,276$ 196,317,926$ 182,705,693$
Business-typeActivities
Grants and contributions not
Unrestricted investment earnings
contributions
General revenue:
Capital grants and
TotalGovernmentalActivities
Charges for services
Other
Revenue
Program revenue:
Total revenues
Operating grants and
contributions
Property taxes
Other taxes
improvement
Interest on long-term debt
Unallocated depreciation
Expenses:
Housing and urban
General government
Public safety
Public works
Parks and recreation
Increase in net position
before contributions to permanent
funds and transfers
Contributions to permanent funds
Net position - October 1,
Water and sewer
Golf courses
Stormwater utility
Total expenses
Adjustment
Transfers
Increase in net position
Net position - October 1
Net position - September 30
7

Governmental Activities. Governmental activities increased the City’s net position by $3,920,690. Charges for services increased $983,776, primarily due to increases in building related permits and Wickham Park community center recreation programs. The $118,496 increase in operating grants primarily funded dredging projects. The $274,191 increase in capital grants and contributions primarily reflects Federal Aid Highway funding for the Hickory Street Complete project. The $3,109,731 increase in property taxes is due to an increase in the millage rate and rise in taxable assessed value as the local economy continues to rebound. The increase in unrestricted grants and contributions of $438,778 is primarily due to increases in shared tax revenues and impact fees. The $272,939 increase in unrestricted investment earnings is due to an increase in market rates combined with more cash available for investment, primarily in the General and Capital Project funds.
Although public safety expenses increased by $6,887,910, that reflects the increase ($6,692,230) in public safety pension contributions due to the implementation of GASB Statement No. 68, “Accounting and Financial Reporting for Pensions – an amendment of GASB Statement No. 27”. General government expenses increased $2,733,482, primarily due to pension adjustments required by GASB Statement No. 68, salaries, and industry development. Public works expenses increased $1,037,606, primarily for Horse Creek and Melbourne Harbor dredging, street resurfacing, railroad crossing improvements and Streets division vehicles. Parks and recreation services expenses increased $489,169, primarily for operating the Wickham Park community center, Parks division vehicles and equipment, and increased marketing expenses.
Business-type Activities. Business-type activities increased the City’s net position by $9,691,543. Charges for services increased $742,540, primarily due to increased consumption and an increase in the number of Water and Sewer accounts. Capital grants decreased ($290,090), primarily due to the prior year ($236,346) Airport contribution to the Stormwater South Sarno Road Area Drainage project, along with decreases in grants for other Stormwater projects. Investment earnings increased $187,123 due to an increase in market rates combined with increased funds being invested.
Water and Sewer expenses increased $1,622,381, primarily due to salaries, pension adjustments, and increased solid waste disposal fees. Golf courses fund expenses increased $350,153, primarily due to payments to the Florida Retirement System for misclassified employees from 1996 to the present. Stormwater expenses increased $143,559, due to increases in the commissions to Brevard County Tax Collector, Information Technology, and depreciation.
8

The revenues by source and expenses by function for governmental activities are displayed in the following graphs:
Charges for services, fees,
fines & forfeitures19%
Operating grants & contributions
9%
Capital grants & contributions
1%Property taxes37%
Other taxes23%
Grants & contributions not
restricted to specific programs
11%
Revenue by Source - Governmental Activities
General government
22%
Public safety52%
Public works10%
Parks & recreation
9%
Housing & urban
improvement2% Other
5%
Expenditures by Function - Governmental Activities
9
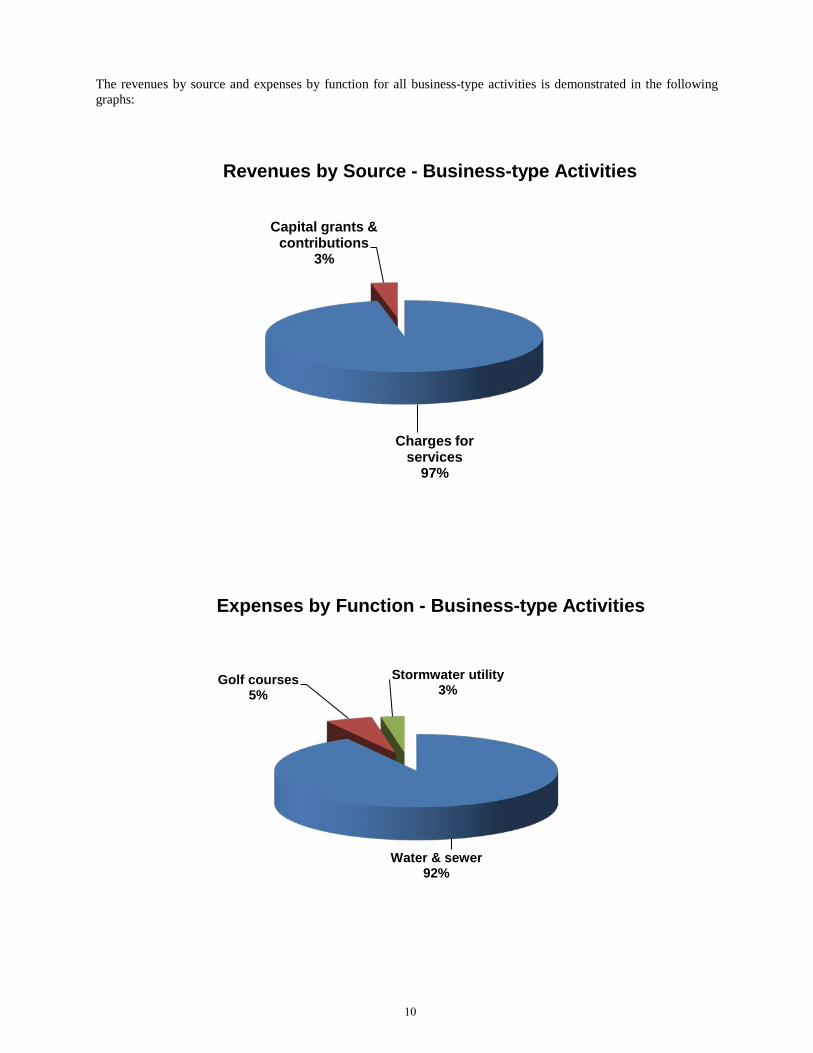
The revenues by source and expenses by function for all business-type activities is demonstrated in the following graphs:
Charges for services
97%
Capital grants & contributions
3%
Revenues by Source - Business-type Activities
Water & sewer92%
Golf courses5%
Stormwater utility3%
Expenses by Function - Business-type Activities
10
Financial Analysis of the City’s Funds
As noted earlier, the City uses fund accounting to ensure and demonstrate compliance with finance-related legal requirements.
Governmental funds. The focus of the City's governmental funds is to provide information on near-term inflows, outflows, and balances of spendable resources. Such information is useful in assessing the City's financing requirements. In particular, unassigned fund balance may serve as a useful measure of a government's net resources available for spending at the end of the fiscal year.
As of the end of the fiscal year, the City's governmental funds reported combined ending fund balances of $51,363,068, an increase of $4,353,457 in comparison with the prior year. Approximately 33% ($16,987,905) of this amount constitutes unassigned fund balance which is available for spending at the government's discretion. The remainder of fund balance is non-spendable, restricted, committed, or assigned to indicate that it is not available for new spending because it is 1) obligated for long term advances to other funds; inventory; prepaids; land held for resale; and perpetual care ($1,003,962), 2) restricted for specific purposes ($24,261,250), 3) restricted for debt service ($143,403), 4) committed for economic development ($666,667), or 5) assigned to pay for obligations previously authorized by the City ($8,299,881).
The General fund is the chief operating fund of the City. At the end of the current fiscal year, the total assigned and unassigned fund balance of the General fund was $20,174,537 while total fund balance was $21,873,010. As a measure of the General fund's liquidity, it may be useful to compare both total assigned and unassigned fund balance and total fund balance to total fund expenditures. Total assigned and unassigned fund balance represents 28% of total fiscal year 2016 General fund expenditures and 26% of fiscal 2017 appropriations. Total fund balance represents 30% of total fiscal year 2016 General fund expenditures and 28% of fiscal 2017 appropriations.
The fund balance of the City’s General fund increased by $2,243,781 during the current fiscal year, primarily a result of a slight increase in revenues combined with controlled spending to reduce expenditures. All other governmental funds increased by $2,109,676, a result of increased funding for transportation projects.
The Transportation Capital Improvement fund, a major fund, had an increase in fund balance during the current year of $2,073,975 to bring the year end fund balance to $22,300,755. Assigned fund balance increased $1,065,983 due to additional funding for road resurfacing projects. Fund balance restricted for transportation increased $1,007,992 as restricted transportation impact fees and Local Option Gas Tax transfers in exceeded spending on road improvement projects funded from those restricted sources.
Proprietary funds. The City's proprietary funds provide the same type of information found in the government-wide financial statements, but in more detail.
Unrestricted net position of the Water and Sewer System at the end of the year amounted to $35,541,520. The unrestricted net position for the Stormwater Utility and Golf Courses fund were $7,123,090 and ($1,204,095), respectively. The net position in the Water and Sewer System and Stormwater Utility increased by $8,435,489, $1,729,607 respectively; due to normal growth and operating activities in the Water and Sewer System and Stormwater Utility. The net position in the Golf Courses decreased by ($307,116). The net position for total business-type activities decreased $166,437 to reflect the consolidation of the Internal Service fund activity in the Enterprise funds.
General Fund Budgetary Highlights
The following is a brief review of the budget changes from the original to the final amended budget, and a review of the final amended budget and actual amounts (presented on a budgetary basis). A detailed budgetary comparison schedule for the General fund is included on page 83 of the RSI section of the CAFR.
The original budget classifies all pending salary and benefit increases in the category, other-unclassified, while the final budget includes the various increases in each functional activity.
The variance between the final budget and the actual results in the General fund reflects total revenues, transfers in and sale of capital assets exceeding the budget by $321,825 and total expenditures and transfers out of $3,026,376 less than appropriated. This is a result of revenues and transfers in slightly greater than originally anticipated offset by a decrease in the sale of capital assets in conjunction with appropriations exceeding actual expenditures across the board. Since revenues exceeded budget estimates and expenditures were less than budgetary estimates, the change in fund balance in the General fund was $3,348,201 higher than budgeted.
11
Capital Asset and Debt Administration
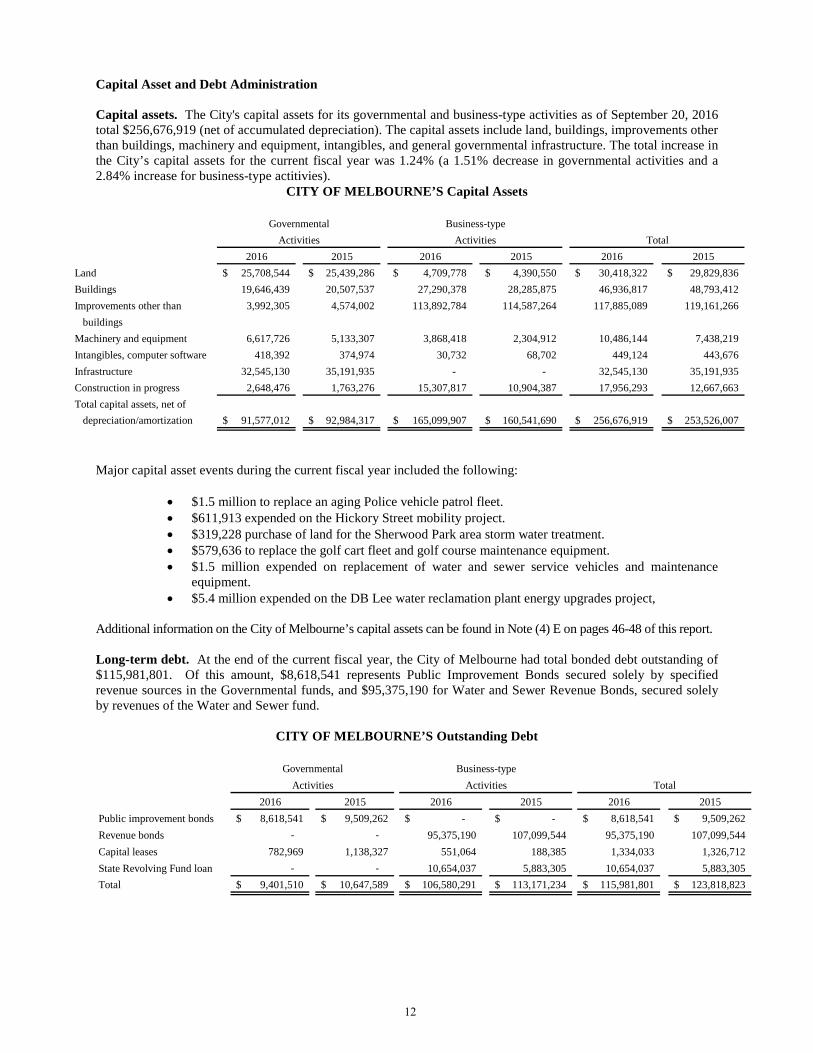
Capital assets. The City's capital assets for its governmental and business-type activities as of September 20, 2016 total $256,676,919 (net of accumulated depreciation). The capital assets include land, buildings, improvements other than buildings, machinery and equipment, intangibles, and general governmental infrastructure. The total increase in the City’s capital assets for the current fiscal year was 1.24% (a 1.51% decrease in governmental activities and a 2.84% increase for business-type actitivies).
CITY OF MELBOURNE’S Capital Assets
2016 2015 2016 2015 2016 2015Land 25,708,544$ 25,439,286$ 4,709,778$ 4,390,550$ 30,418,322$ 29,829,836$ Buildings 19,646,439 20,507,537 27,290,378 28,285,875 46,936,817 48,793,412 Improvements other than 3,992,305 4,574,002 113,892,784 114,587,264 117,885,089 119,161,266 buildingsMachinery and equipment 6,617,726 5,133,307 3,868,418 2,304,912 10,486,144 7,438,219 Intangibles, computer software 418,392 374,974 30,732 68,702 449,124 443,676 Infrastructure 32,545,130 35,191,935 - - 32,545,130 35,191,935 Construction in progress 2,648,476 1,763,276 15,307,817 10,904,387 17,956,293 12,667,663 Total capital assets, net of depreciation/amortization 91,577,012$ 92,984,317$ 165,099,907$ 160,541,690$ 256,676,919$ 253,526,007$
TotalGovernmental
ActivitiesBusiness-type
Activities
Major capital asset events during the current fiscal year included the following:
• $1.5 million to replace an aging Police vehicle patrol fleet.• $611,913 expended on the Hickory Street mobility project.• $319,228 purchase of land for the Sherwood Park area storm water treatment.• $579,636 to replace the golf cart fleet and golf course maintenance equipment.• $1.5 million expended on replacement of water and sewer service vehicles and maintenance
equipment.• $5.4 million expended on the DB Lee water reclamation plant energy upgrades project,
Additional information on the City of Melbourne’s capital assets can be found in Note (4) E on pages 46-48 of this report.
Long-term debt. At the end of the current fiscal year, the City of Melbourne had total bonded debt outstanding of $115,981,801. Of this amount, $8,618,541 represents Public Improvement Bonds secured solely by specified revenue sources in the Governmental funds, and $95,375,190 for Water and Sewer Revenue Bonds, secured solely by revenues of the Water and Sewer fund.
CITY OF MELBOURNE’S Outstanding Debt
2016 2015 2016 2015 2016 2015Public improvement bonds 8,618,541$ 9,509,262$ $ - $ - 8,618,541$ 9,509,262$ Revenue bonds - - 95,375,190 107,099,544 95,375,190 107,099,544 Capital leases 782,969 1,138,327 551,064 188,385 1,334,033 1,326,712 State Revolving Fund loan - - 10,654,037 5,883,305 10,654,037 5,883,305 Total 9,401,510$ 10,647,589$ 106,580,291$ 113,171,234$ 115,981,801$ 123,818,823$
Business-typeTotal
GovernmentalActivities Activities
12

The City of Melbourne’s total debt decreased 6.33%. The primary factor was a result of normal principal payments of outstanding debts.
Governmental activities debt decreased $1,246,079. The decrease reflects $890,721 in normal bond principal payments and $355,358 in capital lease payments.
Business-type activities decreased $6,590,943. The decrease reflecting the $4,897,912 in normal bonds principal payments, refunding of Water and Sewer Revenue Bonds, Series 2007A of $18,715,000, Water and Sewer Improvement Bonds Series 2007B of $21,795,000 State Revolving Fund loan repayments of $234,078, golf course capital lease payments of $125,972 and the balance of the 2012 golf cart lease $53,794 was rolled into the new golf cart lease, offset by the issuance of the Water and Sewer Refunding Bonds Series 2016A and 2016B in the amounts of $19,160,000 and $14,465,000 respectively, net accretion of $58,558 in the Water and Sewer Refunding Revenue Bonds Series 2002B, additional State Revolving Fund loan of $5,004,810 and new golf course leases of $542,445.
The City has no outstanding general obligation debt. As a result, there is no overall bond rating for the City, but certain individual bonds do have ratings. Bond ratings have a significant influence in establishing the rate of interest expense the City must pay when the bonds are sold. The City previously received an underlying rating of AA- from Fitch and an underlying rating of Aa3 from Moody’s.
Additional information on the City of Melbourne's long-term debt can be found in Note (4) J on pages 53-59 of this report.
Economic Factors and Next Year's Budgets and Rates
• The unemployment rate as of September 30, 2016 for the City of Melbourne was 5.1%, which is a decreasefrom a rate of 5.3% last year. This is higher than the national average unemployment rate of 5.0% and the stateaverage rate of 4.7%.
• The previously adopted water and sewer utility rate increase of 5.5% has been deferred until October 1, 2017.
Requests for Information
Questions about this report or requests for additional financial information should be addressed to:
City of Melbourne Financial Services Department 900 E. Strawbridge Ave. Melbourne, FL 32901 Telephone: (321) 608-7011
Or visit our website at: www.melbourneflorida.org
13
BASIC FINANCIAL STATEMENTS
These basic financial statements provide a summary overview of the financial position as well as the operating results of all funds. They also serve as an introduction to the more detailed statements and schedules that follow in subsequent sections:
The following statements and schedules are reported in this subsection:
• Government-wide Statement of Net Position• Government-wide Statement of Activities• Balance Sheet – Governmental Funds• Reconciliation of the Balance Sheet of the Governmental
Funds to the Statement of Net Position• Statement of Revenues, Expenditures and Changes in Fund
Balances – Governmental Funds• Reconciliation of the Statement of Revenues, Expenditures
and Changes in Fund Balances of Governmental Funds to theStatement of Activities
• Statement of Net Position - Proprietary Funds• Statement of Revenues, Expenses and Changes in Fund Net
Position – Proprietary Funds• Statement of Cash Flows – Proprietary Funds• Statement of Fiduciary Net Position – Fiduciary Funds• Statement of Changes in Fiduciary Net Position – Fiduciary
Funds• Notes to the Financial Statements

1 of 2 CITY OF MELBOURNE, FLORIDA STATEMENT OF NET POSITION
SEPTEMBER 30, 2016
ComponentPrimary Government Unit
Governmental Business-type InternationalASSETS Activities Activities Total Airport
Cash and cash equivalents $ 22,865 $ 3,550 $ 26,415 $ 9,057,173 Equity in pooled investments 54,714,045 64,611,351 119,325,396 - Investments, at fair value - - - 11,819,729 Receivables, net 2,894,256 8,771,036 11,665,292 1,398,250 Interest receivable 103,632 120,648 224,280 31,929 Internal balances 187,295 (187,295) - - Due from fiduciary funds 14,749 - 14,749 - Due from primary government - - - 9,015 Due from other governments 2,321,509 88,023 2,409,532 3,875,423 Inventory 209,772 1,189,134 1,398,906 29,609 Prepaid items 676,472 5,750 682,222 48,455 Land held for resale 215,000 - 215,000 - Restricted assets:
Temporarily restricted:Cash and cash equivalents - 9,623,468 9,623,468 283,446 Equity in pooled investments - 1,302,160 1,302,160 - Investments, at fair value - 4,599,553 4,599,553 - Interest receivable - 1,662 1,662 - Due from other governments 36,071 - 36,071 5,738,499
Permanently restricted:Equity in pooled investments 172,543 - 172,543 -
Noncurrent lease receivable - - - 911,442 Net pension asset 672,190 155,289 827,479 65,445 Capital assets:
Nondepreciable:Land 25,708,544 4,709,778 30,418,322 6,899,179 Construction in progress 2,648,476 15,307,817 17,956,293 59,545,998
Depreciable:Buildings 34,028,481 82,281,212 116,309,693 66,534,190 Improvements other than buildings 13,212,563 262,414,862 275,627,425 72,419,526 Machinery and equipment 25,600,265 18,265,114 43,865,379 10,363,504 Intangibles, computer software 1,841,136 403,511 2,244,647 241,825 Infrastructure 136,264,968 - 136,264,968 - Less accumulated depreciation/
amortization (147,727,421) (218,282,387) (366,009,808) (82,399,208)
Total assets 153,817,411 255,384,236 409,201,647 166,873,429
DEFERRED OUTFLOWS OF RESOURCES
Deferred outflows, pensions 24,110,672 5,107,330 29,218,002 1,658,646 Deferred amount on advance refunding - 2,968,460 2,968,460 -
Total deferred outflows 24,110,672 8,075,790 32,186,462 1,658,646
The statement of net position continues on the following page.The accompanying notes are an integral part of this statement.
14
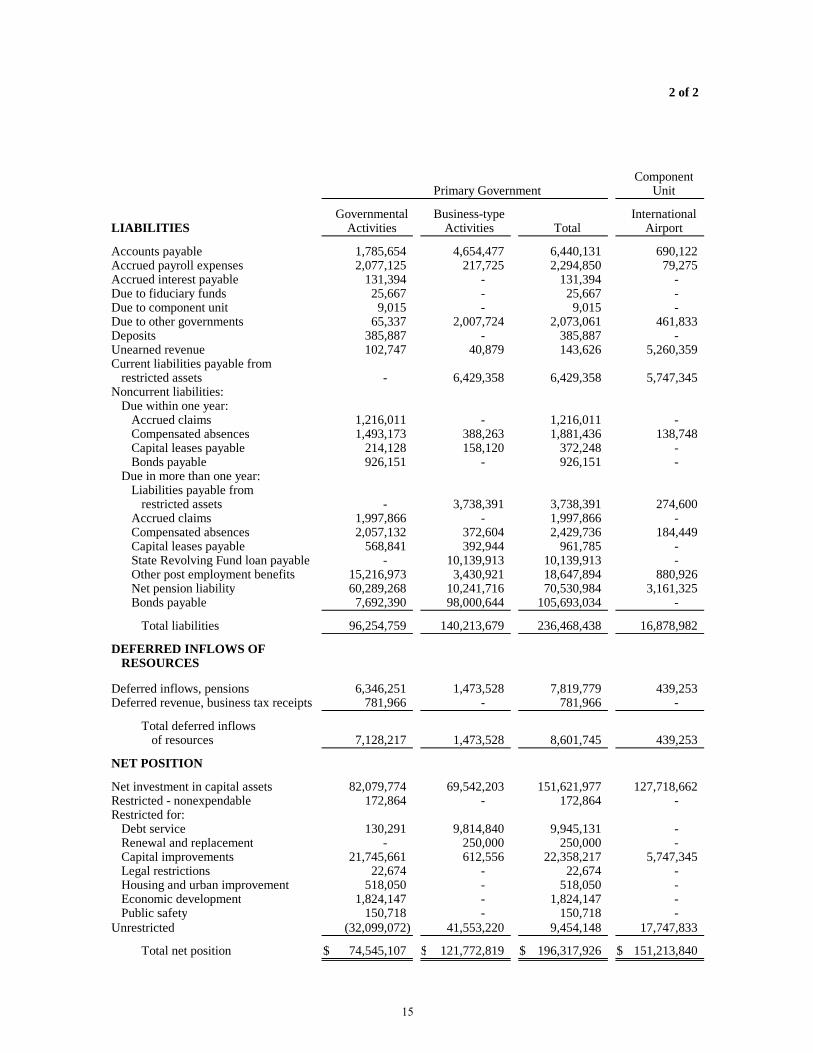
2 of 2
ComponentPrimary Government Unit
Governmental Business-type InternationalLIABILITIES Activities Activities Total Airport
Accounts payable 1,785,654 4,654,477 6,440,131 690,122 Accrued payroll expenses 2,077,125 217,725 2,294,850 79,275 Accrued interest payable 131,394 - 131,394 - Due to fiduciary funds 25,667 - 25,667 - Due to component unit 9,015 - 9,015 - Due to other governments 65,337 2,007,724 2,073,061 461,833 Deposits 385,887 - 385,887 - Unearned revenue 102,747 40,879 143,626 5,260,359 Current liabilities payable from
restricted assets - 6,429,358 6,429,358 5,747,345 Noncurrent liabilities:
Due within one year:Accrued claims 1,216,011 - 1,216,011 - Compensated absences 1,493,173 388,263 1,881,436 138,748 Capital leases payable 214,128 158,120 372,248 - Bonds payable 926,151 - 926,151 -
Due in more than one year:Liabilities payable from
restricted assets - 3,738,391 3,738,391 274,600 Accrued claims 1,997,866 - 1,997,866 - Compensated absences 2,057,132 372,604 2,429,736 184,449 Capital leases payable 568,841 392,944 961,785 - State Revolving Fund loan payable - 10,139,913 10,139,913 - Other post employment benefits 15,216,973 3,430,921 18,647,894 880,926 Net pension liability 60,289,268 10,241,716 70,530,984 3,161,325 Bonds payable 7,692,390 98,000,644 105,693,034 -
Total liabilities 96,254,759 140,213,679 236,468,438 16,878,982
DEFERRED INFLOWS OF RESOURCES
Deferred inflows, pensions 6,346,251 1,473,528 7,819,779 439,253 Deferred revenue, business tax receipts 781,966 - 781,966 -
Total deferred inflowsof resources 7,128,217 1,473,528 8,601,745 439,253
NET POSITION
Net investment in capital assets 82,079,774 69,542,203 151,621,977 127,718,662 Restricted - nonexpendable 172,864 - 172,864 - Restricted for:
Debt service 130,291 9,814,840 9,945,131 - Renewal and replacement - 250,000 250,000 - Capital improvements 21,745,661 612,556 22,358,217 5,747,345 Legal restrictions 22,674 - 22,674 - Housing and urban improvement 518,050 - 518,050 - Economic development 1,824,147 - 1,824,147 - Public safety 150,718 - 150,718 -
Unrestricted (32,099,072) 41,553,220 9,454,148 17,747,833
Total net position $ 74,545,107 $ 121,772,819 $ 196,317,926 $ 151,213,840
15
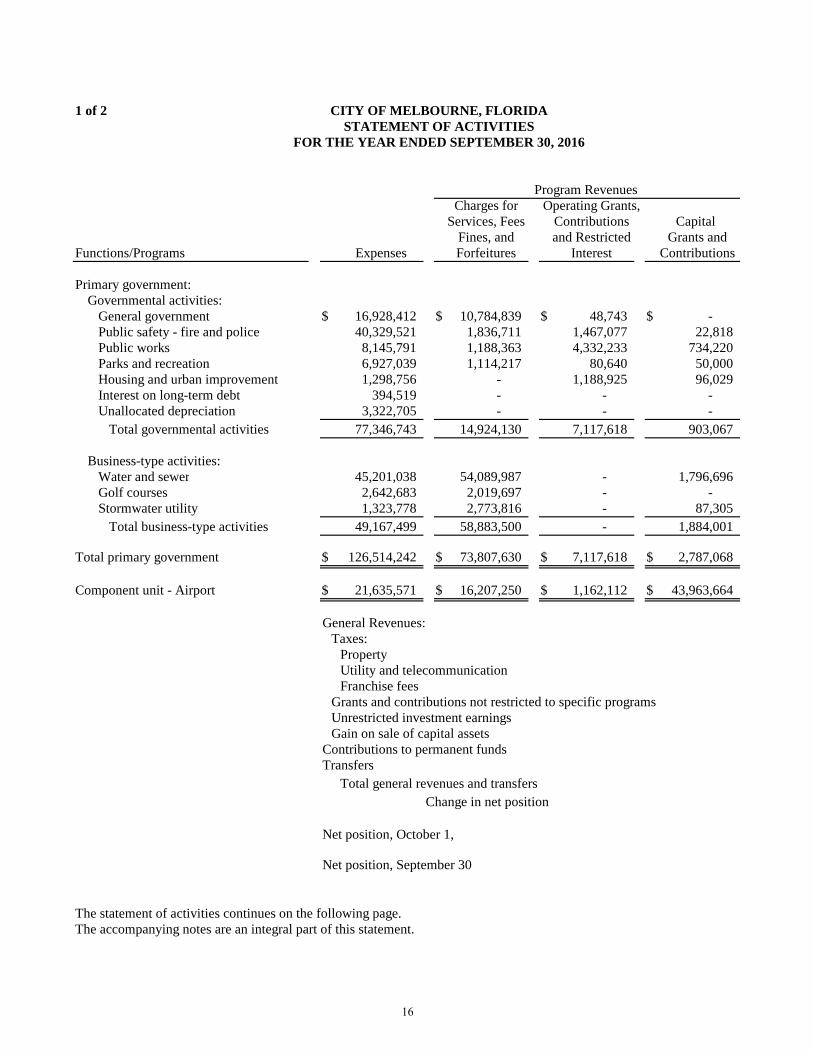
1 of 2 CITY OF MELBOURNE, FLORIDASTATEMENT OF ACTIVITIES
FOR THE YEAR ENDED SEPTEMBER 30, 2016
Program RevenuesCharges for Operating Grants,
Services, Fees Contributions Capital Fines, and and Restricted Grants and
Functions/Programs Expenses Forfeitures Interest Contributions
Primary government:Governmental activities:
General government $ 16,928,412 $ 10,784,839 $ 48,743 $ - Public safety - fire and police 40,329,521 1,836,711 1,467,077 22,818 Public works 8,145,791 1,188,363 4,332,233 734,220 Parks and recreation 6,927,039 1,114,217 80,640 50,000 Housing and urban improvement 1,298,756 - 1,188,925 96,029 Interest on long-term debt 394,519 - - - Unallocated depreciation 3,322,705 - - -
Total governmental activities 77,346,743 14,924,130 7,117,618 903,067
Business-type activities:Water and sewer 45,201,038 54,089,987 - 1,796,696 Golf courses 2,642,683 2,019,697 - - Stormwater utility 1,323,778 2,773,816 - 87,305
Total business-type activities 49,167,499 58,883,500 - 1,884,001
Total primary government $ 126,514,242 $ 73,807,630 $ 7,117,618 $ 2,787,068
Component unit - Airport $ 21,635,571 $ 16,207,250 $ 1,162,112 $ 43,963,664
General Revenues:Taxes:
PropertyUtility and telecommunication Franchise fees
Grants and contributions not restricted to specific programsUnrestricted investment earningsGain on sale of capital assets
Contributions to permanent fundsTransfers
Total general revenues and transfersChange in net position
Net position, October 1,
Net position, September 30
The statement of activities continues on the following page.The accompanying notes are an integral part of this statement.
16

2 of 2
Net (Expense) Revenue and Changes in Net PositionPrimary Government Component Unit
Governmental Business-type InternationalActivities Activities Total Airport
$ (6,094,830) $ $ (6,094,830) $(37,002,915) (37,002,915)
(1,890,975) (1,890,975) (5,682,182) (5,682,182)
(13,802) (13,802) (394,519) (394,519)
(3,322,705) (3,322,705) (54,401,928) (54,401,928)
- 10,685,645 10,685,645 - (622,986) (622,986) - 1,537,343 1,537,343 - 11,600,002 11,600,002
(54,401,928) 11,600,002 (42,801,926)
39,697,455
28,762,101 - 28,762,101 - 11,473,828 - 11,473,828 -
6,668,887 - 6,668,887 - 8,117,198 - 8,117,198 -
657,927 695,166 1,353,093 255,749 - 36,552 36,552 5,843
2,500 - 2,500 - 2,640,177 (2,640,177) - -
58,322,618 (1,908,459) 56,414,159 261,592 3,920,690 9,691,543 13,612,233 39,959,047
70,624,417 112,081,276 182,705,693 111,254,793
$ 74,545,107 $ 121,772,819 $ 196,317,926 $ 151,213,840
17

1 of 2 CITY OF MELBOURNE, FLORIDABALANCE SHEET
GOVERNMENTAL FUNDSSEPTEMBER 30, 2016
Downtown Babcock StreetGeneral Redevelopment Redevelopment
Fund Fund FundASSETSCash and cash equivalents $ 22,865 $ - $ - Equity in pooled investments 20,529,559 215,676 510,068 Receivables (net of allowance of $2,030) 2,805,387 - - Interest receivable 57,118 497 964 Due from other funds 111,161 - - Due from fiduciary funds 14,749 - - Due from other governments 1,939,534 - - Due from other governments, restricted 36,071 - - Advances to other funds 381,304 - - Inventory 209,772 - - Prepaid items 25,022 - - Land held for resale 215,000 - - Total assets $ 26,347,542 $ 216,173 $ 511,032
LIABILITIES, DEFERRED INFLOWS OFRESOURCES, AND FUND BALANCES
Liabilities:Accounts payable $ 1,208,138 $ 2,700 $ 745 Accrued payroll expenditures 2,064,265 3,559 3,912 Due to other funds - - - Due to fiduciary funds 25,667 - - Due to component unit 9,015 - - Due to other governments 65,337 - - Advances from other funds - - - Deposits 270,542 - - Unearned revenue 49,602 - -
Total liabilities 3,692,566 6,259 4,657 Deferred inflows of resources:
Deferred and unavailable revenue 781,966 - -
Fund balances:Non-spendable:
Long-term advances to other funds 381,304 - - Inventory 209,772 - - Prepaids 25,022 - - Land held for resale 215,000 - - Perpetual care - - -
Restricted:Public safety, law enforcement 34,631 - - Housing and urban improvement - - - Debt service 143,403 - - Economic development - 209,914 506,375 Capital improvements - - - Transportation improvement - - - Recreation improvement - - - Fireworks display 22,674 - -
Committed:Economic development 666,667 - -
Assigned:General government 318,377 - - Public safety, law enforcement 297,384 - - Public safety, fire 26,525 - - Public works 93,668 - - Parks and recreation 434,250 - - Housing and community development 1,850 - - Capital improvements 2,014,578 - -
Unassigned 16,987,905 - - Total fund balances 21,873,010 209,914 506,375
Total liabilities, deferred inflows of of resources, and fund balances $ 26,347,542 $ 216,173 $ 511,032
The accompanying notes are an integral part of this statement.18
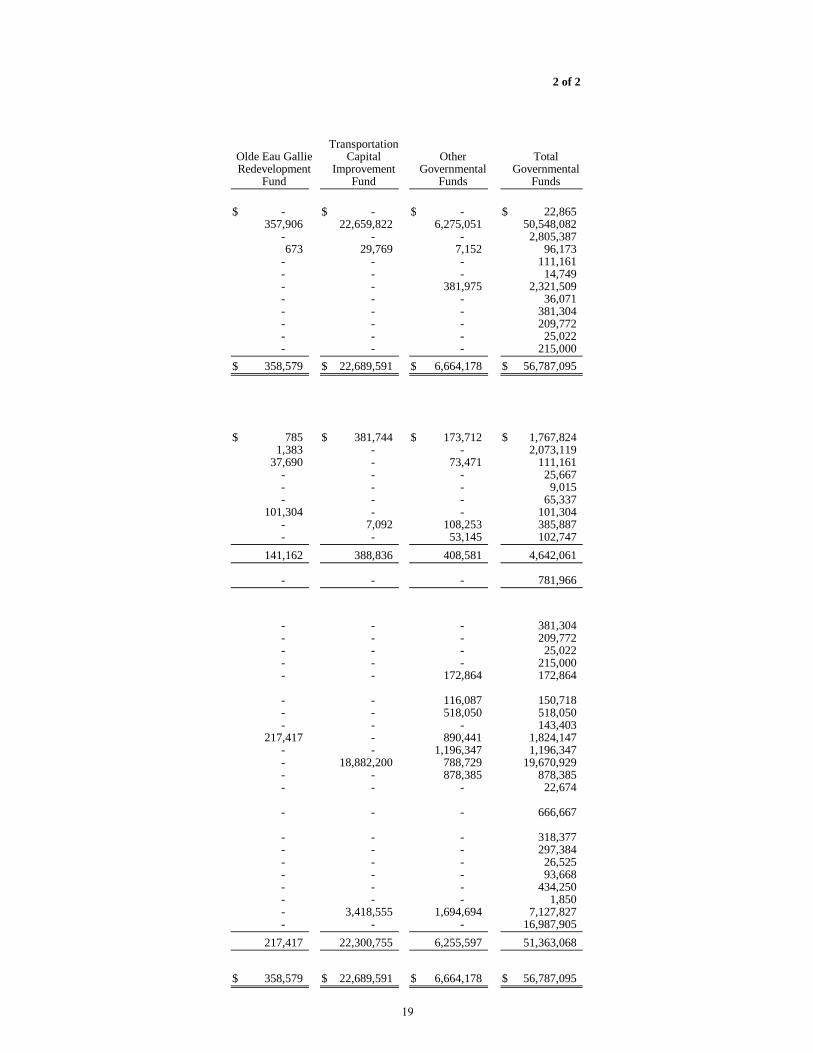
2 of 2
TransportationOlde Eau Gallie Capital Other TotalRedevelopment Improvement Governmental Governmental
Fund Fund Funds Funds
$ - $ - $ - $ 22,865 357,906 22,659,822 6,275,051 50,548,082
- - - 2,805,387 673 29,769 7,152 96,173
- - - 111,161 - - - 14,749 - - 381,975 2,321,509 - - - 36,071 - - - 381,304 - - - 209,772 - - - 25,022 - - - 215,000
$ 358,579 $ 22,689,591 $ 6,664,178 $ 56,787,095
$ 785 $ 381,744 $ 173,712 $ 1,767,824 1,383 - - 2,073,119
37,690 - 73,471 111,161 - - - 25,667 - - - 9,015 - - - 65,337
101,304 - - 101,304 - 7,092 108,253 385,887 - - 53,145 102,747
141,162 388,836 408,581 4,642,061
- - - 781,966
- - - 381,304 - - - 209,772 - - - 25,022 - - - 215,000 - - 172,864 172,864
- - 116,087 150,718 - - 518,050 518,050 - - - 143,403
217,417 - 890,441 1,824,147 - - 1,196,347 1,196,347 - 18,882,200 788,729 19,670,929- - 878,385 878,385 - - - 22,674
- - - 666,667
- - - 318,377 - - - 297,384 - - - 26,525 - - - 93,668 - - - 434,250 - - - 1,850 - 3,418,555 1,694,694 7,127,827 - - - 16,987,905
217,417 22,300,755 6,255,597 51,363,068
$ 358,579 $ 22,689,591 $ 6,664,178 $ 56,787,095
19
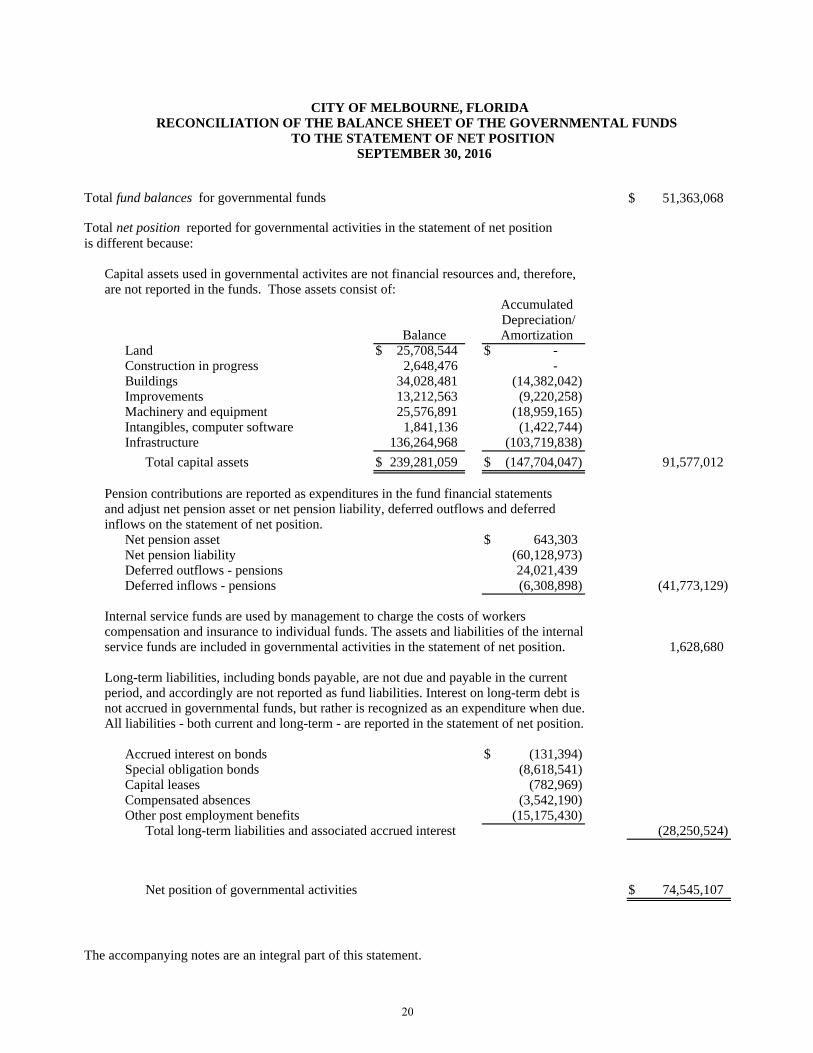
CITY OF MELBOURNE, FLORIDA RECONCILIATION OF THE BALANCE SHEET OF THE GOVERNMENTAL FUNDS
TO THE STATEMENT OF NET POSITION SEPTEMBER 30, 2016
Total fund balances for governmental funds $ 51,363,068
Total net position reported for governmental activities in the statement of net position is different because:
Capital assets used in governmental activites are not financial resources and, therefore, are not reported in the funds. Those assets consist of:
Accumulated Depreciation/
Balance Amortization Land $ 25,708,544 $ - Construction in progress 2,648,476 - Buildings 34,028,481 (14,382,042)Improvements 13,212,563 (9,220,258)Machinery and equipment 25,576,891 (18,959,165)Intangibles, computer software 1,841,136 (1,422,744)Infrastructure 136,264,968 (103,719,838)
Total capital assets $ 239,281,059 $ (147,704,047) 91,577,012
Pension contributions are reported as expenditures in the fund financial statements and adjust net pension asset or net pension liability, deferred outflows and deferredinflows on the statement of net position.
Net pension asset $ 643,303Net pension liability (60,128,973)Deferred outflows - pensions 24,021,439Deferred inflows - pensions (6,308,898) (41,773,129)
Internal service funds are used by management to charge the costs of workers compensation and insurance to individual funds. The assets and liabilities of the internal service funds are included in governmental activities in the statement of net position. 1,628,680
Long-term liabilities, including bonds payable, are not due and payable in the current period, and accordingly are not reported as fund liabilities. Interest on long-term debt is not accrued in governmental funds, but rather is recognized as an expenditure when due. All liabilities - both current and long-term - are reported in the statement of net position.
Accrued interest on bonds $ (131,394)Special obligation bonds (8,618,541)Capital leases (782,969)Compensated absences (3,542,190)Other post employment benefits (15,175,430)
Total long-term liabilities and associated accrued interest (28,250,524)
Net position of governmental activities $ 74,545,107
The accompanying notes are an integral part of this statement.
20

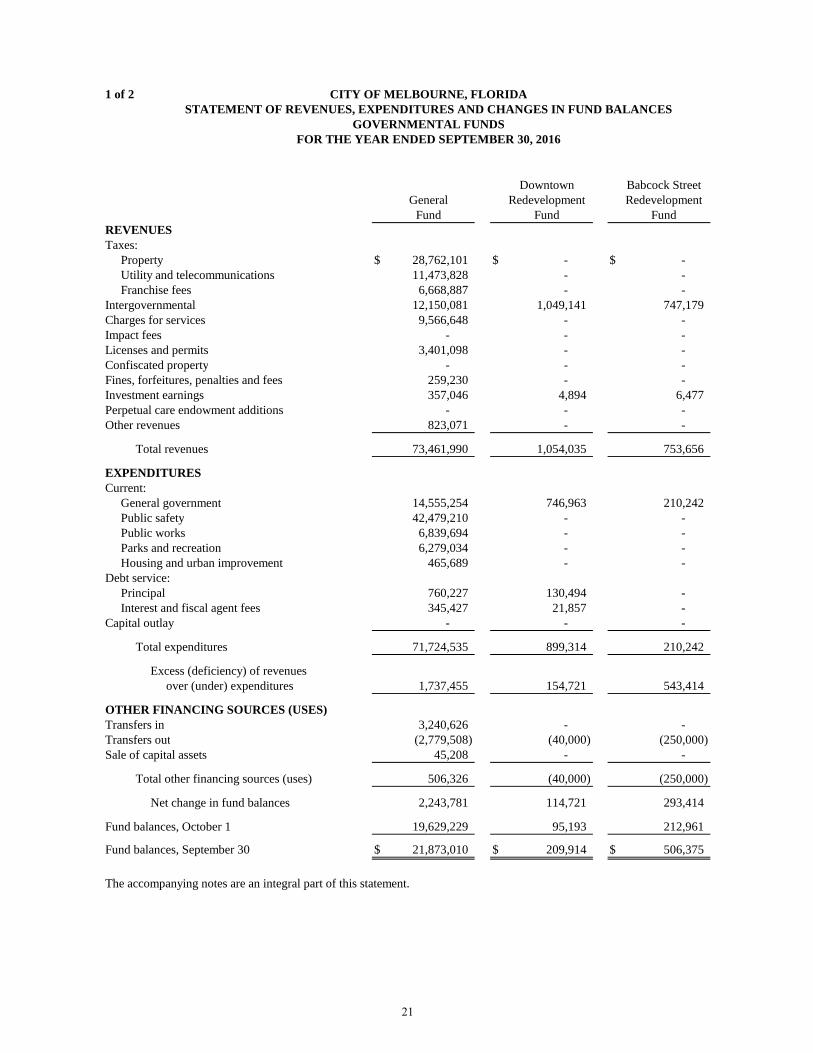
1 of 2 CITY OF MELBOURNE, FLORIDASTATEMENT OF REVENUES, EXPENDITURES AND CHANGES IN FUND BALANCES
GOVERNMENTAL FUNDSFOR THE YEAR ENDED SEPTEMBER 30, 2016
Downtown Babcock StreetGeneral Redevelopment Redevelopment
Fund Fund FundREVENUESTaxes:
Property $ 28,762,101 $ - $ -Utility and telecommunications 11,473,828 - -Franchise fees 6,668,887 - -
Intergovernmental 12,150,081 1,049,141 747,179 Charges for services 9,566,648 - -Impact fees - - -Licenses and permits 3,401,098 - -Confiscated property - - -Fines, forfeitures, penalties and fees 259,230 - -Investment earnings 357,046 4,894 6,477Perpetual care endowment additions - - -Other revenues 823,071 - -
Total revenues 73,461,990 1,054,035 753,656
EXPENDITURESCurrent:
General government 14,555,254 746,963 210,242 Public safety 42,479,210 - -Public works 6,839,694 - -Parks and recreation 6,279,034 - -Housing and urban improvement 465,689 - -
Debt service:Principal 760,227 130,494 -Interest and fiscal agent fees 345,427 21,857 -
Capital outlay - - -
Total expenditures 71,724,535 899,314 210,242
Excess (deficiency) of revenues over (under) expenditures 1,737,455 154,721 543,414
OTHER FINANCING SOURCES (USES)Transfers in 3,240,626 - -Transfers out (2,779,508) (40,000) (250,000) Sale of capital assets 45,208 - -
Total other financing sources (uses) 506,326 (40,000) (250,000)
Net change in fund balances 2,243,781 114,721 293,414
Fund balances, October 1 19,629,229 95,193 212,961
Fund balances, September 30 $ 21,873,010 $ 209,914 $ 506,375
The accompanying notes are an integral part of this statement.
21
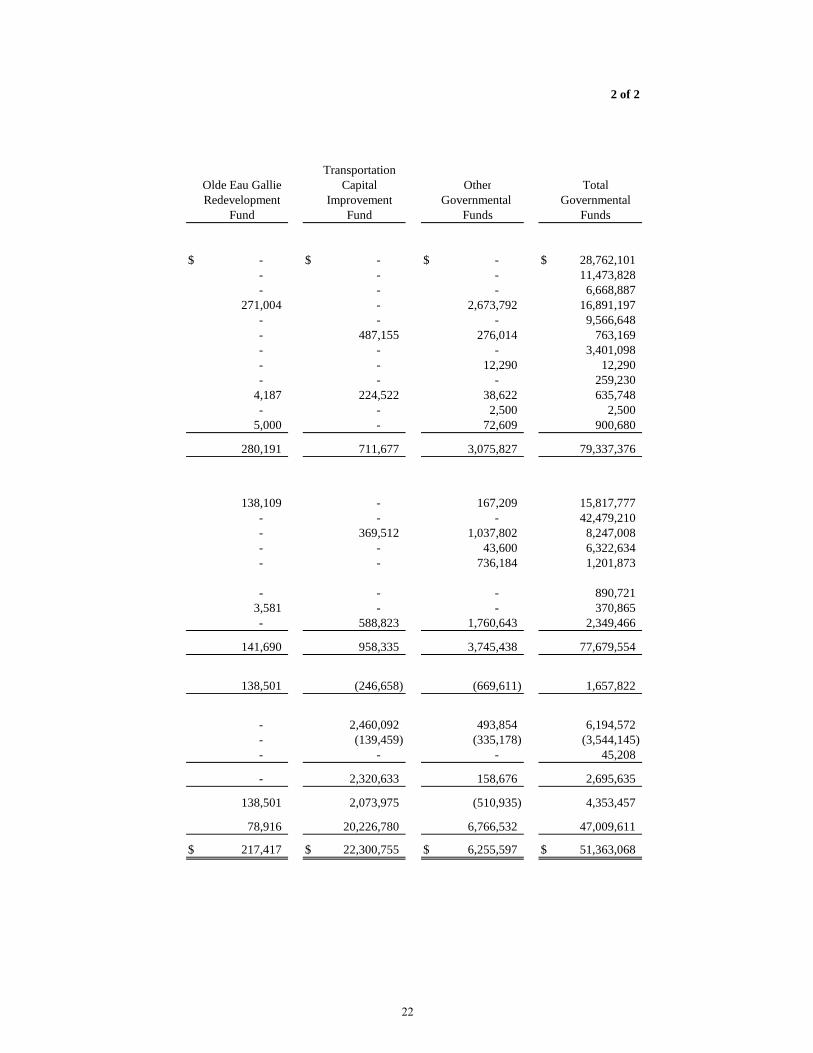
2 of 2
TransportationOlde Eau Gallie Capital Other TotalRedevelopment Improvement Governmental Governmental
Fund Fund Funds Funds
$ - $ - $ - $ 28,762,101 - - - 11,473,828 - - - 6,668,887
271,004 - 2,673,792 16,891,197 - - - 9,566,648 - 487,155 276,014 763,169 - - - 3,401,098 - - 12,290 12,290 - - - 259,230
4,187 224,522 38,622 635,748 - - 2,500 2,500
5,000 - 72,609 900,680
280,191 711,677 3,075,827 79,337,376
138,109 - 167,209 15,817,777 - - - 42,479,210 - 369,512 1,037,802 8,247,008 - - 43,600 6,322,634 - - 736,184 1,201,873
- - - 890,721 3,581 - - 370,865 - 588,823 1,760,643 2,349,466
141,690 958,335 3,745,438 77,679,554
138,501 (246,658) (669,611) 1,657,822
- 2,460,092 493,854 6,194,572 - (139,459) (335,178) (3,544,145) - - - 45,208
- 2,320,633 158,676 2,695,635
138,501 2,073,975 (510,935) 4,353,457
78,916 20,226,780 6,766,532 47,009,611
$ 217,417 $ 22,300,755 $ 6,255,597 $ 51,363,068
22
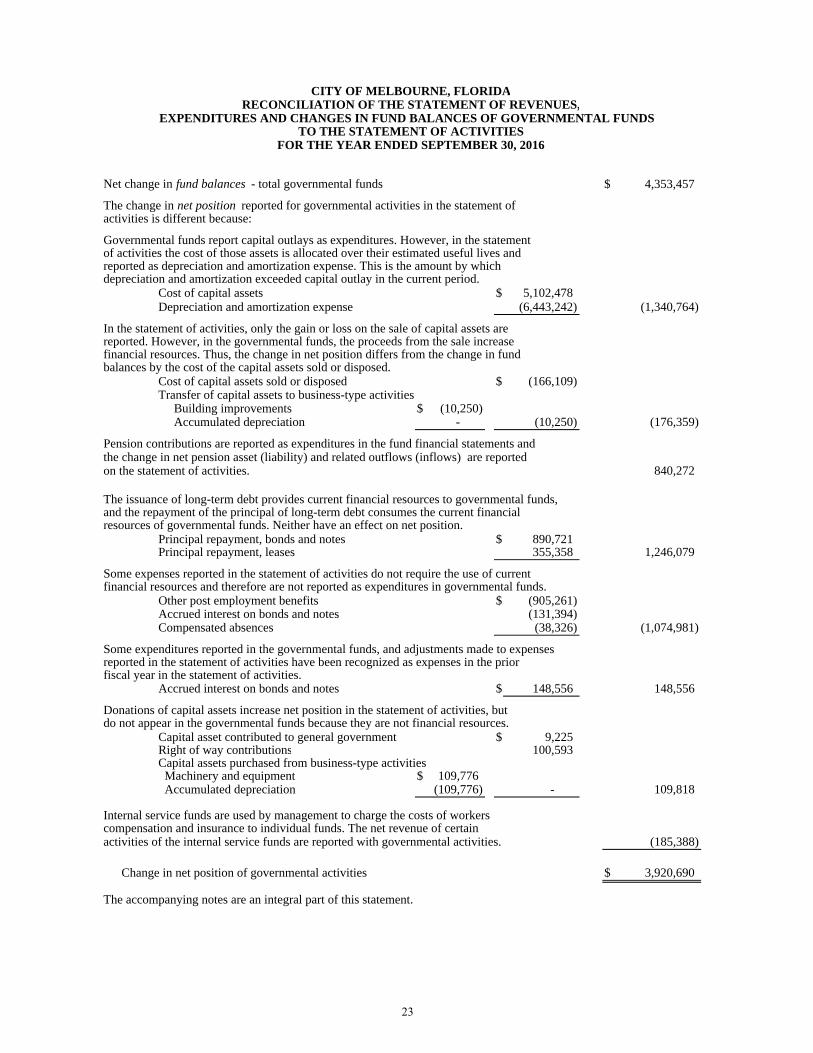
CITY OF MELBOURNE, FLORIDARECONCILIATION OF THE STATEMENT OF REVENUES,
EXPENDITURES AND CHANGES IN FUND BALANCES OF GOVERNMENTAL FUNDS TO THE STATEMENT OF ACTIVITIES
FOR THE YEAR ENDED SEPTEMBER 30, 2016
Net change in fund balances - total governmental funds $ 4,353,457
The change in net position reported for governmental activities in the statement ofactivities is different because:
Governmental funds report capital outlays as expenditures. However, in the statement of activities the cost of those assets is allocated over their estimated useful lives andreported as depreciation and amortization expense. This is the amount by which depreciation and amortization exceeded capital outlay in the current period.
Cost of capital assets $ 5,102,478 Depreciation and amortization expense (6,443,242) (1,340,764)
In the statement of activities, only the gain or loss on the sale of capital assets arereported. However, in the governmental funds, the proceeds from the sale increasefinancial resources. Thus, the change in net position differs from the change in fundbalances by the cost of the capital assets sold or disposed.
Cost of capital assets sold or disposed $ (166,109) Transfer of capital assets to business-type activities Building improvements $ (10,250) Accumulated depreciation - (10,250) (176,359)
Pension contributions are reported as expenditures in the fund financial statements andthe change in net pension asset (liability) and related outflows (inflows) are reported on the statement of activities. 840,272
The issuance of long-term debt provides current financial resources to governmental funds,and the repayment of the principal of long-term debt consumes the current financialresources of governmental funds. Neither have an effect on net position.
Principal repayment, bonds and notes $ 890,721 Principal repayment, leases 355,358 1,246,079
Some expenses reported in the statement of activities do not require the use of currentfinancial resources and therefore are not reported as expenditures in governmental funds.
Other post employment benefits $ (905,261) Accrued interest on bonds and notes (131,394) Compensated absences (38,326) (1,074,981)
Some expenditures reported in the governmental funds, and adjustments made to expenses reported in the statement of activities have been recognized as expenses in the prior fiscal year in the statement of activities.
Accrued interest on bonds and notes $ 148,556 148,556
Donations of capital assets increase net position in the statement of activities, but do not appear in the governmental funds because they are not financial resources.
Capital asset contributed to general government $ 9,225 Right of way contributions 100,593 Capital assets purchased from business-type activities Machinery and equipment $ 109,776 Accumulated depreciation (109,776) - 109,818
Internal service funds are used by management to charge the costs of workers compensation and insurance to individual funds. The net revenue of certain activities of the internal service funds are reported with governmental activities. (185,388)
Change in net position of governmental activities $ 3,920,690
The accompanying notes are an integral part of this statement.
23


1 of 2 CITY OF MELBOURNE, FLORIDASTATEMENT OF NET POSITION
PROPRIETARY FUNDSSEPTEMBER 30, 2016
GovernmentalBusiness-type Activities - Enterprise Funds Activities
Other InternalWater and Sewer Enterprise Service
System Funds Total FundsASSETS
Current assets:Cash and cash equivalents $ 1,350 $ 2,200 $ 3,550 $ - Cash and cash equivalents, restricted 5,897,468 - 5,897,468 - Equity in pooled investments 57,403,290 7,208,061 64,611,351 4,338,506 Equity in pooled investments, restricted 102,598 - 102,598 - Receivables, trade
Billed (net of allowance of $285,000) 5,030,323 - 5,030,323 88,869 Unbilled 3,740,713 - 3,740,713 -
Interest receivable 107,301 13,347 120,648 7,459 Interest receivable, restricted 1,662 - 1,662 - Due from other governments - 88,023 88,023 - Inventory 1,125,612 63,522 1,189,134 - Prepaid items - 5,750 5,750 651,450
Total current assets 73,410,317 7,380,903 80,791,220 5,086,284
Noncurrent assets:Restricted assets:
Cash and cash equivalents 3,726,000 - 3,726,000 - Equity in pooled investments 1,199,562 - 1,199,562 - Investments, at fair value 4,599,553 - 4,599,553 -
Total noncurrent restricted assets 9,525,115 - 9,525,115 -
Net pension asset 142,847 12,442 155,289 28,887 Total noncurrent, nonrestricted assets 142,847 12,442 155,289 28,887
Capital assets:Nondepreciable:
Land 3,094,971 1,614,807 4,709,778 - Construction in progress 13,951,106 1,356,711 15,307,817 -
Depreciable:Buildings 81,453,548 827,664 82,281,212 - Improvements other than buildings 246,709,960 15,704,902 262,414,862 - Machinery and equipment 14,446,437 3,818,677 18,265,114 23,374 Intangibles, computer software 363,416 40,095 403,511 - Less accumulated depreciation/amortization (209,893,509) (8,388,878) (218,282,387) (23,374)
Total capital assets, net of accumulated depreciation/amortization 150,125,929 14,973,978 165,099,907 -
Total noncurrent assets 159,793,891 14,986,420 174,780,311 28,887
Total assets 233,204,208 22,367,323 255,571,531 5,115,171
DEFERRED OUTFLOWS OF RESOURCESDeferred outflows, pensions 4,675,001 432,329 5,107,330 89,233 Deferred amount on advance refunding 2,968,460 - 2,968,460 -
Total deferred outflows 7,643,461 432,329 8,075,790 89,233
The proprietary statement of net position continues on the following page.The accompanying notes are an integral part of this statement.
24
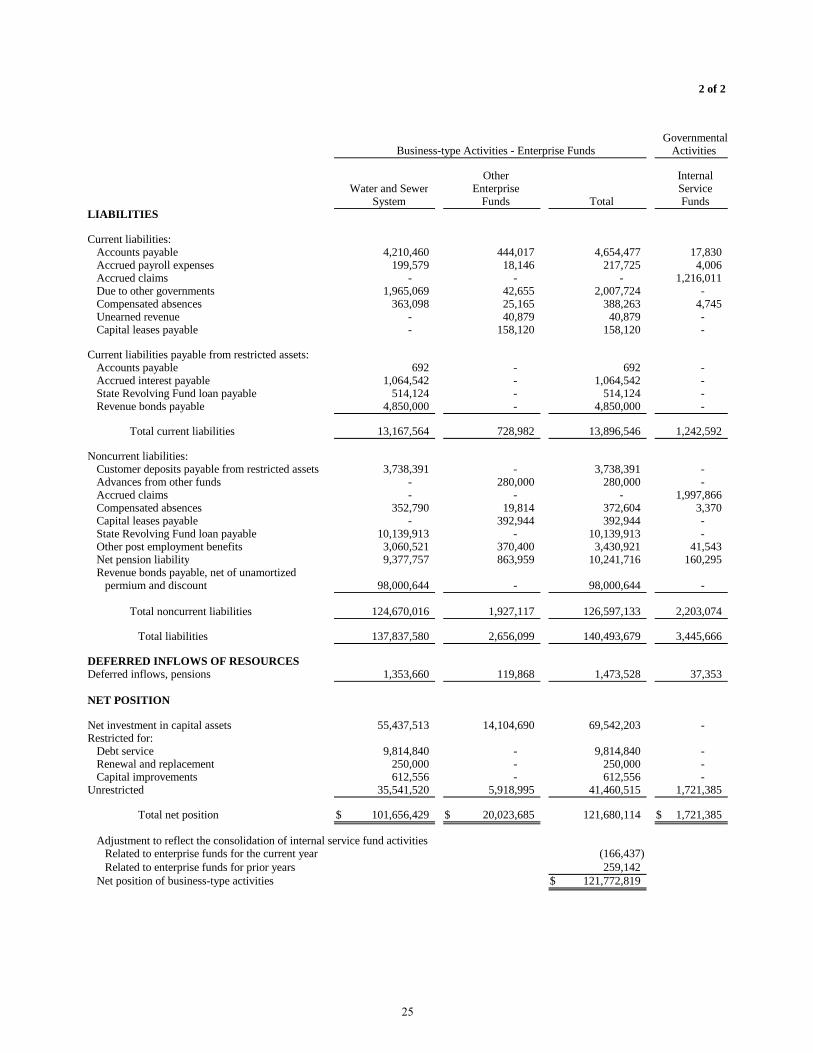
2 of 2
GovernmentalBusiness-type Activities - Enterprise Funds Activities
Other InternalWater and Sewer Enterprise Service
System Funds Total FundsLIABILITIES
Current liabilities: Accounts payable 4,210,460 444,017 4,654,477 17,830 Accrued payroll expenses 199,579 18,146 217,725 4,006 Accrued claims - - - 1,216,011 Due to other governments 1,965,069 42,655 2,007,724 - Compensated absences 363,098 25,165 388,263 4,745 Unearned revenue - 40,879 40,879 - Capital leases payable - 158,120 158,120 -
Current liabilities payable from restricted assets:Accounts payable 692 - 692 - Accrued interest payable 1,064,542 - 1,064,542 - State Revolving Fund loan payable 514,124 - 514,124 - Revenue bonds payable 4,850,000 - 4,850,000 -
Total current liabilities 13,167,564 728,982 13,896,546 1,242,592
Noncurrent liabilities:Customer deposits payable from restricted assets 3,738,391 - 3,738,391 - Advances from other funds - 280,000 280,000 - Accrued claims - - - 1,997,866 Compensated absences 352,790 19,814 372,604 3,370 Capital leases payable - 392,944 392,944 - State Revolving Fund loan payable 10,139,913 - 10,139,913 - Other post employment benefits 3,060,521 370,400 3,430,921 41,543 Net pension liability 9,377,757 863,959 10,241,716 160,295 Revenue bonds payable, net of unamortized
permium and discount 98,000,644 - 98,000,644 -
Total noncurrent liabilities 124,670,016 1,927,117 126,597,133 2,203,074
Total liabilities 137,837,580 2,656,099 140,493,679 3,445,666
DEFERRED INFLOWS OF RESOURCESDeferred inflows, pensions 1,353,660 119,868 1,473,528 37,353
NET POSITION
Net investment in capital assets 55,437,513 14,104,690 69,542,203 - Restricted for:
Debt service 9,814,840 - 9,814,840 - Renewal and replacement 250,000 - 250,000 - Capital improvements 612,556 - 612,556 -
Unrestricted 35,541,520 5,918,995 41,460,515 1,721,385
Total net position $ 101,656,429 $ 20,023,685 121,680,114 $ 1,721,385
Adjustment to reflect the consolidation of internal service fund activities Related to enterprise funds for the current year (166,437) Related to enterprise funds for prior years 259,142
Net position of business-type activities $ 121,772,819
25

CITY OF MELBOURNE, FLORIDA STATEMENT OF REVENUES, EXPENSES, AND CHANGES IN FUND NET POSITION
PROPRIETARY FUNDSFOR THE YEAR ENDED SEPTEMBER 30, 2016
GovernmentalBusiness-type Activities - Enterprise Funds Activities
Water and Other InternalSewer Enterprise ServiceSystem Funds Total Funds
OPERATING REVENUESWater sales (net of bad debt of $3,604) $ 30,980,416 $ - $ 30,980,416 $ -Sewer charges (net of bad debt of $2,402) 20,815,294 - 20,815,294 -Golf course fees - 1,984,636 1,984,636 -Stormwater fees - 2,772,154 2,772,154 -Charges to other funds - - - 4,424,854 Charges to component unit - - - 594,942 Other revenues 2,294,277 36,723 2,331,000 251
Total operating revenues 54,089,987 4,793,513 58,883,500 5,020,047
OPERATING EXPENSESSalaries, wages and employee benefits 12,722,739 1,327,646 14,050,385 230,500 Contractual services, materials and supplies 17,898,064 1,902,940 19,801,004 2,569,977 Claims - - - 2,604,025 Depreciation and amortization 9,826,872 724,553 10,551,425 -
Total operating expenses 40,447,675 3,955,139 44,402,814 5,404,502
Operating income (loss) 13,642,312 838,374 14,480,686 (384,455)
NONOPERATING REVENUES (EXPENSES)Investment earnings 617,807 77,359 695,166 32,630 Interest expense (4,278,638) (3,357) (4,281,995) - Debt issue expense (316,253) - (316,253) - Gain on sale/disposal of capital assets 26,252 10,300 36,552 -
Total nonoperating revenues (expenses) (3,950,832) 84,302 (3,866,530) 32,630
Income (loss) before contributions and transfers 9,691,480 922,676 10,614,156 (351,825)
Capital contributions 1,806,946 87,305 1,894,251 - Transfers in - 412,510 412,510 - Transfers out (3,062,937) - (3,062,937) -
Change in net position 8,435,489 1,422,491 9,857,980 (351,825)
Total net position, October 1, 93,220,940 18,601,194 2,073,210
Total net position, September 30 $ 101,656,429 $ 20,023,685 $ 1,721,385
Adjustment to reflect the consolidation of internal service fundactivities related to enterprise funds for the current year (166,437)
Change in net position of business-type activities $ 9,691,543
The accompanying notes are an integral part of this statement.
26

CITY OF MELBOURNE, FLORIDA 1 of 2STATEMENT OF CASH FLOWS
PROPRIETARY FUNDSFOR THE YEAR ENDED SEPTEMBER 30, 2016
GovernmentalBusiness-type Activities - Enterprise Funds Activities
Water and Other InternalSewer Enterprise ServiceSystem Funds Total Funds
INCREASE IN CASH ANDCASH EQUIVALENTS
CASH FLOWS FROM OPERATING ACTIVITIESCash received from customers $ 54,081,598 $ 4,756,327 $ 58,837,925 $ - Cash received from other funds - - - 4,424,854 Cash received from component unit - - - 594,942 Cash payments to suppliers for goods and services (16,675,215) (2,619,851) (19,295,066) (3,611,620)Cash payments for employee services (12,519,573) (1,310,551) (13,830,124) (218,353) Deposits received 947,653 - 947,653 - Deposits returned (1,002,739) - (1,002,739) - Cash received from lessees 31,674 - 31,674 - Other operating revenues 3,183 36,182 39,365 251
Net cash provided by operating activities 24,866,581 862,107 25,728,688 1,190,074
CASH FLOWS FROM NONCAPITAL FINANCING ACTIVITIESAdvance from other funds - 280,000 280,000 - Transfers in - 300,000 300,000 - Transfers out (3,062,937) - (3,062,937) -
Net cash provided (used) by noncapitalfinancing activities (3,062,937) 580,000 (2,482,937) -
CASH FLOWS FROM CAPITAL AND RELATED FINANCING ACTIVITIESAcquisition and construction of capital assets (12,602,798) (1,907,793) (14,510,591) - Principal paid on revenue bond maturities and lease obligations (4,897,911) (179,766) (5,077,677) - Principal paid on State Revolving Fund loan (234,079) - (234,079) - Proceeds from State Revolving Fund loan 4,947,725 - 4,947,725 - Proceeds from leases - 229,464 229,464 - Bond refundings (2,290,914) - (2,290,914) - Interest paid on revenue bonds and lease obligations (4,096,116) (3,357) (4,099,473) - Cash received from impact fees 1,776,480 - 1,776,480 - Proceeds from sale of capital assets 97,190 53,908 151,098 - Repayment of General fund advance (569,744) - (569,744) - Transfers in - 112,510 112,510 - Capital grants and contributions 4,232 236,346 240,578 -
Net cash used by capital and relatedfinancing activities (17,865,935) (1,458,688) (19,324,623) -
CASH FLOWS FROM INVESTING ACTIVITIESPurchase of investment securities (25,330,674) - (25,330,674) - Proceeds from sale and maturities of investment securities 27,009,062 - 27,009,062 - Interest on investments 567,750 72,113 639,863 28,975
Net cash provided by investing activities 2,246,138 72,113 2,318,251 28,975
Net increase in cash and cash equivalents 6,183,847 55,532 6,239,379 1,219,049 Cash and cash equivalents at October 1 62,146,421 7,154,729 69,301,150 3,119,457 Cash and cash equivalents at September 30 $ 68,330,268 $ 7,210,261 $ 75,540,529 $ 4,338,506
The accompanying notes are an integral part of this statement.27
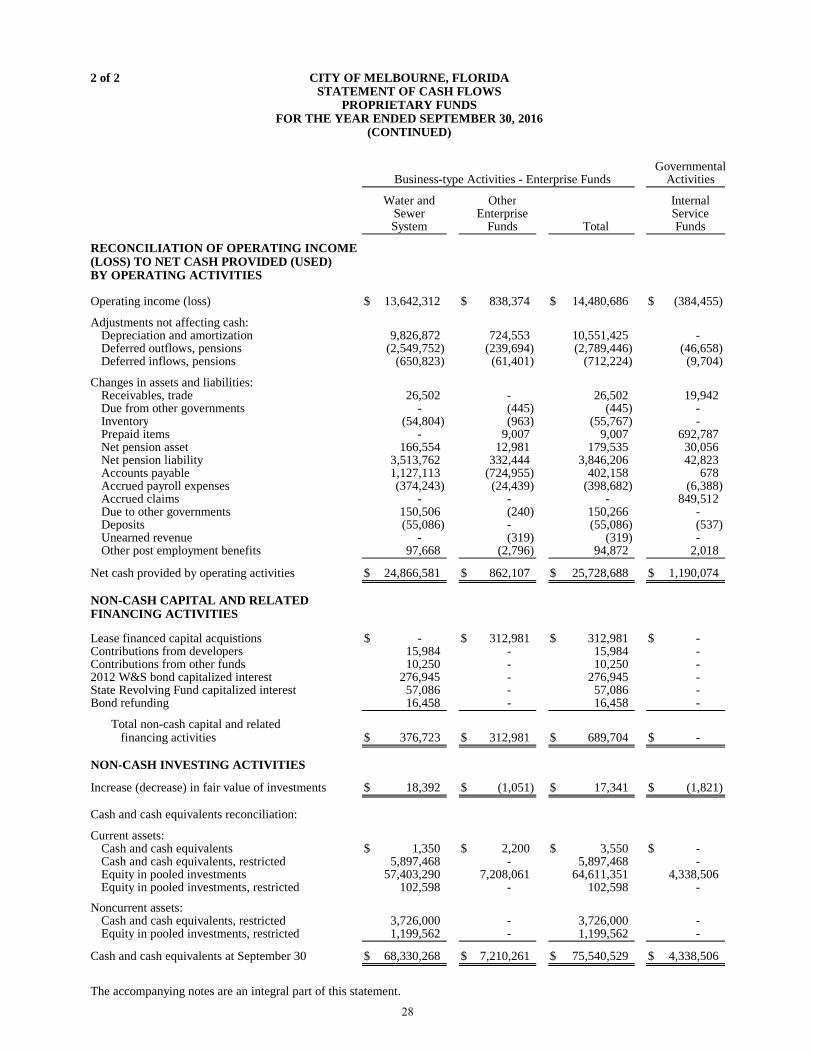
2 of 2 CITY OF MELBOURNE, FLORIDASTATEMENT OF CASH FLOWS
PROPRIETARY FUNDSFOR THE YEAR ENDED SEPTEMBER 30, 2016
(CONTINUED)
GovernmentalBusiness-type Activities - Enterprise Funds Activities
Water and Other InternalSewer Enterprise ServiceSystem Funds Total Funds
RECONCILIATION OF OPERATING INCOME(LOSS) TO NET CASH PROVIDED (USED)BY OPERATING ACTIVITIES
Operating income (loss) $ 13,642,312 $ 838,374 $ 14,480,686 $ (384,455)
Adjustments not affecting cash:Depreciation and amortization 9,826,872 724,553 10,551,425 - Deferred outflows, pensions (2,549,752) (239,694) (2,789,446) (46,658)Deferred inflows, pensions (650,823) (61,401) (712,224) (9,704)
Changes in assets and liabilities:Receivables, trade 26,502 - 26,502 19,942 Due from other governments - (445) (445) - Inventory (54,804) (963) (55,767) - Prepaid items - 9,007 9,007 692,787 Net pension asset 166,554 12,981 179,535 30,056 Net pension liability 3,513,762 332,444 3,846,206 42,823 Accounts payable 1,127,113 (724,955) 402,158 678 Accrued payroll expenses (374,243) (24,439) (398,682) (6,388)Accrued claims - - - 849,512 Due to other governments 150,506 (240) 150,266 - Deposits (55,086) - (55,086) (537) Unearned revenue - (319) (319) - Other post employment benefits 97,668 (2,796) 94,872 2,018
Net cash provided by operating activities $ 24,866,581 $ 862,107 $ 25,728,688 $ 1,190,074
NON-CASH CAPITAL AND RELATEDFINANCING ACTIVITIES
Lease financed capital acquistions $ - $ 312,981 $ 312,981 $ - Contributions from developers 15,984 - 15,984 - Contributions from other funds 10,250 - 10,250 - 2012 W&S bond capitalized interest 276,945 - 276,945 - State Revolving Fund capitalized interest 57,086 - 57,086 - Bond refunding 16,458 - 16,458 -
Total non-cash capital and related financing activities $ 376,723 $ 312,981 $ 689,704 $ -
NON-CASH INVESTING ACTIVITIES
Increase (decrease) in fair value of investments $ 18,392 $ (1,051) $ 17,341 $ (1,821)
Cash and cash equivalents reconciliation:
Current assets:Cash and cash equivalents $ 1,350 $ 2,200 $ 3,550 $ - Cash and cash equivalents, restricted 5,897,468 - 5,897,468 - Equity in pooled investments 57,403,290 7,208,061 64,611,351 4,338,506 Equity in pooled investments, restricted 102,598 - 102,598 -
Noncurrent assets:Cash and cash equivalents, restricted 3,726,000 - 3,726,000 - Equity in pooled investments, restricted 1,199,562 - 1,199,562 -
Cash and cash equivalents at September 30 $ 68,330,268 $ 7,210,261 $ 75,540,529 $ 4,338,506
The accompanying notes are an integral part of this statement.
28
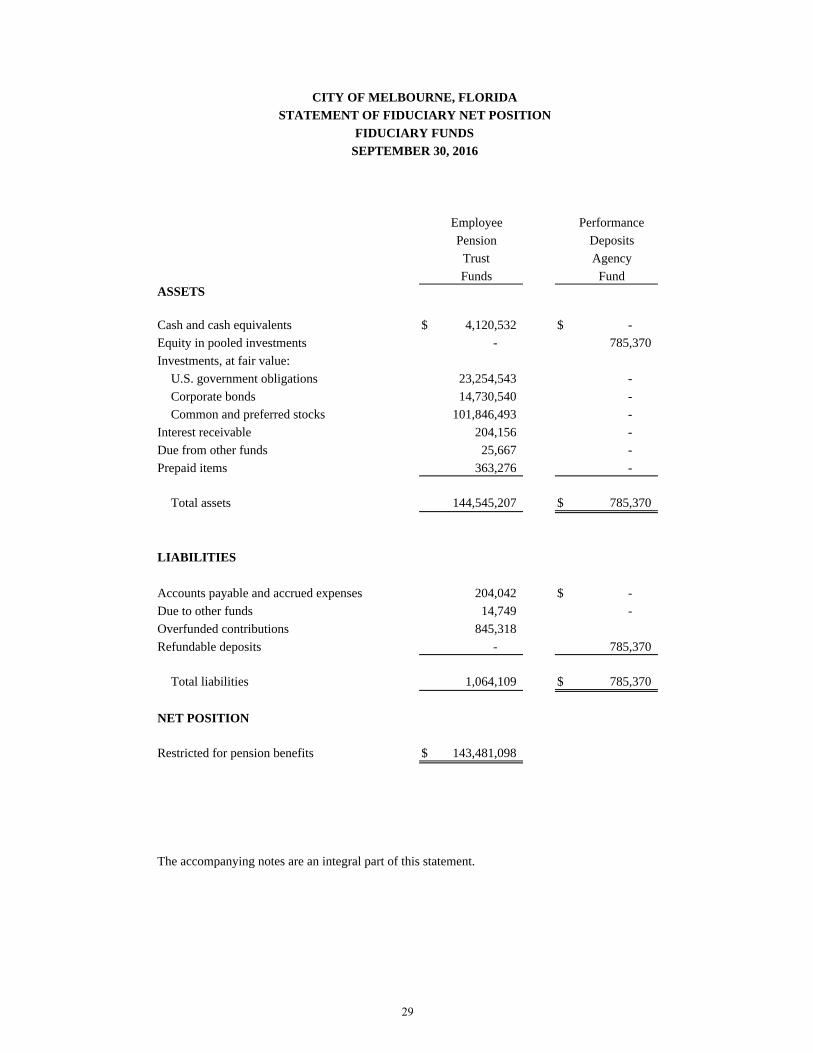
CITY OF MELBOURNE, FLORIDASTATEMENT OF FIDUCIARY NET POSITION
FIDUCIARY FUNDSSEPTEMBER 30, 2016
Employee PerformancePension Deposits
Trust AgencyFunds Fund
ASSETS
Cash and cash equivalents $ 4,120,532 $ -Equity in pooled investments - 785,370 Investments, at fair value:
U.S. government obligations 23,254,543 -Corporate bonds 14,730,540 -Common and preferred stocks 101,846,493 -
Interest receivable 204,156 -Due from other funds 25,667 -Prepaid items 363,276 -
Total assets 144,545,207 $ 785,370
LIABILITIES
Accounts payable and accrued expenses 204,042 $ -Due to other funds 14,749 -Overfunded contributions 845,318 Refundable deposits - 785,370
Total liabilities 1,064,109 $ 785,370
NET POSITION
Restricted for pension benefits $ 143,481,098
The accompanying notes are an integral part of this statement.
29
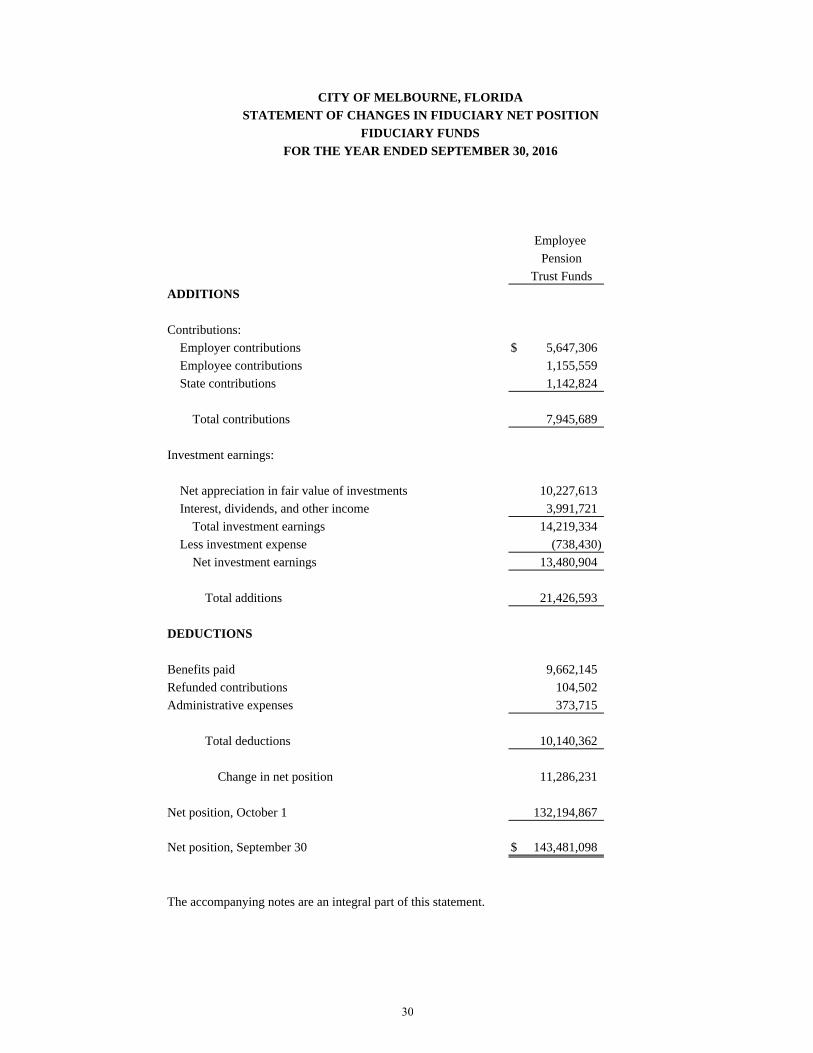
CITY OF MELBOURNE, FLORIDASTATEMENT OF CHANGES IN FIDUCIARY NET POSITION
FIDUCIARY FUNDSFOR THE YEAR ENDED SEPTEMBER 30, 2016
Employee Pension
Trust FundsADDITIONS
Contributions:Employer contributions $ 5,647,306 Employee contributions 1,155,559 State contributions 1,142,824
Total contributions 7,945,689
Investment earnings:
Net appreciation in fair value of investments 10,227,613 Interest, dividends, and other income 3,991,721
Total investment earnings 14,219,334 Less investment expense (738,430)
Net investment earnings 13,480,904
Total additions 21,426,593
DEDUCTIONS
Benefits paid 9,662,145 Refunded contributions 104,502 Administrative expenses 373,715
Total deductions 10,140,362
Change in net position 11,286,231
Net position, October 1 132,194,867
Net position, September 30 $ 143,481,098
The accompanying notes are an integral part of this statement.
30
CITY OF MELBOURNE, FLORIDA NOTES TO THE FINANCIAL STATEMENTS
FOR THE FISCAL YEAR ENDED SEPTEMBER 30, 2016
(1) SUMMARY OF SIGNIFICANT ACCOUNTING POLICIES
The City of Melbourne (the “City”), a Florida Municipal Corporation, was formed in 1969 as a result of the unification of the former cities of Melbourne and Eau Gallie. The City has a population of 80,419 living within an area of approximately 51.3 square miles. The governing body is a seven member elected City Council comprised of a Mayor and six Council members. The City Council appoints the City Manager who is responsible for the administration of all City services.
The financial statements of the City have been prepared in conformity with generally accepted accounting principles (GAAP) as applied to governmental units. The Governmental Accounting Standards Board (GASB) is the standard-setting body for governmental accounting and financial reporting. The GASB periodically updates its codification of the existing Governmental Accounting and Financial Reporting Standards which, along with subsequent GASB pronouncements (Statements and Interpretations), constitutes GAAP for governmental units.
The more significant of the City's accounting policies are described below:
A. Reporting Entity
In evaluating the City as a reporting entity, management has included all component units in accordance with Governmental Accounting Standards Board Statement (GASB) No. 14, “Defining the Financial Reporting Entity” and GASB Statement No. 39, “Determining Whether Certain Organizations are Component Units, an amendment of GASB Statement No. 14, and GASB Statement No. 61, “The Financial Reporting Entity: Omnibus, an amendment of GASB Statements No. 14 and No. 34.” The Financial Reporting Entity consists of the City of Melbourne (the primary government) and its component units. Component units are legally separate organizations for which the City Council is financially accountable. GASB Statement No. 61 further requires that a financial benefit or burden relationship be present for a component unit to be blended with the primary government. The component units discussed below are included in the City's reporting entity and are reported as part of the primary government or discretely presented in the financial statements depending upon the nature of the relationship to the City.
Blended Component Units
The following component units are blended with the primary government for financial statement purposes. Although they are legally separate from the City, the component unit's governing body either is substantively the same as the City Council and the City manages their operations or the component unit exclusively serves the City. The blended component units do not issue separate financial statements. Their financial statements are included in the City’s Comprehensive Annual Financial Report for the year ended September 30, 2016.
Downtown Community Redevelopment Agency -- The governing body of the Downtown Community Redevelopment Agency is the Melbourne City Council and the City manages their operations. The Downtown Community Redevelopment Agency is accounted for as a Special Revenue fund entitled “Downtown Redevelopment fund”.
Babcock Street Community Redevelopment Agency -- The governing body of the Babcock Street Community Redevelopment Agency is the Melbourne City Council and the City manages their operations. The Babcock Street Community Redevelopment Agency is accounted for as a Special Revenue fund entitled “Babcock Street Redevelopment fund”.
Olde Eau Gallie Riverfront Community Redevelopment Agency -- The governing body of the Olde Eau Gallie Riverfront Community Redevelopment Agency is the Melbourne City Council and the City manages their operations. The Olde Eau Gallie Riverfront Community Redevelopment Agency is accounted for as a Special Revenue fund entitled “Olde Eau Gallie Redevelopment fund.”
Firefighters’ Retirement System -- The City Council only appoints two of the five members of the governing board, but it is financially responsible for funding the firefighters' pension benefits. The Firefighters' Retirement
31

Trust fund only exists to provide pension benefits to City of Melbourne firefighters. It is accounted for in the Pension Trust funds.
Melbourne Police Officers’ Retirement System -- The City Council only appoints two of the five members of the governing board, but it is financially responsible for funding the police officers' pension benefits. The Melbourne Police Officers’ Retirement Trust fund only exists to provide pension benefits to City of Melbourne police officers. It is accounted for in the Pension Trust funds.
General Employees’ and Special Risk Class Employees’ Pension Plan -- The City Council only appoints two of the five members of the governing board, but it is financially responsible for funding the general employees' pension benefits. The General Employees’ Retirement Trust fund only exists to provide pension benefits to City of Melbourne general employees, Airport general employees, and Airport police personnel hired between January 1, 1996 and July 31, 2008. It is accounted for in the Pension Trust funds.
Discretely Presented Component Unit
The Melbourne International Airport (the “Airport”), governed by the Melbourne Airport Authority, is a financially self-sustaining enterprise. Its main purpose is to provide and maintain scheduled air passenger and cargo service to residents of Brevard County and surrounding counties. The Airport Authority consists of three City Council members appointed by the City Council and four members from the business community. Although the City does not appoint a majority of the Airport Authority and the Airport does not provide a financial benefit or impose a financial burden on the City, the Airport Authority is fiscally dependent on the City and it would be misleading to exclude. The City must approve the Airport Authority's budget and its bonded debt issuances. The Discretely Presented Component Unit column in the government-wide financial statements presents the financial data of the Airport. It is reported in a separate column of the Government-wide Financial Statements to emphasize that it is legally separate from the City. Financial statements for the Melbourne International Airport may be obtained from the Executive Director, Melbourne International Airport, One Air Terminal Parkway, Suite 220, Melbourne, FL 32901.
Related Organizations
The City's Mayor is responsible for appointing the members of the Melbourne Housing Authority (MHA), but the City's accountability for the MHA does not extend beyond making the appointments. The MHA has full financial accountability for administering the housing programs for low and moderate income families funded by grants and rental income.
B. Government-Wide and Fund Financial Statements
The government-wide financial statements (i.e., the statement of net position and the statement of changes in net position) report information on all of the nonfiduciary activities of the primary government and its component units. For the most part, the effect of interfund activity has been removed from these statements. Governmental activities, which normally are supported by taxes and intergovernmental revenues, are reported separately from business-type activities, which rely to a significant extent on fees and charges for support. Likewise, the primary government is reported separately from the legally separate component unit for which the primary government is financially accountable.
The statement of activities demonstrates the degree to which the direct expenses of a given function or segment are offset by program revenues. Direct expenses are those that are clearly identifiable with a specific function or segment. Program revenues include 1) charges to customers or applicants who purchase, use, or directly benefit from goods, services, or privileges provided by a given function or segment and 2) grants and contributions that are restricted to meeting the operation or capital requirements of a particular function or segment. Taxes and other items not properly included among program revenues are reported instead as general revenues.
Separate financial statements are provided for governmental funds, proprietary funds, and fiduciary funds, even though the latter are excluded from the government-wide financial statements. Major individual governmental funds and major individual enterprise funds are reported as separate columns in the fund financial statements.
32
C. Measurement Focus, Basis of Accounting, and Financial Statement Presentation
Basis of accounting refers to when revenues, expenditures or expenses are recognized and reported in the financial statements. Basis of accounting relates to the timing of the measurements made, regardless of the measurement focus applied.
The government-wide financial statements are reported using the economic resources measurement focus and the accrual basis of accounting, as are the proprietary fund and fiduciary pension fund financial statements. The agency fund has no measurement focus. Revenues are recorded when earned and expenses are recorded when a liability is incurred, regardless of the timing of related cash flows. Property taxes are recognized in the year for which they are levied. Grants and similar items are recognized as revenue as soon as all eligibility requirements imposed by the provider have been met.
Governmental fund financial statements are reported using the current financial resources measurement focus and the modified accrual basis of accounting. Revenues are recognized as soon as they are both measurable and available. Revenues are considered to be available when they are collectible within the current period or soon enough thereafter to pay liabilities of the current period. For this purpose, the City considers revenues to be available if they are collected within 60 days of the end of the current fiscal period, except for grants, for which the period is 12 months. Expenditures generally are recorded when a liability is incurred, as under accrual accounting. However, debt service expenditures, as well as expenditures related to compensated absences, are recorded only when payment is due.
When both restricted and unrestricted resources are available for use, it is the City’s policy to use restricted resources first, followed by committed, assigned, and unassigned amounts when expenditures have been incurred for which resources in more than one classification could be used.
Property taxes, franchise fees, licenses and interest associated with the current fiscal period are all considered to be susceptible to accrual and have been recognized as revenues of the current fiscal period. All other revenue items are considered to be measurable and available only when cash is received by the government.
GASB Statement No. 34 sets forth minimum criteria (percentage of the assets, liabilities, revenues or expenditures/expenses of either fund category or the governmental and enterprise combined) for the determination of major funds. The non-major funds are combined in a column in the fund financial statements and detailed in the combining section.
The City reports the following major governmental funds:
• The General fund is the City’s primary operating fund. It accounts for all financial resources of the generalgovernment, except those required to be accounted for in another fund.
• The Downtown Redevelopment fund is used to account for tax increment revenues assessed on downtownproperties that are used to fund capital improvements that encourage development in the downtown area.
• The Babcock Street Redevelopment fund is used to account for tax increment revenues assessed onproperties within the Babcock Street redevelopment district that are used to fund capital improvements thatfacilitate the revitalization of this commercial corridor in Melbourne.
• The Olde Eau Gallie Redevelopment fund is used to account for tax increment revenues assessed onproperties within the Eau Gallie district that are used to fund capital improvements to revitalize the urbancore area of Eau Gallie.
• The Transportation Capital Improvement fund, primarily funded by transportation impact fees and localoption gas tax, accounts for the activities of governmental fund transportation projects.
The Redevelopment funds do not qualify as major funds but have been shown as such to comply with Chapter 163.387(8), Florida Statutes that requires these funds be separately audited.
The City reports the following major proprietary fund:
• The Water and Sewer System fund provides water and sewer service to residents of the City andneighboring communities.
33
Additionally, the City reports the following fund types:
• Special Revenue funds are used to account for the proceeds of specific revenue sources that are restricted toexpenditures for specified purposes other than capital projects.
• Capital Projects funds account for the activities of governmental fund general construction, recreation,mobility, bikeways and public facility construction projects.
• The Permanent fund is used to account for resources legally held in trust to finance maintenance for theCity’s municipal cemeteries. The revenues designated for perpetual care are placed in trust and the interestearned is transferred to the General fund.
• Internal Service funds account for workers compensation services and general liability insurance provided toother departments and component units of the City on a cost reimbursement basis.
• The Pension Trust fund accounts are used to account for assets held by the City in a fiduciary capacity for theFirefighters Pension Plan, Police Pension Plan and General Employees Pension Plan. The funds are operatedby carrying out specific terms of statutes, ordinances, and other governing regulations.
• The Performance Deposit Agency fund accounts for assets held by the City in a fiduciary capacity as anagent for individuals and businesses. This fund accounts for deposits placed by bidders and developers toguarantee specific performance pursuant to a bid or contract.
The City reports the following discretely presented component unit:
The Melbourne International Airport is an Enterprise fund accounted for on the accrual basis. All references in these notes to the accounting treatment for Proprietary or Enterprise funds are applicable to the Airport.
As a general rule the effect of interfund activity has been eliminated from the government-wide financial statements. Exceptions to this general rule are administrative charges provided by the General fund to the Enterprise funds and the Airport, and fire services provided by the General fund to the Airport. Elimination of these charges would distort the direct costs and program revenues reported for the various functions concerned. Amounts reported as program revenues include 1) charges to customers or applicants for goods, services, or privileges provided, 2) operating grants and contributions, and 3) capital grants and contributions. Internally dedicated resources are reported as general revenues rather than as program revenues. Likewise, general revenues include all taxes.
Proprietary funds distinguish operating revenues and expenses from nonoperating items. Operating revenues and expenses generally result from providing services and producing and delivering goods in connection with a proprietary fund’s principal ongoing operations. The principal operating revenues of the enterprise funds, and of the internal service funds are charges to customers for sales and services. Operating expenses for enterprise funds and internal service funds include the cost of sales and services, administrative expenses, and depreciation on capital assets. All revenues and expenses not meeting this definition are reported as nonoperating revenues and expenses.
D. Assets, Deferred Outflows, Liabilities, Deferred Inflows, and Net Position or Equity
1. Cash and Cash Equivalents/Investments
Cash and cash equivalents represent all investments which are short term, highly liquid, and readily convertible to a specified cash value. These investments generally have original maturities of three months or less. Cash equivalents consist of equity in pooled investments. The cash and cash equivalents presented on the Statement of Cash Flows – Proprietary Funds are composed of restricted and unrestricted cash and cash equivalents and equity in pooled investments presented on the Statement of Net Position – Proprietary Funds. Investments are stated at fair value, based on the quoted market price.
34
2. Pooled Cash
Equity in pooled cash consists primarily of investments in debt instruments of the federal government. Investment earnings of the pool are allocated to the participating funds at the end of each month based on the ratio of each participant fund's investment to the total pooled investment. As of September 30, 2016 the funds participating in pooled cash investments are the General fund; all Special Revenue funds; all Capital Projects funds; all Enterprise funds; all Internal Service funds, the Permanent fund, and the Performance Deposits Agency fund. The Airport participates in the equity in pooled cash system on a limited basis to expedite disbursements. Its funds are primarily invested in debt instruments of the federal government.
3. Receivables and Payables
Activities between funds that are representative of lending/borrowing arrangements outstanding at the end of the fiscal year are referred to as either “due to/from other funds” (i.e., the current portion of interfund loans) or “advances to/from other funds” (i.e., the non-current portion of interfund loans). All other outstanding balances between funds are reported as “due to/from other funds”. Long-term advances between funds are offset by a nonspendable fund balance account in applicable governmental funds to indicate they are not available for appropriation and are not expendable available financial resources. Any residual balances outstanding between the governmental activities and business-type activities are reported in the government-wide financial statements as “internal balances”. All trade receivables are shown net of an allowance for uncollectibles. The Airport records a net noncurrent lease receivable for Embraer earned rent that will be collected in future years per the lease agreement.
The City is permitted by State law to levy taxes up to 10 mills on assessed valuation. However, Chapter 74-430 Laws of Florida, a special act applicable only to governmental units in Brevard County, limits increases to 10% of the prior year’s millage. Pursuant to Ch. 200.065(5)(a), F.S. the maximum millage rate that the City may levy is a rolled-back rate based on the amount of taxes which would have been levied in the prior year if the maximum millage rate had been applied, adjusted for the change in per capita Florida personal income, unless a higher rate is adopted, in which case the maximum is the adopted rate. The Melbourne City Council levy for the fiscal year ended September 30, 2016 was 7.6886 mills, which is greater than the computed rolled back rate of 6.9899 mills.
As provided by law, the Brevard County Property Appraiser assesses all properties for ad valorem taxing purposes and the Brevard County Tax Collector collects and distributes all taxes. Ad valorem taxes are levied based on property valuation as of January 1. The fiscal year for which ad valorem taxes are levied begins on October 1. Taxes are due beginning on November 1, delinquent on April 1, and liened on May 30. Property tax revenues are recognized in the fiscal year for which they are budgeted and also become due and payable. Virtually all unpaid taxes are collected via tax certificates sold on or prior to June 1; therefore, no material taxes are receivable at fiscal year end.
4. Inventories and Prepaids
Inventories such as central warehouse supplies are valued on a moving average cost basis. All other inventories, including fuel and chemicals, are valued at cost on the first-in, first-out method. Inventory in the General fund consists of materials and supplies held for consumption. The cost is recorded as an expenditure at the time individual inventory items are issued. Inventory in the Proprietary funds consists of materials and supplies used in the production of goods and services.
Certain payments to vendors reflect costs applicable to future accounting periods and are recorded as prepaid items in both government-wide and fund financial statements.
35

5. Restricted Assets
Certain assets of the City are classified as restricted assets on the Statement of Net Position because their use is limited by law through constitutional provisions or enabling legislation; or by restrictions imposed externally by creditors, grantors, contributors, or laws or regulations of other governments. In a fund with both restricted and unrestricted assets, qualified expenses are considered to be paid first from restricted assets and then from unrestricted assets. Assets are set aside for the following uses:
• Revenue Bonds/State Revolving Fund (SRF) Current Debt Service – used to segregate resourcesaccumulated for debt service payments over the next twelve months.
• Revenue Bonds Future Debt Service – used to report resources set aside to make up potential futuredeficiencies in the revenue bonds current debt service account.
• Revenue Bonds Renewal and Replacement – used to report resources set aside to fund asset renewals andreplacements or to meet unexpected contingencies.
• Water/Sewer Impact Fees – used to segregate resources set aside for water and sewer improvements.
• Wastewater Capital Recovery – used to segregate resources set aside for wastewater improvements at theDavid B. Lee Water Reclamation Facility.
• Due from other governments – used to segregate revenues due from other governments for General fundfirefighters pension contributions, fines restricted for police education, and for Airport projects.
• Customer/Tenant Deposits – used to segregate deposits collected from water customers and Airport tenants.
• Interest receivable – used to report interest receivable on restricted revenue and reserve accounts.
• Cash and cash equivalents – used to report resources set aside to meet grant requirements for Airportprojects.
6. Capital Assets
Capital assets, which include property, plant, equipment, intangibles, and infrastructure assets (e.g., roads, bridges, sidewalks, and similar items), are reported in the applicable governmental or business-type activities columns in the government-wide financial statements. Capital assets, other than equipment, are defined by the government as assets with an initial, individual cost of more than $25,000 (amount not rounded) and an estimated useful life in excess of two years. Equipment is defined as assets with an initial, individual cost of more than $5,000 (amount not rounded) and an estimated useful life in excess of two years. Such assets are recorded at historical cost, if purchased or constructed, and at estimated fair market value at date of gift, if donated. Major additions are capitalized while maintenance and repairs which do not improve or materially extend the life of the respective assets are charged to expense. Major outlays for capital assets and improvements are capitalized as projects are constructed.
The City’s policy is to capitalize interest costs related to construction projects. Interest incurred during the construction phase of capital assets of business-type activities is included as part of the capitalized value of the assets constructed. The amount of interest to be capitalized is calculated by offsetting interest expense of $334,780 incurred with interest earned on unspent proceeds of $749. For the year ended September 30, 2016, $334,031 of interest expense was capitalized in the Water and Sewer System.
General infrastructure assets acquired prior to October 1, 2002 consist of the road network assets that were acquired or that received substantial improvements subsequent to July 1, 1980 and are reported at estimated historical cost using actual original cost and acquisition date, estimated cost based on known average installed cost at the estimated acquisition date, or deflated replacement cost from the estimated acquisition date.
36

Capital assets of the primary government, as well as the component unit, are depreciated or amortized using the straight-line method over the following average useful lives:
Classification Range of Lives Buildings 20-40 years Improvements other than buildings 10-25 years Machinery, equipment and other 2-20 years Intangibles, computer software 3-10 years Airport runways 25 years Bridges 50 years Roads, asphalt 20 years Sidewalks 20 years Streetlights 15 years Traffic signals 15 years Docks, piers 15 years Seawalls, boat ramps 30 years
7. Deferred Outflows of Resources
The deferred amount for advance refunding of debt in the Water and Sewer fund, and certain pension adjustments are classified as deferred outflows of resources due to GASB Statement No. 65 and No. 68.
8. Compensated Absences
It is the government’s policy to permit employees to accumulate earned but unused vacation and sick pay benefits. All vacation pay is accrued when incurred in the government-wide and proprietary fund financial statements.
The General fund and Internal Service funds obligations for accumulated, vested vacation, reimbursable sick leave, and applicable benefits of $3,550,305 are recorded as a liability in the governmental column of the Government-wide Statement of Net Position. A liability for these amounts is reported in governmental funds only if they have matured, for example, as a result of employee resignations and retirements. The liability for accumulated, vested vacation, reimbursable sick leave, and applicable benefits of the Proprietary funds and the Airport was recorded in the applicable funds as compensated absences.
9. Long-Term Liabilities
Long-term liabilities expected to be financed from Governmental funds are not accounted for in the Governmental funds. Expenditure recognition for Governmental fund types is limited to exclude amounts paid from non-current assets. Such long-term amounts are not recognized as Governmental fund type expenditures or fund liabilities but are incorporated into the governmental column in the Government-wide Statement of Net Position.
In the government-wide financial statements, and proprietary fund types in the fund financial statements, long-term debt and other long-term obligations are reported as liabilities in the applicable governmental activities, business-type activities, or proprietary fund type statement of net position. Bond premiums and discounts are amortized over the life of the bonds. Bonds payable are reported net of the applicable bond premium or discount. Bond issuance costs are expensed as incurred.
In the Proprietary funds (and for the governmental funds, in the Government-wide statements, if applicable) the difference between the re-acquisition price (new debt) and the net carrying value of the old debt on refunded debt transactions is deferred and amortized as a component of interest expense using the bonds outstanding method over the shorter of the remaining life of the old debt or the life of the new debt. The deferred account is reported as deferred outflows of resources.
37

10. Deferred Inflows of Resources
Unavailable revenues in government funds, resources received before time requirements are met, and certain pension reporting adjustments are classified as deferred inflows of resources.
11. Categories and Classification of Fund Equity
Fund balance, under GASB Statement No. 54, is divided into five classifications based primarily on the extent to which the City is bound to observe constraints imposed upon the use of the resources in the governmental funds. The five classifications provide clarity to the level of restrictions, as fund balance can have different levels of restraint, such as external versus internal compliance requirements. The constraints placed on fund balance for the major governmental funds and all other governmental funds are presented below:
Nonspendable - The nonspendable fund balance category includes amounts that cannot be spent because they are not in spendable form, or legally or contractually required to be maintained intact. The “not in spendable form” criterion includes items that are not expected to be converted to cash. It also includes the long-term amount of interfund advances.
Restricted - Fund balance is reported as restricted when constraints placed on the use of resources are either externally imposed by creditors (such as through debt covenants), grantors, contributors, or laws or regulations of other governments or is imposed by law through constitutional provisions or enabling legislation (City ordinances). Enabling legislation authorizes the City to assess, levy, charge, or otherwise mandate payment of resources (from external resource providers) and includes a legally enforceable requirement that those resources be used only for the specific purposes stipulated in the legislation. Legal enforceability means that the City can be compelled by an external party such as citizens, public interest groups, or the judiciary to use resources created by enabling legislation only for the purposes specified by the legislation.
Committed - The committed fund balance classification includes amounts that can be used only for the specific purposes imposed by formal action (resolution) of City Council, the City’s highest level of decision making authority. Commitments may only be removed or changed by the City Council taking the same formal action (resolution) that imposed the constraint originally.
Assigned - Amounts in the assigned fund balance classification are intended to be used by the City for specific purposes but do not meet the criteria to be classified as restricted or committed. In governmental funds other than the general fund, assigned fund balance represents unspent funds appropriated by City Council for specific capital projects. Per City Resolution No. 3510, the authority to assign fund balances lies with the City Manager.
Unassigned - Unassigned fund balance is the residual classification for the General fund and includes all spendable amounts not contained in the other classifications. In other governmental funds, the unassigned classification is used only to report a deficit balance resulting from overspending for specific purposes for which amounts had been restricted, committed, or assigned.
City Resolution No. 3510 requires excess funds to be transferred to unassigned fund balance until the total of assigned plus unassigned fund balance equals 25% of the General fund operating budget, excluding operating transfers. Thereafter, any remaining excess funds shall be identified by the City Manager as available to fund capital purchases, capital construction, non-recurring expenditures, or to establish additional assignments of fund balance.
The government-wide statement of net position reports $35,241,801 of restricted net position, of which $19,022,986 is restricted by enabling legislation.
The City applies restricted resources first when expenditures are incurred for purposes for which either restricted or unrestricted (committed, assigned, and unassigned) amounts are available. Similarly, within unrestricted fund balance, committed amounts are reduced first followed by assigned, and then unassigned amounts when expenditures are incurred for purposes for which amounts in any of the unrestricted fund balance classifications could be used.
38
(2) STEWARDSHIP, COMPLIANCE, AND ACCOUNTABILITY
Budgetary Information
The City has elected to report budgetary comparisons as Required Supplementary Information (RSI). Please refer to the accompanying notes to the RSI for the City’s budgetary information.
The City has no material violations of finance-related legal and contractual provisions.
(3) ACCOUNTING CHANGES
The City has implemented GASB Statement No. 72, “Fair Value Measurement and Application”, which provides guidance for determining, applying, and disclosing fair value measurement for financial reporting purposes for financial and non-financial assets, including real estate, intangible assets, land rights, natural resources and alternative investments. A three level hierarchy of valuation techniques used to measure fair value was established. Level 1 inputs are quoted prices (unadjusted) in active markets for identical assets or liabilities. Level 2 inputs are inputs other than quoted prices that are observable either directly or indirectly. Level 3 inputs are unobservable inputs. The Statement requires disclosures to be made about fair value measurements, the level of fair value hierarchy, and valuation techniques.
(4) DETAILED NOTES – ON ALL FUNDS
A. Deposits and Investments
Deposits –Banks and savings and loans must meet the criteria to be a qualified public depository as described in the Florida Security for Public Deposits Act in accordance with Chapter 280, Florida Statutes before any investment of public funds can be made with them. At September 30, 2016 the carrying amount of the City of Melbourne’s deposits with banks was $8,605,591 and the bank balance was $9,926,281. For the Airport the carrying amount of deposits with banks was $3,191,456 and the bank balance was $3,179,650.
For the Fiduciary funds, the carrying amount was $543,788 and the bank balance was $391,361. As of September 30, 2016, all of the City’s non-interest bearing bank balances are covered by federal depository insurance (FDIC). Monies invested in amounts greater than the insurance coverage are secured by the qualified public depositories pledging securities with the State Treasurer in such amounts required by the Florida Security for Public Depositories Act. In the event of a default or insolvency of a qualified public depositor, the State Treasurer will implement procedures for payment of losses according to the validated claims of the City pursuant to Section 280.08, Florida Statutes.
The City maintains a pool of cash and investments in which each fund participates on a daily transaction basis. Investment earnings are distributed monthly based on average daily balances. The City’s pooled portfolio excludes the Home Investment Partnership Program, Neighborhood Stabilization Program 3, the Debt Service funds, the International Airport fund, and the Firefighters, Police, and General Employees Pension Trust funds.
City and Airport daily deposits are deposited in ECR earning accounts. These accounts are fully collateralized in accordance with Florida state law. Cash also includes Primary Government petty cash of $8,415 and Component Unit petty cash of $3,725.
39
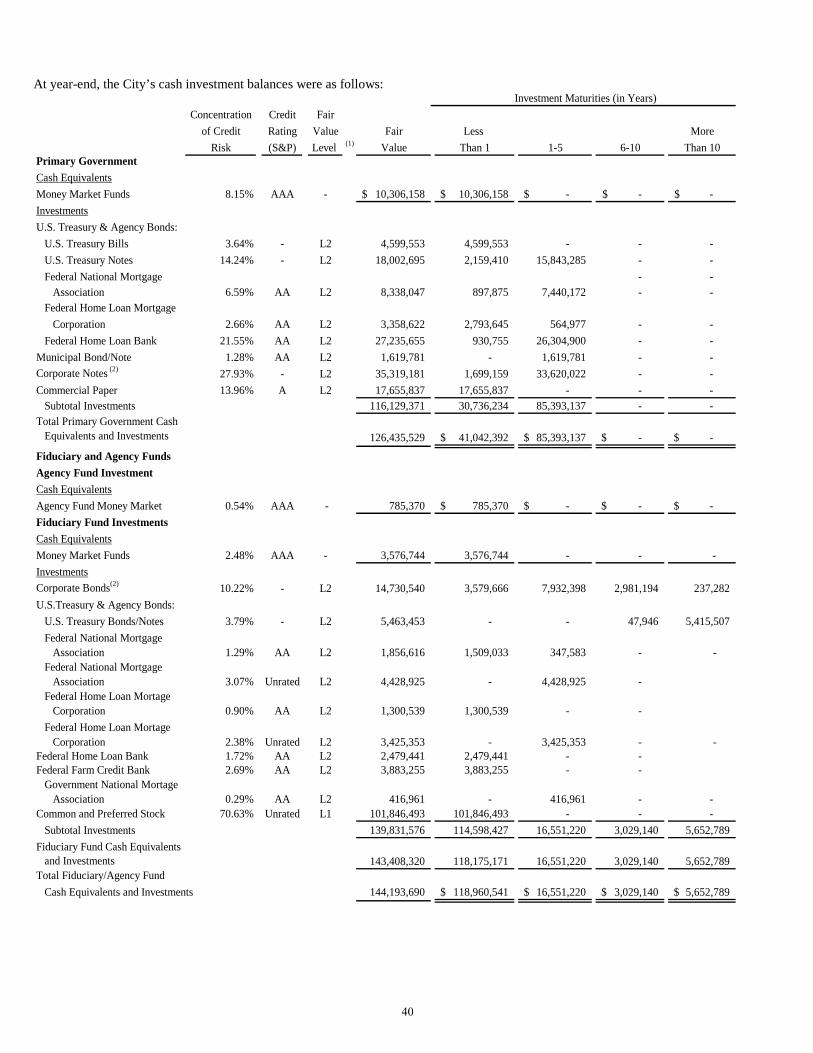
At year-end, the City’s cash investment balances were as follows:
Concentration Credit Fairof Credit Rating Value Fair Less More
Risk (S&P) Level (1) Value Than 1 1-5 6-10 Than 10Primary GovernmentCash EquivalentsMoney Market Funds 8.15% AAA - 10,306,158$ 10,306,158$ -$ -$ -$ InvestmentsU.S. Treasury & Agency Bonds:
U.S. Treasury Bills 3.64% - L2 4,599,553 4,599,553 - - - U.S. Treasury Notes 14.24% - L2 18,002,695 2,159,410 15,843,285 - - Federal National Mortgage - -
Association 6.59% AA L2 8,338,047 897,875 7,440,172 - - Federal Home Loan Mortgage
Corporation 2.66% AA L2 3,358,622 2,793,645 564,977 - - Federal Home Loan Bank 21.55% AA L2 27,235,655 930,755 26,304,900 - - Municipal Bond/Note 1.28% AA L2 1,619,781 - 1,619,781 - - Corporate Notes (2) 27.93% - L2 35,319,181 1,699,159 33,620,022 - - Commercial Paper 13.96% A L2 17,655,837 17,655,837 - - - Subtotal Investments 116,129,371 30,736,234 85,393,137 - - Total Primary Government Cash
Equivalents and Investments 126,435,529 41,042,392$ 85,393,137$ -$ -$
Fiduciary and Agency FundsAgency Fund InvestmentCash EquivalentsAgency Fund Money Market 0.54% AAA - 785,370 785,370$ -$ -$ -$ Fiduciary Fund InvestmentsCash EquivalentsMoney Market Funds 2.48% AAA - 3,576,744 3,576,744 - - -InvestmentsCorporate Bonds(2) 10.22% - L2 14,730,540 3,579,666 7,932,398 2,981,194 237,282 U.S.Treasury & Agency Bonds:
U.S. Treasury Bonds/Notes 3.79% - L2 5,463,453 - - 47,946 5,415,507 Federal National Mortgage
Association 1.29% AA L2 1,856,616 1,509,033 347,583 - - Federal National Mortgage
Association 3.07% Unrated L2 4,428,925 - 4,428,925 - Federal Home Loan Mortage
Corporation 0.90% AA L2 1,300,539 1,300,539 - - Federal Home Loan Mortage
Corporation 2.38% Unrated L2 3,425,353 - 3,425,353 - -Federal Home Loan Bank 1.72% AA L2 2,479,441 2,479,441 - - Federal Farm Credit Bank 2.69% AA L2 3,883,255 3,883,255 - -
Government National Mortage Association 0.29% AA L2 416,961 - 416,961 - - Common and Preferred Stock 70.63% Unrated L1 101,846,493 101,846,493 - - - Subtotal Investments 139,831,576 114,598,427 16,551,220 3,029,140 5,652,789 Fiduciary Fund Cash Equivalents and Investments 143,408,320 118,175,171 16,551,220 3,029,140 5,652,789 Total Fiduciary/Agency Fund
Cash Equivalents and Investments 144,193,690 118,960,541$ 16,551,220$ 3,029,140$ 5,652,789$
Investment Maturities (in Years)
40
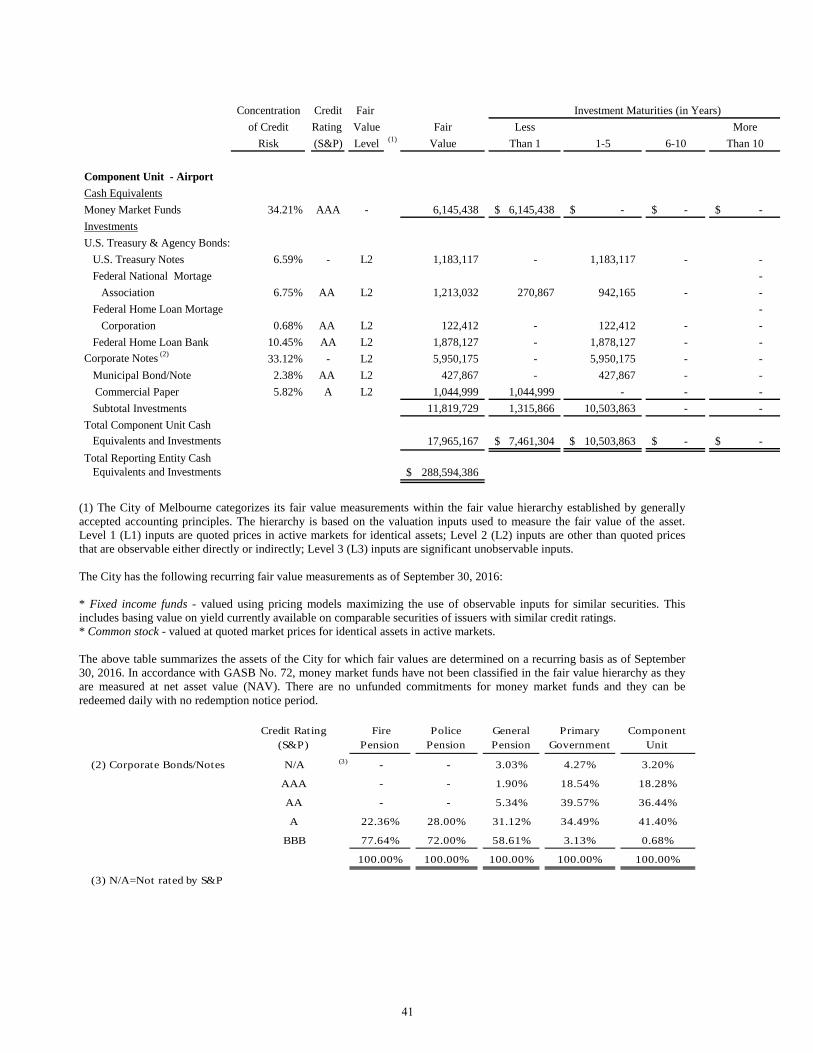
Concentration Credit Fair of Credit Rating Value Fair Less More
Risk (S&P) Level (1) Value Than 1 1-5 6-10 Than 10
Component Unit - Airport
34.21% AAA - 6,145,438 6,145,438$ -$ -$ -$
U.S. Treasury & Agency Bonds: U.S. Treasury Notes 6.59% - L2 1,183,117 - 1,183,117 - - Federal National Mortage -
6.75% AA L2 1,213,032 270,867 942,165 - - Federal Home Loan Mortage -
Corporation 0.68% AA L2 122,412 - 122,412 - - 10.45% AA L2 1,878,127 - 1,878,127 - -
Corporate Notes (2) 33.12% - L2 5,950,175 - 5,950,175 - - Municipal Bond/Note 2.38% AA L2 427,867 - 427,867 - - Commercial Paper 5.82% A L2 1,044,999 1,044,999 - - -
Subtotal Investments 11,819,729 1,315,866 10,503,863 - -
17,965,167 7,461,304$ 10,503,863$ -$ -$
288,594,386$ Total Reporting Entity Cash
Investment Maturities (in Years)
Cash Equivalents
InvestmentsMoney Market Funds
Association
Federal Home Loan Bank
Equivalents and Investments
Equivalents and Investments
Total Component Unit Cash
(1) The City of Melbourne categorizes its fair value measurements within the fair value hierarchy established by generally accepted accounting principles. The hierarchy is based on the valuation inputs used to measure the fair value of the asset. Level 1 (L1) inputs are quoted prices in active markets for identical assets; Level 2 (L2) inputs are other than quoted prices that are observable either directly or indirectly; Level 3 (L3) inputs are significant unobservable inputs.
The City has the following recurring fair value measurements as of September 30, 2016:
* Fixed income funds - valued using pricing models maximizing the use of observable inputs for similar securities. Thisincludes basing value on yield currently available on comparable securities of issuers with similar credit ratings. * Common stock - valued at quoted market prices for identical assets in active markets.
The above table summarizes the assets of the City for which fair values are determined on a recurring basis as of September 30, 2016. In accordance with GASB No. 72, money market funds have not been classified in the fair value hierarchy as they are measured at net asset value (NAV). There are no unfunded commitments for money market funds and they can be redeemed daily with no redemption notice period.
Credit Rating (S&P)
Fire Pension
Police Pension
General Pension
Primary Government
Component Unit
(2) Corporate Bonds/Notes N/A (3) - - 3.03% 4.27% 3.20%
AAA - - 1.90% 18.54% 18.28%
AA - - 5.34% 39.57% 36.44%
A 22.36% 28.00% 31.12% 34.49% 41.40%
BBB 77.64% 72.00% 58.61% 3.13% 0.68%
100.00% 100.00% 100.00% 100.00% 100.00%
(3) N/A=Not rated by S&P
41

City of Melbourne Investment Policy – Pursuant to the requirements of Section 218.415, Florida Statutes, the City of Melbourne adopted Resolution No. 3511 on September 8, 2015, establishing the City’s present investment policy. Such investment policy applies to the investment of surplus funds, which include cash and investment balances of the following funds of the City: General, Capital Projects, Special Revenue, Enterprise, Internal Service, Trust and Agency, and Airport. The investment policy does not apply to the investment of principal, interest, reserve, construction, capitalized interest, redemption or escrow accounts created by ordinance or resolution pursuant to the issuance of bonds where the investments are held by an authorized depository. This policy does not apply to funds not under control of the City; such as, the Police Officers’ Retirement System, the Firefighters’ Retirement System, and the General Employees’ and Special Risk Class Employees’ Pension Plan.
All investments are made based on reasonable research as to credit quality, liquidity and interest rate risk prior to the investment being acquired.
The investment policy authorizes the City to invest in U.S. Government securities, agencies and Federal instrumentalities, repurchase agreements, the Local Government Surplus Funds Trust Fund administered by the Florida State Board of Administration, interest bearing time deposits or savings accounts, commercial paper, corporate notes, bankers acceptances, and State or local government taxable or tax-exempt debt, and an intergovernmental investment pool. Overnight repurchase agreements restrict investments to obligations of U.S. Government Agencies and Federal instrumentalities.
The investment policy provides maturity and liquidity requirements for investments. All investments other than investments in the Local Government Surplus Funds Trust Fund are required to be purchased pursuant to competitive bids. A maximum of 25% of available funds may be invested in the Local Government Surplus Funds Trust Fund. The policy also requires diversification of the investment portfolio to control the risk of loss from overconcentration of assets in a specific maturity, issuer, instrument, dealer, savings and loan, or bank through which investments are purchased. Concentration of credit risk is the risk of loss attributed to the magnitude of a government’s investment in a single issuer. The City’s investment policy restricts portfolio composition for federal instrumentalities to 100% total, 40% individually. Concentration percentages for the Federal instrumentalities are provided in the schedule. Currently, the investment of a significant portion of the City’s and Airport’s portfolios is being managed by the City’s financial advisor, PFM Asset Management LLC.
Custodial credit risk for investments is the risk that, in the event of a failure of the counter party, the City will not be able to recover the value of the investment or collateral securities that are in the possession of an outside party. The City’s investment policy states that all securities, with the exception of certificates of deposits, shall be held with a third party custodian; and all securities purchased by, and all collateral obtained by the City should be properly designated as an asset of the City. The third party custodian holds securities in an account separate and apart from the assets of the financial institution, and are either insured or registered in the City’s or Airport’s name.
The fair values of the City’s fixed-maturity investments fluctuate in response to changes in market interest rates. Increases in prevailing interest rates generally translate into decreases in fair values of those instruments. Fair values of interest rate-sensitive instruments may be affected by the credit worthiness of the issuer, prepayment options, relative values of alternative investments, the liquidity of the instrument, and other general market conditions. As a means to limiting its exposure to fair value losses arising from rising interest rates, the City’s investment policy limits its investment portfolio to maturities of less than 5.5 years for corporate notes, two years for time deposits, and 270 days for commercial paper.
Credit risk is the risk that an issuer or other counterparty to an investment will not fulfill its obligations. As a means to limiting its exposure to credit risk, the City limits investments with credit quality ratings from nationally recognized rating agencies of:
• State and/or local government taxable and/or tax-exempt debt, general obligation and/or revenue bonds,rated at least “MIG 1/A3” by Moody’s Investors Services and “SP-1/A-” by Standard & Poor’s for long-term debt.
• Commercial paper of any United States company that is rated, at the time of purchase, “P-1” by Moody’sand “A-1” by Standard & Poor’s.
42
• Money Market Mutual Funds that are rated “AAA” by Standard & Poor’s, or the equivalent by anotherrating agency.
• Local Government Surplus Funds Trust Fund money market funds that are rated “AAA” by Standard &Poor’s, or the equivalent by another rating agency.
Fire Pension Investment Policy – The investment policy is maintained by the Pension Board of Trustees with the objective of obtaining a reasonable total rate of return commensurate with the Prudent Investor Rule. The asset allocation, sector weightings, security selection, and investment style are at the sole discretion of the Investment Manager employed by the Board of Trustees. The fiduciary responsibility of the Board is to recognize that the retirement system provides income benefits to retired participants and beneficiaries on a long-term basis. The Board of Trustees shall comply with the fiduciary standards set forth in the Employee Retirement Income Security Act of 1974 (ERISA).
Performance of the total Fund is measured for rolling three and five year periods to accommodate the market cycles experienced with investments. The Fund performance is compared to the return of a blended index of 45% Russell 3000, 15% MSCI all Country World Index ex U.S., 20% Barclays Capital U.S. Aggregate Bond Index, 5% Barclays Global Aggregate Index, 5% Consumer Price Index + 5%, and 10% NFI Opened End Diversified Core Equity (ODCE). On a relative basis, the total return of combined equity, fixed income, and cash portfolio is expected to be in the top 40% of the appropriate peer universe. On an absolute basis, the total return of the combined equity, fixed income, and cash portfolio is expected to equal or exceed the actuarial earnings assumption of 8%.
Authorized investments held in the Fund are limited to the following:
1. Equities must be traded on a national exchange or election network. Not more than 5% of the Plan’s assetsat the time of purchase shall be invested in the common stock, capital stock, or convertible stock of any oneissuing company, nor shall the aggregate investment in any one issuing company exceed 5% of theoutstanding capital stock of the company. There are no qualitative guidelines with regard to equity ratingsexcept that prudent standards should be developed and maintained.
2. Fixed income investments must have a minimum rating of Investment Grade or higher as determined by atleast one major audit rating service. The value of bonds issued by any single corporation shall not exceed5% of the total bond portfolio.
3. Money Market Funds or Short – term Investment Fund (STIF) provided by the Plan’s custodian; governmentpaper backed by the full faith and credit of the United States Government.
4. Foreign Securities are limited to fully and easily negotiable equity securities and shall be traded on anexchange recognized as the official exchange by the government where the exchange is located, or on any ofthe major equivalent electronic exchanges.
5. Pooled investments may include, but are not limited to, mutual funds, commingled funds, exchange-tradedfunds, limited partnerships and private equity. In the event of investment by the Plan into a pooled fund, theBoard will adopt the prospectus or governing policy of that fund as the stated addendum to this InvestmentPolicy Statement.
Limitations include investments in corporate common stock and convertible bonds not to exceed 70% of the Fund assets at market value, and foreign securities not to exceed 25% of the value of the Fund at market. All securities must be competitively bid and the most economically advantageous bid selected. Commissions paid for the purchase of securities must meet the prevailing best-execution rates.
Communication between the Board of Trustees and the Board Professionals is continuous. The Plan Custodian provides a monthly accounting statement that includes all receipts, disbursements, and the cost and market value of all assets. The Investment Manager provides written quarterly reports detailing the Fund’s performance, compliance, economic forecast, and portfolio analysis. The Plan Investment Monitor provides a written quarterly report of the relative and absolute performance of the Fund. The Board of Trustees meets on a quarterly basis to discuss the performance of the Fund, investment strategy, and any other pertinent matters.
43

Police Pension Investment Policy – The investment policy is maintained by the Pension Board of Trustees with the primary objective of preserving investment capital and the secondary objective of achieving moderate long-term growth while minimizing risk. The asset allocation, sector weightings, security selection, and investment style are at the sole discretion of the Investment Manager employed by the Board of Trustees. The fiduciary responsibility of the Board is to recognize that the retirement system provides income benefits to retired participants and beneficiaries on a long-term basis. The Board of Trustees shall comply with the fiduciary standards set forth in the Employee Retirement Income Security Act of 1974 (ERISA). This investment policy is intended to complement the investment guidelines provided in Chapter 185, Florida Statutes and the Local Ordinances.
Performance of the total Fund is measured for rolling three and five year periods to accommodate the market cycles experienced with investments. The Fund performance is compared to the return of a blended index of 45% Russell 3000, 15%, MSCI All Country World Index ex U.S., 25% Barclays Aggregate Bond Index, 5% Barclays Global Aggregate Index, 5% NFI Opened End Diversified Core Equity (ODCE), and 5% Consumer Price Index plus 5%. On a relative basis, the total return of combined equity, fixed income, and cash portfolio is expected to be in the top 40% of the appropriate peer universe. A further goal is to achieve an average annual rate of return greater than the absolute return of 7.5%, over the long term.
Authorized investments held in the Fund are limited to the following:
1. Equities must be traded on a national exchange or elections network. Not more than 5% of the Plan’s assets atthe time of purchase shall be invested in common stock, capital stock or convertible stock of any one issuingcompany, nor shall the aggregate investment in any one issuing company exceed 5% of the outstanding capitalstock of the company.
2. Fixed Income investments shall have a minimum rating of investment grade or higher as reported by a majorcredit rating service. The value of bonds issued by any single corporation shall not exceed 5% of the total bondportfolio.
3. Money Market Fund or Short-term Investment Fund (STIF) provided by the Plan’s custodian must be aminimum rating of Standard & Poor’s A1 or Moody’s P1.
4. Pooled investments may include, but are not limited to, mutual funds, commingled funds, exchange-tradedfunds, limited partnerships and private equity. In the event of investment by the Plan into a pooled fund, theBoard will adopt the prospectus or governing policy of that fund as the stated addendum to this InvestmentPolicy Statement.
5. Limitations include investments in corporate common stock, domestic and international, along with convertiblebonds shall not exceed 70% of the Plan assets at market, and foreign securities shall not exceed 25% of thePlan’s market value. All securities must be competitively bid and the most economically advantageous bidselected. Commissions paid for the purchase of securities must meet the prevailing best execution rates.
Communication between the Board of Trustees and the Board Professionals is continuous. The Plan Custodian provides a monthly accounting statement that includes all receipts, disbursements, and the cost and market value of all assets. The Investment Manager provides written quarterly reports detailing the Fund’s performance, compliance, economic forecast, and portfolio analysis. The Plan Investment Monitor provides a written quarterly report of the relative and absolute performance of the Fund. The Board of Trustees meets on a quarterly basis to discuss the performance of the Fund, investment strategy, and any other pertinent matters.
General Pension Investment Policy - The investment policy is maintained by the Pension Board of Trustees with the objective of obtaining a reasonable total rate of return commensurate with the Prudent Investor Rule. The asset allocation, sector weightings, security selection, and investment style are at the sole discretion of the Investment Manager employed by the Board of Trustees. The fiduciary responsibility of the Board is to recognize that the retirement system provides income benefits to retired participants and beneficiaries on a long-term basis. The Board of Trustees shall comply with the fiduciary standards set forth in the Employee Retirement Income Security Act of 1974 (ERISA).
Performance of the total Fund is measured for rolling three and five year periods to accommodate the market cycles experienced with investments. The Fund performance is compared to the return of a blended index of 50% Russell 3000, 10% MSCI All Country World Index ex U.S., 25% Barclays Capital U.S. Aggregate Bond Index, 5% Barclays Global Aggregate Index, 5% NFI Open End Diversified Core Equity (ODCE), and 5% Consumer Price Index plus 5%. On a relative basis, the total return of combined equity, fixed income, and cash portfolio is expected to be in the top 40% of the appropriate peer universe. On an absolute basis, the total return of the combined equity, fixed income, and cash portfolio is expected to equal or exceed the actuarial earnings assumption of 7%.
44
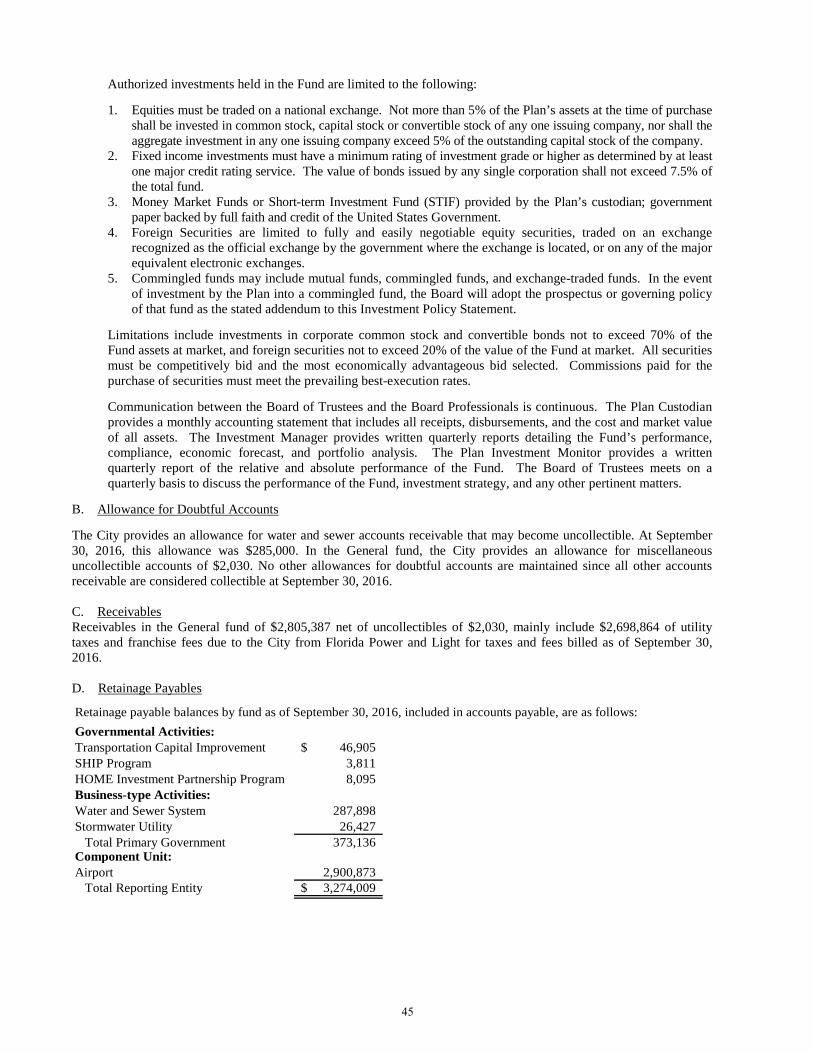
Authorized investments held in the Fund are limited to the following:
1. Equities must be traded on a national exchange. Not more than 5% of the Plan’s assets at the time of purchaseshall be invested in common stock, capital stock or convertible stock of any one issuing company, nor shall theaggregate investment in any one issuing company exceed 5% of the outstanding capital stock of the company.
2. Fixed income investments must have a minimum rating of investment grade or higher as determined by at leastone major credit rating service. The value of bonds issued by any single corporation shall not exceed 7.5% ofthe total fund.
3. Money Market Funds or Short-term Investment Fund (STIF) provided by the Plan’s custodian; governmentpaper backed by full faith and credit of the United States Government.
4. Foreign Securities are limited to fully and easily negotiable equity securities, traded on an exchangerecognized as the official exchange by the government where the exchange is located, or on any of the majorequivalent electronic exchanges.
5. Commingled funds may include mutual funds, commingled funds, and exchange-traded funds. In the eventof investment by the Plan into a commingled fund, the Board will adopt the prospectus or governing policyof that fund as the stated addendum to this Investment Policy Statement.
Limitations include investments in corporate common stock and convertible bonds not to exceed 70% of the Fund assets at market, and foreign securities not to exceed 20% of the value of the Fund at market. All securities must be competitively bid and the most economically advantageous bid selected. Commissions paid for the purchase of securities must meet the prevailing best-execution rates.
Communication between the Board of Trustees and the Board Professionals is continuous. The Plan Custodian provides a monthly accounting statement that includes all receipts, disbursements, and the cost and market value of all assets. The Investment Manager provides written quarterly reports detailing the Fund’s performance, compliance, economic forecast, and portfolio analysis. The Plan Investment Monitor provides a written quarterly report of the relative and absolute performance of the Fund. The Board of Trustees meets on a quarterly basis to discuss the performance of the Fund, investment strategy, and any other pertinent matters.
B. Allowance for Doubtful Accounts
The City provides an allowance for water and sewer accounts receivable that may become uncollectible. At September 30, 2016, this allowance was $285,000. In the General fund, the City provides an allowance for miscellaneous uncollectible accounts of $2,030. No other allowances for doubtful accounts are maintained since all other accounts receivable are considered collectible at September 30, 2016.
C. ReceivablesReceivables in the General fund of $2,805,387 net of uncollectibles of $2,030, mainly include $2,698,864 of utility taxes and franchise fees due to the City from Florida Power and Light for taxes and fees billed as of September 30, 2016.
D. Retainage Payables
Retainage payable balances by fund as of September 30, 2016, included in accounts payable, are as follows:Governmental Activities:Transportation Capital Improvement 46,905$ SHIP Program 3,811 HOME Investment Partnership Program 8,095
Water and Sewer System 287,898 Stormwater Utility 26,427 Total Primary Government 373,136 Component Unit:Airport 2,900,873 Total Reporting Entity 3,274,009$
Business-type Activities:
45

E. Capital Assets
Capital asset activity for the year ended September 30, 2016 was as follows:
Primary Government Balance BalanceGovernmental Activities: October 1, September 30,
2015 Additions Deletions 2016Capital assets, not being depreciated/amortized: Land and intangible land rights 25,439,286$ (1) 284,242$ 14,984$ 25,708,544$ Construction in progress 1,763,276 2,518,749 1,633,549 2,648,476 Total capital assets, not being depreciated/amortized 27,202,562 2,802,991 1,648,533 28,357,020
Capital assets, being depreciated/amortized: Buildings 34,108,428 - 79,947 34,028,481 Improvements other than buildings 13,099,625 112,938 - 13,212,563 Machinery and equipment 24,096,928 (2) 3,151,538 1,648,201 25,600,265 Intangibles 1,697,077 144,059 - 1,841,136 Infrastructure 135,583,347 681,621 - 136,264,968 Total capital assets, being depreciated/amortized 208,585,405 4,090,156 1,728,148 210,947,413
Less accumulated depreciation/amortization for: Buildings 13,600,891 824,650 43,499 14,382,042 Improvements other than buildings 8,525,623 694,635 - 9,220,258 Machinery and equipment 18,963,621 1,604,666 1,585,748 18,982,539 Intangibles 1,322,103 100,641 - 1,422,744 Infrastructure 100,391,412 3,328,426 - 103,719,838 Total accumulated depreciation/amortization 142,803,650 6,553,018 (3) 1,629,247 147,727,421 Total capital assets, being depreciated/amortized, net 65,781,755 (2,462,862) 98,901 63,219,992
Governmental activities capital assets, net 92,984,317$ 340,129$ 1,747,434$ 91,577,012$
Business-type Activities: Balance BalanceOctober 1, September 30,
2015 Additions Deletions 2016Capital assets, not being depreciated:Land 4,390,550$ 319,228$ -$ 4,709,778$ Construction in progress 10,904,387 13,063,663 8,660,233 15,307,817 Total capital assets, not being depreciated/amortized 15,294,937 13,382,891 8,660,233 20,017,595 Capital assets, being depreciated/amortized:Buildings 81,992,247 288,965 - 82,281,212 Improvements other than buildings 254,688,778 7,726,084 - 262,414,862 Machinery and equipment 16,535,864 2,416,651 687,401 18,265,114 Intangibles, computer software 453,916 - 50,405 403,511 Total capital assets, being depreciated/amortized 353,670,805 10,431,700 737,806 363,364,699
46

Balance BalanceOctober 1, September 30,
2015 Additions Deletions 2016Less accumulated depreciation/amortization for:Buildings 53,706,372 1,284,462 - 54,990,834 Improvements other than buildings 140,101,514 8,420,564 - 148,522,078 Machinery and equipment 14,230,952 808,429 642,685 14,396,696 Intangibles, computer software 385,214 37,970 50,405 372,779 Total accumulated depreciation/amortization 208,424,052 10,551,425 693,090 218,282,387 Total capital assets, being depreciated/amortized, net 145,246,753 (119,725) 44,716 145,082,312 Business-type activities capital assets, net 160,541,690$ 13,263,166$ 8,704,949$ 165,099,907$
Component Unit: Balance BalanceOctober 1, September 30,
2015 Additions Deletions 2016Capital assets, not being depreciated:Land 6,746,824$ 152,355$ -$ 6,899,179$ Construction in progress 11,514,654 49,375,295 1,343,951 59,545,998 Total capital assets, not being depreciated/amortized 18,261,478 49,527,650 1,343,951 66,445,177 Capital assets, being depreciated/amortized:Buildings 66,412,930 121,260 - 66,534,190 Improvements other than buildings 72,447,432 218,094 246,000 72,419,526 Machinery and equipment 9,782,817 1,058,702 478,015 10,363,504 Intangibles, computer software 241,825 - - 241,825 Total capital assets, being depreciated/amortized 148,885,004 1,398,056 724,015 149,559,045 Less accumulated depreciation/amortization for:Buildings 31,588,727 1,645,793 - 33,234,520 Improvements other than buildings 38,758,819 2,477,943 237,800 40,998,962 Machinery and equipment 7,951,797 458,473 477,459 7,932,811 Intangibles, computer software 197,275 35,640 - 232,915 Total accumulated depreciation/amortization 78,496,618 4,617,849 715,259 82,399,208 Total capital assets, being depreciated/amortized, net 70,388,386 (3,219,793) 8,756 67,159,837
Component unit capital assets, net 88,649,864$ 46,307,857$ 1,352,707$ 133,605,014$
47
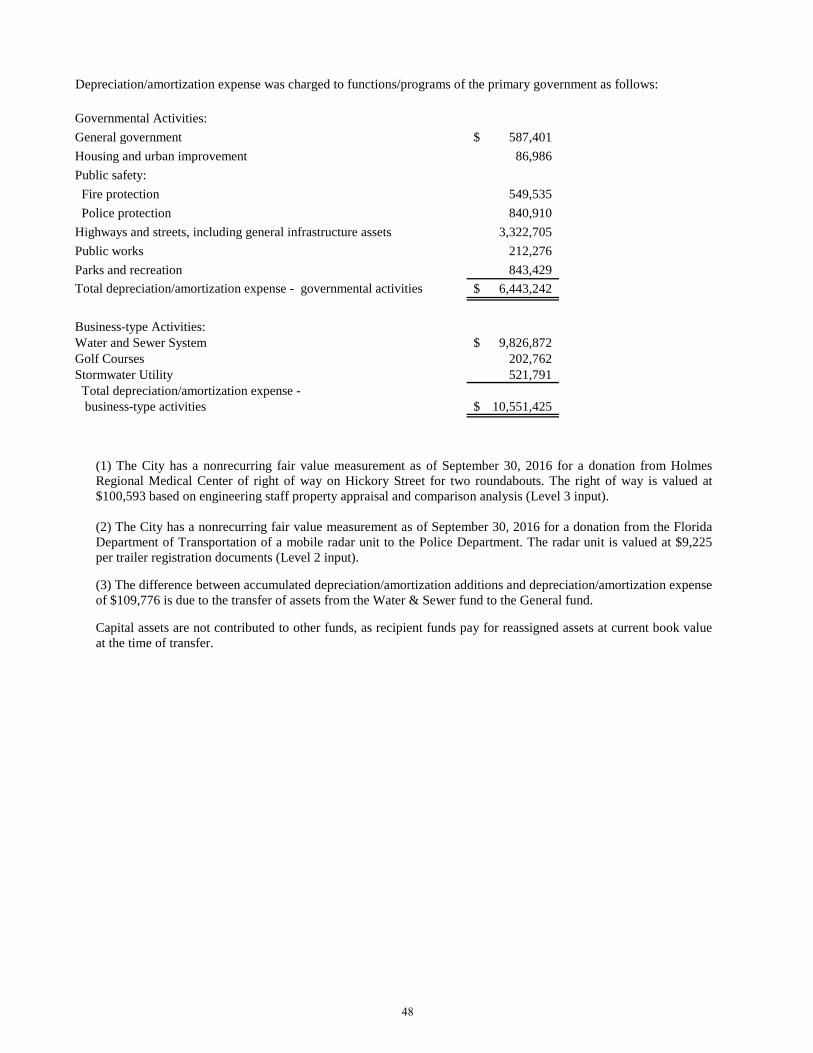
Depreciation/amortization expense was charged to functions/programs of the primary government as follows:
Governmental Activities:General government 587,401$ Housing and urban improvement 86,986 Public safety: Fire protection 549,535 Police protection 840,910 Highways and streets, including general infrastructure assets 3,322,705 Public works 212,276 Parks and recreation 843,429
6,443,242$
Business-type Activities:Water and Sewer System 9,826,872$ Golf Courses 202,762 Stormwater Utility 521,791 Total depreciation/amortization expense - business-type activities 10,551,425$
Total depreciation/amortization expense - governmental activities
(1) The City has a nonrecurring fair value measurement as of September 30, 2016 for a donation from Holmes Regional Medical Center of right of way on Hickory Street for two roundabouts. The right of way is valued at $100,593 based on engineering staff property appraisal and comparison analysis (Level 3 input).
(2) The City has a nonrecurring fair value measurement as of September 30, 2016 for a donation from the Florida Department of Transportation of a mobile radar unit to the Police Department. The radar unit is valued at $9,225 per trailer registration documents (Level 2 input).
(3) The difference between accumulated depreciation/amortization additions and depreciation/amortization expense of $109,776 is due to the transfer of assets from the Water & Sewer fund to the General fund.
Capital assets are not contributed to other funds, as recipient funds pay for reassigned assets at current book value at the time of transfer.
48

F. Construction and Other Significant Commitments
Construction Commitments
The Reporting Entity’s construction and other significant commitments at September 30, 2016 are summarized below by fund.
Community Development Block GrantBrothers Park Improvement 155,249$
Babcok Façade Improvement Program 40,639 Time and Attendance Software 31,430
Recreation ImprovementRiverview Park Improvements 186,332
FY16 Resurfacing Program 1,401,208 FY15 Resurfacing Program 1,108,739
289,276 Miscellaneous Pipe Lining 150,000 Lake Washington/Stewart Mast Arms 130,790
3,434
625,461 354,201
and Autumn Woods Drive 268,903 Install Generator and Fuel Tank at Production Well #4 190,969
797,736 Install South Croton Baffle Box 499,199 Florida Avenue at Southeast Park Drainage Improvements 336,152 West Eau Gallie Basin 250,000
6,819,718
Design and Construct Aviation Facilities 3,919,867 Relocate Grumman Lane 918,818 Air Traffic Control Tower Construction 82,860
Total Component Unit 4,921,545 11,741,263$ Total Reporting Entity
Replace Reclaimed Water Transmission Main at Eau Gallie River Crossing
Component Unit: Airport
Business-type Activities: Water and Sewer System
Total Primary Government
Construct Hibiscus Booster Pump Station Fill Water Main and Valve
Install Second Generation Baffle Boxes through out the City Stormwater Utility
Convert RO Booster Pump to Variable Frequency Drives
Transportation Capital Improvement
FY14 Resurfacing Program
Hibiscus/Hickory Mast Arms
Governmental Activities:
General Construction
49
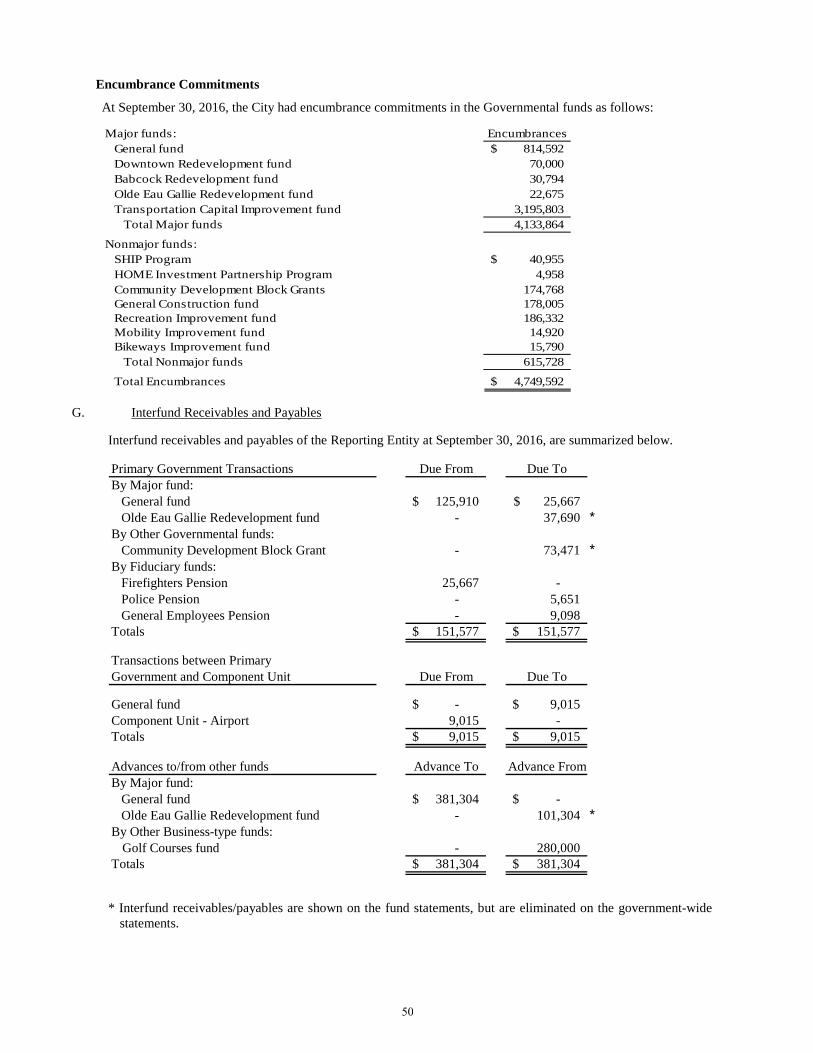
Encumbrance Commitments
At September 30, 2016, the City had encumbrance commitments in the Governmental funds as follows:
Major funds: Encumbrances General fund 814,592$
Downtown Redevelopment fund 70,000 Babcock Redevelopment fund 30,794
Olde Eau Gallie Redevelopment fund 22,675 Transportation Capital Improvement fund 3,195,803 Total Major funds 4,133,864
Nonmajor funds:SHIP Program 40,955$
HOME Investment Partnership Program 4,958 Community Development Block Grants 174,768
General Construction fund 178,005 Recreation Improvement fund 186,332 Mobility Improvement fund 14,920 Bikeways Improvement fund 15,790
Total Nonmajor funds 615,728
Total Encumbrances 4,749,592$
G. Interfund Receivables and Payables
Interfund receivables and payables of the Reporting Entity at September 30, 2016, are summarized below.
Due From Due To
125,910$ 25,667$ - 37,690 *
- 73,471 *
25,667 - - 5,651 - 9,098
151,577$ 151,577$
Due From Due To
-$ 9,015$ 9,015 - 9,015$ 9,015$
Advance To Advance From
381,304$ -$ - 101,304 *
By Other Business-type funds:Golf Courses fund - 280,000
381,304$ 381,304$
By Major fund: General fund
Totals
Olde Eau Gallie Redevelopment fund
Component Unit - AirportTotals
Police Pension
Advances to/from other funds
Transactions between PrimaryGovernment and Component Unit
General fund
Totals
Community Development Block Grant
General Employees Pension
Primary Government TransactionsBy Major fund: General fund
By Other Governmental funds:
By Fiduciary funds:
Olde Eau Gallie Redevelopment fund
Firefighters Pension
* Interfund receivables/payables are shown on the fund statements, but are eliminated on the government-widestatements.
50

All interfund receivables and payables within the primary government represent cash transfers for operating purposes and amounts expected to be repaid within one year. Advances represent the non-current portion of interfund loans. Amounts advanced to the Olde Eau Gallie Redevelopment fund in 2002 were to finance the purchase of land and will be repaid by 2019. Additional advances to the Olde Eau Gallie Redevelopment fund in 2010 were to finance the purchase of land to use for parking and will be repaid by 2020. Amounts advanced to the Golf Courses fund were to finance the payment of FRS contributions and penalties incurred due to a reclassification of former Golf Course fund employees, and will be repaid as funds become available.
H. Interfund Transactions
There are two types of interfund transactions and transfers that are reported as interfund items between the funds:
(1) Interfund services provided and used represent sales and purchases of goods and services between funds for a price approximating their external exchange value. Interfund services provided and used are reported as revenues in seller funds and expenditures or expenses in purchaser funds.
(2) Nonreciprocal interfund activity is the internal counterpart to nonexchange transactions. It includes:
(a) Interfund transfers for flows of assets (such as cash or goods) without equivalent flows of assets in return and without a requirement for repayment. Transfers are used to (1) move revenues from the fund that state law requires to collect them to the fund that state law requires to expend them, (2) provide matching funds for grants, and (3) provide unrestricted general fund revenues to finance transportation activities which must be accounted for in another fund.
(b) Interfund reimbursements for repayments from the funds responsible for particular expenditures or expenses to the funds that initially paid for them. Reimbursements are not displayed in the financial statements.
All other transfers are included in the results of operations for both Governmental and Proprietary fund statements. Interfund transfers at September 30, 2016 are summarized as follows:
Transfer out: General Fund Total
General fund -$ 2,460,092$ 19,416$ 300,000$ 2,779,508$ Downtown Redevelopment - - 40,000 - 40,000 Babcock Street Redevelopment - - 250,000 - 250,000 Transportation Capital Improvement - - 26,949 112,510 139,459 Nonmajor Governmental funds 177,689 - 157,489 - 335,178 Water and Sewer System 3,062,937 - - - 3,062,937 Total Transfers out 3,240,626$ 2,460,092$ 493,854$ 412,510$ 6,607,082$
Transfer in:Nonmajor Business-
type
Transportation Capital
ImprovementNonmajor
Governmental
Significant transfers included $2,460,092 from General fund to the Transportation fund to fund various projects; $300,000 from the General fund to the Golf Courses fund to cover operating deficiencies; The CDBG fund transferred $156,177 to the Recreation Improvement fund for playground equipment; $3,062,937 from the Water and Sewer fund to the General fund for the rate of return per Resolution No. 3510.
51

I. Leases
1. Capital Leases
Governmental Activities:
The General fund is the lessee of four capital leases for the acquisition of 5 police vehicles, 55 police radios, a fire truck and 100 police in-car video systems. Future minimum payments on these leases are:
243,242$ 222,834
2019 71,982 2020 71,982 2021 71,982 2022-2024 173,957
855,979 (73,010) 782,969$
Total minimum lease payments
Year ending September 30,
Less amount representing interestPresent value of net minimum lease payments
20182017
Business-Type Activities:
The Golf Course fund is the lessee of two capital leases for the acquisition of golf carts and maintenance equipment. Future minimum payments on these leases are:
Year Ending September 30,2017 170,664$ 2018 143,058 2019 143,058 2020 122,658 Total Minimum lease payments 579,438 Less amount representing interest (28,374) Present value of net minimum lease payments 551,064$
The assets acquired through capital leases are as follows:
Governmental Activities
Business-Type Activities
Machinery and equipment 1,807,158$ 684,864$ Intangible computer software 83,811 - Less accumulated depreciation/amortization (742,111) (145,856) Net property, plant, and equipment 1,148,858$ 539,008$
52
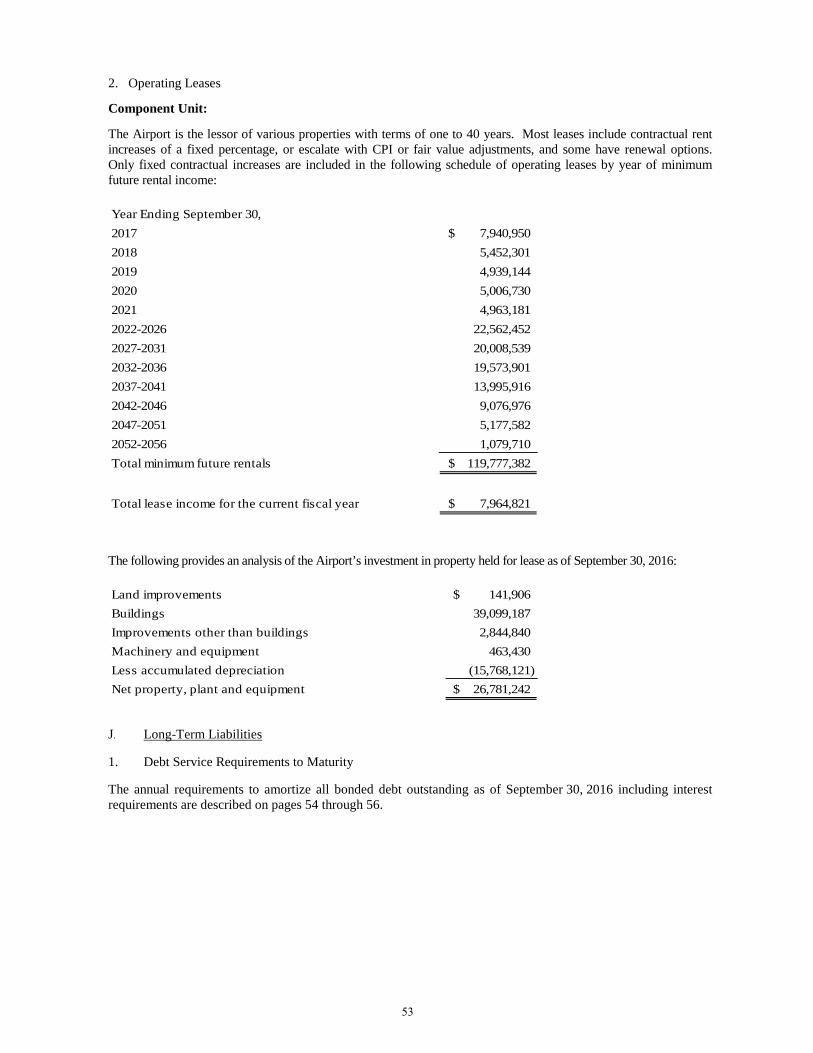
2. Operating Leases
Component Unit:
The Airport is the lessor of various properties with terms of one to 40 years. Most leases include contractual rent increases of a fixed percentage, or escalate with CPI or fair value adjustments, and some have renewal options. Only fixed contractual increases are included in the following schedule of operating leases by year of minimum future rental income:
Year Ending September 30,2017 7,940,950$ 2018 5,452,301 2019 4,939,144 2020 5,006,730 2021 4,963,181 2022-2026 22,562,452 2027-2031 20,008,539 2032-2036 19,573,901 2037-2041 13,995,916 2042-2046 9,076,976 2047-2051 5,177,582 2052-2056 1,079,710 Total minimum future rentals 119,777,382$
Total lease income for the current fiscal year 7,964,821$
The following provides an analysis of the Airport’s investment in property held for lease as of September 30, 2016:
Land improvements 141,906$ Buildings 39,099,187 Improvements other than buildings 2,844,840 Machinery and equipment 463,430 Less accumulated depreciation (15,768,121) Net property, plant and equipment 26,781,242$
J. Long-Term Liabilities
1. Debt Service Requirements to Maturity
The annual requirements to amortize all bonded debt outstanding as of September 30, 2016 including interest requirements are described on pages 54 through 56.
53
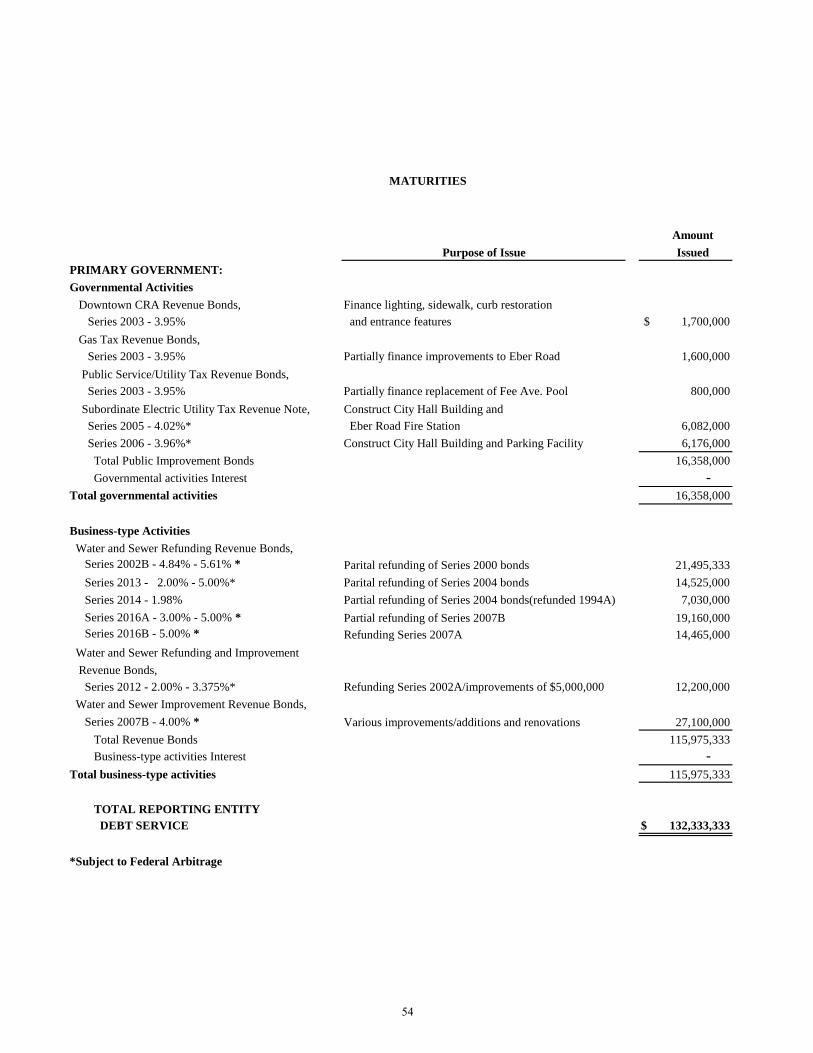
MATURITIES
AmountPurpose of Issue Issued
PRIMARY GOVERNMENT:Governmental Activities Downtown CRA Revenue Bonds, Finance lighting, sidewalk, curb restoration Series 2003 - 3.95% and entrance features $ 1,700,000 Gas Tax Revenue Bonds, Series 2003 - 3.95% Partially finance improvements to Eber Road 1,600,000 Public Service/Utility Tax Revenue Bonds, Series 2003 - 3.95% Partially finance replacement of Fee Ave. Pool 800,000 Subordinate Electric Utility Tax Revenue Note, Construct City Hall Building and Series 2005 - 4.02%* Eber Road Fire Station 6,082,000 Series 2006 - 3.96%* Construct City Hall Building and Parking Facility 6,176,000 Total Public Improvement Bonds 16,358,000 Governmental activities Interest - Total governmental activities 16,358,000
Business-type Activities Water and Sewer Refunding Revenue Bonds, Series 2002B - 4.84% - 5.61% * Parital refunding of Series 2000 bonds 21,495,333 Series 2013 - 2.00% - 5.00%* Parital refunding of Series 2004 bonds 14,525,000 Series 2014 - 1.98% Partial refunding of Series 2004 bonds(refunded 1994A) 7,030,000 Series 2016A - 3.00% - 5.00% * Partial refunding of Series 2007B 19,160,000 Series 2016B - 5.00% * Refunding Series 2007A 14,465,000 Water and Sewer Refunding and Improvement Revenue Bonds, Series 2012 - 2.00% - 3.375%* Refunding Series 2002A/improvements of $5,000,000 12,200,000 Water and Sewer Improvement Revenue Bonds, Series 2007B - 4.00% * Various improvements/additions and renovations 27,100,000 Total Revenue Bonds 115,975,333 Business-type activities Interest - Total business-type activities 115,975,333
TOTAL REPORTING ENTITY DEBT SERVICE $ 132,333,333
*Subject to Federal Arbitrage
54

MATURITIES
AmountOutstanding 2017 2018 2019 2020 2021
$ 423,230 $ 135,648 $ 141,006 $ 146,576 $ - $ -
398,335 127,669 132,712 137,954 - -
176,976 63,834 66,356 46,786 - -
3,637,000 303,000 315,000 327,000 341,000 354,0003,983,000 296,000 308,000 320,000 332,000 346,0008,618,541 926,151 963,074 978,316 673,000 700,0001,785,863 331,425 294,122 255,351 215,927 188,533
10,404,404 1,257,576 1,257,196 1,233,667 888,927 888,533
32,270,190 3,455,000 3,450,000 3,450,000 3,445,000 3,445,00014,010,000 530,000 555,000 570,000 590,000 610,000
5,390,000 - 850,000 870,000 890,000 905,00019,160,000 - - 590,000 620,000 645,00014,465,000 - - - - -
8,735,000 205,000 210,000 215,000 220,000 230,000
1,345,000 660,000 685,000 - - - 95,375,190 4,850,000 5,750,000 5,695,000 5,765,000 5,835,00040,989,936 2,301,581 2,482,838 2,415,185 2,341,711 2,264,616
136,365,126 7,151,581 8,232,838 8,110,185 8,106,711 8,099,616
$ 146,769,530 $ 8,409,157 $ 9,490,034 $ 9,343,852 $ 8,995,638 $ 8,988,149
55
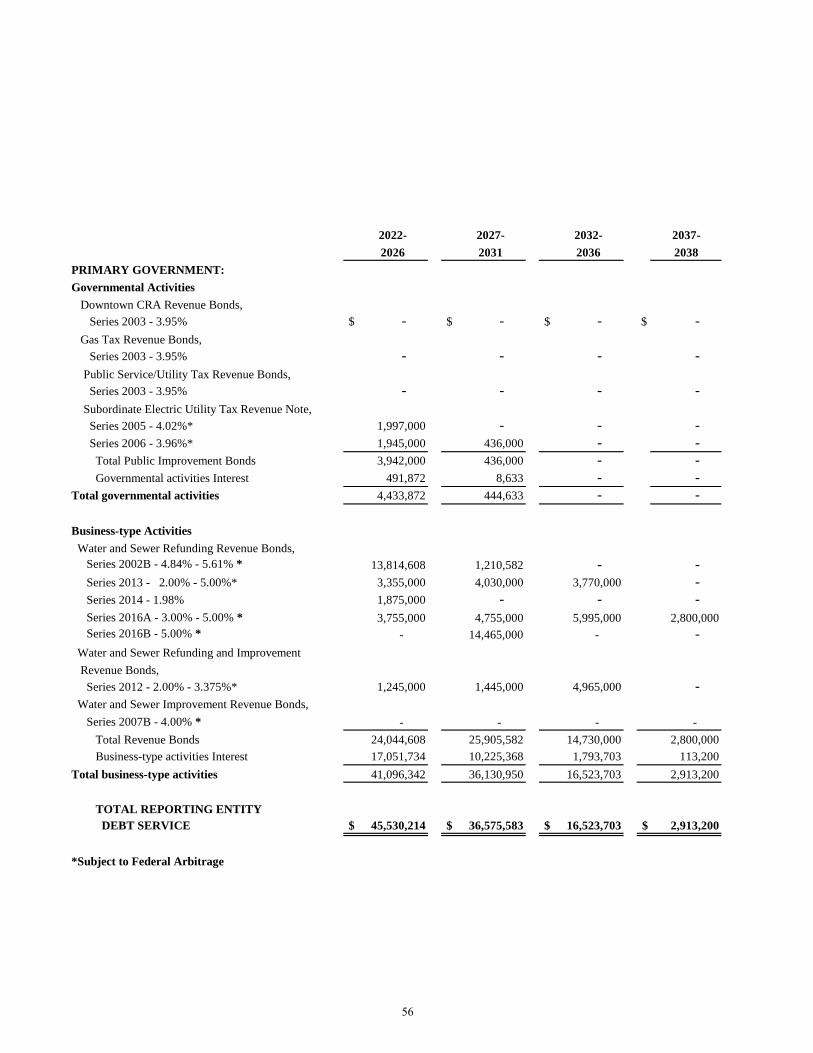
PRIMARY GOVERNMENT:Governmental Activities Downtown CRA Revenue Bonds, Series 2003 - 3.95% Gas Tax Revenue Bonds, Series 2003 - 3.95% Public Service/Utility Tax Revenue Bonds, Series 2003 - 3.95% Subordinate Electric Utility Tax Revenue Note, Series 2005 - 4.02%* Series 2006 - 3.96%* Total Public Improvement Bonds Governmental activities InterestTotal governmental activities
Business-type Activities Water and Sewer Refunding Revenue Bonds, Series 2002B - 4.84% - 5.61% * Series 2013 - 2.00% - 5.00%* Series 2014 - 1.98% Series 2016A - 3.00% - 5.00% * Series 2016B - 5.00% * Water and Sewer Refunding and Improvement Revenue Bonds, Series 2012 - 2.00% - 3.375%* Water and Sewer Improvement Revenue Bonds, Series 2007B - 4.00% * Total Revenue Bonds Business-type activities InterestTotal business-type activities
TOTAL REPORTING ENTITY DEBT SERVICE
*Subject to Federal Arbitrage
2022- 2027- 2032- 2037-2026 2031 2036 2038
$ - $ - $ - $ -
- - - -
- - - -
1,997,000 - - - 1,945,000 436,000 - - 3,942,000 436,000 - -
491,872 8,633 - - 4,433,872 444,633 - -
13,814,608 1,210,582 - - 3,355,000 4,030,000 3,770,000 - 1,875,000 - - - 3,755,000 4,755,000 5,995,000 2,800,000
- 14,465,000 - -
1,245,000 1,445,000 4,965,000 -
- - - - 24,044,608 25,905,582 14,730,000 2,800,00017,051,734 10,225,368 1,793,703 113,20041,096,342 36,130,950 16,523,703 2,913,200
$ 45,530,214 $ 36,575,583 $ 16,523,703 $ 2,913,200
56

2. Revenue Bonds
Revenue bonds are secured by and payable from the gross revenues of the respective funds which issued them. The proceeds of these issues were for capital improvements and refunding certain outstanding issues of the funds.
The resolutions applicable to the revenue bonds established various requirements for deposits to the sinking fund and reserve accounts applicable to the particular bond issues. The provisions require either (1) monthly sinking fund contributions for current debt service of one-twelfth and one-sixth of the next maturing principal and interest payment, respectively, or (2) an annual bucket approach where all receipts are deposited into a sinking fund until the funds therein are sufficient to meet the maturing principal and interest payments. In addition, certain reserves for future debt service requirements (generally the largest principal and interest payment due in any succeeding year) must be maintained.
The following two rate covenant commitments are required with regard to the Water and Sewer Revenue bonds:
(a) The gross revenues to be received in each bond year shall be at least equal to the sum of one hundred percent (100%) of the sum of the cost of operation and maintenance for such bond year plus the bond service requirement for the bonds in such bond year; and
(b) The sum of the gross revenues and the available impact fees to be received in each bond year shall be at least equal to the sum of one hundred percent (100%) of the cost of operation and maintenance for such bond year, and one hundred fifteen percent (115%) of the bond service requirement for the bonds in such bond year.
These requirements have been met for the City as of September 30, 2016.
Ordinance No. 2012-37 has amended the debt service reserve requirements to provide the City the flexibility to fund the debt service reserve fund at $0 for all revenue bonds issued after October 9, 2012. The remaining bonds issued prior to 2012 have a debt service reserve requirement of $4,645,375.
3. Pledged Revenues
Information on pledged revenues and principal and interest payments are as follows:
Pledged Revenue TermFuture Principal
and Interest
Current Pledged Revenue
Current Principal and
Interest
Current Percentage of Revenue
Governmental Activities:Public Service Utility Tax 2019 190,284$ 7,853,722$ 70,825$ 0.90%Electric Utility Tax 2026 9,326,813 7,488,265 891,426 11.90%Gas Tax 2019 430,210 2,926,058 143,403 4.90%Downtown CRA 2019 457,097 1,054,035 152,351 14.45%Total governmental activities 10,404,404$ 19,322,080$ 1,258,005$
Business-type Activities:Water and Sewer net revenues 2038 136,365,126$ 26,291,128$ 8,455,716$ 32.16%Total business-type activities 136,365,126$ 26,291,128$ 8,455,716$
4. New Bond Issues
On March 30, 2016 the City issued Water and Sewer Refunding and Improvement Revenue Bonds, Series 2016A in the principal amount of $19,160,000. These bonds were sold to refund $21,795,000 of the City’s outstanding Water and Sewer Refunding and Improvement Revenue Bonds, Series 2007B. The difference in cash flows required to service the old debt and required to service the new debt is a decrease of $2,960,274. The economic gain resulting from the refunding is $2,051,343.
57
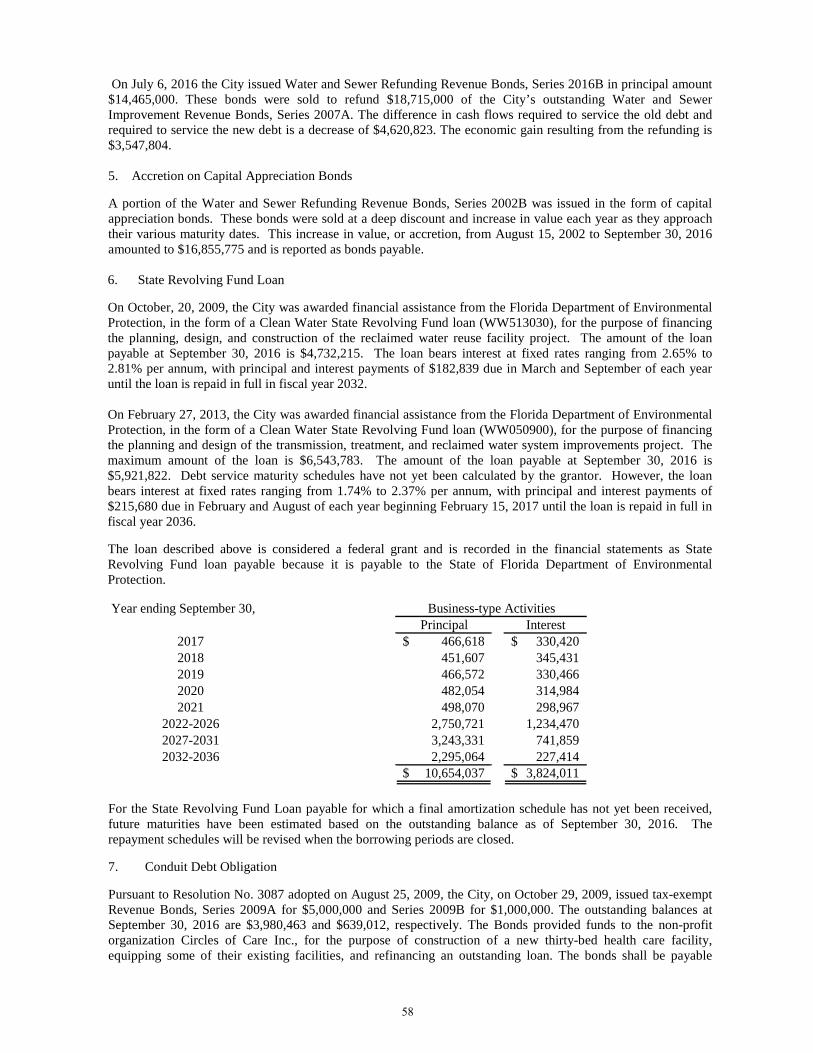
On July 6, 2016 the City issued Water and Sewer Refunding Revenue Bonds, Series 2016B in principal amount $14,465,000. These bonds were sold to refund $18,715,000 of the City’s outstanding Water and Sewer Improvement Revenue Bonds, Series 2007A. The difference in cash flows required to service the old debt and required to service the new debt is a decrease of $4,620,823. The economic gain resulting from the refunding is $3,547,804.
5. Accretion on Capital Appreciation Bonds
A portion of the Water and Sewer Refunding Revenue Bonds, Series 2002B was issued in the form of capital appreciation bonds. These bonds were sold at a deep discount and increase in value each year as they approach their various maturity dates. This increase in value, or accretion, from August 15, 2002 to September 30, 2016 amounted to $16,855,775 and is reported as bonds payable.
6. State Revolving Fund Loan
On October, 20, 2009, the City was awarded financial assistance from the Florida Department of Environmental Protection, in the form of a Clean Water State Revolving Fund loan (WW513030), for the purpose of financing the planning, design, and construction of the reclaimed water reuse facility project. The amount of the loan payable at September 30, 2016 is $4,732,215. The loan bears interest at fixed rates ranging from 2.65% to 2.81% per annum, with principal and interest payments of $182,839 due in March and September of each year until the loan is repaid in full in fiscal year 2032.
On February 27, 2013, the City was awarded financial assistance from the Florida Department of Environmental Protection, in the form of a Clean Water State Revolving Fund loan (WW050900), for the purpose of financing the planning and design of the transmission, treatment, and reclaimed water system improvements project. The maximum amount of the loan is $6,543,783. The amount of the loan payable at September 30, 2016 is $5,921,822. Debt service maturity schedules have not yet been calculated by the grantor. However, the loan bears interest at fixed rates ranging from 1.74% to 2.37% per annum, with principal and interest payments of $215,680 due in February and August of each year beginning February 15, 2017 until the loan is repaid in full in fiscal year 2036.
The loan described above is considered a federal grant and is recorded in the financial statements as State Revolving Fund loan payable because it is payable to the State of Florida Department of Environmental Protection.
Year ending September 30,Principal Interest
2017 466,618$ 330,420$ 2018 451,607 345,431 2019 466,572 330,466 2020 482,054 314,984 2021 498,070 298,967
2022-2026 2,750,721 1,234,470 2027-2031 3,243,331 741,859 2032-2036 2,295,064 227,414
10,654,037$ 3,824,011$
Business-type Activities
For the State Revolving Fund Loan payable for which a final amortization schedule has not yet been received, future maturities have been estimated based on the outstanding balance as of September 30, 2016. The repayment schedules will be revised when the borrowing periods are closed.
7. Conduit Debt Obligation
Pursuant to Resolution No. 3087 adopted on August 25, 2009, the City, on October 29, 2009, issued tax-exempt Revenue Bonds, Series 2009A for $5,000,000 and Series 2009B for $1,000,000. The outstanding balances at September 30, 2016 are $3,980,463 and $639,012, respectively. The Bonds provided funds to the non-profit organization Circles of Care Inc., for the purpose of construction of a new thirty-bed health care facility, equipping some of their existing facilities, and refinancing an outstanding loan. The bonds shall be payable
58
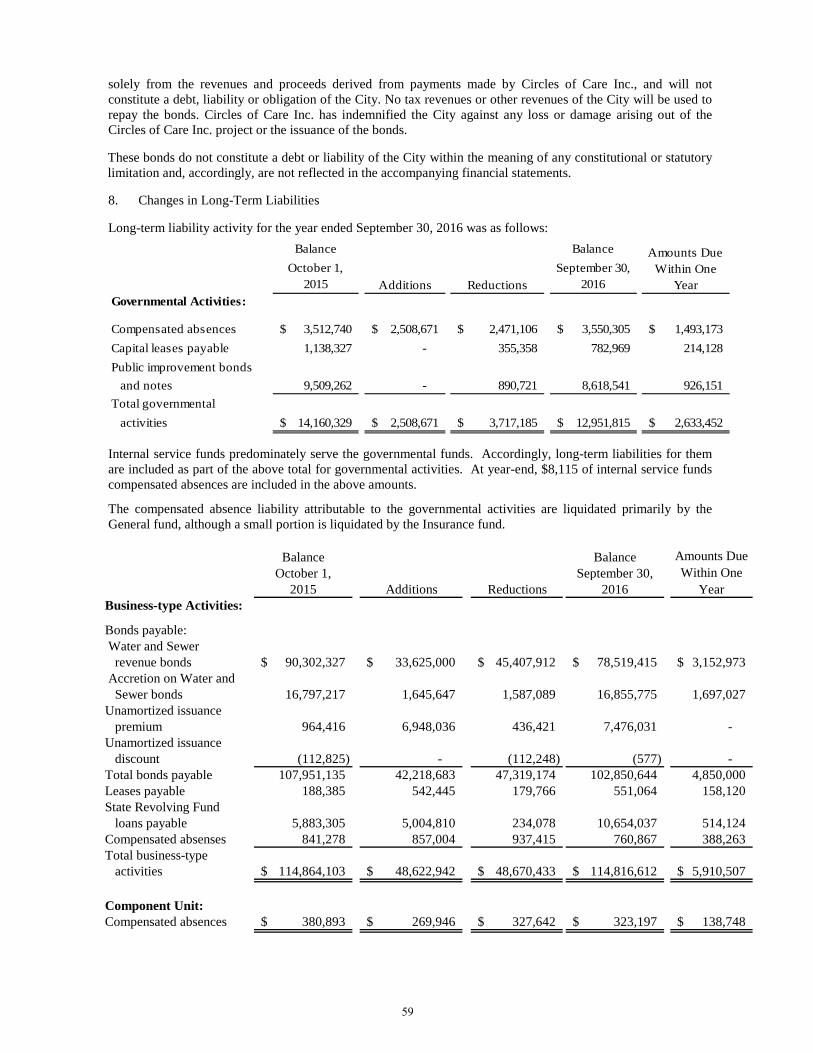
solely from the revenues and proceeds derived from payments made by Circles of Care Inc., and will not constitute a debt, liability or obligation of the City. No tax revenues or other revenues of the City will be used to repay the bonds. Circles of Care Inc. has indemnified the City against any loss or damage arising out of the Circles of Care Inc. project or the issuance of the bonds.
These bonds do not constitute a debt or liability of the City within the meaning of any constitutional or statutory limitation and, accordingly, are not reflected in the accompanying financial statements.
8. Changes in Long-Term Liabilities
Long-term liability activity for the year ended September 30, 2016 was as follows:
Balance Balance October 1, September 30,
2015 Additions Reductions 2016Governmental Activities:
Compensated absences 3,512,740$ 2,508,671$ 2,471,106$ 3,550,305$ 1,493,173$ Capital leases payable 1,138,327 - 355,358 782,969 214,128 Public improvement bonds and notes 9,509,262 - 890,721 8,618,541 926,151 Total governmental activities 14,160,329$ 2,508,671$ 3,717,185$ 12,951,815$ 2,633,452$
Amounts Due Within One
Year
Internal service funds predominately serve the governmental funds. Accordingly, long-term liabilities for them are included as part of the above total for governmental activities. At year-end, $8,115 of internal service funds compensated absences are included in the above amounts.
The compensated absence liability attributable to the governmental activities are liquidated primarily by the General fund, although a small portion is liquidated by the Insurance fund.
Balance Balance October 1, September 30,
2015 Additions Reductions 2016Business-type Activities:
Bonds payable: Water and Sewer revenue bonds 90,302,327$ 33,625,000$ 45,407,912$ 78,519,415$ 3,152,973$ Accretion on Water and Sewer bonds 16,797,217 1,645,647 1,587,089 16,855,775 1,697,027 Unamortized issuance
premium 964,416 6,948,036 436,421 7,476,031 - Unamortized issuance
discount (112,825) - (112,248) (577) - Total bonds payable 107,951,135 42,218,683 47,319,174 102,850,644 4,850,000 Leases payable 188,385 542,445 179,766 551,064 158,120 State Revolving Fund
loans payable 5,883,305 5,004,810 234,078 10,654,037 514,124 Compensated absenses 841,278 857,004 937,415 760,867 388,263 Total business-type activities 114,864,103$ 48,622,942$ 48,670,433$ 114,816,612$ 5,910,507$
Component Unit:Compensated absences 380,893$ 269,946$ 327,642$ 323,197$ 138,748$
Amounts Due Within One
Year
59

(5) RESTRICTED ASSETS
The balance of the restricted assets in the Water & Sewer System fund is as follows:
Customer deposits 3,738,391$ Interest receivable 1,662 Water impact fees 684 Sewer impact fees 278,109 Wastewater capital recovery 612,556 State Revolving Fund current debt service 102,598 Revenue bonds current debt service 5,897,468 Revenue bonds future debt service 4,599,553 2007B Reserve 45,822 Revenue bonds renewal and replacement 250,000 Total restricted assets 15,526,843$
(6) OTHER INFORMATION
A. Risk Management
Insurance - The City is exposed to various risks of loss related to torts; theft of or damage to and destruction of assets; errors and omissions; and natural disasters. The City purchases commercial insurance with various deductibles for different types of losses. The costs for this insurance program are accounted for in the Insurance Internal Service fund. Settled claims have not exceeded this commercial coverage in the past three fiscal years. All applicable funds and component units participate in the general property and liability insurance program and make payments to the Insurance fund based on estimates of the amounts needed to pay insurance premiums and claims and to accumulate funds for financial stability. The excess accumulated funds over claims liability was $1,711,409 at September 30, 2016. The Airport also purchased additional insurance not covered by these programs, which is accounted for in the Airport fund.
The General Property and Liability claims liability at September 30, 2016 is $849,666 and is based on the requirements of GASB Statement No. 10, Accounting and Financial Reporting for Risk Financing and Related Insurance Issues, which requires a liability for claims be reported if information prior to the issuance of the financial statements indicates that it is probable that a liability has been incurred at the date of the financial statements and the amount of the loss can be reasonably estimated. To estimate this liability the incurred but not reported (IBNR) factors are applied to trended claims history. General Property and Liability claims at September 30, 2015 and 2016 are summarized below:
Fiscal Year
Claims Liability
October 1,
Current Year Claims and Changes in Estimates Payments
Claims Liability
September 30, Due Within One Year
2014-2015 $ 614,753 $ 227,279 $ 181,842 $ 660,190 $ 302,413 2015-2016 660,190 356,794 167,318 849,666 527,526
Workers Compensation - The City is exposed to risk of loss related to injuries to employees. The City established a self-insured workers compensation program, accounted for in the Workers Compensation Internal Service fund to finance its uninsured risk of loss. The Workers Compensation fund provides coverage for up to a maximum of $200,000 for each worker's compensation claim. The City purchases commercial insurance for claims in excess of coverage provided by the self-insurance program. Settled claims have not exceeded this commercial coverage in any of the past three fiscal years. All applicable funds and component units participate in the workers compensation self-insurance program and make payments to the Workers Compensation fund based on estimates of the amounts needed to pay prior and current year claims and to accumulate funds for financial stability. Excess accumulated funds over claims liability was $9,976 at September 30, 2016.
60

The workers compensation claims liability at September 30, 2016 is $2,364,211 and is based on the requirements of GASB Statement No. 10, “Accounting and Financial Reporting for Risk Financing and Related Insurance Issues”, which requires a liability for claims be reported if information prior to the issuance of the financial statements indicates that it is probable that a liability has been incurred at the date of the financial statements and the amount of the loss can be reasonably estimated. To estimate this liability the incurred but not reported (IBNR) factors are applied to trended claims history. Workers compensation claims at September 30, 2015 and 2016 are summarized below:
Fiscal Year
Claims Liability
October 1,
Current Year Claims and Changes in Estimates Payments
Claims Liability September
30, Due Within One Year
2014-2015 $ 2,295,639 $ 1,376,356 $ 1,967,820 $ 1,704,175 $ 579,978 2015-2016 1,704,175 2,137,905 1,477,869 2,364,211 688,485
B. Pension Plans
All regular employees are covered by retirement plans. Firefighters and police officers are covered by local pension plans. All other employees are covered by the Florida Retirement System or a local pension plan.
The total pension expense as of September 30, 2016 are as follows:
Governmental Activities 7,616,930$ Business-type Activities 1,478,049 Component Unit 605,656
Total 9,700,635$
The City has three defined benefit single employer pension plans:
• Firefighters Pension Plan• Police Officers Pension Plan• General Employee Pension Plan
The plans do not issue stand-alone financial reports and are not included in any other retirement system’s or entity’s financial report. The City accounts for all three plans as pension trust funds, therefore, they are accounted for in substantially the same manner as proprietary funds, with a capital measurement focus and employment of the accrual basis of accounting. Plan member contributions, employer contributions and contributions from other entities are recognized in the period in which the contributions are due. Benefits and refunds are recognized when due and payable in accordance with the terms of the plans.
Firefighters, Police and General Employee Pension Plans
Summary of Significant Accounting Policies
Method Used to Value Investments. Investments are reported at fair value. Short-term investments are reported at cost, which approximates fair value. Securities traded on a national or international exchange are valued at the last reported sales price at current exchange rates. Mortgages are valued on the basis of future principal and interest payments, and are discounted at prevailing interest rates for similar instruments. Investments that do not have an established market are reported at estimated fair value.
61

Because the plans do not issue stand-alone GAAP financial reports, the following individual financial reports are presented for each of the plans:
The Pension trust funds fiduciary net position activity as of September 30, 2016 was as follows: General Total
Firefighters Police Employees PensionPension Pension Pension Trust Funds
ASSETSCash and cash equivalents 2,007,693$ 1,934,908$ 177,931$ 4,120,532$ Investments, at fair value: U.S.government obligations 8,301,428 13,925,498 1,027,617 23,254,543 Corporate bonds 5,406,161 7,197,557 2,126,822 14,730,540 Common and preferred stocks 48,299,941 48,564,691 4,981,861 101,846,493 Interest receivable 75,540 103,058 25,558 204,156 Due from other funds 25,667 - - 25,667 Prepaid expenses - 363,276 - 363,276
Total assets 64,116,430 72,088,988 8,339,789 144,545,207
LIABILITIESAccounts payable and accrued expenses 79,450 105,809 18,783 204,042 Due to other funds - 5,651 9,098 14,749 Overfunded contributions 397,984 58,867 388,467 845,318
Total liabilities 477,434 170,327 416,348 1,064,109
NET POSITIONHeld in trust for pension benefits 63,638,996$ 71,918,661$ 7,923,441$ 143,481,098$
The Pension trust funds change in fiduciary net position activity as of September 30, 2016 was as follows: General Total
Firefighters Police Employees PensionPension Pension Pension Trust Funds
ADDITIONSContributions Employer contributions 2,622,565$ 2,948,527$ 76,214$ 5,647,306$ Employee contributions 578,536 556,311 20,712 1,155,559 State contributions 545,561 597,263 - 1,142,824
Total contributions 3,746,662 4,102,101 96,926 7,945,689
Investment income Net appreciation in fair value of investments 4,599,573 5,135,680 492,360 10,227,613 Interest, dividends, and other income 1,882,708 1,880,594 228,419 3,991,721 Total investment gains 6,482,281 7,016,274 720,779 14,219,334 Less investment expense (343,818) (361,903) (32,709) (738,430)
Net investment earnings 6,138,463 6,654,371 688,070 13,480,904
Total additions 9,885,125 10,756,472 784,996 21,426,593 DEDUCTIONSBenefits paid 4,459,046 4,689,484 513,615 9,662,145 Refunded contributions - 104,502 - 104,502 Administrative expense 128,302 170,902 74,511 373,715 Total deductions 4,587,348 4,964,888 588,126 10,140,362 Net change in net position 5,297,777 5,791,584 196,870 11,286,231 Net position held in trust for pension
benefits October 1 58,341,219 66,127,077 7,726,571 132,194,867 Net position held in trust for pension benefits September 30 63,638,996$ 71,918,661$ 7,923,441$ 143,481,098$
62
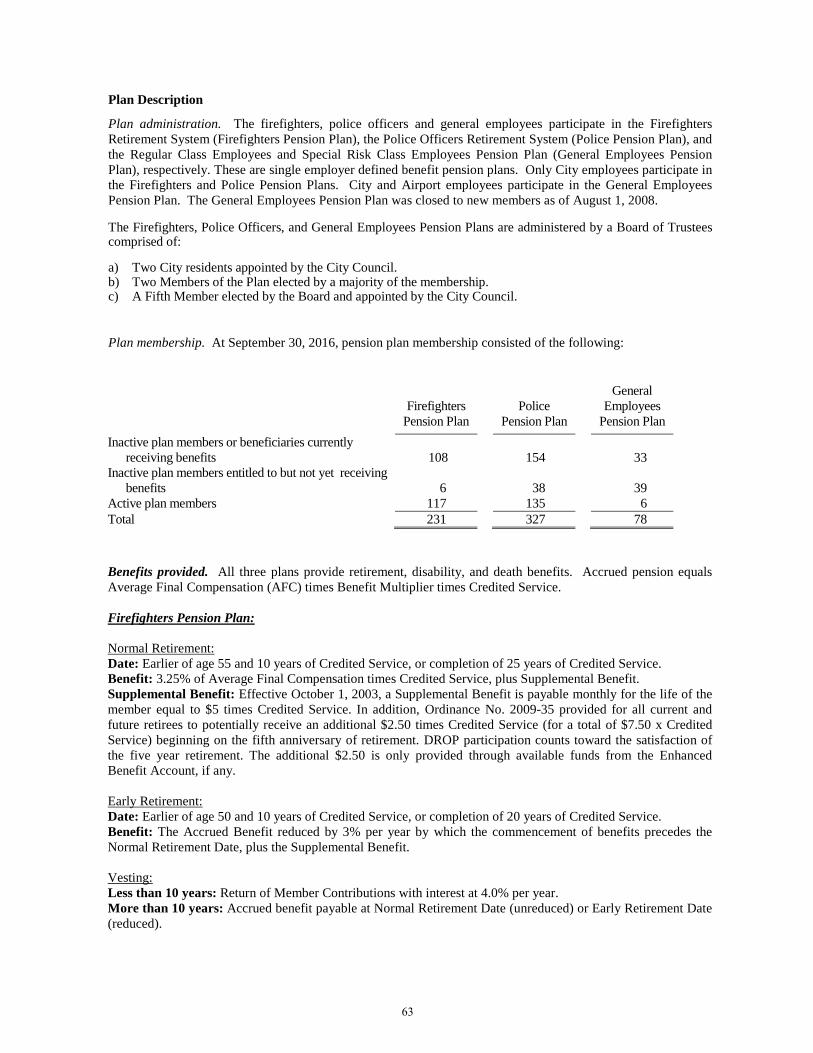
Plan Description
Plan administration. The firefighters, police officers and general employees participate in the Firefighters Retirement System (Firefighters Pension Plan), the Police Officers Retirement System (Police Pension Plan), and the Regular Class Employees and Special Risk Class Employees Pension Plan (General Employees Pension Plan), respectively. These are single employer defined benefit pension plans. Only City employees participate in the Firefighters and Police Pension Plans. City and Airport employees participate in the General Employees Pension Plan. The General Employees Pension Plan was closed to new members as of August 1, 2008.
The Firefighters, Police Officers, and General Employees Pension Plans are administered by a Board of Trustees comprised of:
a) Two City residents appointed by the City Council.b) Two Members of the Plan elected by a majority of the membership.c) A Fifth Member elected by the Board and appointed by the City Council.
Plan membership. At September 30, 2016, pension plan membership consisted of the following:
Firefighters Pension Plan
Police Pension Plan
General Employees
Pension Plan Inactive plan members or beneficiaries currently
receiving benefits 108 154 33 Inactive plan members entitled to but not yet receiving
benefits 6 38 39 Active plan members 117 135 6 Total 231 327 78
Benefits provided. All three plans provide retirement, disability, and death benefits. Accrued pension equals Average Final Compensation (AFC) times Benefit Multiplier times Credited Service.
Firefighters Pension Plan:
Normal Retirement: Date: Earlier of age 55 and 10 years of Credited Service, or completion of 25 years of Credited Service. Benefit: 3.25% of Average Final Compensation times Credited Service, plus Supplemental Benefit. Supplemental Benefit: Effective October 1, 2003, a Supplemental Benefit is payable monthly for the life of the member equal to $5 times Credited Service. In addition, Ordinance No. 2009-35 provided for all current and future retirees to potentially receive an additional $2.50 times Credited Service (for a total of $7.50 x Credited Service) beginning on the fifth anniversary of retirement. DROP participation counts toward the satisfaction of the five year retirement. The additional $2.50 is only provided through available funds from the Enhanced Benefit Account, if any.
Early Retirement: Date: Earlier of age 50 and 10 years of Credited Service, or completion of 20 years of Credited Service. Benefit: The Accrued Benefit reduced by 3% per year by which the commencement of benefits precedes the Normal Retirement Date, plus the Supplemental Benefit.
Vesting: Less than 10 years: Return of Member Contributions with interest at 4.0% per year. More than 10 years: Accrued benefit payable at Normal Retirement Date (unreduced) or Early Retirement Date (reduced).
63
Disability Retirement: Service Connected Eligibility: Total, permanent, and unable to perform the duties of a Firefighter. Benefits payable are the greater of 2% of AFC times Credited Service, 42% times AFC, and 40% of Regular Base Salary. Non-Service Connected Eligibility: Same as for Service Connected except also must have 10 years of Credited Service and benefits payable are the greater of 2% of AFC times Credited Service, and accrued benefit reduced for early retirement, minimum amount payable is 25% of AFC.
Pre-Retirement Death: In the line of duty prior to retirement eligibility: 40% of Regular Base Salary is payable to the spouse until their death. If there is no spouse, or upon the death of the spouse, 15% of Regular Base Salary is payable for each unmarried child until the age of 18 (or age 22 if a full-time student). The maximum amount payable to all such children is 40% of Regular Base Salary. Not in the line of duty prior to retirement eligibility: Accumulated Employee Contributions with interest is payable or 10-year certain annuity reduced actuarially from the early retirement date.
Eligible for retirement at date of death: Benefit payable is the greater actuarial value between the benefit defined for line of duty death prior to retirement eligibility and the benefit payable if the Member had retired on the date of death. The resulting amount is payable on a monthly basis for ten years, or on such other actuarially equivalent basis as approved by the board.
Enhanced Benefit Account (EBA): Date: Provides for a lump sum variable cost of living adjustment for all members who retired, became disabled, or terminated vested on or after September 30, 1996, and their beneficiaries. Benefit: Commencing annually from March 1, 1997, the sum of (a) and (b), as follows, shall be credited to or deducted from the Enhanced Benefit Account to provide a lump sum variable cost of living adjustment:
(a) 50% of positive or negative net investment income compared to fund’s investment objective of 8% for the preceding fiscal year, and
(b) 50% of the amount by which the premium taxes collected and distributed by the state exceed 5.6% of covered payroll during the preceding fiscal year.
Effective October 13, 2009, Ordinance No. 2009-35 reduced EBA funds retroactively to October 1, 2008 by a one-time deduction equal to the cost to provide the increased 3.25% benefit accrual rate minus the amount of any unallocated premium tax money; and defined use of EBA funds to first pay for an additional Supplemental Benefit of $2.50 x Credited Service after the fifth year of retirement, prior to the payment of any lump sum variable cost of living adjustment described in the following.
Each April 1st the Enhanced Benefit Account is allocated among the retirees as of the preceding September 30th based upon (i) the number of full months of retirement during the preceding fiscal year, and (ii) in proportion to the amount of each retiree’s actual monthly retirement benefit. The allocation is limited to a maximum of 3% of the pension benefit (prorated if retired less than a full year).
Police Officers Pension Plan:
Normal Retirement: Date: Earlier of age 55 and 10 years of Credited Service, or completion of 25 years of Credited Service. Benefit: 3% of Average Final Compensation times Credited Service.
Early Retirement: Date: Age 45 and 10 years of Credited Service. Benefit: Accrued pension payable immediately, reduced 3% for each of the first 5 years, and actuarially reduced for all years in excess of 5 years; or, unreduced accrued pension payable at Normal Retirement Date.
Vesting: Less than 10 years: Return of Member Contributions. More than 10 years: Accrued benefit payable at Normal Retirement Date (unreduced) or Early Retirement Date (reduced).
64
Disability Retirement: Service Connected Eligibility: Total, permanent, and unable to perform the duties of a Police Officer with Accrued pension, but not less than 50% of AFC. Non-Service Connected Eligibility: Same as for Service Connected except also must have 366 consecutive days of Credited Service, with Accrued pension, but not less than 25% of AFC.
Pre-Retirement Death: Vested: Beneficiary may elect $50,000 or the Member's accrued pension benefit payable for 10 years beginning at the Member's otherwise Normal Retirement Date (unreduced) or Early Retirement Date (reduced). Non-Vested: Refund of Member Contributions.
Cost of Living Adjustment (COLA): Members eligible for normal retirement prior to 11/28/2012: 1 % automatic cost-of-living increases beginning one year after retirement for Normal, Early, and Disability Retirees. Vested terminated members are not included.
Members eligible for normal retirement after 11/27/2012: Proportion of 1 % (measured by comparing actual service as of 11/27/2012 to total service at the time of retirement) beginning one year after retirement and continuing for 10 years, payable to Normal, Early, and Disability retirees. Vested terminated members are not included.
General Employees Pension Plan:
Normal Retirement: Date: Regular Class – Earlier of age 62 and 6 years of Credited Service (age 57 with 10 years of Credited Service for the City Manager), or completion of 30 years of Credited Service. Special Risk Class – Earlier of age 55 and 6 years of Credited Service or completion of 25 years of Credited Service. Benefit: Regular Class 1.6% of AFC times Credited Service. Rate increases to 1.63% if age 63 or 31 years, 1.65% if age 64 or 32 years, and 1.68% if age 65 or 33 years. Rate is 2.0% for Senior Management employees. Special Risk Class – 3.0% of Average Final Compensation times Credited Service.
Early Retirement: Date: 6 years of Credited Service for both Regular and Special Risk Class. Benefit: Regular Class – Accrued benefit reduced 5% for each year prior to Normal Retirement. Special Risk Class - Accrued benefit reduced 3% for each of the first 5 years prior to Normal Retirement and 5% for each additional year thereafter.
Vesting: Schedule: 100% after 6 years of Credited Service for both Regular and Special Risk Class. Benefit: Vested portion of accrued benefit payable at the otherwise Normal Retirement date.
Disability Retirement: Service Connected Eligibility: Covered from date of employment for both Regular and Special Risk Class. Non-Service Connected Eligibility: After 8 years of Credited Service. Benefit: Regular Class – Accrued to date of disability, but not less than 42% of AFC (Service Connected), or 25% of AFC (Non-Service Connected). Special Risk Class – Accrued to date of disability, but not less than 65% of AFC (Service Connected), or 25% of AFC (Non-Service Connected)
Pre-Retirement Death: Vested: Beneficiary receives an immediate or deferred monthly benefit computed based on the assumption that the member retired on the date of death and elected the 100% joint and survivor annuity. Non-Vested: Refund of Member Contributions, if any.
Cost of Living Adjustment (COLA): Regular Class – each July 1 following retirement the monthly benefit amount is increased 3%, based on the June benefit, excluding any supplemental benefit. Special Risk Class – beginning on the July 1 following 2 years of payments, the monthly amount is increased 3% based on the June benefit, excluding any supplemental benefit.
65
Supplement: Early and Normal Retirees receive a monthly benefit of $5 for each year of Credited Service (minimum is $30 and maximum is $150) for both Regular and Special Risk Class.
Contribution Requirements. All three local pension plans provide retirement and disability benefits to plan members and beneficiaries. These pension plans are administered by separate local Boards of Trustees. Benefit provisions and contribution requirements are established by City ordinance as provided in Chapter 23, Articles V, VI and VII of the Melbourne City Code for the Firefighters, Police, and General Employee Pension Plans, respectively. Amendments may only be made by City Council adoption of a local ordinance.
Contributions. The employer, employee, and State contribution requirements are applicable to each Plan and actuarially determined on an annual basis. Administrative costs of each of the pension plans are financed by the respective plans. The employee contribution rates, expressed as a percentage of salary, for the Firefighters Pension Plan and the Police Pension Plan were 7.5% and 6.5%, respectively for the 2015-2016 fiscal year. Police officers hired after November 27, 2012 contribute 8.0%. No employee contributions are required for the General Employee Pension Plan. The employer contribution rates, expressed as a percentage of salary for the Firefighters and Police Pension Plans were 43.82% and 37.09%, respectively, for the 2015-2016 fiscal year. The employer contribution rates, expressed as a percentage of payroll, for the General Employee Pension Plan were 15.45% for general employees and 42.61% for Airport police personnel for the 2015-2016 fiscal year. The City recognized as revenues and expenditures on-behalf payments relating to pension contributions for its public safety employees that the State paid to the Firefighters and Police Pension Plans in the amounts of $545,561 and $597,263 respectively. These contributions are funded by an excise tax upon certain casualty and property insurance companies on their gross receipts of premiums from policy holders. If the remittance from the State is less than estimated by the actuary, the City pays the balance required to fund the total actuarial requirements. The City’s and Airport’s annual contributions exceeded the annual pension cost for each of the local pension plans for the year ended September 30, 2016. The City’s contributions to the Firefighters and Police Pension Plans were $2,622,565 and $2,948,527 which includes prepaids of $397,984 and $58,867 respectively. The Airport’s contribution to the General Employees Special Risk Class was $32,286. The General Employees Regular Class used $43,928 in prepaids.
Investments
Investment policy. The pension plan policy in regard to the allocation of invested assets is established and may be amended by the Boards. In fulfilling their fiduciary responsibility, the Board recognizes that the pension plan is an essential vehicle for providing income benefits to retired participants. The Board also recognizes that the obligations of the Plan are long-term and that investment policy should be made with a view toward performance and return over a number of years. The general investment objective is to obtain a reasonable total rate of return, defined as interest and dividend income plus realized and unrealized capital gains and losses, commensurate with the Prudent Investor Rule and any other applicable City Ordinances and State Statutes.
The following was the Board’s adopted asset allocation policy as of September 30, 2016:
Target Allocation
Asset Class Firefighters
Pension Plan Police
Pension Plan General Employees
Pension Plan Domestic 45.00% 45.00% 50.00% International 15.00% 15.00% 10.00% Domestic Bonds 20.00% 25.00% 25.00% Global Bonds 5.00% 5.00% 5.00% Real Estate 10.00% 5.00% 5.00% Alternatives 5.00% 5.00% 5.00%
Concentration. Investments (excluding mutual funds and those issued or guaranteed by the U.S. government) held by the local pension plans did not exceed five percent of total plan assets.
66
Rate of Return. For the year end September 30, 2016, the annual money-weighted rate of return on the Firefighters’ Pension Plan, the Police Pension Plan, and the General Employee Pension Plan investments, net of pension plan investment expense, was 10.36%, 10.02%, and 8.46% respectively. The money-weighted rate of return expresses investment performance, net of investment expense, adjusted for the changing amounts actually invested.
Deferred Retirement Option Plan (DROP)
Firefighters Pension Plan:
Members are eligible to enter the DROP at the Normal Retirement Date. DROP participants are not eligible for death or disability benefits. The maximum DROP participation duration is 60 months. The Accrued Benefit plus Supplemental Benefit is frozen and no further Employee Contributions are payable at DROP entry. The Accrued Benefit accumulates in the DROP account with interest, credited quarterly, as elected by the Member (where this election may be changed by the Member annually):
(a) An annual rate of 6.50%, compounded monthly on the prior month’s ending balance (1.3% for members who enter DROP on or after March 24, 2016).
(b) The average daily balance in the member’s DROP account is credited or debited at a rate equal to the net investment return realized for the quarter. (c) 50% of (a) plus 50% of (b).
A Member’s final DROP account value for distribution is the value of the account at the end of the quarter immediately preceding termination of participation in the DROP, plus any monthly periodic additions made to the DROP account subsequent to the end of the previous quarter and prior to distribution. The Supplemental Benefit is payable once the member actually terminates from employment and begins to receive monthly pension payments after the end of the DROP. The DROP balance at September 30, 2016 was $8,209,291.
Police Officers Pension Plan:
Members are eligible to enter the DROP at the Normal Retirement Date. DROP participants are not eligible for death or disability benefits. The maximum DROP participation duration is 60 months or the completion of 31 years of employment with the City as a Police Officer. The Accrued Benefit is frozen and no further Employee Contributions are payable at DROP entry. The Accrued Benefit accumulates in the DROP account with interest, credited quarterly, as elected by the Member (where this election may be changed once during the DROP period):
(a) An annual rate of 6.50%, compounded monthly on the prior month’s ending balance (1.3% for members who enter DROP on or after 11/27/2012).
(b) The average daily balance in the member’s DROP account is credited or debited at a rate equal to the net investment return realized for the quarter.
(c) 50% of (a) plus 50% of (b).
A Member’s final DROP account value for distribution is the value of the account at the end of the quarter immediately preceding termination of participation in the DROP, plus any monthly periodic additions made to the DROP account subsequent to the end of the previous quarter and prior to distribution. The DROP balance at September 30, 2016 was $3,138,647.
General Employees Pension Plan:
Members are eligible to enter the DROP at the Normal Retirement Date. DROP participants are not eligible for death or disability benefits. The maximum DROP participation duration is 60 months. The Accrued Benefit is frozen and no further Employee Contributions are payable at DROP entry. The Accrued Benefit accumulates in the DROP account with an annual interest rate of 6.5%, compounded monthly on the prior month’s ending balance (1.3% for members who enter DROP on or after 6/01/2012).
A Member’s final DROP account value for distribution is the value of the account at the end of the quarter immediately preceding termination of participation in the DROP, plus any monthly periodic additions made to the DROP account subsequent to the end of the previous quarter and prior to distribution. The DROP balance at September 30, 2016 was $26,731.
67
Net Pension Liability of the City of Melbourne
The components of the net pension liability of the City at September 30, 2016, as follows, is presented in accordance with GASB Statement No. 67, while the net pension liability recognized by the City in the current financial statements represents the net pension liability as of September 30, 2015, which is allowed by GASB Statement No. 68.
Firefighters Pension Plan
Police Pension Plan
General Employees
Pension Plan Regular Class
Special Risk Class
Total pension liability $ 81,468,456 $ 93,996,175 $ 6,117,065 $ 1,133,470 Plan fiduciary net position (63,638,996) (71,918,661) (6,858,732) (1,064,709) Sponsor’s net pension liability (asset) $ 17,829,460 $ 22,077,514 $ (741,667) $ 68,761
Plan fiduciary net position as a percentage of total pension liability 78.11% 76.51% 112.12% 93.93%
Actuarial assumptions. The total pension liability was determined by an actuarial valuation as of October 1, 2016 for the Firefighters’ Pension Plan, Police Pension and General Employees Pension Plan using the following actuarial assumptions applied to all measurement periods:
Firefighters Pension Plan
Police Pension Plan
General Employees
Pension Plan Inflation 2.50% 2.50% 2.50% Salary increases 6.00% 4.50% 6.00% Investment rate of return 8.00% 7.50% 7.00%
Mortality rates were based on the RP-2000 Table with no projection for Males and Females, as appropriate. The actuarial assumptions used in the October 1, 2016 valuation were carried forward from the prior actuary. No recent actuarial experience study has been performed.
The long term expected rate of return on pension plan investments was determined using a building-block method in which best estimates ranges of expected future real rates of return (expected returns, net of pension plan investment expenses and inflation) are developed for each major asset class. These ranges are combined to produce the long term expected rate of return by weighting the expected future real rates of return by the target asset allocation percentage and by expected inflation. Best estimates of arithmetic real rates of return for each major asset class included in the pension plan’s target asset allocation as of September 30, 2016 are summarized in the following table:
Long Term Expected Real Rate of Return
Asset Class Firefighters
Pension Plan Police
Pension Plan
General Employees
Pension Plan Domestic equity 7.50% 7.50% 7.50% International 8.50% 8.50% 8.50% Domestic fixed income 2.50% 2.50% 2.50% Global fixed income 3.50% 3.50% 3.50% Real Estate 4.50% 4.50% 0.00% Alternatives 6.03% 0.00% 0.00%
68
Discount rate. The discount rate used to measure the total pension liability for the Firefighters, Police, and General Employee Pension Plans were 8.00%, 7.50%, and 7.00% percent, respectively. The projection of cash flows used to determine the discount rate assumes that plan member contributions will be made at the current contribution rate and that City contributions will be made at rates equal to the difference between actuarially determined contributions rates and the member rate. Based on those assumptions, the pension plan’s fiduciary net position was projected to be available to make all projected future benefits payments of current plan members. Therefore, the long term expected rate of return on pension plan investments was applied to all periods of projected benefits payments to determine the total pension liability.
Sensitivity of the net pension liability (asset) to changes in the discount rate. The following presents the net pension liability of the City, calculated using the discount rate, as well as what the City’s net pension liability (asset) would be if it were calculated using a discount rate that is 1-percentage-point lower or 1-percentage-point higher than the current rate:
1% Decrease Current Discount Rate 1% Increase Firefighters Pension Plan $ 25,475,864 $ 17,829,460 $ 11,352,042 Police Pension Plan 32,860,745 22,077,514 13,116,013 General Employee Regular Class 4,620 (741,667) (1,358,404) General Employee Special Risk Class 497,233 68,761 (201,735)
Net Pension Liability The City’s net pension liability was measured as of September 30, 2016, and the total pension liability used to calculate the net pension liability was determined by an actuarial valuation as of September 30, 2016 for the Firefighters Pension Plan, and October 1, 2016 for the Police and General Employee Pension Plans.
Changes in Net Pension Liability
FIREFIGHTERS PENSION PLANTotal Pension Plan Fiduciary Net Pension
Liability Net Position Liability(a) (b) (a) - (b)
Reporting Period Ending 9/30/2014 76,300,337$ 58,760,194$ 17,540,143$ Changes for the year: Service cost 1,465,467 - 1,465,467 Interest 5,937,717 - 5,937,717
Changes of benefit terms (1,042,704) - (1,042,704) Difference between expected and actual experience (418,968) - (418,968) Changes of assumptions 76,676 - 76,676 Contributions - employer - 2,702,209 (2,702,209) Contributions - state - 569,837 (569,837) Contributions - employee - 466,578 (466,578) Net investment income - 126,002 (126,002) Benefit payments, including refunds of employee contributions (4,151,523) (4,151,523) - Administrative expenses - (132,078) 132,078 Net changes 1,866,665 (418,975) 2,285,640 Reporting Period Ending 9/30/2015 78,167,002$ 58,341,219$ 19,825,783$
Increase (Decrease)
69
POLICE OFFICERS PENSION PLANTotal Pension Plan Fiduciary Net Pension
Liability Net Position Liability(a) (b) (a) - (b)
Reporting Period Ending 9/30/2014 88,192,033$ 68,007,130$ 20,184,903$ Changes for the year: Service cost 1,457,495 - 1,457,495 Interest 6,500,397 - 6,500,397
Differences between Expected and Actual Experience (129,550) - (129,550) Changes of assumptions (1,189,338) - (1,189,338)
Contributions - employer - 2,876,710 (2,876,710) Contributions - state - 543,474 (543,474) Contributions - employee - 512,708 (512,708) Contributions - buy back 8,784 8,784 - Net investment income - (43,614) 43,614 Benefit payments, including refunds of employee contributions (5,699,583) (5,699,583) - Administrative expenses - (78,532) 78,532 Net changes 948,205 (1,880,053) 2,828,258 Reporting Period Ending 9/30/2015 89,140,238$ 66,127,077$ 23,013,161$
Increase (Decrease)
GENERAL EMPLOYEES REGULAR CLASS PENSION PLAN
Total Pension Plan Fiduciary Net PensionLiability Net Position Liability
(a) (b) (a) - (b)Reporting Period Ending 9/30/2014 5,322,967$ 7,214,418$ (1,891,451)$ Changes for the year: Service cost 49,546 - 49,546 Interest 406,207 - 406,207 Difference between expected and actual experience (31,975) - (31,975) Changes of assumptions 442,831 - 442,831 Contributions - employer - 52,573 (52,573) Net investment income - (143,686) 143,686 Benefit payments, including refunds of employee contributions (329,470) (329,470) - Administrative expenses - (40,805) 40,805 Net changes 537,139 (461,388) 998,527 Reporting Period Ending 9/30/2015 5,860,106$ 6,753,030$ (892,924)$
Increase (Decrease)
70
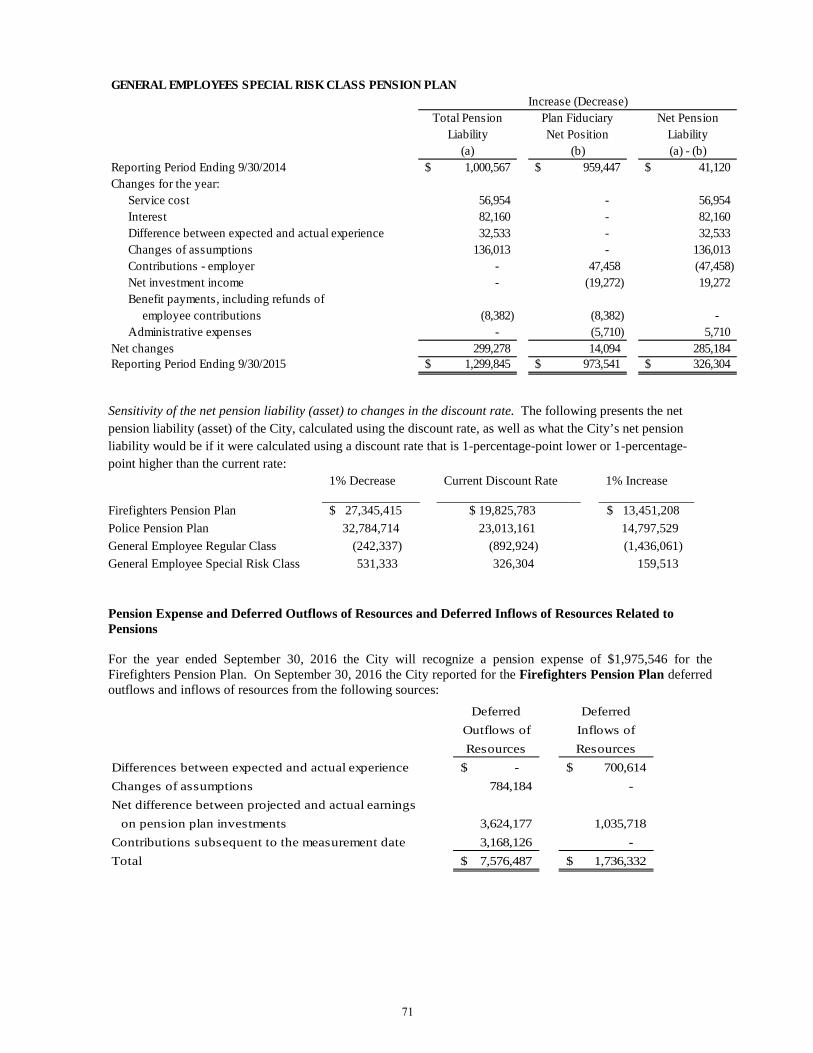
Total Pension Plan Fiduciary Net PensionLiability Net Position Liability
(a) (b) (a) - (b)Reporting Period Ending 9/30/2014 1,000,567$ 959,447$ 41,120$ Changes for the year: Service cost 56,954 - 56,954 Interest 82,160 - 82,160 Difference between expected and actual experience 32,533 - 32,533 Changes of assumptions 136,013 - 136,013 Contributions - employer - 47,458 (47,458) Net investment income - (19,272) 19,272 Benefit payments, including refunds of employee contributions (8,382) (8,382) - Administrative expenses - (5,710) 5,710 Net changes 299,278 14,094 285,184 Reporting Period Ending 9/30/2015 1,299,845$ 973,541$ 326,304$
Increase (Decrease)GENERAL EMPLOYEES SPECIAL RISK CLASS PENSION PLAN
Sensitivity of the net pension liability (asset) to changes in the discount rate. The following presents the net pension liability (asset) of the City, calculated using the discount rate, as well as what the City’s net pension liability would be if it were calculated using a discount rate that is 1-percentage-point lower or 1-percentage-point higher than the current rate:
1% Decrease Current Discount Rate 1% Increase
Firefighters Pension Plan $ 27,345,415 $ 19,825,783 $ 13,451,208 Police Pension Plan 32,784,714 23,013,161 14,797,529 General Employee Regular Class (242,337) (892,924) (1,436,061) General Employee Special Risk Class 531,333 326,304 159,513
Pension Expense and Deferred Outflows of Resources and Deferred Inflows of Resources Related to Pensions
For the year ended September 30, 2016 the City will recognize a pension expense of $1,975,546 for the Firefighters Pension Plan. On September 30, 2016 the City reported for the Firefighters Pension Plan deferred outflows and inflows of resources from the following sources:
Deferred DeferredOutflows of Inflows ofResources Resources
Differences between expected and actual experience -$ 700,614$ Changes of assumptions 784,184 - Net difference between projected and actual earnings
on pension plan investments 3,624,177 1,035,718 Contributions subsequent to the measurement date 3,168,126 - Total 7,576,487$ 1,736,332$
71

Deferred outflows of $3,168,126, resulting from City and State contributions subsequent to the measurement date, will be recognized as a reduction of the net pension liability in the fiscal year ended September 30, 2016. Other amounts reported as deferred outflows and inflows of resources related to pensions will be recognized in pension expense as follows:
Year ended September 30:2017 605,789$ 2018 605,789 2019 605,791 2020 854,660
For the year ended September 30, 2016 the City will recognize a pension expense of $2,867,693 for the Police Officers Pension Plan. On September 30, 2016 the City reported for the Police Officers Pension Plan deferred outflows and inflows of resources from the following sources:
Deferred DeferredOutflows of Inflows ofResources Resources
Differences between expected and actual experience - 97,163$ Changes of assumptions - 892,004 Net difference between projected and actual earnings
on pension plan investments 4,060,225 929,073 Contributions subsequent to the measurement date 3,545,790 - Total 7,606,015$ 1,918,240$
Deferred outflows of $3,545,790, resulting from City and State contributions subsequent to the measurement date, will be recognized as a reduction of the net pension liability in the fiscal year ended September 30, 2016. Other amounts reported as deferred outflows and inflows of resources related to pensions will be recognized in pension expense as follows:
Year ended September 30:
2017 375,645$ 2018 375,642 2019 375,642 2020 1,015,056
For the year ended September 30, 2016 the City will recognize a pension expense of $432,723 for the General Employees Regular Class Pension Plan. On September 30, 2016 the City reported for the General Employees Regular Class Pension Plan deferred outflows and inflows of resources from the following sources:
Deferred DeferredOutflows of Inflows ofResources Resources
Net difference between projected and actual earningson pension plan investments 555,216$ 189,483$
Contributions subsequent to the measurement date 43,928 - Total 599,144$ 189,483$
72
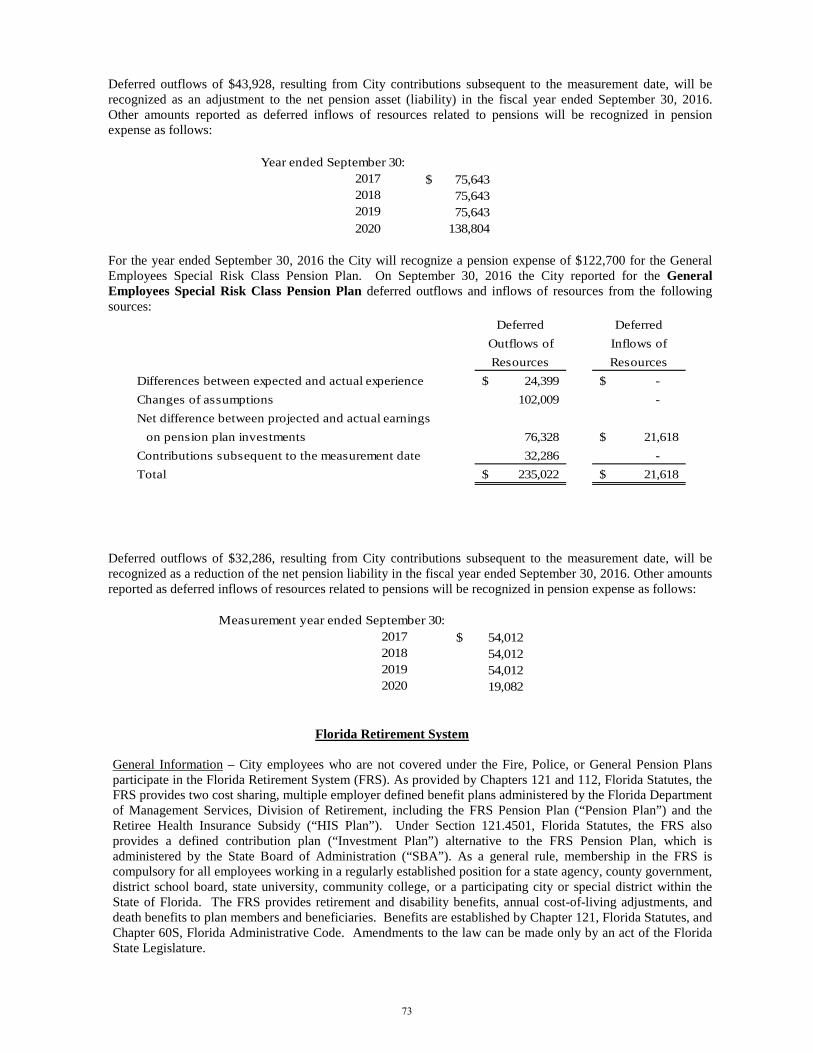
Deferred outflows of $43,928, resulting from City contributions subsequent to the measurement date, will be recognized as an adjustment to the net pension asset (liability) in the fiscal year ended September 30, 2016. Other amounts reported as deferred inflows of resources related to pensions will be recognized in pension expense as follows:
Year ended September 30:2017 75,643$ 2018 75,643 2019 75,643 2020 138,804
For the year ended September 30, 2016 the City will recognize a pension expense of $122,700 for the General Employees Special Risk Class Pension Plan. On September 30, 2016 the City reported for the General Employees Special Risk Class Pension Plan deferred outflows and inflows of resources from the following sources:
Deferred DeferredOutflows of Inflows ofResources Resources
Differences between expected and actual experience 24,399$ -$ Changes of assumptions 102,009 - Net difference between projected and actual earnings
on pension plan investments 76,328 21,618$ Contributions subsequent to the measurement date 32,286 - Total 235,022$ 21,618$
Deferred outflows of $32,286, resulting from City contributions subsequent to the measurement date, will be recognized as a reduction of the net pension liability in the fiscal year ended September 30, 2016. Other amounts reported as deferred inflows of resources related to pensions will be recognized in pension expense as follows:
Measurement year ended September 30:2017 54,012$ 2018 54,012 2019 54,012 2020 19,082
Florida Retirement System
General Information – City employees who are not covered under the Fire, Police, or General Pension Plans participate in the Florida Retirement System (FRS). As provided by Chapters 121 and 112, Florida Statutes, the FRS provides two cost sharing, multiple employer defined benefit plans administered by the Florida Department of Management Services, Division of Retirement, including the FRS Pension Plan (“Pension Plan”) and the Retiree Health Insurance Subsidy (“HIS Plan”). Under Section 121.4501, Florida Statutes, the FRS also provides a defined contribution plan (“Investment Plan”) alternative to the FRS Pension Plan, which is administered by the State Board of Administration (“SBA”). As a general rule, membership in the FRS is compulsory for all employees working in a regularly established position for a state agency, county government, district school board, state university, community college, or a participating city or special district within the State of Florida. The FRS provides retirement and disability benefits, annual cost-of-living adjustments, and death benefits to plan members and beneficiaries. Benefits are established by Chapter 121, Florida Statutes, and Chapter 60S, Florida Administrative Code. Amendments to the law can be made only by an act of the Florida State Legislature.
73

The State of Florida annually issues a publicly available financial report that includes financial statements and required supplementary information for the FRS. The latest available report may be obtained by writing to the State of Florida Division of Retirement, Department of Management Services, P.O. Box 9000, Tallahassee, Florida 32315-9000, or from the Web site: www.dms.myflorida.com/workforce_operations/retirement/publications.
Pension Plan
Plan Description – The Pension Plan is a cost-sharing multiple-employer defined benefit pension plan, with a Deferred Retirement Option Program (“DROP”) for eligible employees.
Benefits Provided - Benefits under the Pension Plan are computed on the basis of age, average final compensation, and service credit. For Pension Plan members enrolled before July 1, 2011, Regular class members who retire at or after age 62 with at least six years of credited service or 30 years of service regardless of age are entitled to a retirement benefit payable monthly for life, equal to 1.6% of their final average compensation based on the five highest years of salary, for each year of credited service. Vested members with less than 30 years of service may retire before age 62 and receive reduced retirement benefits. Special Risk class members (sworn Airport police officers) who retire at or after age 55 with at least six years of credited service, or with 25 years of service regardless of age, are entitled to a retirement benefit payable monthly for life, equal to 3.0% of their final average compensation based on the five highest years of salary for each year of credited service. Senior Management Service class members who retire at or after age 62 with at least six years of credited service or 30 years of service regardless of age are entitled to a retirement benefit payable monthly for life, equal to 2.0% of their final average compensation based on the five highest years of salary for each year of credited service. Elected Officers’ class members who retire at or after age 62 with at least six years of credited service or 30 years of service regardless of age are entitled to a retirement benefit payable monthly for life, equal to 3.0% of their final average compensation based on the five highest years of salary for each year of credited service.
For Plan members enrolled on or after July 1, 2011, the vesting requirement is extended to eight years of credited service for all these members and increasing normal retirement to age 65 or 33 years of service regardless of age for Regular, Senior Management Service, and Elected Officers’ class members, and to age 60 or 30 years of service regardless of age for Special Risk class members. Also, the final average compensation for all these members will be based on the eight highest years of salary.
As provided in Section 121.101, Florida Statutes, if the member is initially enrolled in the Pension Plan before July 1, 2011, and all service credit was accrued before July 1, 2011, the annual cost-of-living adjustment is three percent per year. If the member is initially enrolled before July 1, 2011, and has service credit on or after July 1, 2011, there is an individually calculated cost-of-living adjustment. The annual cost-of-living adjustment is a proportion of three percent determined by dividing the sum of the pre-July 2011 service credit by the total service credit at retirement multiplied by three percent. Plan members initially enrolled on or after July 1, 2011, will not have a cost-of-living adjustment after retirement.
In addition to the above benefits, the DROP program allows eligible members to defer receipt of monthly retirement benefit payments while continuing employment with a FRS employer for a period not to exceed 60 months after electing to participate. Deferred monthly benefits are held in the FRS Trust Fund and accrue interest. There are no required contributions by DROP participants.
Contributions – Effective July 1, 2011, all enrolled members of the FRS, other than DROP participants, are required to contribute three percent of their salary to the FRS. In addition to member contributions, governmental employers are required to make contributions to the FRS based on state-wide contribution rates established by the Florida Legislature. These rates are updated as of July 1 of each year. The employer contribution rates by job class for the periods from October 1, 2016 through June 30, 2016 and from July 1, 2016 through September 30, 2016, respectively, were as follows: Regular 7.26% and 7.52%; Special Risk Airport Police 22.04% and 22.57%; Senior Management Service 21.43% and 21.77%; Elected Officers’ 42.27% and 42.47%; DROP participants 12.88% and 12.99%; Re-employed General 4.31% and 4.49%, and Re-employed Airport Police 10.65% and 10.71%.
74
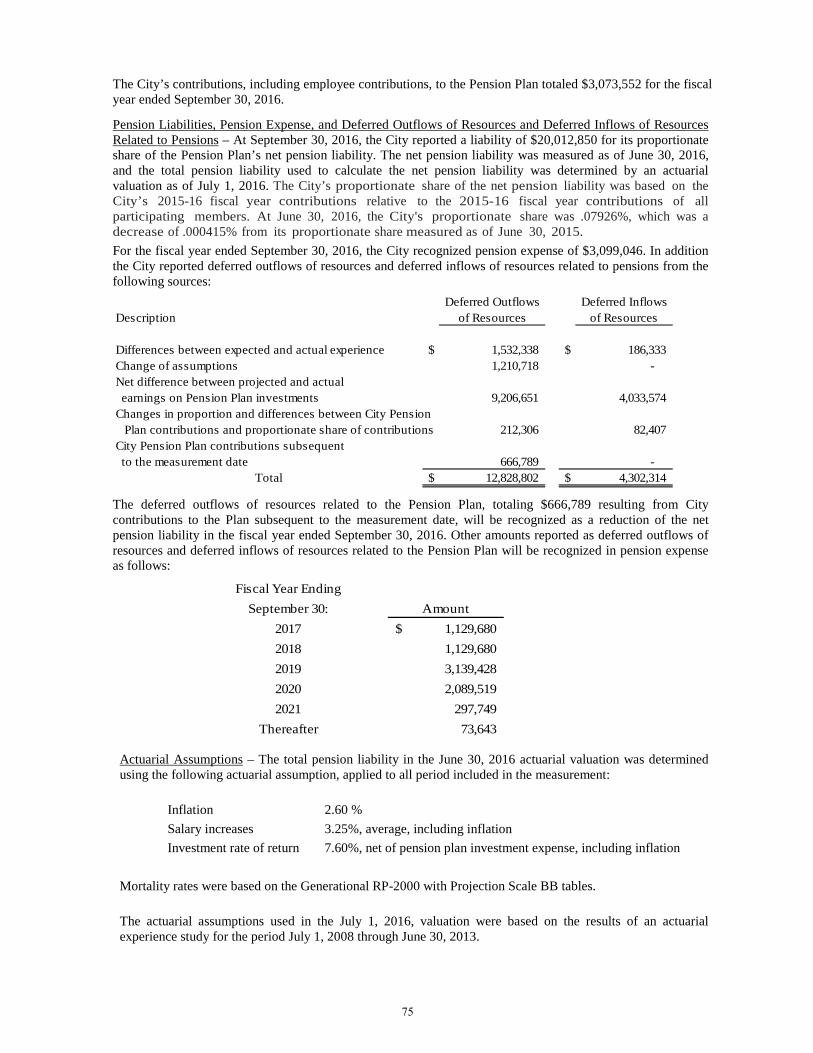
The City’s contributions, including employee contributions, to the Pension Plan totaled $3,073,552 for the fiscal year ended September 30, 2016.
Pension Liabilities, Pension Expense, and Deferred Outflows of Resources and Deferred Inflows of Resources Related to Pensions – At September 30, 2016, the City reported a liability of $20,012,850 for its proportionate share of the Pension Plan’s net pension liability. The net pension liability was measured as of June 30, 2016, and the total pension liability used to calculate the net pension liability was determined by an actuarial valuation as of July 1, 2016. The City’s proportionate share of the net pension liability was based on the City’s 2015-16 fiscal year contributions relative to the 2015-16 fiscal year contributions of all participating members. At June 30, 2016, the City's proportionate share was .07926%, which was a decrease of .000415% from its proportionate share measured as of June 30, 2015. For the fiscal year ended September 30, 2016, the City recognized pension expense of $3,099,046. In addition the City reported deferred outflows of resources and deferred inflows of resources related to pensions from the following sources:
Deferred Outflows Deferred InflowsDescription of Resources of Resources
Differences between expected and actual experience $ 1,532,338 $ 186,333 Change of assumptions 1,210,718 - Net difference between projected and actual earnings on Pension Plan investments 9,206,651 4,033,574 Changes in proportion and differences between City Pension
Plan contributions and proportionate share of contributions 212,306 82,407 City Pension Plan contributions subsequent to the measurement date 666,789 -
Total $ 12,828,802 $ 4,302,314
The deferred outflows of resources related to the Pension Plan, totaling $666,789 resulting from City contributions to the Plan subsequent to the measurement date, will be recognized as a reduction of the net pension liability in the fiscal year ended September 30, 2016. Other amounts reported as deferred outflows of resources and deferred inflows of resources related to the Pension Plan will be recognized in pension expense as follows:
Fiscal Year EndingSeptember 30: Amount
2017 1,129,680$ 2018 1,129,680 2019 3,139,428 2020 2,089,519 2021 297,749
Thereafter 73,643
Actuarial Assumptions – The total pension liability in the June 30, 2016 actuarial valuation was determined using the following actuarial assumption, applied to all period included in the measurement:
Inflation 2.60 % Salary increases 3.25%, average, including inflation Investment rate of return 7.60%, net of pension plan investment expense, including inflation
Mortality rates were based on the Generational RP-2000 with Projection Scale BB tables.
The actuarial assumptions used in the July 1, 2016, valuation were based on the results of an actuarial experience study for the period July 1, 2008 through June 30, 2013.
75

The long-term expected investment rate of return was not based on historical returns, but instead was based on a forward-looking capital market economic model. Each asset class assumption is based on a consistent set of underlying assumptions, and includes an adjustment for the inflation assumption. For the FRS Pension Plan, the table below summarizes the consulting actuary’s assumptions based on the long-term target asset allocation. The reduced investment return assumption of 7.60 percent, which was adopted by the Florida Retirement System Actuarial Assumption Conference, conflicts with the consulting actuary’s judgement of a reasonable assumption as defined by Actuarial Standards of Practice No. 27.
CompoundAnnual Annual
Target Arithmetic (Geometric) StandardAsset Class Allocation* Return Return Deviation
Cash 1.00% 3.00% 3.00% 1.70%Fixed income 18.00% 4.70% 4.60% 4.60%Global quity 53.00% 8.10% 6.80% 17.20%Real estate 10.00% 6.40% 5.80% 12.00%Private equity 6.00% 11.50% 7.80% 30.00%Strategic investments 12.00% 6.10% 5.60% 11.10%Total 100.00%
Assumed Inflation - Mean 2.60% 1.90%
* As outlined in the Plan's investment policy
Discount Rate - The discount rate used to measure the total pension liability was 7.60%. The Pension Plan’s fiduciary net position was projected to be available to make all projected future benefit payments of current active and inactive employees. Therefore, the discount rate for calculation the total pension liability is equal to the long-term expected rate of return.
Sensitivity of the City’s Proportionate Share of the Net Position Liability to Changes in the Discount Rate - The following represents the City’s proportionate share of the net pension liability calculated using the discount rate of 7.60%, as well as what the City’s proportionate share of the net pension liability would be if it were calculated using a discount rate that is one percentage point lower (6.60%) or one percentage point higher (8.60%) than the current rate:
Current1% Decrease Discount Rate 1% Increase
(6.60%) (7.60%) (8.60%)
City's proportionate share of the net pension liability 36,845,012$ 20,012,850$ 6,002,298$
Pension Plan Fiduciary Net Position - Detailed information regarding the Pension Plan’s fiduciary net position is available in the separately issued FRS Pension Plan and Other State-Administered Systems Comprehensive Annual Financial Report.
Payables to the Pension Plan - At September 30, 2016, the City reported a payable in the amount of $430,024 for outstanding contributions to the Pension Plan required for the fiscal year ended September 30, 2016.
HIS Plan
Plan Description – The HIS Plan is a cost-sharing multiple-employer defined benefit pension plan established under Section 112.363, Florida Statutes, and may be amended by the Florida legislature at any time. The benefit is a monthly payment to assist retirees of State-administered retirement systems in paying their health insurance costs and is administered by the Florida Department of Management Services, Division of Retirement.
76
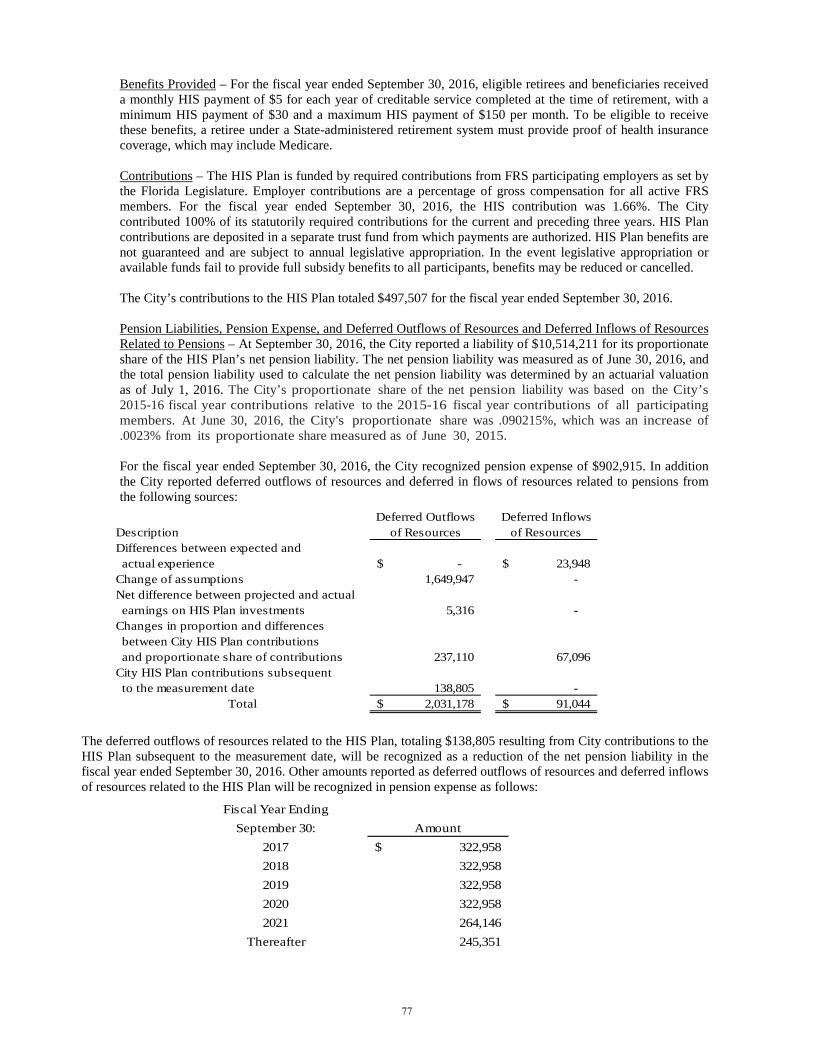
Benefits Provided – For the fiscal year ended September 30, 2016, eligible retirees and beneficiaries received a monthly HIS payment of $5 for each year of creditable service completed at the time of retirement, with a minimum HIS payment of $30 and a maximum HIS payment of $150 per month. To be eligible to receive these benefits, a retiree under a State-administered retirement system must provide proof of health insurance coverage, which may include Medicare.
Contributions – The HIS Plan is funded by required contributions from FRS participating employers as set by the Florida Legislature. Employer contributions are a percentage of gross compensation for all active FRS members. For the fiscal year ended September 30, 2016, the HIS contribution was 1.66%. The City contributed 100% of its statutorily required contributions for the current and preceding three years. HIS Plan contributions are deposited in a separate trust fund from which payments are authorized. HIS Plan benefits are not guaranteed and are subject to annual legislative appropriation. In the event legislative appropriation or available funds fail to provide full subsidy benefits to all participants, benefits may be reduced or cancelled.
The City’s contributions to the HIS Plan totaled $497,507 for the fiscal year ended September 30, 2016.
Pension Liabilities, Pension Expense, and Deferred Outflows of Resources and Deferred Inflows of Resources Related to Pensions – At September 30, 2016, the City reported a liability of $10,514,211 for its proportionate share of the HIS Plan’s net pension liability. The net pension liability was measured as of June 30, 2016, and the total pension liability used to calculate the net pension liability was determined by an actuarial valuation as of July 1, 2016. The City’s proportionate share of the net pension liability was based on the City’s 2015-16 fiscal year contributions relative to the 2015-16 fiscal year contributions of all participating members. At June 30, 2016, the City's proportionate share was .090215%, which was an increase of .0023% from its proportionate share measured as of June 30, 2015.
For the fiscal year ended September 30, 2016, the City recognized pension expense of $902,915. In addition the City reported deferred outflows of resources and deferred in flows of resources related to pensions from the following sources:
Deferred Outflows Deferred InflowsDescription of Resources of ResourcesDifferences between expected and actual experience -$ 23,948$ Change of assumptions 1,649,947 - Net difference between projected and actual earnings on HIS Plan investments 5,316 - Changes in proportion and differences between City HIS Plan contributions and proportionate share of contributions 237,110 67,096 City HIS Plan contributions subsequent to the measurement date 138,805 -
Total 2,031,178$ 91,044$
The deferred outflows of resources related to the HIS Plan, totaling $138,805 resulting from City contributions to the HIS Plan subsequent to the measurement date, will be recognized as a reduction of the net pension liability in the fiscal year ended September 30, 2016. Other amounts reported as deferred outflows of resources and deferred inflows of resources related to the HIS Plan will be recognized in pension expense as follows:
Fiscal Year EndingSeptember 30: Amount
2017 322,958$ 2018 322,958 2019 322,958 2020 322,958 2021 264,146
Thereafter 245,351
77

Actuarial Assumptions – The total pension liability in the July 1, 2016, actuarial valuation was determined using the following actuarial assumptions, applied to all periods included in the measurement:
Inflation 2.60 % Salary increases 3.25%, average, including inflation Municipal bond rate 2.85 %
Mortality rates were based on the Generational RP-2000 with Projection Scale BB tables. The actuarial assumptions used in the July 1, 2016, valuation were based on the results of an actuarial experience study for the period July 1, 2008 through June 30, 2013. Discount Rate - The discount rate used to measure the total pension liability was 2.85%. In general, the discount rate for calculating the total pension liability is equal to the single rate equivalent to discounting at the long-term expected rate of return for benefit payments prior to the projected depletion date. Because the HIS benefit is essentially funded on a pay-as-you-go basis, the depletion date is considered to be immediate, and the single equivalent discount rate is equal to the municipal bond rate selected by the HIS Plan sponsor. The Bond Buyer General Obligation 20-Bond Municipal Bond Index was adopted as the applicable municipal bond index.
Sensitivity of the City’s Proportionate Share of the Net Position Liability to Changes in the Discount Rate - The following represents the City’s proportionate share of the net pension liability calculated using the discount rate of 2.85%, as well as what the City’s proportionate share of the net pension liability would be if it were calculated using a discount rate that is one percentage point lower (1.85%) or one percentage point higher (3.85%) than the current rate:
Current1% Decrease Discount Rate 1% Increase
(1.85%) (2.85%) (3.85%)
City's proportionate share of the net pension liability 12,062,189$ 10,514,211$ 9,229,474$
Pension Plan Fiduciary Net Position - Detailed information regarding the HIS Plan’s fiduciary net position is available in the separately issued FRS Pension Plan and Other State-Administered Systems Comprehensive Annual Financial Report.
Payables to the Pension Plan - At September 30, 2016, the City reported a payable in the amount of $70,629 for outstanding contributions to the HIS Plan required for the fiscal year ended September 30, 2016.
Investment Plan
The SBA administers the defined contribution plan officially titled the FRS Investment Plan. The investment Plan is reported in the SBA’s annual financial statements and in the State of Florida Comprehensive Annual Financial Report.
As provided in Section 121.4501, Florida Statutes, eligible FRS members may elect to participate in the Investment Plan in lieu of the FRS defined benefit plan. City employees participating in DROP are not eligible to participate in the Investment Plan. Employer and employee contributions, including amounts contributed to individual member's accounts, are defined by law, but the ultimate benefit depends in part on the performance of investment funds. Benefit terms, including contribution requirements, for the Investment Plan are established and may be amended by the Florida Legislature. The Investment Plan is funded with the same employer and employee contribution rates that are based on salary and membership class (Regular Class, Elected County Officers, etc.), as the Pension Plan. Contributions are directed to individual member accounts, and the individual members allocate contributions and account balances among various approved investment choices. Costs of administering the Investment Plan, including the FRS Financial Guidance Program, are funded through an employer contribution of 0.04 percent of payroll and by forfeited benefits of plan members. Allocations to the investment member's accounts during the 2015-16 fiscal year, as established by Section 121.72, Florida Statutes, are based on a percentage of gross
78
compensation, by class, as follows: Regular class 5.56%, Special Risk class 20.34%, Senior Management Service class 19.73% and County Elected Officers class 40.57%.
For all membership classes, employees are immediately vested in their own contributions and are vested after one year of service for employer contributions and investment earnings. If an accumulated benefit obligation for service credit originally earned under the Pension Plan is transferred to the Investment Plan, the member must have the years of service required for Pension Plan vesting (including the service credit represented by the transferred funds) to be vested for these funds and the earnings on the funds. Non-vested employer contributions are placed in a suspense account for up to five years. If the employee returns to FRS-covered employment within the five-year period, the employee will regain control over their account. If the employee does not return within the five-year period, the employee will forfeit the accumulated account balance. For the fiscal year ended September 30, 2016, the information for the amount of forfeitures was unavailable from the SBA; however, management believes that these amounts, if any, would be immaterial to the City.
After termination and applying to receive benefits, the member may rollover vested funds to another qualified plan, structure a periodic payment under the Investment Plan, receive a lump-sum distribution, leave the funds invested for future distribution, or any combination of these options. Disability coverage is provided; the member may either transfer the account balance to the Pension Plan when approved for disability retirement to receive guaranteed lifetime monthly benefits under the Pension Plan, or remain in the Investment Plan and rely upon that account balance for retirement income.
The City’s Investment Plan pension expense totaled $300,012 for the fiscal year ended September 30, 2016.
C. Post Employment Benefits Other Than Pensions
Plan Description. The City of Melbourne administers a single-employer defined benefit healthcare plan (the “Plan”) that provides medical insurance to its employees and their eligible dependents. Pursuant to Section 112.0801 Florida Statutes, the City is required to provide eligible retirees (as defined in the City’s pension plans) the opportunity to participate in this Plan at the same cost that is applicable to active employees. Eligible retirees must be drawing an immediate benefit from their respective pension plan and be enrolled in medical coverage prior to retirement. Surviving spouses of participants are allowed access to the Plan but must pay the full premium. Benefit provisions for the Plan were established by City Council on May 12, 1987 and may only be amended by City Council. The City does not issue stand alone financial statements for this Plan. All financial information related to the Plan is accounted for in the City’s basic financial statements.
Funding Policy. The City is funding the post employee benefits on a pay-as-you-go basis. Contribution rates for the Plan are established by City Council annually. For non-union and Police Union employees hired before January 1, 2011, the City provides 50% of the health insurance premium for retirees who opt for coverage through the City’s insurance program or the Florida Retired Public Employees Group Medicare Supplemental Insurance Program as an explicit subsidy. IAFF employees receive a subsidy at the rate of 2% per year of service up to a maximum of 50% of published rates, until the retiree reaches normal medicare age. LIU Union employees receive a subsidy of 50% or $236.90, whichever is less, if they have 22 or more years of service as of October 1, 2010. They receive 25% or $120.00, whichever is less, for a period of 5 years if they have 7 to 22 years of service. There will be no subsidy for LIU employees with less than 7 years of service as of October 1, 2010. For the fiscal year ended September 30, 2016 the City contributed $455,184 to cover 237 retired employees and $19,493 for the Airport to cover 13 retired employees. Blended premium rates for active and retired employees combined provide an implicit subsidy for retirees because on an actual basis, their current and future claims are expected to result in higher costs to the Plan than those of active employees. The current year contribution represents an estimate of this implied subsidy.
Annual OPEB Cost and Net OPEB Obligation. The City’s annual OPEB cost (expense) is calculated based on the annual required contribution (ARC) of the employer, and the amount actuarially determined in accordance with parameters of GASB Statement No. 45. The ARC represents a level of funding that, if paid on an ongoing basis, is projected to cover the normal cost each year to amortize any unfunded actuarial liabilities over a period not to exceed thirty years.
79

The following table shows the components of the City’s annual OPEB cost for the last three fiscal years, the amount actually contributed to the Plan, and changes in the City’s net OPEB obligation to the retiree health plan:
9/30/2014 9/30/2015 9/30/2016Annual required contribution (ARC) 2,907,000$ 1,943,000$ 2,064,000$ Interest on net OPEB obligation 538,000 612,000 648,000 Adjustment to annual required contribution (674,000) (796,000) (877,000) Annual OPEB cost 2,771,000 1,759,000 1,835,000 Contributions made (441,984) (456,329) (474,678) Implicit subsidy (265,000) (284,000) (320,000) Increase in net OPEB obligation 2,064,016 1,018,671 1,040,322 Net OPEB obligation-beginning of year 15,405,811 17,469,827 18,488,498 Net OPEB obligation-end of year 17,469,827$ 18,488,498$ 19,528,820$
The net OPEB obligation is allocated to governmental activities, business-type activities, and the component unit based on the relative proportion of plan participants. At September 30, 2016 the net OPEB obligation of governmental activities, business-type activities, and the component unit is $15,216,973, $3,430,921, and $880,926, respectively. No trust or agency fund has been established for the Plan and there were no adjustments to the annual required contribution or interest earnings. The City’s annual OPEB cost, the percentage of annual OPEB cost contributed to the Plan, and the net OPEB obligation for the past three fiscal years were as follows (dollar amounts in thousands):
2014 2,771$ 707$ 26% 17,470$ 2015 1,759 740 42% 18,488 2016 1,835 795 43% 19,529
Fiscal Year Ended
Annual OPEB Cost
Actual Contribution
Percentage of Annual OPEB Costs Contributed
Net OPEB Obligation
Funded Status and Funding Progress. The funded status as of October 1, 2016, the most recent actuarial valuation date, is as follows (dollar amounts in thousands):
Measurement Date
Actuarial Value of Assets
(a)
Actuarial Accrued Liability (AAL) Projected Unit
Cost (b)
Unfunded AAL (b-a)
Funded Ratio (a/b)
Annual Covered Payroll
(c)
UAAL as a Percentage of
Covered Payroll ((b-a)/c)
10/1/2015 $ - $22,763 $22,763 0% $37,393 60.9%
The projection of future benefit payments for an ongoing plan involves estimates of the value of reported amounts and assumptions about the probability of the occurrence of events far into the future. The actuarial determined amounts regarding the funding status of the Plan and the ARC are subject to continual revision as actual results are compared with past expectations and new estimates are made about the future. The schedule of funding progress, presented as required supplementary information following the notes to the financial statements, presents multiyear trend information about whether the actuarial value of the plan assets is increasing or decreasing over time relative to the actuarial accrued liabilities for benefits. Calculations are based on benefits provided under the terms of the substantive plan at the time of each valuation and on the pattern of cost sharing between the employer and the plan members at that time. Because the Plan has greater than 200 members, the City is required to obtain an actuarial valuation at least every two years.
80

Methods and Assumptions. The actuarial methods and assumptions used include techniques that are designed to reduce the effects of short-term volatility in actuarial accrued liabilities and the actuarial value of the assets, consistent with the long-term perspective of calculations. In the 10/1/2016 actuarial valuation the Projected Unit Credit (PUC) cost method was used with linear pro-ration to assumed benefit commencement. The unfunded actuarial accrued liability is being amortized over a remaining period of 23 years using a 30 year closed amortization both as a level dollar and as a level percent of pay. The actuarial assumptions included a 3.5% investment rate of return, 3% projected annual salary increase, and a 2.2% rate of inflation. The medical trend assumption of 4.7% was developed using the Society of Actuaries Long-Term Medical Trend Model.
D. Contingencies
1. Litigation
The City and the Airport are named as defendants in various lawsuits. The outcome of the lawsuits is not determinable at this time. It is the opinion of counsel that the resolution of these matters will not have a material adverse effect on the financial condition of the City or the Airport.
2. Pollution Remediation
During fiscal year 2012, the City of Melbourne recognized a pollution remediation liability related to contaminated soil and groundwater discovered during the process of removing and decommissioning the vehicle fuel facility at the Melbourne Police Department on Apollo Boulevard. The Florida Department of Environmental Protection approved the Remedial Action Plan for site cleanup and restoration.
Cleanup, restoration, and testing were completed in 2015. No additional testing or remediation is expected.
3. Grants
The City and the Airport receive funds from federal, state, and private agencies under grants and contracts. The costs, both direct and indirect, charged to these grants and contracts are subject to audit and possible disallowance by the sponsoring agency. It is management’s belief that any disallowances or adjustments would not have a significant effect on the financial statements.
E. Subsequent Events
In early October of 2016, the City was impacted by Hurricane Matthew. The estimated costs of overtime, debris removal, and other costs associated with the hurricane were $1,468,645. The City believes that it will be able to obtain reimbursement in the amount of $1,290,472 through insurance and agreements with FEMA and the State.
On October 11, 2016, the City Council approved the purchase of one replacement fire rescue pumper from South Florida Emergency Vehicles, Fort Myers, Florida for $422,278.
On October 25, 2016, the City Council approved the purchase of sewer manhole and lift station lining services from VacVision Environmental, LLC, Tampa, Florida for an estimated annual cost of $880,100.
On November 8, 2016, the City Council approved amendment Nos. 7 and 8 for the engineering services for systems upgrades related to the Reverse Water Treatment Plant Replacement of Control Instrumentation with CH2M Hill Engineers, Inc., Orlando, Florida for $1,443,890.
One December 7, 2016, the Melbourne Airport Authority approved the Construction Manager at Risk, Walbridge, for the guaranteed maximum price for the new Air Traffic Control Tower in the amount not to exceed $5,860,724.
On December 7, 2016, the Melbourne Airport Authority approved the Construction Manager at Risk, Ivey’s Construction, for the guaranteed maximum price for the Federal Inspection Station project in an amount not to exceed $4,630,478.
81
On December 13, 2016, the City Council awarded a contract for the Autumn Woods Stormwater Quality Retrofit to Jobear Contracting, Inc., Palm Bay, Florida for $670,831.
On December 13, 2016, the City Council approved the purchase of fifteen 2017 Dodge Charger Police Package Patrol Units from Gator Chrysler Dodge Jeep, Melbourne, Florida for $502,092.
On January 25, 2017, the Melbourne Airport Authority approved a contract with AVCON, Inc. for professional engineering services for the rehabilitation of Runway 09R-27L in an amount not to exceed $1,200,000.
On February 14, 2017, the City Council awarded a contract for the Sarno Road-US Highway 1 Turn Lane Addition, Stormwater Retrofit and Signalization project to Timothy Rose Contracting, Vero Beach, Florida for $520,994.
82

REQUIRED SUPPLEMENTARY INFORMATION
The following schedules are reported in this subsection:
• Schedule of Revenues, Expenditures and Changes in FundBalance - Budget and Actual – General Fund
• Schedule of Revenues, Expenditures and Changes in FundBalance - Budget and Actual – Downtown RedevelopmentSpecial Revenue Fund
• Schedule of Revenues, Expenditures and Changes in FundBalance - Budget and Actual – Babcock Street RedevelopmentSpecial Revenue Fund
• Schedule of Revenues, Expenditures and Changes in FundBalance - Budget and Actual – Olde Eau Gallie RedevelopmentSpecial Revenue Fund
• Budgetary Notes to Required Supplementary Information• Schedules of Changes in Net Pension Liability and Related
Ratios• Schedule of City Contributions• Schedules of Investment Returns• Schedules of Proportionate Share of the Net Pension
Liability• Schedules of Contributions• Schedule of Funding Progress – OPEB

Variance with
Final Budget -
Positive
Original Final (See Note A) (Negative)
Taxes:
$ 28,906,298 $ 28,751,193 $ 28,762,101 $ 10,908
11,754,608 11,370,437 11,473,828 103,391
Franchise fees 6,985,000 6,689,761 6,668,887 (20,874)
11,797,015 11,966,175 12,150,081 183,906
9,316,944 9,565,145 9,566,648 1,503
2,632,750 3,188,350 3,401,098 212,748
293,400 303,400 259,230 (44,170)
157,792 312,792 357,046 44,254
905,995 989,029 823,071 (165,958)
Total revenues 72,749,802 73,136,282 73,461,990 325,708
EXPENDITURES
Mayor and council 168,442 169,862 166,578 3,284
City manager 746,055 768,082 732,922 35,160
City attorney 710,317 723,081 715,029 8,052
City clerk 404,111 451,203 429,494 21,709
Accounting and budget 1,760,864 1,782,044 1,757,432 24,612
Management services 308,194 290,137 288,647 1,490
Procurement 457,910 443,408 438,881 4,527
Personnel 537,711 554,311 517,943 36,368
Information technology 3,651,261 4,148,143 4,082,221 65,922
Engineering 1,284,966 1,318,790 1,314,665 4,125
Planning and economic development 680,415 709,590 700,603 8,987
Other - unclassified 4,365,450 3,966,458 3,729,216 237,242
15,075,696 15,325,109 14,873,631 451,478
18,484,302 19,189,236 18,443,219 746,017
24,952,611 25,246,611 24,359,900 886,711
43,436,913 44,435,847 42,803,119 1,632,728
7,363,745 7,750,141 6,933,362 816,779
Parks and recreation 6,899,575 6,952,050 6,355,822 596,228
Housing and urban improvement 456,963 480,414 467,539 12,875
760,227 760,227 760,227 -
345,429 345,429 345,427 2
1,105,656 1,105,656 1,105,654 2
Total expenditures 74,338,548 76,049,217 72,539,127 3,510,090
Excess(deficiency) of revenues
over(under) expenditures (1,588,746) (2,912,935) 922,863 3,835,798
OTHER FINANCING SOURCES (USES)
3,201,791 3,234,717 3,240,626 5,909
(2,276,378) (2,295,794) (2,779,508) (483,714)
30,000 55,000 45,208 (9,792)
Total other financing sources (uses) 955,413 993,923 506,326 (487,597)
Net change in fund balance (633,333) (1,919,012) 1,429,189 3,348,201
19,629,229 19,629,229 19,629,229 -
Fund balance, September 30 $ 18,995,896 $ 17,710,217 $ 21,058,418 $ 3,348,201
Fund balance, October 1
Sale of capital assets
Transfers out
Total public saftey
Transfers in
Interest and fiscal agent fees
Principal
Debt service:
Public works
Total debt service
Fines, forfeitures, penalties and fees
Investment earnings
Police
Other revenues
General government:
Current:
Total general government
Public Safety:
Fire
REQUIRED SUPPLEMENTARY INFORMATION
SCHEDULE OF REVENUES, EXPENDITURES AND CHANGES IN FUND BALANCE -
GENERAL FUND
BUDGET AND ACTUAL
CITY OF MELBOURNE FLORIDA
FOR THE YEAR ENDED SEPTEMBER 30, 2016
Actual Amounts
Budgeted Amounts (Budgetary Basis)
Property
Licenses and permits
Intergovernmental
Charges for services
REVENUES
Utility and communications
83
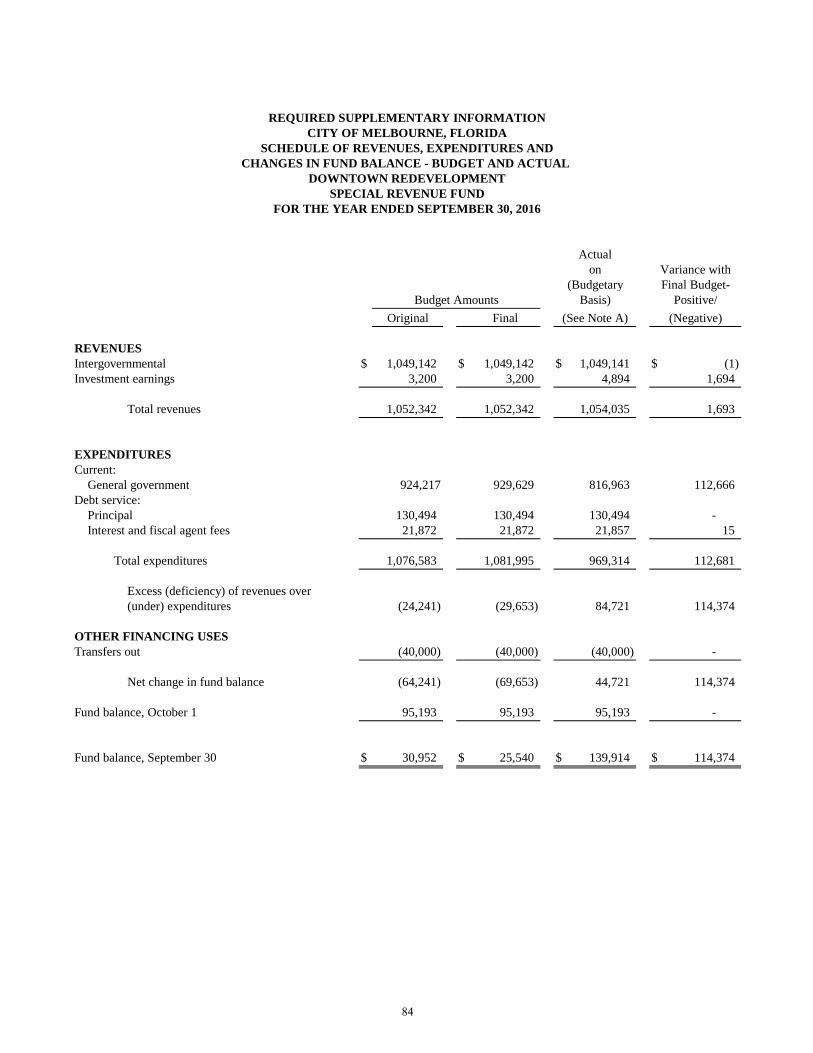
CITY OF MELBOURNE, FLORIDASCHEDULE OF REVENUES, EXPENDITURES AND
CHANGES IN FUND BALANCE - BUDGET AND ACTUAL DOWNTOWN REDEVELOPMENT
SPECIAL REVENUE FUNDFOR THE YEAR ENDED SEPTEMBER 30, 2016
Budget AmountsOriginal Final
REVENUESIntergovernmental $ 1,049,142 $ 1,049,142 $ 1,049,141 $ (1)Investment earnings 3,200 3,200 4,894 1,694
Total revenues 1,052,342 1,052,342 1,054,035 1,693
EXPENDITURESCurrent:
General government 924,217 929,629 816,963 112,666 Debt service:
Principal 130,494 130,494 130,494 - Interest and fiscal agent fees 21,872 21,872 21,857 15
Total expenditures 1,076,583 1,081,995 969,314 112,681
Excess (deficiency) of revenues over(under) expenditures (24,241) (29,653) 84,721 114,374
OTHER FINANCING USESTransfers out (40,000) (40,000) (40,000) -
Net change in fund balance (64,241) (69,653) 44,721 114,374
Fund balance, October 1 95,193 95,193 95,193 -
Fund balance, September 30 $ 30,952 $ 25,540 $ 139,914 $ 114,374
Positive/(Negative)
Final Budget-
REQUIRED SUPPLEMENTARY INFORMATION
Variance with
(See Note A)Basis)
(Budgetaryon
Actual
84

REVENUESIntergovernmental $ 747,179 $ 747,179 $ 747,179 $ - Investment earnings 2,400 2,400 6,477 4,077
Total revenues 749,579 749,579 753,656 4,077
EXPENDITURESCurrent:
General government 667,996 698,745 241,036 457,709
Excess of revenues over expenditures 81,583 50,834 512,620 461,786
OTHER FINANCING USESTransfers out (250,000) (250,000) (250,000) -
Net change in fund balance (168,417) (199,166) 262,620 461,786
Fund balance, October 1 212,961 212,961 212,961 -
Fund balance, September 30 $ 44,544 $ 13,795 $ 475,581 $ 461,786
Original Final
Variance withFinal Budget-
(Negative)
on(Budgetary
Basis)(See Note A)
Positive/
SPECIAL REVENUE FUNDFOR THE YEAR ENDED SEPTEMBER 30, 2016
Budget Amounts
Actual
REQUIRED SUPPLEMENTARY INFORMATIONCITY OF MELBOURNE, FLORIDA
SCHEDULE OF REVENUES, EXPENDITURES ANDCHANGES IN FUND BALANCE - BUDGET AND ACTUAL
BABCOCK STREET REDEVELOPMENT
85

CITY OF MELBOURNE, FLORIDASCHEDULE OF REVENUES, EXPENDITURES AND
CHANGES IN FUND BALANCE - BUDGET AND ACTUAL OLDE EAU GALLIE REDEVELOPMENT
SPECIAL REVENUE FUNDFOR THE YEAR ENDED SEPTEMBER 30, 2016
REVENUESIntergovernmental $ 271,004 $ 271,004 $ 271,004 $ - Investment earnings 1,500 1,500 4,187 2,687 Other revenue - - 5,000 5,000
Total revenues 272,504 272,504 280,191 7,687
EXPENDITURESCurrent:
General government 273,357 273,357 160,784 112,573 Debt service:
Principal 36,064 36,064 - 36,064 Interest and fiscal agent fees 7,792 7,792 3,581 4,211
Total expenditures 317,213 317,213 164,365 152,848
Net change in fund balance (44,709) (44,709) 115,826 160,535
Fund balance, October 1 78,916 78,916 78,916 -
Fund balance, September 30 $ 34,207 $ 34,207 $ 194,742 $ 160,535
REQUIRED SUPPLEMENTARY INFORMATION
Budget AmountsOriginal Final
Actualon
(BudgetaryBasis)
(See Note A) (Negative)
Final Budget-Variance with
Positive/
86
REQUIRED SUPPLEMENTARY INFORMATION BUDGETARY NOTES TO REQUIRED SUPPLEMENTARY INFORMATION
The City Council typically adopts an annual budget for the General fund and the Special Revenue funds. The City Council adopts budgets for projects in Capital Projects funds on a “life of the project” basis. All budgets are prepared on a modified accrual basis with encumbrance accounting. Budgetary control is legally maintained at the fund level. Budget transfer authority is provided to the City Manager within a fund as long as the total budget of the fund is not increased. City Council action is required for the approval of a supplemental budget.
Governmental Accounting Standards Board Statement No. 34, “Basic Financial Statements – and Management’s Discussion and Analysis-for State and Local Governments” requires reporting of supplementary information for budgetary comparison schedules for the general fund and each major special revenue fund that has a legally adopted annual budget. These schedules include the original budget, the final budget, and actual amounts (stated on the budgetary basis). The City has shown three special revenue funds as major funds, and, accordingly, is presenting the budgetary comparison schedule for the General Fund, Downtown Redevelopment, Babcock Street Redevelopment and Olde Eau Gallie Redevelopment with original and final budgets, as Required Supplementary Information.
There was no budget adopted for the Law Enforcement Special Revenue fund. Funds accumulated in the Law Enforcement fund are transferred to other funds, from which expenditures are made, and these expenditures are budgeted in those funds. Capital Projects funds have budgets which are approved on a “life of the project basis”. These budget periods are not consistent with the method of financial reporting; therefore, comparisons between the results of operations and budgets in these funds are not relevant and are not presented herein.
Supplemental appropriations were made during the year and all budget amounts presented in the accompanying Schedule of Revenues, Expenditures and Changes in Fund Balance for the General Fund, Downtown Redevelopment, Babcock Street Redevelopment and Olde Eau Gallie Redevelopment funds have been adjusted for legally authorized revisions of the annual budget. All appropriations which are not expended, encumbered, or committed lapse at year end. Encumbered appropriations are carried forward to the subsequent year’s budget.
Encumbrance accounting, under which purchase orders, contracts, and other commitments for the expenditure of monies are recorded in order to reserve that portion of the applicable appropriation, is employed as an extension of formal budgetary integration in the General, Special Revenue, and Capital Projects funds. Encumbrances outstanding at year end are carried forward to the next year’s budget and are reported as a restricted or assigned fund balance in the governmental fund financial statements since they do not constitute actual expenditures or liabilities.
Actual results of operations are presented in accordance with generally accepted accounting principles (GAAP basis) and the City’s accounting policies do not recognize encumbrances as expenditures until the period in which the actual goods or services are received and a liability is incurred. It is necessary to include budgetary encumbrances to reflect actual revenues and expenditures on a basis consistent with the City’s legally adopted budget.
87

A – Explanation of Differences between Budgetary Inflows and Outflows and GAAP Revenues and Expenditures
Revenues
Actual amounts (budgetary basis) of total revenues as reported on the statement of revenues, expenditures and changes in fund balances - - budget and actual equal total revenues as reported on the statement of revenues, expenditures, and changes in fund balances.
Expenditures General FundDowntown
RedevelopmentBabcock Street Redevelopment
Olde Eau Gallie Redevelopment
Actual amounts (budgetary basis) "totalexpenditures" as reported on the statement ofrevenues, expenditures and changes in fundbalances - - budget and actual 72,539,127$ 969,314$ 241,036$ 164,365$
Differences - - budget to GAAP:
Encumbrances for professional services,supplies and equipment ordered but notreceived are reported in the year the order isplaced for budgetary purposes, but in the year the supplies and services are received forfinancial reporting purposes. (814,592) (70,000) (30,794) (22,675)
Total expenditures are reported on thestatement of revenues, expenditures, andchanges in fund balances. 71,724,535$ 899,314$ 210,242$ 141,690$
B – Explanation of Differences between Budgetary Inflows and Outflows and GAAP Revenues and Expenditures
The budgetary schedules present comparisons of the legally adopted budget with actual data on a budgetary basis. Since accounting principles applied for purposes of developing data on a budgetary basis differ significantly from those used to present financial statements in conformity with generally accepted accounting principles, a reconciliation of the resultant timing differences in the excess (deficiency) of revenues over (under) expenditures and other financing sources (uses) (Budgetary Basis) as compared to the excess (deficiency) of revenues over (under) expenditures and other financing sources (uses) (GAAP Basis) for the year ended September 30, 2016 is presented in the following table:
General FundDowntown
RedevelopmentBabcock Street Redevelopment
Olde Eau Gallie Redevelopment
Excess (deficiency) of revenues over (under) expenditures and other financing sources (uses) (Budgetary Basis) 1,429,189$ 44,721$ 262,620$ 115,826$
Adjustments:
Encumbrances 814,592 70,000 30,794 22,675 Excess (deficiency) of revenues over (under) expenditures and other financing sources (uses) (GAAP Basis) 2,243,781$ 114,721$ 293,414$ 138,501$
88

REQUIRED SUPPLEMENTARY INFORMATION
Governmental Accounting Standards Board Statements No 67 “Financial Reporting for Pension Plans” and No 68 “Accounting and Financial Reporting for Pensions” require supplementary information be reported on the local pension plans in addition to that provided in the Notes to the Financial Statements. This information is presented in the following schedules.
9/30/2016 9/30/2015* 9/30/2014Total pension liabilityService cost 1,596,483$ 1,465,467$ 1,431,629$ Interest 6,164,017 5,937,717 5,743,448 Changes of benefit terms - (1,042,704) - Difference between expected and actual experience - (418,968) (604,020) Changes in assumptions - 76,676 1,189,708 Benefit payments, including refunds of employee contributions (4,459,046) (4,151,523) (4,161,045) Net change in total pension liability 3,301,454 1,866,665 3,599,720 Total pension liability - beginning 78,167,002 76,300,337 72,700,617 Total pension liability - ending (a) 81,468,456$ 78,167,002$ 76,300,337$
Plan fiduciary net positionContributions - employer 2,622,565$ 2,702,209$ 2,282,865$ Contributions - state 545,561 569,837 604,006 Contributions - employee 578,536 466,578 442,286 Net investment income 6,138,463 126,002 5,965,296 Benefit payments, including refunds of employee contributions (4,459,046) (4,151,523) (4,161,045) Administrative expense (128,302) (132,078) (159,794) Net change in plan fiduciary net position 5,297,777 (418,975) 4,973,614
Plan fiduciary net position - beginning 58,341,219 58,760,194 53,786,580 Plan fiduciary net position - ending (b) 63,638,996$ 58,341,219$ 58,760,194$
Net pension liability - ending (a) - (b) 17,829,460$ 19,825,783$ 17,540,143$
Plan fiduciary net position as a percentage of the 78.11% 74.64% 77.01% total pension liabilityCovered employee payroll 6,893,083$ 6,513,920$ 6,075,965$
Net pension liability as a percentage of covered 258.66% 304.36% 288.68% employee payroll
FIREFIGHTERS PENSION
SCHEDULE OF CHANGES IN NET PENSION LIABILITYCITY OF MELBOURNE, FLORIDA
LAST THREE FISCAL YEARSAND RELATED RATIOS
*The net pension liability recognized by the City in the current year financial statements represents the netpension liability as of September 30, 2015, which is allowed by GASB Statement No. 68.
89
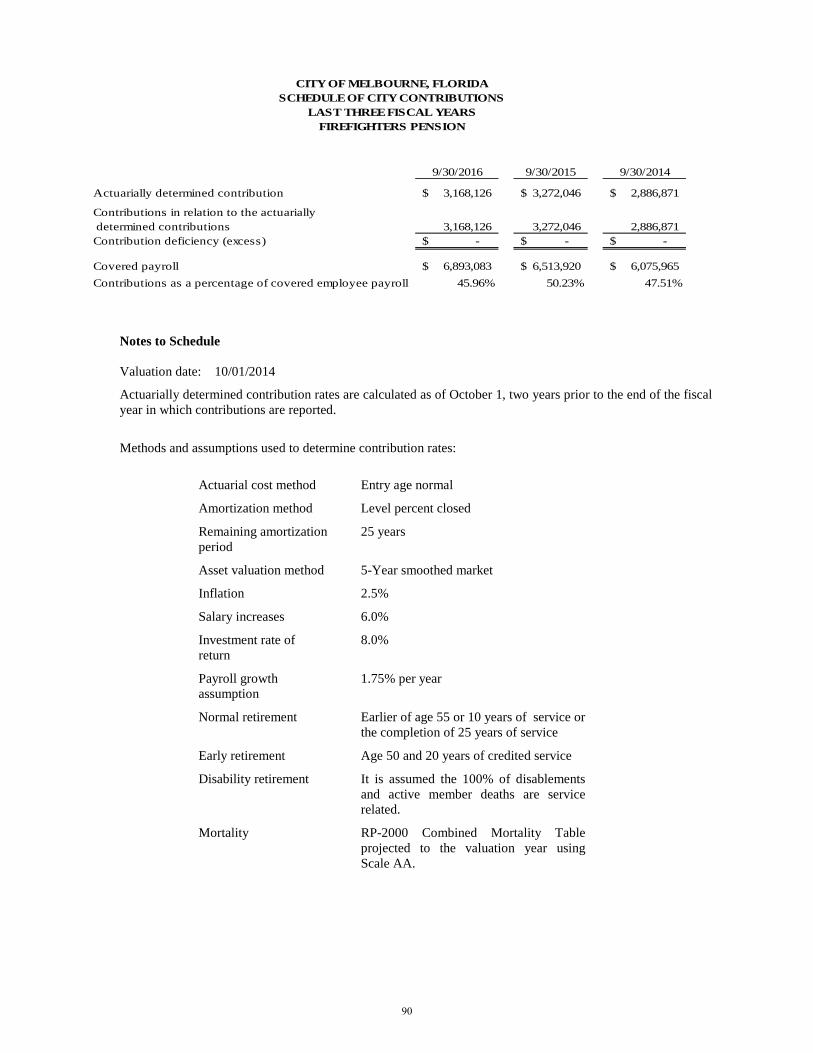
9/30/2016 9/30/2015 9/30/2014
Actuarially determined contribution 3,168,126$ 3,272,046$ 2,886,871$
Contributions in relation to the actuarially determined contributions 3,168,126 3,272,046 2,886,871 Contribution deficiency (excess) -$ -$ -$
Covered payroll 6,893,083$ 6,513,920$ 6,075,965$ Contributions as a percentage of covered employee payroll 45.96% 50.23% 47.51%
LAST THREE FISCAL YEARSSCHEDULE OF CITY CONTRIBUTIONS
CITY OF MELBOURNE, FLORIDA
FIREFIGHTERS PENSION
Notes to Schedule
Valuation date: 10/01/2014
Actuarially determined contribution rates are calculated as of October 1, two years prior to the end of the fiscal year in which contributions are reported.
Methods and assumptions used to determine contribution rates:
Actuarial cost method Entry age normal
Amortization method Level percent closed
Remaining amortization period
25 years
Asset valuation method 5-Year smoothed market
Inflation 2.5%
Salary increases 6.0%
Investment rate of return
8.0%
Payroll growth assumption
1.75% per year
Normal retirement Earlier of age 55 or 10 years of service or the completion of 25 years of service
Early retirement Age 50 and 20 years of credited service
Disability retirement It is assumed the 100% of disablements and active member deaths are service related.
Mortality RP-2000 Combined Mortality Table projected to the valuation year using Scale AA.
90

9/30/2016 9/30/2015 * 9/30/2014Total pension liabilityService cost 1,514,579$ 1,457,495$ 1,468,863$ Interest 6,609,747 6,500,397 6,297,597 Difference between expected and actual experience (723,896) (129,550) - Changes in assumptions 2,243,175 (1,189,338) - Contributions - buy back 6,497 8,784 - Benefit payments, including refunds of employee contributions (4,794,165) (5,699,583) (4,402,589) Net change in total pension liability 4,855,937 948,205 3,363,871 Total pension liability - beginning 89,140,238 88,192,033 84,828,162 Total pension liability - ending (a) 93,996,175$ 89,140,238$ 88,192,033$
Plan fiduciary net positionContributions - employer 2,948,527$ 2,876,710$ 3,025,362$ Contributions - state 597,263 543,474 535,651 Contributions - employee 549,814 512,708 523,863 Contributions - buy back 6,497 8,784 - Net investment income 6,589,808 (43,614) 6,199,184 Benefit payments, including refunds of employee contributions (4,794,165) (5,699,583) (4,402,589) Administrative expense (106,160) (78,532) (85,877) Net change in plan fiduciary net position 5,791,584 (1,880,053) 5,795,594
Plan fiduciary net position - beginning 66,127,077 68,007,130 62,211,536 Plan fiduciary net position - ending (b) 71,918,661$ 66,127,077$ 68,007,130$
Net pension liability - ending (a) - (b) 22,077,514$ 23,013,161$ 20,184,903$
Plan fiduciary net position as a percentage of the 76.51% 74.18% 77.11% total pension liabilityCovered employee payroll 8,108,369$ 8,613,965$ 7,753,130$
Net pension liability as a percentage of covered 272.28% 267.16% 260.35% employee payroll
POLICE OFFICERS PENSION
SCHEDULE OF CHANGES IN NET PENSION LIABILITYCITY OF MELBOURNE, FLORIDA
LAST THREE FISCAL YEARSAND RELATED RATIOS
*The net pension liability recognized by the City in the current year financial statements represents the netpension liability as of September 30, 2015, which is allowed by GASB Statement No. 68.
91

9/30/2016 9/30/2015 9/30/2014
Actuarially determined contribution 3,545,790$ 3,420,184$ 3,561,013$
Contributions in relation to the actuarially determined contributions 3,545,790 3,420,184 3,561,013 Contribution deficiency (excess) -$ -$ -$
Covered payroll 8,108,369$ 8,613,965$ 7,753,130$ Contributions as a percentage of covered employee payroll 43.73% 39.71% 45.93%
LAST THREE FISCAL YEARSSCHEDULE OF CITY CONTRIBUTIONS
CITY OF MELBOURNE, FLORIDA
POLICE OFFICERS PENSION
Notes to Schedule
Valuation date: 10/01/2014
Actuarially determined contribution rates are calculated as of October 1, two years prior to the end of the fiscal year in which contributions are reported.
Methods and assumptions used to determine contribution rates:
Actuarial cost method Entry age normal
Amortization method Level percent closed
Remaining amortization period
30 years
Asset valuation method
Historical geometric 4 year average market value returns, net of fees
Inflation 2.5%
Salary increases 6.0%
Investment rate of return
7.5%
Payroll growth assumption
0.9%
Normal retirement Earlier of age 55 and 10 years of service or the completion of 25 years of service
Early retirement Age 45 and 10 years of service
Disability retirement It is assumed that 75% of disablements and active member deaths are service related.
Mortality RP-2000 Combined Healthy-Sex Distinct. Disabled lives set forward 5 years. Based on a study of over 650 public safety funds with a 10% margin for future mortality improvement.
92
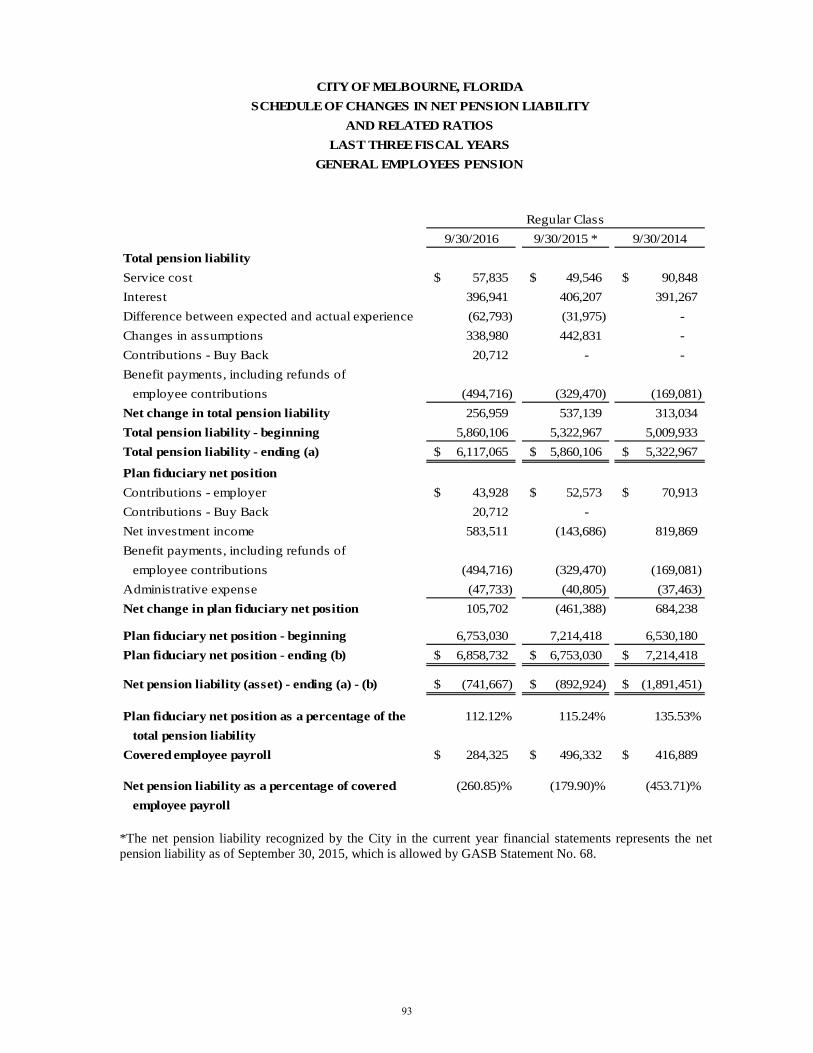
9/30/2016 9/30/2015 * 9/30/2014Total pension liabilityService cost 57,835$ 49,546$ 90,848$ Interest 396,941 406,207 391,267 Difference between expected and actual experience (62,793) (31,975) - Changes in assumptions 338,980 442,831 - Contributions - Buy Back 20,712 - - Benefit payments, including refunds of employee contributions (494,716) (329,470) (169,081) Net change in total pension liability 256,959 537,139 313,034 Total pension liability - beginning 5,860,106 5,322,967 5,009,933 Total pension liability - ending (a) 6,117,065$ 5,860,106$ 5,322,967$
Plan fiduciary net positionContributions - employer 43,928$ 52,573$ 70,913$ Contributions - Buy Back 20,712 - Net investment income 583,511 (143,686) 819,869 Benefit payments, including refunds of employee contributions (494,716) (329,470) (169,081) Administrative expense (47,733) (40,805) (37,463) Net change in plan fiduciary net position 105,702 (461,388) 684,238
Plan fiduciary net position - beginning 6,753,030 7,214,418 6,530,180 Plan fiduciary net position - ending (b) 6,858,732$ 6,753,030$ 7,214,418$
Net pension liability (asset) - ending (a) - (b) (741,667)$ (892,924)$ (1,891,451)$
Plan fiduciary net position as a percentage of the 112.12% 115.24% 135.53% total pension liabilityCovered employee payroll 284,325$ 496,332$ 416,889$
Net pension liability as a percentage of covered (260.85)% (179.90)% (453.71)% employee payroll
Regular Class
GENERAL EMPLOYEES PENSION
SCHEDULE OF CHANGES IN NET PENSION LIABILITYCITY OF MELBOURNE, FLORIDA
LAST THREE FISCAL YEARSAND RELATED RATIOS
*The net pension liability recognized by the City in the current year financial statements represents the netpension liability as of September 30, 2015, which is allowed by GASB Statement No. 68.
93
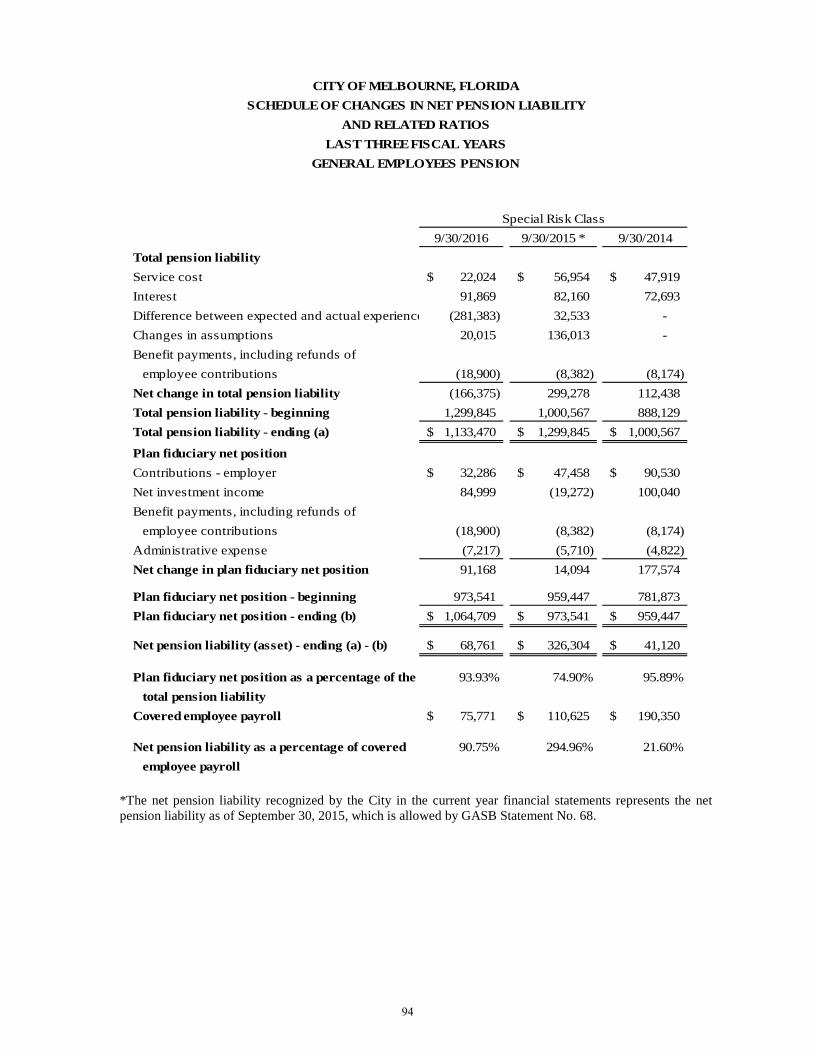
9/30/2016 9/30/2015 * 9/30/2014Total pension liabilityService cost 22,024$ 56,954$ 47,919$ Interest 91,869 82,160 72,693 Difference between expected and actual experience (281,383) 32,533 - Changes in assumptions 20,015 136,013 - Benefit payments, including refunds of employee contributions (18,900) (8,382) (8,174) Net change in total pension liability (166,375) 299,278 112,438 Total pension liability - beginning 1,299,845 1,000,567 888,129 Total pension liability - ending (a) 1,133,470$ 1,299,845$ 1,000,567$
Plan fiduciary net positionContributions - employer 32,286$ 47,458$ 90,530$ Net investment income 84,999 (19,272) 100,040 Benefit payments, including refunds of employee contributions (18,900) (8,382) (8,174) Administrative expense (7,217) (5,710) (4,822) Net change in plan fiduciary net position 91,168 14,094 177,574
Plan fiduciary net position - beginning 973,541 959,447 781,873 Plan fiduciary net position - ending (b) 1,064,709$ 973,541$ 959,447$
Net pension liability (asset) - ending (a) - (b) 68,761$ 326,304$ 41,120$
Plan fiduciary net position as a percentage of the 93.93% 74.90% 95.89% total pension liabilityCovered employee payroll 75,771$ 110,625$ 190,350$
Net pension liability as a percentage of covered 90.75% 294.96% 21.60% employee payroll
SCHEDULE OF CHANGES IN NET PENSION LIABILITYCITY OF MELBOURNE, FLORIDA
LAST THREE FISCAL YEARSAND RELATED RATIOS
Special Risk Class
GENERAL EMPLOYEES PENSION
*The net pension liability recognized by the City in the current year financial statements represents the netpension liability as of September 30, 2015, which is allowed by GASB Statement No. 68.
94

9/30/2016 9/30/2015 9/30/2014Actuarially determined contribution 43,928$ 52,573$ 70,913$ Contributions in relation to the actuarially
determined contributions 43,928 52,573 70,913 Contribution deficiency (excess) -$ -$ -$ Covered payroll 284,325$ 496,332$ 416,889$ Contributions as a percentage of covered employee payroll 15.45% 10.59% 17.01%
9/30/2016 9/30/2015 9/30/2014Actuarially determined contribution 32,286$ 47,458$ 90,530$ Contributions in relation to the actuarially
determined contributions 32,286 47,458 90,530 Contribution deficiency (excess) -$ -$ -$ Covered payroll 75,771$ 110,625$ 190,350$ Contributions as a percentage of covered employee payroll 42.61% 42.90% 47.56%
CITY OF MELBOURNE, FLORIDASCHEDULE OF CITY CONTRIBUTIONS
LAST THREE FISCAL YEARSGENERAL EMPLOYEES PENSION
Special Risk Class
Regular Class
Notes to Schedule
Valuation date: 10/01/2014
Actuarially determined contribution rates are calculated as of October 1, two years prior to the end of the fiscal year in which contributions are reported.
Methods and assumptions used to determine contribution rates:
Actuarial cost method Entry age normal
Amortization method Level percentage of pay, closed
Remaining amortization period 16 years
Asset valuation method Historical geometric 4 year average market value returns, net of fees
Inflation 3.0%
Salary increases 6.0%
Investment rate of return 7.8%
Payroll growth assumption None
Normal retirement Regular - Earlier of age 62 and 6 years of service or the completion of 30 years of service
Special Risk – Earlier of 55 and 6 years of service or the completion of 25 years of service
Early retirement Regular – Age 52 and 6 years of service, or the completion of 20 years
Special Risk – Completion of 6 years of service
Disability retirement It is assumed that 100% of disablements and active member deaths are service related.
Mortality RP-2000 Combined Healthy Mortality Table projected to valuation date using Scale AA. Disabled lives set forward 5 years.
95

9/30/2016 9/30/2015 9/30/2014Annual money-weighted rate of return, net of investment expenses 10.36% 0.07% 10.85%
9/30/2016 9/30/2015 9/30/2014Annual money-weighted rate of return, net of investment expenses 10.02% (0.07 )% 9.99%
9/30/2016 9/30/2015 9/30/2014Annual money-weighted rate of return, net of investment expenses 8.46% (1.92 )% 11.79%
GENERAL EMPLOYEES PENSION
CITY OF MELBOURNE, FLORIDASCHEDULES OF INVESTMENT RETURNS
LAST THREE FISCAL YEARS
FIREFIGHTERS PENSION
POLICE OFFICERS PENSION
96

2016 2015 2014
City's proportion of the net pension liability (asset) 0.079258566% 0.079673656% 0.079984257%
City's proportionate share of the net pension liability (asset) 20,012,850$ 10,290,921$ 4,880,216$
City's covered-employee payroll 27,871,449 26,680,027 25,481,617
City's proportionate share of the net pension liability (asset)as a percentage of its covered-employee payroll 71.80% 38.57% 19.15%
Plan fiduciary net position as a percentage of the total pension liability 84.88% 92.00% 96.09%
2016 2015 2014
City's proportion of the net pension liability (asset) 0.090215231% 0.087923955% 0.088954715%
City's proportionate share of the net pension liability (asset) 10,514,211$ 8,966,860$ 8,317,483$
City's covered-employee payroll 27,871,449 26,680,027 25,481,617
City's proportionate share of the net pension liability (asset)as a percentage of its covered-employee payroll 37.72% 33.60% 32.64%
Plan fiduciary net position as a percentage of the total pension liability .97% .50% .99%
LAST THREE FISCAL YEARS
The amounts presented for each fiscal year were determined as of 6/30.
CITY OF MELBOURNE, FLORIDA
FLORIDA RETIREMENT SYSTEMLAST THREE FISCAL YEARS
The amounts presented for each fiscal year were determined as of 6/30.
SCHEDULE OF PROPORTIONATE SHARE OF THE NET PENSION LAIBILITYHEALTH INSURANCE SUBSIDY PROGRAM
SCHEDULE OF PROPORTIONATE SHARE OF THE NET PENSION LAIBILITY
CITY OF MELBOURNE, FLORIDA
97
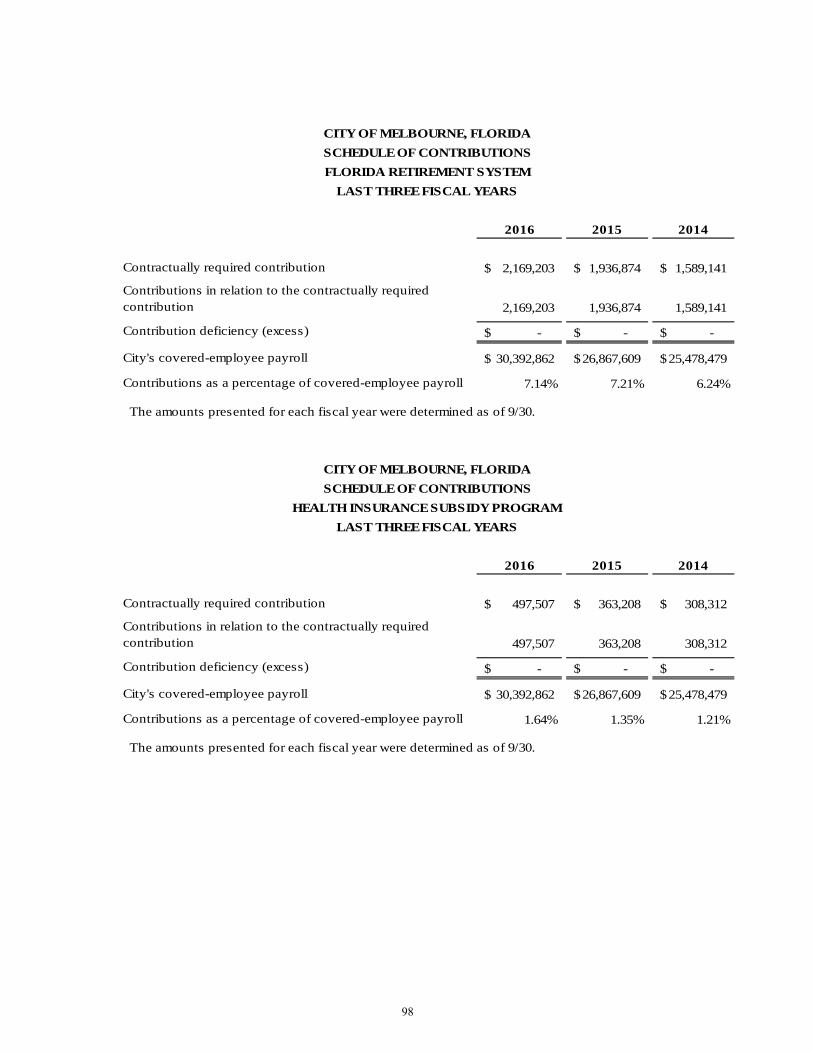
2016 2015 2014
Contractually required contribution 2,169,203$ 1,936,874$ 1,589,141$
Contributions in relation to the contractually required contribution 2,169,203 1,936,874 1,589,141
Contribution deficiency (excess) -$ -$ -$
City's covered-employee payroll 30,392,862$ 26,867,609$ 25,478,479$
Contributions as a percentage of covered-employee payroll 7.14% 7.21% 6.24%
2016 2015 2014
Contractually required contribution 497,507$ 363,208$ 308,312$
Contributions in relation to the contractually required contribution 497,507 363,208 308,312
Contribution deficiency (excess) -$ -$ -$
City's covered-employee payroll 30,392,862$ 26,867,609$ 25,478,479$
Contributions as a percentage of covered-employee payroll 1.64% 1.35% 1.21%
HEALTH INSURANCE SUBSIDY PROGRAM
The amounts presented for each fiscal year were determined as of 9/30.
LAST THREE FISCAL YEARS
LAST THREE FISCAL YEARS
CITY OF MELBOURNE, FLORIDASCHEDULE OF CONTRIBUTIONSFLORIDA RETIREMENT SYSTEM
The amounts presented for each fiscal year were determined as of 9/30.
CITY OF MELBOURNE, FLORIDASCHEDULE OF CONTRIBUTIONS
98
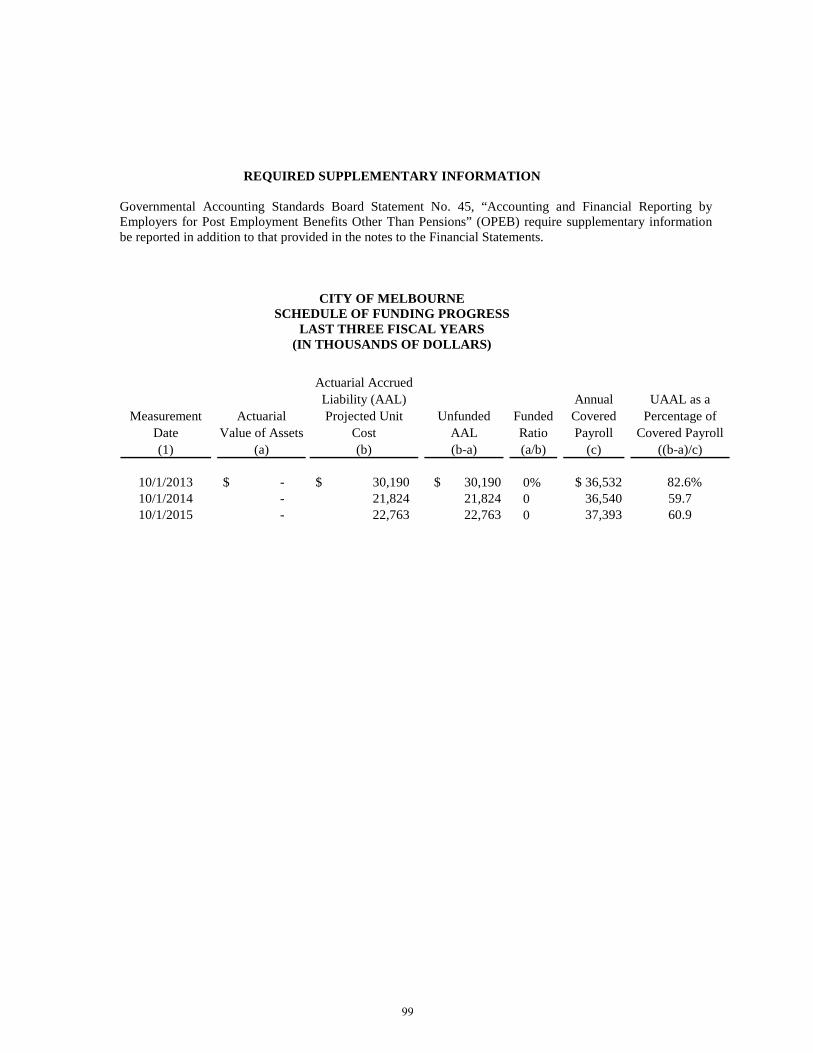
REQUIRED SUPPLEMENTARY INFORMATION
Governmental Accounting Standards Board Statement No. 45, “Accounting and Financial Reporting by Employers for Post Employment Benefits Other Than Pensions” (OPEB) require supplementary information be reported in addition to that provided in the notes to the Financial Statements.
CITY OF MELBOURNE SCHEDULE OF FUNDING PROGRESS
LAST THREE FISCAL YEARS (IN THOUSANDS OF DOLLARS)
Measurement Date (1)
Actuarial Value of Assets
(a)
Actuarial Accrued Liability (AAL) Projected Unit
Cost (b)
Unfunded AAL (b-a)
Funded Ratio (a/b)
Annual Covered Payroll
(c)
UAAL as a Percentage of
Covered Payroll ((b-a)/c)
10/1/2013 $ - $ 30,190 $ 30,190 0% $ 36,532 '82.6%10/1/2014 - 21,824 21,824 0 36,540 59.710/1/2015 - 22,763 22,763 0 37,393 60.9
99
COMBINING AND INDIVIDUAL FUND STATEMENTS AND SCHEDULES
The following statements and schedules are reported in this subsection:
• Nonmajor Governmental Funds• Nonmajor Enterprise Funds• Internal Service Funds• Fiduciary Fund• Discretely Presented Component Unit

NONMAJOR GOVERNMENTAL FUNDS
SPECIAL REVENUE FUNDS
Special Revenue Funds are used to account for revenues from specific revenue sources, which by law are designed to finance particular functions, or activities of the government and which, therefore, cannot be diverted to other uses.
The City maintains the following Special Revenue Funds to finance construction improvements and provide housing and economic assistance to lower income residents:
• Community Development Block Grant• State Housing Initiative Partnership Program• HOME Investment Partnership Program• Neighborhood Stabilization Program 3• Law Enforcement – accounts for confiscated money, vehicles,
and tangible personal property for use in law enforcementactivities.

CAPITAL PROJECTS FUNDS
Capital Projects Funds account for all resources used for the acquisition and/or construction of capital facilities by the City, except those financed by the Enterprise Funds.
The City maintains the following Capital Projects Funds:
• General Construction – accounts for capital improvementsmainly funded by General fund, grants, and transfers from theRedevelopment funds.
• Mobility Improvement – accounts for mobility improvementsmainly funded by mobility impact fees from developers.
• Recreation Improvement – accounts for recreation facilitiesimprovements mainly funded by recreation impact fees fromdevelopers.
• Bikeways Improvement – accounts for bikepath improvementsmainly funded by bikeway impact fees from developers.
• Public Facility Improvement – accounts for public facilityimprovements mainly funded by public facility impact fees fromdevelopers.
PERMANENT FUNDS
Permanent Funds are used to account for resources that are legally restricted to the extent that only earnings, not principal, may be used for purposes that support the reporting government’s programs.
The City maintains the following Permanent Fund:
• Perpetual Care – accounts for funds held in trust to financemaintenance for the City’s municipal cemeteries.
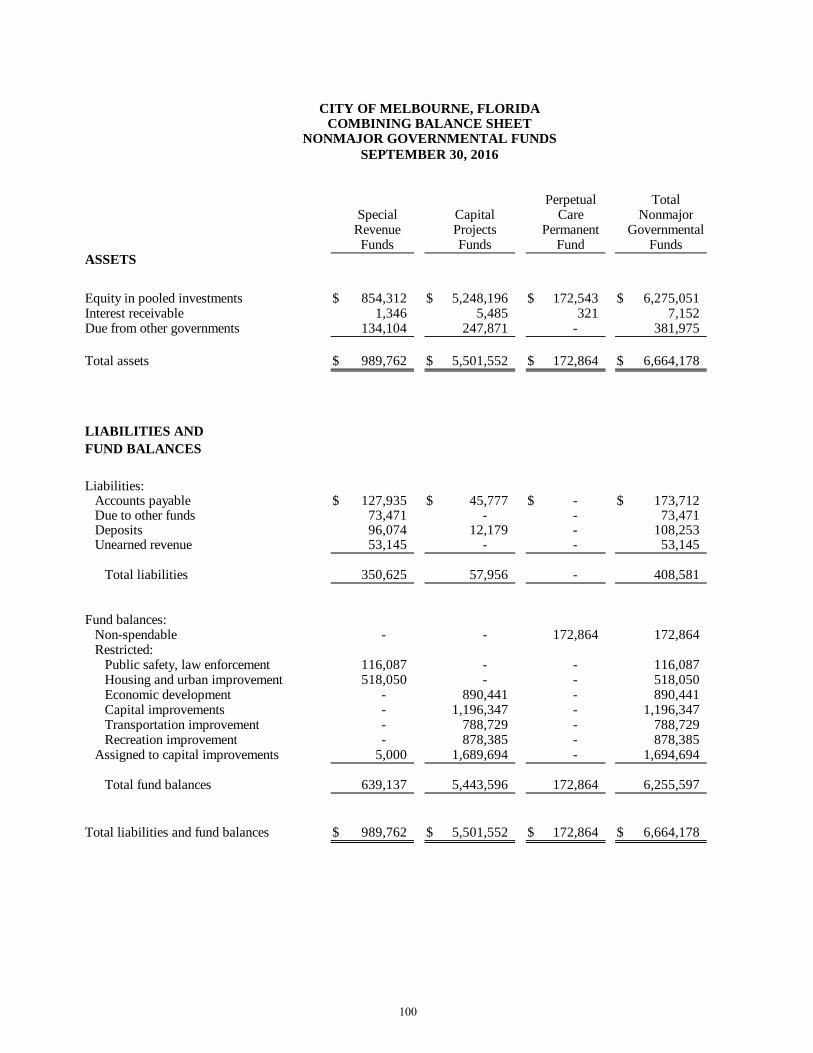
CITY OF MELBOURNE, FLORIDACOMBINING BALANCE SHEET
NONMAJOR GOVERNMENTAL FUNDSSEPTEMBER 30, 2016
Perpetual TotalSpecial Capital Care Nonmajor
Revenue Projects Permanent GovernmentalFunds Funds Fund Funds
ASSETS
Equity in pooled investments $ 854,312 $ 5,248,196 $ 172,543 $ 6,275,051 Interest receivable 1,346 5,485 321 7,152 Due from other governments 134,104 247,871 - 381,975
Total assets $ 989,762 $ 5,501,552 $ 172,864 $ 6,664,178
LIABILITIES ANDFUND BALANCES
Liabilities:Accounts payable $ 127,935 $ 45,777 $ - $ 173,712 Due to other funds 73,471 - - 73,471 Deposits 96,074 12,179 - 108,253 Unearned revenue 53,145 - - 53,145
Total liabilities 350,625 57,956 - 408,581
Fund balances:Non-spendable - - 172,864 172,864 Restricted:
Public safety, law enforcement 116,087 - - 116,087 Housing and urban improvement 518,050 - - 518,050 Economic development - 890,441 - 890,441 Capital improvements - 1,196,347 - 1,196,347 Transportation improvement - 788,729 - 788,729 Recreation improvement - 878,385 - 878,385
Assigned to capital improvements 5,000 1,689,694 - 1,694,694
Total fund balances 639,137 5,443,596 172,864 6,255,597
Total liabilities and fund balances $ 989,762 $ 5,501,552 $ 172,864 $ 6,664,178
100

CITY OF MELBOURNE, FLORIDA COMBINING STATEMENT OF REVENUES,
EXPENDITURES AND CHANGES IN FUND BALANCES NONMAJOR GOVERNMENTAL FUNDS
FOR THE YEAR ENDED SEPTEMBER 30, 2016
Perpetual TotalSpecial Capital Care NonmajorRevenue Projects Permanent GovernmentalFunds Funds Fund Funds
REVENUESIntergovernmental $ 1,212,937 $ 1,460,855 $ - $ 2,673,792 Impact fees - 276,014 - 276,014 Confiscated property 12,290 - - 12,290 Investment earnings 6,870 29,968 1,784 38,622 Perpetual care endowment additions - - 2,500 2,500 Other revenue 72,609 - - 72,609
Total revenues 1,304,706 1,766,837 4,284 3,075,827
EXPENDITURESCurrent:
General government - 167,209 - 167,209 Public works - 1,037,802 - 1,037,802 Parks and recreation - 43,600 - 43,600 Housing and urban improvement 736,184 - - 736,184
Capital outlay 97,647 1,662,996 - 1,760,643
Total expenditures 833,831 2,911,607 - 3,745,438
Excess (deficiency) of revenues over (under) expenditures 470,875 (1,144,770) 4,284 (669,611)
OTHER FINANCING SOURCES (USES)
Transfers in - 493,854 - 493,854 Transfers out (333,394) - (1,784) (335,178)
Total other financing sources (uses) (333,394) 493,854 (1,784) 158,676
Net change in fund balances 137,481 (650,916) 2,500 (510,935)
Fund balances, October 1 501,656 6,094,512 170,364 6,766,532
Fund balances, September 30 $ 639,137 $ 5,443,596 $ 172,864 $ 6,255,597
101
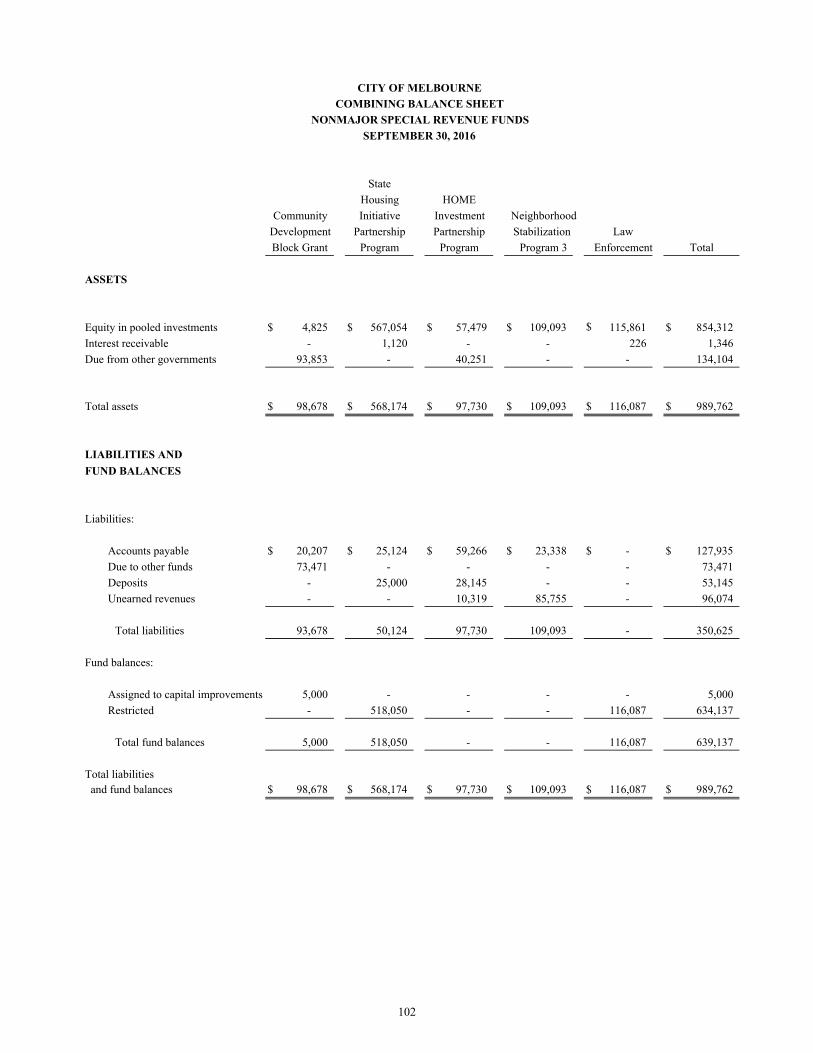
CITY OF MELBOURNE
COMBINING BALANCE SHEET
NONMAJOR SPECIAL REVENUE FUNDS
SEPTEMBER 30, 2016
Neighborhood
Stabilization Law
Program 3 Enforcement
ASSETS
Equity in pooled investments $ 4,825 $ 567,054 $ 57,479 $ 109,093 $ 115,861 $ 854,312
Interest receivable - 1,120 - - 226 1,346
Due from other governments 93,853 - 40,251 - - 134,104
Total assets $ 98,678 $ 568,174 $ 97,730 $ 109,093 $ 116,087 $ 989,762
LIABILITIES AND
FUND BALANCES
Liabilities:
Accounts payable $ 20,207 $ 25,124 $ 59,266 $ 23,338 $ - $ 127,935
Due to other funds 73,471 - - - - 73,471
Deposits - 25,000 28,145 - - 53,145
Unearned revenues - - 10,319 85,755 - 96,074
Total liabilities 93,678 50,124 97,730 109,093 - 350,625
Fund balances:
Assigned to capital improvements 5,000 - - - - 5,000
Restricted - 518,050 - - 116,087 634,137
Total fund balances 5,000 518,050 - - 116,087 639,137
Total liabilities
and fund balances $ 98,678 $ 568,174 $ 97,730 $ 109,093 $ 116,087 $ 989,762
TotalProgram
Investment
HOME
Partnership Partnership
Community
Development
Block Grant Program
State
Housing
Initiative
102
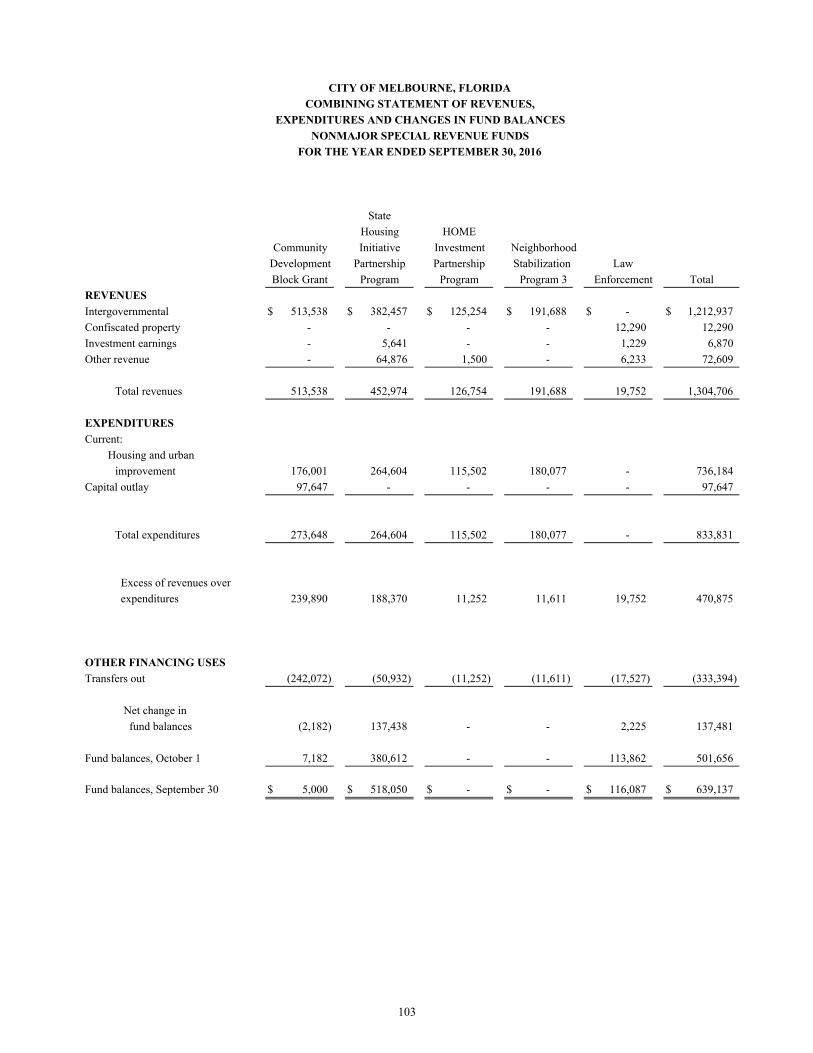
CITY OF MELBOURNE, FLORIDA
COMBINING STATEMENT OF REVENUES,
EXPENDITURES AND CHANGES IN FUND BALANCES
NONMAJOR SPECIAL REVENUE FUNDS
FOR THE YEAR ENDED SEPTEMBER 30, 2016
Neighborhood
Stabilization Law
Program 3 Enforcement
REVENUES
Intergovernmental $ 513,538 $ 382,457 $ 125,254 $ 191,688 $ - $ 1,212,937
Confiscated property - - - - 12,290 12,290
Investment earnings - 5,641 - - 1,229 6,870
Other revenue - 64,876 1,500 - 6,233 72,609
Total revenues 513,538 452,974 126,754 191,688 19,752 1,304,706
EXPENDITURES
Current:
Housing and urban
improvement 176,001 264,604 115,502 180,077 - 736,184
Capital outlay 97,647 - - - - 97,647
Total expenditures 273,648 264,604 115,502 180,077 - 833,831
Excess of revenues over
expenditures 239,890 188,370 11,252 11,611 19,752 470,875
OTHER FINANCING USES
Transfers out (242,072) (50,932) (11,252) (11,611) (17,527) (333,394)
Net change in
fund balances (2,182) 137,438 - - 2,225 137,481
Fund balances, October 1 7,182 380,612 - - 113,862 501,656
Fund balances, September 30 $ 5,000 $ 518,050 $ - $ - $ 116,087 $ 639,137
Block Grant Program Program
Development Partnership
Community Initiative Investment
State
Total
Partnership
HOMEHousing
103
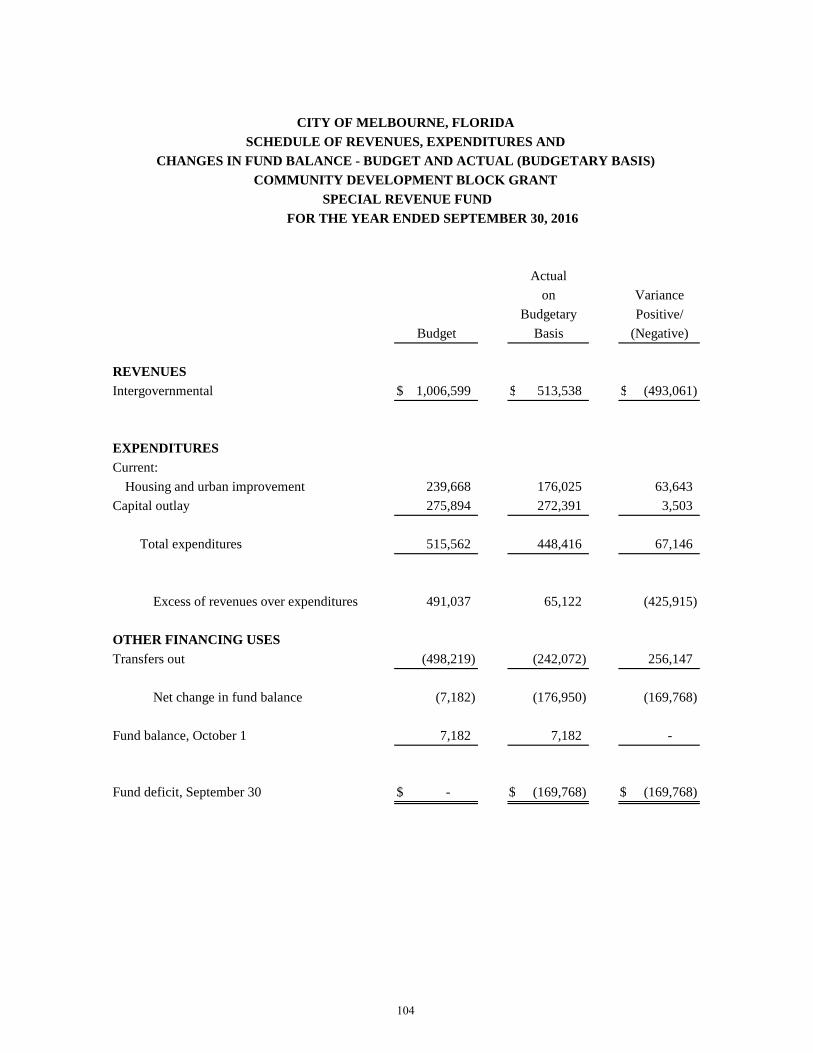
CITY OF MELBOURNE, FLORIDASCHEDULE OF REVENUES, EXPENDITURES AND
CHANGES IN FUND BALANCE - BUDGET AND ACTUAL (BUDGETARY BASIS)COMMUNITY DEVELOPMENT BLOCK GRANT
SPECIAL REVENUE FUNDFOR THE YEAR ENDED SEPTEMBER 30, 2016
Budget
REVENUESIntergovernmental $ 1,006,599 $ 513,538 $ (493,061)
EXPENDITURESCurrent:
Housing and urban improvement 239,668 176,025 63,643Capital outlay 275,894 272,391 3,503
Total expenditures 515,562 448,416 67,146
Excess of revenues over expenditures 491,037 65,122 (425,915)
OTHER FINANCING USESTransfers out (498,219) (242,072) 256,147
Net change in fund balance (7,182) (176,950) (169,768)
Fund balance, October 1 7,182 7,182 -
Fund deficit, September 30 $ - $ (169,768) $ (169,768)
onActual
VariancePositive/
(Negative)BasisBudgetary
104

CITY OF MELBOURNE, FLORIDASCHEDULE OF REVENUES, EXPENDITURES AND
CHANGES IN FUND BALANCE - BUDGET AND ACTUAL (BUDGETARY BASIS)STATE HOUSING INITIATIVE PARTNERSHIP PROGRAM
SPECIAL REVENUE FUNDFOR THE YEAR ENDED SEPTEMBER 30, 2016
Budget
REVENUESIntergovernmental $ 382,457 $ 382,457 $ - Investment earnings - 5,641 5,641Other revenue - 64,876 64,876
Total revenues 382,457 452,974 70,517
EXPENDITURESCurrent:
Housing and urban improvement 712,136 305,559 406,577
Excess (deficiency) of revenues over (under) expenditures (329,679) 147,415 477,094
OTHER FINANCING USESTransfers out (50,933) (50,932) 1
Net change in fund balance (380,612) 96,483 477,095
Fund balance, October 1 380,612 380,612 -
Fund balance, September 30 $ - $ 477,095 $ 477,095
Actual
Positive/(Negative)
Variance
BasisBudgetary
on
105

CITY OF MELBOURNE, FLORIDASCHEDULE OF REVENUES, EXPENDITURES AND
CHANGES IN FUND BALANCE - BUDGET AND ACTUAL (BUDGETARY BASIS)HOME INVESTMENT PARTNERSHIP PROGRAM
SPECIAL REVENUE FUNDFOR THE YEAR ENDED SEPTEMBER 30, 2016
Actualon Variance
BudgetaryBudget Basis (Negative)
REVENUESIntergovernmental $ 466,790 $ 125,254 $ (341,536) Other revenue - 1,500 1,500
Total revenues 466,790 126,754 (340,036)
EXPENDITURESCurrent:
Housing and urban improvement 455,538 120,460 335,078
Excess of revenues over expenditures 11,252 6,294 (4,958)
OTHER FINANCING USESTransfers out (11,252) (11,252) -
Net change in fund balance - (4,958) (4,958)
Fund balance, October 1 - - -
Fund deficit, September 30 $ - $ (4,958) $ (4,958)
Positive/
106

CITY OF MELBOURNE, FLORIDASCHEDULE OF REVENUES, EXPENDITURES AND
CHANGES IN FUND BALANCE - BUDGET AND ACTUAL (BUDGETARY BASIS)NEIGHBORHOOD STABILIZATION PROGRAM 3
SPECIAL REVENUE FUNDFOR THE YEAR ENDED SEPTEMBER 30, 2016
Actualon Variance
BudgetaryBudget Basis (Negative)
REVENUESIntergovernmental $ 67,377 $ 191,688 $ 124,311
EXPENDITURESCurrent:
Housing and community development 55,766 180,077 (124,311)
Excess of revenues over expenditures 11,611 11,611 -
OTHER FINANCING USESTransfers out (11,611) (11,611) -
Net change in fund balance - - -
Fund balance, October 1 - - -
Fund balance, September 30 $ - $ - $ -
Positive/
107
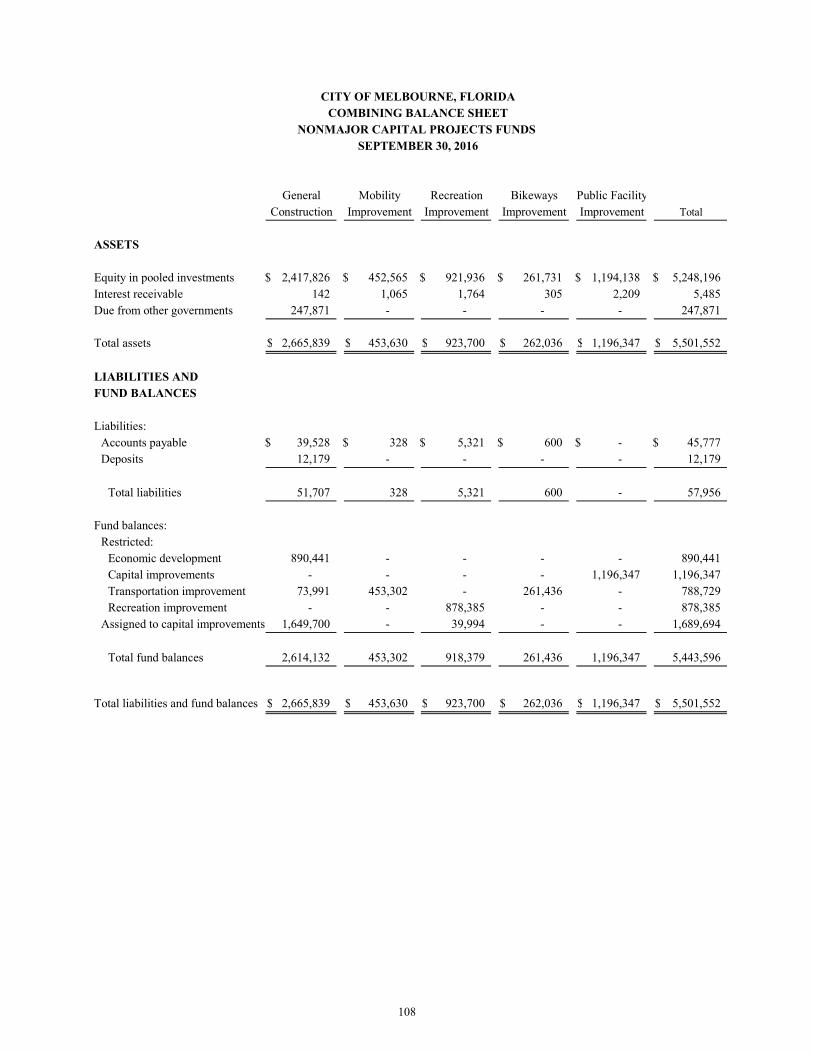
CITY OF MELBOURNE, FLORIDA
COMBINING BALANCE SHEET
NONMAJOR CAPITAL PROJECTS FUNDS
SEPTEMBER 30, 2016
Recreation
Construction Total
ASSETS
Equity in pooled investments $ 2,417,826 $ 452,565 $ 921,936 $ 261,731 $ 1,194,138 $ 5,248,196
Interest receivable 142 1,065 1,764 305 2,209 5,485
Due from other governments 247,871 - - - - 247,871
Total assets $ 2,665,839 $ 453,630 $ 923,700 $ 262,036 $ 1,196,347 $ 5,501,552
LIABILITIES AND
FUND BALANCES
Liabilities:
Accounts payable $ 39,528 $ 328 $ 5,321 $ 600 $ - $ 45,777
Deposits 12,179 - - - - 12,179
Total liabilities 51,707 328 5,321 600 - 57,956
Fund balances:
Restricted:
Economic development 890,441 - - - - 890,441
Capital improvements - - - - 1,196,347 1,196,347
Transportation improvement 73,991 453,302 - 261,436 - 788,729
Recreation improvement - - 878,385 - - 878,385
Assigned to capital improvements 1,649,700 - 39,994 - - 1,689,694
Total fund balances 2,614,132 453,302 918,379 261,436 1,196,347 5,443,596
Total liabilities and fund balances $ 2,665,839 $ 453,630 $ 923,700 $ 262,036 $ 1,196,347 $ 5,501,552
Public Facility
ImprovementImprovement
Bikeways
Improvement
General Mobility
Improvement
108
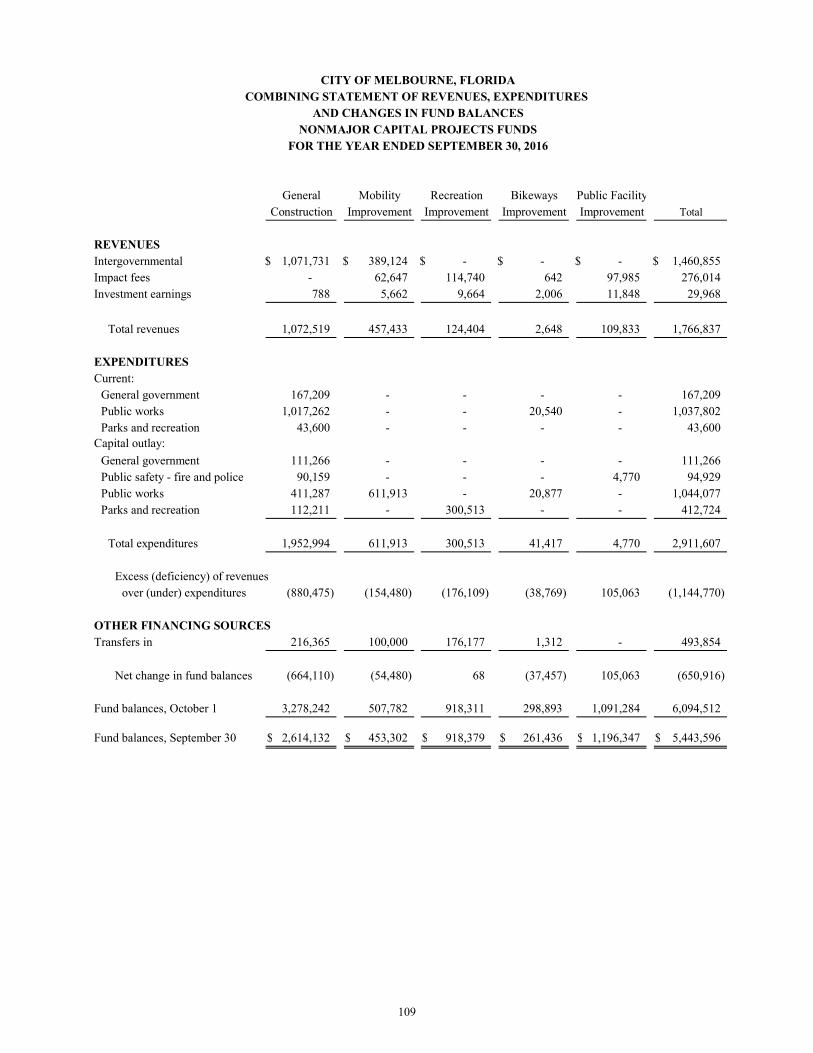
CITY OF MELBOURNE, FLORIDA
COMBINING STATEMENT OF REVENUES, EXPENDITURES
AND CHANGES IN FUND BALANCES
NONMAJOR CAPITAL PROJECTS FUNDS
FOR THE YEAR ENDED SEPTEMBER 30, 2016
Recreation
Construction Total
REVENUES
Intergovernmental $ 1,071,731 $ 389,124 $ - $ - $ - $ 1,460,855
Impact fees - 62,647 114,740 642 97,985 276,014
Investment earnings 788 5,662 9,664 2,006 11,848 29,968
Total revenues 1,072,519 457,433 124,404 2,648 109,833 1,766,837
EXPENDITURES
Current:
General government 167,209 - - - - 167,209
Public works 1,017,262 - - 20,540 - 1,037,802
Parks and recreation 43,600 - - - - 43,600
Capital outlay:
General government 111,266 - - - - 111,266
Public safety - fire and police 90,159 - - - 4,770 94,929
Public works 411,287 611,913 - 20,877 - 1,044,077
Parks and recreation 112,211 - 300,513 - - 412,724
Total expenditures 1,952,994 611,913 300,513 41,417 4,770 2,911,607
Excess (deficiency) of revenues
over (under) expenditures (880,475) (154,480) (176,109) (38,769) 105,063 (1,144,770)
OTHER FINANCING SOURCES
Transfers in 216,365 100,000 176,177 1,312 - 493,854
Net change in fund balances (664,110) (54,480) 68 (37,457) 105,063 (650,916)
Fund balances, October 1 3,278,242 507,782 918,311 298,893 1,091,284 6,094,512
Fund balances, September 30 $ 2,614,132 $ 453,302 $ 918,379 $ 261,436 $ 1,196,347 $ 5,443,596
Improvement
Public Facility
ImprovementImprovement
Bikeways
Improvement
General Mobility
109

NONMAJOR ENTERPRISE FUNDS
Enterprise Funds are used to account for the acquisition, operation and maintenance of governmental facilities and services, which are entirely or predominantly self-supported, by user charges. The operations of Enterprise Funds are accounted for in such a manner as to show a profit or loss similar to comparable private enterprises.
The City maintains the following Nonmajor Enterprise Funds:
• Golf Courses – accounts for the operation of two municipalgolf courses.
• Stormwater Utility – accounts for the operation of stormwaterservices in the City.

1 of 2 CITY OF MELBOURNE, FLORIDACOMBINING STATEMENT OF NET POSITION
NONMAJOR ENTERPRISE FUNDSSEPTEMBER 30, 2016
ASSETS
Current assets:Cash and cash equivalents $ 2,200 $ - $ 2,200 Equity in pooled investments 84,570 7,123,491 7,208,061 Interest receivable - 13,347 13,347 Due from other governments - 88,023 88,023 Inventory 63,522 - 63,522 Prepaid items 5,750 - 5,750
Total current assets 156,042 7,224,861 7,380,903
Noncurrent assets:Net pension asset 12,442 - 12,442
Capital assets:Nondepreciable:
Land 649,500 965,307 1,614,807 Construction in progress - 1,356,711 1,356,711
Depreciable:Buildings 827,664 - 827,664 Improvements other than buildings 3,439,217 12,265,685 15,704,902 Machinery and equipment 1,812,899 2,005,778 3,818,677 Intangibles, computer software 31,932 8,163 40,095
Less accumulated depreciation/amortization (5,040,552) (3,348,326) (8,388,878) Total capital assets, net of
accumulated depreciation/amortization 1,720,660 13,253,318 14,973,978
Total noncurrent assets 1,733,102 13,253,318 14,986,420
Total assets 1,889,144 20,478,179 22,367,323
DEFERRED OUTFLOWS OF RESOURCES
Deferred outflows, pensions 386,870 45,459 432,329
StormwaterUtility
GolfCourses Total
110

2 of 2
LIABILITIES
Current liabilities: Accounts payable 112,138 331,879 444,017 Accrued payroll expenses 14,572 3,574 18,146 Due to other governments 42,655 - 42,655 Compensated absences 24,580 585 25,165 Unearned revenue 40,879 - 40,879 Capital leases payable 158,120 - 158,120
Total current liabilities 392,944 336,038 728,982
Noncurrent liabilities:Advance from other funds 280,000 - 280,000 Compensated absences 19,645 169 19,814 Capital leases payable 392,944 - 392,944 Other post employment benefits 345,187 25,213 370,400 Net pension liability 772,049 91,910 863,959
Total noncurrent liabilities 1,809,825 117,292 1,927,117
Total liabilities 2,202,769 453,330 2,656,099
DEFERRED INFLOWS OF RESOURCESDeferred inflows, pensions 107,744 12,124 119,868
NET POSITION
Net investment in capital assets 1,169,596 12,935,094 14,104,690 Unrestricted (1,204,095) 7,123,090 5,918,995
Total net position $ (34,499) $ 20,058,184 $ 20,023,685
CoursesStormwater
Utility TotalGolf
111
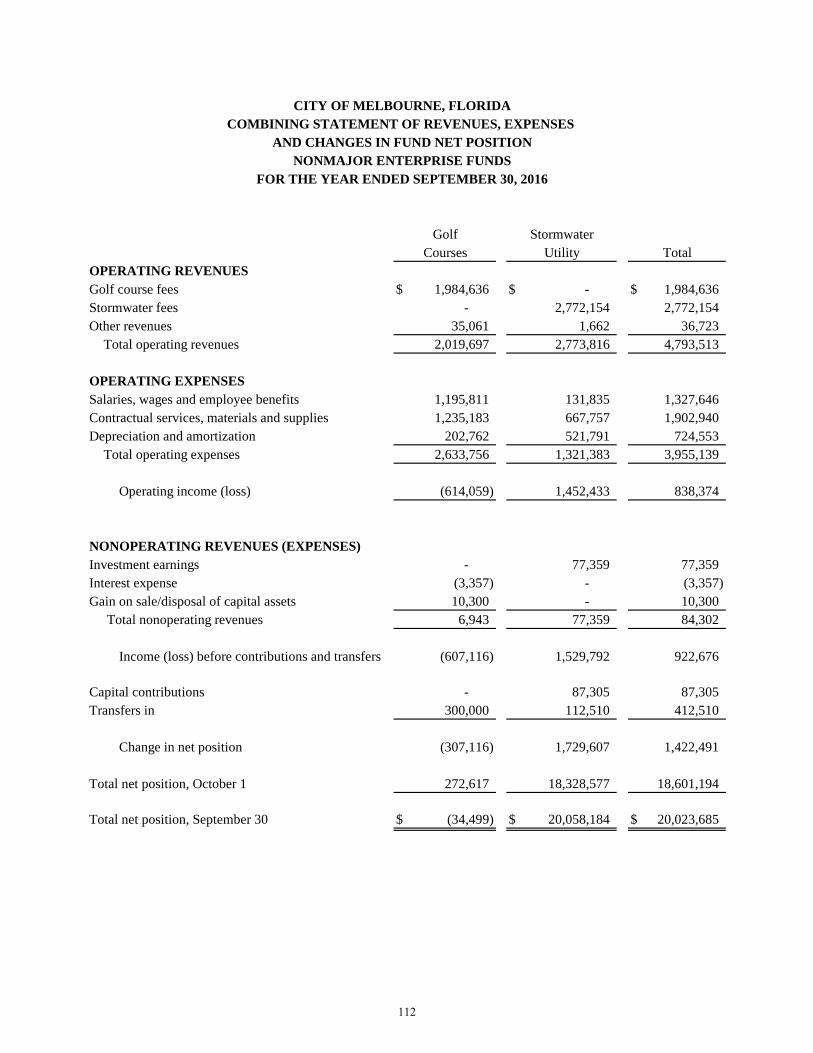
CITY OF MELBOURNE, FLORIDACOMBINING STATEMENT OF REVENUES, EXPENSES
AND CHANGES IN FUND NET POSITIONNONMAJOR ENTERPRISE FUNDS
FOR THE YEAR ENDED SEPTEMBER 30, 2016
OPERATING REVENUESGolf course fees $ 1,984,636 $ - $ 1,984,636 Stormwater fees - 2,772,154 2,772,154 Other revenues 35,061 1,662 36,723
Total operating revenues 2,019,697 2,773,816 4,793,513
OPERATING EXPENSESSalaries, wages and employee benefits 1,195,811 131,835 1,327,646 Contractual services, materials and supplies 1,235,183 667,757 1,902,940 Depreciation and amortization 202,762 521,791 724,553
Total operating expenses 2,633,756 1,321,383 3,955,139
Operating income (loss) (614,059) 1,452,433 838,374
NONOPERATING REVENUES (EXPENSES)Investment earnings - 77,359 77,359 Interest expense (3,357) - (3,357) Gain on sale/disposal of capital assets 10,300 - 10,300
Total nonoperating revenues 6,943 77,359 84,302
Income (loss) before contributions and transfers (607,116) 1,529,792 922,676
Capital contributions - 87,305 87,305 Transfers in 300,000 112,510 412,510
Change in net position (307,116) 1,729,607 1,422,491
Total net position, October 1 272,617 18,328,577 18,601,194
Total net position, September 30 $ (34,499) $ 20,058,184 $ 20,023,685
GolfCourses
StormwaterUtility Total
112

CITY OF MELBOURNE, FLORIDA 1 of 2COMBINING STATEMENT OF CASH FLOWS
NONMAJOR ENTERPRISE FUNDSFOR THE YEAR ENDED SEPTEMBER 30, 2016
INCREASE (DECREASE) IN CASH ANDCASH EQUIVALENTS
CASH FLOWS FROM OPERATING ACTIVITIESCash received from customers $ 1,984,618 $ 2,771,709 $ 4,756,327Cash payments to suppliers for goods and services (1,202,470) (1,417,381) (2,619,851)Cash payments for employee services (1,183,122) (127,429) (1,310,551)Other operating revenues 34,520 1,662 36,182
Net cash provided (used) by operating activities (366,454) 1,228,561 862,107
CASH FLOWS FROM NONCAPITAL FINANCING ACTIVITIESAdvance from other funds 280,000 - 280,000 Transfers in 300,000 - 300,000
Net cash provided by noncapital financing activities 580,000 - 580,000
CASH FLOWS FROM CAPITAL AND RELATED FINANCING ACTIVITIESAcquisition and construction of capital assets (229,464) (1,678,329) (1,907,793)Principal paid on lease obligations (179,766) - (179,766)Proceeds from leases 229,464 - 229,464 Interest paid on lease obligations (3,357) - (3,357)Proceeds from sale of capital assets 53,908 - 53,908 Transfers in - 112,510 112,510 Capital grants and contributions - 236,346 236,346
Net cash used by capital and related financing activities (129,215) (1,329,473) (1,458,688)
CASH FLOWS FROM INVESTING ACTIVITIESInterest on investments 40 72,073 72,113
Net cash provided by investing activities 40 72,073 72,113
Net increase (decrease) in cash and cash equivalents 84,371 (28,839) 55,532
Cash and cash equivalents at October 1 2,399 7,152,330 7,154,729
Cash and cash equivalents at September 30 $ 86,770 $ 7,123,491 $ 7,210,261
GolfCourses
StormwaterUtility Total
113

2 of 2 CITY OF MELBOURNE, FLORIDACOMBINING STATEMENT OF CASH FLOWS
NONMAJOR ENTERPRISE FUNDSFOR THE YEAR ENDED SEPTEMBER 30, 2016
(Continued)
RECONCILIATION OF OPERATING INCOME (LOSS) TO NET CASH PROVIDED (USED)BY OPERATING ACTIVITIES
Operating income (loss) $ (614,059) $ 1,452,433 $ 838,374
Adjustments not affecting cash:Depreciation and amortization 202,762 521,791 724,553Deferred outflows-pensions (214,476) (25,218) (239,694)Deferred inflows-pensions (54,829) (6,572) (61,401)
Changes in assets and liabilities:Due from other governments - (445) (445) Inventory (963) - (963)Prepaid items 9,007 - 9,007Net pension asset 12,981 - 12,981Accounts payable 24,669 (749,624) (724,955)Accrued payroll expenses (22,187) (2,252) (24,439)Due to other governments (240) - (240)Unearned revenue (319) - (319)Other post employment benefits (5,182) 2,386 (2,796)Net pension liability 296,382 36,062 332,444
Net cash provided (used) by operating activities $ (366,454) $ 1,228,561 $ 862,107
NON-CASH CAPITAL AND RELATED FINANCING ACTIVITIES:
Lease financed capital acquisitions $ 312,981 $ - $ 312,981
NON-CASH INVESTING ACTIVITIESDecrease in fair value of investments $ - $ (1,051) $ (1,051)
Cash and cash equivalents reconciliation:
Current assets:Cash and cash equivalents $ 2,200 $ - $ 2,200Equity in pooled investments 84,570 7,123,491 7,208,061
Cash and cash equivalents at September 30 $ 86,770 $ 7,123,491 $ 7,210,261
CoursesStormwater
Utility TotalGolf
114

INTERNAL SERVICE FUNDS
The Internal Service Funds are used to account for services to the various departments within the City. The charges are based on the cost of the services supplied.
The City maintains the following Internal Service Funds:
• Workers Compensation – accounts for workers compensationservices provided to other funds and the component units of theCity on a cost reimbursement basis.
• Insurance - accounts for insurance services provided to otherfunds and the component units of the City on a costreimbursement basis.

ASSETS
Current assets:Equity in pooled investments $ 1,735,095 $ 2,603,411 $ 4,338,506 Accounts receivable - 88,869 88,869 Interest receivable 2,654 4,805 7,459 Prepaid items 649,900 1,550 651,450
Total current assets 2,387,649 2,698,635 5,086,284
Noncurrent asset:Net pension asset - 28,887 28,887
Capital assets:Machinery and equipment - 23,374 23,374
Less accumulated depreciation - (23,374) (23,374)
Total capital assets, net of accumulated depreciation - - -
Total noncurrent assets - 28,887 28,887
Total assets 2,387,649 2,727,522 5,115,171
DEFERRED OUTFLOWS OF RESOURCES
Deferred outflows, pensions - 89,233 89,233
LIABILITIES
Current liabilities:Accounts payable 13,462 4,368 17,830 Accrued payroll expenses - 4,006 4,006 Accrued claims 688,485 527,526 1,216,011 Compensated absences - 4,745 4,745
Total current liabilities 701,947 540,645 1,242,592 Noncurrent liabilities:
Accrued claims 1,675,726 322,140 1,997,866 Compensated absences - 3,370 3,370 Other post employment benefits - 41,543 41,543 Net pension liability - 160,295 160,295
Total noncurrent liabilities 1,675,726 527,348 2,203,074
Total liabilities 2,377,673 1,067,993 3,445,666
DEFERRED INFLOWS OF RESOURCES
Deferred inflows, pensions - 37,353 37,353
NET POSITION
Unrestricted 9,976 1,711,409 1,721,385
Total net position $ 9,976 $ 1,711,409 $ 1,721,385
Compensation Insurance Total
CITY OF MELBOURNE, FLORIDACOMBINING STATEMENT OF NET POSITION
INTERNAL SERVICE FUNDSSEPTEMBER 30, 2016
Workers
115

OPERATING REVENUESCharges to other funds $ 2,919,489 $ 1,505,365 $ 4,424,854 Charges to component unit 110,104 484,838 594,942 Other revenues - 251 251
Total operating revenue 3,029,593 1,990,454 5,020,047
OPERATING EXPENSESSalaries, wages and employee benefits - 230,500 230,500 Contractual services, materials and supplies 794,746 1,775,231 2,569,977 Claims 2,240,268 363,757 2,604,025
Total operating expense 3,035,014 2,369,488 5,404,502
Operating loss (5,421) (379,034) (384,455)
NONOPERATING REVENUEInvestment earnings 7,663 24,967 32,630
Change in net position 2,242 (354,067) (351,825)
Total net position, October 1, 7,734 2,065,476 2,073,210
Total net position, September 30 $ 9,976 $ 1,711,409 $ 1,721,385
Workers Compensation Insurance Total
CITY OF MELBOURNE, FLORIDACOMBINING STATEMENT OF REVENUES, EXPENSES
AND CHANGES IN FUND NET POSITIONINTERNAL SERVICE FUNDS
FOR THE YEAR ENDED SEPTEMBER 30, 2016
116
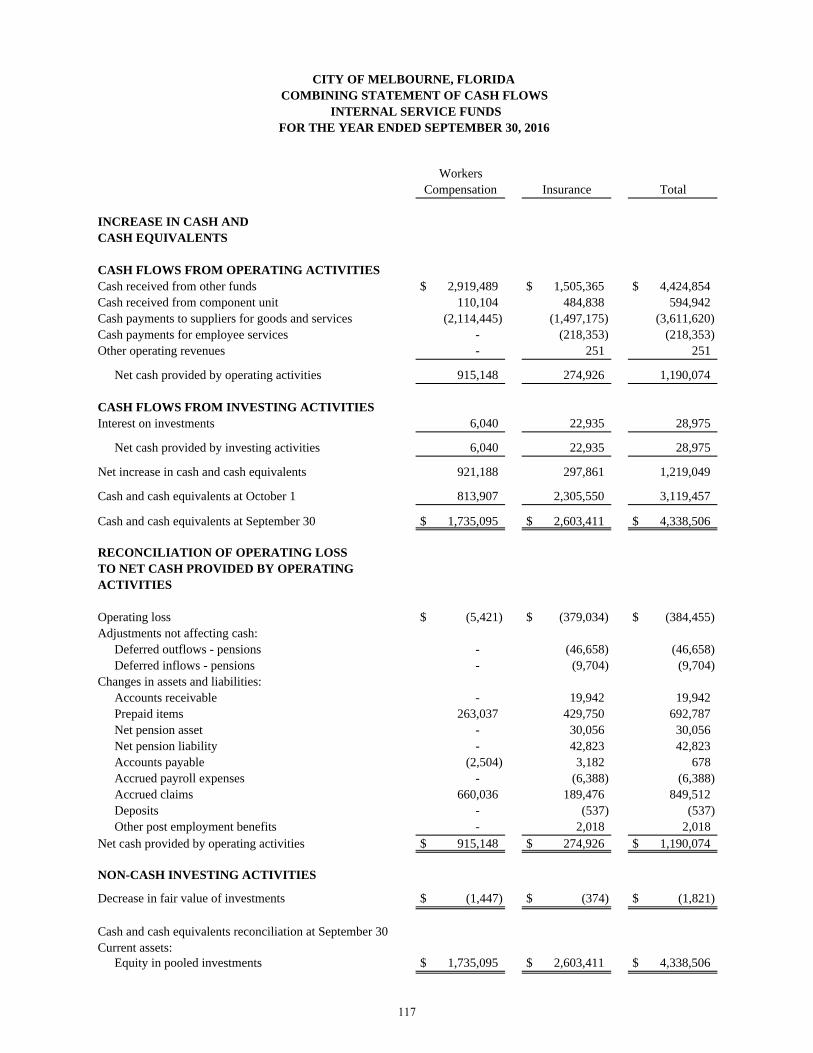
INCREASE IN CASH ANDCASH EQUIVALENTS
CASH FLOWS FROM OPERATING ACTIVITIESCash received from other funds $ 2,919,489 $ 1,505,365 $ 4,424,854 Cash received from component unit 110,104 484,838 594,942 Cash payments to suppliers for goods and services (2,114,445) (1,497,175) (3,611,620) Cash payments for employee services - (218,353) (218,353) Other operating revenues - 251 251
Net cash provided by operating activities 915,148 274,926 1,190,074
CASH FLOWS FROM INVESTING ACTIVITIESInterest on investments 6,040 22,935 28,975
Net cash provided by investing activities 6,040 22,935 28,975
Net increase in cash and cash equivalents 921,188 297,861 1,219,049
Cash and cash equivalents at October 1 813,907 2,305,550 3,119,457
Cash and cash equivalents at September 30 $ 1,735,095 $ 2,603,411 $ 4,338,506
RECONCILIATION OF OPERATING LOSSTO NET CASH PROVIDED BY OPERATINGACTIVITIES
Operating loss $ (5,421) $ (379,034) $ (384,455) Adjustments not affecting cash:
Deferred outflows - pensions - (46,658) (46,658) Deferred inflows - pensions - (9,704) (9,704)
Changes in assets and liabilities:Accounts receivable - 19,942 19,942 Prepaid items 263,037 429,750 692,787 Net pension asset - 30,056 30,056 Net pension liability - 42,823 42,823 Accounts payable (2,504) 3,182 678 Accrued payroll expenses - (6,388) (6,388) Accrued claims 660,036 189,476 849,512 Deposits - (537) (537) Other post employment benefits - 2,018 2,018
Net cash provided by operating activities $ 915,148 $ 274,926 $ 1,190,074
NON-CASH INVESTING ACTIVITIES
Decrease in fair value of investments $ (1,447) $ (374) $ (1,821)
Cash and cash equivalents reconciliation at September 30Current assets:
Equity in pooled investments $ 1,735,095 $ 2,603,411 $ 4,338,506
CITY OF MELBOURNE, FLORIDA COMBINING STATEMENT OF CASH FLOWS
INTERNAL SERVICE FUNDS FOR THE YEAR ENDED SEPTEMBER 30, 2016
Compensation InsuranceWorkers
Total
117

FIDUCIARY FUNDS
Fiduciary Funds are used to account for assets held by the City in a fiduciary capacity for individuals, governmental entities and others. Such funds are operated by carrying out specific terms of trust indentures, statutes, ordinances or other governing regulations.
AGENCY FUND
The City maintains the following Agency Fund:
• Performance Deposits

CITY OF MELBOURNE, FLORIDASTATEMENT OF FIDUCIARY NET POSITIONPERFORMANCE DEPOSITS AGENCY FUND
SEPTEMBER 30, 2016
ASSETS
Equity in pooled investments $ 785,370
Total assets $ 785,370
LIABILITIES
Refundable deposits $ 785,370
Total liabilities $ 785,370
118

Balance BalanceBeginning End of
of Year Additions Deductions YearASSETS
Equity in pooled investments 769,151$ 176,028$ 159,809$ 785,370$
Total assets 769,151$ 176,028$ 159,809$ 785,370$
LIABILITIES
Accounts payable -$ 156,937$ 156,937$ -$ Refundable deposits 769,151 174,928 158,709 785,370
Total liabilities 769,151$ 331,865$ 315,646$ 785,370$
CITY OF MELBOURNE, FLORIDASTATEMENT OF CHANGES IN ASSETS AND LIABILITIES
PERFORMANCE DEPOSITS AGENCY FUNDFOR THE YEAR ENDED SEPTEMBER 30, 2016
119


DISCRETELY PRESENTED COMPONENT UNIT
The Melbourne International Airport, an Enterprise fund, is a discretely presented component unit of the City. The Airport fund accounts for the operation and maintenance of air passenger and cargo service to residents, which are entirely or predominantly self-supported, by user charges. The operation of the Airport fund is accounted for in such a manner as to show a profit or loss similar to comparable private enterprises.

1 of 2 CITY OF MELBOURNE, FLORIDASTATEMENT OF NET POSITION
DISCRETELY PRESENTED COMPONENT UNITINTERNATIONAL AIRPORT
SEPTEMBER 30, 2016
ASSETS
Current assets:Cash and cash equivalents $ 9,057,173 Cash and cash equivalents, restricted 8,846 Investments, at fair value 11,819,729 Receivables, trade 398,820 Other receivables 999,430 Interest receivable 31,929 Due from primary government 9,015 Due from other governments 3,875,423 Due from other governments, restricted 5,738,499 Inventory 29,609 Prepaid items 48,455
Total current assets 32,016,928
Noncurrent assets:Restricted assets:
Cash and cash equivalents 274,600
Noncurrent lease receivables 911,442
Net pension asset 65,445
Capital assets:Nondepreciable:
Land 6,899,179 Construction in progress 59,545,998
Depreciable:Buildings 66,534,190 Improvements other than buildings 72,419,526 Machinery and equipment 10,363,504 Intangibles, computer software 241,825 Less accumulated depreciation/amortization (82,399,208)
Total capital assets, net of accumulated depreciation/amortization 133,605,014
Total noncurrent assets 134,856,501
Total assets 166,873,429
DEFERRED OUTFLOWS OF RESOURCESDeferred outflows, pensions 1,658,646
120
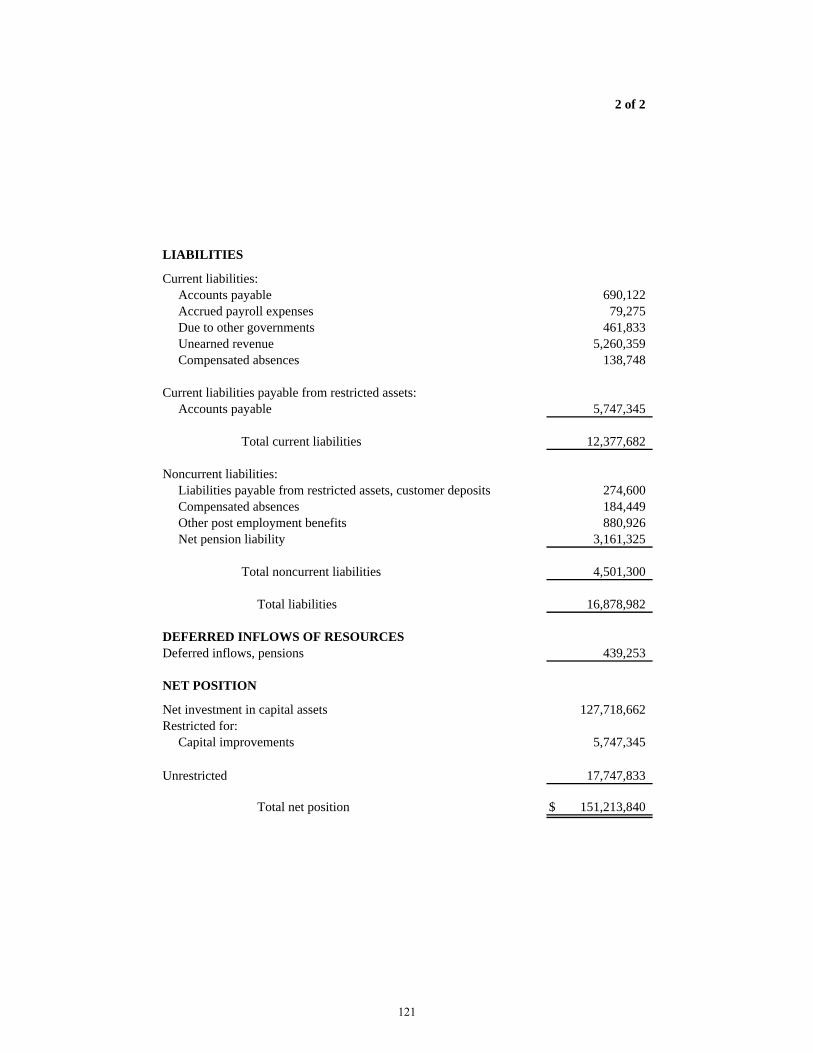
2 of 2
LIABILITIES
Current liabilities:Accounts payable 690,122 Accrued payroll expenses 79,275 Due to other governments 461,833 Unearned revenue 5,260,359 Compensated absences 138,748
Current liabilities payable from restricted assets:Accounts payable 5,747,345
Total current liabilities 12,377,682
Noncurrent liabilities:Liabilities payable from restricted assets, customer deposits 274,600 Compensated absences 184,449 Other post employment benefits 880,926 Net pension liability 3,161,325
Total noncurrent liabilities 4,501,300
Total liabilities 16,878,982
DEFERRED INFLOWS OF RESOURCESDeferred inflows, pensions 439,253
NET POSITION
Net investment in capital assets 127,718,662 Restricted for:
Capital improvements 5,747,345
Unrestricted 17,747,833
Total net position $ 151,213,840
121
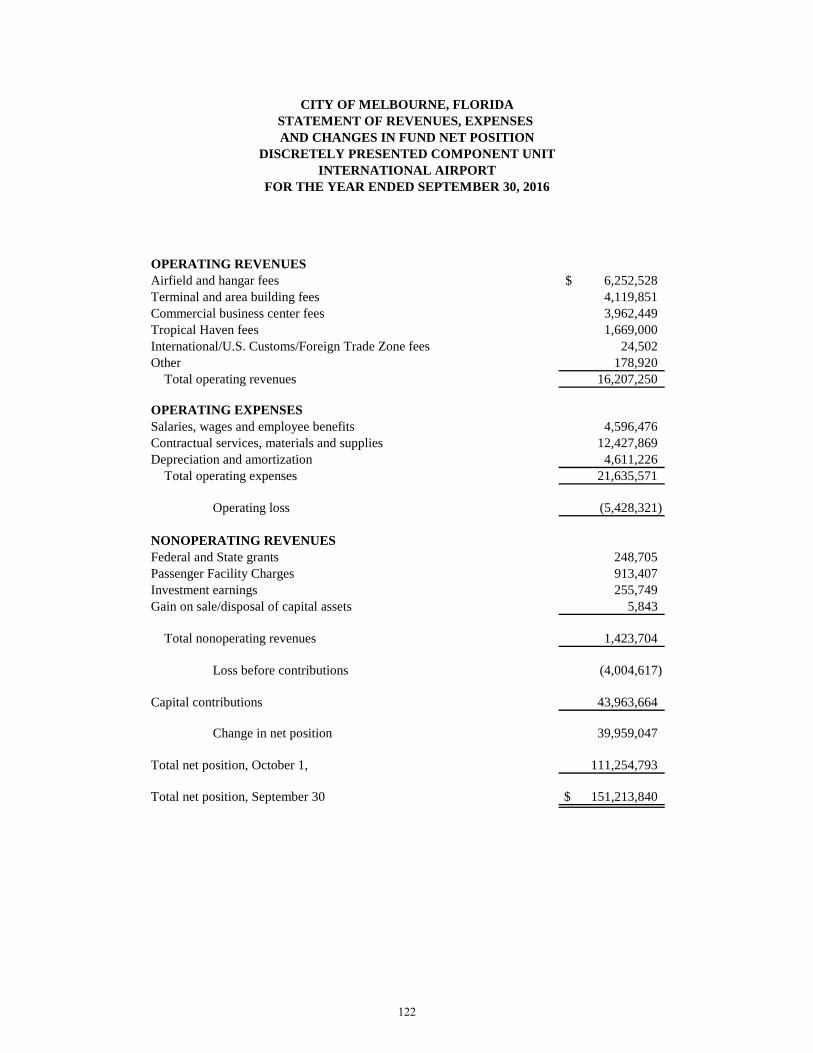
OPERATING REVENUESAirfield and hangar fees $ 6,252,528 Terminal and area building fees 4,119,851 Commercial business center fees 3,962,449 Tropical Haven fees 1,669,000 International/U.S. Customs/Foreign Trade Zone fees 24,502 Other 178,920 Total operating revenues 16,207,250
OPERATING EXPENSESSalaries, wages and employee benefits 4,596,476 Contractual services, materials and supplies 12,427,869 Depreciation and amortization 4,611,226 Total operating expenses 21,635,571
Operating loss (5,428,321)
NONOPERATING REVENUESFederal and State grants 248,705 Passenger Facility Charges 913,407 Investment earnings 255,749 Gain on sale/disposal of capital assets 5,843
Total nonoperating revenues 1,423,704
Loss before contributions (4,004,617)
Capital contributions 43,963,664
Change in net position 39,959,047
Total net position, October 1, 111,254,793
Total net position, September 30 $ 151,213,840
FOR THE YEAR ENDED SEPTEMBER 30, 2016
CITY OF MELBOURNE, FLORIDA
INTERNATIONAL AIRPORT
STATEMENT OF REVENUES, EXPENSES AND CHANGES IN FUND NET POSITION
DISCRETELY PRESENTED COMPONENT UNIT
122

1 of 2
INCREASE IN CASH AND CASH EQUIVALENTS
CASH FLOWS FROM OPERATING ACTIVITIESCash received from customers $ 17,550,442 Cash payments to suppliers for goods and services (11,990,380) Cash payments for employee services (4,458,540) Deposits received 470,000 Deposits returned and applied (300,000) Other operating revenues 178,920
Net cash provided by operating activities 1,450,442
CASH FLOWS FROM NONCAPITAL FINANCING ACTIVITIESOperating grants and donations 244,241 Passenger facility charges 910,463
Net cash provided by noncapital financing activities 1,154,704
CASH FLOWS FROM CAPITAL AND RELATED FINANCING ACTIVITIESAcquisition and construction of capital assets (47,260,925) Proceeds from sale of capital assets 14,599 Capital grants 36,461,931
Net cash used by capital and related financing activities (10,784,395)
CASH FLOWS FROM INVESTING ACTIVITIESPurchase of investment securities (17,001,498) Proceeds from sale and maturities of investment securities 26,186,546 Interest on investments 343,220
Net cash provided by investing activities 9,528,268
Net increase in cash and cash equivalents 1,349,019
Cash and cash equivalents at October 1 7,991,600
Cash and cash equivalents at September 30 $ 9,340,619
FOR THE YEAR ENDED SEPTEMBER 30, 2016
CITY OF MELBOURNE, FLORIDA STATEMENT OF CASH FLOWS
DISCRETELY PRESENTED COMPONENT UNITINTERNATIONAL AIRPORT
123
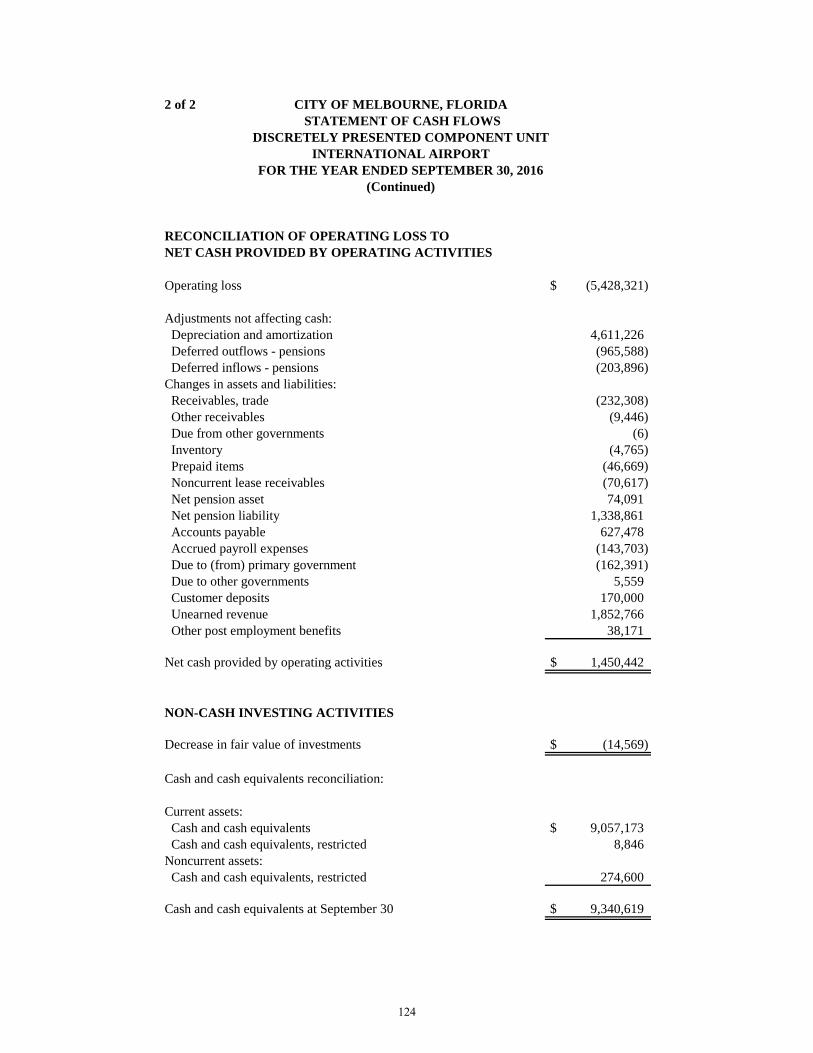
2 of 2
RECONCILIATION OF OPERATING LOSS TONET CASH PROVIDED BY OPERATING ACTIVITIES
Operating loss $ (5,428,321)
Adjustments not affecting cash: Depreciation and amortization 4,611,226 Deferred outflows - pensions (965,588) Deferred inflows - pensions (203,896) Changes in assets and liabilities: Receivables, trade (232,308) Other receivables (9,446) Due from other governments (6) Inventory (4,765) Prepaid items (46,669) Noncurrent lease receivables (70,617) Net pension asset 74,091 Net pension liability 1,338,861 Accounts payable 627,478 Accrued payroll expenses (143,703) Due to (from) primary government (162,391) Due to other governments 5,559 Customer deposits 170,000 Unearned revenue 1,852,766 Other post employment benefits 38,171
Net cash provided by operating activities $ 1,450,442
NON-CASH INVESTING ACTIVITIES
Decrease in fair value of investments $ (14,569)
Cash and cash equivalents reconciliation:
Current assets: Cash and cash equivalents $ 9,057,173 Cash and cash equivalents, restricted 8,846 Noncurrent assets: Cash and cash equivalents, restricted 274,600
Cash and cash equivalents at September 30 $ 9,340,619
(Continued)
CITY OF MELBOURNE, FLORIDA STATEMENT OF CASH FLOWS
DISCRETELY PRESENTED COMPONENT UNIT
FOR THE YEAR ENDED SEPTEMBER 30, 2016INTERNATIONAL AIRPORT
124

STATISTICAL SECTION
The Statistical Schedules present detailed information as a context for understanding this year’s financial statements, note disclosures, and required supplementary information.
This section contains the following subsections:
• Financial Trends
• Revenue Capacity
• Debt Capacity
• Demographic and Economic Information
• Operating Information

FINANCIAL TRENDS These schedules contain trend information to help the reader understand how the City's financial performance and well-being have changed over time. Schedule
1 Net Position by Component, Last Ten Fiscal Years 2 Changes in Net Position, Last Ten Fiscal Years 3 Fund Balances, Governmental Funds, Last Ten Fiscal Years 4 Changes in Fund Balances, Governmental Funds, Last Ten Fiscal
Years
REVENUE CAPACITY These schedules contain information to help the reader assess the City's two significant local revenue sources, the property tax, and water and sewer charges. Schedule
5 Assessed Value and Estimated Actual Value of Taxable Property, Last Ten Fiscal Years
6 Direct and Overlapping Property Tax Rates, Last Ten Fiscal Years 7 Principal Property Taxpayers, Current Year and Nine Years Ago 8 Property Tax Levies and Collections, Last Ten Fiscal Years 9 Water and Sewer Consumption, Rates, and Revenue, Last Ten
Fiscal Years 10 Principal Water and Sewer Customers, Current Year and Nine
Years Ago
DEBT CAPACITY These schedules present information to help the reader assess the affordability of the City's current levels of outstanding debt and the City's ability to issue additional debt in the future.
Schedule 11 Ratios of Outstanding Debt by Type, Last Ten Fiscal Years 12 Ratios of General Bonded Debt Outstanding, Last Ten Fiscal Years 13 Legal Debt Margin Information, Last Ten Fiscal Years 14 Direct and Overlapping Governmental Activities Debt, as of
September 30, 2016 15 Pledged Revenue Coverage, Last Ten Fiscal Years
DEMOGRAPHIC AND ECONOMIC INFORMATION
These schedules offer demographic and economic indicators to help the reader understand the environment within which the City's financial activities take place. Schedule
16 Demographic and Economic Statistics, Last Ten Fiscal Years 17 Principal Employers, Current Year and Nine Years Ago
OPERATING INFORMATION These schedules contain service and infrastructure data to help the reader understand how the information in the City's financial report relates to the services the City provides and the activities it performs. Schedule
18 Full-Time Equivalent City Government Employees by Function/Program, Last Ten Fiscal Years
19 Operating Indicators by Function/Program, Last Ten Fiscal Years 20 Capital Asset Statistics by Function/Program, Last Ten Fiscal Years
Sources: Unless otherwise noted, the information in these schedules is derived from the comprehensive annual financial reports for the relevant year.
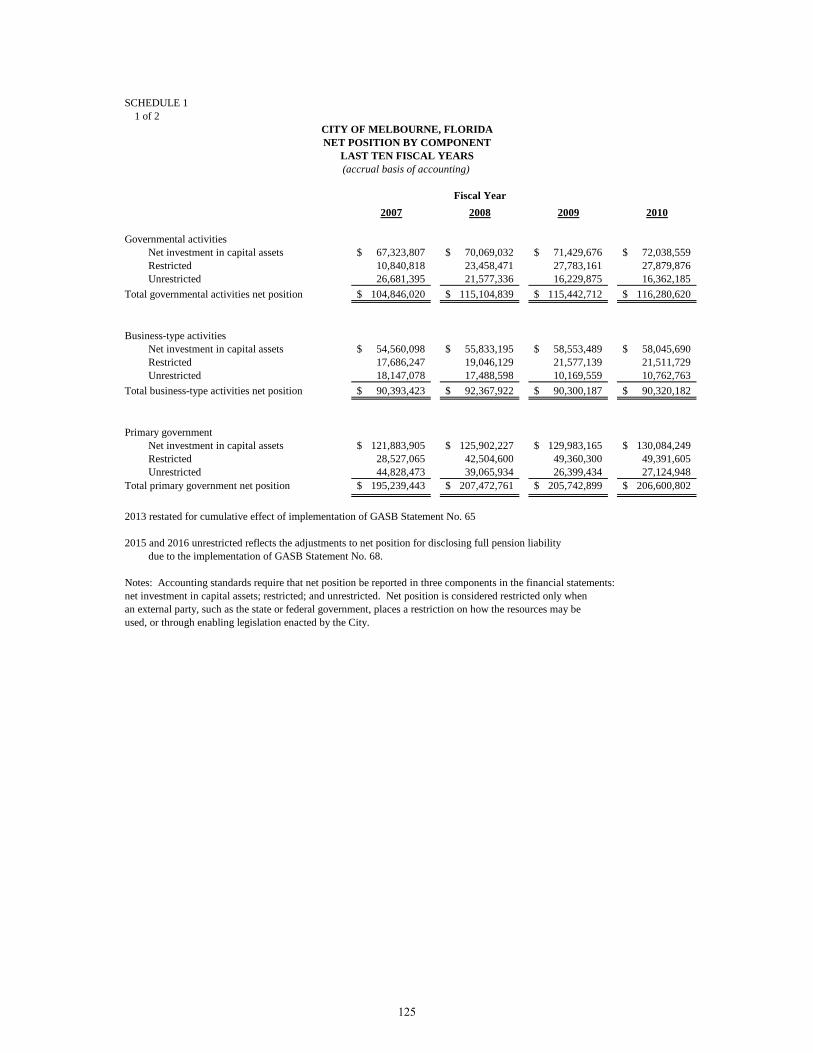
SCHEDULE 11 of 2
2007 2008 2009 2010
Governmental activitiesNet investment in capital assets 67,323,807$ 70,069,032$ 71,429,676$ 72,038,559$ Restricted 10,840,818 23,458,471 27,783,161 27,879,876 Unrestricted 26,681,395 21,577,336 16,229,875 16,362,185
Total governmental activities net position 104,846,020$ 115,104,839$ 115,442,712$ 116,280,620$
Business-type activitiesNet investment in capital assets 54,560,098$ 55,833,195$ 58,553,489$ 58,045,690$ Restricted 17,686,247 19,046,129 21,577,139 21,511,729 Unrestricted 18,147,078 17,488,598 10,169,559 10,762,763
Total business-type activities net position 90,393,423$ 92,367,922$ 90,300,187$ 90,320,182$
Primary governmentNet investment in capital assets 121,883,905$ 125,902,227$ 129,983,165$ 130,084,249$ Restricted 28,527,065 42,504,600 49,360,300 49,391,605 Unrestricted 44,828,473 39,065,934 26,399,434 27,124,948
Total primary government net position 195,239,443$ 207,472,761$ 205,742,899$ 206,600,802$
2013 restated for cumulative effect of implementation of GASB Statement No. 65
2015 and 2016 unrestricted reflects the adjustments to net position for disclosing full pension liabilitydue to the implementation of GASB Statement No. 68.
Notes: Accounting standards require that net position be reported in three components in the financial statements:net investment in capital assets; restricted; and unrestricted. Net position is considered restricted only whenan external party, such as the state or federal government, places a restriction on how the resources may beused, or through enabling legislation enacted by the City.
CITY OF MELBOURNE, FLORIDANET POSITION BY COMPONENT
LAST TEN FISCAL YEARS(accrual basis of accounting)
Fiscal Year
125

SCHEDULE 12 of 2
2011 2012 2013 2014 2015 2016
77,645,248$ 81,082,994$ 78,404,558$ 82,144,646$ 82,067,802$ 82,079,774$ 22,714,682 22,841,308 22,841,609 22,826,912 22,960,162 24,564,405 18,489,936 14,490,489 12,231,951 8,669,905 (34,403,547) (32,099,072)
118,849,866$ 118,414,791$ 113,478,118$ 113,641,463$ 70,624,417$ 74,545,107$
58,609,763$ 58,925,901$ 65,889,305$ 63,190,585$ 64,009,483$ 69,542,203$ 18,985,861 18,156,113 14,849,906 14,489,407 12,253,588 10,677,396 15,655,994 19,864,115 19,547,409 29,614,094 35,818,205 41,553,220 93,251,618$ 96,946,129$ 100,286,620$ 107,294,086$ 112,081,276$ 121,772,819$
136,255,011$ 140,008,895$ 144,293,863$ 145,335,231$ 146,077,285$ 151,621,977$ 41,700,543 40,997,421 37,691,515 37,316,319 35,213,750 35,241,801 34,145,930 34,354,604 31,779,360 38,283,999 1,414,658 9,454,148
212,101,484$ 215,360,920$ 213,764,738$ 220,935,549$ 182,705,693$ 196,317,926$
Fiscal Year
126
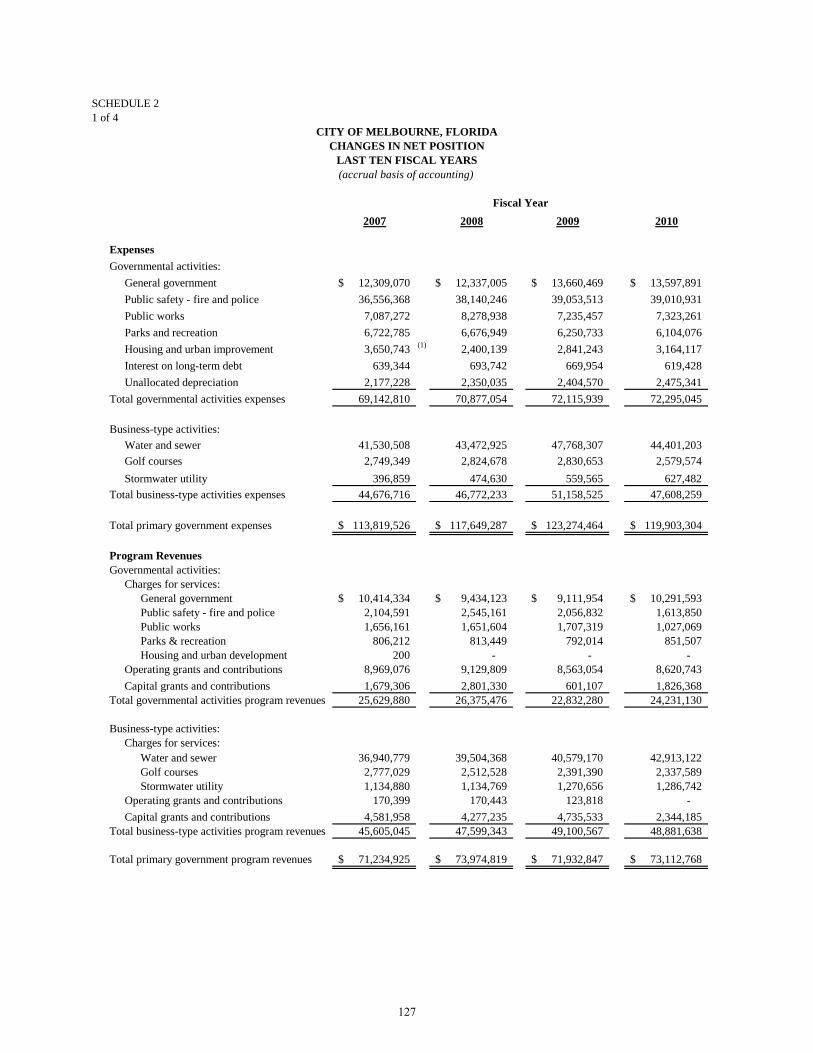
SCHEDULE 21 of 4
2007 2008 2009 2010
ExpensesGovernmental activities:
General government 12,309,070$ 12,337,005$ 13,660,469$ 13,597,891$ Public safety - fire and police 36,556,368 38,140,246 39,053,513 39,010,931 Public works 7,087,272 8,278,938 7,235,457 7,323,261 Parks and recreation 6,722,785 6,676,949 6,250,733 6,104,076 Housing and urban improvement 3,650,743 (1) 2,400,139 2,841,243 3,164,117 Interest on long-term debt 639,344 693,742 669,954 619,428 Unallocated depreciation 2,177,228 2,350,035 2,404,570 2,475,341
Total governmental activities expenses 69,142,810 70,877,054 72,115,939 72,295,045
Business-type activities:Water and sewer 41,530,508 43,472,925 47,768,307 44,401,203 Golf courses 2,749,349 2,824,678 2,830,653 2,579,574 Stormwater utility 396,859 474,630 559,565 627,482
Total business-type activities expenses 44,676,716 46,772,233 51,158,525 47,608,259
Total primary government expenses 113,819,526$ 117,649,287$ 123,274,464$ 119,903,304$
Program RevenuesGovernmental activities:
Charges for services:General government 10,414,334$ 9,434,123$ 9,111,954$ 10,291,593$ Public safety - fire and police 2,104,591 2,545,161 2,056,832 1,613,850 Public works 1,656,161 1,651,604 1,707,319 1,027,069 Parks & recreation 806,212 813,449 792,014 851,507 Housing and urban development 200 - - -
Operating grants and contributions 8,969,076 9,129,809 8,563,054 8,620,743 Capital grants and contributions 1,679,306 2,801,330 601,107 1,826,368
Total governmental activities program revenues 25,629,880 26,375,476 22,832,280 24,231,130
Business-type activities:Charges for services:
Water and sewer 36,940,779 39,504,368 40,579,170 42,913,122 Golf courses 2,777,029 2,512,528 2,391,390 2,337,589 Stormwater utility 1,134,880 1,134,769 1,270,656 1,286,742
Operating grants and contributions 170,399 170,443 123,818 -Capital grants and contributions 4,581,958 4,277,235 4,735,533 2,344,185
Total business-type activities program revenues 45,605,045 47,599,343 49,100,567 48,881,638
Total primary government program revenues 71,234,925$ 73,974,819$ 71,932,847$ 73,112,768$
CITY OF MELBOURNE, FLORIDACHANGES IN NET POSITION
LAST TEN FISCAL YEARS(accrual basis of accounting)
Fiscal Year
127

SCHEDULE 22 of 4
2011 2012 2013 2014 2015 2016
13,366,909$ 13,764,828$ 15,561,604$ (3) 13,835,021$ 14,194,930$ (8) 16,928,412$ 39,717,295 41,815,591 (2) 40,168,100 41,353,221 33,441,611 (8) 40,329,521
8,720,053 6,049,564 8,316,795 (4) 8,116,255 7,108,185 8,145,791 6,036,530 6,136,168 6,254,656 6,711,448 6,437,870 6,927,039 2,399,107 1,592,095 2,574,619 1,883,401 1,289,586 1,298,756
569,317 537,544 497,222 467,651 445,221 394,519 2,567,216 2,794,502 2,868,115 2,997,742 3,191,952 3,322,705
73,376,427 72,690,292 76,241,111 75,364,739 66,109,355 77,346,743
43,688,265 43,494,835 45,289,816 (5) 42,643,322 43,578,657 (8) 45,201,038 2,510,247 2,535,298 2,507,241 2,565,545 2,292,530 2,642,683
808,587 1,007,033 1,099,665 1,174,732 1,180,219 1,323,778 47,007,099 47,037,166 48,896,722 46,383,599 47,051,406 49,167,499
120,383,526$ 119,727,458$ 125,137,833$ 121,748,338$ 113,160,761$ 126,514,242$
10,220,895$ 9,918,937$ 10,456,884$ 9,523,800$ 10,072,902$ 10,784,839$ 1,483,927 1,566,866 1,776,557 1,873,093 1,810,164 1,836,711 1,075,153 1,015,248 976,080 1,091,551 1,157,906 1,188,363
806,870 838,908 815,759 834,368 898,132 1,114,217 16,300 13,100 13,500 19,685 1,250 -
6,948,506 6,660,356 7,084,093 6,133,822 6,999,122 7,117,618 6,795,571 3,273,290 1,418,806 2,553,954 628,876 903,067
27,347,222 23,286,705 22,541,679 22,030,273 21,568,352 22,944,815
45,853,683 47,245,389 47,370,637 50,164,115 53,391,431 54,089,987 2,455,332 2,413,445 2,286,132 2,078,840 2,029,093 2,019,697 1,775,997 2,218,083 2,290,742 2,275,789 2,720,436 2,773,816
(24,972) 110,477 - - - -1,359,095 736,596 2,244,507 1,241,348 2,174,091 1,884,001
51,419,135 52,723,990 54,192,018 55,760,092 60,315,051 60,767,501
78,766,357$ 76,010,695$ 76,733,697$ 77,790,365$ 81,883,403$ 83,712,316$
Fiscal Year
128

SCHEDULE 23 of 4
2007 2008 2009 2010Net (Expense)/RevenueGovernmental activities (43,512,930)$ (44,501,578)$ (49,283,659)$ (48,063,915)$ Business-type activities 928,329 827,110 (2,057,958) 1,273,379 Total primary government net expense (42,584,601)$ (43,674,468)$ (51,341,617)$ (46,790,536)$
General Revenues and Other Changes in Net PositionGovernmental activities:
Taxes:Property 20,102,973$ 21,575,415$ 21,279,929$ 21,976,524$ Utility and telecommunication 10,776,705 11,326,996 10,997,283 11,394,528 Franchise fees 7,155,421 7,187,413 7,281,090 6,594,719
Unrestricted grants and contributions 10,335,305 11,514,895 6,468,279 6,032,442 Investment earnings 2,906,310 2,139,784 2,248,911 1,067,666 Miscellaneous 96,923 103,776 91,906 350 Gain on sale of capital assets 21,419 - - -Contributions to permanent funds 3,350 2,250 1,100 2,400 Extraordinary item - - - -Transfers 2,122,657 909,868 1,253,034 1,833,194
Total governmental activities 53,521,063 54,760,397 49,621,532 48,901,823
Business-type activities:Unrestricted grants and contributions - - - -Investment earnings 2,539,126 2,057,257 1,243,257 579,810 Gain on sale of capital assets - - - -Transfers (2,122,657) (909,868) (1,253,034) (1,833,194)
Total business-type activities 416,469 1,147,389 (9,777) (1,253,384)
Total primary government 53,937,532$ 55,907,786$ 49,611,755$ 47,648,439$
Change in Net PositionGovernmental activities 10,008,133$ 10,258,819$ 337,873$ 837,908$ Business-type activities 1,344,798 1,974,499 (2,067,735) 19,995
Total primary government 11,352,931$ 12,233,318$ (1,729,862)$ 857,903$
(1) Increase is due to the activity of the Hurricane Housing Recovery Program fund, created in 2006.(2) Increase is due to the increase in pension, Worker's Compensation and OPEB expenses.(3) Increase is due to the transfer of land to the Airport.(4) Increase is due to road resurfacing.(5) Implemented GASB Statement No. 65.(6) Water and wastewater rate increase of 7% and decrease in operational expenses.(7) Property tax millage increase of 6%.(8) Implemented GASB Statement No. 68.
Fiscal Year
CITY OF MELBOURNE, FLORIDACHANGES IN NET POSITION (Continued)
LAST TEN FISCAL YEARS(accrual basis of accounting)
129
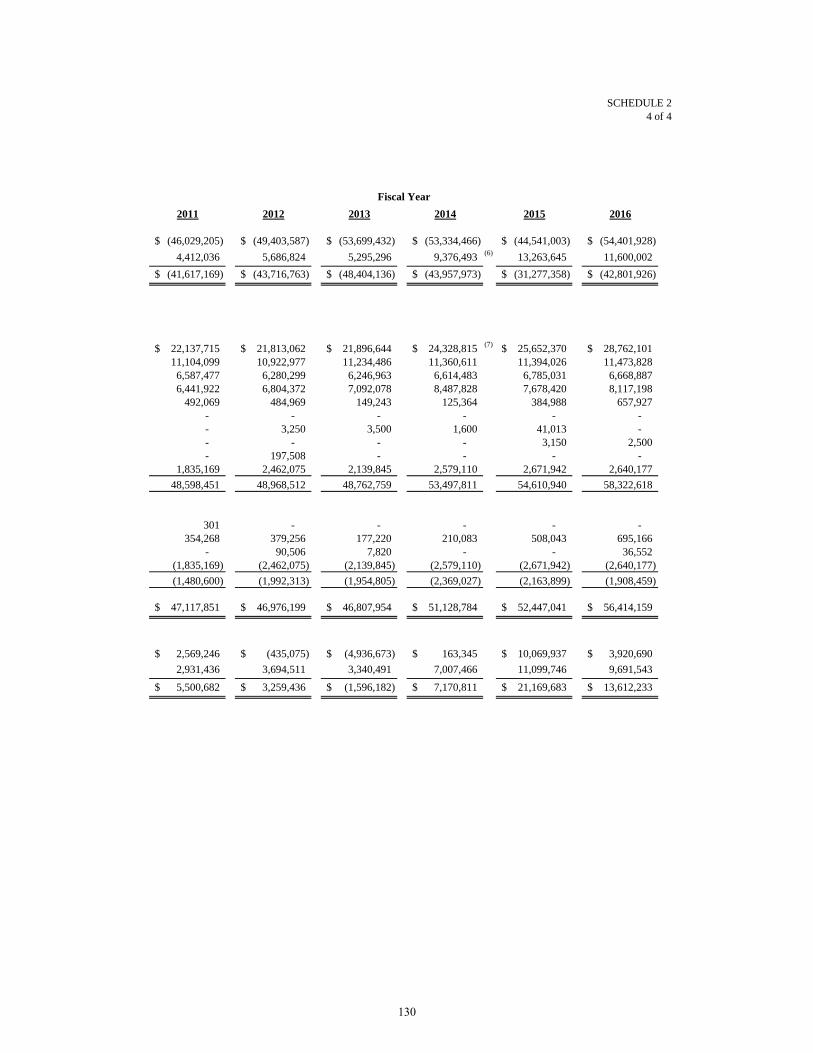
SCHEDULE 24 of 4
2011 2012 2013 2014 2015 2016
(46,029,205)$ (49,403,587)$ (53,699,432)$ (53,334,466)$ (44,541,003)$ (54,401,928)$ 4,412,036 5,686,824 5,295,296 9,376,493 (6) 13,263,645 11,600,002
(41,617,169)$ (43,716,763)$ (48,404,136)$ (43,957,973)$ (31,277,358)$ (42,801,926)$
22,137,715$ 21,813,062$ 21,896,644$ 24,328,815$ (7) 25,652,370$ 28,762,101$ 11,104,099 10,922,977 11,234,486 11,360,611 11,394,026 11,473,828
6,587,477 6,280,299 6,246,963 6,614,483 6,785,031 6,668,887 6,441,922 6,804,372 7,092,078 8,487,828 7,678,420 8,117,198
492,069 484,969 149,243 125,364 384,988 657,927 - - - - - -- 3,250 3,500 1,600 41,013 -- - - - 3,150 2,500 - 197,508 - - - -
1,835,169 2,462,075 2,139,845 2,579,110 2,671,942 2,640,177 48,598,451 48,968,512 48,762,759 53,497,811 54,610,940 58,322,618
301 - - - - -354,268 379,256 177,220 210,083 508,043 695,166
- 90,506 7,820 - - 36,552 (1,835,169) (2,462,075) (2,139,845) (2,579,110) (2,671,942) (2,640,177) (1,480,600) (1,992,313) (1,954,805) (2,369,027) (2,163,899) (1,908,459)
47,117,851$ 46,976,199$ 46,807,954$ 51,128,784$ 52,447,041$ 56,414,159$
2,569,246$ (435,075)$ (4,936,673)$ 163,345$ 10,069,937$ 3,920,690$ 2,931,436 3,694,511 3,340,491 7,007,466 11,099,746 9,691,543
5,500,682$ 3,259,436$ (1,596,182)$ 7,170,811$ 21,169,683$ 13,612,233$
Fiscal Year
130
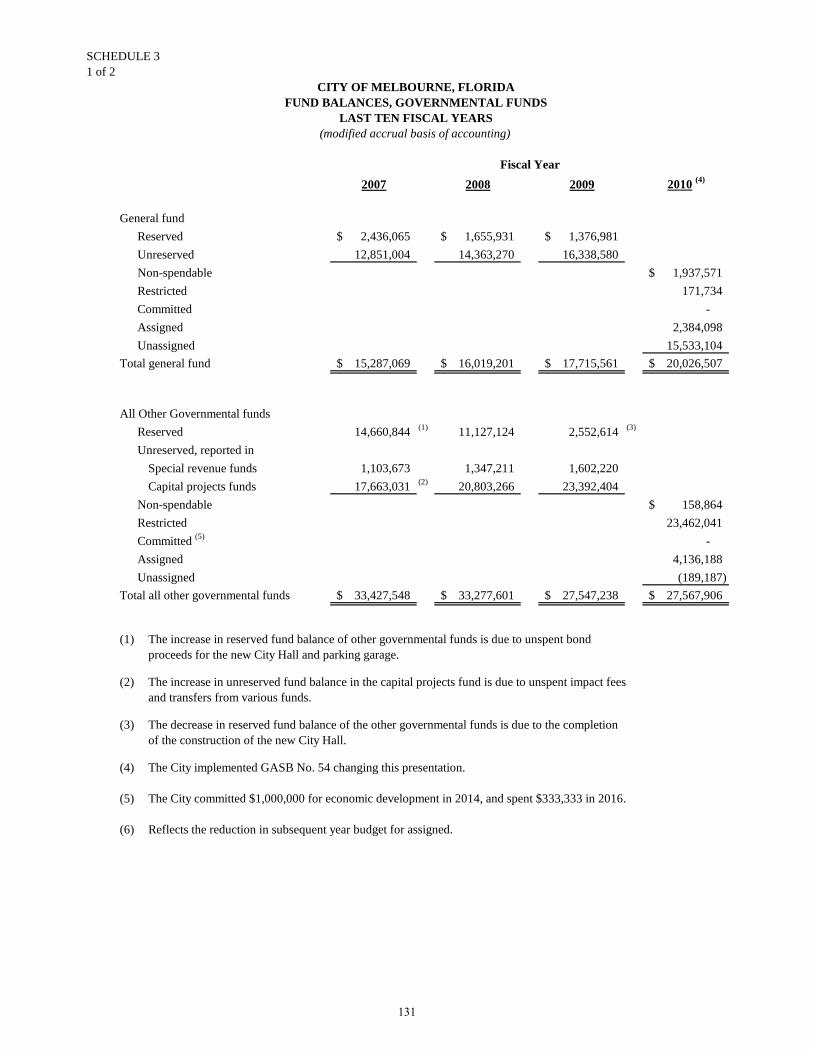
SCHEDULE 31 of 2
2007 2008 2009 2010 (4)
General fundReserved 2,436,065$ 1,655,931$ 1,376,981$ Unreserved 12,851,004 14,363,270 16,338,580 Non-spendable 1,937,571$ Restricted 171,734 Committed -Assigned 2,384,098 Unassigned 15,533,104
Total general fund 15,287,069$ 16,019,201$ 17,715,561$ 20,026,507$
All Other Governmental fundsReserved 14,660,844 (1) 11,127,124 2,552,614 (3)
Unreserved, reported inSpecial revenue funds 1,103,673 1,347,211 1,602,220 Capital projects funds 17,663,031 (2) 20,803,266 23,392,404
Non-spendable 158,864$ Restricted 23,462,041 Committed (5) -Assigned 4,136,188 Unassigned (189,187)
Total all other governmental funds 33,427,548$ 33,277,601$ 27,547,238$ 27,567,906$
(1) The increase in reserved fund balance of other governmental funds is due to unspent bondproceeds for the new City Hall and parking garage.
(2) The increase in unreserved fund balance in the capital projects fund is due to unspent impact feesand transfers from various funds.
(3) The decrease in reserved fund balance of the other governmental funds is due to the completion of the construction of the new City Hall.
(4) The City implemented GASB No. 54 changing this presentation.
(5) The City committed $1,000,000 for economic development in 2014, and spent $333,333 in 2016.
(6) Reflects the reduction in subsequent year budget for assigned.
CITY OF MELBOURNE, FLORIDAFUND BALANCES, GOVERNMENTAL FUNDS
LAST TEN FISCAL YEARS(modified accrual basis of accounting)
Fiscal Year
131
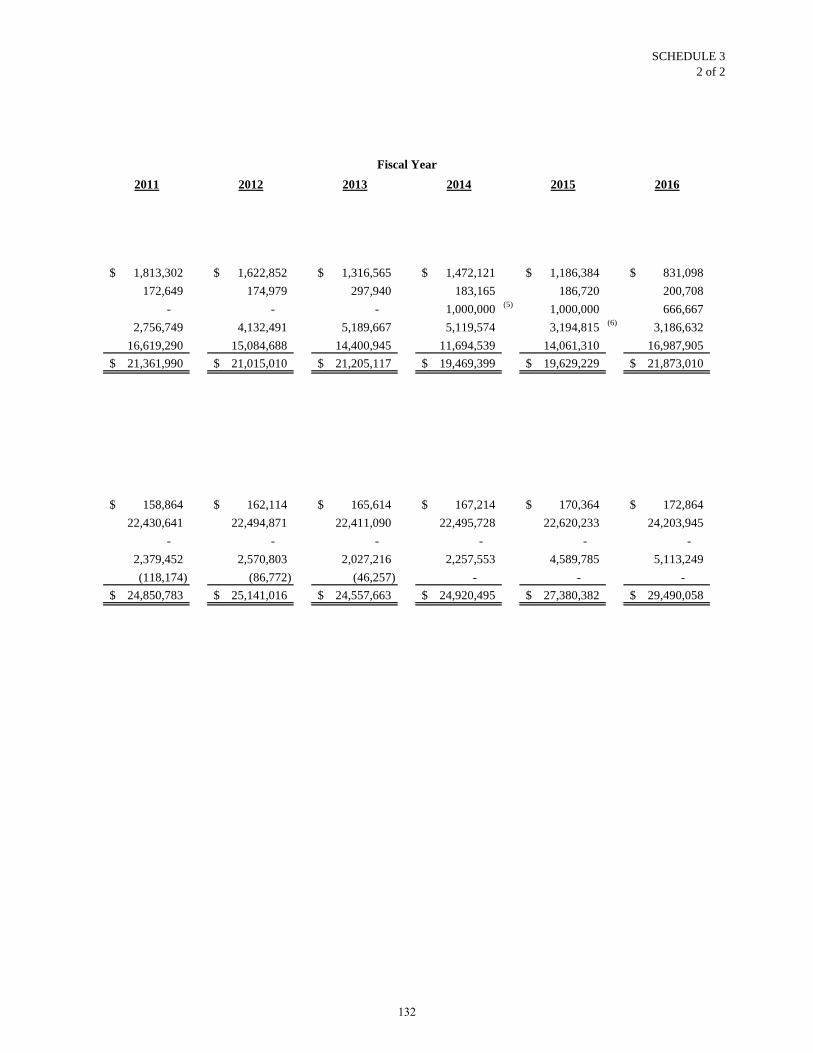
SCHEDULE 32 of 2
2011 2012 2013 2014 2015 2016
1,813,302$ 1,622,852$ 1,316,565$ 1,472,121$ 1,186,384$ 831,098$ 172,649 174,979 297,940 183,165 186,720 200,708
- - - 1,000,000 (5) 1,000,000 666,667 2,756,749 4,132,491 5,189,667 5,119,574 3,194,815 (6) 3,186,632
16,619,290 15,084,688 14,400,945 11,694,539 14,061,310 16,987,905 21,361,990$ 21,015,010$ 21,205,117$ 19,469,399$ 19,629,229$ 21,873,010$
158,864$ 162,114$ 165,614$ 167,214$ 170,364$ 172,864$ 22,430,641 22,494,871 22,411,090 22,495,728 22,620,233 24,203,945
- - - - - -2,379,452 2,570,803 2,027,216 2,257,553 4,589,785 5,113,249 (118,174) (86,772) (46,257) - - -
24,850,783$ 25,141,016$ 24,557,663$ 24,920,495$ 27,380,382$ 29,490,058$
Fiscal Year
132

SCHEDULE 41 OF 2
2007 2008 2009 2010Revenues
TaxesProperty 20,102,973$ 21,575,415$ 21,279,929$ 21,976,524$ Utility and telecommunications 10,776,705 10,707,574 11,397,119 11,492,122 Franchise fees 7,155,421 7,187,413 7,281,090 6,594,719
Intergovernmental 16,054,733 16,049,655 15,088,823 15,660,518 Charges for services 10,964,291 10,475,048 10,495,266 10,140,673 Impact fees 4,224,599 5,829,725 1,224,448 (3) 990,382 Licenses and permits 2,620,650 2,606,129 2,113,101 2,176,146 Confiscated property 51,468 134,125 50,892 101,335 Fines, forfeitures, penalties and fees 636,026 545,813 428,541 349,902 Investment earnings 2,756,167 2,026,505 2,058,312 980,543 Perpetual care endowment additions 3,350 2,250 1,100 2,400 Other revenues 675,564 780,545 853,052 868,794 Total revenues 76,021,947 77,920,197 72,271,673 71,334,058
Expenditures
General government 12,130,419 12,753,633 13,080,708 12,733,112 Public safety 35,128,764 37,283,528 36,632,263 36,471,946 Public works 6,879,135 8,235,277 7,262,198 7,333,757 Parks and recreation 6,130,938 6,137,068 5,539,116 5,357,134 Housing and urban improvement 3,605,551 2,374,948 2,778,951 3,119,666 Capital outlay 9,684,871 10,823,301 10,807,978 4,429,871 Debt service
Principal 599,443 829,163 875,355 835,446 Interest 576,110 680,262 641,885 603,110 Bond issuance costs 26,137 - - -
Total expenditures 74,761,368 79,117,180 77,618,454 70,884,042
Excess of revenues over (under)expenditures 1,260,579 (1,196,983) (5,346,781) 450,016
Other financing sources (uses)
Revenue bonds issued 6,176,000 - - -
Capital leases 1,171,481 (1) 782,817 (1) - - Sale of capital assets 61,606 64,421 71,185 64,575 Insurance recoveries - - - - Transfers in 9,882,451 (2) 4,813,589 5,247,400 5,694,976 Transfers out (7,755,785) (3,881,659) (4,005,807) (3,877,953) Total other financing sources (uses) 9,535,753 1,779,168 1,312,778 1,881,598
Net change in fund balances 10,796,332$ 582,185$ (4,034,003)$ 2,331,614$
Debt service as a percentage ofnoncapital expenditures 1.8% 2.2% 2.3% 2.2%
(1) Purchase of police vehicles and radios.(2) Non-departmental general fund for appropriation to transportation projects and various funds for general capital projects. (3) Downturn in construction activity.(4) No road resurfacing in 2012.(5) Neighborhood stabilization program expenditures(6) Purchase of fire truck and police video system, contractual salary increases and increased workers compensation medical claims. (7) Purchase of aerial fire truck and police video system.
Fiscal Year
CITY OF MELBOURNE, FLORIDACHANGES IN FUND BALANCES, GOVERNMENTAL FUNDS
LAST TEN FISCAL YEARS(modified accrual basis of accounting)
133
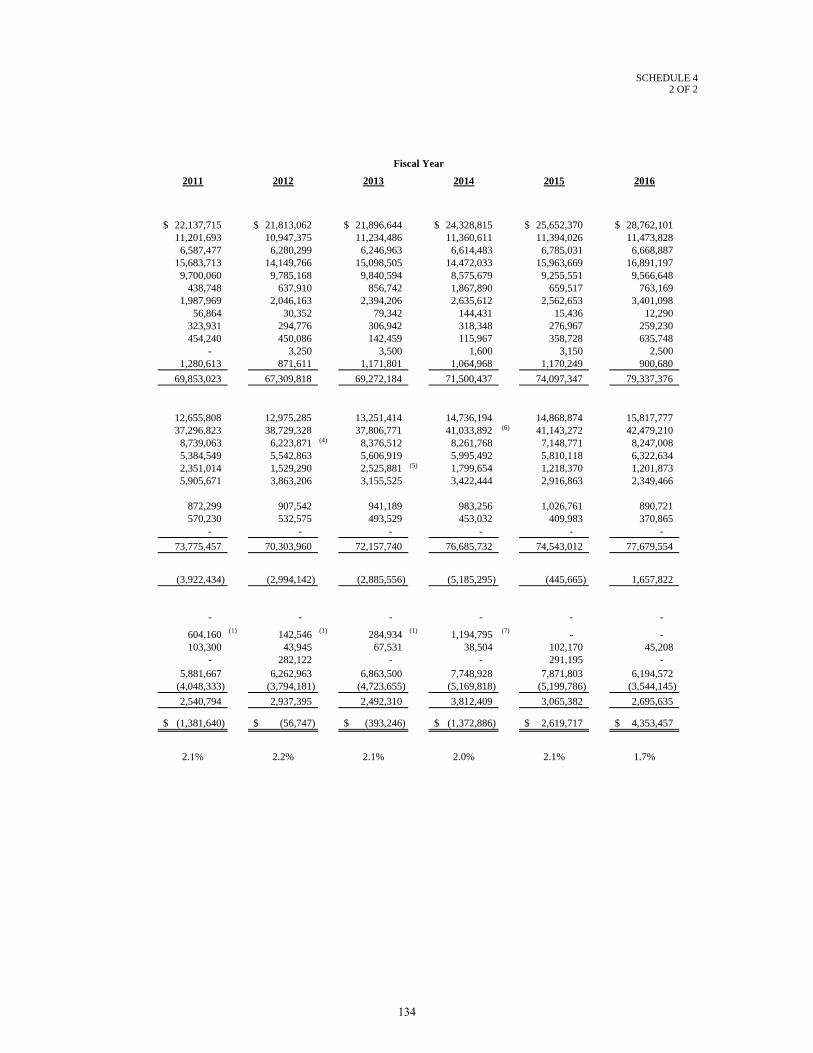
SCHEDULE 42 OF 2
2011 2012 2013 2014 2015 2016
22,137,715$ 21,813,062$ 21,896,644$ 24,328,815$ 25,652,370$ 28,762,101$ 11,201,693 10,947,375 11,234,486 11,360,611 11,394,026 11,473,828
6,587,477 6,280,299 6,246,963 6,614,483 6,785,031 6,668,887 15,683,713 14,149,766 15,098,505 14,472,033 15,963,669 16,891,197
9,700,060 9,785,168 9,840,594 8,575,679 9,255,551 9,566,648 438,748 637,910 856,742 1,867,890 659,517 763,169
1,987,969 2,046,163 2,394,206 2,635,612 2,562,653 3,401,098 56,864 30,352 79,342 144,431 15,436 12,290
323,931 294,776 306,942 318,348 276,967 259,230 454,240 450,086 142,459 115,967 358,728 635,748
- 3,250 3,500 1,600 3,150 2,500 1,280,613 871,611 1,171,801 1,064,968 1,170,249 900,680
69,853,023 67,309,818 69,272,184 71,500,437 74,097,347 79,337,376
12,655,808 12,975,285 13,251,414 14,736,194 14,868,874 15,817,777 37,296,823 38,729,328 37,806,771 41,033,892 (6) 41,143,272 42,479,210
8,739,063 6,223,871 (4) 8,376,512 8,261,768 7,148,771 8,247,008 5,384,549 5,542,863 5,606,919 5,995,492 5,810,118 6,322,634 2,351,014 1,529,290 2,525,881 (5) 1,799,654 1,218,370 1,201,873 5,905,671 3,863,206 3,155,525 3,422,444 2,916,863 2,349,466
872,299 907,542 941,189 983,256 1,026,761 890,721 570,230 532,575 493,529 453,032 409,983 370,865
- - - - - - 73,775,457 70,303,960 72,157,740 76,685,732 74,543,012 77,679,554
(3,922,434) (2,994,142) (2,885,556) (5,185,295) (445,665) 1,657,822
- - - - - -
604,160 (1) 142,546 (1) 284,934 (1) 1,194,795 (7) - - 103,300 43,945 67,531 38,504 102,170 45,208
- 282,122 - - 291,195 - 5,881,667 6,262,963 6,863,500 7,748,928 7,871,803 6,194,572
(4,048,333) (3,794,181) (4,723,655) (5,169,818) (5,199,786) (3,544,145) 2,540,794 2,937,395 2,492,310 3,812,409 3,065,382 2,695,635
(1,381,640)$ (56,747)$ (393,246)$ (1,372,886)$ 2,619,717$ 4,353,457$
2.1% 2.2% 2.1% 2.0% 2.1% 1.7%
Fiscal Year
134
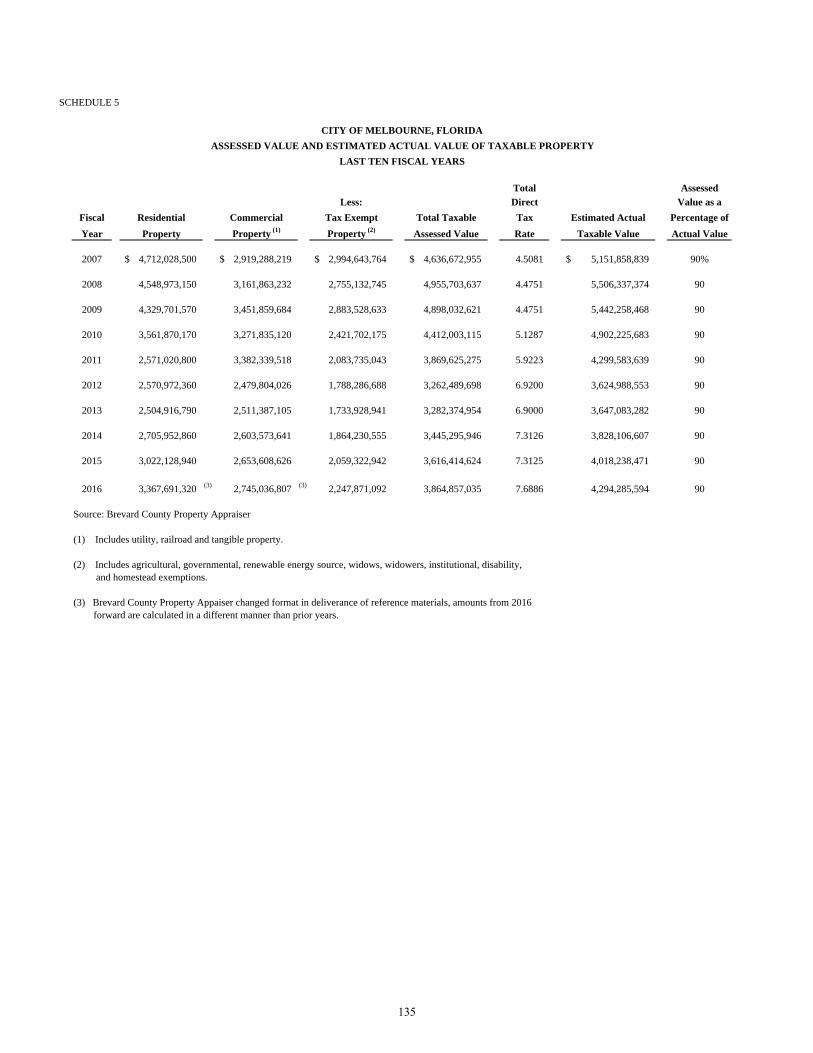
SCHEDULE 5
Total AssessedLess: Direct Value as a
Fiscal Residential Commercial Tax Exempt Total Taxable Tax Estimated Actual Percentage ofYear Property Property (1) Property (2) Assessed Value Rate Taxable Value Actual Value
2007 4,712,028,500$ 2,919,288,219$ 2,994,643,764$ 4,636,672,955$ 4.5081 5,151,858,839$ 90%
2008 4,548,973,150 3,161,863,232 2,755,132,745 4,955,703,637 4.4751 5,506,337,374 90
2009 4,329,701,570 3,451,859,684 2,883,528,633 4,898,032,621 4.4751 5,442,258,468 90
2010 3,561,870,170 3,271,835,120 2,421,702,175 4,412,003,115 5.1287 4,902,225,683 90
2011 2,571,020,800 3,382,339,518 2,083,735,043 3,869,625,275 5.9223 4,299,583,639 90
2012 2,570,972,360 2,479,804,026 1,788,286,688 3,262,489,698 6.9200 3,624,988,553 90
2013 2,504,916,790 2,511,387,105 1,733,928,941 3,282,374,954 6.9000 3,647,083,282 90
2014 2,705,952,860 2,603,573,641 1,864,230,555 3,445,295,946 7.3126 3,828,106,607 90
2015 3,022,128,940 2,653,608,626 2,059,322,942 3,616,414,624 7.3125 4,018,238,471 90
2016 3,367,691,320 (3) 2,745,036,807 (3) 2,247,871,092 3,864,857,035 7.6886 4,294,285,594 90
Source: Brevard County Property Appraiser
(1) Includes utility, railroad and tangible property.
(2) Includes agricultural, governmental, renewable energy source, widows, widowers, institutional, disability, and homestead exemptions.
(3) Brevard County Property Appaiser changed format in deliverance of reference materials, amounts from 2016 forward are calculated in a different manner than prior years.
CITY OF MELBOURNE, FLORIDAASSESSED VALUE AND ESTIMATED ACTUAL VALUE OF TAXABLE PROPERTY
LAST TEN FISCAL YEARS
135
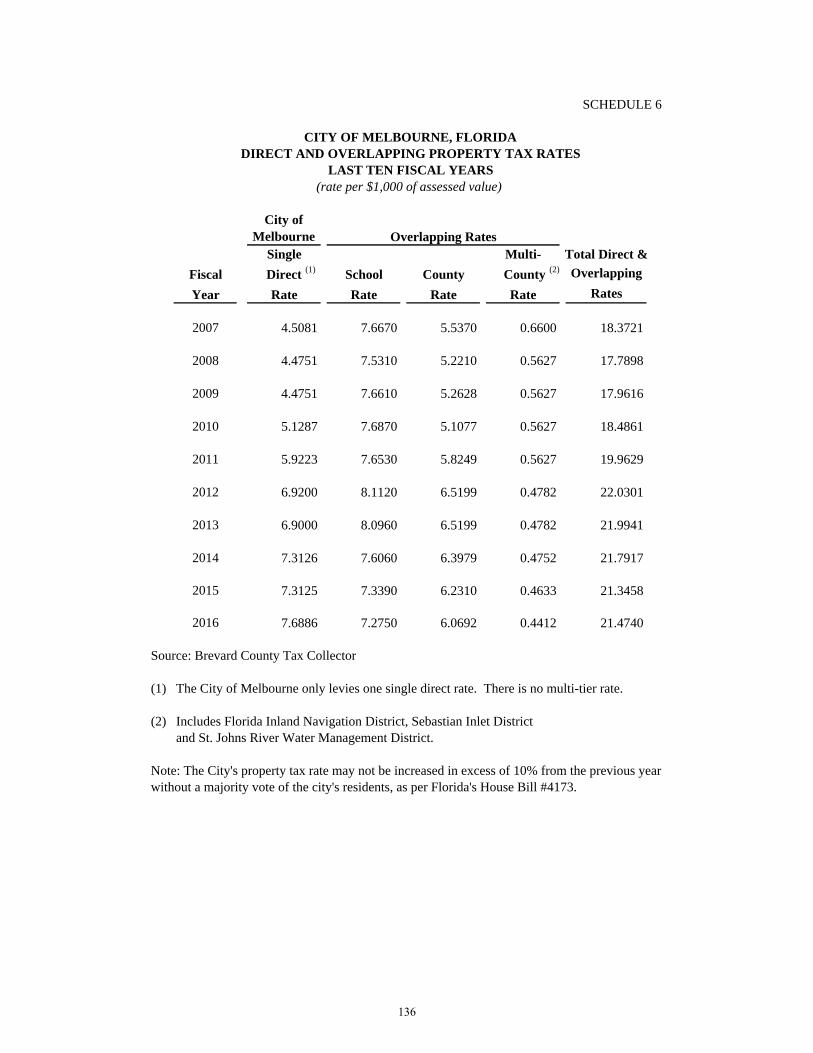
SCHEDULE 6
City of Melbourne
Single Multi- Total Direct &Fiscal Direct (1) School County County (2) OverlappingYear Rate Rate Rate Rate Rates
2007 4.5081 7.6670 5.5370 0.6600 18.3721
2008 4.4751 7.5310 5.2210 0.5627 17.7898
2009 4.4751 7.6610 5.2628 0.5627 17.9616
2010 5.1287 7.6870 5.1077 0.5627 18.4861
2011 5.9223 7.6530 5.8249 0.5627 19.9629
2012 6.9200 8.1120 6.5199 0.4782 22.0301
2013 6.9000 8.0960 6.5199 0.4782 21.9941
2014 7.3126 7.6060 6.3979 0.4752 21.7917
2015 7.3125 7.3390 6.2310 0.4633 21.3458
2016 7.6886 7.2750 6.0692 0.4412 21.4740
Source: Brevard County Tax Collector
(1) The City of Melbourne only levies one single direct rate. There is no multi-tier rate.
(2) Includes Florida Inland Navigation District, Sebastian Inlet Districtand St. Johns River Water Management District.
Note: The City's property tax rate may not be increased in excess of 10% from the previous year without a majority vote of the city's residents, as per Florida's House Bill #4173.
Overlapping Rates
CITY OF MELBOURNE, FLORIDADIRECT AND OVERLAPPING PROPERTY TAX RATES
LAST TEN FISCAL YEARS(rate per $1,000 of assessed value)
136
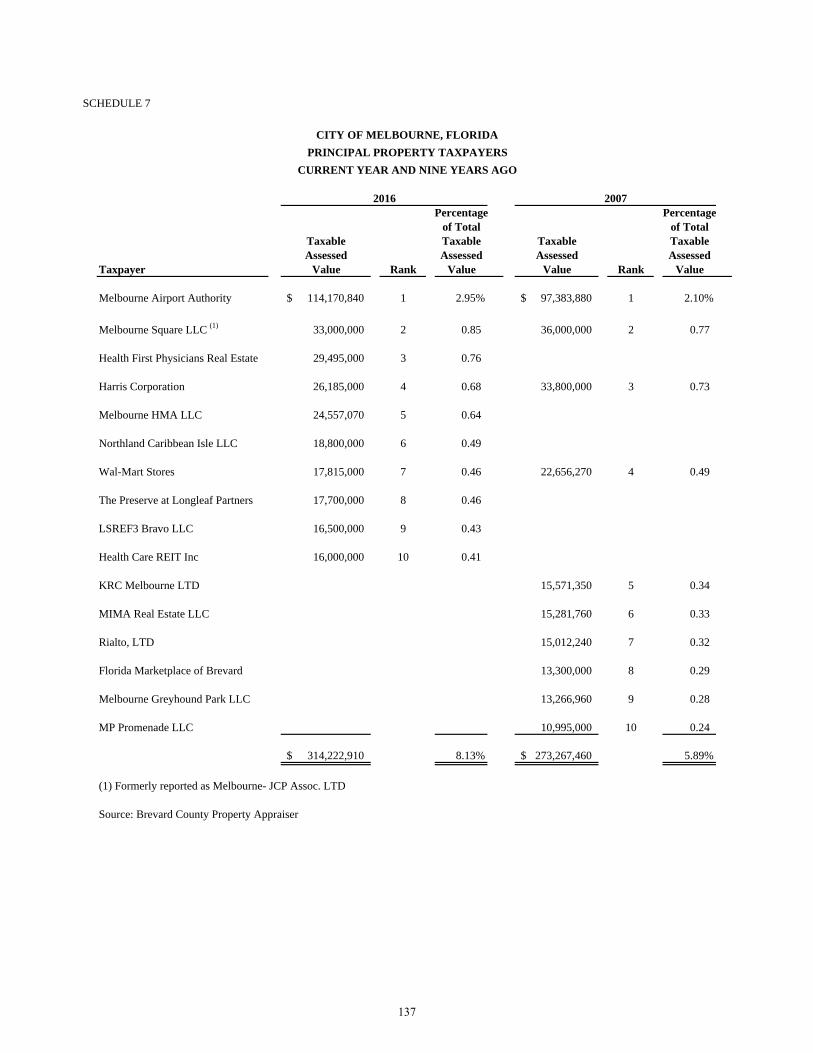
SCHEDULE 7
Percentage Percentageof Total of Total
Taxable Taxable Taxable TaxableAssessed Assessed Assessed Assessed
Taxpayer Value Rank Value Value Rank Value
Melbourne Airport Authority 114,170,840$ 1 2.95% 97,383,880$ 1 2.10%
Melbourne Square LLC (1) 33,000,000 2 0.85 36,000,000 2 0.77
Health First Physicians Real Estate 29,495,000 3 0.76
Harris Corporation 26,185,000 4 0.68 33,800,000 3 0.73
Melbourne HMA LLC 24,557,070 5 0.64
Northland Caribbean Isle LLC 18,800,000 6 0.49
Wal-Mart Stores 17,815,000 7 0.46 22,656,270 4 0.49
The Preserve at Longleaf Partners 17,700,000 8 0.46
LSREF3 Bravo LLC 16,500,000 9 0.43
Health Care REIT Inc 16,000,000 10 0.41
KRC Melbourne LTD 15,571,350 5 0.34
MIMA Real Estate LLC 15,281,760 6 0.33
Rialto, LTD 15,012,240 7 0.32
Florida Marketplace of Brevard 13,300,000 8 0.29
Melbourne Greyhound Park LLC 13,266,960 9 0.28
MP Promenade LLC 10,995,000 10 0.24
314,222,910$ 8.13% 273,267,460$ 5.89%
(1) Formerly reported as Melbourne- JCP Assoc. LTD
Source: Brevard County Property Appraiser
CITY OF MELBOURNE, FLORIDAPRINCIPAL PROPERTY TAXPAYERS
CURRENT YEAR AND NINE YEARS AGO
2016 2007
137
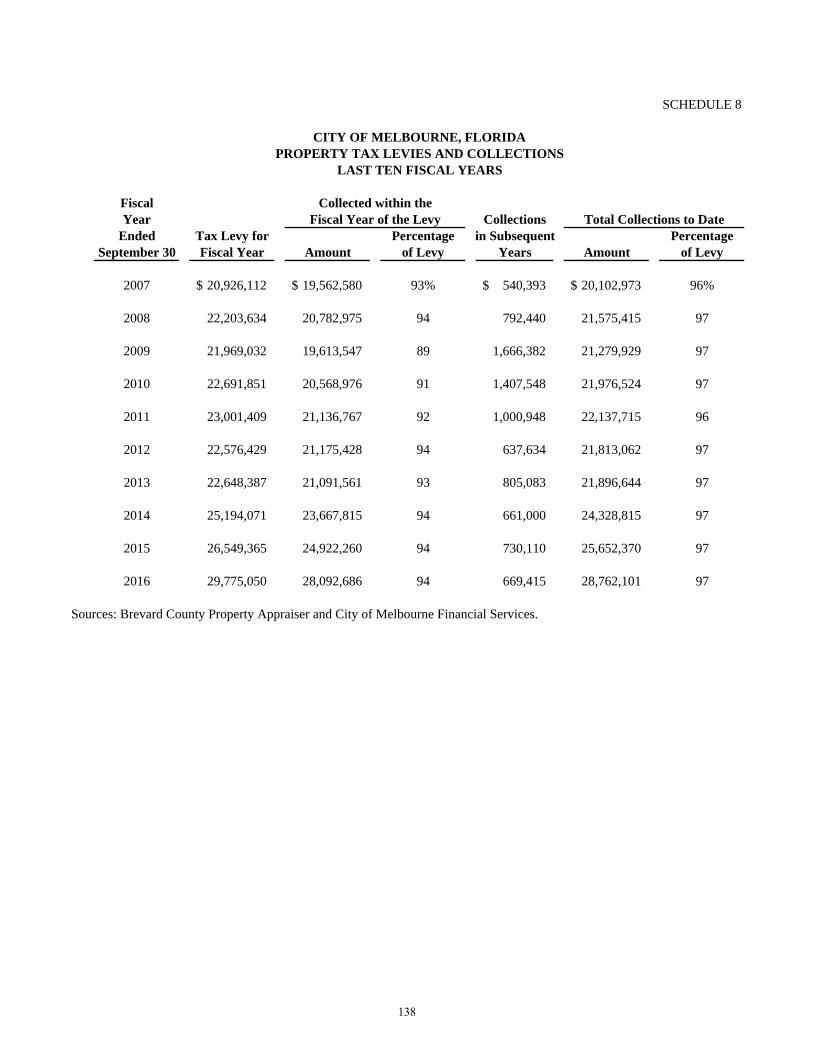
SCHEDULE 8
FiscalYear Collections
Ended Tax Levy for Percentage in Subsequent PercentageSeptember 30 Fiscal Year Amount of Levy Years Amount of Levy
2007 20,926,112$ 19,562,580$ 93% 540,393$ 20,102,973$ 96%
2008 22,203,634 20,782,975 94 792,440 21,575,415 97
2009 21,969,032 19,613,547 89 1,666,382 21,279,929 97
2010 22,691,851 20,568,976 91 1,407,548 21,976,524 97
2011 23,001,409 21,136,767 92 1,000,948 22,137,715 96
2012 22,576,429 21,175,428 94 637,634 21,813,062 97
2013 22,648,387 21,091,561 93 805,083 21,896,644 97
2014 25,194,071 23,667,815 94 661,000 24,328,815 97
2015 26,549,365 24,922,260 94 730,110 25,652,370 97
2016 29,775,050 28,092,686 94 669,415 28,762,101 97
Sources: Brevard County Property Appraiser and City of Melbourne Financial Services.
Collected within theFiscal Year of the Levy
CITY OF MELBOURNE, FLORIDAPROPERTY TAX LEVIES AND COLLECTIONS
LAST TEN FISCAL YEARS
Total Collections to Date
138

SCHEDULE 9
Gallons of Gallons ofFiscal Water Water Water Water Sewer Sewer Sewer SewerYear Consumed (1) Revenue (4) Base Rate (2) Usage Rate (3) Treated (1) Revenue (4) Base Rate (2) Usage Rate (3)
2007 4,857,091 20,727,646$ 5.09$ 3.21$ 2,272,113 14,542,999$ 7.19$ 5.17$
2008 4,718,506 22,295,533 6.25 3.43 2,226,739 15,067,766 7.85 5.27
2009 4,562,415 23,154,689 6.69 3.67 2,153,407 15,586,500 8.40 5.64
2010 4,657,291 24,571,182 6.25 3.85 2,171,931 16,469,144 8.18 5.92
2011 4,783,236 26,334,505 6.56 4.04 2,179,757 17,543,002 8.59 6.22
2012 4,687,615 27,195,156 6.89 4.24 2,143,691 18,100,459 9.02 6.53
2013 4,645,065 27,275,917 6.89 4.24 2,129,172 18,083,757 9.02 6.53
2014 4,672,892 28,638,534 7.58 4.33 2,127,061 19,292,642 11.21 6.49
2015 4,643,892 30,412,363 8.00 4.57 2,136,767 20,527,181 11.83 6.85
2016 4,768,201 30,984,020 8.00 4.57 2,214,882 20,817,696 11.83 6.85
Source: City Water and Sewer Department
(1) Gallons are presented in thousands.(2) Rates shown through 2009 are for 3/4" meters at the inside City rate. Rates after October 1, 2009 are based on one equivalent residential connection (ERC) at the inside City rate.(3) Per 1,000 gallons of metered water at the inside City rate.(4) Revenues are not adjusted for bad debt.
Total Direct Rate Total Direct Rate
CITY OF MELBOURNE, FLORIDAWATER AND SEWER CONSUMPTION, RATES AND REVENUE
LAST TEN FISCAL YEARS
139
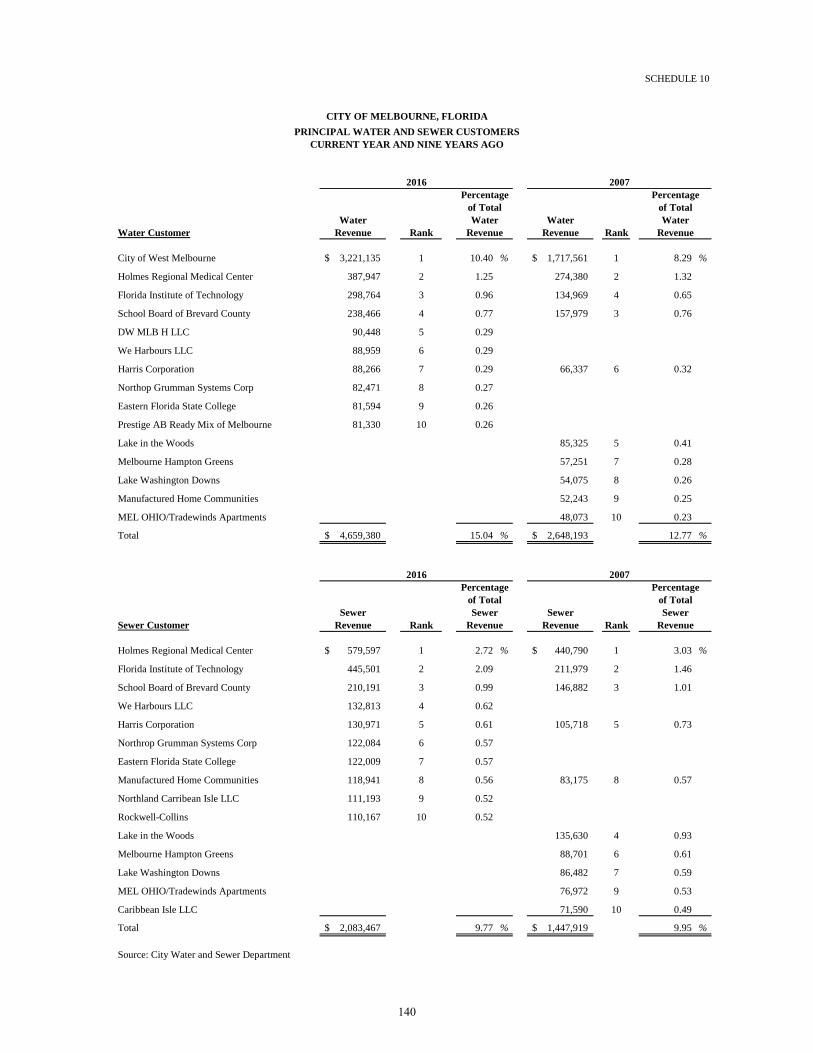
SCHEDULE 10
Water WaterWater Customer Revenue Rank Revenue Rank
City of West Melbourne 3,221,135$ 1 10.40 % 1,717,561$ 1 8.29 %
Holmes Regional Medical Center 387,947 2 1.25 274,380 2 1.32
Florida Institute of Technology 298,764 3 0.96 134,969 4 0.65
School Board of Brevard County 238,466 4 0.77 157,979 3 0.76
DW MLB H LLC 90,448 5 0.29
We Harbours LLC 88,959 6 0.29
Harris Corporation 88,266 7 0.29 66,337 6 0.32
Northop Grumman Systems Corp 82,471 8 0.27
Eastern Florida State College 81,594 9 0.26
Prestige AB Ready Mix of Melbourne 81,330 10 0.26
Lake in the Woods 85,325 5 0.41
Melbourne Hampton Greens 57,251 7 0.28
Lake Washington Downs 54,075 8 0.26
Manufactured Home Communities 52,243 9 0.25
MEL OHIO/Tradewinds Apartments 48,073 10 0.23
Total 4,659,380$ 15.04 % 2,648,193$ 12.77 %
Sewer SewerSewer Customer Revenue Rank Revenue Rank
Holmes Regional Medical Center 579,597$ 1 2.72 % 440,790$ 1 3.03 %
Florida Institute of Technology 445,501 2 2.09 211,979 2 1.46
School Board of Brevard County 210,191 3 0.99 146,882 3 1.01
We Harbours LLC 132,813 4 0.62
Harris Corporation 130,971 5 0.61 105,718 5 0.73
Northrop Grumman Systems Corp 122,084 6 0.57
Eastern Florida State College 122,009 7 0.57
Manufactured Home Communities 118,941 8 0.56 83,175 8 0.57
Northland Carribean Isle LLC 111,193 9 0.52
Rockwell-Collins 110,167 10 0.52
Lake in the Woods 135,630 4 0.93
Melbourne Hampton Greens 88,701 6 0.61
Lake Washington Downs 86,482 7 0.59
MEL OHIO/Tradewinds Apartments 76,972 9 0.53
Caribbean Isle LLC 71,590 10 0.49
Total 2,083,467$ 9.77 % 1,447,919$ 9.95 %
Source: City Water and Sewer Department
Percentageof TotalSewer
Revenue
Percentageof Total
2016
WaterRevenue
2007
Percentageof TotalWater
Revenue
CURRENT YEAR AND NINE YEARS AGO
CITY OF MELBOURNE, FLORIDAPRINCIPAL WATER AND SEWER CUSTOMERS
2016 2007
SewerRevenue
Percentageof Total
140

SCHEDULE 111 of 2
1994, 1995 2005 & 2006& 1998 2003 2003 Electric
Fiscal Sales Tax Utility Tax Gax Tax Utility Tax RedevelopmentYear Bonds Bonds Bonds Note Bonds2007 1,284,701$ 652,689$ 1,349,762$ 12,062,000$ 1,434,121$ 2008 1,092,387 607,645 1,259,675 11,653,000 1,338,403 2009 895,000 560,822 1,166,029 11,215,000 1,238,904 2010 765,000 512,150 1,068,684 10,759,000 1,135,475 2011 625,000 461,555 967,494 10,286,000 1,027,961 2012 480,000 408,961 862,307 9,793,000 916,200 2013 330,000 354,290 752,965 9,282,000 800,024 2014 170,000 297,460 639,304 8,750,000 679,259 2015 - 238,385 521,153 8,196,000 553,724 2016 - 176,976 398,335 7,620,000 423,230
Total PercentageFiscal Primary of Personal PerYear Government Income (1) Capita (1)
2007 149,857,808$ 9.01% 1,912$ 2008 146,764,619 7.84 1,874 2009 142,520,066 7.52 1,820 2010 137,864,199 6.74 1,758 2011 133,449,834 6.81 1,748 2012 131,660,444 7.81 1,708 2013 131,229,204 7.44 1,696 2014 128,575,363 6.59 1,647 2015 123,818,823 6.62 1,556 2016 115,981,801 5.64 1,442
Notes: Details regarding the City's outstanding debt can be found in the notes to the financial statements.(1) Population and personal income data can be found in Schedule 16.
Governmental Activities
CITY OF MELBOURNE, FLORIDARATIOS OF OUTSTANDING DEBT BY TYPE
LAST TEN FISCAL YEARS
141
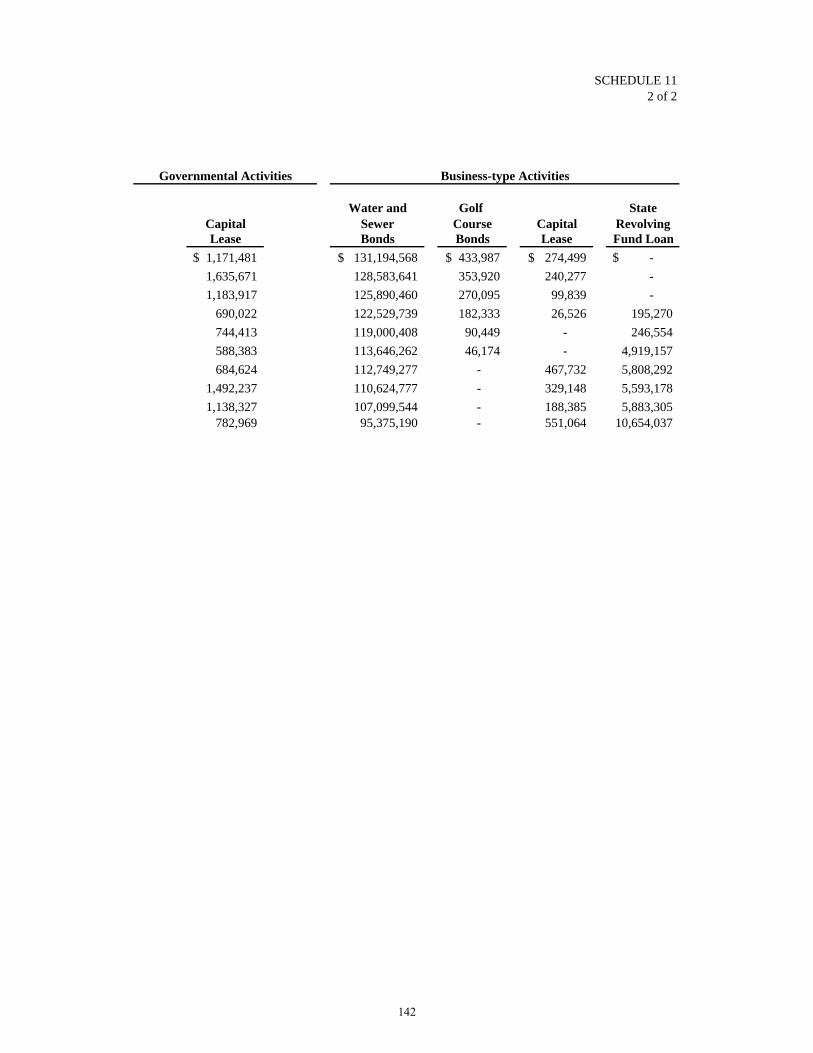
SCHEDULE 112 of 2
Water and Golf StateCapital Sewer Course Capital RevolvingLease Bonds Bonds Lease Fund Loan
1,171,481$ 131,194,568$ 433,987$ 274,499$ -$ 1,635,671 128,583,641 353,920 240,277 - 1,183,917 125,890,460 270,095 99,839 -
690,022 122,529,739 182,333 26,526 195,270 744,413 119,000,408 90,449 - 246,554 588,383 113,646,262 46,174 - 4,919,157 684,624 112,749,277 - 467,732 5,808,292
1,492,237 110,624,777 - 329,148 5,593,178 1,138,327 107,099,544 - 188,385 5,883,305
782,969 95,375,190 - 551,064 10,654,037
Business-type ActivitiesGovernmental Activities
142
SCHEDULE 12
CITY OF MELBOURNE, FLORIDARATIOS OF GENERAL BONDED DEBT OUTSTANDING
LAST TEN FISCAL YEARS
The City of Melbourne has no general bonded debt.
SCHEDULE 13
CITY OF MELBOURNE, FLORIDALEGAL DEBT MARGIN INFORMATION
LAST TEN FISCAL YEARS
The City of Melbourne has no general bonded debt.
143
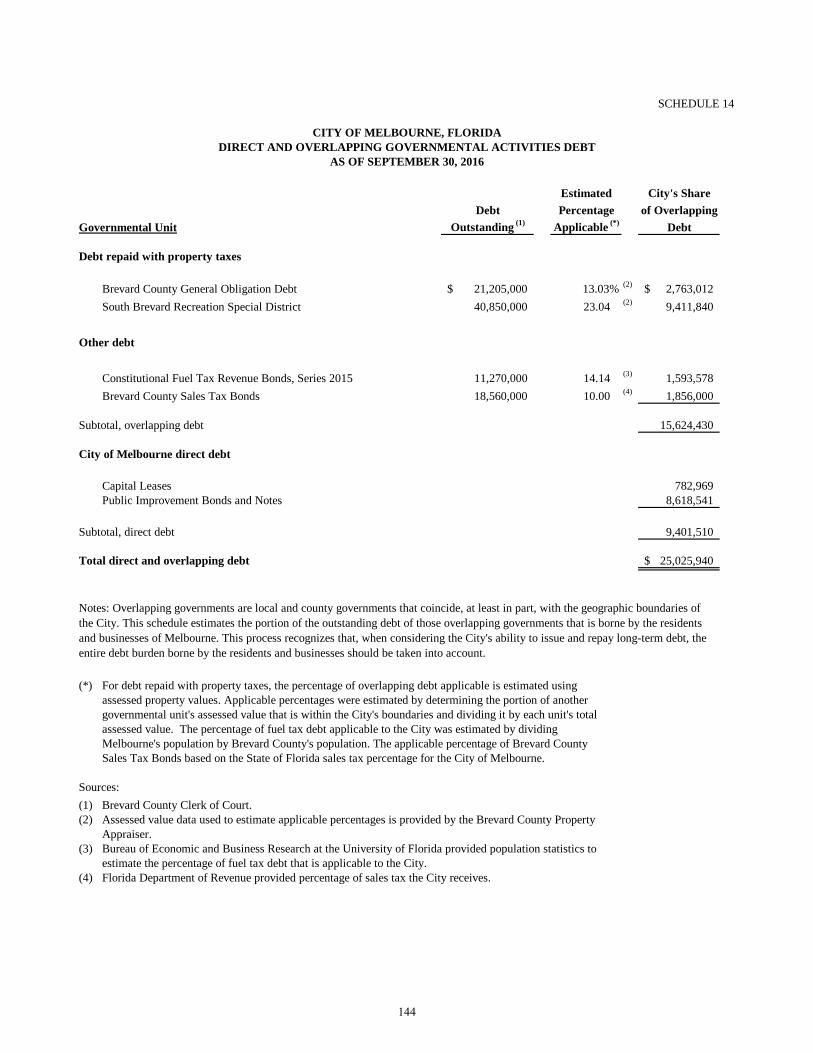
SCHEDULE 14
Estimated City's ShareDebt Percentage of Overlapping
Governmental Unit Outstanding (1) Applicable (*) Debt
Debt repaid with property taxes
Brevard County General Obligation Debt 21,205,000$ 13.03% (2) 2,763,012$ South Brevard Recreation Special District 40,850,000 23.04 (2) 9,411,840
Other debt
Constitutional Fuel Tax Revenue Bonds, Series 2015 11,270,000 14.14 (3) 1,593,578 Brevard County Sales Tax Bonds 18,560,000 10.00 (4) 1,856,000
Subtotal, overlapping debt 15,624,430
City of Melbourne direct debt
Capital Leases 782,969 Public Improvement Bonds and Notes 8,618,541
Subtotal, direct debt 9,401,510
Total direct and overlapping debt 25,025,940$
(*) For debt repaid with property taxes, the percentage of overlapping debt applicable is estimated using assessed property values. Applicable percentages were estimated by determining the portion of another governmental unit's assessed value that is within the City's boundaries and dividing it by each unit's total assessed value. The percentage of fuel tax debt applicable to the City was estimated by dividing Melbourne's population by Brevard County's population. The applicable percentage of Brevard County Sales Tax Bonds based on the State of Florida sales tax percentage for the City of Melbourne.
Sources:(1) Brevard County Clerk of Court.(2) Assessed value data used to estimate applicable percentages is provided by the Brevard County Property
Appraiser.(3) Bureau of Economic and Business Research at the University of Florida provided population statistics to
estimate the percentage of fuel tax debt that is applicable to the City.(4) Florida Department of Revenue provided percentage of sales tax the City receives.
Notes: Overlapping governments are local and county governments that coincide, at least in part, with the geographic boundaries of the City. This schedule estimates the portion of the outstanding debt of those overlapping governments that is borne by the residents and businesses of Melbourne. This process recognizes that, when considering the City's ability to issue and repay long-term debt, the entire debt burden borne by the residents and businesses should be taken into account.
CITY OF MELBOURNE, FLORIDADIRECT AND OVERLAPPING GOVERNMENTAL ACTIVITIES DEBT
AS OF SEPTEMBER 30, 2016
144
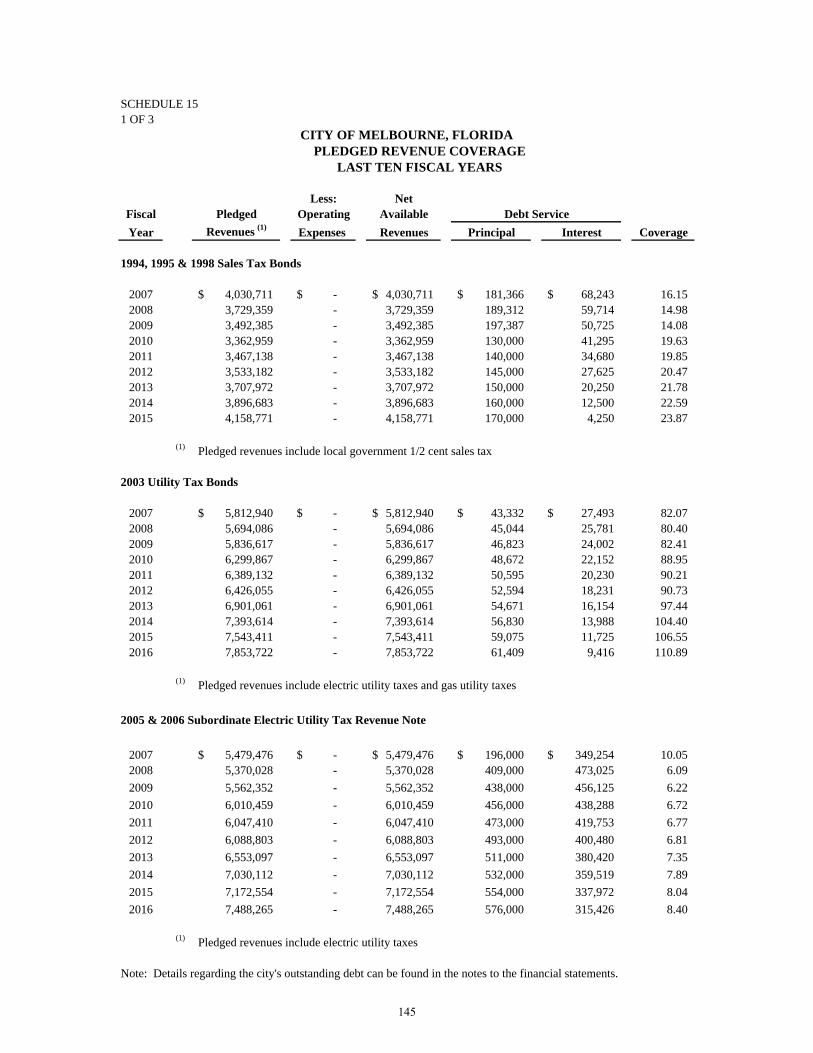
SCHEDULE 151 OF 3
Less: NetFiscal Pledged Operating AvailableYear Revenues (1) Expenses Revenues Principal Interest Coverage
1994, 1995 & 1998 Sales Tax Bonds
2007 4,030,711$ -$ 4,030,711$ 181,366$ 68,243$ 16.15 2008 3,729,359 - 3,729,359 189,312 59,714 14.98 2009 3,492,385 - 3,492,385 197,387 50,725 14.08 2010 3,362,959 - 3,362,959 130,000 41,295 19.63 2011 3,467,138 - 3,467,138 140,000 34,680 19.85 2012 3,533,182 - 3,533,182 145,000 27,625 20.47 2013 3,707,972 - 3,707,972 150,000 20,250 21.78 2014 3,896,683 - 3,896,683 160,000 12,500 22.59 2015 4,158,771 - 4,158,771 170,000 4,250 23.87
(1) Pledged revenues include local government 1/2 cent sales tax
2003 Utility Tax Bonds
2007 5,812,940$ -$ 5,812,940$ 43,332$ 27,493$ 82.07 2008 5,694,086 - 5,694,086 45,044 25,781 80.40 2009 5,836,617 - 5,836,617 46,823 24,002 82.41 2010 6,299,867 - 6,299,867 48,672 22,152 88.95 2011 6,389,132 - 6,389,132 50,595 20,230 90.21 2012 6,426,055 - 6,426,055 52,594 18,231 90.73 2013 6,901,061 - 6,901,061 54,671 16,154 97.44 2014 7,393,614 - 7,393,614 56,830 13,988 104.40 2015 7,543,411 - 7,543,411 59,075 11,725 106.55 2016 7,853,722 - 7,853,722 61,409 9,416 110.89
(1) Pledged revenues include electric utility taxes and gas utility taxes
2005 & 2006 Subordinate Electric Utility Tax Revenue Note
2007 5,479,476$ -$ 5,479,476$ 196,000$ 349,254$ 10.05 2008 5,370,028 - 5,370,028 409,000 473,025 6.09 2009 5,562,352 - 5,562,352 438,000 456,125 6.22 2010 6,010,459 - 6,010,459 456,000 438,288 6.72 2011 6,047,410 - 6,047,410 473,000 419,753 6.77 2012 6,088,803 - 6,088,803 493,000 400,480 6.81 2013 6,553,097 - 6,553,097 511,000 380,420 7.35 2014 7,030,112 - 7,030,112 532,000 359,519 7.89 2015 7,172,554 - 7,172,554 554,000 337,972 8.04 2016 7,488,265 - 7,488,265 576,000 315,426 8.40
(1) Pledged revenues include electric utility taxes
Note: Details regarding the city's outstanding debt can be found in the notes to the financial statements.
Debt Service
CITY OF MELBOURNE, FLORIDAPLEDGED REVENUE COVERAGE
LAST TEN FISCAL YEARS
145
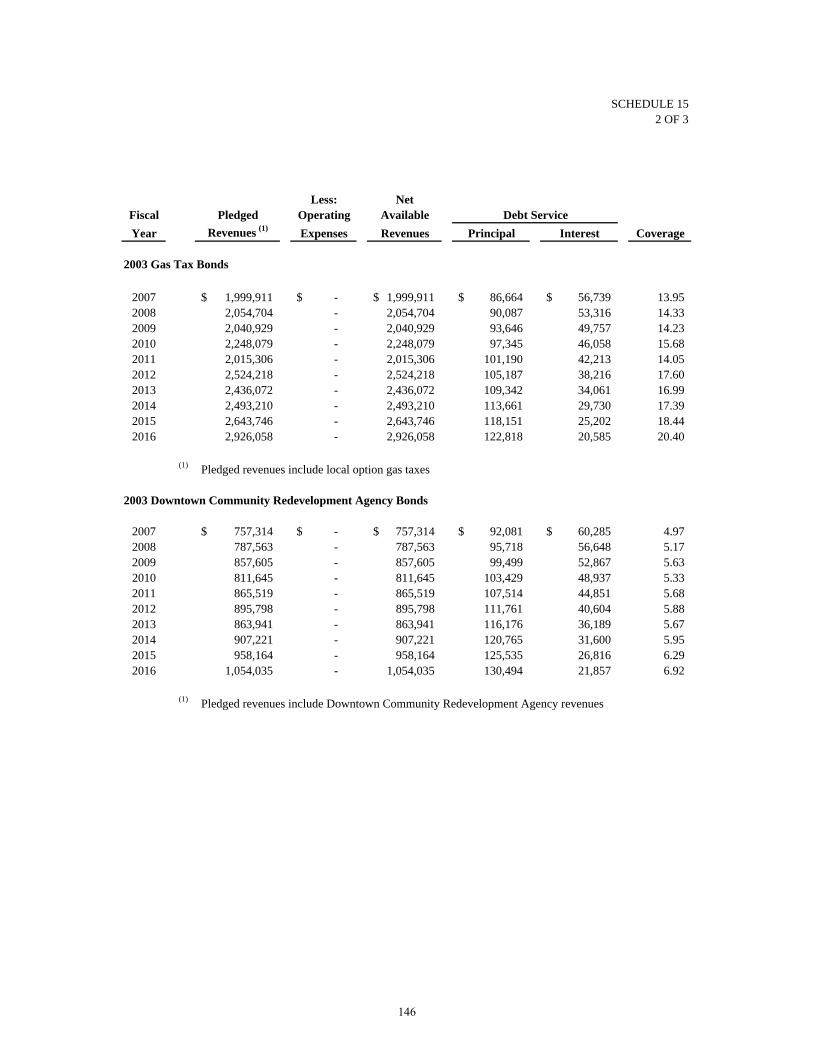
SCHEDULE 152 OF 3
Less: NetFiscal Pledged Operating AvailableYear Revenues (1) Expenses Revenues Principal Interest Coverage
2003 Gas Tax Bonds
2007 1,999,911$ -$ 1,999,911$ 86,664$ 56,739$ 13.95 2008 2,054,704 - 2,054,704 90,087 53,316 14.33 2009 2,040,929 - 2,040,929 93,646 49,757 14.23 2010 2,248,079 - 2,248,079 97,345 46,058 15.68 2011 2,015,306 - 2,015,306 101,190 42,213 14.05 2012 2,524,218 - 2,524,218 105,187 38,216 17.60 2013 2,436,072 - 2,436,072 109,342 34,061 16.99 2014 2,493,210 - 2,493,210 113,661 29,730 17.39 2015 2,643,746 - 2,643,746 118,151 25,202 18.44 2016 2,926,058 - 2,926,058 122,818 20,585 20.40
(1) Pledged revenues include local option gas taxes
2003 Downtown Community Redevelopment Agency Bonds
2007 757,314$ -$ 757,314$ 92,081$ 60,285$ 4.97 2008 787,563 - 787,563 95,718 56,648 5.17 2009 857,605 - 857,605 99,499 52,867 5.63 2010 811,645 - 811,645 103,429 48,937 5.33 2011 865,519 - 865,519 107,514 44,851 5.68 2012 895,798 - 895,798 111,761 40,604 5.88 2013 863,941 - 863,941 116,176 36,189 5.67 2014 907,221 - 907,221 120,765 31,600 5.95 2015 958,164 - 958,164 125,535 26,816 6.29 2016 1,054,035 - 1,054,035 130,494 21,857 6.92
(1) Pledged revenues include Downtown Community Redevelopment Agency revenues
Debt Service
146
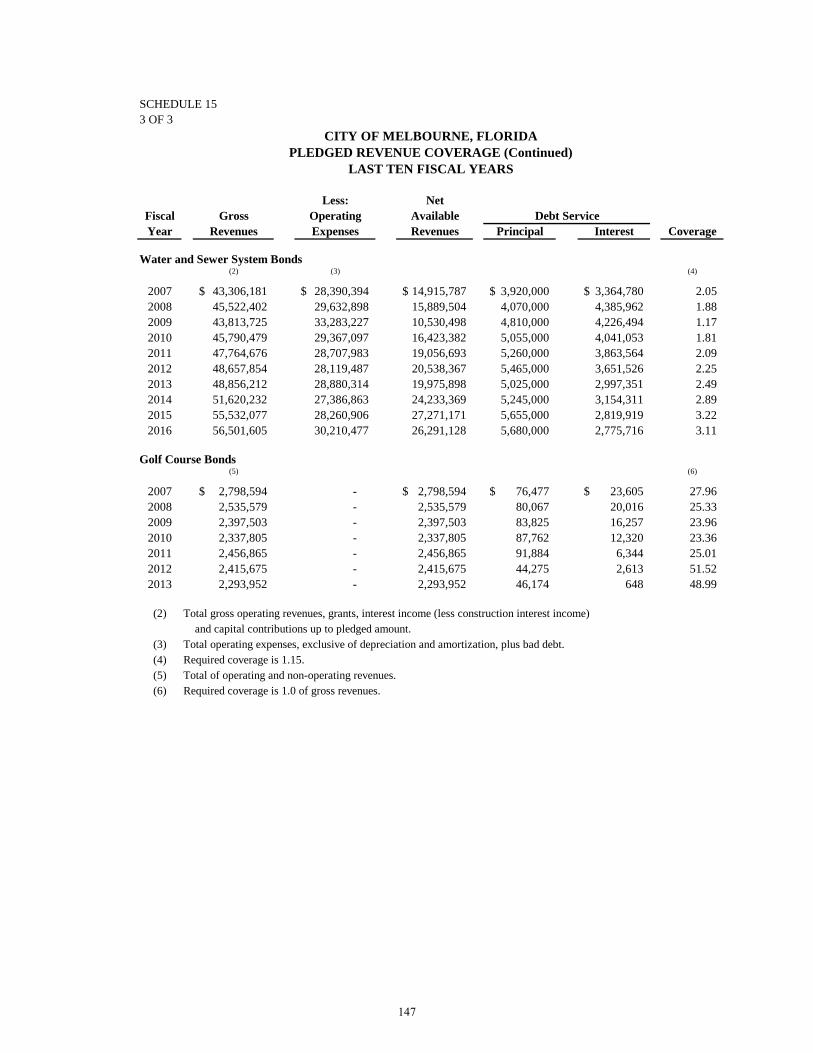
SCHEDULE 153 OF 3
Less: NetFiscal Gross Operating AvailableYear Revenues Expenses Revenues Principal Interest Coverage
Water and Sewer System Bonds(2) (3) (4)
2007 43,306,181$ 28,390,394$ 14,915,787$ 3,920,000$ 3,364,780$ 2.05 2008 45,522,402 29,632,898 15,889,504 4,070,000 4,385,962 1.88 2009 43,813,725 33,283,227 10,530,498 4,810,000 4,226,494 1.17 2010 45,790,479 29,367,097 16,423,382 5,055,000 4,041,053 1.81 2011 47,764,676 28,707,983 19,056,693 5,260,000 3,863,564 2.09 2012 48,657,854 28,119,487 20,538,367 5,465,000 3,651,526 2.25 2013 48,856,212 28,880,314 19,975,898 5,025,000 2,997,351 2.49 2014 51,620,232 27,386,863 24,233,369 5,245,000 3,154,311 2.89 2015 55,532,077 28,260,906 27,271,171 5,655,000 2,819,919 3.22 2016 56,501,605 30,210,477 26,291,128 5,680,000 2,775,716 3.11
Golf Course Bonds(5) (6)
2007 2,798,594$ - 2,798,594$ 76,477$ 23,605$ 27.96 2008 2,535,579 - 2,535,579 80,067 20,016 25.33 2009 2,397,503 - 2,397,503 83,825 16,257 23.96 2010 2,337,805 - 2,337,805 87,762 12,320 23.36 2011 2,456,865 - 2,456,865 91,884 6,344 25.01 2012 2,415,675 - 2,415,675 44,275 2,613 51.52 2013 2,293,952 - 2,293,952 46,174 648 48.99
(2) Total gross operating revenues, grants, interest income (less construction interest income)and capital contributions up to pledged amount.
(3) Total operating expenses, exclusive of depreciation and amortization, plus bad debt.(4) Required coverage is 1.15.(5) Total of operating and non-operating revenues.(6) Required coverage is 1.0 of gross revenues.
CITY OF MELBOURNE, FLORIDA
Debt Service
LAST TEN FISCAL YEARSPLEDGED REVENUE COVERAGE (Continued)
147
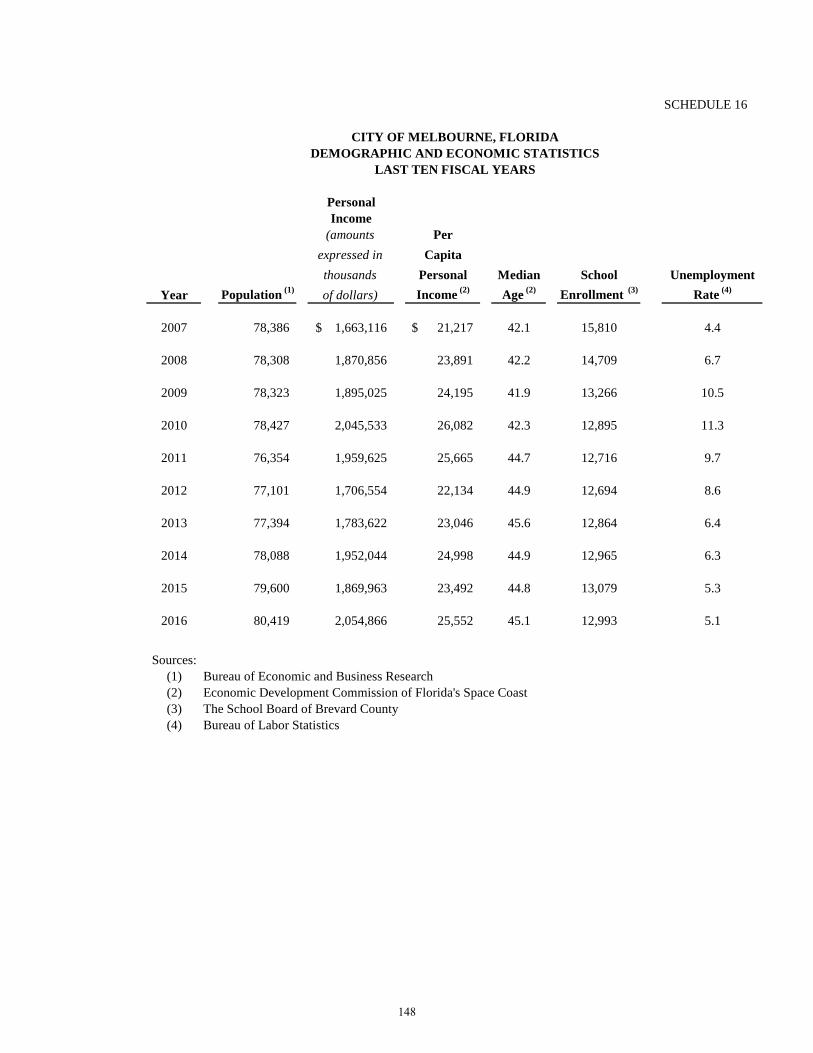
SCHEDULE 16
PersonalIncome
(amounts Perexpressed in Capitathousands Personal Median School Unemployment
Year Population (1) of dollars) Income (2) Age (2) Enrollment (3) Rate (4)
2007 78,386 1,663,116$ 21,217$ 42.1 15,810 4.4
2008 78,308 1,870,856 23,891 42.2 14,709 6.7
2009 78,323 1,895,025 24,195 41.9 13,266 10.5
2010 78,427 2,045,533 26,082 42.3 12,895 11.3
2011 76,354 1,959,625 25,665 44.7 12,716 9.7
2012 77,101 1,706,554 22,134 44.9 12,694 8.6
2013 77,394 1,783,622 23,046 45.6 12,864 6.4
2014 78,088 1,952,044 24,998 44.9 12,965 6.3
2015 79,600 1,869,963 23,492 44.8 13,079 5.3
2016 80,419 2,054,866 25,552 45.1 12,993 5.1
Sources:(1) Bureau of Economic and Business Research(2) Economic Development Commission of Florida's Space Coast(3) The School Board of Brevard County(4) Bureau of Labor Statistics
DEMOGRAPHIC AND ECONOMIC STATISTICSCITY OF MELBOURNE, FLORIDA
LAST TEN FISCAL YEARS
148
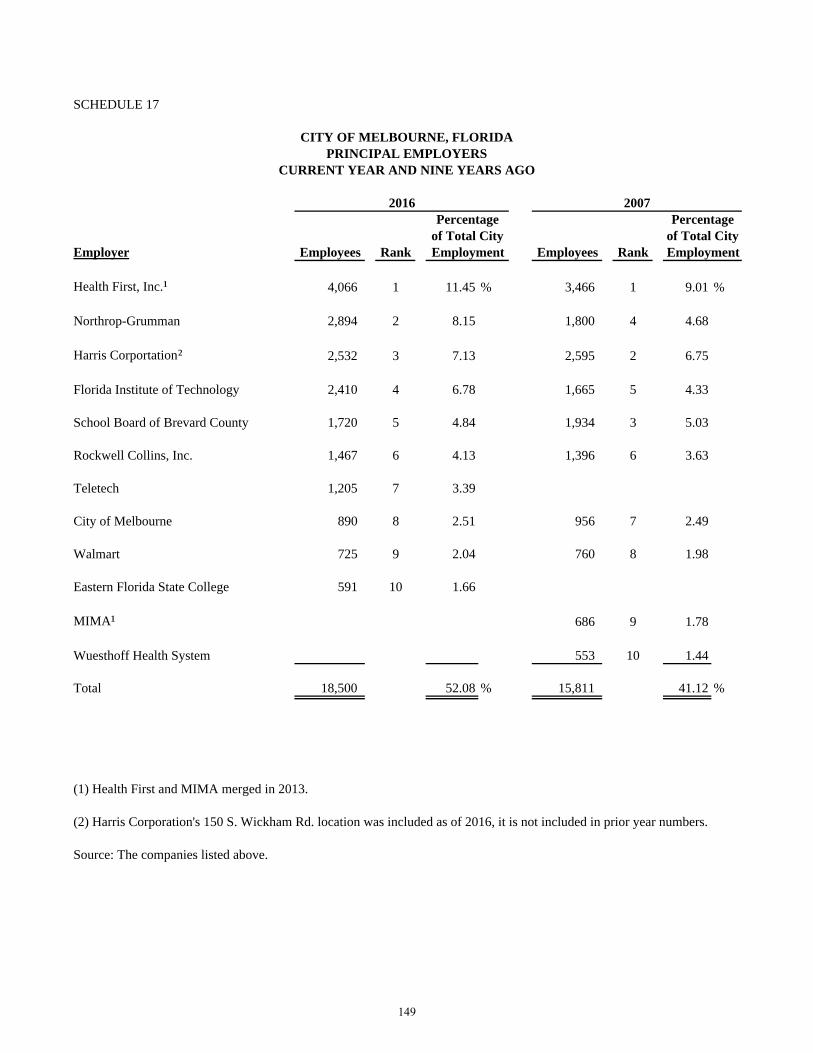
SCHEDULE 17
Employer Employees Rank Employees Rank
Health First, Inc.¹ 4,066 1 11.45 % 3,466 1 9.01 %
Northrop-Grumman 2,894 2 8.15 1,800 4 4.68
Harris Corportation² 2,532 3 7.13 2,595 2 6.75
Florida Institute of Technology 2,410 4 6.78 1,665 5 4.33
School Board of Brevard County 1,720 5 4.84 1,934 3 5.03
Rockwell Collins, Inc. 1,467 6 4.13 1,396 6 3.63
Teletech 1,205 7 3.39
City of Melbourne 890 8 2.51 956 7 2.49
Walmart 725 9 2.04 760 8 1.98
Eastern Florida State College 591 10 1.66
MIMA¹ 686 9 1.78
Wuesthoff Health System 553 10 1.44
Total 18,500 52.08 % 15,811 41.12 %
(1) Health First and MIMA merged in 2013.
(2) Harris Corporation's 150 S. Wickham Rd. location was included as of 2016, it is not included in prior year numbers.
Source: The companies listed above.
of Total City of Total CityEmployment Employment
CITY OF MELBOURNE, FLORIDAPRINCIPAL EMPLOYERS
CURRENT YEAR AND NINE YEARS AGO
2016 2007Percentage Percentage
149

SCHEDULE 18
2007 2008 2009 2010 2011 2012 2013 2014 2015 2016Function/program
General government 113 115 110 103 102 102 103 103 103 104
Police 244 245 242 242 244 241 241 239 239 239
Fire 169 173 171 169 168 164 164 164 165 165
Public works 70 71 71 63 64 64 63 (2) 65 65 65
Parks and recreation 89 85 89 83 84 84 82 84 87 (3) 88
Housing and urban improvement 10 10 9 7 7 7 7 6 6 6
Water and sewer system 186 187 187 177 175 175 175 178 179 183
Stormwater utility 0 0 0 1 1 1 4 (2) 4 4 4
Golf courses 37 36 37 32 31 31 23 23 22 21
Total 918 922 916 877 876 869 862 866 870 875
Component unit - Airport 51 52 53 52 52 51 52 49 52 55
Source: City of Melbourne Budget Department
(1) Full-time equivalent employees per the adopted budget.
(2) The Stormwater Utility added one new position and reclassified two positions from the StreetsManagement Division of Public Works to meet federal mandates and regulatory compliance in 2013.
(3) The Parks and Recreation department added three new positions to staff Wickham Park Community Center.
CITY OF MELBOURNE, FLORIDAFULL-TIME EQUIVALENT CITY GOVERNMENT EMPLOYEES BY FUNCTION/PROGRAM
LAST TEN FISCAL YEARS (1)
150
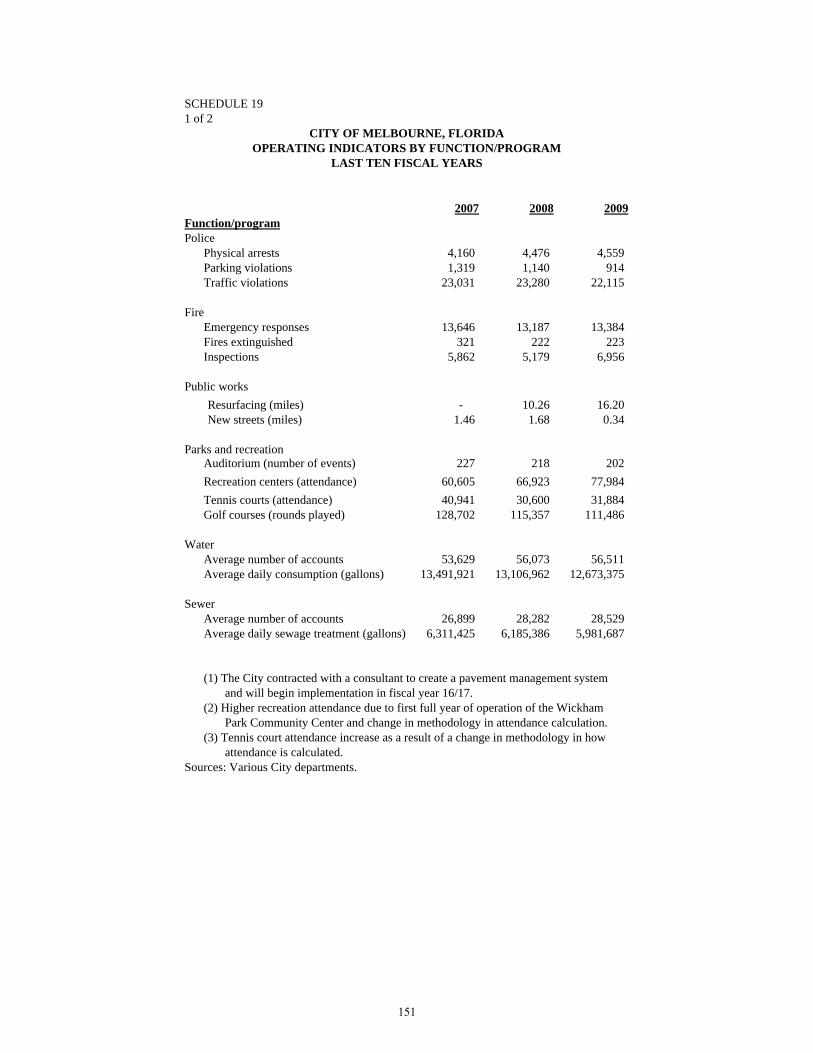
SCHEDULE 191 of 2
2007 2008 2009Function/programPolice
Physical arrests 4,160 4,476 4,559 Parking violations 1,319 1,140 914 Traffic violations 23,031 23,280 22,115
FireEmergency responses 13,646 13,187 13,384 Fires extinguished 321 222 223 Inspections 5,862 5,179 6,956
Public worksResurfacing (miles) - 10.26 16.20 New streets (miles) 1.46 1.68 0.34
Parks and recreation Auditorium (number of events) 227 218 202 Recreation centers (attendance) 60,605 66,923 77,984 Tennis courts (attendance) 40,941 30,600 31,884 Golf courses (rounds played) 128,702 115,357 111,486
WaterAverage number of accounts 53,629 56,073 56,511 Average daily consumption (gallons) 13,491,921 13,106,962 12,673,375
SewerAverage number of accounts 26,899 28,282 28,529 Average daily sewage treatment (gallons) 6,311,425 6,185,386 5,981,687
(1) The City contracted with a consultant to create a pavement management system and will begin implementation in fiscal year 16/17.(2) Higher recreation attendance due to first full year of operation of the Wickham Park Community Center and change in methodology in attendance calculation.(3) Tennis court attendance increase as a result of a change in methodology in how attendance is calculated.
Sources: Various City departments.
CITY OF MELBOURNE, FLORIDAOPERATING INDICATORS BY FUNCTION/PROGRAM
LAST TEN FISCAL YEARS
151

SCHEDULE 192 of 2
2010 2011 2012 2013 2014 2015 2016
3,854 3,158 2,948 3,101 3,315 2,895 2,938 621 436 733 692 1,099 886 581
17,041 19,412 16,847 20,061 15,861 12,193 17,870
13,775 14,263 14,932 14,986 15,650 16,787 17,394 207 244 214 245 208 210 225
6,161 6,665 5,864 5,878 5,298 3,972 5,555
2.00 14.40 - 8.10 7.22 - 3.05 (1)
- 0.49 - - - - -
200 193 184 182 162 195 199 66,412 56,971 59,483 61,208 71,089 67,717 222,066 (2)
28,059 27,194 21,414 23,337 21,694 20,858 33,152 (3)
96,477 93,717 87,720 86,302 80,151 73,833 83,617
56,711 56,819 56,934 57,162 57,487 57,766 58,108 12,759,702 13,104,756 12,842,782 12,726,206 12,802,444 12,722,993 13,063,565
28,748 28,583 28,764 28,878 29,026 29,132 29,250 5,950,497 5,971,936 5,873,126 5,833,348 5,827,564 5,854,155 6,068,169
152

SCHEDULE 20
2007 2008 2009 2010 2011 2012 2013 2014 2015 2016Function/program
PoliceStations 2 2 2 2 2 2 2 2 2 2 Patrol vehicles 112 116 125 126 135 142 150 146 142 142
Fire stations 8 (1) 8 8 8 8 8 8 8 8 8
Public worksStreets (miles) 293 295 295 295 289 (3) 289 286 286 284 291 Streetlights 7,822 8,228 8,474 8,630 8,638 8,886 8,403 8,415 8,460 8,460
Parks and recreationAcreage 555 555 555 555 555 570 (4) 570 570 570 570 Special use facilities 7 7 7 7 7 7 7 7 7 7 Community parks 11 11 11 11 11 12 (4) 12 12 12 12 Neighborhood parks 27 27 27 27 27 27 27 27 27 27
WaterMains (miles) Water transmission 148 149 149 149 149 149 149 149 149 149 Water distribution 725 729 730 730 730 730 730 730 730 730 Storage tanks Quantity 9 9 9 10 (2) 10 10 7 (5) 7 7 7 Capacity (thousands of gallons) 15,000 15,000 15,000 17,000 (2) 17,000 17,000 16,000 16,000 16,000 16,000
Sewer (miles)Gravity sewer mains 265 267 267 267 267 256 257 257 258 258 Force mains 53 53 53 53 53 53 53 53 57 57 Storm sewers 200 200 200 200 201 201 201 201 201 201 Reclaimed - Water mains 19 19 23 24 24 33 34 34 34 34
Sources: Various City departments.
(1) New station on Eber Road.
(2) New Pineda Blvd. water tank.
(3) Per City GIS survey, portions of Aurora Rd. reclassified as County maintained.
(4) Brevard County donation to City of Riverview Park.
(5) 5th Street, Oak Street and Tradewinds tanks were demolished in 2013.
LAST TEN FISCAL YEARSCAPITAL ASSET STATISTICS BY FUNCTION/PROGRAM
CITY OF MELBOURNE, FLORIDA
153
SINGLE AUDIT SECTION
The Single Audit Section contains various independent auditors’ reports and schedules as required by the Single Audit Act of 1996 for state and local governments that receive federal financial assistance and as required by Chapter 215.97, Florida Statutes for local governments that receive grants from State agencies.

INDEPENDENT AUDITORS' REPORT ON INTERNAL CONTROL OVER FINANCIAL REPORTING AND ON COMPLIANCE AND OTHER MATTERS BASED ON AN AUDIT OF FINANCIAL STATEMENTS PERFORMED IN ACCORDANCE WITH GOVERNMENT AUDITING STANDARDS
Honorable Mayor and Members of the City Council City of Melbourne, Florida
We have audited, in accordance with auditing standards generally accepted in the United States of America and the standards applicable to financial audits contained in Government Auditing Standards issued by the Comptroller General of the United States, the financial statements of the governmental activities, the business-type activities, the aggregate discretely presented component unit, each major fund, and the aggregate remaining fund information of the City of Melbourne, Florida, as of and for the year ended September 30, 2016, and the related notes to the financial statements, which collectively comprise the City of Melbourne, Florida’s basic financial statements, and have issued our report thereon dated March 3, 2017.
Internal Control Over Financial Reporting
In planning and performing our audit of the financial statements, we considered the City of Melbourne, Florida’s internal control over financial reporting (internal control) to determine the audit procedures that are appropriate in the circumstances for the purpose of expressing our opinions on the financial statements, but not for the purpose of expressing an opinion on the effectiveness of the City of Melbourne, Florida’s internal control. Accordingly, we do not express an opinion on the effectiveness of the City of Melbourne, Florida‘s internal control.
A deficiency in internal control exists when the design or operation of a control does not allow management or employees, in the normal course of performing their assigned functions, to prevent, or detect and correct misstatements on a timely basis. A material weakness is a deficiency, or a combination of deficiencies, in internal control, such that there is a reasonable possibility that a material misstatement of the entity’s financial statements will not be prevented, or detected and corrected on a timely basis. A significant deficiency is a deficiency, or a combination of deficiencies, in internal control that is less severe than a material weakness, yet important enough to merit attention by those charged with governance.
Our consideration of internal control was for the limited purpose described in the first paragraph of this section and was not designed to identify all deficiencies in internal control that might be material weaknesses or significant deficiencies. Given these limitations, during our audit we did not identify any deficiencies in internal control that we consider to be material weaknesses. However, material weaknesses may exist that have not been identified. We did identify a certain deficiency in internal control, described in the accompanying schedule of findings and questioned costs that we consider to be a significant deficiency, 2016-001.
Carr, Riggs & Ingram, LLC 215 Baytree Drive Melbourne, Florida 32940
(321) 255-0088 (321) 259-8648 (fax) www.cricpa.com
154
Honorable Mayor and Members of the City Council City of Melbourne, Florida Page Two
Compliance and Other Matters
As part of obtaining reasonable assurance about whether the City of Melbourne, Florida’s financial statements are free from material misstatement, we performed tests of its compliance with certain provisions of laws, regulations, contracts, and grant agreements, noncompliance with which could have a direct and material effect on the determination of financial statement amounts. However, providing an opinion on compliance with those provisions was not an objective of our audit, and accordingly, we do not express such an opinion. The results of our tests disclosed no instances of noncompliance or other matters that are required to be reported under Government Auditing Standards.
Purpose of this Report
The purpose of this report is solely to describe the scope of our testing of internal control and compliance and the results of that testing, and not to provide an opinion on the effectiveness of the entity’s internal control or on compliance. This report is an integral part of an audit performed in accordance with Government Auditing Standards in considering the entity’s internal control and compliance. Accordingly, this communication is not suitable for any other purpose.
Melbourne, Florida March 3, 2017
155
INDEPENDENT AUDITORS' REPORT ON COMPLIANCE FOR EACH MAJOR FEDERAL PROGRAM AND STATE PROJECT; REPORT ON INTERNAL CONTROL OVER COMPLIANCE; AND REPORT ON THE SCHEDULE OF EXPENDITURES OF FEDERAL AWARDS AND STATE FINANCIAL ASSISTANCE REQUIRED BY THE UNIFORM GUIDANCE AND CHAPTER 10.550, RULES OF THE FLORIDA AUDITOR GENERAL
Honorable Mayor and Members of the City Council City of Melbourne, Florida
Report on Compliance for Each Major Federal Program and State Project
We have audited the City of Melbourne, Florida’s compliance with the types of compliance requirements described in the OMB Compliance Supplement that could have a direct and material effect on each of the City of Melbourne, Florida’s major federal programs and state projects for the year ended September 30, 2016. The City of Melbourne, Florida’s major federal programs and state projects are identified in the summary of auditors' results section of the accompanying schedule of findings and questioned costs.
Management’s Responsibility
Management is responsible for compliance with federal and state statues, regulations, and the terms and conditions of its federal and state awards applicable to its federal programs and state projects.
Auditor’s Responsibility
Our responsibility is to express an opinion on compliance for each of the City of Melbourne, Florida’s major federal programs and state projects based on our audit of the types of compliance requirements referred to above. We conducted our audit of compliance in accordance with auditing standards generally accepted in the United States of America; the standards applicable to financial audits contained in Government Auditing Standards, issued by the Comptroller General of the United States; and the audit requirements of Title 2 U.S. Code of Federal Regulations (CFR) Part 200, Uniform Administrative Requirements, Cost Principles, and Audit Requirements for Federal Awards (Uniform Guidance), and Chapter 10.550, Rules of the Auditor General. Those standards, the Uniform Guidance and Chapter 10.550, require that we plan and perform the audit to obtain reasonable assurance about whether noncompliance with the types of compliance requirements referred to above that could have a direct and material effect on a major federal program occurred. An audit includes examining, on a test basis, evidence about the City of Melbourne, Florida’s compliance with those requirements and performing such other procedures as we considered necessary in the circumstances.
Carr, Riggs & Ingram, LLC 215 Baytree Drive Melbourne, Florida 32940
(321) 255-0088 (321) 259-8648 (fax) www.cricpa.com
156

Honorable Mayor and Members of City Council City of Melbourne, Florida Page Two
We believe that our audit provides a reasonable basis for our opinion on compliance for each major federal program and state project. However, our audit does not provide a legal determination of the City of Melbourne, Florida’s compliance.
Opinion on Each Major Federal Program and State Project
In our opinion, the City of Melbourne, Florida complied, in all material respects, with the types of compliance requirements referred to above that could have a direct and material effect on each of its major federal programs and state projects for the year ended September 30, 2016.
Other Matters
The results of our auditing procedures disclosed instances of noncompliance, which are required to be reported in accordance with the Uniform Guidance and which are described in the accompanying schedule of findings and questioned costs as item 2014-3. Our opinion on each major federal program is not modified with respect to these matters.
The City of Melbourne, Florida’s response to the noncompliance finding identified in our audit is described in the accompanying schedule of findings and questioned costs. The City of Melbourne, Florida’s response was not subjected to the auditing procedures applied in the audit of compliance and, accordingly, we express no opinion on the response.
Report on Internal Control Over Compliance
Management of the City of Melbourne, Florida is responsible for establishing and maintaining effective internal control over compliance with the types of requirements referred to above. In planning and performing our audit of compliance, we considered the City of Melbourne, Florida’s internal control over compliance with the types of requirements that could have a direct and material effect on a major federal program or state project to determine the auditing procedures that are appropriate in the circumstances for the purpose of expressing an opinion on compliance for each major federal program and state project, and to test and report on internal control over compliance in accordance with the Uniform Guidance and Chapter 10.550, Rules of the Auditor General, but not for the purpose of expressing an opinion on the effectiveness of internal control over compliance. Accordingly, we do not express an opinion on the effectiveness of the City of Melbourne, Florida’s internal control over compliance.
A deficiency in internal control over compliance exists when the design or operation of a control over compliance does not allow management or employees, in the normal course of performing their assigned functions, to prevent, or detect and correct, noncompliance with a type of compliance requirement of a federal program or state project on a timely basis. A material weakness in internal control over compliance is a deficiency, or combination of deficiencies, in internal control over compliance, such that there is a reasonable possibility that material noncompliance with a type of compliance requirement of a federal program or state project will not be prevented, or detected and corrected, on a timely basis. A significant deficiency in internal
157
Honorable Mayor and Members of City Council City of Melbourne, Florida Page Three
control over compliance is a deficiency, or a combination of deficiencies, in internal control over compliance with a type of compliance requirement of a federal program or state project that is less severe than a material weakness in internal control over compliance, yet important enough to merit attention by those charged with governance.
Our consideration of internal control over compliance was for the limited purpose described in the first paragraph of this section and was not designed to identify all deficiencies in internal control over compliance that might be material weaknesses or significant deficiencies and therefore material weaknesses or significant deficiencies may exist that were not identified. We did not identify any deficiencies in internal control over compliance that we consider to be material weaknesses. However, we identified a certain deficiency in internal control over compliance, as described in the accompanying schedule of findings and questioned costs as Item 2014-3, which we consider to be a significant deficiency.
The City of Melbourne's response to the internal control over compliance finding identified in our audit is described in the accompanying schedule of findings and questioned costs. The City of Melbourne's response was not subjected to the auditing procedures applied in the audit of compliance and, accordingly, we express no opinion on the response.
This purpose of this report on internal control over compliance is solely to describe the scope of our testing of internal control over compliance and the results of that testing based on the requirements of the Uniform Guidance and Chapter 10.550, Rules of the Auditor General. Accordingly, this report is not suitable for any other purpose.
Melbourne, Florida March 3, 2017
158

Federal/State Agency, CFDA Contract/
Pass-through Entity, CSFA Grant Transfers to
Federal Program/State Project No. No. Expenditures Subrecipients
Federal Programs:
U.S. DEPARTMENT OF JUSTICE
2014 Edward Byrne Memorial JAG-VSAT Communications and Surveillance Project 16.738 2014-DJ-BX-0389 42,500$
2015 Edward Byrne Memorial JAG-Melbourne 2015 JAG Grant 16.738 2015-DJ-BX-0494 38,933
81,433
Pass through Office of the Attorney General:
Victims of Crime Act (VOCA) 16.575 V138-14026 37,224
Total U.S Department of Justice 118,657
U.S. DEPARTMENT OF HOUSING
& URBAN DEVELOPMENT
Community Development Block Grant 2013 14.218 B-13-MC-12-0012 26,308
Community Development Block Grant 2014 14.218 B-14-MC-12-0012 175,434
Community Development Block Grant 2015 14.218 B-15-MC-12-0012 302,868 66,966$
Neighborhood Stabilization Program 3 14.218 B-11-MN-12-0033 191,688
Total Community Development Block Grant 696,298 66,966
U.S. DEPARTMENT OF HOUSING
& URBAN DEVELOPMENT
Pass through FL Dept of Economic Opportunity
Neighborhood Stabilization Program 1 14.228 10DB-4X-06-15-02-F 15 8,928
Pass through Brevard County:
Home Investment Partnerships Program 2010 14.239 M-10-DC-12-00200 4,148
Home Investment Partnerships Program 2011 14.239 M-11-DC-12-00200 66,383
Home Investment Partnerships Program 2012 14.239 M-12-DC-12-00200 5,344
Home Investment Partnerships Program 2015 14.239 M-15-DC-12-00200 49,379
Total Pass through Brevard County 125,254
Total U.S Department of Housing & Urban Development 830,480
U.S ENVIRONMENTAL PROTECTION ACT
Pass through Florida Department of Environmental Protection:
State Revolving Fund Loan 66.458 WW050900 5,846,641
U.S. DEPARTMENT OF TRANSPORTATION
Pass through Florida Department of Transportation
Highway Planning and Construction-Safe Route to School (Sherwood Elementary) 20.205 G0671 246,976
Highway Planning and Construction-Hickory Street Complete Street 20.205 G0035 389,124
Total Pass through Florida Department of Transportation 636,100
U.S. DEPARTMENT OF TRANSPORTATION
Federal Aviation Administration
Airport Improvement Grant 20.106 3-12-0046-38-2012 203,065
Airport Improvement Grant - Construct Cargo Apron and TW Improvement 20.106 3-12-0046-39-2013 (4,035)
Airport Improvement Grant - Master Plan Audit 20.106 3-12-0046-40-2014 290,057
Airport Improvement Grant - Widen TW Phase 3 Construction 20.106 3-12-0046-42-2015 1,126,723
1,615,810
Total U.S. Department of Transportation 2,251,910
TRANSPORTATION SECURITY ADMINISTRATION
LEO Support Co-op Agreement 97.090 HSTS0213HSLR037 39,610
TOTAL EXPENDITURES OF FEDERAL AWARDS 9,087,298$ 66,966$
CITY OF MELBOURNE
SCHEDULE OF EXPENDITURES OF FEDERAL AWARDS
AND STATE OF FLORIDA FINANCIAL ASSISTANCE
FOR THE FISCAL YEAR ENDED SEPTEMBER 30, 2016
159

Federal/State Agency, CFDA Contract/Pass-through Entity, CSFA Grant TransfersFederal Program/State Project No. No. Expenditures to Subrecipients
State Programs:
FLORIDA HOUSING FINANCE CORPORATION State Housing Initiatives Partnership 12/13 52.901 (136)$ State Housing Initiatives Partnership 13/14 52.901 748 State Housing Initiatives Partnership 14/15 52.901 209,685 State Housing Initiatives Partnership 15/16 40.901 20,020 State Housing Initiatives Partnership 16/17 40.901 26,599 Total Florida Housing Finance Corporation 256,916
FLORIDA DEPARTMENT OF ENVIRONMENTAL PROTECTIONWater Restoration Assistance - Horse Creek Dredging 37.039 S0843 458,166 Water Restoration Assistance - South Croton Stormwater Drainage Improvements 37.039 LP05092 14,553 FL Recreation Development Assistance Program - Wells Park Playground 37.017 A6081 50,000
522,719
FLORIDA DEPARTMENT OF ECONOMIC OPPORTUNITYSpace Florida Escrow Agreement 40.008 8,000,000
Joint Participation Agreements withFlorida Department of TransportationConduct Noise Compatibility Study 55.004 432339/AQP06 6,651 Construct Aviation Facilities-(Summit) 55.004 409782/ARF76 28,638,108 Construct Aircraft Hangar 55.004 431572/AR155 1,161,052 Construct Air Traffic Control Tower 55.004 437014/G0383 249,100 Widen Taxi K-Construction 55.004 431567/ARO04 62,353 Fuel Facility Improvements 55.004 431568/G0077 17,450 Rehabilitation of Runway 9L-27R and Taxiway "B" Cargo Apron 55.004 431565/G0078 12,450 Update Master Plan 55.004 431569/ARO03 26,268 Northside Access Road 55.032 432508/ARL50 1,293,589 Reclocate Grumman Lane 55.032 435824/ARF87 29,671 Total FDOT Joint Participation Agreement 31,496,692
Total Florida Department of Transportation 31,496,692
TOTAL EXPENDITURES OF STATE FINANCIAL ASSISTANCE 40,276,327$ -$
NOTES TO SCHEDULE OF EXPENDITURES OF FEDERAL AWARDS AND STATE OF FLORIDA FINANCIAL ASSISTANCE
NOTE AThe Schedule of Expenditures of Federal Awards and State of Florida Financial Assistance is a summary of the activity of the City's Federal and State award programs presented on the accrual basis of accounting in accordance with generally accepted accounting principles.
NOTE BThe Uniform Guidance allows a City to elect a 10% de minimus indirect cost rate. For the year ended September 30, 2016, the City electednot to use the rate.
NOTE CReconciliation of the State Revolving Loan:
5,846,641$ Draws on loan WW05090075,181 Capitalized interest on loan WW050900
4,732,215 Additional State Revolving loan closed out and being repaid.10,654,037$ Total State Revolving Loan payable
160
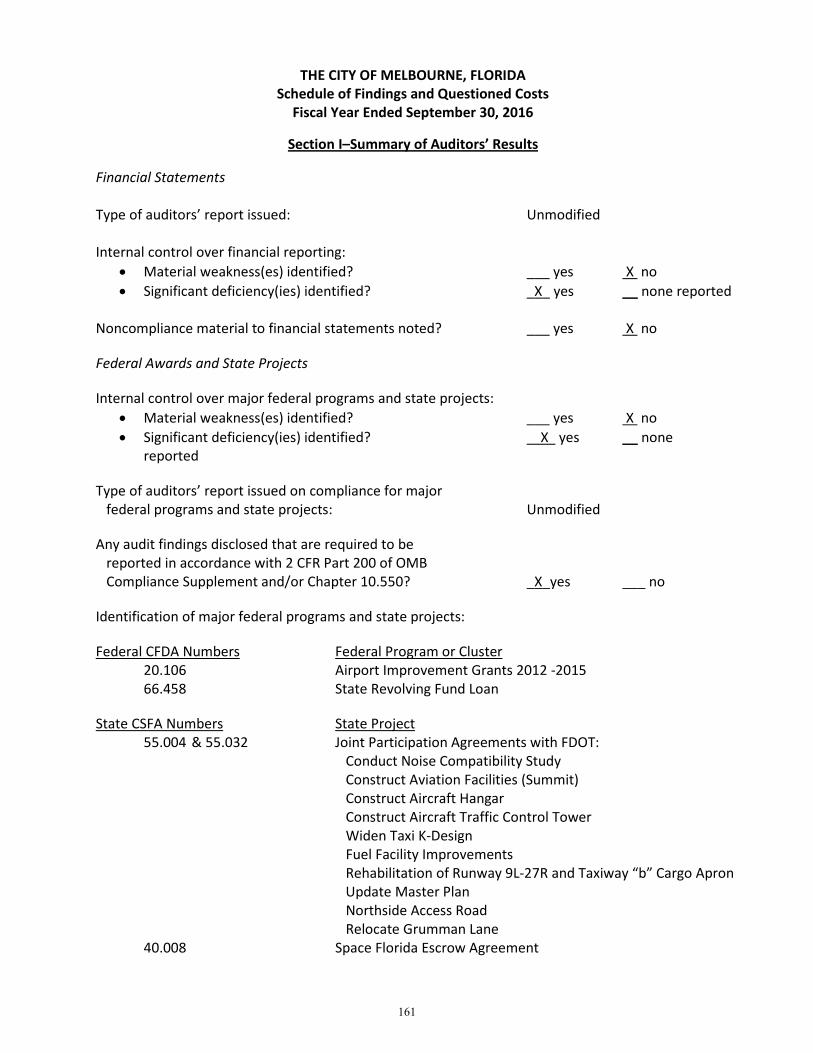
THE CITY OF MELBOURNE, FLORIDA Schedule of Findings and Questioned Costs
Fiscal Year Ended September 30, 2016
Section I–Summary of Auditors’ Results
Financial Statements
Type of auditors’ report issued: Unmodified
Internal control over financial reporting: • Material weakness(es) identified? ___ yes X no • Significant deficiency(ies) identified? _X_ yes __ none reported
Noncompliance material to financial statements noted? ___ yes X no
Federal Awards and State Projects
Internal control over major federal programs and state projects: • Material weakness(es) identified? ___ yes X no • Significant deficiency(ies) identified? X yes __ none
reported
Type of auditors’ report issued on compliance for major federal programs and state projects: Unmodified
Any audit findings disclosed that are required to be reported in accordance with 2 CFR Part 200 of OMB Compliance Supplement and/or Chapter 10.550? _X_yes ___ no
Identification of major federal programs and state projects:
Federal CFDA Numbers Federal Program or Cluster 20.106 Airport Improvement Grants 2012 -2015 66.458 State Revolving Fund Loan
State CSFA Numbers State Project 55.004 & 55.032 Joint Participation Agreements with FDOT:
Conduct Noise Compatibility Study Construct Aviation Facilities (Summit) Construct Aircraft Hangar Construct Aircraft Traffic Control Tower Widen Taxi K-Design Fuel Facility Improvements Rehabilitation of Runway 9L-27R and Taxiway “b” Cargo Apron Update Master Plan Northside Access Road Relocate Grumman Lane
40.008 Space Florida Escrow Agreement
161

THE CITY OF MELBOURNE, FLORIDA Schedule of Findings and Questioned Costs (Continued)
Fiscal Year Ended September 30, 2016
Section I–Summary of Auditors’ Results (Continued)
Dollar threshold used to distinguish between type A and B programs was $750,000 for major federal programs and $300,000 for major state projects.
Auditee qualified as a low-risk auditee for federal purposes? X yes __ no
Section II–Financial Statement Findings
2016-1 Accounts Payable – Significant Deficiency
CONDITION: An adjusting journal entry was required for fiscal year 2016 to record accounts payable for services or goods incurred or received prior to the balance sheet date.
CRITERIA: Section 1500: Reporting Liabilities of the Governmental Accounting Standards Board Codification of Governmental Accounting and Financial Reporting Standards requires a government to accrue a liability and expense in the period in which the government incurs the liability. Accounts payable should be recorded for all invoices for goods and services received on or before the balance sheet date.
POTENTIAL EFFECT OF CONDITION: During the audit, journal entries totaling $535,381 were required to provide for proper accrual of the component unit’s accounts payable at September 30, 2016. Accounts payable and accrued liabilities were understated prior to the audit adjustment in the Component Unit’s trial balance.
CAUSE OF THE CONDITION: Invoices received subsequent to the balance sheet date were not accrued in the proper accounting period for the year ended September 30, 2016.
RECOMMENDATION: We recommend that the Component Unit implement procedures to provide reasonable assurance that all amounts due to vendors are properly accrued in the correct accounting period.
MANAGEMENT’S RESPONSE: The Airport Administration agrees with this finding and will establish a log for all invoices. All Airport invoices come to the Airport accounting department to be logged, prior to sending out for department approval. When returned to the Airport accounting department the invoices will be checked off the log and processed for payment. The Airport Financial Services Manager will be responsible to locate any invoices not returned. At year end, the Airport Financial Services Manager will be responsible to review all invoices received after year end to ensure they are recorded in the proper year. Once assured that all invoices are properly recorded, the Airport Senior Director of Finance and Administration will review and transmit the SEFA to the Finance department.
162
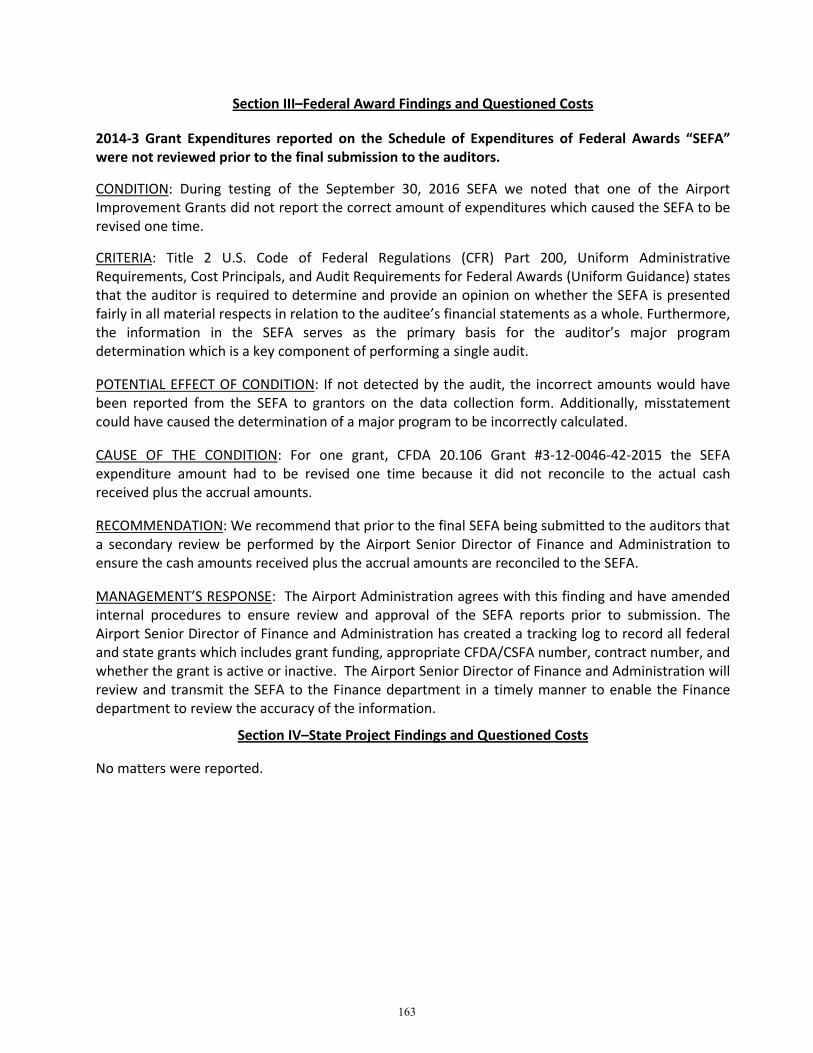
Section III–Federal Award Findings and Questioned Costs
2014-3 Grant Expenditures reported on the Schedule of Expenditures of Federal Awards “SEFA” were not reviewed prior to the final submission to the auditors.
CONDITION: During testing of the September 30, 2016 SEFA we noted that one of the Airport Improvement Grants did not report the correct amount of expenditures which caused the SEFA to be revised one time.
CRITERIA: Title 2 U.S. Code of Federal Regulations (CFR) Part 200, Uniform Administrative Requirements, Cost Principals, and Audit Requirements for Federal Awards (Uniform Guidance) states that the auditor is required to determine and provide an opinion on whether the SEFA is presented fairly in all material respects in relation to the auditee’s financial statements as a whole. Furthermore, the information in the SEFA serves as the primary basis for the auditor’s major program determination which is a key component of performing a single audit.
POTENTIAL EFFECT OF CONDITION: If not detected by the audit, the incorrect amounts would have been reported from the SEFA to grantors on the data collection form. Additionally, misstatement could have caused the determination of a major program to be incorrectly calculated.
CAUSE OF THE CONDITION: For one grant, CFDA 20.106 Grant #3-12-0046-42-2015 the SEFA expenditure amount had to be revised one time because it did not reconcile to the actual cash received plus the accrual amounts.
RECOMMENDATION: We recommend that prior to the final SEFA being submitted to the auditors that a secondary review be performed by the Airport Senior Director of Finance and Administration to ensure the cash amounts received plus the accrual amounts are reconciled to the SEFA.
MANAGEMENT’S RESPONSE: The Airport Administration agrees with this finding and have amended internal procedures to ensure review and approval of the SEFA reports prior to submission. The Airport Senior Director of Finance and Administration has created a tracking log to record all federal and state grants which includes grant funding, appropriate CFDA/CSFA number, contract number, and whether the grant is active or inactive. The Airport Senior Director of Finance and Administration will review and transmit the SEFA to the Finance department in a timely manner to enable the Finance department to review the accuracy of the information.
Section IV–State Project Findings and Questioned Costs
No matters were reported.
163

THE CITY OF MELBOURNE, FLORIDA Summary of Prior Audit Findings
Fiscal Year Ended September 30, 2016
Section V–Prior Findings and Questioned Costs for Federal Awards
2014-3 Grant Expenditures reported on the Schedule of Expenditures of Federal Awards “SEFA” were not reviewed prior to the final submission to the auditors. Status: Repeated
164


CORRECTIVE ACTION PLAN March 3, 2017
The City of Melbourne, Florida respectfully submits the following corrective action plan for the year ended September 30, 2016.
Name and address of independent public accounting firm: Carr, Riggs & Ingram, LLC 215 Baytree Drive Melbourne, Florida 32940
Audit Period: Fiscal Year October 1, 2015 – September 30, 2016
The finding from the March 3, 2017 schedule of findings and questioned costs are discussed below. The finding is numbered consistently with the number assigned in the schedule.
2014-3 Grant Expenditures reported on the Schedule of Expenditures of Federal Awards “SEFA” were not reviewed prior to the final submission to the auditors.
RECOMMENDATION: We recommend that prior to the final SEFA being submitted to the auditors that a secondary review be performed by the Airport Senior Director of Finance and Administration to ensure the cash amounts received plus accruals are reconciled to the SEFA.
CORRECTIVE ACTION: The Airport Administration agrees with this finding and have amended internal procedures to ensure review and approval of the SEFA reports prior to submission. The Airport Senior Director of Finance and Administration has created a tracking log to record all federal and state grants which includes grant funding, appropriate CFDA/CSFA number, contract number, and whether the grant is active or inactive. The Airport Senior Director of Finance and Administration will review and transmit the SEFA to the Finance department in a timely manner to enable the Finance department to review the accuracy of the information.
2016-1 Accounts Payable – Significant Deficiency
RECOMMENDATION: We recommend that the Component Unit implement procedures to provide reasonable assurance that all amounts due to vendors are properly accrued in the correct accounting period.
165

CORRECTIVE ACTION: The Airport Administration agrees with this finding and will establish a log for all invoices. All Airport invoices come to the Airport accounting department to be logged, prior to sending out for department approval. When returned to the Airport accounting department the invoices will be checked off the log and processed for payment. The Airport Financial Services Manager will be responsible to locate any invoices not returned. At year end, the Airport Financial Services Manager will be responsible to review all invoices received after year end to ensure they are recorded in the proper year. Once assured that all invoices are properly recorded, the Airport Senior Director of Finance and Administration will review and transmit the SEFA to the Finance department.
166

Carr, Riggs & Ingram, LLC 215 Baytree Drive Melbourne, Florida 32940
(321) 255-0088 (321) 259-8648 (fax) www.cricpa.com
INDEPENDENT AUDITORS’ MANAGEMENT LETTER
To the Honorable Mayor and Members of City Council City of Melbourne, Florida
Report on the Financial Statements
We have audited the financial statements of the City of Melbourne, Florida, as of and for the fiscal year ended September 30, 2016, and have issued our report thereon dated March 3, 2017.
Auditors’ Responsibility
We conducted our audit in accordance with auditing standards generally accepted in the United States of America; the standards applicable to financial audits contained in Government Auditing Standards, issued by the Comptroller General of the United States, the audit requirements of Title 2 Code of Federal Regulations Part 200, Uniform Administrative Requirements, Cost Principles, and Audit Requirements of Federal Awards (Uniform Guidance); and Chapter 10.550 Rules of the Florida Auditor General.
Other Reports and Schedule
We have issued our Independent Auditors’ Report on Internal Control over Financial Reporting and on Compliance and Other Matters Based on an Audit of the Financial Statements Performed in Accordance with Government Auditing Standards, Independent Auditors’ Report on Compliance for Each Major Federal Program and State Project; Report on Internal Control over Compliance; Schedule of Findings and Questioned Costs; and Independent Accountants' Report on an examination conducted in accordance with AICPA Professional Standards, Section 601, regarding compliance requirements in accordance with Chapter 10.550, Rules of the Auditor General. Disclosures in those reports and schedule, which are dated March 3, 2017, should be considered in conjunction with this management letter.
Prior Audit Findings
Section 10.554(1)(i)1., Rules of the Auditor General, requires that we determine whether or not corrective actions have been taken to address findings and recommendations made in the preceding annual financial audit report. Corrective action not has been taken to fully address the finding and recommendation made in the preceding annual financial audit report, as noted below:
Findings and Questioned Costs Comments 2014-3 Schedule of Expenditure of Federal Awards (“SEFA”) Repeated and revised
167
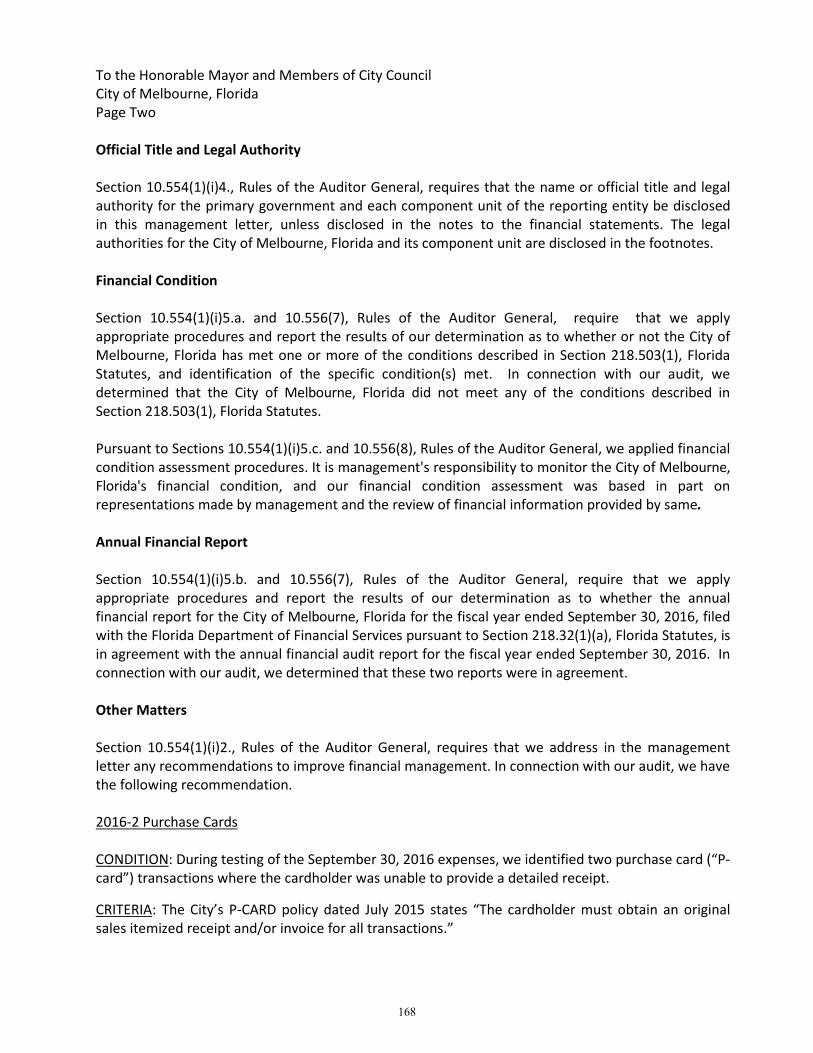
To the Honorable Mayor and Members of City Council City of Melbourne, Florida Page Two
Official Title and Legal Authority
Section 10.554(1)(i)4., Rules of the Auditor General, requires that the name or official title and legal authority for the primary government and each component unit of the reporting entity be disclosed in this management letter, unless disclosed in the notes to the financial statements. The legal authorities for the City of Melbourne, Florida and its component unit are disclosed in the footnotes.
Financial Condition
Section 10.554(1)(i)5.a. and 10.556(7), Rules of the Auditor General, require that we apply appropriate procedures and report the results of our determination as to whether or not the City of Melbourne, Florida has met one or more of the conditions described in Section 218.503(1), Florida Statutes, and identification of the specific condition(s) met. In connection with our audit, we determined that the City of Melbourne, Florida did not meet any of the conditions described in Section 218.503(1), Florida Statutes.
Pursuant to Sections 10.554(1)(i)5.c. and 10.556(8), Rules of the Auditor General, we applied financial condition assessment procedures. It is management's responsibility to monitor the City of Melbourne, Florida's financial condition, and our financial condition assessment was based in part on representations made by management and the review of financial information provided by same.
Annual Financial Report
Section 10.554(1)(i)5.b. and 10.556(7), Rules of the Auditor General, require that we apply appropriate procedures and report the results of our determination as to whether the annual financial report for the City of Melbourne, Florida for the fiscal year ended September 30, 2016, filed with the Florida Department of Financial Services pursuant to Section 218.32(1)(a), Florida Statutes, is in agreement with the annual financial audit report for the fiscal year ended September 30, 2016. In connection with our audit, we determined that these two reports were in agreement.
Other Matters
Section 10.554(1)(i)2., Rules of the Auditor General, requires that we address in the management letter any recommendations to improve financial management. In connection with our audit, we have the following recommendation.
2016-2 Purchase Cards
CONDITION: During testing of the September 30, 2016 expenses, we identified two purchase card (“P-card”) transactions where the cardholder was unable to provide a detailed receipt.
CRITERIA: The City’s P-CARD policy dated July 2015 states “The cardholder must obtain an original sales itemized receipt and/or invoice for all transactions.”
168
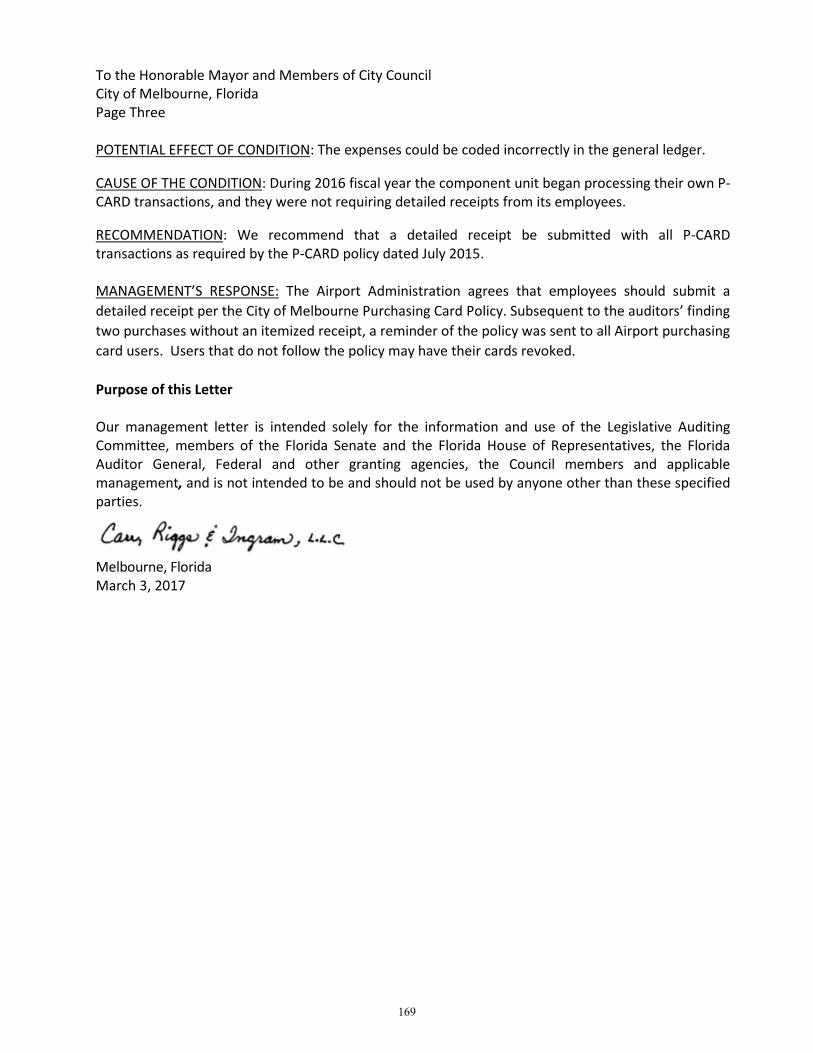
To the Honorable Mayor and Members of City Council City of Melbourne, Florida Page Three
POTENTIAL EFFECT OF CONDITION: The expenses could be coded incorrectly in the general ledger.
CAUSE OF THE CONDITION: During 2016 fiscal year the component unit began processing their own P-CARD transactions, and they were not requiring detailed receipts from its employees.
RECOMMENDATION: We recommend that a detailed receipt be submitted with all P-CARD transactions as required by the P-CARD policy dated July 2015.
MANAGEMENT’S RESPONSE: The Airport Administration agrees that employees should submit a detailed receipt per the City of Melbourne Purchasing Card Policy. Subsequent to the auditors’ finding two purchases without an itemized receipt, a reminder of the policy was sent to all Airport purchasing card users. Users that do not follow the policy may have their cards revoked.
Purpose of this Letter
Our management letter is intended solely for the information and use of the Legislative Auditing Committee, members of the Florida Senate and the Florida House of Representatives, the Florida Auditor General, Federal and other granting agencies, the Council members and applicable management, and is not intended to be and should not be used by anyone other than these specified parties.
Melbourne, Florida March 3, 2017
169

Carr, Riggs & Ingram, LLC 215 Baytree Drive Melbourne, Florida 32940
(321) 255-0088 (321) 259-8648 (fax) www.cricpa.com
INDEPENDENT ACCOUNTANTS’ REPORT ON COMPLIANCE WTH LOCAL GOVERNMENT INVESTMENT POLICIES
To the Honorable Mayor and Members of City Council City of Melbourne, Florida
We have examined the City of Melbourne, Florida’s (the “City”) compliance with the requirements of Section 218.415, Florida Statutes, Local Government Investment Policies, during the year ended September 30, 2016. Management is responsible for the City’s compliance with those requirements. Our responsibility is to express an opinion on the City’s compliance based on our examination.
Our examination was conducted in accordance with attestation standards established by the American Institute of Certified Public Accountants and, accordingly, included examining, on a test basis, evidence about the City’s compliance with those requirements and performing such other procedures as we considered necessary in the circumstances. We believe that our examination provides a reasonable basis for our opinion. Our examination does not provide a legal determination on the City’s compliance with specified requirements.
In our opinion, the City complied, in all material respects, with the aforementioned requirements for the year ended September 30, 2016.
This report is intended solely for the information and use of management and the State of Florida Auditor General and is not intended to be and should not be used by anyone other than these specified parties.
Melbourne, Florida March 3, 2017
170

171

SECONDARY MARKET DISCLOSURE SECTION
Rule 15c2-12 promulgated by the Securities and Exchange Commission requires certain ongoing disclosure of annual financial information and operating data for bonds sold on or after July 3, 1995. This section includes disclosures not found elsewhere in this Report for the following bonds:
• Water and Sewer Refunding Revenue Bonds, Series 2002B
• Water and Sewer Improvement Revenue Bonds, Series 2007B
• Water and Sewer Refunding and Improvement RevenueBonds, Series 2012
• Water and Sewer Refunding Revenue Bonds, Series 2013
• Water and Sewer Refunding Revenue Bonds, Series 2014
• Water and Sewer Refunding Revenue Bonds, Series 2016A
• Water and Sewer Refunding Revenue Bonds, Series 2016B

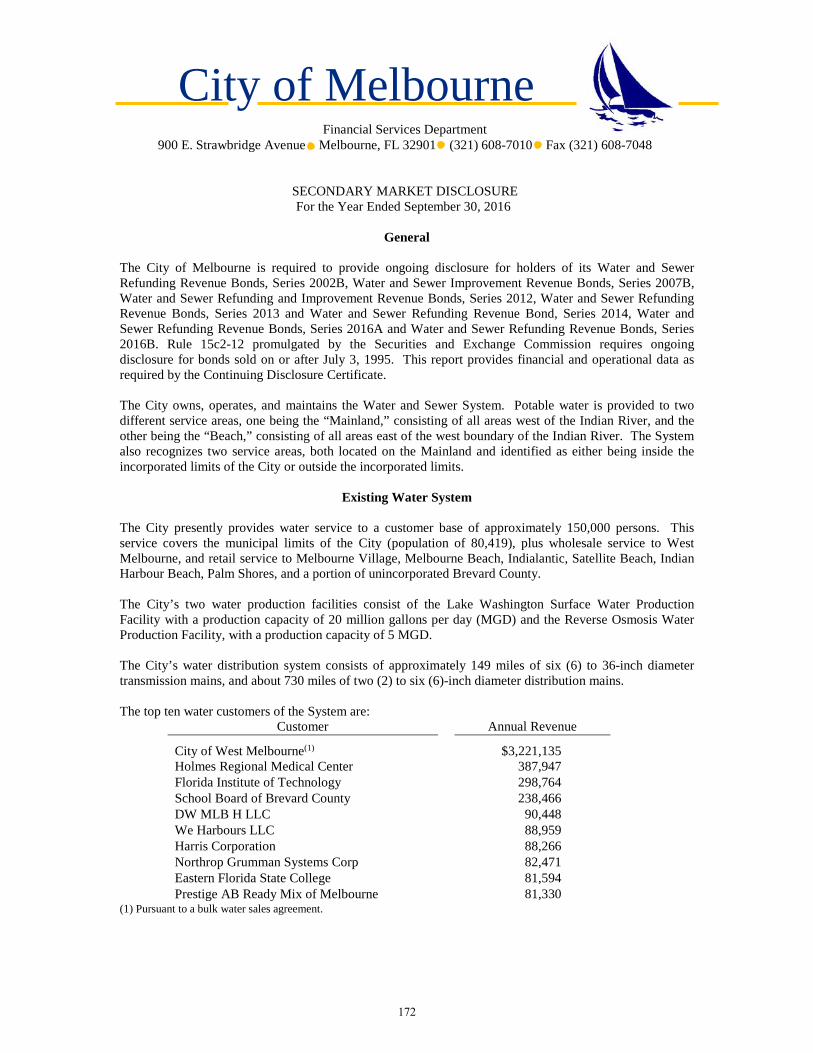
City of Melbourne Financial Services Department
900 E. Strawbridge Avenue Melbourne, FL 32901 (321) 608-7010 Fax (321) 608-7048
SECONDARY MARKET DISCLOSURE For the Year Ended September 30, 2016
General
The City of Melbourne is required to provide ongoing disclosure for holders of its Water and Sewer Refunding Revenue Bonds, Series 2002B, Water and Sewer Improvement Revenue Bonds, Series 2007B, Water and Sewer Refunding and Improvement Revenue Bonds, Series 2012, Water and Sewer Refunding Revenue Bonds, Series 2013 and Water and Sewer Refunding Revenue Bond, Series 2014, Water and Sewer Refunding Revenue Bonds, Series 2016A and Water and Sewer Refunding Revenue Bonds, Series 2016B. Rule 15c2-12 promulgated by the Securities and Exchange Commission requires ongoing disclosure for bonds sold on or after July 3, 1995. This report provides financial and operational data as required by the Continuing Disclosure Certificate.
The City owns, operates, and maintains the Water and Sewer System. Potable water is provided to two different service areas, one being the “Mainland,” consisting of all areas west of the Indian River, and the other being the “Beach,” consisting of all areas east of the west boundary of the Indian River. The System also recognizes two service areas, both located on the Mainland and identified as either being inside the incorporated limits of the City or outside the incorporated limits.
Existing Water System
The City presently provides water service to a customer base of approximately 150,000 persons. This service covers the municipal limits of the City (population of 80,419), plus wholesale service to West Melbourne, and retail service to Melbourne Village, Melbourne Beach, Indialantic, Satellite Beach, Indian Harbour Beach, Palm Shores, and a portion of unincorporated Brevard County.
The City’s two water production facilities consist of the Lake Washington Surface Water Production Facility with a production capacity of 20 million gallons per day (MGD) and the Reverse Osmosis Water Production Facility, with a production capacity of 5 MGD.
The City’s water distribution system consists of approximately 149 miles of six (6) to 36-inch diameter transmission mains, and about 730 miles of two (2) to six (6)-inch diameter distribution mains.
The top ten water customers of the System are: Customer Annual Revenue
City of West Melbourne(1) $3,221,135 Holmes Regional Medical Center 387,947 Florida Institute of Technology 298,764 School Board of Brevard County 238,466 DW MLB H LLC 90,448 We Harbours LLC 88,959 Harris Corporation 88,266 Northrop Grumman Systems Corp 82,471 Eastern Florida State College 81,594 Prestige AB Ready Mix of Melbourne 81,330
(1) Pursuant to a bulk water sales agreement.
172
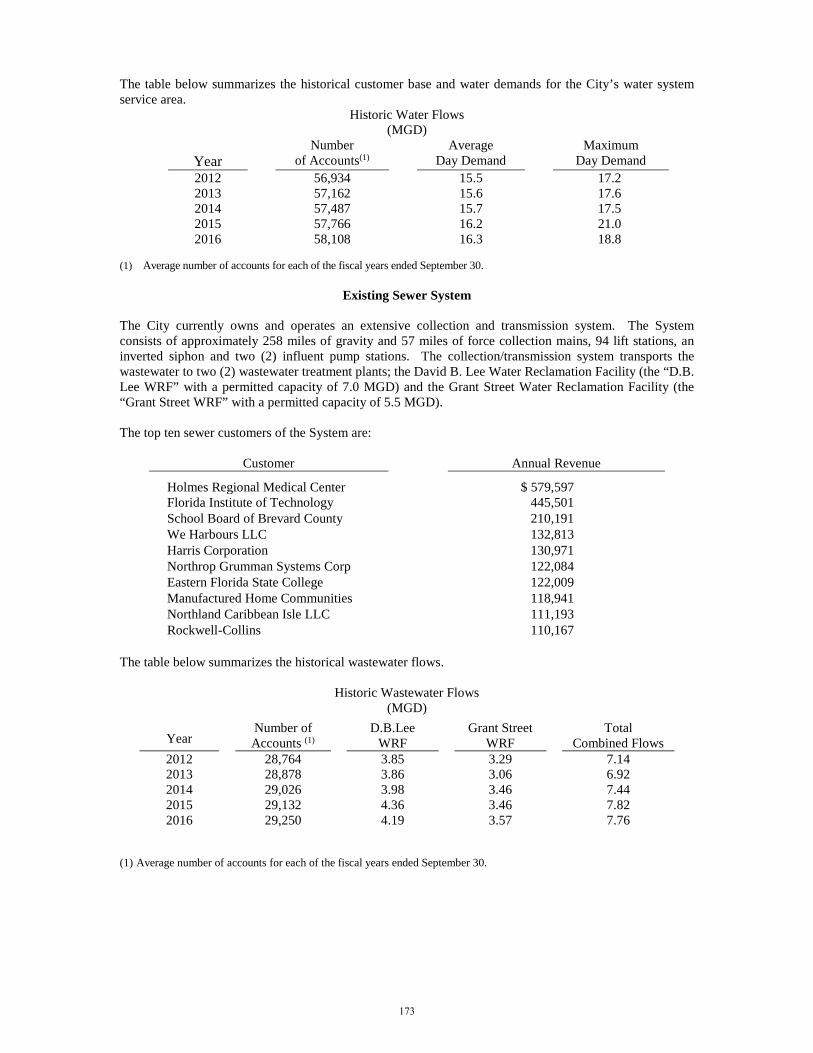
The table below summarizes the historical customer base and water demands for the City’s water system service area.
Historic Water Flows (MGD)
Year Number
of Accounts(1) Average
Day Demand Maximum
Day Demand 2012 56,934 15.5 17.2 2013 57,162 15.6 17.6 2014 57,487 15.7 17.5 2015 57,766 16.2 21.0 2016 58,108 16.3 18.8
(1) Average number of accounts for each of the fiscal years ended September 30.
Existing Sewer System
The City currently owns and operates an extensive collection and transmission system. The System consists of approximately 258 miles of gravity and 57 miles of force collection mains, 94 lift stations, an inverted siphon and two (2) influent pump stations. The collection/transmission system transports the wastewater to two (2) wastewater treatment plants; the David B. Lee Water Reclamation Facility (the “D.B. Lee WRF” with a permitted capacity of 7.0 MGD) and the Grant Street Water Reclamation Facility (the “Grant Street WRF” with a permitted capacity of 5.5 MGD).
The top ten sewer customers of the System are:
Customer Annual Revenue
Holmes Regional Medical Center $ 579,597 Florida Institute of Technology 445,501 School Board of Brevard County 210,191 We Harbours LLC 132,813 Harris Corporation 130,971 Northrop Grumman Systems Corp 122,084 Eastern Florida State College 122,009 Manufactured Home Communities 118,941 Northland Caribbean Isle LLC 111,193 Rockwell-Collins 110,167
The table below summarizes the historical wastewater flows.
Historic Wastewater Flows (MGD)
Year Number of Accounts (1)
D.B.Lee WRF
Grant Street WRF
Total Combined Flows
2012 28,764 3.85 3.29 7.14 2013 28,878 3.86 3.06 6.92 2014 29,026 3.98 3.46 7.44 2015 29,132 4.36 3.46 7.82 2016 29,250 4.19 3.57 7.76
(1) Average number of accounts for each of the fiscal years ended September 30.
173

Existing Reclaimed Water System
The City currently owns and operates a reclaimed water production and distribution system. The System consists of two reclaimed water production facilities, and approximately 34 miles of various sized reclaimed water distribution mains. In regards to reclaimed water production, the David B. Lee Water Reclamation Facility (the “D.B. Lee WRF”) has a production capacity of 4.0 MGD, while the Grant Street Water Reclamation Facility (the “Grant Street WRF”) has a production capacity of 2.0 MGD. The public access approved reclaimed water is applied via spray irrigation to City golf courses, City parks, commercial green space, medians/rights-of-way and residential areas. As of September 30, 2016, there were 682 accounts in the reclaimed water system, of which 470 were residential.
The table below summarizes the historical reclaimed water flows.
Historic Reclaimed Water Flows (MGD)
Year Number of Accounts (1)
D.B.Lee WRF
Grant Street WRF
Total Combined Flows
2012 641 1.29 0.92 2.21 2013 645 1.61 0.58 2.19 2014 648 1.76 0.52 2.28 2015 651 1.74 0.44 2.18 2016 682 1.69 0.44 2.13
(1) Average number of accounts for each of the fiscal years ended September 30.
Water Rates
The rate charged for potable water service to each customer shall consist of a monthly service charge based on the number of equivalent residential connections (ERCs) determined by the city periodically for the premise which shall serve as the minimum bill, and a gallonage charge for each unit of one thousand (1,000) gallons or portion therof. Such charges are due and payable on a monthly basis. The rates are charged based on the customer’s location. Customers located within the city limits of the City are charged the inside City rate. Customers located outside the city limits of the City are charged the outside City rate.
Rate per ERC – All Customers
Effective Date Inside City Outside City
October 1, 2015 $ 8.00 $ 8.80 October 1, 2016 8.00 8.80 October 1, 2017 8.44 9.28
In addition to the above established service charge, each customer pays a monthly gallonage charge per unit for each one thousand (1,000) gallons, or portion thereof, of water passed through the customer’s service meter in accordance with the schedule set forth below:
Effective Date Inside City Outside City
October 1, 2015 $ 4.57 $ 5.02 October 1, 2016 4.57 5.02 October 1, 2017 4.82 5.30
174
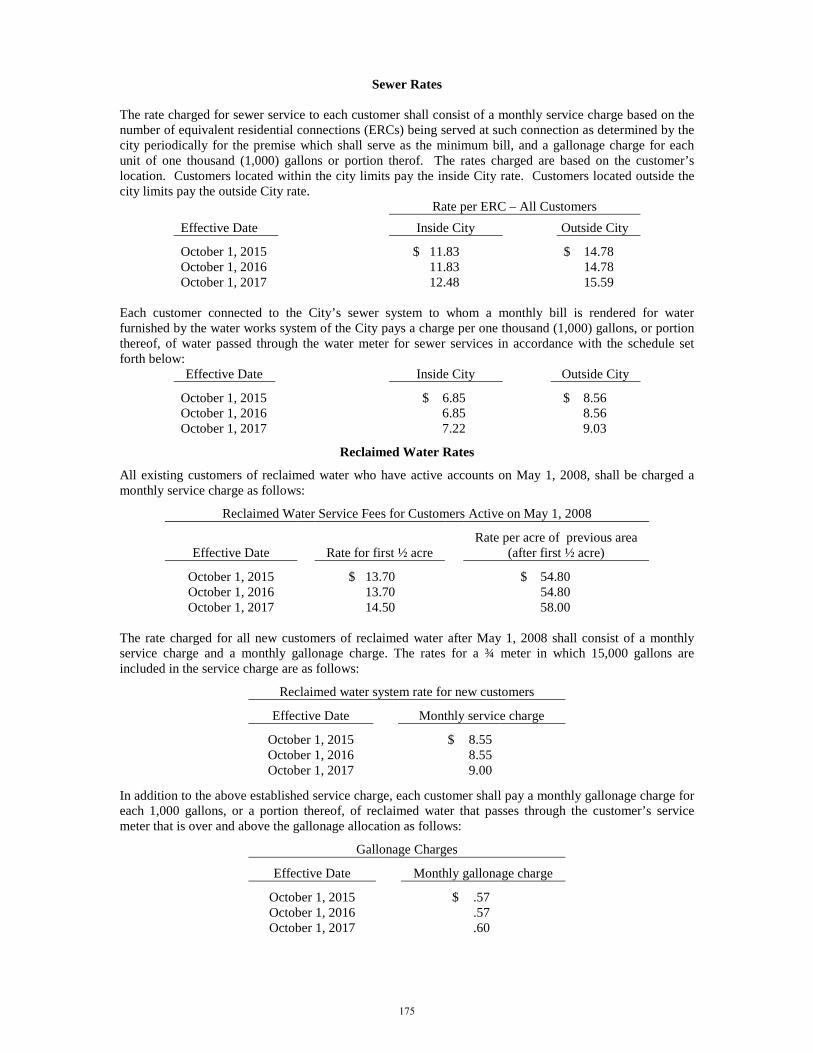
Sewer Rates
The rate charged for sewer service to each customer shall consist of a monthly service charge based on the number of equivalent residential connections (ERCs) being served at such connection as determined by the city periodically for the premise which shall serve as the minimum bill, and a gallonage charge for each unit of one thousand (1,000) gallons or portion therof. The rates charged are based on the customer’s location. Customers located within the city limits pay the inside City rate. Customers located outside the city limits pay the outside City rate.
Rate per ERC – All Customers Effective Date Inside City Outside City
October 1, 2015 $ 11.83 $ 14.78 October 1, 2016 11.83 14.78 October 1, 2017 12.48 15.59
Each customer connected to the City’s sewer system to whom a monthly bill is rendered for water furnished by the water works system of the City pays a charge per one thousand (1,000) gallons, or portion thereof, of water passed through the water meter for sewer services in accordance with the schedule set forth below:
Effective Date Inside City Outside City
October 1, 2015 $ 6.85 $ 8.56 October 1, 2016 6.85 8.56 October 1, 2017 7.22 9.03
Reclaimed Water Rates
All existing customers of reclaimed water who have active accounts on May 1, 2008, shall be charged a monthly service charge as follows:
Reclaimed Water Service Fees for Customers Active on May 1, 2008
Rate per acre of previous area Effective Date Rate for first ½ acre (after first ½ acre)
October 1, 2015 $ 13.70 $ 54.80 October 1, 2016 13.70 54.80 October 1, 2017 14.50 58.00
The rate charged for all new customers of reclaimed water after May 1, 2008 shall consist of a monthly service charge and a monthly gallonage charge. The rates for a ¾ meter in which 15,000 gallons are included in the service charge are as follows:
Reclaimed water system rate for new customers
Effective Date Monthly service charge
October 1, 2015 $ 8.55 October 1, 2016 8.55 October 1, 2017 9.00
In addition to the above established service charge, each customer shall pay a monthly gallonage charge for each 1,000 gallons, or a portion thereof, of reclaimed water that passes through the customer’s service meter that is over and above the gallonage allocation as follows:
Gallonage Charges
Effective Date Monthly gallonage charge
October 1, 2015 $ .57 October 1, 2016 .57 October 1, 2017 .60
175
Each customer requesting reclaimed water service from the City shall, prior to the installation of a flow meter for each connection to the reclaimed water main, pay the following amounts to defray the cost of the service provided:
Meter Size (Inches)
Reclaimed Water Connection Charge
¾ $ 250 1 475
1-1/2 850 2 1,600
Over 2 inches To be determined by the City on an individual basis
The full amount of the connection charge provided above must be paid prior to connection of each unit to the City’s reclaimed water system. The meter shall be adequately sized to service the customer irrigation system.
Water Impact Fees
Each customer requesting capacity from the City’s water system shall, prior to the installation of the connection to the water main, pay the following amounts to provide service to properties or customers and to all customers presently connected to the City’s water system when additional development, structural changes, additions or changes in permitted use shall result in an additional impact to the City’s water system. Water impact fees shall not be transferable from one property to another property.
(1) Single-family residence: All development which is considered an individually metered residential unit shall be considered one (1) ERC. The water impact fee per one (1) ERC shall be one thousand five hundred forty dollars ($1,540).
(2) Multiple-family, condominium, mobile home trailer and motor home parks, including all related facilities not having individual water meter connections, or other multiple living units or developments of mobile-type homes: The water impact fees for each living unit served by a master meter shall be determined in accordance with the following schedule. If the development served by the master meter includes individually metered non-residential use, then the water impact fee for such individually metered non-residential use will be determined in addition to the applicable water impact fees as shown below for this customer designation.
ERC Factor per Living Unit Water Impact Fee
Duplex (1 or 2 Bedrooms) 0.833 $ 1,283 Duplex (3 or more Bedrooms) 1.000 1,540 Multifamily (1 Bedroom) 0.583 898 Multifamily (efficiency less than 500 sq. ft.) 0.500 770 Multifamily (2 Bedrooms) 0.833 1,283 Multifamily (3 Bedrooms) 1.000 1,540 Mobile Home (1 or 2 Bedrooms) 0.667 1,027 Mobile Home (3 or more Bedrooms) 0.833 1,283
(3) Hotels and motels not having individual water connections: The water impact fees for each unit that is not individually metered shall be considered as 0.75 ERC’s per unit. The water impact fee per each unit shall be one thousand one hundred fifty-five dollars ($1,155) per unit.
(4) Housing for older persons not having individual water connections: The water impact fees for each unit of housing as defined by Florida Statute 760.29, as amended from time to time, that is not individually metered shall be considered as 0.75 ERC’s per unit. The water impact fee per unit of housing shall be one thousand one hundred fifty-five dollars ($1,155) per unit.
(5) Commercial customers: For all commercial and non-residential connections not specifically identified in one of the classifications listed above, the water impact fees shall be based on the average dependable daily capacity for the development of property identified by the applicant and as certified for the applicant
176
by a registered Florida Professional Engineer using the city’s potable water concurrency standards in Article IV, Chapter 3, Section 3.46 of Appendix D, Land Development Code and as approved by the city expressed on a gallons per day basis multiplied by $6.417 per gallon of capacity. In no event will the water impact fee charged to a commercial customer property be less than one thousand five hundred forty dollars ($1,540). For each commercial customer that is presently connected to the city’s water system that constructs structural changes, additions, or changes in permitted use of such property that shall result in additional capacity impact to the city’s water system, the water impact fee shall be based on the net increase in the average dependable daily capacity for the structural changes, additions, or changes in permitted use as determined above expressed on a gallons per day basis multiplied by $6.417 per gallon of capacity.
To the extent that the average daily flow for a commercial connection during any consecutive twelve month period is greater than the average dependable daily capacity for which water impact fees have been paid, an additional water impact fee shall be assessed for the excess flow calculated in accordance with this section. No refund or credit shall be afforded to the owner of the property in the event that diminution of use occurs.
(6) Each customer requesting water service from the City shall, prior to the installation of a flow meter for each connection to the water main, pay the following amounts to defray the cost of the service provided:
Meter Size (Inches) Water Connection Charge
¾ $ 250 1 475
1-1/2 850 2 1,600
Over 2 inches To be determined by the City on an individual basis
The full amount of the connection charge provided above must be paid prior to connection of each unit to the City’s water system. The City reserves the right to determine the meter size that will be required for the service requested.
Sewer Impact Fees
Each customer requesting capacity from the City’s sewer system shall, prior to connection to the system pay the following amounts to provide service to properties and on all properties presently connected to the City’s sewer system when structural changes, additions or changes in permitted use shall result in an additional impact to the City’s sewer system. Sewer impact fees will not be transferable from one property to another property.
(1) Single-family residence: All development which is considered an individually metered residential unit shall be considered as one (1) ERC. The sewer impact fee per ERC shall be two thousand two hundred ten dollars ($2,210).
(2) Multiple-family, condominium, mobile home trailer and motor home parks, including all related facilities not having individual sewer connections, or other multiple living units or developments of mobile type homes: The sewer impact fees for each living unit serviced by a master meter shall be determined in accordance with the following schedule. If the development served by the master meter includes individually metered non-residential use, then the sewer impact fee for such non-residential use will be determined in addition to the applicable sewer impact fees as shown on the next page for this customer designation.
177

ERC Factor per Living Unit Sewer Impact Fee
Duplex (1 or 2 Bedrooms) 0.833 $ 1,841 Duplex (3 or more Bedrooms) 1.000 2,210 Multifamily (1 Bedroom) 0.583 1,288 Multifamily (efficiency less than 500 sq. ft.) 0.500 1,105 Multifamily (2 Bedrooms) 0.833 1,841 Multifamily (3 or more Bedrooms) 1.000 2,210 Mobile Home (1 or 2 Bedrooms) 0.667 1,474 Mobile Home (3 or more Bedrooms) 0.833 1,841
(3) Hotels and motels not having individual sewer connections: The sewer impact fee for each unit that is not individually metered shall be considered as 0.75 ERC’s per unit. The sewer impact fee per each unit shall be one thousand six hundred fifty eight dollars ($1,658) per unit.
(4) Housing for older persons not having individual sewer connections: The sewer impact fees for each unit of housing as defined by Florida Statute 760.29, as amended from time to time, that is not individually metered shall be considered as 0.75 ERC’s per unit. The sewer impact fee per each unit of housing shall be one thousand six hundred fifty-eight dollars ($1,658) per unit.
(5) Commercial customers: For all commercial and non-residential connections not specifically identified in one of the classifications listed above, the sewer impact fees shall be based on the average dependable daily capacity for the development or property identified by the applicant and as certified for the applicant by a registered Florida Professional Engineer using the city’s potable water concurrency standards in Article IV, Chapter 3 of Appendix D, Land Development Code and as approved by the city expressed on a gallons per day basis multiplied by $9.208 per gallon of capacity. In no event will the sewer impact fee charged to a commercial customer property be less than two thousand two hundred ten dollars ($2,210). For each commercial customer that is presently connected to the city’s system that constructs structural changes, additions or changes in permitted use of such property that shall result in an additional capacity impact to the city’s sewer system, the sewer impact fee shall be based on the net increase in the average dependable daily capacity for the structural changes, additions, or changes in permitted use as determined above expressed on a gallons per day basis multiplied by $9.208 per gallon of capacity.
To the extent that the average daily flow for a commercial connection during a consecutive twelve month period is greater than the average dependable daily capacity for which sewer impact fees have been paid, an additional sewer impact fee shall be assessed for the excess flow calculated in accordance with this section. No refund or credit shall be afforded to the owner of the property in the event that a diminution of use occurs.
(6) Each customer requesting sewer service from the City shall be required to pay to the City an amount equal to the actual cost as determined by the City as incurred for any modification or extension of the sewer system required to provide sewer service to the property requiring such service. The minimum charge to be billed by the City for the cost of a sewer connection is one hundred dollars ($100), regardless of meter size. The payment of the sewer connection charges shall be in addition to the payment of the sewer impact fees.
178

Wat
er c
harg
eSe
wer
cha
rge
Com
bine
d w
ater
and
sew
er c
harg
e0
2,00
05,
000
10,0
0015
,000
02,
000
5,00
010
,000
15,0
000
2,00
05,
000
10,0
0015
,000
Serv
ice
Prov
ider
Gal
lons
Gal
lons
Gal
lons
Gal
lons
Gal
lons
Gal
lons
Gal
lons
Gal
lons
Gal
lons
Gal
lons
Gal
lons
Gal
lons
Gal
lons
Gal
lons
Gal
lons
City
of M
elbo
urne
$8.0
0$1
7.14
$30.
85$5
3.70
$76.
55$1
1.83
$25.
53$4
6.08
$80.
33$1
14.5
8$1
9.83
$42.
67$7
6.93
$134
.03
$191
.13
Bre
vard
Cou
nty
15.7
015
.70
25.5
254
.51
90.1
620
.21
28.7
541
.56
62.9
171
.45
35.9
144
.45
67.0
811
7.42
161.
61
City
of C
ocoa
14
.34
20.3
029
.24
55.0
688
.80
13.8
627
.00
46.7
179
.56
92.7
028
.20
47.3
075
.95
134.
6218
1.50
City
of P
alm
Bay
13
.80
21.0
832
.00
55.6
584
.80
20.2
531
.35
48.0
075
.75
75.7
534
.05
52.4
380
.00
131.
4016
0.55
City
of T
itusv
ille
9.50
15.6
624
.90
48.0
078
.75
13.8
428
.50
50.4
987
.14
123.
7923
.34
44.1
675
.39
135.
1420
2.54
City
of V
ero
Bea
ch
13.6
015
.26
17.7
531
.65
45.5
519
.89
27.0
737
.84
55.7
973
.74
33.4
942
.33
55.5
987
.44
119.
29
City
of W
est M
elbo
urne
13
.88
26.3
845
.63
79.0
311
4.43
13.8
723
.73
38.5
263
.17
87.8
227
.75
50.1
184
.15
142.
2020
2.25
Dat
a pr
epar
ed b
y C
ity o
f Mel
bour
ne F
inan
cial
Ser
vice
s
Com
pari
son
of W
ater
and
Sew
er R
ates
(as o
f Oct
ober
1, 2
016)
179
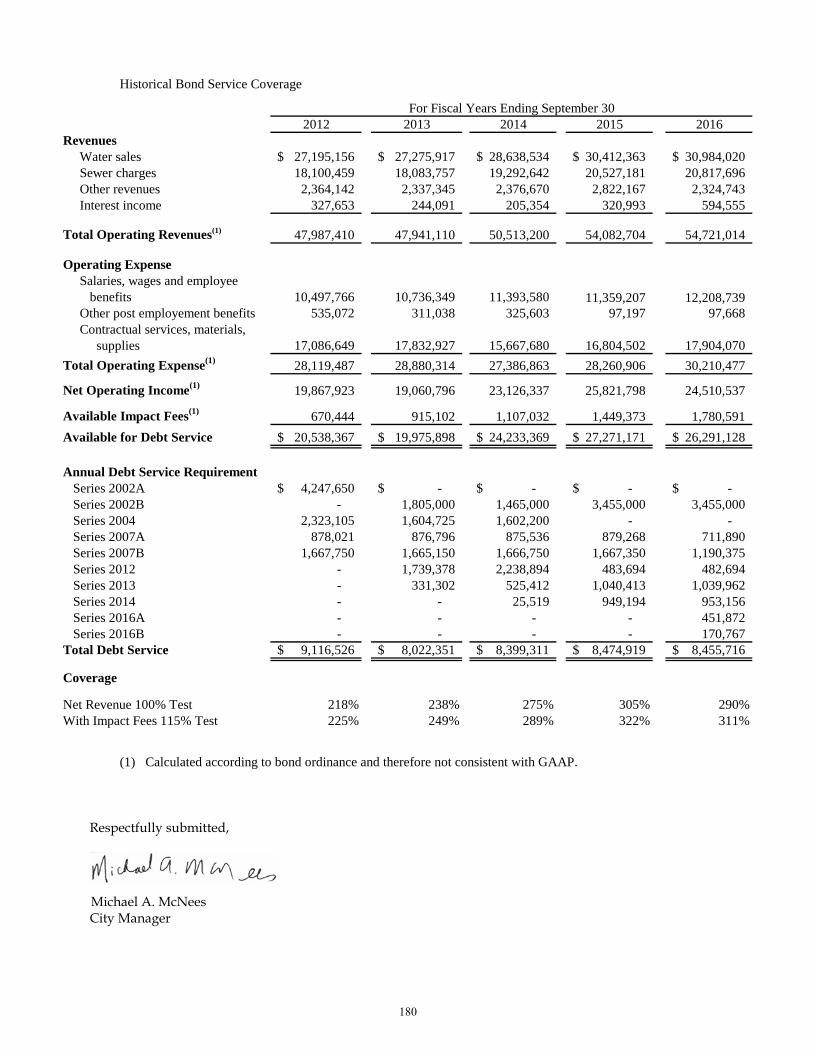
Historical Bond Service Coverage
2012 2013 2014 2015 2016Revenues Water sales 27,195,156$ 27,275,917$ 28,638,534$ 30,412,363$ 30,984,020$ Sewer charges 18,100,459 18,083,757 19,292,642 20,527,181 20,817,696 Other revenues 2,364,142 2,337,345 2,376,670 2,822,167 2,324,743 Interest income 327,653 244,091 205,354 320,993 594,555
Total Operating Revenues(1) 47,987,410 47,941,110 50,513,200 54,082,704 54,721,014
Operating Expense Salaries, wages and employee benefits 10,497,766 10,736,349 11,393,580 11,359,207 12,208,739 Other post employement benefits 535,072 311,038 325,603 97,197 97,668 Contractual services, materials, supplies 17,086,649 17,832,927 15,667,680 16,804,502 17,904,070 Total Operating Expense(1) 28,119,487 28,880,314 27,386,863 28,260,906 30,210,477
Net Operating Income(1) 19,867,923 19,060,796 23,126,337 25,821,798 24,510,537
Available Impact Fees(1) 670,444 915,102 1,107,032 1,449,373 1,780,591 Available for Debt Service 20,538,367$ 19,975,898$ 24,233,369$ 27,271,171$ 26,291,128$
Annual Debt Service Requirement Series 2002A 4,247,650$ -$ -$ -$ -$ Series 2002B - 1,805,000 1,465,000 3,455,000 3,455,000 Series 2004 2,323,105 1,604,725 1,602,200 - - Series 2007A 878,021 876,796 875,536 879,268 711,890 Series 2007B 1,667,750 1,665,150 1,666,750 1,667,350 1,190,375 Series 2012 - 1,739,378 2,238,894 483,694 482,694 Series 2013 - 331,302 525,412 1,040,413 1,039,962 Series 2014 - - 25,519 949,194 953,156
Series 2016A - - - - 451,872 Series 2016B - - - - 170,767
Total Debt Service 9,116,526$ 8,022,351$ 8,399,311$ 8,474,919$ 8,455,716$
Coverage
Net Revenue 100% Test 218% 238% 275% 305% 290%With Impact Fees 115% Test 225% 249% 289% 322% 311%
For Fiscal Years Ending September 30
(1) Calculated according to bond ordinance and therefore not consistent with GAAP.
Respectfully submitted,
Michael A. McNees City Manager
180