city of fernandina beach, florida addendum no. 6 …
TRANSCRIPT
CITY OF FERNANDINA BEACH, FLORIDA ADDENDUM NO. 6
For ITB 21-02 AREA 5 DRAINAGE CONSTRUCTION AND ALACHUA STREET EXPANSION
1
City of Fernandina Beach
204 Ash Street Fernandina Beach, FL 32034
ADDENDUM No. 6 The following changes are applicable to the original documents and specifications of ITB 21-02. This Addendum No.6 now becomes part of the original Invitation to Bid and shall be acknowledged by attaching a copy of this Addendum, signed by an authorized representative of the person or firm submitting the bid. Failure to do so may disqualify the bid submittal. Submitters shall thoroughly familiarize themselves with the contents of this Addendum before submitting the bid. NAME: ___________________________________TITLE: _________________________ ADDRESS: _______________________________________________________________ CITY: _________________________________________________STATE: ____________ AUTHORIZED SIGNATURE: ______________________________DATE: ______________

CITY OF FERNANDINA BEACH, FLORIDA ADDENDUM NO. 6
For ITB 21-02 AREA 5 DRAINAGE CONSTRUCTION AND ALACHUA STREET EXPANSION
2
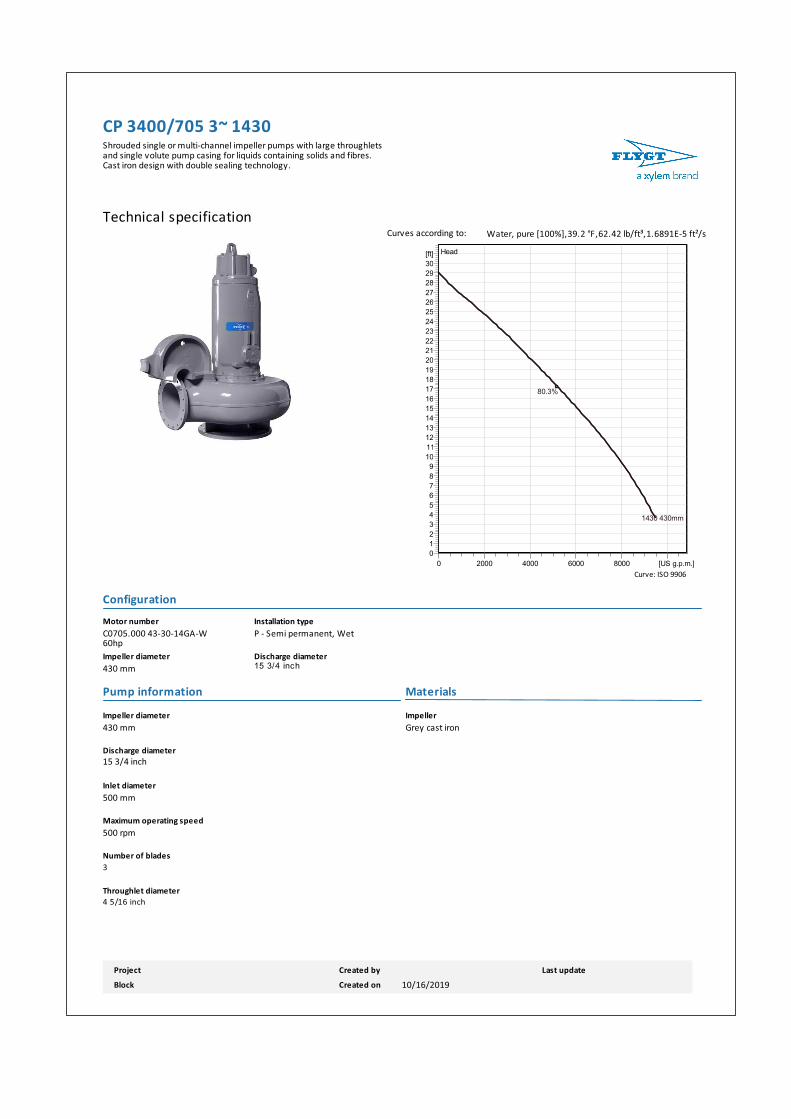
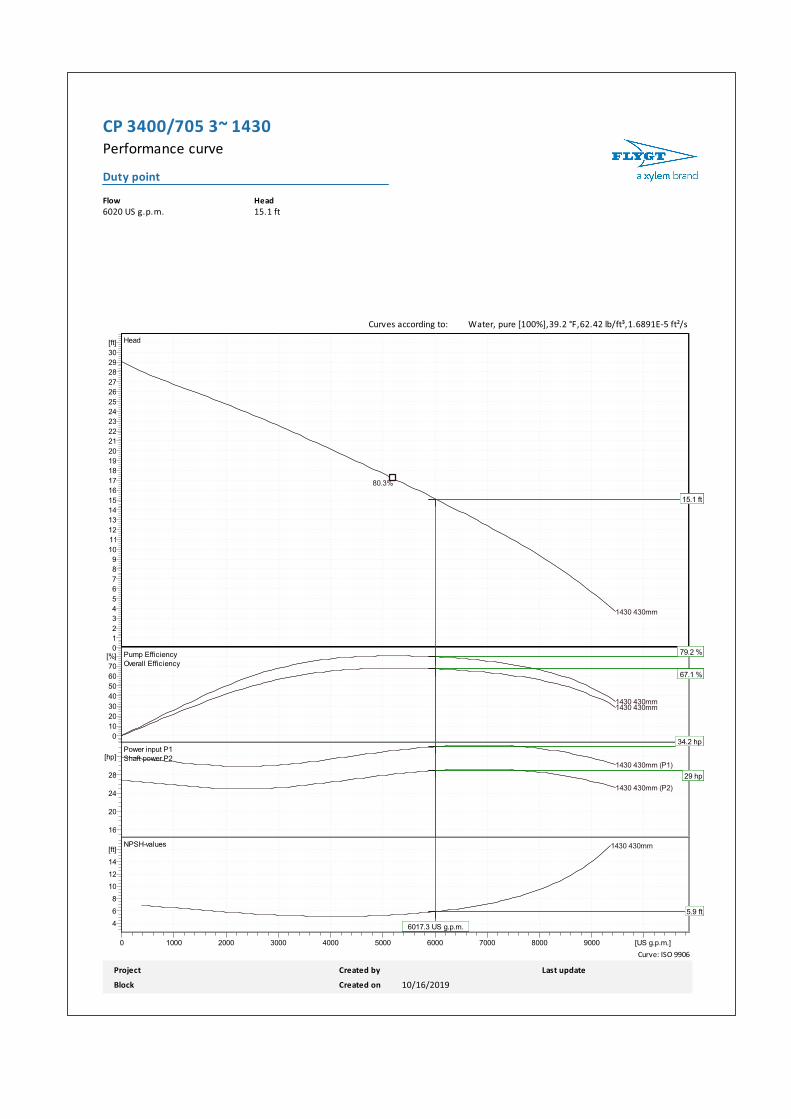
September 2020 Engineering Report Attached for pump information


Table of Contents Introduction .................................................................................................................................................. 2
System Modeling .......................................................................................................................................... 2
Gravity System – Hydraflow ..................................................................................................................... 2
Pump Station - SewerCAD ........................................................................................................................ 2
Conclusions ................................................................................................................................................... 3
Appendices Appendix A – Alachua Street Plan Sheets
Appendix B – Hydraflow Results
Appendix C – SewerCAD Results
Appendix D – Pump Manufacturer Sheets

2 | P a g e
Introduction
In order to have the most accurate model for this gravity to Stormwater force main system CPH used a
combination of Hydraflow and SewerCAD modeling software. Hydraflow was used to model the gravity
system up to the pump station and SewerCAD was used to model the pump station to the discharge
point. The resulting flows calculated in Hydraflow, along with the Mean High Water Level of the Amelia
River, were input in the SewerCAD model to demonstrate the amount of water coming in to the pump
station and how the pumps handled the discharge into the river. The gravity bypass system was also
included in the SewerCAD model to account for the water from smaller storms discharging via gravity
versus the larger storms going through the pump station.
System Modeling
Gravity System – Hydraflow
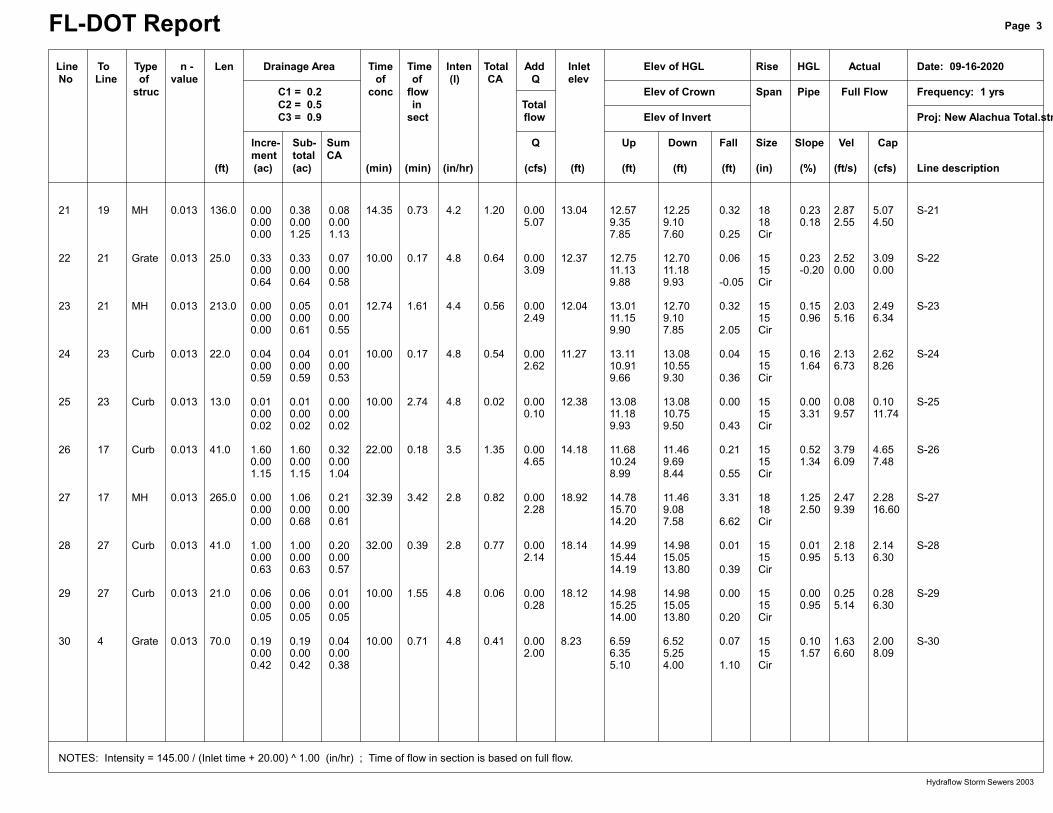
The existing storm sewer system, from the intersection of Alachua Street and North Second Street, was
modeled in Hydraflow to get the anticipated flow going into the proposed pump station. The storms
modeled were the 1-Year, 5-Year and 10-Year 24-Hour storm events. A starting Hydraulic Grade Line for
this model was set at 3.25-ft, which is the top of the Stormwater tanks proposed in Alachua Street. This
assumption was made so that the worst case scenario of the pump station at full capacity would be
modeled and to show the drawdown the pumps provide in the event this occurs. The flows from the 1-
year, 5-year and 10-year storm events are displayed below in Table-1. Please refer to Appendix B for the
Hydraflow results. These flows were used as the inflow rates into the system modeled in SewerCAD.
Storm Event Flow (CFS)
1-Yr 25.30
5-Yr 33.98
10-Yr 38.53 Table 1 - Hydraflow Results - Modeling Flow Going into Pump Station
Pump Station – SewerCAD
The flows from the Hydraflow results were input for each respective storm as the inflow to the pump
station system that was modeled in SewerCAD. The starting Hydraulic Grade Line (HGL) for this model
was set as the Mean High Water Level for the Amelia River, the ultimate discharge point for this system.
The Mean High Water Level is 2.39 ft. Two models were ran in SewerCAD – one that modeled the
existing conditions of the system with no pumps and the other modeled the proposed condition with
the proposed pumps. The comparison of the two models for each storm shows how the HGL is improved
in the proposed condition with the proposed pumps turning on.
3 | P a g e
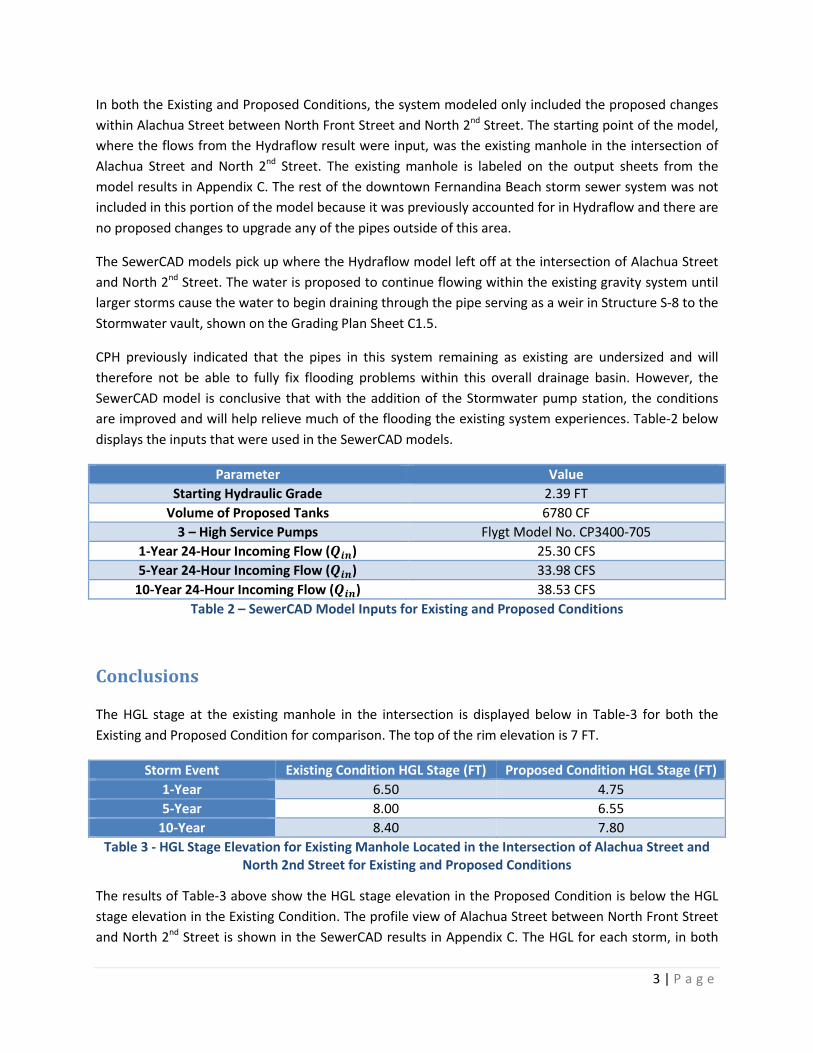
In both the Existing and Proposed Conditions, the system modeled only included the proposed changes
within Alachua Street between North Front Street and North 2nd Street. The starting point of the model,
where the flows from the Hydraflow result were input, was the existing manhole in the intersection of
Alachua Street and North 2nd Street. The existing manhole is labeled on the output sheets from the
model results in Appendix C. The rest of the downtown Fernandina Beach storm sewer system was not
included in this portion of the model because it was previously accounted for in Hydraflow and there are
no proposed changes to upgrade any of the pipes outside of this area.
The SewerCAD models pick up where the Hydraflow model left off at the intersection of Alachua Street
and North 2nd Street. The water is proposed to continue flowing within the existing gravity system until
larger storms cause the water to begin draining through the pipe serving as a weir in Structure S-8 to the
Stormwater vault, shown on the Grading Plan Sheet C1.5.
CPH previously indicated that the pipes in this system remaining as existing are undersized and will
therefore not be able to fully fix flooding problems within this overall drainage basin. However, the
SewerCAD model is conclusive that with the addition of the Stormwater pump station, the conditions
are improved and will help relieve much of the flooding the existing system experiences. Table-2 below
displays the inputs that were used in the SewerCAD models.
Parameter Value
Starting Hydraulic Grade 2.39 FT
Volume of Proposed Tanks 6780 CF
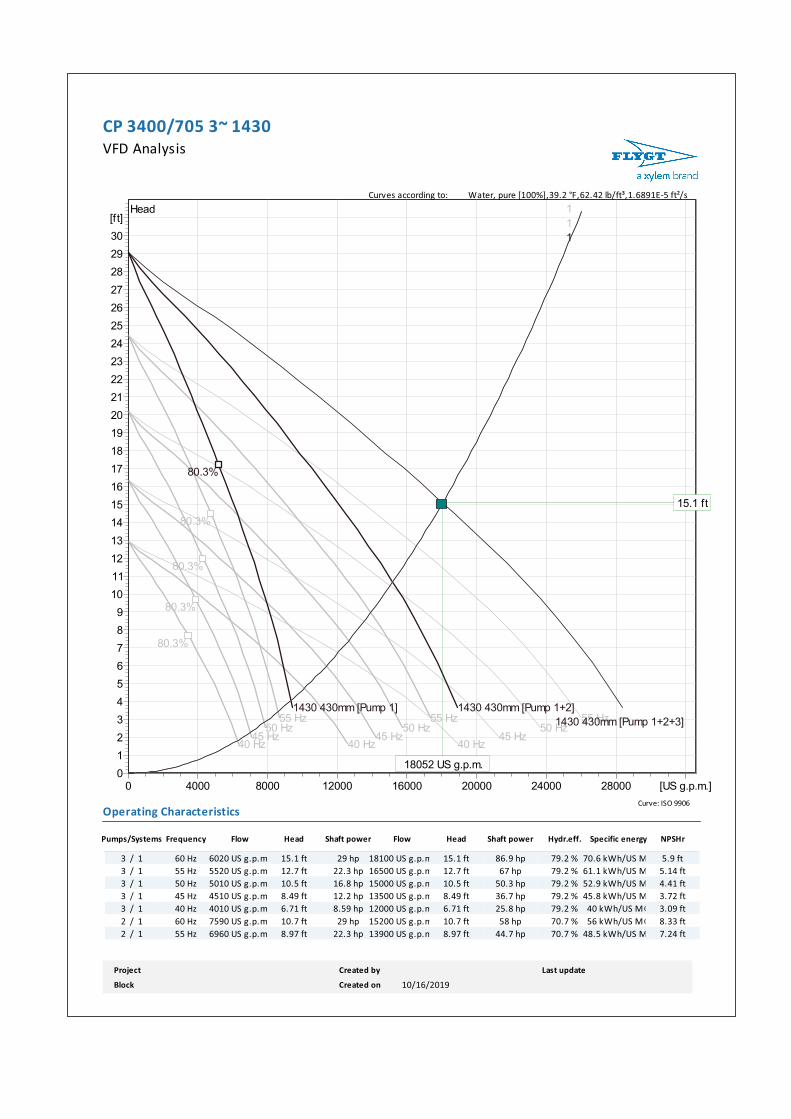
3 – High Service Pumps Flygt Model No. CP3400-705
1-Year 24-Hour Incoming Flow (���) 25.30 CFS
5-Year 24-Hour Incoming Flow (���) 33.98 CFS
10-Year 24-Hour Incoming Flow (���) 38.53 CFS
Table 2 – SewerCAD Model Inputs for Existing and Proposed Conditions
Conclusions
The HGL stage at the existing manhole in the intersection is displayed below in Table-3 for both the
Existing and Proposed Condition for comparison. The top of the rim elevation is 7 FT.
Storm Event Existing Condition HGL Stage (FT) Proposed Condition HGL Stage (FT)
1-Year 6.50 4.75
5-Year 8.00 6.55
10-Year 8.40 7.80
Table 3 - HGL Stage Elevation for Existing Manhole Located in the Intersection of Alachua Street and North 2nd Street for Existing and Proposed Conditions
The results of Table-3 above show the HGL stage elevation in the Proposed Condition is below the HGL
stage elevation in the Existing Condition. The profile view of Alachua Street between North Front Street
and North 2nd Street is shown in the SewerCAD results in Appendix C. The HGL for each storm, in both

4 | P a g e
existing and proposed conditions, is shown across this profile. The Existing Manhole is labeled to show
the start of the existing system that was modeled in Hydrafow. Comparing results from both conditions
for each storm event shows how the pumps are able to draw down the HGL from Existing to Proposed.
In each of the Existing Conditions the HGL stages out of the inlets along this section of the pipe system.
In each of the Proposed Conditions the HGL stage is kept within the limits of the inlet elevations, with
the exception of the existing inlet in the 10-Year which stages 0.8-ft above the 7-ft rim elevation.

Appendix A
Alachua Street Plan Sheets

4
.2
3
4
.4
6
4
.2
4
.0
4
.3
5
3
.6
8
4
.3
3
3
.9
5
.0
5
.0
4
.1
4
.6
4
.6
4
.8
3
3
.6
7
4
.6
2
4
.5
4
.8
4
.4
5
.0
3
.2
4
.7
3
4
.5
4
.8
4
.65
.2
5
.1 3
.9
3
.6
3
.8
4
.0
1
5
.1
4
.3
3
.8
3
.4
4
.7
4
.2
3
.3
3
.1
4
.4
4
.63
.7
3
.5
4
.5
4
.8
3
.4
3
.4
4
.7
3
.6
3
.5
4
.8
4
.9
5
.1
4
.9
5
.3
5
.4
4
.0
4
.04
.2
3
.9
3
.9
5
.9
5
.1
4
.8
5
.1
4
.2
3
.5
3
.6
3
.2
4
.7
5
.2
5
.6
5
.0
5
.7
4
.9
4
.4
2
1
34 33 32 31 30
16
15
31 3034 33 32
N F
RO
NT
S
TR
EE
T
ALACHUA STREET
N S
EC
ON
D S
TR
EE
T
SITE BENCHMARK #2
SS
S
S
S
S
S
S S S S S S
SS
SS
SS
S
FM FM FM FM FM FM
10+00 11+00 12+00 12+85
24
+0
02
5+
00
9'
9'
11'
11'
9'
11'
11'
12'
12'
12'
12'
12'
3.5'
5'
3.5'
5'
ROW LINE
ROW LINE
ROW LINE
STA: 10+30.00
OFF: 11.00' L
ELEV. = 4.90
STA: 10+30.00
OFF: 11.00' R
ELEV. = 4.90
STA: 11+05.10
OFF: 30.00' L
ELEV. = 5.90
STA: 10+93.10
OFF: 30.00' L
ELEV. = 5.80
STA: 10+83.10
OFF: 11.00' L
ELEV. = 5.20
STA: 10+73.89
OFF: 11.00' R
STA: 11+05.89
OFF: 11.00' R
ELEV. = 5.50
STA: 10+83.89
OFF: 30.00' R
ELEV. = 5.60
STA: 10+95.89
OFF: 30.00' R
ELEV. = 5.76
STA: 11+15.00
OFF: 11.00' L
ELEV. = 5.50
STA: 11+22.43
OFF: 20.00' L
ELEV. = 5.40
STA: 11+62.43
OFF: 20.00' L
ELEV. = 5.76
STA: 11+70.04
OFF: 11.00' L
ELEV. = 6.00
STA: 12+05.93
OFF: 20.00' L
ELEV. = 6.10
STA: 12+01.94
OFF: 11.00' L
ELEV. = 6.25
STA: 12+50.54
OFF: 20.00' L
ELEV. = 6.40
STA: 12+59.54
OFF: 11.00' L
STA: 12+74.53
OFF: 26.72' L
MATCH EXIST.
STA: 11+79.76
OFF: 30.00' L
ELEV. = 6.40
STA: 11+91.76
OFF: 30.00' L
ELEV. = 6.50
ELEV. = 7.00
ELEV. = 6.90
ELEV. = 6.80
ELEV. = 4.50
CURB AND GUTTER
PER DETAIL SHEET
LANDSCAPE CUT OUT,
SEE LANDSCAPE PLANS
FLARED DRIVEWAY
PER FDOT INDEX
NO. 522-003, TYP
PROTECT AND SAVE
EXISTING ELECTRICAL
EQUIPMENT
S-1
STA: 11+40.92
OFF: 30.00' R
ELEV. = 6.10
STA: 11+52.92
OFF: 30.00' R
ELEV. = 6.15
STA: 11+74.78
OFF: 30.00' R
ELEV. = 6.40
STA: 11+86.78
OFF: 30.00' R
ELEV. = 6.50
STA: 11+30.92
OFF: 11.00' R
ELEV. = 5.71
STA: 11+62.92
OFF: 11.00' R
ELEV. = 5.96
STA: 11+64.78
OFF: 11.00' R
ELEV. = 5.96
STA: 12+10.54
OFF: 20.00' R
ELEV. = 6.10
STA: 12+50.54
OFF: 20.00' R
ELEV. = 6.40
STA: 12+59.00
OFF: 11.00' R
STA: 12+73.77
OFF: 23.36' R
STA: 11+96.78
OFF: 11.00' R
ELEV. = 6.20
STA: 12+02.94
OFF: 11.00' R
R15'
R15'
R3'
R4'
R3'
R5'
R5'
5' WIDE CONCRETE SIDEWALK
PER FDOT INDEX NO. 522-001
PAVER SIDEWALK PER
DETAIL SHEET
END CONSTRUCTION ALONG
ALACHUA STREET
SAWCUT AND MATCH
EXISTING PAVEMENT
STA: 12+74.47
ELEV. = 7.07
ALACHUA STREET
CENTERLINE
CURB RAMP PER
FDOT INDEX NO.
522-002, TYP
ELEV. = 7.10
ELEV. = 6.80
ELEV. = 4.15
S-2
S-3
S-6
S-4
S-5
S-14
S-7
S-8
S-9
S-10
S-11
S-12
CENTERLINE ALACHUA STREET
STA: 10+00.00
CENTERLINE FRONT STREET
STA: 24+70.00
S82° 18' 07"E 285.00
RAILROAD CROSSING PER
FDOT INDEX NO. 830-T01
SEE SHEET C5.1 FOR
RAILROAD JACK AND
BORE AND FORCEMAIN
INFORMATION
S-13
REROUTE EXISTING
FORCEMAIN
REROUTE EXISTING
WATERMAIN
E-1
ELEV. = 6.80
-8
0
2
4
6
10+00 11+00 12+00
8
10
4.78
5.13
4.20
4.96
4.84
4.91
5.04
5.12
5.34
5.49
5.80
6.01
6.24
6.66
7.21
13+00
4.78
5.13
5.16
5.19
5.29
5.43
5.66
5.99
6.00
6.07
6.44
6.63
6.77
6.92
PV
I
EL
EV
. =
5
.1
5
ST
A. 1
0+
30
.6
4
PV
I
EL
EV
. =
6
.0
5
ST
A. 1
1+
44
.0
0
0.7
9%
PV
I
EL
EV
. =
6
.5
0
ST
A. 1
2+
03
.0
0
0.7
6%
PV
I
EL
EV
. =
7
.0
0
ST
A. 1
2+
70
.9
2
0.7
4%
-8
0
2
4
6
8
10
PROPOSED GRADE ALONG
CENTERLINE
EXISTING GRADE ALONG CENTER LINE
EXISTING GRADE 10' RIGHT
EXISTING GRADE 10' LEFT
PV
I
EL
EV
. =
7
.0
7
ST
A. 1
2+
74
.4
7
END CONSTRUCTION
ALONG ALACHUA STREET
SAWCUT AND MATCH
EXISTING PAVEMENT
MATCH EXISTING
RAILROAD TRACK
ELEVATIONS, TYP
PV
I
EL
EV
. =
5
.1
3
ST
A. 1
0+
25
.5
7
0.3
9%
PV
I
EL
EV
. =
5
.1
3
ST
A. 1
0+
15
.8
1
PV
I
EL
EV
. =
4
.7
8
ST
A. 1
0+
11
.3
8
PV
I
EL
EV
. =
4
.7
8
ST
A. 1
0+
01
.6
2
BEGIN CONSTRUCTION
ALONG ALACHUA STREET
SAWCUT AND MATCH
EXISTING PAVEMENT
7
.
9
%
-2 -2
-4 -4
-6 -6
S-14
S-1
S-2
S-3
S-4
S-5
S-8
S-9
S-7
S-6
S-11
S-12
EXISTING 24" VCP
EXISTING 24" VCP
SEE SHEET C5.1 FOR
RAILROAD CROSSING
DETAILS
CPH, Inc.Plans Prepared By:
State of Florida Licenses:
Engineer No. 3215
Surveyor No. LB7143
Architect. No. AA26000926
Landscape No. LC000298
500 West Fulton Street
Sanford, FL 32771
Ph: 407.322.6841
CPH, Inc.Plans Prepared By:
State of Florida Licenses:
Engineer No. 3215
Surveyor No. LB7143
Architect. No. AA26000926
Landscape No. LC000298
500 West Fulton Street
Sanford, FL 32771
Ph: 407.322.6841
0
Graphic Scale in Feet
20 20 40
N
PL
AN
A
ND
P
RO
FIL
E
AL
AC
HU
A S
TR
EE
T S
TA
: 10+
00 T
O 12+
85
C1.5www.sunshine811.com
CPH, Inc.Plans Prepared By:
State of Florida Licenses:
Engineer No. 3215
Surveyor No. LB7143
Architect. No. AA26000926
Landscape No. LC000298
www.cphcorp.com
A Full ServiceA & E Firm
1234567
THIS SHEET NOT VALID FOR
CONSTRUCTION WITHOUT
COMPLETE SET OF PLANS.
Sheet No.
C 2020
Drawn:
Designed:
Checked:
Job No.:
Date:
Date
No.
Revision
K. Sheffield
P. Ranucci
W. Olszewski
10/2019
F6704
WA
DE
P
. O
LS
ZE
WS
KI, P
.E
.
54068
5200 Belfort Road, Suite 220
Jacksonville, FL 32256
Ph: 904.332.0999
CIT
Y O
F F
ER
NA
ND
IN
A B
EA
CH
AR
EA
5 D
RA
IN
AG
E IM
PR
OV
EM
EN
TS
/ A
LA
CH
UA
S
TR
EE
T
EX
PA
NS
IO
N
CIT
Y O
F F
ER
NA
ND
IN
A B
EA
CH
/ F
LO
RID
A
PROPOSED STORM SEWER SCHEDULE
TYPE C INLET
PER FDOT INDEX NO. 425-052
STA: 10+30.80
OFF: 16.75' L
TOP ELEV. = 4.00
E. F.L. = 0.50
S-1
90'~ 15" RCP @ 0.28%
S-2
S-3
TYPE 9 CURB INLET
PER FDOT INDEX NO. 425-024
STA: 12+07.92
OFF: 20.50' L
EOP ELEV. = 6.10
TOP ELEV. = 6.60
W. F.L. = 2.60
S-5
TYPE 9 CURB INLET
PER FDOT INDEX NO. 425-024
STA: 11+24.02
OFF: 20.50' L
EOP ELEV. = 5.40
TOP ELEV. = 5.90
S. F.L. = 0.00
E. F.L. = 2.35
W. F.L. = 0.25
81'~ 15" RCP @ 0.31%
S-4
30'~ 15" RCP @ 0.33%
S-6
S-7 TYPE 9 CURB INLET
PER FDOT INDEX NO. 425-024
STA: 11+21.05
OFF:11.00' R
EOP ELEV. = 5.55
TOP ELEV. = 6.05
4' DIA. MANHOLE
PER FDOT INDEX NO. 425-001 & 425-010
STA: 11+10.45
OFF: 21.22' R
RIM ELEV. = 5.50
N. F.L. = 1.40
E. F.L. = -0.90
W. F.L. = -2.60
S-8
86'~ 24" RCP @ 0.25%
S-9
4'~ 24" RCP @ 1.00%
S-10
STORMCAPTURE® PV DETENTION
PANEL VAULT WITH PUMPS (OR
APPROVED EQUAL). SEE DETAIL
SHEET
N. F.L. = -0.10
S. F.L. = 2.15
S-11
CONCRETE VALVE BOX
SEE DETAIL SHEET
S-12
S-14TYPE 9 CURB INLET
PER FDOT INDEX NO. 425-024
INSTALL OVER EXISTING
STORMPIPE AND
GROUT SEAL TO ENSURE
WATERTIGHT CONNECTION
STA: 12+11.60
OFF: 20.50' R
EOP ELEV. = 6.10
TOP ELEV. = 6.60
E. F.L. = 0.73
W. F.L. = 0.73
MA
TC
HL
IN
E - S
EE
S
HE
ET
C
5.1
CONNECT TO EXISTING INLET
S-13
10'X16' ELECTRICAL BUILDING.
SEE DETAIL SHEET
E-1

ELEV. = 3.25
PROP. GRADE = 5.15±
ELEV. = -8.75
ELEV. = 3.25
PROP. GRADE = 5.25±
ELEV. = -5.58
ELEV. = -0.25
VALVE BOX AND DETENTION VAULT SECTION
VALVE BOX AND DETENTION VAULT PLAN1/2" = 1'
ELEV. = -4.25
ELEV. = -5.50
ELEV. = -2.23
3'
3'
PROPOSED CURB LINE
10' 40'
1
1/2" = 1'
2
1
8
4
5
6
7
8
2
2
2
1
1
1
8
8
8
4
4
5
5
6
6
7
7
8
8
8
9
9
9
8
8
10
11
12
11
13
13
14
1415
1516
1617
18
A
B
C
C
D
D
E
E
E
E
D
STORMWATER VALVE BOX,
SEE STRUCTURAL PLANS
STORMWATER DETENTION
VAULT AND PUMP STATION,
SEE SHEET C5.2 FOR
ADDITIONAL INFORMATION
F4
F3
F2
F1
3
3
3
3
3
3
5'-3
1 2
"5
'-3
1 2
"
C5.2
LIF
T S
TA
TIO
N D
ET
AIL
S
HE
ET
CPH, Inc.Plans Prepared By:
State of Florida Licenses:
Engineer No. 3215
Surveyor No. LB7143
Architect. No. AA26000926
Landscape No. LC000298
www.cphcorp.com
A Full ServiceA & E Firm
1234567
THIS SHEET NOT VALID FOR
CONSTRUCTION WITHOUT
COMPLETE SET OF PLANS.
Sheet No.
C 2019
Drawn:
Designed:
Checked:
Job No.:
Date:
Date
No.
Revision
K. Sheffield
P. Ranucci
W. Olszewski
10/2019
F6704
WA
DE
P
. O
LS
ZE
WS
KI, P
.E
.
54068
5200 Belfort Road, Suite 220
Jacksonville, FL 32256
Ph: 904.332.0999
CIT
Y O
F F
ER
NA
ND
IN
A B
EA
CH
AR
EA
5 D
RA
IN
AG
E IM
PR
OV
EM
EN
TS
/ A
LA
CH
UA
S
TR
EE
T
EX
PA
NS
IO
N
CIT
Y O
F F
ER
NA
ND
IN
A B
EA
CH
/ F
LO
RID
A
1
PROPOSED FITTINGS LEGEND:
16" S.S SPOOL PIECE (FLG)
2
16" S.S 90° BEND (FLG)
3 16" WALL SLEEVE
4
16" DIP COUPLING ADAPTER (FLG)
5 16" CHECK VALVE W/LEVER AND WEIGHT
6 16" TEE W/BLIND FLANGE AND GAUGE
7 16" PLUG VALVE
8
16" DIP SPOOL PIECE (FLG)
9
16" C905 PVC 90° BEND (FLG)
10
16" C905 PVC CROSS (FLG)
11
24" X 16" C905 PVC REDUCING 90° BEND (FLG)
12
24" C905 PVC 90° BEND (FLG)
13
24" C905 PVC SPOOL PIECE (FLG)
14
24" GATE VALVE (FLG)
15
16 24" C905 PVC STORMWATER FORCEMAIN
17 32" STEEL CASING PIPE
18 CASING END TREATMENT PER MANUFACTURES SPECIFICATIONS
A
EQUIPMENT LEGEND:
HIGH SERVICE PUMP NO. 1
FLYGT MODEL NO. CP3400-705
OR APPROVED EQUAL
B
HIGH SERVICE PUMP NO. 2
FLYGT MODEL NO. CP3400-705
OR APPROVED EQUAL
C
HIGH SERVICE PUMP NO. 3
FLYGT MODEL NO. CP3400-705
OR APPROVED EQUAL
D
36" X 36" ACUDOR FC-H20 ACCESS
HATCH OR APPROVED EQUAL
E
48" X 72" ACUDOR FC-H20 ACCESS
HATCH OR APPROVED EQUAL
F1
PUMP FLOAT LEGEND:
HIGH WATER ALARM FLOAT
F2 LAG PUMPS ON FLOAT
F3 LEAD PUMP ON FLOAT
F4 PUMPS OFF FLOAT
24" TIDEFLEX SERIES 39 CHECK VALVE

11'-6" 2' 11'-6"
10' 10'
16
'-6
"
15
'
17
'-6
"
16
'
3'
3'
9'-3
"
7'-6
"
11'-6" 2'
10'
A
A
B
B
B
4'-1
0"
7'-6
"
2'-7
3 4
"
3'-0
1 2
"5
'-3
1 2
"5
'-3
1 2
"
6'-3
1
4
"
5'
40'
40'
11
'-6
"
10
'
13
'-9
"
12
'
5'-2"5'5'-2"
4" (TYP)
3'-1
0"
3'-7
"
13'-5"
8'-3
1
2
"
2'-3
3
4
"
8'-3
1
2
"
C
C
F.L. ELEV. = 1.36
F.L. ELEV. = -0.10
D
E
C5.3
LIF
T S
TA
TIO
N D
ET
AIL
S
HE
ET
CPH, Inc.Plans Prepared By:
State of Florida Licenses:
Engineer No. 3215
Surveyor No. LB7143
Architect. No. AA26000926
Landscape No. LC000298
www.cphcorp.com
A Full ServiceA & E Firm
1234567
THIS SHEET NOT VALID FOR
CONSTRUCTION WITHOUT
COMPLETE SET OF PLANS.
Sheet No.
C 2019
Drawn:
Designed:
Checked:
Job No.:
Date:
Date
No.
Revision
K. Sheffield
P. Ranucci
W. Olszewski
10/2019
F6704
WA
DE
P
. O
LS
ZE
WS
KI, P
.E
.
54068
5200 Belfort Road, Suite 220
Jacksonville, FL 32256
Ph: 904.332.0999
CIT
Y O
F F
ER
NA
ND
IN
A B
EA
CH
AR
EA
5 D
RA
IN
AG
E IM
PR
OV
EM
EN
TS
/ A
LA
CH
UA
S
TR
EE
T
EX
PA
NS
IO
N
CIT
Y O
F F
ER
NA
ND
IN
A B
EA
CH
/ F
LO
RID
A
PRE-CAST VALVE BOX AND DETENTION VAULT SECTION
PRE-CAST VALVE BOX AND DETENTION VAULT PLAN1/2" = 1'
1/2" = 1'
A
EQUIPMENT LEGEND:
B
C
36" X 36" ACUDOR FC-H20 ACCESS
HATCH OR APPROVED EQUAL
48" X 72" ACUDOR FC-H20 ACCESS
HATCH OR APPROVED EQUAL
HYDRO INTERNATIONAL 10'X16'
DRYSCREEN VAULT OR APPROVED
EQUAL
C
30" MANHOLE FRAME AND COVER
PER HYDRO INTERNATIONAL
SPECIFICATIONS
D
TYPE 9 CURB INLET PER FDOT
INDEX NO. 425-024

Appendix B
Hydraflow Results

Hydraflow Plan View
Project file: New Alachua Total.stm No. Lines: 36 09-16-2020
Hydraflow Storm Sewers 2003

Hydraflow Results
1-Year Storm

FL-DOT Report Page 1
Line To Type n - Len Drainage Area Time Time Inten Total Add Inlet Elev of HGL Rise HGL Actual Date: 09-16-2020No Line of value of of (I) CA Q elev
struc C1 = 0.2 conc flow Elev of Crown Span Pipe Full Flow Frequency: 1 yrsC2 = 0.5 in TotalC3 = 0.9 sect flow Elev of Invert Proj: New Alachua Total.stm
Incre- Sub- Sum Q Up Down Fall Size Slope Vel Capment total CA
(ft) (ac) (ac) (min) (min) (in/hr) (cfs) (ft) (ft) (ft) (ft) (in) (%) (ft/s) (cfs) Line description
1 End Grate 0.013 88.0 1.84 7.72 1.54 43.27 0.19 2.3 11.04 0.00 6.10 4.35 3.25 1.10 24 1.25 8.05 25.30 S-10.00 0.00 0.00 25.30 2.73 1.10 24 1.85 9.80 30.781.29 10.55 9.50 0.73 -0.90 1.63 Cir
2 1 MH 0.013 71.0 0.00 5.88 1.18 43.09 0.17 2.3 9.50 0.00 7.00 5.52 4.86 0.66 24 0.93 6.95 21.84 S-20.00 0.00 0.00 21.84 3.93 2.73 24 1.69 9.36 29.400.00 9.26 8.33 1.93 0.73 1.20 Cir
3 2 Curb 0.013 50.0 0.24 0.24 0.05 10.00 0.35 4.8 0.60 0.00 6.78 6.26 6.16 0.10 15 0.20 2.37 2.91 S-30.00 0.00 0.00 2.91 4.67 3.74 15 1.86 7.18 8.810.62 0.62 0.56 3.42 2.49 0.93 Cir
4 2 Curb 0.013 24.0 0.43 0.62 0.12 10.71 0.09 4.7 1.12 0.00 6.94 6.32 6.16 0.16 15 0.67 4.31 5.29 S-40.00 0.00 0.00 5.29 4.00 3.60 15 1.67 6.79 8.340.69 1.11 1.00 2.75 2.35 0.40 Cir
5 2 MH 0.013 300.0 0.00 5.02 1.00 42.22 0.87 2.3 7.78 0.00 11.00 8.09 6.16 1.93 24 0.64 5.77 18.13 S-50.00 0.00 0.00 18.13 6.56 3.97 24 0.86 6.69 21.020.00 7.53 6.78 4.56 1.97 2.59 Cir
6 5 Curb 0.013 18.0 0.04 0.04 0.01 10.00 0.24 4.8 0.32 0.00 10.16 8.61 8.60 0.01 15 0.04 1.27 1.52 S-60.00 0.00 0.00 1.52 8.71 6.40 15 12.83 18.85 23.130.34 0.34 0.31 7.46 5.15 2.31 Cir
7 5 MH 0.013 39.0 0.00 0.27 0.05 12.26 0.08 4.5 2.13 0.00 10.45 9.46 8.60 0.86 15 2.20 7.81 9.58 S-70.00 0.00 0.00 9.58 6.09 5.93 15 0.41 3.37 4.140.00 2.31 2.08 4.84 4.68 0.16 Cir
8 7 Grate 0.013 9.0 0.01 0.01 0.00 10.00 0.32 4.8 0.12 0.00 9.79 10.41 10.41 0.00 15 0.01 0.47 0.58 S-80.00 0.00 0.00 0.58 8.54 7.90 15 7.11 14.03 17.220.13 0.13 0.12 7.29 6.65 0.64 Cir
9 7 MH 0.013 171.0 0.00 0.26 0.05 11.88 0.38 4.5 2.01 0.00 9.97 13.84 10.41 3.43 15 2.01 7.46 9.15 S-90.00 0.00 0.00 9.15 6.48 6.13 15 0.20 2.38 2.920.00 2.18 1.96 5.23 4.88 0.35 Cir
10 9 Grate 0.013 26.0 0.02 0.02 0.00 10.00 1.88 4.8 0.06 0.00 10.00 14.71 14.71 0.00 15 0.00 0.23 0.28 S-100.00 0.00 0.00 0.28 6.90 6.51 15 1.50 6.44 7.910.06 0.06 0.05 5.65 5.26 0.39 Cir
NOTES: Intensity = 145.00 / (Inlet time + 20.00) ^ 1.00 (in/hr) ; Time of flow in section is based on full flow.
Hydraflow Storm Sewers 2003

FL-DOT Report Page 2
Line To Type n - Len Drainage Area Time Time Inten Total Add Inlet Elev of HGL Rise HGL Actual Date: 09-16-2020No Line of value of of (I) CA Q elev
struc C1 = 0.2 conc flow Elev of Crown Span Pipe Full Flow Frequency: 1 yrsC2 = 0.5 in TotalC3 = 0.9 sect flow Elev of Invert Proj: New Alachua Total.stm
Incre- Sub- Sum Q Up Down Fall Size Slope Vel Capment total CA
(ft) (ac) (ac) (min) (min) (in/hr) (cfs) (ft) (ft) (ft) (ft) (in) (%) (ft/s) (cfs) Line description
11 9 Grate 0.013 7.0 0.08 0.13 0.03 10.30 0.03 4.8 0.94 0.00 9.48 14.74 14.71 0.03 15 0.49 3.68 4.51 S-110.00 0.00 0.00 4.51 7.35 7.27 15 1.14 5.63 6.900.62 1.02 0.92 6.10 6.02 0.08 Cir
12 11 Grate 0.013 26.0 0.05 0.05 0.01 10.00 0.30 4.8 0.37 0.00 10.02 15.02 15.00 0.02 15 0.08 1.45 1.78 S-120.00 0.00 0.00 1.78 7.87 7.48 15 1.50 6.44 7.910.40 0.40 0.36 6.62 6.23 0.39 Cir
13 9 MH 0.013 176.0 0.00 0.11 0.02 10.33 0.74 4.8 1.01 0.00 9.01 15.69 14.71 0.98 15 0.56 3.94 4.83 S-130.00 0.00 0.00 4.83 7.05 6.52 15 0.30 2.89 3.540.00 1.10 0.99 5.80 5.27 0.53 Cir
14 13 Grate 0.013 29.0 0.08 0.08 0.02 10.00 0.33 4.8 0.37 0.00 9.18 15.95 15.93 0.02 15 0.08 1.44 1.77 S-140.00 0.00 0.00 1.77 7.65 7.40 15 0.86 4.89 6.000.39 0.39 0.35 6.40 6.15 0.25 Cir
15 13 Curb 0.013 9.0 0.03 0.03 0.01 10.00 0.06 4.8 0.64 0.00 8.75 15.95 15.93 0.02 15 0.23 2.54 3.11 S-150.00 0.00 0.00 3.11 7.62 7.40 15 2.44 8.23 10.100.71 0.71 0.64 6.37 6.15 0.22 Cir
16 5 Curb 0.013 41.0 1.60 1.60 0.32 42.00 0.22 2.3 1.60 0.00 10.74 8.74 8.60 0.14 15 0.33 3.04 3.73 S-160.00 0.00 0.00 3.73 7.75 7.50 15 0.61 4.11 5.041.41 1.41 1.27 6.50 6.25 0.25 Cir
17 5 MH 0.013 279.0 0.00 3.11 0.62 35.81 0.82 2.6 3.74 0.00 14.41 10.99 8.60 2.39 18 0.86 5.50 9.72 S-170.00 0.00 0.00 9.72 8.62 6.12 18 0.90 5.63 9.940.00 3.47 3.12 7.12 4.62 2.50 Cir
18 17 Curb 0.013 22.0 0.04 0.04 0.01 10.00 0.58 4.8 0.16 0.00 13.87 11.47 11.46 0.00 15 0.01 0.64 0.78 S-180.00 0.00 0.00 0.78 10.25 10.11 15 0.64 4.20 5.150.17 0.17 0.15 9.00 8.86 0.14 Cir
19 17 MH 0.013 54.0 0.00 0.41 0.08 15.07 0.18 4.1 1.41 0.00 13.91 11.90 11.46 0.44 15 0.81 4.74 5.82 S-190.00 0.00 0.00 5.82 8.85 8.38 15 0.87 4.91 6.020.00 1.47 1.32 7.60 7.13 0.47 Cir
20 19 Grate 0.013 24.0 0.03 0.03 0.01 10.00 0.50 4.8 0.21 0.00 13.02 12.32 12.31 0.01 15 0.02 0.81 0.99 S-200.00 0.00 0.00 0.99 11.98 12.31 15 -1.38 0.00 0.000.22 0.22 0.20 10.73 11.06 -0.33 Cir
NOTES: Intensity = 145.00 / (Inlet time + 20.00) ^ 1.00 (in/hr) ; Time of flow in section is based on full flow.
Hydraflow Storm Sewers 2003
FL-DOT Report Page 3
Line To Type n - Len Drainage Area Time Time Inten Total Add Inlet Elev of HGL Rise HGL Actual Date: 09-16-2020No Line of value of of (I) CA Q elev
struc C1 = 0.2 conc flow Elev of Crown Span Pipe Full Flow Frequency: 1 yrsC2 = 0.5 in TotalC3 = 0.9 sect flow Elev of Invert Proj: New Alachua Total.stm
Incre- Sub- Sum Q Up Down Fall Size Slope Vel Capment total CA
(ft) (ac) (ac) (min) (min) (in/hr) (cfs) (ft) (ft) (ft) (ft) (in) (%) (ft/s) (cfs) Line description
21 19 MH 0.013 136.0 0.00 0.38 0.08 14.35 0.73 4.2 1.20 0.00 13.04 12.57 12.25 0.32 18 0.23 2.87 5.07 S-210.00 0.00 0.00 5.07 9.35 9.10 18 0.18 2.55 4.500.00 1.25 1.13 7.85 7.60 0.25 Cir
22 21 Grate 0.013 25.0 0.33 0.33 0.07 10.00 0.17 4.8 0.64 0.00 12.37 12.75 12.70 0.06 15 0.23 2.52 3.09 S-220.00 0.00 0.00 3.09 11.13 11.18 15 -0.20 0.00 0.000.64 0.64 0.58 9.88 9.93 -0.05 Cir
23 21 MH 0.013 213.0 0.00 0.05 0.01 12.74 1.61 4.4 0.56 0.00 12.04 13.01 12.70 0.32 15 0.15 2.03 2.49 S-230.00 0.00 0.00 2.49 11.15 9.10 15 0.96 5.16 6.340.00 0.61 0.55 9.90 7.85 2.05 Cir
24 23 Curb 0.013 22.0 0.04 0.04 0.01 10.00 0.17 4.8 0.54 0.00 11.27 13.11 13.08 0.04 15 0.16 2.13 2.62 S-240.00 0.00 0.00 2.62 10.91 10.55 15 1.64 6.73 8.260.59 0.59 0.53 9.66 9.30 0.36 Cir
25 23 Curb 0.013 13.0 0.01 0.01 0.00 10.00 2.74 4.8 0.02 0.00 12.38 13.08 13.08 0.00 15 0.00 0.08 0.10 S-250.00 0.00 0.00 0.10 11.18 10.75 15 3.31 9.57 11.740.02 0.02 0.02 9.93 9.50 0.43 Cir
26 17 Curb 0.013 41.0 1.60 1.60 0.32 22.00 0.18 3.5 1.35 0.00 14.18 11.68 11.46 0.21 15 0.52 3.79 4.65 S-260.00 0.00 0.00 4.65 10.24 9.69 15 1.34 6.09 7.481.15 1.15 1.04 8.99 8.44 0.55 Cir
27 17 MH 0.013 265.0 0.00 1.06 0.21 32.39 3.42 2.8 0.82 0.00 18.92 14.78 11.46 3.31 18 1.25 2.47 2.28 S-270.00 0.00 0.00 2.28 15.70 9.08 18 2.50 9.39 16.600.00 0.68 0.61 14.20 7.58 6.62 Cir
28 27 Curb 0.013 41.0 1.00 1.00 0.20 32.00 0.39 2.8 0.77 0.00 18.14 14.99 14.98 0.01 15 0.01 2.18 2.14 S-280.00 0.00 0.00 2.14 15.44 15.05 15 0.95 5.13 6.300.63 0.63 0.57 14.19 13.80 0.39 Cir
29 27 Curb 0.013 21.0 0.06 0.06 0.01 10.00 1.55 4.8 0.06 0.00 18.12 14.98 14.98 0.00 15 0.00 0.25 0.28 S-290.00 0.00 0.00 0.28 15.25 15.05 15 0.95 5.14 6.300.05 0.05 0.05 14.00 13.80 0.20 Cir
30 4 Grate 0.013 70.0 0.19 0.19 0.04 10.00 0.71 4.8 0.41 0.00 8.23 6.59 6.52 0.07 15 0.10 1.63 2.00 S-300.00 0.00 0.00 2.00 6.35 5.25 15 1.57 6.60 8.090.42 0.42 0.38 5.10 4.00 1.10 Cir
NOTES: Intensity = 145.00 / (Inlet time + 20.00) ^ 1.00 (in/hr) ; Time of flow in section is based on full flow.
Hydraflow Storm Sewers 2003

FL-DOT Report Page 4
Line To Type n - Len Drainage Area Time Time Inten Total Add Inlet Elev of HGL Rise HGL Actual Date: 09-16-2020No Line of value of of (I) CA Q elev
struc C1 = 0.2 conc flow Elev of Crown Span Pipe Full Flow Frequency: 1 yrsC2 = 0.5 in TotalC3 = 0.9 sect flow Elev of Invert Proj: New Alachua Total.stm
Incre- Sub- Sum Q Up Down Fall Size Slope Vel Capment total CA
(ft) (ac) (ac) (min) (min) (in/hr) (cfs) (ft) (ft) (ft) (ft) (in) (%) (ft/s) (cfs) Line description
31 End Grate 0.013 30.0 0.00 1.08 0.22 13.26 0.09 4.4 1.59 0.00 5.40 3.59 3.25 0.34 15 1.15 5.63 6.91 New S-30.00 0.00 0.00 6.91 1.30 0.35 15 3.17 9.36 11.490.13 1.52 1.37 0.05 -0.90 0.95 Cir
32 31 Grate 0.013 90.0 0.00 0.00 0.00 10.00 3.26 4.8 0.12 0.00 4.00 4.34 4.33 0.01 15 0.01 0.46 0.57 New S-10.00 0.00 0.00 0.57 1.75 1.50 15 0.28 2.77 3.400.13 0.13 0.11 0.50 0.25 0.25 Cir
33 31 Grate 0.013 81.0 0.00 1.08 0.22 11.03 0.26 4.7 1.35 0.00 6.10 5.11 4.33 0.77 15 0.96 5.15 6.31 New S-50.00 0.00 0.00 6.31 3.85 3.60 15 0.31 2.92 3.590.03 1.27 1.14 2.60 2.35 0.25 Cir
34 33 Comb 0.013 54.0 0.26 1.08 0.22 10.78 0.26 4.7 1.32 0.00 6.60 5.89 5.75 0.14 18 0.26 3.53 6.24 S-330.00 0.00 0.00 6.24 5.89 5.75 18 0.26 3.03 5.350.09 1.24 1.12 4.39 4.25 0.14 Cir
35 34 Grate 0.013 115.0 0.12 0.82 0.16 10.18 0.59 4.8 1.19 0.00 6.43 6.50 6.18 0.32 18 0.28 3.24 5.72 S-340.00 0.00 0.00 5.72 6.50 5.89 18 0.53 4.33 7.650.19 1.15 1.04 5.00 4.39 0.61 Cir
36 35 Grate 0.013 30.0 0.70 0.70 0.14 10.00 0.18 4.8 1.00 0.00 6.08 6.80 6.74 0.06 18 0.20 2.72 4.81 S-350.00 0.00 0.00 4.81 6.80 6.50 18 1.00 5.94 10.500.96 0.96 0.86 5.30 5.00 0.30 Cir
NOTES: Intensity = 145.00 / (Inlet time + 20.00) ^ 1.00 (in/hr) ; Time of flow in section is based on full flow.
Hydraflow Storm Sewers 2003

Hydraflow Results
5-Year Storm

FL-DOT Report Page 1
Line To Type n - Len Drainage Area Time Time Inten Total Add Inlet Elev of HGL Rise HGL Actual Date: 09-16-2020No Line of value of of (I) CA Q elev
struc C1 = 0.2 conc flow Elev of Crown Span Pipe Full Flow Frequency: 5 yrsC2 = 0.5 in TotalC3 = 0.9 sect flow Elev of Invert Proj: New Alachua Total.stm
Incre- Sub- Sum Q Up Down Fall Size Slope Vel Capment total CA
(ft) (ac) (ac) (min) (min) (in/hr) (cfs) (ft) (ft) (ft) (ft) (in) (%) (ft/s) (cfs) Line description
1 End Grate 0.013 88.0 1.84 7.72 1.54 42.95 0.14 3.1 11.04 0.00 6.10 5.24 3.25 1.99 24 2.26 10.82 33.98 S-10.00 0.00 0.00 33.98 2.73 1.10 24 1.85 9.80 30.781.29 10.55 9.50 0.73 -0.90 1.63 Cir
2 1 MH 0.013 71.0 0.00 5.88 1.18 42.82 0.13 3.1 9.50 0.00 7.00 7.34 6.15 1.19 24 1.68 9.33 29.31 S-20.00 0.00 0.00 29.31 3.93 2.73 24 1.69 9.36 29.400.00 9.26 8.33 1.93 0.73 1.20 Cir
3 2 Curb 0.013 50.0 0.24 0.24 0.05 10.00 0.28 6.1 0.60 0.00 6.78 8.65 8.49 0.16 15 0.33 3.01 3.69 S-30.00 0.00 0.00 3.69 4.67 3.74 15 1.86 7.18 8.810.62 0.62 0.56 3.42 2.49 0.93 Cir
4 2 Curb 0.013 24.0 0.43 0.62 0.12 10.56 0.07 6.0 1.12 0.00 6.94 8.75 8.49 0.26 15 1.09 5.50 6.75 S-40.00 0.00 0.00 6.75 4.00 3.60 15 1.67 6.79 8.340.69 1.11 1.00 2.75 2.35 0.40 Cir
5 2 MH 0.013 300.0 0.00 5.02 1.00 42.17 0.65 3.1 7.78 0.00 11.00 11.93 8.49 3.44 24 1.15 7.71 24.23 S-50.00 0.00 0.00 24.23 6.56 3.97 24 0.86 6.69 21.020.00 7.53 6.78 4.56 1.97 2.59 Cir
6 5 Curb 0.013 18.0 0.04 0.04 0.01 10.00 0.19 6.1 0.32 0.00 10.16 12.88 12.86 0.02 15 0.09 1.58 1.93 S-60.00 0.00 0.00 1.93 8.71 6.40 15 12.83 18.85 23.130.34 0.34 0.31 7.46 5.15 2.31 Cir
7 5 MH 0.013 39.0 0.00 0.27 0.05 11.78 0.07 5.8 2.13 0.00 10.45 14.30 12.86 1.44 15 3.68 10.09 12.39 S-70.00 0.00 0.00 12.39 6.09 5.93 15 0.41 3.37 4.140.00 2.31 2.08 4.84 4.68 0.16 Cir
8 7 Grate 0.013 9.0 0.01 0.01 0.00 10.00 0.25 6.1 0.12 0.00 9.79 15.88 15.88 0.00 15 0.01 0.59 0.73 S-80.00 0.00 0.00 0.73 8.54 7.90 15 7.11 14.03 17.220.13 0.13 0.12 7.29 6.65 0.64 Cir
9 7 MH 0.013 171.0 0.00 0.26 0.05 11.48 0.30 5.9 2.01 0.00 9.97 21.59 15.88 5.71 15 3.34 9.61 11.80 S-90.00 0.00 0.00 11.80 6.48 6.13 15 0.20 2.38 2.920.00 2.18 1.96 5.23 4.88 0.35 Cir
10 9 Grate 0.013 26.0 0.02 0.02 0.00 10.00 1.48 6.1 0.06 0.00 10.00 23.02 23.02 0.00 15 0.00 0.29 0.36 S-100.00 0.00 0.00 0.36 6.90 6.51 15 1.50 6.44 7.910.06 0.06 0.05 5.65 5.26 0.39 Cir
NOTES: Intensity = 145.00 / (Inlet time + 20.00) ^ 0.93 (in/hr) ; Time of flow in section is based on full flow.
Hydraflow Storm Sewers 2003

FL-DOT Report Page 2
Line To Type n - Len Drainage Area Time Time Inten Total Add Inlet Elev of HGL Rise HGL Actual Date: 09-16-2020No Line of value of of (I) CA Q elev
struc C1 = 0.2 conc flow Elev of Crown Span Pipe Full Flow Frequency: 5 yrsC2 = 0.5 in TotalC3 = 0.9 sect flow Elev of Invert Proj: New Alachua Total.stm
Incre- Sub- Sum Q Up Down Fall Size Slope Vel Capment total CA
(ft) (ac) (ac) (min) (min) (in/hr) (cfs) (ft) (ft) (ft) (ft) (in) (%) (ft/s) (cfs) Line description
11 9 Grate 0.013 7.0 0.08 0.13 0.03 10.24 0.02 6.1 0.94 0.00 9.48 23.08 23.02 0.06 15 0.79 4.68 5.74 S-110.00 0.00 0.00 5.74 7.35 7.27 15 1.14 5.63 6.900.62 1.02 0.92 6.10 6.02 0.08 Cir
12 11 Grate 0.013 26.0 0.05 0.05 0.01 10.00 0.23 6.1 0.37 0.00 10.02 23.54 23.50 0.03 15 0.12 1.84 2.26 S-120.00 0.00 0.00 2.26 7.87 7.48 15 1.50 6.44 7.910.40 0.40 0.36 6.62 6.23 0.39 Cir
13 9 MH 0.013 176.0 0.00 0.11 0.02 10.26 0.58 6.1 1.01 0.00 9.01 24.62 23.02 1.59 15 0.91 5.01 6.15 S-130.00 0.00 0.00 6.15 7.05 6.52 15 0.30 2.89 3.540.00 1.10 0.99 5.80 5.27 0.53 Cir
14 13 Grate 0.013 29.0 0.08 0.08 0.02 10.00 0.26 6.1 0.37 0.00 9.18 25.04 25.01 0.04 15 0.12 1.83 2.25 S-140.00 0.00 0.00 2.25 7.65 7.40 15 0.86 4.89 6.000.39 0.39 0.35 6.40 6.15 0.25 Cir
15 13 Curb 0.013 9.0 0.03 0.03 0.01 10.00 0.05 6.1 0.64 0.00 8.75 25.04 25.01 0.03 15 0.37 3.22 3.95 S-150.00 0.00 0.00 3.95 7.62 7.40 15 2.44 8.23 10.100.71 0.71 0.64 6.37 6.15 0.22 Cir
16 5 Curb 0.013 41.0 1.60 1.60 0.32 42.00 0.17 3.1 1.60 0.00 10.74 13.10 12.86 0.24 15 0.60 4.06 4.98 S-160.00 0.00 0.00 4.98 7.75 7.50 15 0.61 4.11 5.041.41 1.41 1.27 6.50 6.25 0.25 Cir
17 5 MH 0.013 279.0 0.00 3.11 0.62 34.89 0.62 3.5 3.74 0.00 14.41 17.19 12.86 4.33 18 1.55 7.40 13.08 S-170.00 0.00 0.00 13.08 8.62 6.12 18 0.90 5.63 9.940.00 3.47 3.12 7.12 4.62 2.50 Cir
18 17 Curb 0.013 22.0 0.04 0.04 0.01 10.00 0.45 6.1 0.16 0.00 13.87 18.04 18.04 0.01 15 0.02 0.81 0.99 S-180.00 0.00 0.00 0.99 10.25 10.11 15 0.64 4.20 5.150.17 0.17 0.15 9.00 8.86 0.14 Cir
19 17 MH 0.013 54.0 0.00 0.41 0.08 14.00 0.14 5.5 1.41 0.00 13.91 18.80 18.04 0.76 15 1.42 6.26 7.68 S-190.00 0.00 0.00 7.68 8.85 8.38 15 0.87 4.91 6.020.00 1.47 1.32 7.60 7.13 0.47 Cir
20 19 Grate 0.013 24.0 0.03 0.03 0.01 10.00 0.39 6.1 0.21 0.00 13.02 19.42 19.41 0.01 15 0.04 1.02 1.26 S-200.00 0.00 0.00 1.26 11.98 12.31 15 -1.38 0.00 0.000.22 0.22 0.20 10.73 11.06 -0.33 Cir
NOTES: Intensity = 145.00 / (Inlet time + 20.00) ^ 0.93 (in/hr) ; Time of flow in section is based on full flow.
Hydraflow Storm Sewers 2003

FL-DOT Report Page 3
Line To Type n - Len Drainage Area Time Time Inten Total Add Inlet Elev of HGL Rise HGL Actual Date: 09-16-2020No Line of value of of (I) CA Q elev
struc C1 = 0.2 conc flow Elev of Crown Span Pipe Full Flow Frequency: 5 yrsC2 = 0.5 in TotalC3 = 0.9 sect flow Elev of Invert Proj: New Alachua Total.stm
Incre- Sub- Sum Q Up Down Fall Size Slope Vel Capment total CA
(ft) (ac) (ac) (min) (min) (in/hr) (cfs) (ft) (ft) (ft) (ft) (in) (%) (ft/s) (cfs) Line description
21 19 MH 0.013 136.0 0.00 0.38 0.08 13.43 0.57 5.5 1.20 0.00 13.04 19.96 19.41 0.55 18 0.40 3.77 6.67 S-210.00 0.00 0.00 6.67 9.35 9.10 18 0.18 2.55 4.500.00 1.25 1.13 7.85 7.60 0.25 Cir
22 21 Grate 0.013 25.0 0.33 0.33 0.07 10.00 0.13 6.1 0.64 0.00 12.37 20.27 20.18 0.09 15 0.37 3.20 3.93 S-220.00 0.00 0.00 3.93 11.13 11.18 15 -0.20 0.00 0.000.64 0.64 0.58 9.88 9.93 -0.05 Cir
23 21 MH 0.013 213.0 0.00 0.05 0.01 12.16 1.27 5.7 0.56 0.00 12.04 20.71 20.18 0.53 15 0.25 2.63 3.23 S-230.00 0.00 0.00 3.23 11.15 9.10 15 0.96 5.16 6.340.00 0.61 0.55 9.90 7.85 2.05 Cir
24 23 Curb 0.013 22.0 0.04 0.04 0.01 10.00 0.14 6.1 0.54 0.00 11.27 20.88 20.82 0.06 15 0.27 2.71 3.32 S-240.00 0.00 0.00 3.32 10.91 10.55 15 1.64 6.73 8.260.59 0.59 0.53 9.66 9.30 0.36 Cir
25 23 Curb 0.013 13.0 0.01 0.01 0.00 10.00 2.16 6.1 0.02 0.00 12.38 20.82 20.82 0.00 15 0.00 0.10 0.12 S-250.00 0.00 0.00 0.12 11.18 10.75 15 3.31 9.57 11.740.02 0.02 0.02 9.93 9.50 0.43 Cir
26 17 Curb 0.013 41.0 1.60 1.60 0.32 22.00 0.14 4.5 1.35 0.00 14.18 18.40 18.04 0.36 15 0.88 4.92 6.04 S-260.00 0.00 0.00 6.04 10.24 9.69 15 1.34 6.09 7.481.15 1.15 1.04 8.99 8.44 0.55 Cir
27 17 MH 0.013 265.0 0.00 1.06 0.21 32.30 2.59 3.7 0.82 0.00 18.92 18.26 18.04 0.22 18 0.08 1.70 3.01 S-270.00 0.00 0.00 3.01 15.70 9.08 18 2.50 9.39 16.600.00 0.68 0.61 14.20 7.58 6.62 Cir
28 27 Curb 0.013 41.0 1.00 1.00 0.20 32.00 0.30 3.7 0.77 0.00 18.14 18.38 18.30 0.08 15 0.19 2.30 2.82 S-280.00 0.00 0.00 2.82 15.44 15.05 15 0.95 5.13 6.300.63 0.63 0.57 14.19 13.80 0.39 Cir
29 27 Curb 0.013 21.0 0.06 0.06 0.01 10.00 1.22 6.1 0.06 0.00 18.12 18.30 18.30 0.00 15 0.00 0.29 0.35 S-290.00 0.00 0.00 0.35 15.25 15.05 15 0.95 5.14 6.300.05 0.05 0.05 14.00 13.80 0.20 Cir
30 4 Grate 0.013 70.0 0.19 0.19 0.04 10.00 0.56 6.1 0.41 0.00 8.23 9.19 9.08 0.11 15 0.16 2.07 2.54 S-300.00 0.00 0.00 2.54 6.35 5.25 15 1.57 6.60 8.090.42 0.42 0.38 5.10 4.00 1.10 Cir
NOTES: Intensity = 145.00 / (Inlet time + 20.00) ^ 0.93 (in/hr) ; Time of flow in section is based on full flow.
Hydraflow Storm Sewers 2003

FL-DOT Report Page 4
Line To Type n - Len Drainage Area Time Time Inten Total Add Inlet Elev of HGL Rise HGL Actual Date: 09-16-2020No Line of value of of (I) CA Q elev
struc C1 = 0.2 conc flow Elev of Crown Span Pipe Full Flow Frequency: 5 yrsC2 = 0.5 in TotalC3 = 0.9 sect flow Elev of Invert Proj: New Alachua Total.stm
Incre- Sub- Sum Q Up Down Fall Size Slope Vel Capment total CA
(ft) (ac) (ac) (min) (min) (in/hr) (cfs) (ft) (ft) (ft) (ft) (in) (%) (ft/s) (cfs) Line description
31 End Grate 0.013 30.0 0.00 1.08 0.22 12.57 0.07 5.7 1.59 0.00 5.40 3.83 3.25 0.58 15 1.95 7.34 9.01 New S-30.00 0.00 0.00 9.01 1.30 0.35 15 3.17 9.36 11.490.13 1.52 1.37 0.05 -0.90 0.95 Cir
32 31 Grate 0.013 90.0 0.00 0.00 0.00 10.00 2.57 6.1 0.12 0.00 4.00 5.10 5.09 0.01 15 0.01 0.58 0.72 New S-10.00 0.00 0.00 0.72 1.75 1.50 15 0.28 2.77 3.400.13 0.13 0.11 0.50 0.25 0.25 Cir
33 31 Grate 0.013 81.0 0.00 1.08 0.22 10.81 0.21 6.0 1.35 0.00 6.10 6.36 5.09 1.27 15 1.57 6.59 8.08 New S-50.00 0.00 0.00 8.08 3.85 3.60 15 0.31 2.92 3.590.03 1.27 1.14 2.60 2.35 0.25 Cir
34 33 Comb 0.013 54.0 0.26 1.08 0.22 10.61 0.20 6.0 1.32 0.00 6.60 7.01 6.70 0.31 18 0.58 4.51 7.97 S-330.00 0.00 0.00 7.97 5.89 5.75 18 0.26 3.03 5.350.09 1.24 1.12 4.39 4.25 0.14 Cir
35 34 Grate 0.013 115.0 0.12 0.82 0.16 10.14 0.47 6.1 1.19 0.00 6.43 8.04 7.48 0.55 18 0.48 4.12 7.27 S-340.00 0.00 0.00 7.27 6.50 5.89 18 0.53 4.33 7.650.19 1.15 1.04 5.00 4.39 0.61 Cir
36 35 Grate 0.013 30.0 0.70 0.70 0.14 10.00 0.14 6.1 1.00 0.00 6.08 8.53 8.43 0.10 18 0.34 3.46 6.11 S-350.00 0.00 0.00 6.11 6.80 6.50 18 1.00 5.94 10.500.96 0.96 0.86 5.30 5.00 0.30 Cir
NOTES: Intensity = 145.00 / (Inlet time + 20.00) ^ 0.93 (in/hr) ; Time of flow in section is based on full flow.
Hydraflow Storm Sewers 2003

Hydraflow Results
10-Year Storm

FL-DOT Report Page 1
Line To Type n - Len Drainage Area Time Time Inten Total Add Inlet Elev of HGL Rise HGL Actual Date: 09-16-2020No Line of value of of (I) CA Q elev
struc C1 = 0.2 conc flow Elev of Crown Span Pipe Full Flow Frequency: 10 yrsC2 = 0.5 in TotalC3 = 0.9 sect flow Elev of Invert Proj: New Alachua Total.stm
Incre- Sub- Sum Q Up Down Fall Size Slope Vel Capment total CA
(ft) (ac) (ac) (min) (min) (in/hr) (cfs) (ft) (ft) (ft) (ft) (in) (%) (ft/s) (cfs) Line description
1 End Grate 0.013 88.0 1.84 7.72 1.54 42.84 0.12 3.5 11.04 0.00 6.10 5.81 3.25 2.56 24 2.90 12.27 38.53 S-10.00 0.00 0.00 38.53 2.73 1.10 24 1.85 9.80 30.781.29 10.55 9.50 0.73 -0.90 1.63 Cir
2 1 MH 0.013 71.0 0.00 5.88 1.18 42.72 0.11 3.5 9.50 0.00 7.00 8.51 6.98 1.53 24 2.16 10.58 33.23 S-20.00 0.00 0.00 33.23 3.93 2.73 24 1.69 9.36 29.400.00 9.26 8.33 1.93 0.73 1.20 Cir
3 2 Curb 0.013 50.0 0.24 0.24 0.05 10.00 0.25 6.8 0.60 0.00 6.78 10.19 9.99 0.20 15 0.40 3.33 4.09 S-30.00 0.00 0.00 4.09 4.67 3.74 15 1.86 7.18 8.810.62 0.62 0.56 3.42 2.49 0.93 Cir
4 2 Curb 0.013 24.0 0.43 0.62 0.12 10.51 0.07 6.7 1.12 0.00 6.94 10.31 9.99 0.32 15 1.35 6.11 7.49 S-40.00 0.00 0.00 7.49 4.00 3.60 15 1.67 6.79 8.340.69 1.11 1.00 2.75 2.35 0.40 Cir
5 2 MH 0.013 300.0 0.00 5.02 1.00 42.15 0.57 3.5 7.78 0.00 11.00 14.40 9.99 4.42 24 1.47 8.73 27.44 S-50.00 0.00 0.00 27.44 6.56 3.97 24 0.86 6.69 21.020.00 7.53 6.78 4.56 1.97 2.59 Cir
6 5 Curb 0.013 18.0 0.04 0.04 0.01 10.00 0.17 6.8 0.32 0.00 10.16 15.61 15.59 0.02 15 0.11 1.75 2.14 S-60.00 0.00 0.00 2.14 8.71 6.40 15 12.83 18.85 23.130.34 0.34 0.31 7.46 5.15 2.31 Cir
7 5 MH 0.013 39.0 0.00 0.27 0.05 11.61 0.06 6.5 2.13 0.00 10.45 17.37 15.59 1.78 15 4.57 11.25 13.81 S-70.00 0.00 0.00 13.81 6.09 5.93 15 0.41 3.37 4.140.00 2.31 2.08 4.84 4.68 0.16 Cir
8 7 Grate 0.013 9.0 0.01 0.01 0.00 10.00 0.23 6.8 0.12 0.00 9.79 19.34 19.34 0.00 15 0.02 0.66 0.81 S-80.00 0.00 0.00 0.81 8.54 7.90 15 7.11 14.03 17.220.13 0.13 0.12 7.29 6.65 0.64 Cir
9 7 MH 0.013 171.0 0.00 0.26 0.05 11.34 0.27 6.5 2.01 0.00 9.97 26.42 19.34 7.08 15 4.14 10.70 13.14 S-90.00 0.00 0.00 13.14 6.48 6.13 15 0.20 2.38 2.920.00 2.18 1.96 5.23 4.88 0.35 Cir
10 9 Grate 0.013 26.0 0.02 0.02 0.00 10.00 1.34 6.8 0.06 0.00 10.00 28.20 28.20 0.00 15 0.00 0.32 0.40 S-100.00 0.00 0.00 0.40 6.90 6.51 15 1.50 6.44 7.910.06 0.06 0.05 5.65 5.26 0.39 Cir
NOTES: Intensity = 145.00 / (Inlet time + 20.00) ^ 0.90 (in/hr) ; Time of flow in section is based on full flow.
Hydraflow Storm Sewers 2003

FL-DOT Report Page 2
Line To Type n - Len Drainage Area Time Time Inten Total Add Inlet Elev of HGL Rise HGL Actual Date: 09-16-2020No Line of value of of (I) CA Q elev
struc C1 = 0.2 conc flow Elev of Crown Span Pipe Full Flow Frequency: 10 yrsC2 = 0.5 in TotalC3 = 0.9 sect flow Elev of Invert Proj: New Alachua Total.stm
Incre- Sub- Sum Q Up Down Fall Size Slope Vel Capment total CA
(ft) (ac) (ac) (min) (min) (in/hr) (cfs) (ft) (ft) (ft) (ft) (in) (%) (ft/s) (cfs) Line description
11 9 Grate 0.013 7.0 0.08 0.13 0.03 10.21 0.02 6.7 0.94 0.00 9.48 28.27 28.20 0.07 15 0.97 5.19 6.36 S-110.00 0.00 0.00 6.36 7.35 7.27 15 1.14 5.63 6.900.62 1.02 0.92 6.10 6.02 0.08 Cir
12 11 Grate 0.013 26.0 0.05 0.05 0.01 10.00 0.21 6.8 0.37 0.00 10.02 28.83 28.79 0.04 15 0.15 2.04 2.51 S-120.00 0.00 0.00 2.51 7.87 7.48 15 1.50 6.44 7.910.40 0.40 0.36 6.62 6.23 0.39 Cir
13 9 MH 0.013 176.0 0.00 0.11 0.02 10.24 0.53 6.7 1.01 0.00 9.01 30.16 28.20 1.96 15 1.11 5.55 6.81 S-130.00 0.00 0.00 6.81 7.05 6.52 15 0.30 2.89 3.540.00 1.10 0.99 5.80 5.27 0.53 Cir
14 13 Grate 0.013 29.0 0.08 0.08 0.02 10.00 0.24 6.8 0.37 0.00 9.18 30.68 30.64 0.04 15 0.15 2.03 2.49 S-140.00 0.00 0.00 2.49 7.65 7.40 15 0.86 4.89 6.000.39 0.39 0.35 6.40 6.15 0.25 Cir
15 13 Curb 0.013 9.0 0.03 0.03 0.01 10.00 0.04 6.8 0.64 0.00 8.75 30.68 30.64 0.04 15 0.46 3.56 4.37 S-150.00 0.00 0.00 4.37 7.62 7.40 15 2.44 8.23 10.100.71 0.71 0.64 6.37 6.15 0.22 Cir
16 5 Curb 0.013 41.0 1.60 1.60 0.32 42.00 0.15 3.5 1.60 0.00 10.74 15.90 15.59 0.31 15 0.76 4.59 5.64 S-160.00 0.00 0.00 5.64 7.75 7.50 15 0.61 4.11 5.041.41 1.41 1.27 6.50 6.25 0.25 Cir
17 5 MH 0.013 279.0 0.00 3.11 0.62 34.57 0.55 4.0 3.74 0.00 14.41 21.15 15.59 5.56 18 1.99 8.39 14.82 S-170.00 0.00 0.00 14.82 8.62 6.12 18 0.90 5.63 9.940.00 3.47 3.12 7.12 4.62 2.50 Cir
18 17 Curb 0.013 22.0 0.04 0.04 0.01 10.00 0.41 6.8 0.16 0.00 13.87 22.25 22.25 0.01 15 0.03 0.89 1.10 S-180.00 0.00 0.00 1.10 10.25 10.11 15 0.64 4.20 5.150.17 0.17 0.15 9.00 8.86 0.14 Cir
19 17 MH 0.013 54.0 0.00 0.41 0.08 13.61 0.12 6.1 1.41 0.00 13.91 23.21 22.25 0.96 15 1.79 7.03 8.63 S-190.00 0.00 0.00 8.63 8.85 8.38 15 0.87 4.91 6.020.00 1.47 1.32 7.60 7.13 0.47 Cir
20 19 Grate 0.013 24.0 0.03 0.03 0.01 10.00 0.35 6.8 0.21 0.00 13.02 23.99 23.98 0.01 15 0.05 1.13 1.39 S-200.00 0.00 0.00 1.39 11.98 12.31 15 -1.38 0.00 0.000.22 0.22 0.20 10.73 11.06 -0.33 Cir
NOTES: Intensity = 145.00 / (Inlet time + 20.00) ^ 0.90 (in/hr) ; Time of flow in section is based on full flow.
Hydraflow Storm Sewers 2003

FL-DOT Report Page 3
Line To Type n - Len Drainage Area Time Time Inten Total Add Inlet Elev of HGL Rise HGL Actual Date: 09-16-2020No Line of value of of (I) CA Q elev
struc C1 = 0.2 conc flow Elev of Crown Span Pipe Full Flow Frequency: 10 yrsC2 = 0.5 in TotalC3 = 0.9 sect flow Elev of Invert Proj: New Alachua Total.stm
Incre- Sub- Sum Q Up Down Fall Size Slope Vel Capment total CA
(ft) (ac) (ac) (min) (min) (in/hr) (cfs) (ft) (ft) (ft) (ft) (in) (%) (ft/s) (cfs) Line description
21 19 MH 0.013 136.0 0.00 0.38 0.08 13.09 0.51 6.2 1.20 0.00 13.04 24.67 23.98 0.69 18 0.51 4.23 7.47 S-210.00 0.00 0.00 7.47 9.35 9.10 18 0.18 2.55 4.500.00 1.25 1.13 7.85 7.60 0.25 Cir
22 21 Grate 0.013 25.0 0.33 0.33 0.07 10.00 0.12 6.8 0.64 0.00 12.37 25.06 24.95 0.11 15 0.45 3.54 4.35 S-220.00 0.00 0.00 4.35 11.13 11.18 15 -0.20 0.00 0.000.64 0.64 0.58 9.88 9.93 -0.05 Cir
23 21 MH 0.013 213.0 0.00 0.05 0.01 11.95 1.15 6.4 0.56 0.00 12.04 25.61 24.95 0.66 15 0.31 2.94 3.61 S-230.00 0.00 0.00 3.61 11.15 9.10 15 0.96 5.16 6.340.00 0.61 0.55 9.90 7.85 2.05 Cir
24 23 Curb 0.013 22.0 0.04 0.04 0.01 10.00 0.12 6.8 0.54 0.00 11.27 25.82 25.74 0.07 15 0.33 3.00 3.68 S-240.00 0.00 0.00 3.68 10.91 10.55 15 1.64 6.73 8.260.59 0.59 0.53 9.66 9.30 0.36 Cir
25 23 Curb 0.013 13.0 0.01 0.01 0.00 10.00 1.95 6.8 0.02 0.00 12.38 25.74 25.74 0.00 15 0.00 0.11 0.14 S-250.00 0.00 0.00 0.14 11.18 10.75 15 3.31 9.57 11.740.02 0.02 0.02 9.93 9.50 0.43 Cir
26 17 Curb 0.013 41.0 1.60 1.60 0.32 22.00 0.12 5.0 1.35 0.00 14.18 22.69 22.25 0.45 15 1.10 5.51 6.76 S-260.00 0.00 0.00 6.76 10.24 9.69 15 1.34 6.09 7.481.15 1.15 1.04 8.99 8.44 0.55 Cir
27 17 MH 0.013 265.0 0.00 1.06 0.21 32.26 2.30 4.1 0.82 0.00 18.92 22.52 22.25 0.28 18 0.10 1.92 3.39 S-270.00 0.00 0.00 3.39 15.70 9.08 18 2.50 9.39 16.600.00 0.68 0.61 14.20 7.58 6.62 Cir
28 27 Curb 0.013 41.0 1.00 1.00 0.20 32.00 0.26 4.1 0.77 0.00 18.14 22.68 22.58 0.10 15 0.24 2.58 3.17 S-280.00 0.00 0.00 3.17 15.44 15.05 15 0.95 5.13 6.300.63 0.63 0.57 14.19 13.80 0.39 Cir
29 27 Curb 0.013 21.0 0.06 0.06 0.01 10.00 1.11 6.8 0.06 0.00 18.12 22.58 22.58 0.00 15 0.00 0.32 0.39 S-290.00 0.00 0.00 0.39 15.25 15.05 15 0.95 5.14 6.300.05 0.05 0.05 14.00 13.80 0.20 Cir
30 4 Grate 0.013 70.0 0.19 0.19 0.04 10.00 0.51 6.8 0.41 0.00 8.23 10.85 10.72 0.13 15 0.19 2.30 2.82 S-300.00 0.00 0.00 2.82 6.35 5.25 15 1.57 6.60 8.090.42 0.42 0.38 5.10 4.00 1.10 Cir
NOTES: Intensity = 145.00 / (Inlet time + 20.00) ^ 0.90 (in/hr) ; Time of flow in section is based on full flow.
Hydraflow Storm Sewers 2003

FL-DOT Report Page 4
Line To Type n - Len Drainage Area Time Time Inten Total Add Inlet Elev of HGL Rise HGL Actual Date: 09-16-2020No Line of value of of (I) CA Q elev
struc C1 = 0.2 conc flow Elev of Crown Span Pipe Full Flow Frequency: 10 yrsC2 = 0.5 in TotalC3 = 0.9 sect flow Elev of Invert Proj: New Alachua Total.stm
Incre- Sub- Sum Q Up Down Fall Size Slope Vel Capment total CA
(ft) (ac) (ac) (min) (min) (in/hr) (cfs) (ft) (ft) (ft) (ft) (in) (%) (ft/s) (cfs) Line description
31 End Grate 0.013 30.0 0.00 1.08 0.22 12.32 0.06 6.4 1.59 0.00 5.40 3.98 3.25 0.73 15 2.43 8.21 10.07 New S-30.00 0.00 0.00 10.07 1.30 0.35 15 3.17 9.36 11.490.13 1.52 1.37 0.05 -0.90 0.95 Cir
32 31 Grate 0.013 90.0 0.00 0.00 0.00 10.00 2.32 6.8 0.12 0.00 4.00 5.56 5.55 0.01 15 0.02 0.65 0.79 New S-10.00 0.00 0.00 0.79 1.75 1.50 15 0.28 2.77 3.400.13 0.13 0.11 0.50 0.25 0.25 Cir
33 31 Grate 0.013 81.0 0.00 1.08 0.22 10.73 0.19 6.6 1.35 0.00 6.10 7.12 5.55 1.57 15 1.93 7.32 8.98 New S-50.00 0.00 0.00 8.98 3.85 3.60 15 0.31 2.92 3.590.03 1.27 1.14 2.60 2.35 0.25 Cir
34 33 Comb 0.013 54.0 0.26 1.08 0.22 10.55 0.18 6.7 1.32 0.00 6.60 7.92 7.53 0.38 18 0.71 5.01 8.85 S-330.00 0.00 0.00 8.85 5.89 5.75 18 0.26 3.03 5.350.09 1.24 1.12 4.39 4.25 0.14 Cir
35 34 Grate 0.013 115.0 0.12 0.82 0.16 10.13 0.42 6.8 1.19 0.00 6.43 9.18 8.50 0.68 18 0.59 4.56 8.06 S-340.00 0.00 0.00 8.06 6.50 5.89 18 0.53 4.33 7.650.19 1.15 1.04 5.00 4.39 0.61 Cir
36 35 Grate 0.013 30.0 0.70 0.70 0.14 10.00 0.13 6.8 1.00 0.00 6.08 9.79 9.66 0.12 18 0.42 3.83 6.76 S-350.00 0.00 0.00 6.76 6.80 6.50 18 1.00 5.94 10.500.96 0.96 0.86 5.30 5.00 0.30 Cir
NOTES: Intensity = 145.00 / (Inlet time + 20.00) ^ 0.90 (in/hr) ; Time of flow in section is based on full flow.
Hydraflow Storm Sewers 2003

Appendix C
SewerCAD Results

Scenario: Base
P-9
P-8
P-7
P-4CO-6
CO-5
CO-4
CO-1
CO-10
J-1
W-1
PMP-3PMP-2
PMP-1O-2
O-3
MH-2 (S-14)MH-4 (S-11)
MH-6
MH-5
MH-1
Page 1 of 127 Siemon Company Drive Suite 200 W Watertown, CT 06795 USA +1-203-755-1666
8/19/2020
SewerCAD[10.03.01.08]Bentley Systems, Inc. Haestad Methods Solution CenterStormwater Diversion Lift Station 10-9-19.stsw

Profile Report
Profile: Profile - 2
Page 1 of 127 Siemon Company Drive Suite 200 W Watertown, CT 06795 USA +1-203-755-1666
9/16/2020
SewerCAD[10.03.01.08]Bentley Systems, Inc. Haestad Methods Solution CenterStormwater Diversion Lift Station 10-9-19.stsw
InletExisting

Profile Report
Profile: Profile - 2
Ele
va
tio
n (
ft)
Page 1 of 127 Siemon Company Drive Suite 200 W Watertown, CT 06795 USA +1-203-755-1666
9/16/2020
SewerCAD[10.03.01.08]Bentley Systems, Inc. Haestad Methods Solution CenterStormwater Diversion Lift Station 10-9-19.stsw
Existing Inlet

Profile Report
Profile: Profile - 2
Page 1 of 127 Siemon Company Drive Suite 200 W Watertown, CT 06795 USA +1-203-755-1666
9/16/2020
SewerCAD[10.03.01.08]Bentley Systems, Inc. Haestad Methods Solution CenterStormwater Diversion Lift Station 10-9-19.stsw
Existing Inlet

Profile Report
Profile: Profile - 2
Page 1 of 127 Siemon Company Drive Suite 200 W Watertown, CT 06795 USA +1-203-755-1666
9/16/2020
SewerCAD[10.03.01.08]Bentley Systems, Inc. Haestad Methods Solution CenterStormwater Diversion Lift Station 10-9-19.stsw
Existing Inlet

Profile Report
Profile: Profile - 2
Page 1 of 127 Siemon Company Drive Suite 200 W Watertown, CT 06795 USA +1-203-755-1666
9/16/2020
SewerCAD[10.03.01.08]Bentley Systems, Inc. Haestad Methods Solution CenterStormwater Diversion Lift Station 10-9-19.stsw
InletExisting

Profile Report
Profile: Profile - 2
Page 1 of 127 Siemon Company Drive Suite 200 W Watertown, CT 06795 USA +1-203-755-1666
9/16/2020
SewerCAD[10.03.01.08]Bentley Systems, Inc. Haestad Methods Solution CenterStormwater Diversion Lift Station 10-9-19.stsw
Existing Inlet

Appendix D
Pump Manufacturer Sheets
Shrouded single or multi-channel impeller pumps with large throughletsand single volute pump casing for liquids containing solids and fibres.Cast iron design with double sealing technology.
Head
1430 430mm
80.3%
0
1
2
3
4
5
6
7
8
9
10
11
12
13
14
15
16
17
18
19
20
21
22
23
24
25
26
27
28
29
30
[ft]
0 2000 4000 6000 8000 [US g.p.m.]
CP 3400/705 3~ 1430
430 mm
Number of blades
3
Technical specification
P - Semi permanent, Wet
Configuration
15 3/4 inch
Impeller diameter
430 mm
Discharge diameter15 3/4 inch
Motor number Installation type
C0705.000 43-30-14GA-W60hp
Inlet diameter
Maximum operating speed
Throughlet diameter
500 rpm
Materials
Curves according to:
Pump information
Discharge diameter
500 mm
Impeller diameter
Impeller
4 5/16 inch
Grey cast iron
Water, pure [100%],39.2 °F,62.42 lb/ft³,1.6891E-5 ft²/s
Curve: ISO 9906
Last update
Created on 10/16/2019
Created byProject
Block

CP 3400/705 3~ 1430Technical specification
Motor - General
Frequency Rated voltage
Rated powerRated speed
Rated current
460 V
60 hp500 rpm
121 A
3~C0705.000 43-30-14GA-W60hp
Phases
Total moment of inertia
154 lb ft²
Power factor - 1/1 Load
0.53
0.46
0.35
87.0 %
87.0 %
85.0 %
Motor number
Approval
60 Hz
Number of poles
14
Stator variant
1
Insulation class
H
Type of Duty
Motor - Technical
Power factor - 3/4 Load
Power factor - 1/2 Load
Motor efficiency - 1/1 Load
Motor efficiency - 3/4 Load
Motor efficiency - 1/2 Load
Starting current, direct starting
Starting current, star-delta
355 A
118 A
S1
Starts per hour max.
15
No
Last update
Created on 10/16/2019
Created byProject
Block
CP 3400/705 3~ 1430Performance curve
Duty point
15.1 ft6020 US g.p.m.HeadFlow
Curves according to:
Head
Pump EfficiencyOverall Efficiency
Power input P1Shaft power P2
NPSH-values
1430 430mm
80.3%
15.1 ft
79.2 %
67.1 %
29 hp
34.2 hp
5.9 ft
6017.3 US g.p.m.
1430 430mm
15.1 ft
79.2 %
67.1 %
29 hp
34.2 hp
5.9 ft
6017.3 US g.p.m.
1430 430mm
15.1 ft
79.2 %
67.1 %
29 hp
34.2 hp
5.9 ft
6017.3 US g.p.m.
1430 430mm (P2)
15.1 ft
79.2 %
67.1 %
29 hp
34.2 hp
5.9 ft
6017.3 US g.p.m.
1430 430mm (P1)
15.1 ft
79.2 %
67.1 %
29 hp
34.2 hp
5.9 ft
6017.3 US g.p.m.
1430 430mm
15.1 ft
79.2 %
67.1 %
29 hp
34.2 hp
5.9 ft
6017.3 US g.p.m.
0
1
2
3
4
5
6
7
8
9
10
11
12
13
14
15
16
17
18
19
20
21
22
23
24
25
26
27
28
29
30
[ft]
0
10
20
30
40
50
60
70
[%]
16
20
24
28
[hp]
4
6
8
10
12
14
[ft]
0 1000 2000 3000 4000 5000 6000 7000 8000 9000 [US g.p.m.]
Water, pure [100%],39.2 °F,62.42 lb/ft³,1.6891E-5 ft²/s
Curve: ISO 9906
Last update
Created on 10/16/2019
Created byProject
Block

Pumps/Systems Flow Head Shaft power Flow Head Shaft power Hydr.eff. Specific energy NPSHr
3 / 1 6020 US g.p.m. 15.1 ft 29 hp 18100 US g.p.m. 15.1 ft 86.9 hp 79.2 % 70.6 kWh/US MG 5.9 ft
2 / 1 7590 US g.p.m. 10.7 ft 29 hp 15200 US g.p.m. 10.7 ft 58 hp 70.7 % 56 kWh/US MG 8.33 ft
1 / 1 9370 US g.p.m. 4.06 ft 25.5 hp 9370 US g.p.m. 4.06 ft 25.5 hp 37.8 % 40.5 kWh/US MG 16.7 ft
CP 3400/705 3~ 1430Duty Analysis
Curves according to:
Head
1430 430mm [Pump 1+2]
1430 430mm [Pump 1+2+3]
1430 430mm [Pump 1]
80.3%
15.1 ft
18052 US g.p.m.0
1
2
3
4
5
6
7
8
9
10
11
12
13
14
15
16
17
18
19
20
21
22
23
24
25
26
27
28
29
30
[ft]
0 4000 8000 12000 16000 20000 24000 28000 [US g.p.m.]
1
1
1
Operating characteristics
Water, pure [100%],39.2 °F,62.42 lb/ft³,1.6891E-5 ft²/s
Curve: ISO 9906
Last update
Created on 10/16/2019
Created byProject
Block

Head
Pump Efficiency
Overall Eff iciency
Pow er input P1
Shaft pow er P2
NPSH-values
55 Hz 55 Hz55 Hz
80.3%
50 Hz 50 Hz50 Hz
80.3%
45 Hz 45 Hz45 Hz
80.3%
40 Hz 40 Hz40 Hz
80.3%
1430 430mm [Pump 1+2]
1430 430mm [Pump 1+2+3]
1430 430mm [Pump 1]
80.3%
55 Hz 55 Hz55 Hz 50 Hz 50 Hz50 Hz 45 Hz 45 Hz45 Hz 40 Hz 40 Hz40 Hz 1430 430mm [Pump 1+2]
1430 430mm [Pump 1+2+3]
1430 430mm [Pump 1]55 Hz 55 Hz55 Hz 50 Hz 50 Hz50 Hz 45 Hz 45 Hz45 Hz 40 Hz 40 Hz40 Hz
1430 430mm [Pump 1+2]
1430 430mm [Pump 1+2+3]
1430 430mm [Pump 1]
55 Hz
55 Hz
55 Hz50 Hz
50 Hz
50 Hz45 Hz
45 Hz
45 Hz 40 Hz40 Hz
40 Hz
1430 430mm [Pump 1+2] (P2)
1430 430mm [Pump 1+2+3] (P2)
1430 430mm [Pump 1] (P2)
55 Hz
55 Hz
55 Hz
50 Hz
50 Hz
50 Hz45 Hz
45 Hz
45 Hz40 Hz
40 Hz
40 Hz
1430 430mm [Pump 1+2] (P1)
1430 430mm [Pump 1+2+3] (P1)
1430 430mm [Pump 1] (P1)
55 Hz 55 Hz55 Hz
50 Hz 50 Hz50 Hz
45 Hz 45 Hz45 Hz40 Hz 40 Hz40 Hz
1430 430mm [Pump 1+2]
1430 430mm [Pump 1+2+3]
1430 430mm [Pump 1]
0
2
4
6
8
10
12
14
16
18
20
22
24
26
28
[ft]
010203040506070
[%]
0
20
40
60
80
[hp]
4
6
8
10
12
14
[ft]
0 4000 8000 12000 16000 20000 24000 28000 [US g.p.m.]
CP 3400/705 3~ 1430VFD Curve
Curves according to: Water, pure [100%],39.2 °F,62.42 lb/ft³,1.6891E-5 ft²/s
Curve: ISO 9906
Last update
Created on 10/16/2019
Created byProject
Block
Head
55 Hz 55 Hz55 Hz
80.3%
50 Hz 50 Hz50 Hz
80.3%
45 Hz 45 Hz45 Hz
80.3%
40 Hz 40 Hz40 Hz
80.3%
1430 430mm [Pump 1+2]
1430 430mm [Pump 1+2+3]
1430 430mm [Pump 1]
80.3%
15.1 ft
18052 US g.p.m.0
1
2
3
4
5
6
7
8
9
10
11
12
13
14
15
16
17
18
19
20
21
22
23
24
25
26
27
28
29
30
[ft]
0 4000 8000 12000 16000 20000 24000 28000 [US g.p.m.]
1
1
1
CP 3400/705 3~ 1430VFD Analysis
Curves according to:
Pumps/Systems Frequency Flow Head Shaft power Flow Head Shaft power Hydr.eff. Specific energy NPSHr
3 / 1 60 Hz 6020 US g.p.m. 15.1 ft 29 hp 18100 US g.p.m. 15.1 ft 86.9 hp 79.2 % 70.6 kWh/US MG 5.9 ft
3 / 1 55 Hz 5520 US g.p.m. 12.7 ft 22.3 hp 16500 US g.p.m. 12.7 ft 67 hp 79.2 % 61.1 kWh/US MG 5.14 ft
3 / 1 50 Hz 5010 US g.p.m. 10.5 ft 16.8 hp 15000 US g.p.m. 10.5 ft 50.3 hp 79.2 % 52.9 kWh/US MG 4.41 ft
3 / 1 45 Hz 4510 US g.p.m. 8.49 ft 12.2 hp 13500 US g.p.m. 8.49 ft 36.7 hp 79.2 % 45.8 kWh/US MG 3.72 ft
3 / 1 40 Hz 4010 US g.p.m. 6.71 ft 8.59 hp 12000 US g.p.m. 6.71 ft 25.8 hp 79.2 % 40 kWh/US MG 3.09 ft
2 / 1 60 Hz 7590 US g.p.m. 10.7 ft 29 hp 15200 US g.p.m. 10.7 ft 58 hp 70.7 % 56 kWh/US MG 8.33 ft
2 / 1 55 Hz 6960 US g.p.m. 8.97 ft 22.3 hp 13900 US g.p.m. 8.97 ft 44.7 hp 70.7 % 48.5 kWh/US MG 7.24 ft
Operating Characteristics
Water, pure [100%],39.2 °F,62.42 lb/ft³,1.6891E-5 ft²/s
Curve: ISO 9906
Last update
Created on 10/16/2019
Created byProject
Block

Head
55 Hz 55 Hz55 Hz
80.3%
50 Hz 50 Hz50 Hz
80.3%
45 Hz 45 Hz45 Hz
80.3%
40 Hz 40 Hz40 Hz
80.3%
1430 430mm [Pump 1+2]
1430 430mm [Pump 1+2+3]
1430 430mm [Pump 1]
80.3%
15.1 ft
18052 US g.p.m.0
1
2
3
4
5
6
7
8
9
10
11
12
13
14
15
16
17
18
19
20
21
22
23
24
25
26
27
28
29
30
[ft]
0 4000 8000 12000 16000 20000 24000 28000 [US g.p.m.]
1
1
1
CP 3400/705 3~ 1430VFD Analysis
Curves according to:
Pumps/Systems Frequency Flow Head Shaft power Flow Head Shaft power Hydr.eff. Specific energy NPSHr
2 / 1 50 Hz 6330 US g.p.m. 7.41 ft 16.8 hp 12700 US g.p.m. 7.41 ft 33.6 hp 70.7 % 42 kWh/US MG 6.22 ft
2 / 1 45 Hz 5690 US g.p.m. 6 ft 12.2 hp 11400 US g.p.m. 6 ft 24.5 hp 70.7 % 36.4 kWh/US MG 5.25 ft
2 / 1 40 Hz 5060 US g.p.m. 4.74 ft 8.59 hp 10100 US g.p.m. 4.74 ft 17.2 hp 70.7 % 31.8 kWh/US MG 4.35 ft
1 / 1 60 Hz 9370 US g.p.m. 4.06 ft 25.5 hp 9370 US g.p.m. 4.06 ft 25.5 hp 37.8 % 40.5 kWh/US MG 16.7 ft
1 / 1 55 Hz 8590 US g.p.m. 3.42 ft 19.7 hp 8590 US g.p.m. 3.42 ft 19.7 hp 37.8 % 35.2 kWh/US MG 14.5 ft
1 / 1 50 Hz 7810 US g.p.m. 2.82 ft 14.8 hp 7810 US g.p.m. 2.82 ft 14.8 hp 37.8 % 30.7 kWh/US MG 12.5 ft
1 / 1 45 Hz 7030 US g.p.m. 2.29 ft 10.8 hp 7030 US g.p.m. 2.29 ft 10.8 hp 37.8 % 26.8 kWh/US MG 10.5 ft
Operating Characteristics
Water, pure [100%],39.2 °F,62.42 lb/ft³,1.6891E-5 ft²/s
Curve: ISO 9906
Last update
Created on 10/16/2019
Created byProject
Block

Head
55 Hz 55 Hz55 Hz
80.3%
50 Hz 50 Hz50 Hz
80.3%
45 Hz 45 Hz45 Hz
80.3%
40 Hz 40 Hz40 Hz
80.3%
1430 430mm [Pump 1+2]
1430 430mm [Pump 1+2+3]
1430 430mm [Pump 1]
80.3%
15.1 ft
18052 US g.p.m.0
1
2
3
4
5
6
7
8
9
10
11
12
13
14
15
16
17
18
19
20
21
22
23
24
25
26
27
28
29
30
[ft]
0 4000 8000 12000 16000 20000 24000 28000 [US g.p.m.]
1
1
1
CP 3400/705 3~ 1430VFD Analysis
Curves according to:
Pumps/Systems Frequency Flow Head Shaft power Flow Head Shaft power Hydr.eff. Specific energy NPSHr
1 / 1 40 Hz 6250 US g.p.m. 1.81 ft 7.57 hp 6250 US g.p.m. 1.81 ft 7.57 hp 37.8 % 23.6 kWh/US MG 8.72 ft
Operating Characteristics
Water, pure [100%],39.2 °F,62.42 lb/ft³,1.6891E-5 ft²/s
Curve: ISO 9906
Last update
Created on 10/16/2019
Created byProject
Block

CP 3400/705 3~ 1430Dimensional drawing
CL
OF
DIS
CH
REF. LINE
GUIDE BARS
ZZ
(TO FURTHEST POINT)REF. LINE
REF. LINE
Z - ZVIEW* DIMENSION TO ENDS OF GUIDE BARS
CP,NP 3400 705/715/706/716
Weights (Lbs)
Drive unit Pump Disch
705 / 715 5625 1105
706 / 716 6065 1105
MAX. 2 CABLES 95-120mm²ADDITIONAL 335LbsRequired for 716 FM, allcables
878
2058
4238
3"5516
Ø16"
2815 16
225 8 33 8
Ø 1"(4x)
2018
153 4
311 2
3112
15°
33 8
811 8
2"
181 8
4558
2"
395 8
925 8
2312
9812
7118
193 4
273 4
caleS
Drawn
Reg no
DatebyChecked
by
DRAWINGAUTOCAD
Denomination
Dimensional drwg
6441500 6
5399
140115IW JP
1:1
Ø16"
Last update
Created on 10/16/2019
Created byProject
Block