city of des moines, iowa combining statement · pdf filecity of des moines, iowa combining...
TRANSCRIPT
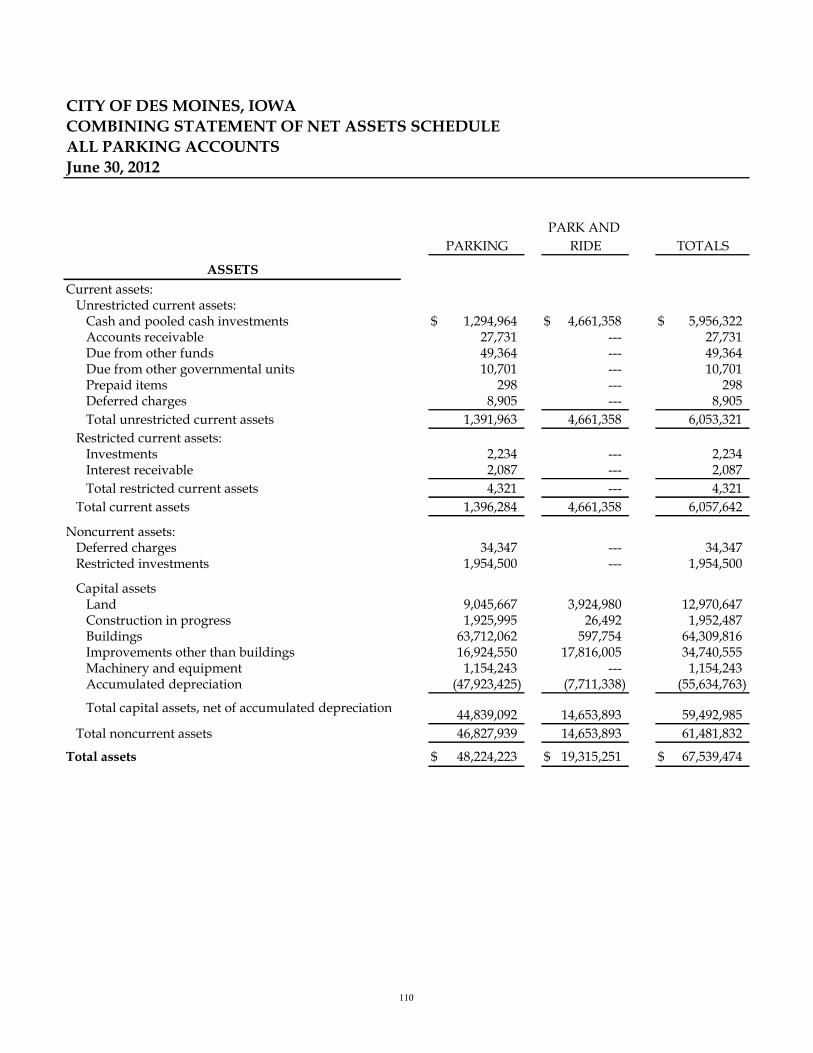
CITY OF DES MOINES, IOWA
COMBINING STATEMENT OF NET ASSETS SCHEDULE
ALL PARKING ACCOUNTS
June 30, 2012
PARK AND
PARKING RIDE TOTALS
Current assets:Unrestricted current assets:
Cash and pooled cash investments 1,294,964$ 4,661,358$ 5,956,322$ Accounts receivable 27,731 --- 27,731Due from other funds 49,364 --- 49,364Due from other governmental units 10,701 --- 10,701Prepaid items 298 --- 298Deferred charges 8,905 --- 8,905
Total unrestricted current assets 1,391,963 4,661,358 6,053,321
Restricted current assets:Investments 2,234 --- 2,234Interest receivable 2,087 --- 2,087
Total restricted current assets 4,321 --- 4,321
Total current assets 1,396,284 4,661,358 6,057,642
Noncurrent assets:Deferred charges 34,347 --- 34,347Restricted investments 1,954,500 --- 1,954,500
Capital assetsLand 9,045,667 3,924,980 12,970,647Construction in progress 1,925,995 26,492 1,952,487Buildings 63,712,062 597,754 64,309,816Improvements other than buildings 16,924,550 17,816,005 34,740,555Machinery and equipment 1,154,243 --- 1,154,243Accumulated depreciation (47,923,425) (7,711,338) (55,634,763)
44,839,092 14,653,893 59,492,985
Total noncurrent assets 46,827,939 14,653,893 61,481,832
Total assets 48,224,223$ 19,315,251$ 67,539,474$
Total capital assets, net of accumulated depreciation
ASSETS
110

PARK AND
PARKING RIDE TOTALS
Liabilities:Current liabilities:
Accounts payable 182,464$ 38,965$ 221,429$ Contracts payable 90,402 24,264 114,666Accrued wages payable 17,182 --- 17,182Accrued employee benefits 62,518 --- 62,518Due to other funds 369,598 --- 369,598Accrued interest payable 68,819 --- 68,819Revenue bonds payable, net 1,505,000 --- 1,505,000Other liabilities 880 --- 880
Total 2,296,863 63,229 2,360,092
Current liabilities payable from restricted assets:Accrued interest payable 4,321 --- 4,321
4,321 --- 4,321
2,301,184 63,229 2,364,413
Noncurrent liabilities:Accrued employee benefits 104,743 --- 104,743Other postemployment benefits 40,229 --- 40,229Advance from other funds 4,230,402 --- 4,230,402Revenue bonds payable, net 13,350,000 --- 13,350,000
Total noncurrent liabilities 17,725,374 --- 17,725,374
Total liabilities 20,026,558 63,229 20,089,787
Invested in capital assets, net of related debt 29,984,092 14,653,893 44,637,985Restricted:
Debt retirement 1,954,500 --- 1,954,500 Unrestricted (3,740,927) 4,598,129 857,202
Total net assets 28,197,665$ 19,252,022$ 47,449,687$
The notes to the financial statements are an integral part of this statement.
NET ASSETS
LIABILITIES
Total current liabilities payable from restricted
assetsTotal current liabilities
111


CITY OF DES MOINES, IOWA
COMBINING SCHEDULE OF REVENUES, EXPENSES,
AND CHANGES IN FUND NET ASSETS
ALL PARKING ACCOUNTS
For the Fiscal Year Ended June 30, 2012
PARK AND
PARKING RIDE TOTALS
Operating revenues:
Charges for sales and services 7,504,539$ 1,359,091$ 8,863,630$
Total operating revenues 7,504,539 1,359,091 8,863,630
Operating expenses:Personal services 1,096,924 --- 1,096,924Contractual services 2,728,026 1,250,519 3,978,545Commodities 185,332 --- 185,332Depreciation 2,741,779 636,253 3,378,032Other charges 2,015,990 177,967 2,193,957
Total operating expenses 8,768,051 2,064,739 10,832,790
Operating income (loss) (1,263,512) (705,648) (1,969,160)
Non-operating revenues (expenses):
Donations and contributions 282,117 --- 282,117
Loss on disposal of capital assets (3,069) --- (3,069)Investment earnings 6,575 4,715 11,290Proceeds from damage claims 1,252 --- 1,252Contribution to general government --- (285,189) (285,189)Interest expense and fiscal charges (1,075,174) --- (1,075,174)
Total nonoperating revenues (expenses) (788,299) (280,474) (1,068,773)
Income (loss) before transfers (2,051,811) (986,122) (3,037,933)
Transfers in 1,200,000 --- 1,200,000
Transfers out (50,000) --- (50,000)
Change in net assets (901,811) (986,122) (1,887,933)
29,099,476 20,238,144 49,337,620
Total net assets - ending 28,197,665$ 19,252,022$ 47,449,687$
Total net assets - beginning
113

CITY OF DES MOINES, IOWA
COMBINING STATEMENT OF CASH FLOWS
ALL PARKING ACCOUNTS
For the Fiscal Year Ended June 30, 2012
PARK AND
PARKING RIDE TOTALS
CASH FLOWS FROM OPERATING
ACTIVITIES
Receipts from customers and users 7,518,144$ 1,359,091$ 8,877,235$ Payments to suppliers (4,975,800) (1,380,354) (6,356,154) Payments to employees (1,149,239) --- (1,149,239)
Net cash provided (used) by operating
activities 1,393,105 (21,263) 1,371,842
CASH FLOWS FROM NONCAPITAL
FINANCING ACTIVITIES
Proceeds from interfund accounts 3,169,449 1,479,915 4,649,364 Payments to interfund accounts (1,702) --- (1,702) Proceeds from damage claims 1,252 --- 1,252 Transfers In 1,200,000 --- 1,200,000 Transfers Out (50,000) --- (50,000) Donations and Contributions 282,117 --- 282,117
Net cash provided (used) by noncapital
and related financing activities 4,601,116 1,479,915 6,081,031
CASH FLOWS FROM CAPITAL AND
RELATED FINANCING ACTIVITIES
Interest paid on capital debt (1,194,074) --- (1,194,074) Principal paid on long-term debt (6,142,947) --- (6,142,947) Proceeds from sale of capital assets --- 676,621 676,621
Acquisition and construction of capital
assets (476,297) (136,480) (612,777)
(7,813,318) 540,141 (7,273,177)
CASH FLOWS FROM INVESTING
ACTIVITIES
Interest and dividends received 3,193 4,715 7,908
Net cash provided by investing activities 3,193 4,715 7,908
Net decrease in cash and cash equivalents(1,815,904) 2,003,508 187,604
Net cash (used) by capital and related
financing activities
114

PARK ANDPARKING RIDE TOTALS
3,110,868$ 2,657,850$ 5,768,718$
1,294,964$ 4,661,358$ 5,956,322$
Operating (loss) (1,263,512)$ (705,648)$ (1,969,160)$
Depreciation expense 2,741,779 636,253 3,378,032
Accretion and amortization 12,844 --- 12,844
(17,841) --- (17,841) (Increase) decrease in due from other
governmental units 31,446 --- 31,446
(298) --- (298)
Increase (decrease) in accounts payable (56,358) 48,132 (8,226)
Increase (decrease) in accrued wages
payable (37,445) --- (37,445)
Increase (decrease) in accrued
employee benefits (14,870) --- (14,870)
Increase (decrease) in other liabilities (2,640) --- (2,640)
Total adjustments 2,656,617 684,385 3,341,002
Net cash provided (used) by operating
activities 1,393,105$ (21,263)$ 1,371,842$
Schedule of noncash capital and related
financing activities:
Gain (loss) on disposal of capital assets (3,069)$ ---$ (3,069)$ Acquisition of capital assets through notes
payable (2,455,984)$ ---$ (2,455,984)$ Capital contribution to Governmental
activities ---$ (285,189)$ (285,189)$
(Increase) decrease in accounts receivable
(Increase) decrease in prepaid items
Cash and cash equivalents, beginning of year
Cash and cash equivalents, end of year
Reconciliation of operating (loss) to net cash
provided (used) by operating activities:
Adjustments to reconcile operating (loss) to
net cash provided (used) by operating
activities:
115

CITY OF DES MOINES, IOWACOMBINING STATEMENT OF NET ASSETS (DEFICIT)NONMAJOR ENTERPRISE FUNDSJune 30, 2012
SOLIDGOLF WASTE
COURSES SYSTEM TOTALS
Current assets:Unrestricted current assets:
Cash and pooled cash investments 4,500$ 4,992,622$ 4,997,122$ Accounts receivable 422,559 156,842 579,401Special assessments receivable --- 86,527 86,527Due from other governmental units --- 7,914 7,914Prepaid items --- 399 399Total current assets 427,059 5,244,304 5,671,363
Noncurrent assets, capital assets:Land 123,497 --- 123,497Buildings 330,339 1,143,880 1,474,219Improvements other than buildings 3,222,054 261,589 3,483,643Machinery and equipment 664,780 13,551,175 14,215,955Accumulated depreciation (1,953,281) (9,454,416) (11,407,697)
2,387,389 5,502,228 7,889,617
Total assets 2,814,448$ 10,746,532$ 13,560,980$
Liabilities:Current liabilities:
Accounts payable 8,609$ 103,253$ 111,862$ Accrued wages payable --- 73,962 73,962Accrued employee benefits --- 228,032 228,032Due to other funds 49,364 --- 49,364Notes payable --- 376,872 376,872Accrued interest payable --- 3,133 3,133
Total current liabilities 57,973 785,252 843,225Noncurrent liabilities:
Accrued employee benefits --- 382,048 382,048Other postemployment benefits --- 149,512 149,512Advance from other funds 3,950,105 --- 3,950,105Notes payable --- 758,687 758,687
Total noncurrent liabilities 3,950,105 1,290,247 5,240,352
Total liabilities 4,008,078 2,075,499 6,083,577
Invested in capital assets, net of related debt 2,387,389 4,366,669 6,754,058Unrestricted (3,581,019) 4,304,364 723,345Total net assets (deficit) (1,193,630)$ 8,671,033$ 7,477,403$
NET ASSETS (DEFICIT)
ASSETS
LIABILITIES
Total capital assets (net of accumulated depreciation)
116

CITY OF DES MOINES, IOWA
COMBINING STATEMENT OF REVENUES, EXPENSES,
AND CHANGES IN FUND NET ASSETS (DEFICIT)
NONMAJOR ENTERPRISE FUNDS
For the Fiscal Year Ended June 30, 2012
SOLID
GOLF WASTE
COURSES SYSTEM TOTALS
Operating revenues:
Charges for sales and services 294,259$ 12,230,965$ 12,525,224$
Miscellaneous 141,007 --- 141,007
Total operating revenues 435,266 12,230,965 12,666,231
Operating expenses:Personal services (3,775) 4,535,661 4,531,886Contractual services 106,341 4,463,490 4,569,831Commodities 3,078 338,513 341,591Depreciation 89,770 942,267 1,032,037Other charges 5,958 680,087 686,045
Total operating expenses 201,372 10,960,018 11,161,390
Operating income 233,894 1,270,947 1,504,841
Non-operating revenues (expenses):Gain (loss) on disposal of capital assets (15,471) 510 (14,961)Investment earnings --- 8,834 8,834Interest expense and fiscal charges (10,791) (57,810) (68,601)
Total nonoperating revenues (expenses) (26,262) (48,466) (74,728)
Income before transfers 207,632 1,222,481 1,430,113
Transfers in 152 --- 152
Transfers out --- (90,000) (90,000)
Change in net assets 207,784 1,132,481 1,340,265
(1,401,414) 7,538,552 6,137,138
Total net assets (deficit) - ending (1,193,630)$ 8,671,033$ 7,477,403$
Total net assets (deficit) - beginning
117
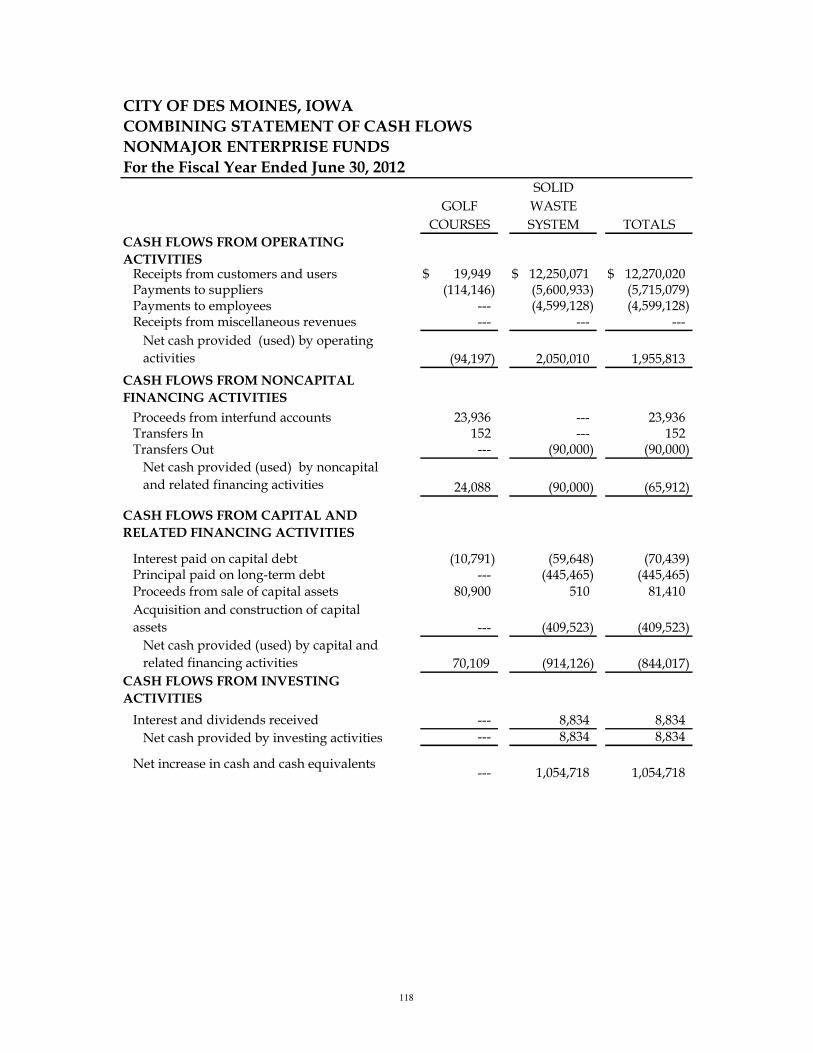
CITY OF DES MOINES, IOWA
COMBINING STATEMENT OF CASH FLOWS
NONMAJOR ENTERPRISE FUNDS
For the Fiscal Year Ended June 30, 2012SOLID
GOLF WASTE
COURSES SYSTEM TOTALS
CASH FLOWS FROM OPERATING
ACTIVITIESReceipts from customers and users 19,949$ 12,250,071$ 12,270,020$ Payments to suppliers (114,146) (5,600,933) (5,715,079) Payments to employees --- (4,599,128) (4,599,128) Receipts from miscellaneous revenues --- --- ---
Net cash provided (used) by operating
activities (94,197) 2,050,010 1,955,813
CASH FLOWS FROM NONCAPITAL
FINANCING ACTIVITIES
Proceeds from interfund accounts 23,936 --- 23,936 Transfers In 152 --- 152 Transfers Out --- (90,000) (90,000)
Net cash provided (used) by noncapital
and related financing activities 24,088 (90,000) (65,912)
CASH FLOWS FROM CAPITAL AND
RELATED FINANCING ACTIVITIES
Interest paid on capital debt (10,791) (59,648) (70,439) Principal paid on long-term debt --- (445,465) (445,465) Proceeds from sale of capital assets 80,900 510 81,410
Acquisition and construction of capital
assets --- (409,523) (409,523)
70,109 (914,126) (844,017)
CASH FLOWS FROM INVESTING
ACTIVITIES
Interest and dividends received --- 8,834 8,834
Net cash provided by investing activities --- 8,834 8,834
Net increase in cash and cash equivalents--- 1,054,718 1,054,718
Net cash provided (used) by capital and
related financing activities
118

SOLIDGOLF WASTE
COURSES SYSTEM TOTALS
4,500$ 3,937,904$ 3,942,404$
4,500$ 4,992,622$ 4,997,122$
Operating income 233,894$ 1,270,947$ 1,504,841$
Depreciation expense 89,770 942,267 1,032,037
(415,317) (8,497) (423,814) Decrease in special assessments
receivable --- 13,864 13,864 Decrease in due from other
governmental units --- 13,739 13,739
--- (254) (254)
Increase (decrease) in accounts payable 1,231 (118,589) (117,358)
(Decrease) in accrued wages payable --- (132,120) (132,120)
Increase (decrease) in accrued
employee benefits (3,775) 68,653 64,878
Total adjustments (328,091) 779,063 450,972
Net cash provided (used) by operating
activities (94,197)$ 2,050,010$ 1,955,813$
Schedule of noncash capital and related
financing activities:
Gain (loss) on disposal of capital assets (15,471)$ 510$ (14,961)$
(Increase) in accounts receivable
(Increase) in prepaid items
Cash and cash equivalents, beginning of year
Cash and cash equivalents, end of year
Reconciliation of operating income to net
cash provided (used) by operating activities:
Adjustments to reconcile operating income
to net cash provided (used) by operating
activities:
119
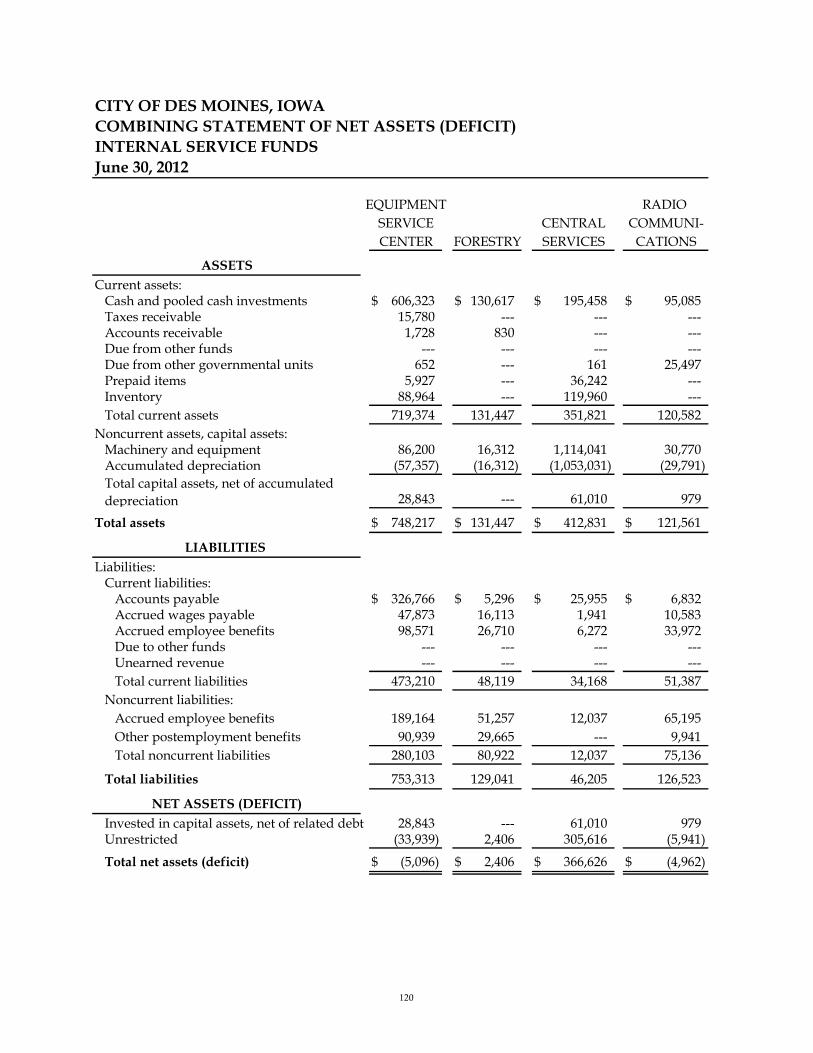
CITY OF DES MOINES, IOWA
COMBINING STATEMENT OF NET ASSETS (DEFICIT)
INTERNAL SERVICE FUNDS
June 30, 2012
EQUIPMENT RADIO
SERVICE CENTRAL COMMUNI-
CENTER FORESTRY SERVICES CATIONS
ASSETS
Current assets:Cash and pooled cash investments 606,323$ 130,617$ 195,458$ 95,085$ Taxes receivable 15,780 --- --- ---Accounts receivable 1,728 830 --- ---Due from other funds --- --- --- ---Due from other governmental units 652 --- 161 25,497Prepaid items 5,927 --- 36,242 ---Inventory 88,964 --- 119,960 ---
Total current assets 719,374 131,447 351,821 120,582
Noncurrent assets, capital assets:Machinery and equipment 86,200 16,312 1,114,041 30,770Accumulated depreciation (57,357) (16,312) (1,053,031) (29,791)
Total capital assets, net of accumulated
depreciation 28,843 --- 61,010 979
Total assets 748,217$ 131,447$ 412,831$ 121,561$
LIABILITIES
Liabilities:Current liabilities:
Accounts payable 326,766$ 5,296$ 25,955$ 6,832$ Accrued wages payable 47,873 16,113 1,941 10,583Accrued employee benefits 98,571 26,710 6,272 33,972Due to other funds --- --- --- ---Unearned revenue --- --- --- ---
Total current liabilities 473,210 48,119 34,168 51,387
Noncurrent liabilities:
Accrued employee benefits 189,164 51,257 12,037 65,195
Other postemployment benefits 90,939 29,665 --- 9,941
Total noncurrent liabilities 280,103 80,922 12,037 75,136
Total liabilities 753,313 129,041 46,205 126,523
NET ASSETS (DEFICIT)
Invested in capital assets, net of related debt 28,843 --- 61,010 979Unrestricted (33,939) 2,406 305,616 (5,941)
Total net assets (deficit) (5,096)$ 2,406$ 366,626$ (4,962)$
120
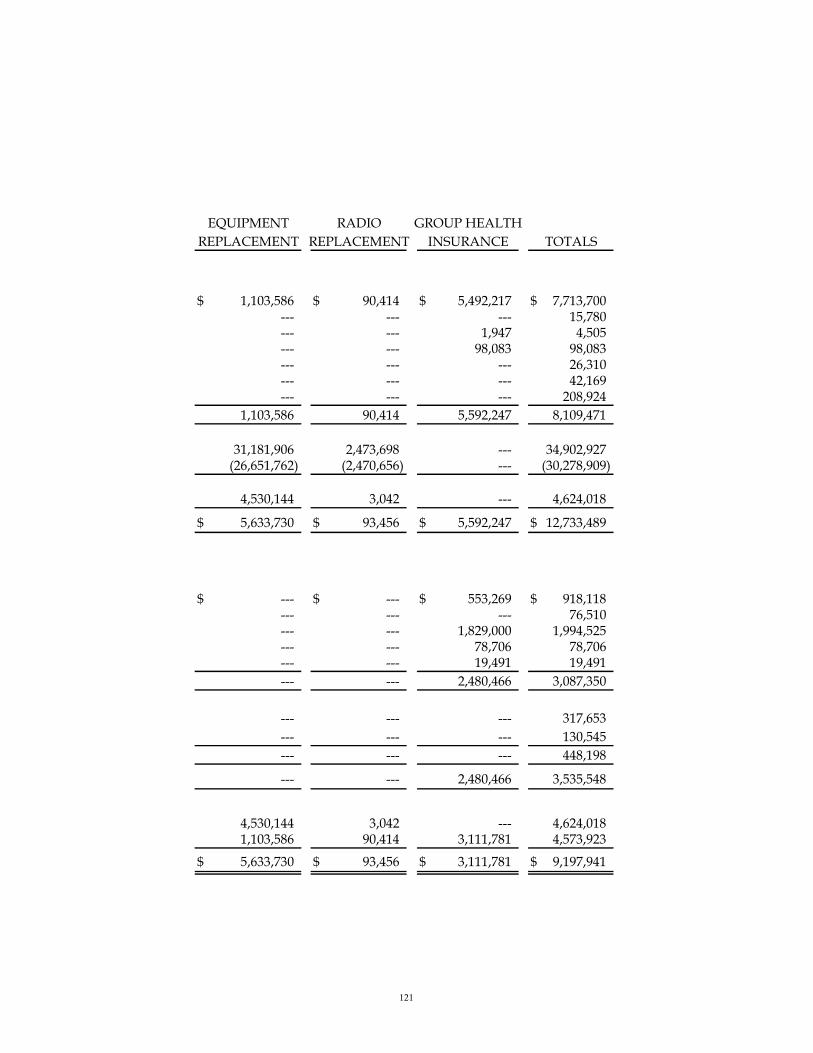
EQUIPMENT RADIO GROUP HEALTH
REPLACEMENT REPLACEMENT INSURANCE TOTALS
1,103,586$ 90,414$ 5,492,217$ 7,713,700$ --- --- --- 15,780--- --- 1,947 4,505--- --- 98,083 98,083--- --- --- 26,310--- --- --- 42,169--- --- --- 208,924
1,103,586 90,414 5,592,247 8,109,471
31,181,906 2,473,698 --- 34,902,927(26,651,762) (2,470,656) --- (30,278,909)
4,530,144 3,042 --- 4,624,018
5,633,730$ 93,456$ 5,592,247$ 12,733,489$
---$ ---$ 553,269$ 918,118$ --- --- --- 76,510--- --- 1,829,000 1,994,525--- --- 78,706 78,706--- --- 19,491 19,491
--- --- 2,480,466 3,087,350
--- --- --- 317,653
--- --- --- 130,545
--- --- --- 448,198
--- --- 2,480,466 3,535,548
4,530,144 3,042 --- 4,624,0181,103,586 90,414 3,111,781 4,573,923
5,633,730$ 93,456$ 3,111,781$ 9,197,941$
121
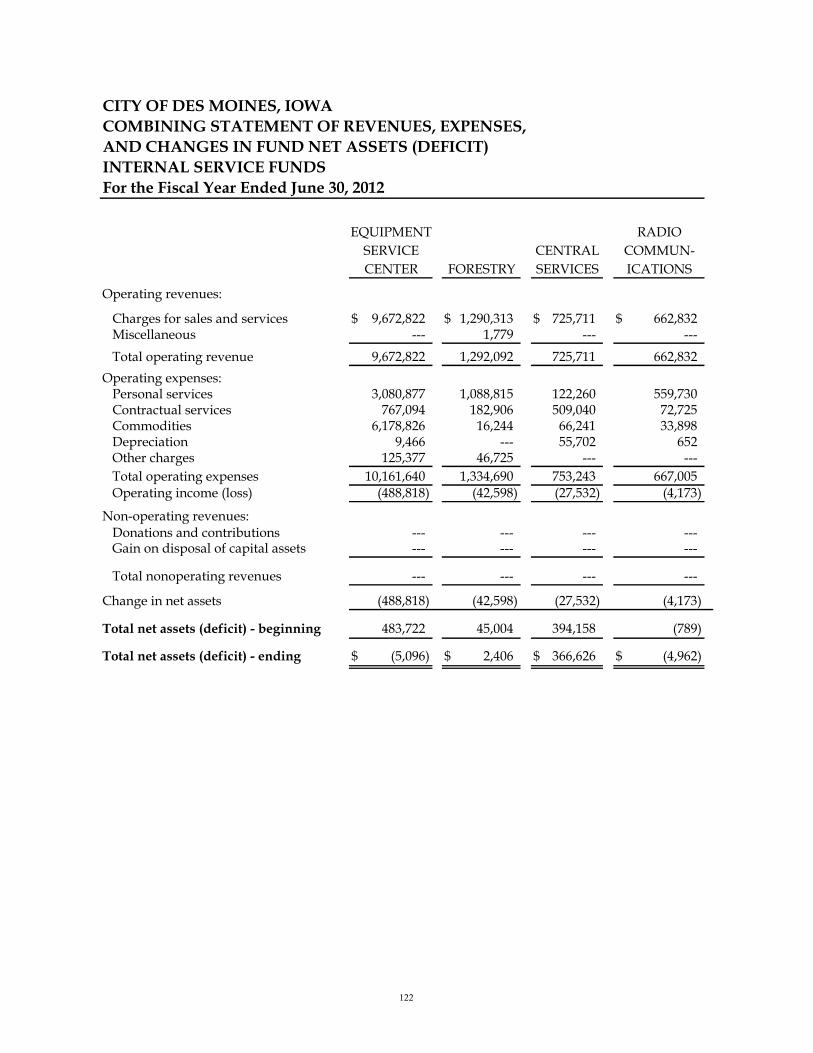
CITY OF DES MOINES, IOWA
COMBINING STATEMENT OF REVENUES, EXPENSES,
AND CHANGES IN FUND NET ASSETS (DEFICIT)
INTERNAL SERVICE FUNDS
For the Fiscal Year Ended June 30, 2012
EQUIPMENT RADIO
SERVICE CENTRAL COMMUN-
CENTER FORESTRY SERVICES ICATIONS REPLACEMENT
Operating revenues:
Charges for sales and services 9,672,822$ 1,290,313$ 725,711$ 662,832$ Miscellaneous --- 1,779 --- ---
Total operating revenue 9,672,822 1,292,092 725,711 662,832
Operating expenses:Personal services 3,080,877 1,088,815 122,260 559,730Contractual services 767,094 182,906 509,040 72,725Commodities 6,178,826 16,244 66,241 33,898Depreciation 9,466 --- 55,702 652Other charges 125,377 46,725 --- ---
Total operating expenses 10,161,640 1,334,690 753,243 667,005Operating income (loss) (488,818) (42,598) (27,532) (4,173)
Non-operating revenues:Donations and contributions --- --- --- ---Gain on disposal of capital assets --- --- --- ---
Total nonoperating revenues --- --- --- ---
(488,818) (42,598) (27,532) (4,173)
Total net assets (deficit) - beginning 483,722 45,004 394,158 (789)
Total net assets (deficit) - ending (5,096)$ 2,406$ 366,626$ (4,962)$
Change in net assets
122

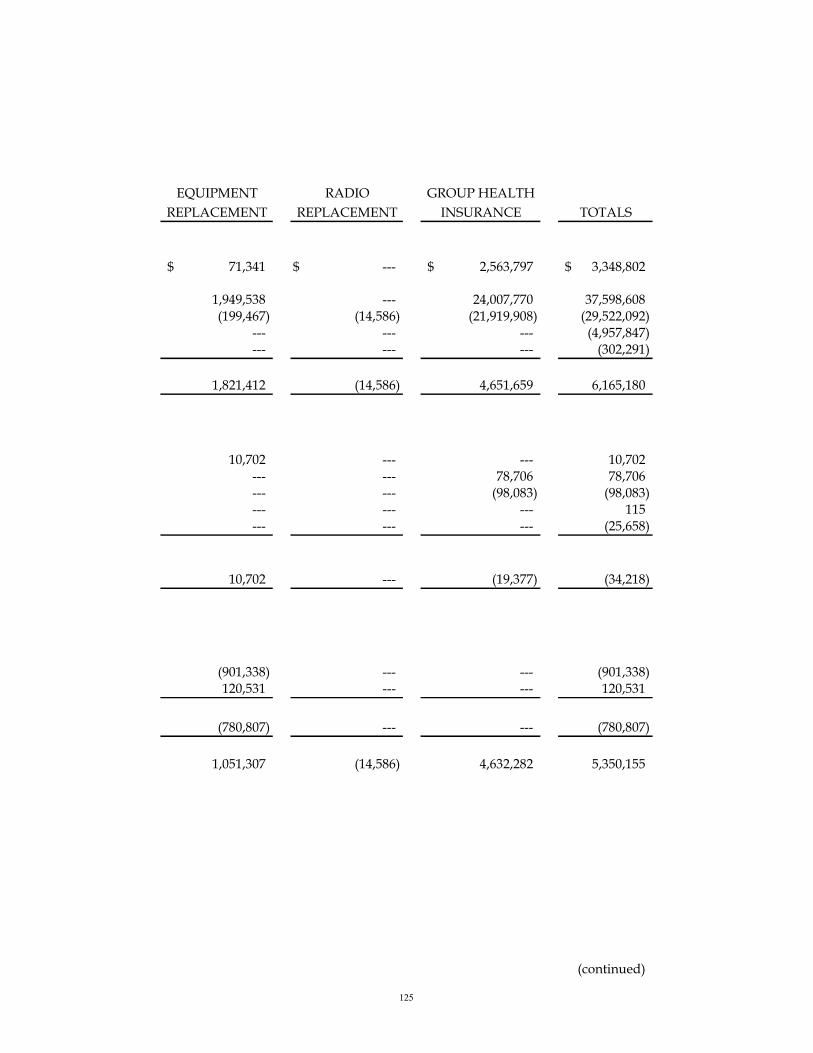
EQUIPMENT RADIO GROUP HEALTH
REPLACEMENT REPLACEMENT INSURANCE TOTALS
1,949,538$ ---$ 26,577,640$ 40,878,856$ 62,648 --- --- 64,427
2,012,186 --- 26,577,640 40,943,283
--- --- --- 4,851,682--- --- 24,304,855 25,836,620
2,477 14,586 --- 6,312,2721,334,482 2,382 --- 1,402,684
--- --- 4,291 176,393
1,336,959 16,968 24,309,146 38,579,651675,227 (16,968) 2,268,494 2,363,632
10,702 --- --- 10,70296,909 --- --- 96,909
107,611 --- --- 107,611
782,838 (16,968) 2,268,494 2,471,243
4,850,892 110,424 843,287 6,726,698
5,633,730$ 93,456$ 3,111,781$ 9,197,941$
123
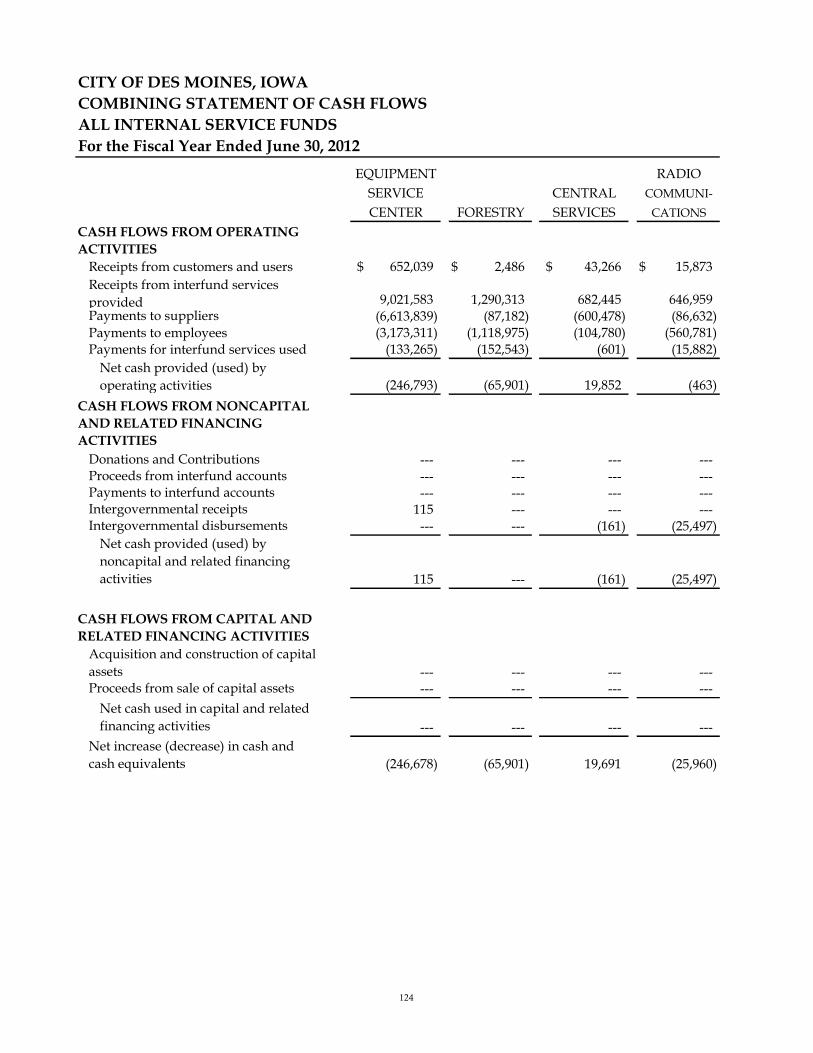
CITY OF DES MOINES, IOWA
COMBINING STATEMENT OF CASH FLOWS
ALL INTERNAL SERVICE FUNDS
For the Fiscal Year Ended June 30, 2012
EQUIPMENT RADIO
SERVICE CENTRAL COMMUNI-
CENTER FORESTRY SERVICES CATIONS
CASH FLOWS FROM OPERATING
ACTIVITIES
Receipts from customers and users 652,039$ 2,486$ 43,266$ 15,873$
Receipts from interfund services
provided 9,021,583 1,290,313 682,445 646,959 Payments to suppliers (6,613,839) (87,182) (600,478) (86,632) Payments to employees (3,173,311) (1,118,975) (104,780) (560,781) Payments for interfund services used (133,265) (152,543) (601) (15,882)
Net cash provided (used) by
operating activities (246,793) (65,901) 19,852 (463)
CASH FLOWS FROM NONCAPITAL
AND RELATED FINANCING
ACTIVITIES
Donations and Contributions --- --- --- ---Proceeds from interfund accounts --- --- --- ---Payments to interfund accounts --- --- --- ---Intergovernmental receipts 115 --- --- ---Intergovernmental disbursements --- --- (161) (25,497)
Net cash provided (used) by
noncapital and related financing
activities 115 --- (161) (25,497)
CASH FLOWS FROM CAPITAL AND
RELATED FINANCING ACTIVITIES
Acquisition and construction of capital
assets --- --- --- ---Proceeds from sale of capital assets --- --- --- ---
Net cash used in capital and related
financing activities --- --- --- ---
Net increase (decrease) in cash and
cash equivalents (246,678) (65,901) 19,691 (25,960)
124
EQUIPMENT RADIO GROUP HEALTH
REPLACEMENT REPLACEMENT INSURANCE TOTALS
71,341$ ---$ 2,563,797$ 3,348,802$
1,949,538 --- 24,007,770 37,598,608 (199,467) (14,586) (21,919,908) (29,522,092)
--- --- --- (4,957,847) --- --- --- (302,291)
1,821,412 (14,586) 4,651,659 6,165,180
10,702 --- --- 10,702 --- --- 78,706 78,706 --- --- (98,083) (98,083) --- --- --- 115 --- --- --- (25,658)
10,702 --- (19,377) (34,218)
(901,338) --- --- (901,338) 120,531 --- --- 120,531
(780,807) --- --- (780,807)
1,051,307 (14,586) 4,632,282 5,350,155
(continued)
125

CITY OF DES MOINES, IOWA
COMBINING STATEMENT OF CASH FLOWS (CONTINUED)
ALL INTERNAL SERVICE FUNDS
For the Fiscal Year Ended June 30, 2012
EQUIPMENT RADIO
SERVICE CENTRAL COMMUNI-
CENTER FORESTRY SERVICES CATIONS
Cash and cash equivalents, beginning
of year 853,001$ 196,518$ 175,767$ 121,045$
Cash and cash equivalents, end of
year 606,323$ 130,617$ 195,458$ 95,085$
Reconciliation of operating income
(loss) to net cash provided (used) by
operating activities:
Operating income (loss) (488,818) (42,598) (27,532) (4,173)
Adjustments to reconcile operating
(loss) to net cash provided (used) by
operating activities:
Depreciation expense 9,466 --- 55,702 652 (Increase) decrease in accounts
and taxes receivable 800 707 --- ---
(Increase) decrease in inventories 355,952 --- (28,939) ---
(Increase) decrease in prepaid items (1,288) 1,170 4,118 470
Increase (decrease) in accounts
payable and other liabilities (30,471) 4,980 (977) 3,639
Increase (decrease) in accrued
wages payable (87,277) (28,711) 1,941 (18,324) Increase (decrease) in accrued
employee benefits (5,157) (1,449) 15,539 17,273 Increase (decrease) in due to other
governmental units --- --- --- ---
Increase (decrease) in deferred
revenue --- --- --- ---
Total adjustments 242,025 (23,303) 47,384 3,710
Net cash provided (used) by operating
activities (246,793)$ (65,901)$ 19,852$ (463)$
Schedule of noncash capital and
related financing activities:
Gain (Loss) on sale of capital asset --- --- --- ---
126
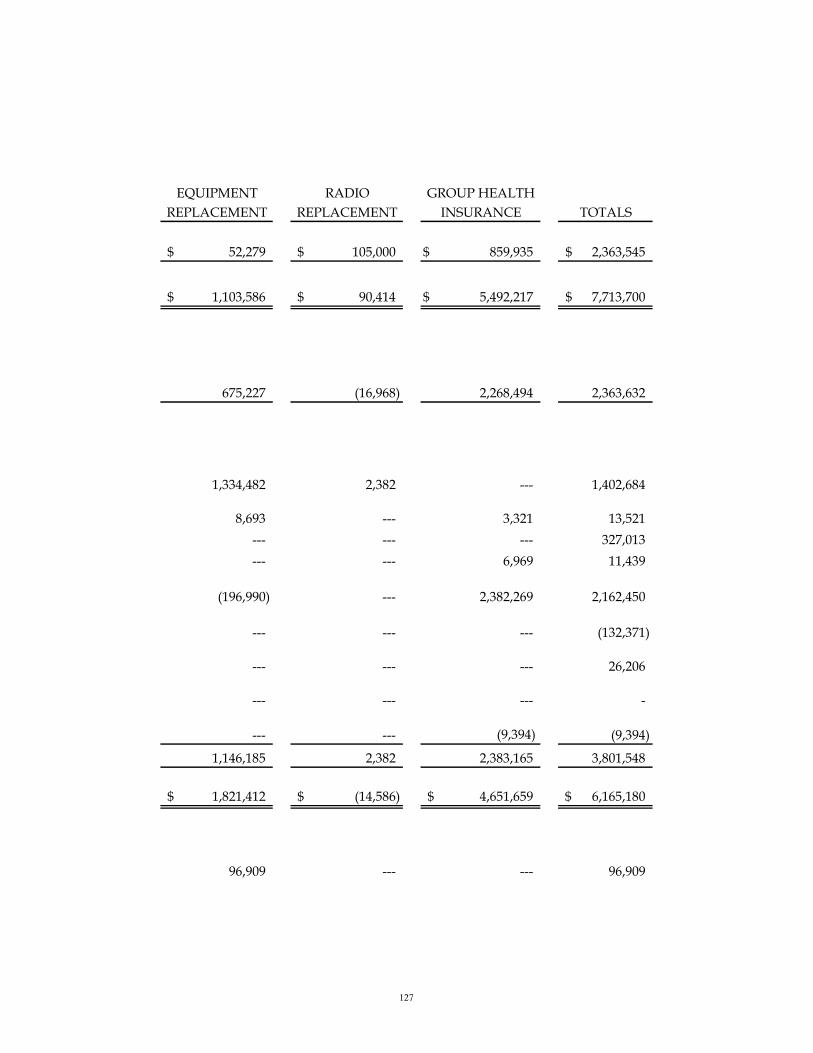
EQUIPMENT RADIO GROUP HEALTH
REPLACEMENT REPLACEMENT INSURANCE TOTALS
52,279$ 105,000$ 859,935$ 2,363,545$
1,103,586$ 90,414$ 5,492,217$ 7,713,700$
675,227 (16,968) 2,268,494 2,363,632
1,334,482 2,382 --- 1,402,684
8,693 --- 3,321 13,521
--- --- --- 327,013
--- --- 6,969 11,439
(196,990) --- 2,382,269 2,162,450
--- --- --- (132,371)
--- --- --- 26,206
--- --- --- -
--- --- (9,394) (9,394)
1,146,185 2,382 2,383,165 3,801,548
1,821,412$ (14,586)$ 4,651,659$ 6,165,180$
96,909 --- --- 96,909
127