city delivery excess routes audit report - nalc
TRANSCRIPT

OFFICE OF
INSPECTOR GENERAL UNITED STATES POSTAL SERVICE
City Delivery – Excess Routes
Audit Report
June 19, 2012
Report Number DR-AR-12-002

IMPACT ON: City delivery operations. WHY THE OIG DID THE AUDIT: To assess districts using fewer carrier street hours than projected. Carrier street time (or street hours) is time a carrier spends delivering mail and not in the office. Routes have a base or projected street time that is, on average, 5 to 6 hours. When a route’s actual hours are under its base street time, the time is referred to as ‘less than projected. WHAT THE OIG FOUND: Opportunities exist to improve street efficiency in districts using fewer than the projected carrier street hours. In the 10 districts reviewed, we found more than 500,000 street hours were projected than needed during fiscal year 2011. This created an excess capacity of 33 city routes and vehicles. Excess city routes exist because some managers are not concerned with locations using fewer than the projected hours and routes are not always eliminated or consolidated. By eliminating the 33 city routes and transferring vehicles to rural delivery operations, the U.S. Postal Service could reduce rural delivery costs by $250,110 a year, or $500,220 over
2 years. This audit also identified assets at risk totaling $45,912 in two delivery units due to inadequate asset safeguards. Management immediately initiated corrective action on these security matters. WHAT THE OIG RECOMMENDED: We recommended that managers in the 10 districts eliminate 33 excess city delivery routes and reallocate the assigned delivery vehicles to rural routes. We also recommended that the 10 district managers continue to review those delivery units consistently using fewer than the projected street hours and make appropriate route adjustments, eliminations, and consolidations. WHAT MANAGEMENT SAID: Management in all 10 districts agreed with the recommendations, findings, and monetary impact. Management plan to take corrective action by June 2013. AUDITORS’ COMMENTS: We consider management’s comments to be responsive to our
recommendations. Link to review the entire report
June 19, 2012
City Delivery — Excess Routes
Report Number DR-AR-12-002

June 19, 2012
MEMORANDUM FOR: TIMOTHY R. COSTELLO DISTRICT MANAGER, ALABAMA DISTRICT DARRYL K. MYERS DISTRICT MANAGER, APPALACHIAN DISTRICT KEVIN MCADAMS DISTRICT MANAGER, BALTIMORE DISTRICT TIM VIERLING DISTRICT MANAGER, FORT WORTH DISTRICT CHARLES K. LYNCH DISTRICT MANAGER, GREATER BOSTON DISTRICT MARK MARTINEZ DISTRICT MANAGER, NEVADA-SIERRA DISTRICT TODD HAWKINS DISTRICT MANAGER, NORTHERN OHIO DISTRICT GERARD AHERN DISTRICT MANAGER, SANTA ANA DISTRICT DAVID J. DILLMAN ACTING DISTRICT MANAGER, TENNESSEE DISTRICT FRANK J. CALABRESE DISTRICT MANAGER, TRIBORO DISTRICT
FROM: Robert J. Batta
Deputy Assistant Inspector General for Mission Operations
SUBJECT: Audit Report - City Delivery – Excess Routes
(Report Number DR-AR-12-002)

This report presents the results of our audit of city delivery excess routes in 10 districts (Project Number 11XG047DR000). We appreciate the cooperation and courtesies provided by your staff. If you have any questions or need additional information, please contact Rita F. Oliver, director, Delivery, or me at 703-248-2100. Attachments cc: Dean J. Granholm Elizabeth A. Schaefer Philip F. Knoll Vice Presidents, Area Operations Corporate Audit and Response Management

City Delivery – Excess Routes DR-AR-12-002
TABLE OF CONTENTS
Introduction ..................................................................................................................... 1
Conclusion ...................................................................................................................... 1
Excess Routes ................................................................................................................ 2
Other Issues .................................................................................................................... 4
Recommendations .......................................................................................................... 5
Management’s Comments .............................................................................................. 5
Evaluation of Management’s Comments ......................................................................... 5
Appendix A: Additional Information ................................................................................. 6
Background ................................................................................................................. 6
Objective, Scope, and Methodology ............................................................................ 7
Prior Audit Coverage ................................................................................................... 8
Appendix B: Monetary Impact ......................................................................................... 9
Appendix C: Excess Routes and Vehicles .................................................................... 10
Appendix D: Management’s Comments ........................................................................ 11
City Delivery – Excess Routes DR-AR-12-002
1
Introduction
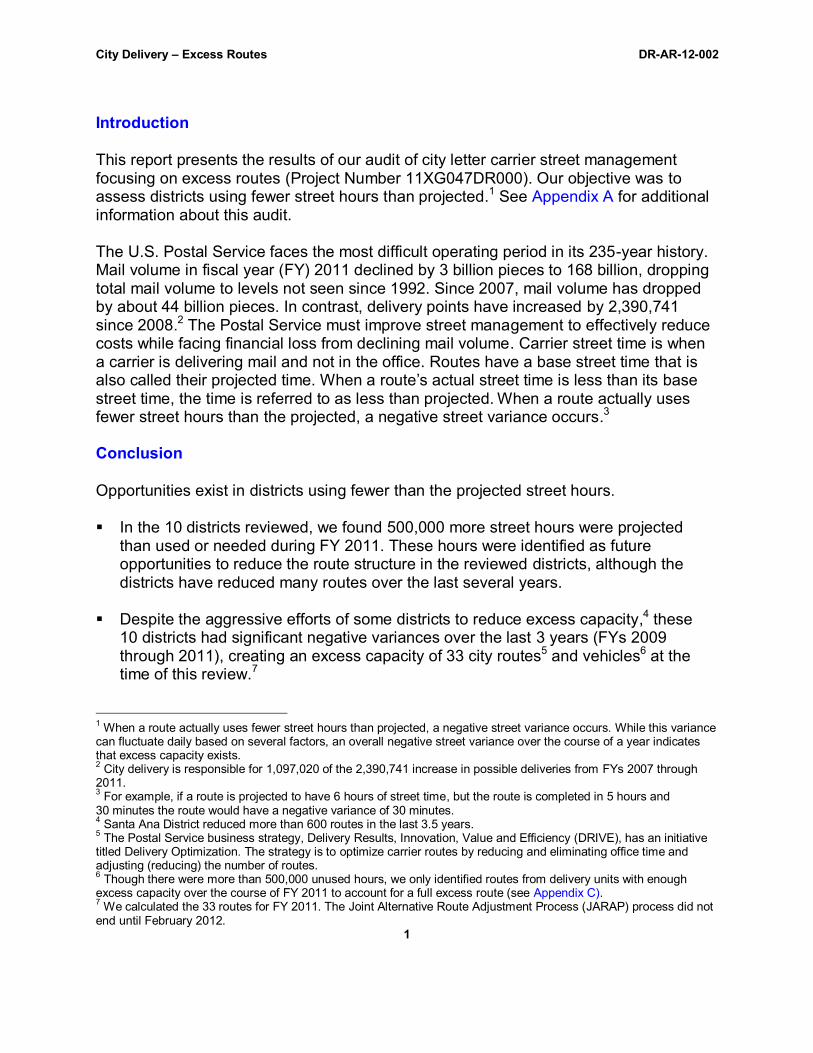
This report presents the results of our audit of city letter carrier street management focusing on excess routes (Project Number 11XG047DR000). Our objective was to assess districts using fewer street hours than projected.1 See Appendix A for additional information about this audit. The U.S. Postal Service faces the most difficult operating period in its 235-year history. Mail volume in fiscal year (FY) 2011 declined by 3 billion pieces to 168 billion, dropping total mail volume to levels not seen since 1992. Since 2007, mail volume has dropped by about 44 billion pieces. In contrast, delivery points have increased by 2,390,741 since 2008.2 The Postal Service must improve street management to effectively reduce costs while facing financial loss from declining mail volume. Carrier street time is when a carrier is delivering mail and not in the office. Routes have a base street time that is also called their projected time. When a route’s actual street time is less than its base street time, the time is referred to as less than projected. When a route actually uses fewer street hours than the projected, a negative street variance occurs.3 Conclusion
Opportunities exist in districts using fewer than the projected street hours. In the 10 districts reviewed, we found 500,000 more street hours were projected
than used or needed during FY 2011. These hours were identified as future opportunities to reduce the route structure in the reviewed districts, although the districts have reduced many routes over the last several years.
Despite the aggressive efforts of some districts to reduce excess capacity,4 these 10 districts had significant negative variances over the last 3 years (FYs 2009 through 2011), creating an excess capacity of 33 city routes5 and vehicles6 at the time of this review.7
1 When a route actually uses fewer street hours than projected, a negative street variance occurs. While this variance
can fluctuate daily based on several factors, an overall negative street variance over the course of a year indicates that excess capacity exists. 2 City delivery is responsible for 1,097,020 of the 2,390,741 increase in possible deliveries from FYs 2007 through
2011. 3 For example, if a route is projected to have 6 hours of street time, but the route is completed in 5 hours and
30 minutes the route would have a negative variance of 30 minutes. 4 Santa Ana District reduced more than 600 routes in the last 3.5 years.
5 The Postal Service business strategy, Delivery Results, Innovation, Value and Efficiency (DRIVE), has an initiative
titled Delivery Optimization. The strategy is to optimize carrier routes by reducing and eliminating office time and adjusting (reducing) the number of routes. 6 Though there were more than 500,000 unused hours, we only identified routes from delivery units with enough
excess capacity over the course of FY 2011 to account for a full excess route (see Appendix C). 7 We calculated the 33 routes for FY 2011. The Joint Alternative Route Adjustment Process (JARAP) process did not
end until February 2012.

City Delivery – Excess Routes DR-AR-12-002
2
Excess city routes exist because of the rapid decline in workload along with changes in the workload due to implementation of automated systems. Eliminating the 33 excess city routes and transferring the associated vehicles to rural delivery routes could reduce rural delivery equipment maintenance allowance (EMA) costs by a $250,110 annual discounted savings or $500,220 over 2 years. We also identified assets at risk totaling $45,912 at two delivery units due to inadequate asset safeguards. Management immediately initiated corrective actions on these security matters. Excess Routes Our analysis indicated that excess capacity existed in the 10 districts. For example, FY 2011 data indicated that 10 districts had a negative street variance, using 530,703 fewer hours than projected. Regular city routes are established at 8 hours per day, with about 2 hours in the office and 6 hours for street delivery. We analyzed FY 2011 route data and determined that, of the 10 districts reviewed, 82 percent were projected at using fewer than the established 8 hours per day. In fact, these routes had actual route times averaging 7 hours and 44 minutes per day. As a result, we identified delivery units in these districts with excess capacity. In fact, they had excess capacity over the course of FY 2011 equivalent to at least a full route.8 In these districts, we found 33 excess city routes that management could eliminate (see Table 1).
Table 1. U.S. Postal Service Office of Inspector General Analysis of Negative Street Variance and Routes in FY 2011
Source: Enterprise Data Warehouse (EDW) and U.S. Postal Service Office of Inspector General (OIG) Analysis.
8 Each excess route represents 2,424 hours, which is the time needed for one route over 1 year -- 303 delivery days
multiplied by 8 hours for FY 2011. 9 Although our review identified opportunity to reduce an additional nine routes in the Santa Ana District, this district has been very aggressive in reducing route structure and workhours resulting in the reduction of more than 600 routes in the last 3.5 years.
District Projected
Street Hours Actual
Street Hours Street
Variance
Average Actual
Total Time Per Route in Hours
Excess Routes & Delivery Vehicles
Santa Ana 7,716,590 7,614,281 (102,308) 7.45 99
Triboro 4,777,330 4,699,682 (77,648) 7.76 2
Greater Boston 7,203,144 7,135,617 (67,527) 7.74 5
Tennessee 3,187,389 3,132,731 (54,659) 7.56 2
Nevada-Sierra 2,524,057 2,477,263 (46,794) 7.73 4
Baltimore 2,994,891 2,948,931 (45,960) 7.71 6
Northern Ohio 7,146,734 7,104,906 (41,828) 7.39 1
Alabama 2,512,329 2,472,641 (39,688) 7.12 1
Fort Worth 2,927,708 2,895,445 (32,263) 6.97 2
Appalachian 1,564,797 1,542,768 (22,029) 6.94 1
Total 42,554,969 42,024,265 (530,703) 7.44 33

City Delivery – Excess Routes DR-AR-12-002
3
Furthermore, over the course of 1 year, workloads vary based on mail volume and workhours are expected to mirror the workloads.10 Ideally, the workload fluctuations over the course of 1 year will balance close to the planned workhours. However, continual use of fewer than projected hours indicates excess capacity and an opportunity to reduce costs. We analyzed the projected versus the actual street hours for the last 3 fiscal years in these 10 districts and determined these districts have consistently used fewer hours than projected, creating a negative street variance (see Table 2).
Table 2. Negative Street Variance for FYs 2009 – 2011 District FY 2009 FY 2010 FY 2011
Greater Boston (108,594) (149,773) (67,527)
Triboro (36,234) (28,561) (77,648)
Baltimore (85,453) (55,358) (45,960)
Appalachian (21,358) (15,394) (22,029)
Alabama (33,267) (18,535) (39,688)
Tennessee (29,873) (43,995) (54,659)
Northern Ohio (90,012) (39,175) (41,828)
Fort Worth (71,922) (42,209) (32,263)
Nevada-Sierra (46,237) (23,677) (46,794)
Santa Ana (39,923) (81,810) (102,308)
Total (562,873) (498,486) (530,703) Source: EDW and OIG Analysis.
Excess capacity or routes existed in these districts for the following reasons: Headquarters, area, and district management stated they were not concerned with
districts using fewer than projected street hours. Further, some officials initially stated that using fewer street hours than projected was an indication these districts were efficient. In most cases, using fewer actual hours than projected is considered positive and an efficient street performance.
Excess capacity in the 10 districts also existed because district management was not always able to eliminate or consolidate routes. Specifically, the adjustment process required district management to negotiate with the union to adjust or eliminate routes.11 Management indicated these negotiations did not always result in adjusting, consolidating, or eliminating routes, therefore, making the projected hours more than needed for street delivery.
Managers also informed the OIG they had little to no say in what happened with route adjustments. For example, one manager indicated they could eliminate 10 routes or more in one location because the manager was consistently using fewer hours than projected for street delivery. However, negotiations with the union
10
To offset periods of increased workload, the periods of decreased workload combined with the effective use of management tools, such as pivoting, can result in a negative street variance, or undertime. 11
Memorandum of Understanding (MOU) between the U.S. Postal Service and the National Association of Letter Carriers; Joint Alternate Route Adjustment Process (JARAP), March 22, 2011.

City Delivery – Excess Routes DR-AR-12-002
4
only allowed the station to remove one route. Also, in another case, a district official indicated the union did not agree to any of the route adjustments the district submitted.12 Headquarters management informed us they are continually monitoring the route adjustment process and making changes where necessary.
In our discussions with district officials, they agreed with the OIG’s conclusion that their districts have excess capacity and routes that should be eliminated. Management further stated this was an area for improvement by reviewing route and unit performance to eliminate routes consistently using less than the projected hours. Several districts also informed the OIG they had begun to eliminate routes at the units we reviewed in this audit. City and rural delivery could both benefit by reducing these excess city routes. In city delivery, most routes are assigned a postal-owned delivery vehicle. In the national labor agreement between the Postal Service and the National Rural Letter Carriers’ Association, the Postal Service agreed to provide 15,000 vehicles for rural routes during the period January 1, 2009, through December 31, 2013. As of pay period 2, FY 2012, the Postal Service was obligated to transfer 5,804 additional vehicles to rural delivery. As stated earlier in our report, the 10 districts have 33 excess city routes with assigned vehicles. Therefore, 33 vehicles can be transferred from the eliminated city routes to rural delivery in these districts.
An increased focus on improving the route and street management process by eliminating excess city routes and transferring the associated vehicles could reduce rural delivery EMA operating costs by $250,110 annual discounted savings or $500,220 over 2 years. Other Issues Physical access control and safeguarding of assets required additional management attention. Specifically, at two13 of the units visited, stamp stock inventory or cash was not properly safeguarded and, at one of the locations, the rear entry access door to the facility was not locked. Additionally, safes were not locked properly at either location.14 Two of the safes contained stamp stock inventory valued of $45,912.11. Physical access controls reduce the security risk to Postal Service employees while safeguarding controls reduces the potential for loss or misappropriation of assets. 15 We brought these control issues to the attention of station managers, supervisors, or other personnel who took immediate action to correct the situation. As a result, we are making no recommendations on these issues.
12
Many route adjustments were made using carrier demonstrated ability (how the carrier had been performing on a daily basis without supervision) instead of the more accurate observation on the route. 13
We judgmentally selected six sites to evaluate the physical security and safeguarding of assets. 14
Safes are required to be locked except when authorized personnel are getting safe contents for use. 15
Assets or accountable items at risk - assets or accountable items (for example, cash, stamps, and money orders) that are at risk of loss because of inadequate internal controls.

City Delivery – Excess Routes DR-AR-12-002
5
Recommendations
We recommend the district managers:
1. Eliminate 33 excess city delivery routes in their respective districts.
2. Review delivery units consistently using fewer than projected street hours to make appropriate route adjustments, eliminations, and consolidations.
3. Reallocate the 33 assigned Postal Service-owned delivery vehicles from the eliminated city routes to rural routes to achieve an associated economic impact of $250,110 annual discounted savings or $500,220 over 2 years.
Management’s Comments All of the districts agreed with the findings, recommendations, and monetary impact. In response to recommendation 1, management agreed to reduce excess city delivery routes and make applicable changes by May 31, 2013. Management stated they conducted or planned to conduct formal route inspections to eliminate the routes indicated in the finding. In response to recommendation 2, management in all the districts agreed it is important to monitor all units and review delivery units using fewer than projected street hours and make appropriate adjustments. Management stated they are conducting trend analysis, weekly teleconferences, and route inspections to close the gap on route variances. They plan to complete these actions by May 31, 2013.
In response to recommendation 3, management in the 10 districts stated by eliminating city delivery routes, delivery vehicles would be relocated within their districts for rural use or transferred to another district within their area for rural use by June 30, 2013. See Appendix D for management’s comments, in their entirety. Evaluation of Management’s Comments
The OIG considers management’s comments responsive to the recommendations and corrective actions should resolve the issues identified in the report. The OIG considers all the recommendations significant, and therefore requires OIG concurrence before closure. Consequently, the OIG requests written confirmation when corrective actions are completed. These recommendations should not be closed in the Postal Service’s follow-up tracking system until the OIG provides written confirmation that the recommendations can be closed.

City Delivery – Excess Routes DR-AR-12-002
6
Appendix A: Additional Information
Background The Postal Service faces the most difficult operating period in its 235-year history. Mail volume in FY 2011 declined by 3 billion pieces to 168 billion, dropping total mail volume to levels not seen since 1992. Since 2007, mail volume has dropped by about 44 billion pieces. The Postal Service must improve operational efficiency to reduce costs while facing financial losses from declining mail volumes. Delivery operations are the highest fixed cost in the system, making up more than 30 percent of the Postal Service’s operating expenses. Within the delivery carrier’s function, street operations make up 264,989,254 workhours, which is more than 76 percent of the overall 349,564,154 total office and street workhours16 city carriers used in FY 2011. The Postal Service has 204,56017 full-time carriers who are guaranteed 8 hours a day — about 2 hours in the office and 6 hours on the street. Because of the significant decline in mail volume over the last 4 years, many carriers do not have a full 8-hour work day. A carrier’s base street time is determined by street observation or by the average street time a carrier puts in over 7 weeks.18 This information is put into the DOIS as the projected19 street time for the route. When a carrier performs better or worse than the established street time, a variance occurs. If a carrier finishes a route earlier than expected, a negative variance occurs. Managers can manage the variances by adjusting the routes. Management adjusts routes using the JARAP and, as part of this process, use the Carrier Optimal Routing (COR) System. The JARAP is based on an agreement between the Postal Service and the National Association of Letter Carriers to evaluate and adjust city delivery routes through a joint expedited evaluation and adjustment process. The agreement intends that both parties evaluate routes and agree on how and where routes will be adjusted. COR is a computer modeling program that uses data to objectively configure compact, contiguous routes and determine safe, efficient travel patterns while reducing workhours.
16
Delivery Operations Information System (DOIS) workhours queried from the EDW. 17
This number was obtained from the EDW. 18
Postal Service Handbook M-39, Management of Delivery Services. 19
Projected street hours are hours the put in DOIS based on street reviews.
City Delivery – Excess Routes DR-AR-12-002
7
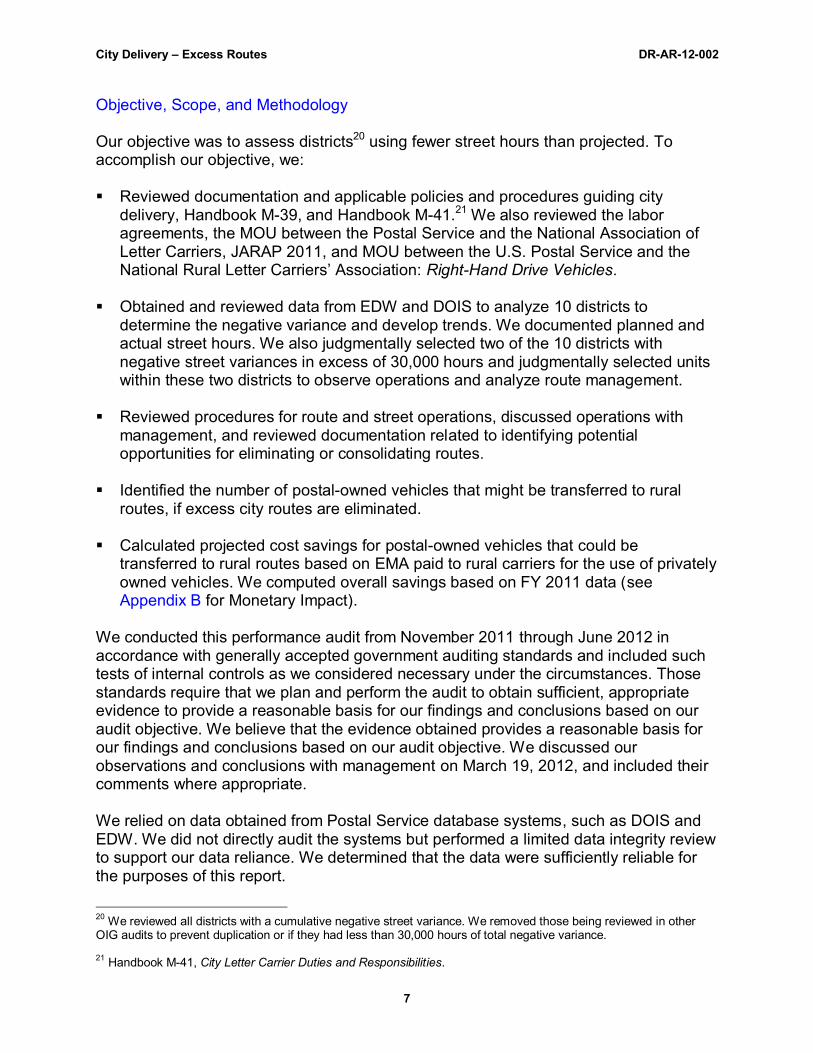
Objective, Scope, and Methodology Our objective was to assess districts20 using fewer street hours than projected. To accomplish our objective, we: Reviewed documentation and applicable policies and procedures guiding city
delivery, Handbook M-39, and Handbook M-41.21 We also reviewed the labor agreements, the MOU between the Postal Service and the National Association of Letter Carriers, JARAP 2011, and MOU between the U.S. Postal Service and the National Rural Letter Carriers’ Association: Right-Hand Drive Vehicles.
Obtained and reviewed data from EDW and DOIS to analyze 10 districts to
determine the negative variance and develop trends. We documented planned and actual street hours. We also judgmentally selected two of the 10 districts with negative street variances in excess of 30,000 hours and judgmentally selected units within these two districts to observe operations and analyze route management.
Reviewed procedures for route and street operations, discussed operations with
management, and reviewed documentation related to identifying potential opportunities for eliminating or consolidating routes.
Identified the number of postal-owned vehicles that might be transferred to rural
routes, if excess city routes are eliminated. Calculated projected cost savings for postal-owned vehicles that could be
transferred to rural routes based on EMA paid to rural carriers for the use of privately owned vehicles. We computed overall savings based on FY 2011 data (see Appendix B for Monetary Impact).
We conducted this performance audit from November 2011 through June 2012 in accordance with generally accepted government auditing standards and included such tests of internal controls as we considered necessary under the circumstances. Those standards require that we plan and perform the audit to obtain sufficient, appropriate
evidence to provide a reasonable basis for our findings and conclusions based on our audit objective. We believe that the evidence obtained provides a reasonable basis for our findings and conclusions based on our audit objective. We discussed our observations and conclusions with management on March 19, 2012, and included their comments where appropriate. We relied on data obtained from Postal Service database systems, such as DOIS and EDW. We did not directly audit the systems but performed a limited data integrity review to support our data reliance. We determined that the data were sufficiently reliable for the purposes of this report.
20
We reviewed all districts with a cumulative negative street variance. We removed those being reviewed in other OIG audits to prevent duplication or if they had less than 30,000 hours of total negative variance. 21
Handbook M-41, City Letter Carrier Duties and Responsibilities.

City Delivery – Excess Routes DR-AR-12-002
8
Prior Audit Coverage We did not identify any prior audits related to our objective.

City Delivery – Excess Routes DR-AR-12-002
9
Appendix B: Monetary Impact
We estimated the monetary impact of $500,220 in funds put to better use by eliminating 33 routes and transferring the associated vehicles to rural routes.
Finding Impact Category Amount
Operating Efficiency Funds Put to Better Use22 $500,220 Source: OIG.
This amount is based on the reduction of vehicles for each of the associated 33 routes, at a cost of $250,110 annual discounted savings over for 2 years using cash flow methodology (see Table 3). The transfer of vehicles from city delivery can reduce rural delivery costs of EMA paid to rural carriers that are currently using personal vehicles. In addition to the savings, this action will assist in meeting labor agreement obligations to provide vehicles to the National Rural Letter Carriers Association by 2013.
Table 3: Estimated Savings from Vehicles Transferred to
Rural Routes
District
City Delivery Vehicles for Transfer to Rural
Routes Annual EMA Savings23
Alabama 1 $8,484
Appalachian 1 8,484
Baltimore 6 50,904
Fort Worth 2 16,968
Greater Boston 5 42,420
Nevada-Sierra 4 33,936
Northern Ohio 1 8,484
Santa Ana 9 76,356
Tennessee 2 16,968
Triboro 2 16,968
Total 33 $279,97224 Source: EDW and OIG Analysis.
22
Funds that could be used more efficiently by implementing recommended actions. 23
We calculated the cost savings for each route by multiplying $28 for the EMA with 303 delivery days in a year. 24
This number is reduced to $250,110 annually, using the cash flow reduction methodology.

City Delivery – Excess Routes DR-AR-12-002
10
Appendix C: Excess Routes and Vehicles
District Delivery Unit Excess Routes and Vehicles
Alabama Florence Main Post Office 1
Appalachian Martinsville Main Post Office 1
Baltimore Annapolis Destination Delivery Unit 2
Baltimore Dundalk Sparrows Point 1
Baltimore Frederick 1
Baltimore Pasadena 1
Baltimore Westminster 1
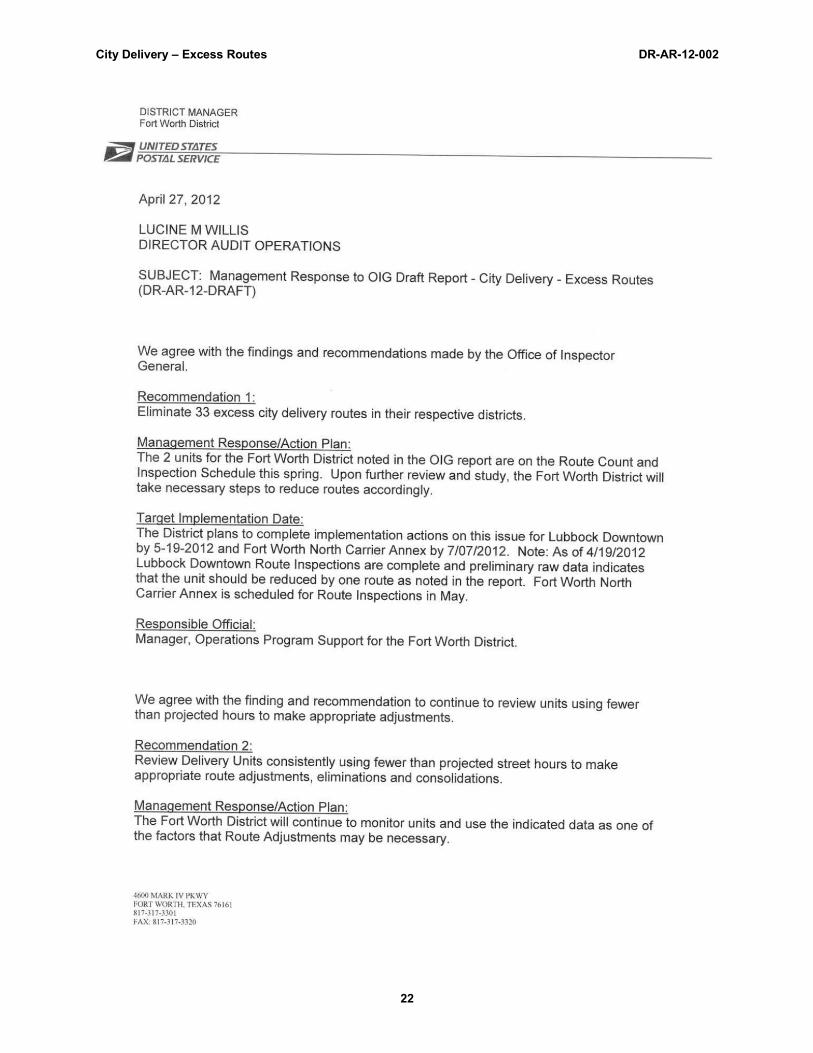
Fort Worth Fort Worth North Carrier Annex 1
Fort Worth Lubbock Downtown Station 1
Greater Boston Framingham 1
Greater Boston Marlborough 1
Greater Boston Porter Square 1
Greater Boston Woburn 2
Nevada-Sierra Las Vegas Sunrise Station 1
Nevada-Sierra North Las Vegas Main Post Office 1
Nevada-Sierra North Las Vegas Meadow Mesa Station 1
Nevada-Sierra Sparks, Main Post Office 1
Northern Ohio Lyndhurst/Mayfield 1
Santa Ana Chino Main Post Office 1
Santa Ana Diamond Bar Station 1
Santa Ana Irvine Main Post Office 1
Santa Ana Long Beach Downtown Station 2
Santa Ana Long Beach Loma Station 1
Santa Ana Paramount Main Post Office 1
Santa Ana Pomona Main Post Office 1
Santa Ana Santa Ana Diamond Station 1
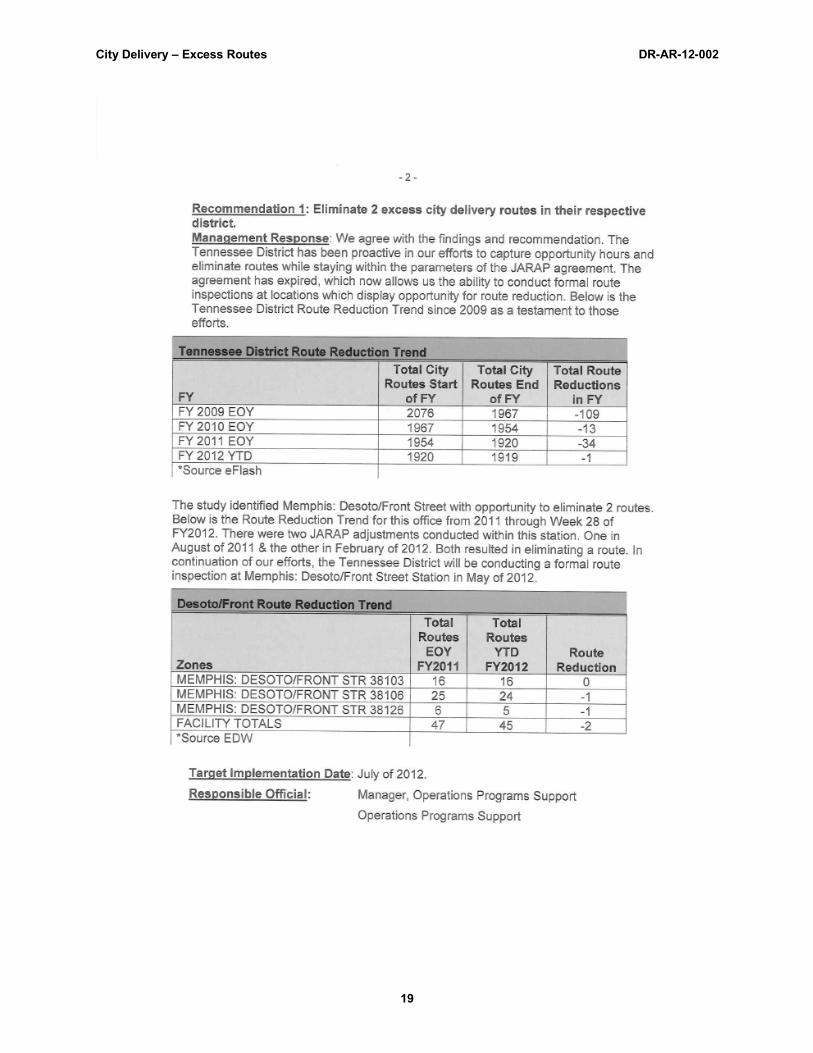
Tennessee Memphis: Desoto/Front 2
Triboro Jamaica Main Post Office 1
Triboro Long Island City Main Post Office 1
Total 33 Source: OIG Aanalysis.

City Delivery – Excess Routes DR-AR-12-002
11
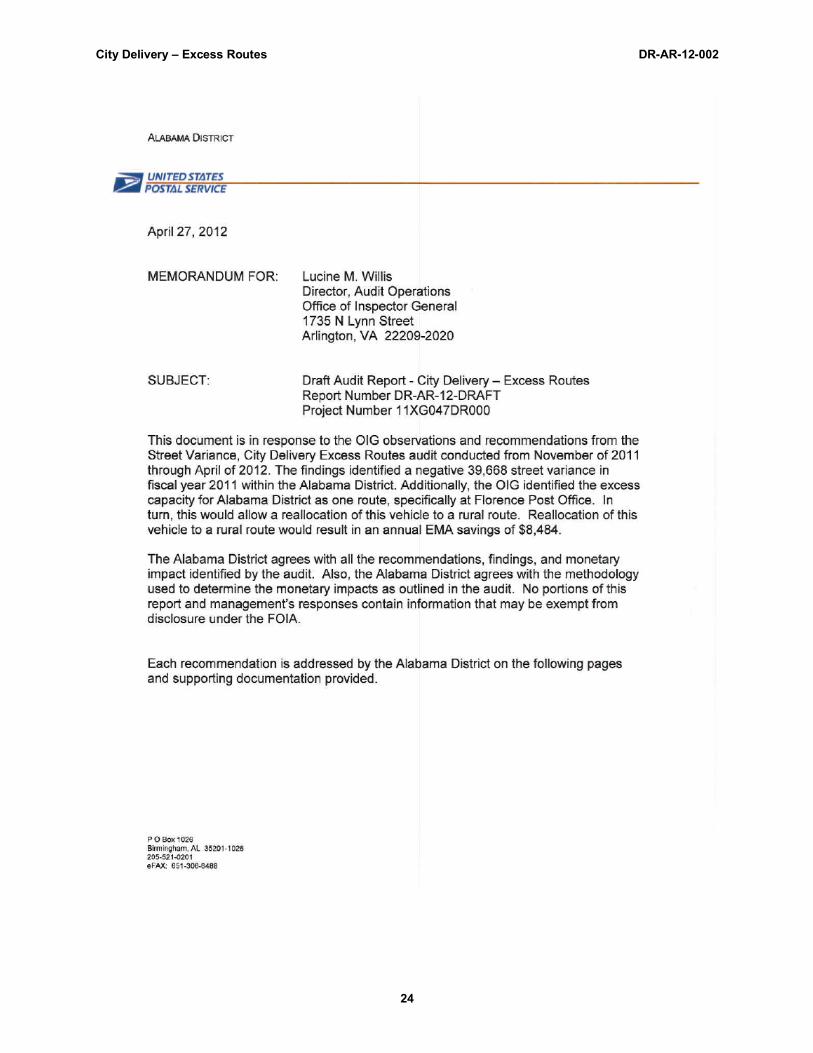
Appendix D: Management’s Comments

City Delivery – Excess Routes DR-AR-12-002
12

City Delivery – Excess Routes DR-AR-12-002
13

City Delivery – Excess Routes DR-AR-12-002
14

City Delivery – Excess Routes DR-AR-12-002
15

City Delivery – Excess Routes DR-AR-12-002
16

City Delivery – Excess Routes DR-AR-12-002
17

City Delivery – Excess Routes DR-AR-12-002
18
City Delivery – Excess Routes DR-AR-12-002
19

City Delivery – Excess Routes DR-AR-12-002
20

City Delivery – Excess Routes DR-AR-12-002
21
City Delivery – Excess Routes DR-AR-12-002
22

City Delivery – Excess Routes DR-AR-12-002
23
City Delivery – Excess Routes DR-AR-12-002
24

City Delivery – Excess Routes DR-AR-12-002
25

City Delivery – Excess Routes DR-AR-12-002
26

City Delivery – Excess Routes DR-AR-12-002
27

City Delivery – Excess Routes DR-AR-12-002
28

City Delivery – Excess Routes DR-AR-12-002
29

City Delivery – Excess Routes DR-AR-12-002
30

City Delivery – Excess Routes DR-AR-12-002
31

City Delivery – Excess Routes DR-AR-12-002
32

City Delivery – Excess Routes DR-AR-12-002
33

City Delivery – Excess Routes DR-AR-12-002
34

City Delivery – Excess Routes DR-AR-12-002
35

City Delivery – Excess Routes DR-AR-12-002
36

City Delivery – Excess Routes DR-AR-12-002
37

City Delivery – Excess Routes DR-AR-12-002
38