city academy 2017 - session 1 - finance
TRANSCRIPT

City Academy FY 2017


Budget Committee 7 Council Members / 7 Community Members

• Finance• Public Works• Downtown Planning• Railroad• Public Safety• Transportation• Air Quality• Economic Development• Planning

Assumptions Actual Actual Estimated Proposed Projection Projection Projection Projection2014 2015 2016 2017 2018 2019 2020 2021
Rate - single family home 48.25$ 49.70$ 51.81$ 53.73$ 55.72$ 57.78$ 58.79$ 59.82$ % increase - rates (% of CPI) 3.00% 3.00% 4.25% 3.70% 3.70% 3.70% 1.75% 1.75%CPI % 1.8% 2.5% 3.0% 1.8% 3.0% 3.0% 3.0% 3.0%Cumulative CPI % - 2015 forward 109.2% 100.0% 103.0% 104.9% 108.0% 111.2% 114.6% 118.0%Population growth rate 0.0% 0.0% 0.0% 1.0% 1.0% 1.0% 1.0% 1.0%Population increase - - - 94 95 96 97 97 Population 9,385 9,385 9,385 9,460 9,555 9,651 9,748 9,845 Franchise fee 5% 5% 5% 5% 5% 5% 5% 5%Interest earnings rate 0.5% 0.5% 1.0% 1.0% 1.5% 1.75% 2.00%
Capital outlay - 2015 dollars 175 175 200 200 200 200 200 200

Wastewater FundFinancial Proformas2014 - 2021 (amounts in thousands)
Actual Actual Estimated Proposed Projection Projection Projection ProjectionResources 2014 2015 2016 2017 2018 2019 2020 2021Charges for services 2,889$ 3,018$ 3,183$ 3,297$ 3,452$ 3,614$ 3,713$ 3,815$ IntergovernmentalInterest 3 4 3 4 8 9 10 31Miscellaneous 89 73 50 25 26 27 28 29SDC Reimbursement Fee 74 11 32 50 35 40 73 75WWTP Property Sales 566Debt Proceeds - 4,500 - Transfers 22
Total resources 3,055 3,694 3,268 7,876 3,521 3,690 3,824 3,950
ExpendituresPersonal services 200 117 110 113 120 127 135 143 Materials and services 451 536 520 570 593 617 642 668 Franchise fee 151 151 159 164 173 181 186 191 Capital outlay 111 118 492 135 216 222 229 236 Debt service Principal 459 491 523 5,061 644 859 895 925 DEQ CWSRF R74682/2 399 411 423 436 448 462 475 489 2011 Refunding issue 60 80 100 125 170 200 220 235 State of Oregon IFA 2015 - 26 27 28 27 DEQ - term loan FY 2018 - 4,500 - 170 172 174 USDA - 2015 - Interest 396 382 384 408 372 359 334 311 DEQ CWSRF R74682/2 189 177 165 152 139 126 112 98 2011 Refunding issue 207 205 219 201 195 188 180 172 State of Oregon IFA 2015 - 10 - 7 6 7 DEQ bridge loan - 2015 - 45 19 - - - DEQ - term loan - FY 2018 19 38 36 34 USDA - 2015 - - - - - - Fees 17 15 29 27 25 22 20 17 DEQ CWSRF R74682/1 - - - - - - - DEQ CWSRF R74682/2 17 15 29 27 25 22 20 17 Transfers 1,249 1,253 1,264 1,315 1,341 1,388 1,416 1,445
Total expenditures 3,034 3,063 3,481 7,793 3,484 3,775 3,857 3,936
Resources over/(under) expenditures 21 631 (213) 83 37 (85) (33) 14
Beginning fund balance 1,115 1,136 1,767 1,554 1,637 1,674 1,590 1,557
Ending fund balance 1,136$ 1,767$ 1,554$ 1,637$ 1,674$ 1,590$ 1,557$ 1,571$
Other requirements Debt service reserves 304 304 304 304 507 507 507 507
Available fund balance 832 1,463 1,250 1,333 1,167 1,083 1,050 1,064 Minimum fund balance 730 733 731 754 771 790 806 821 Difference 102 730 519 579 396 293 244 243

Council
The City of Prineville provides quality municipal services and programs which contribute to our reputation as a desirable place to live, work and play.
We strive to improve our quality of life through transparency, open communication, investment in essential infrastructure, public safety, community programs and business, all while staying within the constraints of a fiscally responsible government.

Council
• Continue to fiscally responsible in all we do.• Provide quality municipal services and programs which contribute
to Prineville’s reputation as a desirable place to live, work and play.• Continue improving on transparency.• Continue striving to improve quality of life through investment in
essential infrastructure to our citizens and businesses.• Community safety.• Effective public communication.

Council
• Revenue• Operating Expenditures• Expenditure Control• Capital Equipment and Improvements• Accounting and Financial Reporting• Financial Planning• Debt• Pension Funding• Reserves • Management of Fiscal Policies

Staff

• Identify and estimate revenue sources realistically and prudently• Outline programs and activities that will
best achieve desired results• Utilizing long range planning models and
financial software• Examine requests for personnel,
maintenance expenditures, additional debt, and capital requests• Make sure requests line up with policies,
Council goals, and Oregon budget law• We make sure proper budget controls
and proper spending authority is in place• Our budget must be balanced according
to Oregon budget law• In compliance using best practices

Distinguished
• Government Finance Officer Association (GFOA) for the “Distinguished Budget Presentation Award”• The budget is reviewed by three different
reviewers annually, giving us suggestions on how to create a document that communicates better, is a better operations and financial guide, and a better policy document. • The budget incorporates best practices
that are recognized throughout the Untied States and Canada• We are also working on obtaining the
“Certificate of Achievement for Excellence in Financial Reporting”
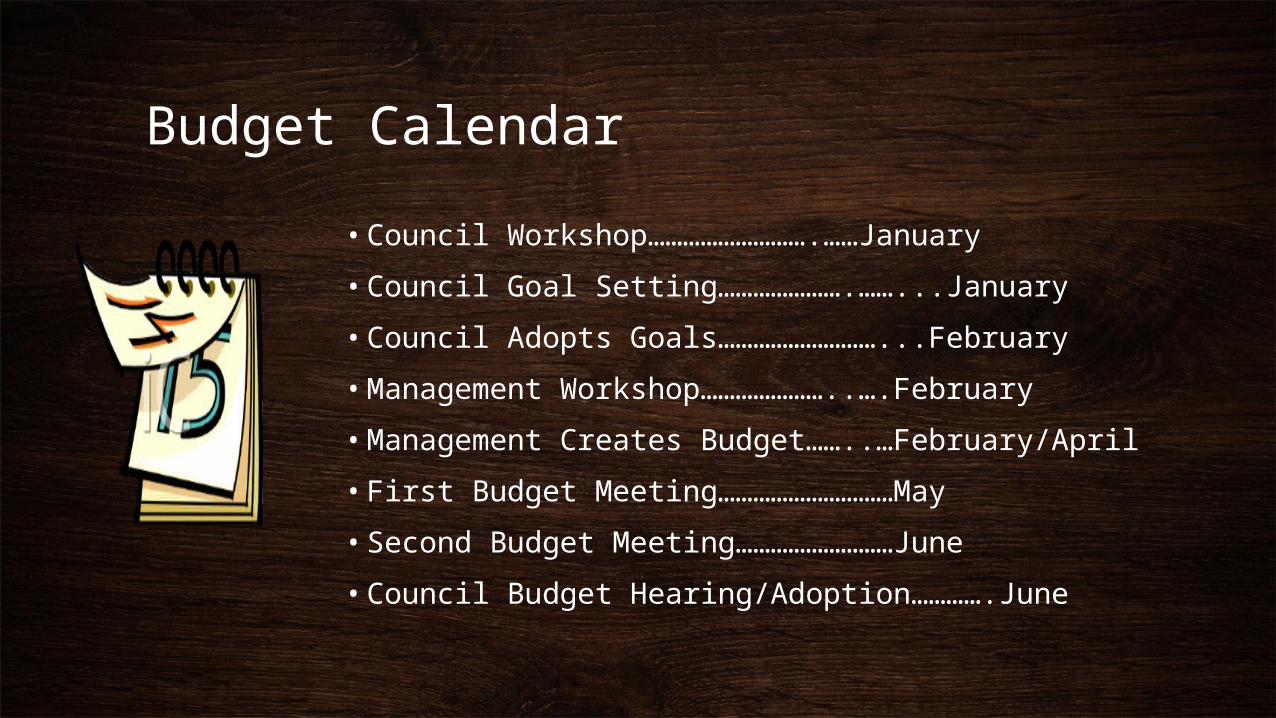
Budget Calendar• Council Workshop……………………….……January• Council Goal Setting………………….……...January• Council Adopts Goals………………………...February• Management Workshop…………………..….February• Management Creates Budget……..…February/April• First Budget Meeting…………………………May• Second Budget Meeting………………………June• Council Budget Hearing/Adoption………….June


Total City Assets June 30, 2016
2007 2008 2009 2010 2011 2012 2013 2014 2015 2016$58,000,000.00
$60,000,000.00
$62,000,000.00
$64,000,000.00
$66,000,000.00
$68,000,000.00
$70,000,000.00
$72,000,000.00
$74,000,000.00
$76,000,000.00

Total Net Position June 30, 2016
2007 2008 2009 2010 2011 2012 2013 2014 2015 2016$25,000,000.00
$30,000,000.00
$35,000,000.00
$40,000,000.00
$45,000,000.00
$50,000,000.00

City DebtJUNE 30, 2016UNAUDITED

Total Outstanding Debt June 30, 2016, Estimated Debt for 2017
Unaudited
2006 2007 2008 2009 2010 2011 2012 2013 2014 2015 2016 2017$10,000,000.00
$12,000,000.00
$14,000,000.00
$16,000,000.00
$18,000,000.00
$20,000,000.00
$22,000,000.00
$24,000,000.00
$26,000,000.00
$28,000,000.00

Debt Per Capita June 30, 2016, Estimated Debt Per Capita for 2017
Unaudited
2006 2007 2008 2009 2010 2011 2012 2013 2014 2015 2016 2017$1,000.00
$1,500.00
$2,000.00
$2,500.00
$3,000.00

Total Debt Comparison 2017estimated/unaudited
0
50,000,000
100,000,000
150,000,000
200,000,000
250,000,000Prineville
Madras
Redmond
Bend
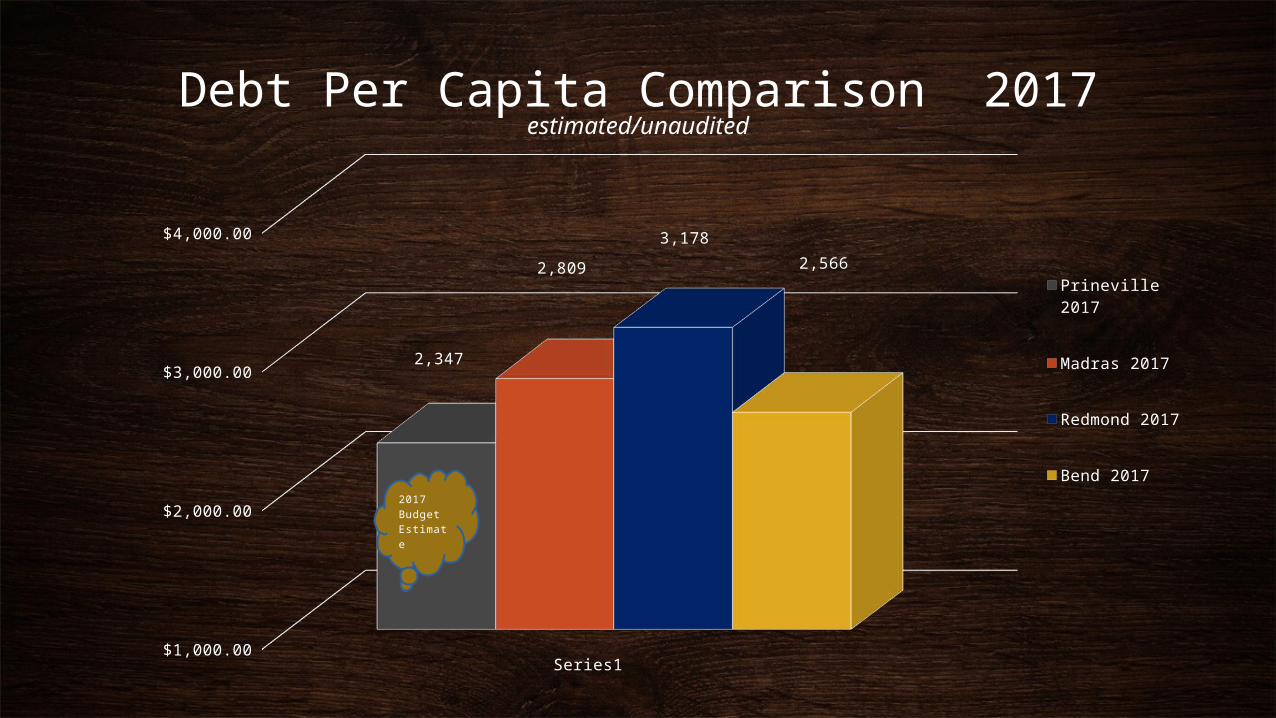
Debt Per Capita Comparison 2017estimated/unaudited
Series1$1,000.00
$2,000.00
$3,000.00
$4,000.00
2,347
2,809 3,178
2,566 Prineville 2017
Madras 2017
Redmond 2017
Bend 20172017BudgetEstimate

Outstanding Debt by Fund June 30,2016Governmental Type Funds
City Hall - 2005 USDA Rural Development 1,394,997$ Pension Obligation Bond - 2014 2,695,000
Business Type Funds Water - 2003 Revenue Bond 380,000
Wastewater - 2004 DEQ 5,271,942 Water - 2011 FFCO Refunding 2,385,000 Wastewater - 2011 FFCO Refunding 4,695,000 Golf - 2011 FFCO 445,000 Golf - 2011 US Bank Note Payable 23,473 Freight Depot - 2011 US Bank Note Payable 49,387 Golf - 2015 BOTC 155,612 Public Works - 2016 Kansas State Bank 129,824
17,625,235$


2017 Budget Highlights• Total Budget $45 Million• General Fund $6.35 Million• Capital Improvements $11.56 Million• Grant Dollars $6.2 Million• Additional Debt $4.58 Million• City Retains Standard and Poor’s
Credit Rating of A+• 11 out of 13 Funds Meet Policy Levels

Percent of Total Requirements by Fund
14%3%
3%1% 3%
1%2%
0%
11%
4%
11%
9%
21%
4%5% 4% 2% 0%
General Transportation Emergency Dispatch PlanningLID Debt Service PERS / POB Transportation SDC Water SDC Wastewater SDC Railroad Airport Water Wastewater Golf Course and Restaurant Admin/Financial Support Services Public Works Support Services Building Facilities FundPlaza Maintenance

Revenue General Fund

Your Tax Dollars
Education46%
County29%
City of Prineville7%
CC Parks & Rec3%
Fire Districts11%
Other 4%

Tax dollars Received from the County
2007 2008 2009 2010 2011 2012 2013 2014 2015 2016 2017 1,300,000
1,400,000
1,500,000
1,600,000
1,700,000
1,800,000
1,900,000
2,000,000
2,100,000

General Fund Property Tax/Electrical Franchise Fee Trends FY 2010-2016
2017 estimated
FY 20
10FY
2011
FY 20
12FY
2013
FY 20
14FY
2015
FY 20
16FY
2017
- 200,000 400,000 600,000 800,000
1,000,000 1,200,000 1,400,000 1,600,000 1,800,000 2,000,000
Property TaxFranchise Fees

General Fund Police Budget/Tax Collection
Trends FY 2010-2017
FY 2010 FY 2011 FY 2012 FY 2013 FY 2014 FY 2015 FY 2016 FY 2017 -
500,000
1,000,000
1,500,000
2,000,000
2,500,000
3,000,000
3,500,000
4,000,000

General Fund Operating Revenue
41%
6%
41%
5%
5% 2%
Property TaxTransiet Lodging TaxFranchise FeesIntergovernmental RevenuesCharges for ServiceOther Revenue

0% 10% 20% 30% 40% 50% 60% 70% 80% 90% 100%
Publi
c Safe
ty 79
%
Tran
spor
tation
6%Pla
nning
7%Gen
eral
Gov-
ernm
ent 8
%

General Fund Balance
FY 20
10
FY 20
11
FY 20
12
FY 20
13
FY 20
14
FY 20
15
FY 20
16
FY 20
17
- 200,000 400,000 600,000 800,000
1,000,000 1,200,000
Beginning Fund Balance General FundLinear (Beginning Fund Balance General Fund)Ending Fund Balance
