cinnaminson township public schools 2011 test score presentation
TRANSCRIPT
CINNAMINSON TOWNSHIP PUBLIC SCHOOLS
2011 TEST SCORE PRESENTATION

CINNAMINSON SCHOOL DISTRICT TEST SCORE PRESENTATION 2011
The following are some points to consider as you review the test data.
Education in New Jersey ranks close to the top in national achievement as measured by NAEP, the National Assessment of Educational Progress. NJ ranks 2nd in the nation in grades 4 and 8 reading. NJ moved from 5th to 4th place in grade 4 math and from 5th to 3rd place in grade 8 math. Nearly all subgroups have improved since 2003, but there is still a gap in achievement between the total population and subgroups.
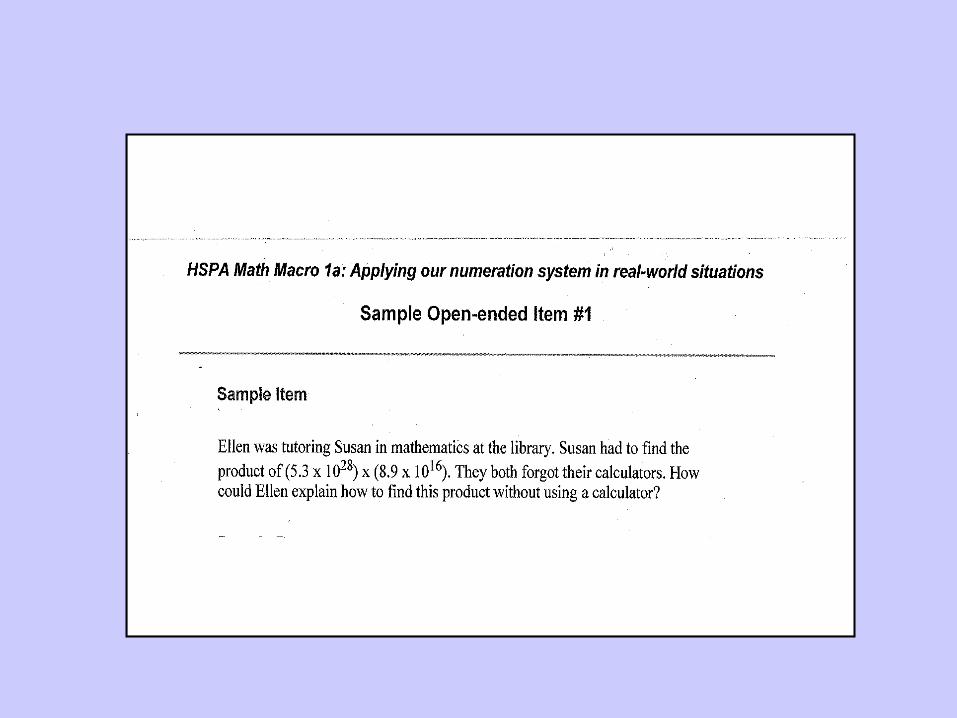
State tests, as required by No Child Left Behind, are different in every state. What do the questions look like on NJ state tests? Neither teachers nor administrators are permitted to see the actual test questions. Within the slideshow, there are sample questions.
While scores have been fairly steady in many areas, there are some notable changes in 2011.

This year our scores are higher than ourDFG* and the state average in total scores for every test.
Other changes:We have seen a 4 year upswing in math 8. There has been a 3 year upswing in math 5. There has been a 3 year decline in LAL 5.
Adequate Yearly Progress (AYP) is the state scale for indicating that schools are meeting requirements. The number indicates the percentage of students achieving scores of 200. Those expectations increased considerably in 2011 over 2010. While AYP improved over the report of 2010, and all total scores met requirements, three building subgroups failed to make AYP.
There has been a decline in SAT scores. This situation is being addressed at the HS with The Princeton Review providing services to students and teachers along with other changes to the program.
Cinnaminson has developed plans to recognize what practices supported increased scores so that we can continue those practices. We have also developed plans for improvement in areas where we have not seen insufficient growth.
*DFG is the District Factor Group, a measure of income, education and other factors to compare communities. Our DFG is FG.

Grade 5 Sample Question - Math

Grade 8 Science: Sample
Test Question

0.0
20.0
40.0
60.0
80.0
100.0
Grade 3 89.9 89.8 82.3 91.7 96.0
2011 2010 **2009 2008 2007
5 YEAR TREND: NJ ASK 3 – MATH
Percentage of Total Population Passing
** Test was redesigned for 2009 administration
0.0
20.0
40.0
60.0
80.0
100.0
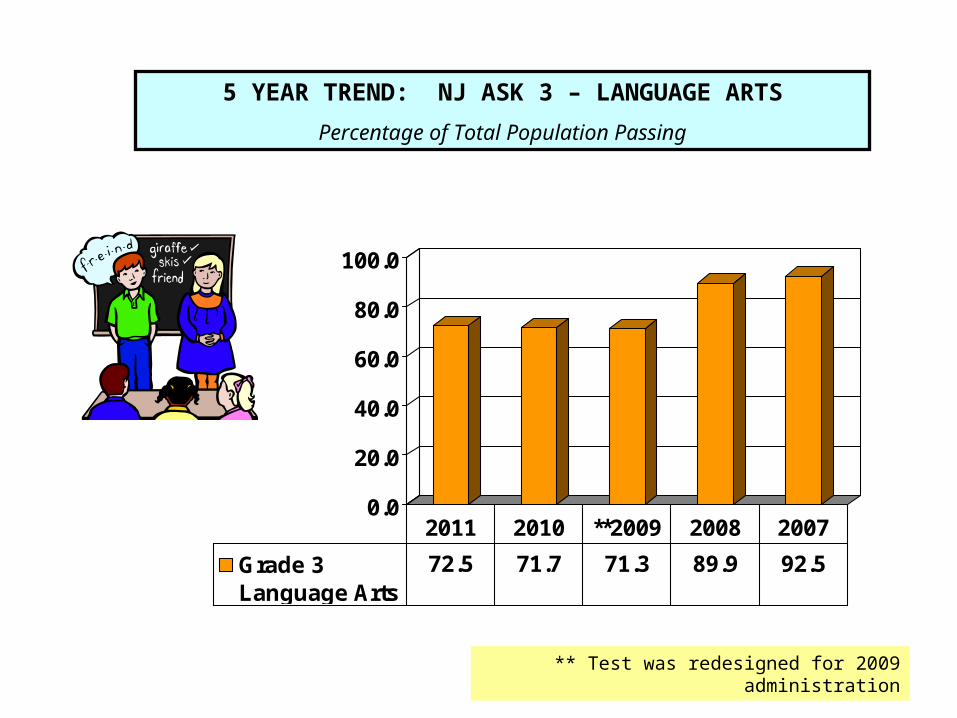
Grade 3Language Arts
72.5 71.7 71.3 89.9 92.5
2011 2010 **2009 2008 2007
5 YEAR TREND: NJ ASK 3 – LANGUAGE ARTS
Percentage of Total Population Passing
** Test was redesigned for 2009 administration

0.0
20.0
40.0
60.0
80.0
100.0
Grade 4 84.6 89.1 81.5 94.3 96.3
2011 2010 **2009 2008 2007
5 YEAR TREND: NJ ASK 4 – MATH
Percentage of Total Population Passing
**Test was redesigned for 2009 administration

0.0
20.0
40.0
60.0
80.0
100.0
GRADE 4 74.6 63.7 72.7 89.1 91.4
2011 2010 **2009 2008 2007
5 YEAR TREND: NJ ASK 4 – LANGUAGE ARTS
Percentage of Total Population Passing
**Test was redesigned for 2009 administration

0.0
20.0
40.0
60.0
80.0
100.0
Grade 5 91.8 86.7 85.6 91.9 94.7
2011 2010 2009 **2008 2007
5 YEAR TREND: NJ ASK 5 – MATH
Percentage of Total Population Passing
**Test was redesigned for 2008 administration

0.0
20.0
40.0
60.0
80.0
100.0
GRADE 5 70.6 72.5 80.7 73.1 97.0
2011 2010 2009 **2008 2007
5 YEAR TREND: NJ ASK 5 – LANGUAGE ARTS
Percentage of Total Population Passing
**Test was redesigned for 2008 administration

0.0
20.0
40.0
60.0
80.0
100.0
Grade 6 79.9 73.7 83.3 73.3 87.1
2011 2010 2009 **2008 2007
5 YEAR TREND: NJ ASK 6 – MATH
Percentage of Total Population Passing
**Test was redesigned for 2008 administration

0.0
20.0
40.0
60.0
80.0
100.0
GRADE 6 75.8 72.6 87.9 64.5 82.6
2011 2010 2009 **2008 2007
5 YEAR TREND: NJ ASK 6 – LANGUAGE ARTS
Percentage of Total Population Passing
**Test was redesigned for 2008 administration

0.0
20.0
40.0
60.0
80.0
100.0
Grade 7 70.9 67.2 70.8 65.4 73.4
2011 2010 2009 **2008 2007
5 YEAR TREND: NJ ASK 7– MATH
Percentage of Total Population Passing
**Test was redesigned for 2008 administration
0.0
20.0
40.0
60.0
80.0
100.0
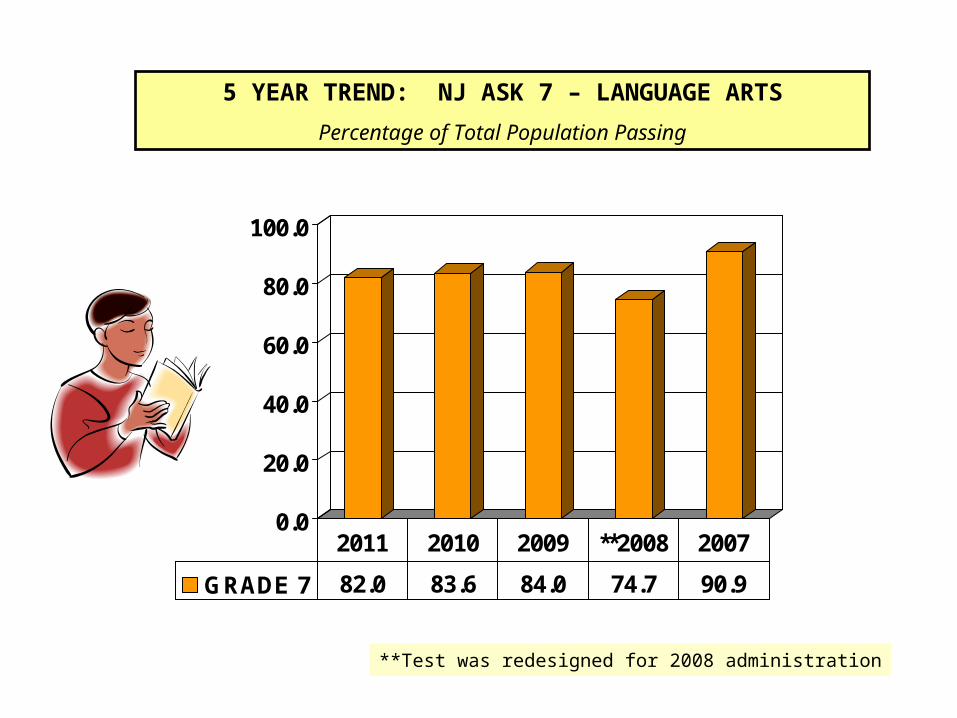
GRADE 7 82.0 83.6 84.0 74.7 90.9
2011 2010 2009 **2008 2007
5 YEAR TREND: NJ ASK 7 – LANGUAGE ARTS
Percentage of Total Population Passing
**Test was redesigned for 2008 administration

0.0
20.0
40.0
60.0
80.0
100.0
Grade 8 76.5 68.2 68.2 67.0 GEPA
2011 2010 2009 **2008 2007
4 YEAR TREND: NJ ASK 8– MATH
Percentage of Total Population Passing
**Test was redesigned for 2008 administration

0.0
20.0
40.0
60.0
80.0
100.0
GRADE 8 91.3 92.4 84.9 90.4 GEPA
2011 2010 2009 **2008 2007
4 YEAR TREND: NJ ASK 8 – LANGUAGE ARTS
Percentage of Total Population Passing
**Test was redesigned for 2008 administration

0.0
20.0
40.0
60.0
80.0
100.0
District 79.2 76.9 81.6 83.6 85.8
DFG 78.7 77.1 81.6 80.3 79.1
State 75.2 74.1 72.7 83.6 73.4
2011 2010 2009 2008 2007
HSPA – 5 YEAR TREND (2007 – 2011)
MATHBased on Total Population Scoring Proficient and Advanced Proficient for First Time Test Takers
0.0
20.0
40.0
60.0
80.0
100.0
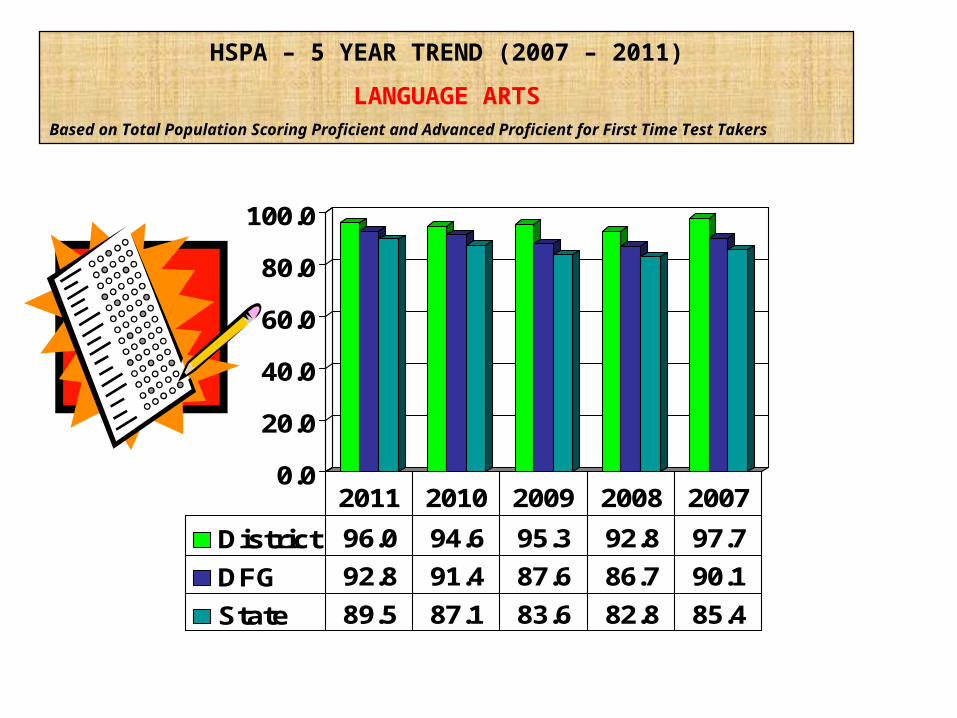
District 96.0 94.6 95.3 92.8 97.7
DFG 92.8 91.4 87.6 86.7 90.1
State 89.5 87.1 83.6 82.8 85.4
2011 2010 2009 2008 2007
HSPA – 5 YEAR TREND (2007 – 2011)
LANGUAGE ARTSBased on Total Population Scoring Proficient and Advanced Proficient for First Time Test Takers

0.0
20.0
40.0
60.0
80.0
100.0
District 79.9 73.7 70.9 67.2 76.5 68.3
DFG 80.9 76.5 69.7 68.1 74.4 72.1
State 77.3 71.8 65.7 64.3 71.5 68.5
Grade 6 2011
Grade 6 2010
Grade 7 2011
Grade 7 2010
Grade 8 2011
Grade 8 2010
ASK 3 – 5 COMPARISON TO DFG AND STATE
2011 AND 2010
Percentage of total population scoring proficient and advanced proficient
ASK 6-8 MATH
COMPARISON TO DFG AND STATE:
2011 AND 2010
Percentage of total population scoring proficient and advanced proficient
0.0
20.0
40.0
60.0
80.0
100.0
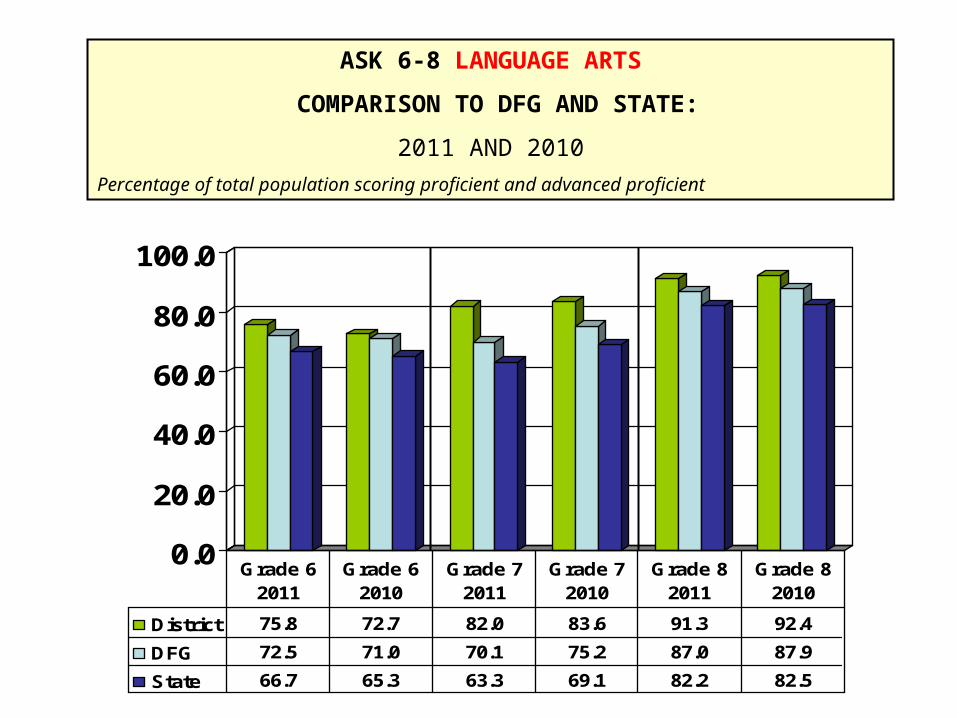
District 75.8 72.7 82.0 83.6 91.3 92.4
DFG 72.5 71.0 70.1 75.2 87.0 87.9
State 66.7 65.3 63.3 69.1 82.2 82.5
Grade 6 2011
Grade 6 2010
Grade 7 2011
Grade 7 2010
Grade 8 2011
Grade 8 2010
ASK 6-8 LANGUAGE ARTS
COMPARISON TO DFG AND STATE:
2011 AND 2010
Percentage of total population scoring proficient and advanced proficient

0.0
20.0
40.0
60.0
80.0
100.0
District 89.9 89.7 84.6 89.1 91.8 86.7
DFG 84.3 83.5 83.7 81.6 84.7 82.7
State 78.9 78.1 79.3 77.0 80.6 78.7
Grade 3 2011
Grade 3 2010
Grade 4 2011
Grade 4 2010
Grade 5 2011
Grade 5 2010
ASK 3 – 5 COMPARISON TO DFG AND STATE
2011 AND 2010
Percentage of total population scoring proficient and advanced proficient
ASK 3-5 MATH
COMPARISON TO DFG AND STATE:
2011 AND 2010
Percentage of total population scoring proficient and advanced proficient

0.0
20.0
40.0
60.0
80.0
100.0
District 72.5 71.7 74.6 63.7 70.6 72.5
DFG 69.7 66.0 69.6 65.3 67.8 68.7
State 63.0 59.7 62.7 59.6 60.9 63.1
Grade 3 2011
Grade 3 2010
Grade 4 2011
Grade 4 2010
Grade 5 2011
Grade 5 2010
ASK 3 – 5 COMPARISON TO DFG AND STATE
2011 AND 2010
Percentage of total population scoring proficient and advanced proficient
ASK 3-5 LANGUAGE ARTS
COMPARISON TO DFG AND STATE:
2011 AND 2010
Percentage of total population scoring proficient and advanced proficient

3 4 5 6 7 8 11
Sp Ed 66.7 67.9 69.0 42.3 18.5 33.3 40.9
Econ
Dis93.0 50.0 68.8 54.5 61.1 50.0 N/A
African American
66.7 56.2 92.3 42.9 57.9 35.7 N/A
2011 – STATE TESTING: MATH
Percentage of Sub-group Populations Scoring Proficient and Advanced Proficient

3 4 5 6 7 8 11
Sp Ed 40.0 28.6 44.8 26.9 44.4 60.0 81.8
Econ
Dis57.1 33.3 43.8 63.6 55.6 72.7 N/A
African American
46.2 31.2 53.8 52.4 78.9 50.0 N/A
2011 – STATE TESTING: LANGUAGE ARTS
Percentage of Sub-group Populations Scoring Proficient and Advanced Proficient

0.0
20.0
40.0
60.0
80.0
100.0
District 89.9 67.9 69.0 42.3 18.5 33.3 40.9
DFG 69.4 65.7 58.7 48.9 28.0 27.6 34.1
State 63.2 60.9 55.5 46.1 29.1 31.3 34.5
ASK 3 ASK 4 ASK 5 ASK 6 ASK 7 ASK 8HSPA
11
2011 ASK TEST RESULTS
Math Scores for SPECIAL EDUCATION – District: DFG: StateBased on Total Classified Population Scoring Proficient and Advanced Proficient

0.0
20.0
40.0
60.0
80.0
100.0
District 40.0 28.6 44.8 26.9 44.4 60.0 81.8
DFG 42.7 37.0 34.5 33.2 26.4 49.2 66.7
State 37.3 33.7 29.9 29.1 24.3 47.6 61.7
ASK 3 ASK 4 ASK 5 ASK 6 ASK 7 ASK 8 HSPA 11
2011 ASK TEST RESULTS
Language Arts Literacy Scores for SPECIAL EDUCATION
District: DFG: StateBased on Total Classified Population Scoring Proficient and Advanced Proficient

0.0
20.0
40.0
60.0
80.0
100.0
DISTRICT 91.3 90.6 89.9
DFG 86.6 89.1 94.9
STATE 81.2 82.4 90.9
2011 2010 2009
NJ ASK 8 SCIENCE – 3 YEAR HISTORY
Compared to DFG and State
Percentage of Total Population Passing

0.0
20.0
40.0
60.0
80.0
100.0
DISTRICT 96.4 99.0 95.5
DFG 94.6 96.7 94.9
STATE 96.4 93.4 90.9
2011 2010 2009
NJ ASK 4 SCIENCE – 3 YEAR HISTORY
Compared to DFG and State
Percentage of Total Population Passing
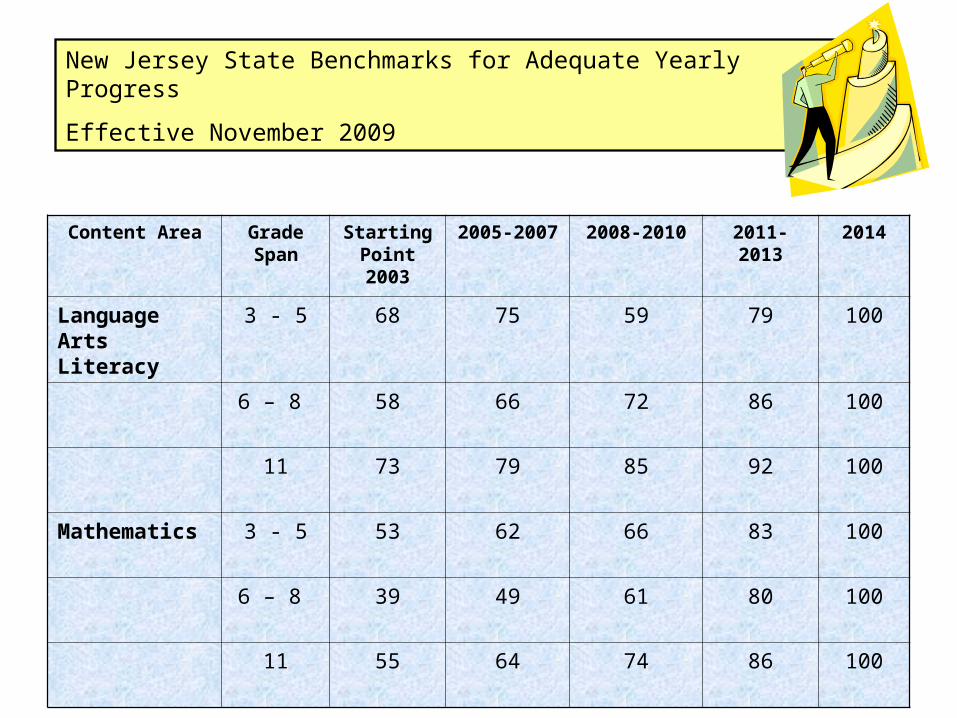
Content Area Grade Span
Starting Point 2003
2005-2007 2008-2010 2011-2013 2014
Language Arts Literacy
3 - 5 68 75 59 79 100
6 – 8 58 66 72 86 100
11 73 79 85 92 100
Mathematics 3 - 5 53 62 66 83 100
6 – 8 39 49 61 80 100
11 55 64 74 86 100
New Jersey State Benchmarks for Adequate Yearly Progress
Effective November 2009

RUSH MIDDLE SCHOOL HIGH SCHOOL
LAL MATH LAL MATH LAL MATH
TOTAL POPULATION: YES * YES YES YES * YES YES
CLASSIFIED STUDENTS: YES * YES * YES * YES * YES NO
AFRICAN-
AMERICAN
STUDENTS
NO YES YES * YES * N/A N/A
ECONOMICALLY DISADVANTAGED: NO YES YES * YES * N/A N/A
2012 AYP STATUS by Building
Based on 2010-2011 Test Scores
* Made Safe Harbor

SAT 5 YEAR TREND:
YearNumber of students
DIST TOTAL
VERBAL
STATE TOTAL
VERBAL
NATL TOTAL
VERBAL
DIST TOTAL MATH
STATE TOTAL MATH
NATL TOTAL MATH
DIST TOTAL
WRITING
STATE TOTAL
WRITING
NATL TOTAL
WRITING
2007
224503 495 502 522 510 515 486 494 494
2008
212515 495 502 527 513 515 527 496 494
2009
218509 496 501 518 513 515 510 493 493
2010
239510 495 501 513 514 516 499 497 492
2011
186492 495 497 502 516 514 484 497 489

0
1
2
3
4
5
6
2007 2008 2009 2010 2011
US SATTAKERS
US HIGHSCHOOLGRADUATES
SAT® Participation Relative to High School Population
Cohort
Source: 2011 College-Bound Seniors Total Group Report; WICHE (2008)

2009-2010NJ ASK - Grade 7 Performance Level - LALProficient
Performance Level - MathProficient Scaled Score - LAL240 Scaled Score - Math200
LAL Cluster Score - Reading39.0 LAL Cluster Score - Analyzing Text22.0
LAL Cluster Score - Working With Text17.0 LAL Cluster Score - Writing12.0
LAL Cluster Score - Persuasive Task8.0 LAL Cluster Score - Explanatory Task4.0
Math Cluster Score - Data Analysis6.0 Math Cluster Score - Geometry7.0
Math Cluster Score - Number Operations9.0 Math Cluster Score - Patterns4.0
Math Cluster Score - Problem Solving11.0
2008-2009NJ ASK - Grade 6Performance Level - LAL Proficient Performance Level - MathProficient
Scaled Score - LAL 220 Scaled Score - Math221
2007-2008NJ ASK - Grade 5Performance Level - LAL Proficient
Performance Level - MathProficient Scaled Score - LAL 214 Scaled Score - Math225
2006-2007NJ ASK - Grade 4Performance Level - LAL Proficient Performance Level - MathProficient
Performance Level - ScienceAdvanced Proficient Scaled Score - LAL 241 Scaled Score - Math238
Scaled Score - Science264
2005-2006NJ ASK - Grade 3Performance Level - LALProficient Performance Level - MathProficient
Scaled Score - LAL233 Scaled Score - Math223
Through NJ Smart, we can see all testing history for any student.

Using EdAnalyzer (NJ Smart Component), we can see how students who score partially proficient one subject compare to their performance in another subject.
Sample Performance Level MATH
Performance Level LAL
Student A Partially Proficient
Proficient
Student B Partially Proficient
Partially Proficient
Student C Partially Proficient
Proficient
Student D Partially Proficient
Advanced Proficient
Student E Partially Proficient
Proficient
Sample Performance Level LAL
Performance Level MATH
Student A Partially Proficient
Proficient
Student B Partially Proficient
Proficient
Student C Partially Proficient
Partially Proficient
Student D Partially Proficient
Proficient
Student E Partially Proficient
Advanced Proficient