chronic diseases and injuries in canada - public … vol 31, no 3, june 2011 – chronic diseases...
TRANSCRIPT

Chronic Diseases and Injuries in Canada
Volume 31 · Number 3 · June 2011
Inside this issue94 Preface – What’s in a name: Chronic Diseases
and Injuries in Canada H. Morrison, M. Tracy
95 Editorial – Non-communicable diseases – finally on the global agenda
A. T. Wielgosz
97 Patterns of fatal machine rollovers in Canadian agriculture
J. M. DeGroot, C. Isaacs, W. Pickett, R. J. Brison
103 Estimating gestational age at birth: a population-based derivation-validation study
M. L. Urquia, T. A. Stukel, K. Fung, R. H. Glazier, J. G. Ray
109 The influence of primary health care organizational models on patients’ experience of care in different chronic disease situations
R. Pineault, S. Provost, M. Hamel, A. Couture, J. F. Levesque
121 An assessment of the barriers to accessing food among food-insecure people in Cobourg, Ontario
S. Tsang, A. M. Holt, E. Azevedo
129 Estimates of the treated prevalence of bipolar disorders by mental health services in the general population: comparison of results from administrative and health survey data
A. G. Bulloch, S. Currie, L. Guyn, J. V. Williams, D. H. Lavorato, S. B. Patten

To promote and protect the health of Canadians through leadership, partnership, innovation and action in public health. — Public Health Agency of Canada
Published by authority of the Minister of Health. © Her Majesty the Queen in Right of Canada, represented by the Minister of Health, 2011
ISSN 1925-6523
This publication is also available online at www.publichealth.gc.ca/cdic Également disponible en français sous le titre : Maladies chroniques et blessures au Canada
CDIC: Information for authors
Chronic Diseases and Injuries in Canada (CDIC) is a
quarterly scientific journal focusing on the prevention
and control of non‑communicable diseases and injuries
in Canada. Its feature articles are peer reviewed.
The content of articles may include research from
such fields as epidemiology, public/community
health, biostatistics, the behavioural sciences, and
health services or economics. CDIC endeav ours to
foster communication on chronic diseases and injuries
among public health practitioners, epidemiolo gists
and researchers, health policy plan ners and health
educators. Submissions are selected based on scientific
quality, public health relevance, clarity, concise ness
and technical accuracy. Although CDIC is a publication
of the Public Health Agency of Canada, contributions
are welcomed from both the public and pri vate sectors.
Authors retain responsibility for the contents of their
papers, and opinions expressed are not necessarily
those of the CDIC editorial committee nor of the
Public Health Agency of Canada.
Article Types
Peer‑reviewed Feature Article: Maximum 4000
words for main text body (excluding abstract,
tables, figures, references) in the form of original
research, surveillance reports, meta‑analyses or
methodological papers.
Status Report: Describe ongoing national programs,
studies or information systems bearing on Canadian
public health (maximum 3000 words). Abstract
not required.
Workshop/Conference Report: Summarize significant,
recently held events relat ing to national public health
(maximum 1200 words). Abstract not required.
Cross‑Canada Forum: For authors to present or
exchange information and opin ions on regional or
national surveillance findings, programs under
development or public health policy initiatives
(maximum 3000 words). Abstract not required.
Letter to the Editor: Comments on articles recently
published in CDIC will be consid ered for publication
(maximum 500 words). Abstract not required.
Book/Software Review: Usually solicited by the
editors (500‑1300 words), but requests to review
are welcomed. Abstract not required.
Submitting Manuscripts
Submit manuscripts to the Managing Editor,
Chronic Diseases and Injuries in Canada, Public
Health Agency of Canada, 785 Carling Avenue,
Address Locator 6805B, Ottawa, Ontario K1A 0K9,
email: cdic‑mcbc@phac‑aspc.gc.ca.
Since CDIC adheres in general (section on illustrations
not applicable) to the “Uniform Requirements for
Manuscripts Submitted to Biomedical Journals”
as approved by the International Committee of
Medical Journal Editors, authors should refer to this
document for complete details before submitting a
manuscript to CDIC (see <www.icmje.org>).
Checklist for Submitting Manuscripts
Cover letter: Signed by all authors, stating that all have
seen and approved the final manuscript and have met
the authorship criteria including a full statement
regarding any prior or duplicate publi cation or
submission for publication.
First title page: Concise title; full names of all
authors and institutional affiliations; name, postal
and email addresses, tele phone and fax numbers
for corresponding author; separate word counts for
abstract and text.
Second title page: Title only; start page numbering
here as page 1.
Abstract: Unstructured (one paragraph, no headings),
maximum 175 words (100 for short reports); include
3‑8 keywords (preferably from the Medical Subject
Headings [MeSH] of Index Medicus).
Text: Double‑spaced, 1 inch (25 mm) margins,
12 point font size.
Acknowledgements: Include disclosure of financial
and material support in acknowledgements; if anyone
is credited in acknowledgements with substantive
scientific contributions, authors should state in the
cover letter that they have obtained written permission.
References: In Vancouver style (consult a recent CDIC
issue for examples); num bered in superscript in the
order cited in text, tables and figures; listing up to
six authors (first six and et al. if more); without any
automatic reference numbering feature used in
word processing; any unpublished observations/
data or personal communications used (discouraged)
to be cited in the text in parentheses (authors
responsible for obtaining written per mis sion); authors
are responsible for verifying accuracy of references.
Tables and Figures: Send vector graphics only.
Each on a separate page and in electronic file(s)
separate from the text (not imported into the text
body); as self‑explanatory and succinct as possible;
not too numerous; numbered in the order that they
are mentioned in the text; explanatory material for
tables in footnotes, identified by lower‑case
superscript letters in alpha betical order; figures
limited to graphs or flow charts/templates (no
photographs), with software used specified and
titles/footnotes on a separate page.
Number of copies: If submitting by mail, one
complete copy, including tables and figures; one
copy of any related supple men tary material, and a
copy of the manuscript on diskette. If submitting by
email to cdic‑mcbc@phac‑aspc.gc.ca, please fax or
mail the covering letter to the address on the inside
front cover.
Chronic Diseases and Injuries in Canadaa publication of the Public Health Agency
of Canada
Howard Morrison, PhD Editor-in-Chief (613) 941-1286
Robert A. Spasoff, MD Associate Scientific Editor
Claire Infante-Rivard, MD Associate Scientific Editor
Elizabeth Kristjansson, PhD Associate Scientific Editor
Michelle Tracy, MA Managing Editor
CDIC Editorial Board
Lesley Doering, MSW Public Health Agency of Canada
Robert Geneau, PhD Public Health Agency of Canada
Isra Levy, MB, FRCPC, FACPM Ottawa Public Health
Lesli Mitchell, MA Centers for Disease Control and Prevention
Scott Patten, MD, PhD, FRCPC University of Calgary
Barry Pless, CM, MD, FRCPC Montreal Children’s Hospital
Kerry Robinson, PhD Public Health Agency of Canada
Fabiola Tatone-Tokuda, MSc University of Ottawa
Andreas T. Wielgosz, MD, PhD, FRCPC Public Health Agency of Canada
Don Wigle, MD, PhD University of Ottawa
Russell Wilkins, MUrb Statistics Canada
Chronic Diseases and Injuries in Canada (CDIC) is a quarterly scientific journal focussing on current evidence relevant to the control and prevention of chronic (i.e. non-communicable) diseases and injuries in Canada. Since 1980 the journal has published a unique blend of peer-reviewed feature articles by authors from the public and private sectors and which may include research from such fields as epidemiology, public/community health, biostatistics, the behavioural sciences, and health services or economics. Only feature articles are peer reviewed. Authors retain responsibility for the content of their articles; the opinions expressed are not necessarily those of the CDIC editorial committee nor of the Public Health Agency of Canada.
Chronic Diseases and Injuries in Canada Public Health Agency of Canada
785 Carling Avenue Address Locator 6805B
Ottawa, Ontario K1A 0K9
Fax: (613) 941-9502 E-mail: [email protected]
Indexed in Index Medicus/MEDLINE, SciSearch® and Journal Citation Reports/
Science Edition

94 Vol 31, No 3, June 2011 – Chronic Diseases and Injuries in Canada
Preface
What’s in a name: Chronic Diseases and Injuries in Canada
As of this current issue, Chronic Diseases in Canada (CDIC) has been renamed Chronic Diseases and Injuries in Canada (CDIC). Reporting on injuries (accidents, occupational injuries and intentional injuries, including suicide) has always been part of the journal’s implicit mandate, if not its name. As the guest editor, Dr. A. J. Clayton, wrote in the inaugural issue, “We propose to include material based on research, surveillance and control aspects of non-communicable dis-eases or conditions such as cancer, heart disease and accidents.” Since 1993, the mission statement on the inside cover of the journal has included mention of injuries as part of the journal’s focus.
In fact, since its inception in June 1980, CDIC has published over 50 articles on injuries, as well as the proceedings of the International Conference on Air Bags and Seat Belts (October 18-20, 1992, Montreal, Quebec). Two theme issues were devoted to the topic of injuries (Volume 11, Number 6, 1990 and Volume 15, Number 1, 1994). CDIC was one of the first journals to publish a study based on data obtained from the Canadian Hospitals Injury Reporting and Prevention Program (CHIRPP), which has a strong focus on paediatric injury surveillance. More recently, CDIC has published papers on variations in injury among urban-rural geographic status (Jiang, 2007;28(1-2):56-62), seniors and falls (Leclerc, 2008;28(4):111-120), the link between deprivation and unintentional injury hospitalization (Gagné, 2009;29(2):56-69) and how to make injury data useful to policy makers (Mitton, 2009;29(2):70-9).
In the current issue, we are pleased to feature a paper by DeGroot et al., “Patterns of fatal machine rollovers in Canadian agriculture” (p. 97). A paper by Campbell et al. entitled “Can we use medical examiners’ records for suicide surveillance and prevention research in Nova Scotia?” will be published in our September 2011 issue (Volume 31:4).
Changing the journal’s name to include the word “Injuries” in the title is more than just calling a spade a spade, however. It reflects a shift in research priorities where experts will be needed to perform risk assessment as well as the usual surveillance. This shift is reflected on a corporate level within the Public Health Agency of Canada, which is the organization that publishes CDIC. In this vein, the editors would be interested in seeing papers that support or challenge current platforms for chronic disease risk assessment and/or make novel use of available data sources to report on injury risk factors. We would also be interested in receiving manuscripts of structured reviews of population interventions meant to reduce injury risk in the Canadian population.
Howard Morrison, PhD, Editor-in-Chief Chronic Diseases and Injuries in Canada
Michelle Tracy, MA, Managing Editor Chronic Diseases and Injuries in Canada

95Vol 31, No 3, June 2011 – Chronic Diseases and Injuries in Canada
After the UN Millennium Development Goals were declared in September 2000 (see Table 1), one of the major short-com-ings recognized world-wide was the lack of mention of non-communicable diseases (NCDs). While AIDS and malaria were included, none of the leading and univer-sal non-communicable causes of death made the list. There was no mention of cardiovascular diseases, cancer or diabe-tes, even though these place a far greater burden on global health and economic development than the infectious diseases and are predicted to continue to increase in epidemic proportions.
After much public discussion and intense lobbying, a significant—and uncommon—achievement occurred: on May 13th, 2010, the United Nations General Assembly voted in favour of convening a summit on non-communicable diseases, to take place in September 2011.
The resolution calling for the UN Summit, tabled by Trinidad and Tobago on behalf of the Caribbean Community (CARICOM) member states, was cosponsored by over 100 countries including the United States, which traditionally resists UN summits. However, in this case support even came from the US First Lady and the Secretary of State. This level of support acknowledges the burden of NCDs—diabetes, cancer, and cardiovascular and chronic respiratory ill-nesses are responsible for 60 percent of deaths world-wide—and indicates that NCDs have become a priority matter for world leaders.
Although the lead-up to September’s Summit has taken a decade, momentum has increased such that there is a short timeline for prepa-ration. The resolution calls on member states and the international community to:
• convene a high-level meeting of the General Assembly in September 2011, with the participation of Heads of State and Government, on the prevention and control of NCDs;
• include discussions on the rising inci-dence and the socio-economic impact of NCDs in developing countries dur-ing the 2010 Millennium Development Goals Review Summit;
• request the UN Secretary-General to prepare a global status report on NCDs, with a particular focus on the developmental challenges faced by developing countries.
High expectations emerged early after the resolution was declared. After reviewing data about the impact of NCDs on individuals and countries, the Summit should recognize that a collaborative, international effort will be most effective at controlling these diseases and preventing their spread. More impor-tantly, it is expected that such a high-level event—with a potential effect similar to that of a UN General Assembly Special Session (UNGASS)—will result in concrete action steps applicable on a global scale. These will have to be monitored through periodic pro-gress reports, so as to provide a measure of accountability to any resolutions and particularly the declared action steps.
Through comprehensive consultation, specific indicators and outcomes need to be identified to use for monitoring and evaluating progress. There are issues of resources and capacity to effectively carry out the actions that will be agreed upon, particularly in low- and middle-income countries. Broad representation and buy-in will be required from the start in order to ensure societal uptake. The work will not stop with the Summit, of course. At the end of the discussions, there must be a strong commitment, appropriately articu-lated, to continue the work with the full participation of member states.
Preparing for the Summit will offer oppor-tunities for widespread engagement, and various non-governmental organizations are working together through a global alli-ance. In late December 2010, a UN modali-ties resolution was adopted that declared September 19-20, 2011 as the dates of the Summit. It included a call for all UN Member States to be represented by Heads of State but most importantly, it called for Member States to adopt a concise action-oriented outcome document at the end of the Summit. Three roundtable sessions are planned, which will focus on the rising incidence of NCDs, strengthening national capacities and fostering international cooperation and coordination.
Given Canada’s experience and resources, it must not only be a leader but must be seen to be a leader in this global effort. Canada made a significant contribution to the Framework Convention on Tobacco Control (FCTC), which was a success as the
A.T. Wielgosz, MD, PhD, Professor of Medicine and Epidemiology & Community Medicine, University of Ottawa
Editorial
Non-communicable diseases – finally on the global agenda

96 Vol 31, No 3, June 2011 – Chronic Diseases and Injuries in Canada
first international treaty on a matter of health, and which continues to reap benefits country by country by reducing the effects on health of tobacco use through international coop-eration and action on tobacco control. Canadian strengths are in policy develop-ment, intersectoral collaboration and com-munity engagement.
The challenges in stemming the epidemic of NCDs with all the lifestyle-related fac-tors are enormous. As a wealthy nation with considerable experience in address-ing prevention and control of the leading causes of death and disability, there will be a high expectation of assistance from Canada for countries with middle and low economies, even as Canada is challenged to stem this epidemic within its own bor-ders. Success will be achieved through trust, mutual respect and collaboration. The Summit will be a historic event. More importantly, it must succeed.
Acknowledgements
The above editorial was based on material written by Greg Paton and Matthias Ploeg of the International Diabetes Federation and made available by the World Heart Federation.
TAblE 1 United Nations Millennium
Development Goals
1. Eradicate extreme poverty and hunger.
2. Achieve universal primary education.
3. Promote gender equality and empower women.
4. Reduce child mortality.
5. Improve maternal health.
6. Combat HIV/AIDS, malaria and other diseases.
7. Ensure environmental sustainability.
8. Develop a global partnership for development.

97Vol 31, No 3, June 2011 – Chronic Diseases and Injuries in Canada
Author references
1. Clinical Research Centre, Kingston General Hospital, Kingston, Ontario, Canada2. Department of Community Health and Epidemiology, Queen’s University, Kingston, Ontario, Canada3. Department of Emergency Medicine, Queen’s University, Kingston, Ontario, CanadaCorrespondence: Robert Brison, Kingston General Hospital, 76 Stuart Street, Kingston ON K7L 2V7. Tel.: (613) 548-2389; Fax: (613) 548-1381; Email: [email protected]
Patterns of fatal machine rollovers in Canadian agriculture
Abstract
Introduction: Our objectives were to examine the activities and circumstances associated with agricultural machine-related rollover fatalities.
Methods: We identified agricultural machine rollover fatalities recorded by the Canadian Agricultural Injury Surveillance Program (CAISP) in 1990–2005. We determined sideways and backwards rollovers by year, age and sex of the victims, agricultural season, machine type, and the activity, circumstances and location of the injury event.
Results: The annual rate of rollover fatalities in Canada was 9.1 per 100 000 farm operations. Rollover fatalities decreased to 30% of baseline over the 16-year study period (p = .004). Fatal rollovers most often occurred among men aged 50–69 years and 60–79 years for side-ways and backwards rollovers, respectively.
Discussion: Sideways rollovers occur when driving across an incline or at the edge of a ditch bordering a roadway or field. Backwards rollovers occur when driving up an incline, towing or extracting stuck machines, pulling stumps or trees, and towing implements or logs. Primary prevention programs for rollover injuries should target these identified patterns of injury.
Introduction
Agriculture is one of the most dangerous industries in Canada, with estimated annual population fatality rates between 14.6 and 25.6 per 100 000.1 It is similarly hazardous in other developed countries.2,3 In Canada, agricultural-related machine rollovers—when a vehicle or machine turns over either onto its side or backwards—account for approximately 40 hospitalizations (2.4% of agriculture-related hospitalized injuries) and 21 fatalities per year (20% of agricul-ture-related fatal injuries).1,4 Rollover events develop rapidly leaving little or no time for
evasive action; tractors can tip backwards to the point of no return in 0.75 seconds.5
There is ample evidence to support the efficacy of rollover protection structures (ROPS) as a secondary prevention strategy in reducing injury in rollover events.6-8 (Secondary prevention is defined as any strategy that limits the severity of an injury during the occurrence of an injury event such as a rollover.)9 There are less data available to inform primary prevention strategies that might decrease the occurrence of rollover events. (Primary prevention is
defined as any strategy that might prevent the occurrence of the injury event in the first place.)9
A number of studies have examined rollovers while exploring a spectrum of agricultural workplace injuries.1-4 However, a recent search of the biomedical literature did not identify any studies that describe common patterns of occurrence for rollover injuries. Knowing the circumstances of injury events and the people involved can inform primary prevention methods for rollover events and perhaps better target secondary strategies such as ROPS installation. Identifying the most hazardous situations and those people at highest risk could assist in targeting prevention messages.
The objectives of this study were to use data from a national agricultural injury surveillance program in Canada to examine the activities and circumstances associated with fatal agricultural-related rollover injuries and to describe who sustained these injuries.
Methods
Study population and data collection
Ethics approval was provided by Queen’s University Health Sciences Research Ethics Board.
The study population included all people who died as a result of a vehicle or machine roll-over on a Canadian farm or ranch between January 1, 1990, and December 31, 2005. Cases were identified by the Canadian Agricultural Injury Surveillance Program (CAISP).1 Briefly, CAISP identified accidental
J.M. DeGroot, MSc (1); C. Isaacs, MSc (1); W. Pickett, PhD (1,2); R.J. Brison, MPH (1,2,3)
Keywords: agricultural machine rollover, agricultural injuries, injury prevention, mortality, rollover protection structures, injury surveillance

98 Vol 31, No 3, June 2011 – Chronic Diseases and Injuries in Canada
agriculture-related injury fatalities in data-bases maintained by offices of provincial coroners or chief medical examiners in the ten Canadian provinces. Each coroner’s file is abstracted on-site by CAISP provincial collaborators using a standardized template.1 Fatal rollover information was not available from the province of Quebec for 2004 and 2005. CAISP also identifies hospitalized cases of agricultural injury;4 however, as the focus of our analysis was on patterns associated with fatal injuries only, these data were not considered here.
Injury definition
We reviewed documentation on fatal agricul-ture-related injuries and coded those caused by rollovers. We defined a backwards rollover as one where the vehicle or machine turns over backwards with its front tires rotating around its rear axle by 90° to 180° and a sideways rollover as one where a vehicle or machine turns onto its side. Incidents that did not have sufficient documentation to deter-mine whether the rollover was backwards or sideways were deemed unspecified.
Data analysis
We counted the number of backwards and sideways rollovers described in CAISP for the time period 1990 to 2005. We profiled sideways and backwards rollovers by age and sex of the victims, type of machine, agricultural season, location of the injury event, type of activity prior to rollover, and most probable cause of rollover. Overall and age-specific annual rates of fatal injury were calculated per 100 000 farms and then per 100 000 people using population estimates from the 1996 Canada Census of Agriculture as the denominator.10 All analyses were performed using SAS software (version 9.2, SAS Institute Inc., Cary, NC, United States).
Results
Number of rollovers
Of the 1766 agriculture-related fatalities identified between 1990 and 2005, 360 (20.4%) were due to rollovers. Of these, 221 (61.4%) were sideways rollovers, 107 (29.7%) were backwards rollovers, and 32 (8.9%) were unspecified (Table 1). The overall number of rollovers decreased significantly from a high of 31 in 1990 to a low of 9 in 2005
(p = .004), with considerable variability in the annual occurrence of both sideways and backwards rollovers. (Note: The observed decline should be interpreted cautiously due to the lack of fatality records from Quebec for 2004–2005). Though counts
of rollover events varied over the study period, a descending trend in numbers of sideways rollovers was statistically significant (p = .01) while a descending trend in numbers of backwards rollovers was less clear (p = .08) (Figure 1).
TABLE 1 Number of fatal agriculture-related rollovers by type of rollover, personal
characteristics of the victim and rollover circumstance
Number of rollovers, n
Sideways (n = 221)
Backwards (n = 107)
Age of victim, years
0–9 4 3
10–19 29 5
20–29 13 10
30–39 21 7
40–49 28 15
50–59 35 15
60–69 46 25
70–79 28 22
80+ 17 5
Sex of victim
Male 207 103
Female 14 4
Agricultural season
Harvest, July–Oct 126 47
Planting, April–June 46 39
Winter, Nov–March 49 19
Unknown 0 2
Machine type
Tractor 189 97
Off-road vehicle 11 8
Construction equipment 6 2
Motor vehicle 6 0
Other 9 0
Location of injury event
Field 44 44
Public road 71 6
Farm road 39 10
Woodlot 14 32
Water source 24 3
Farmyard 7 4
Driveway 10 0
Farm building 5 3
Other 4 3
Unknown 3 2
Notes: Bolding highlights the most prevalent patterns of risk.

99Vol 31, No 3, June 2011 – Chronic Diseases and Injuries in Canada
Injury circumstances
That older age groups experienced large number of rollover injury events is consistent with the known demographic distribution of farmers in Canada.10 The highest number of fatal sideways rollovers occurred in people aged 50 to 69 years, and the highest number of backwards rollovers in those aged 60 to 79 years (Table 1). Fatal rollovers occurred most often among men and boys, with the majority occurring during the harvest season, and on tractors, irrespec-tive of the type of rollover. The next most common machine type for both sideways and backwards rollovers was the off-road vehicle (n = 19); of these, 8 (42.1%) were reported for children aged 16 years and less. Available injury narratives suggest that almost all of these children were engaged in recreational rather than work-related activities at the time of the accident. Sideways rollovers were most likely to occur on fields or public roads while backwards rollovers were most likely to occur in a field or a woodlot (woods, forest or orchard).
Rates of fatal rollover injuries
We estimated annual rates of fatal rollover injury per 100 000 farm operations at 9.1 for total fatal rollovers, 5.6 for sideways rollovers and 2.7 for backwards rollovers. Annual rates of fatal rollover injury per 100 000 farm population were 2.4 for total fatal rollovers, 1.6 for sideways rollovers and 0.8 for backwards rollovers. Annual age-specific rates of rollover injury generally increased with age for both sideways roll-overs (minimum 0.2 per 100 000 for ages 0–9; maximum 13.7 per 100 000 for ages 80+) and backwards rollovers (minimum 0.2 per 100 000 for ages 0–9; maximum 4.5 per 100 000 for ages 70–79).
Activities and contributing factors
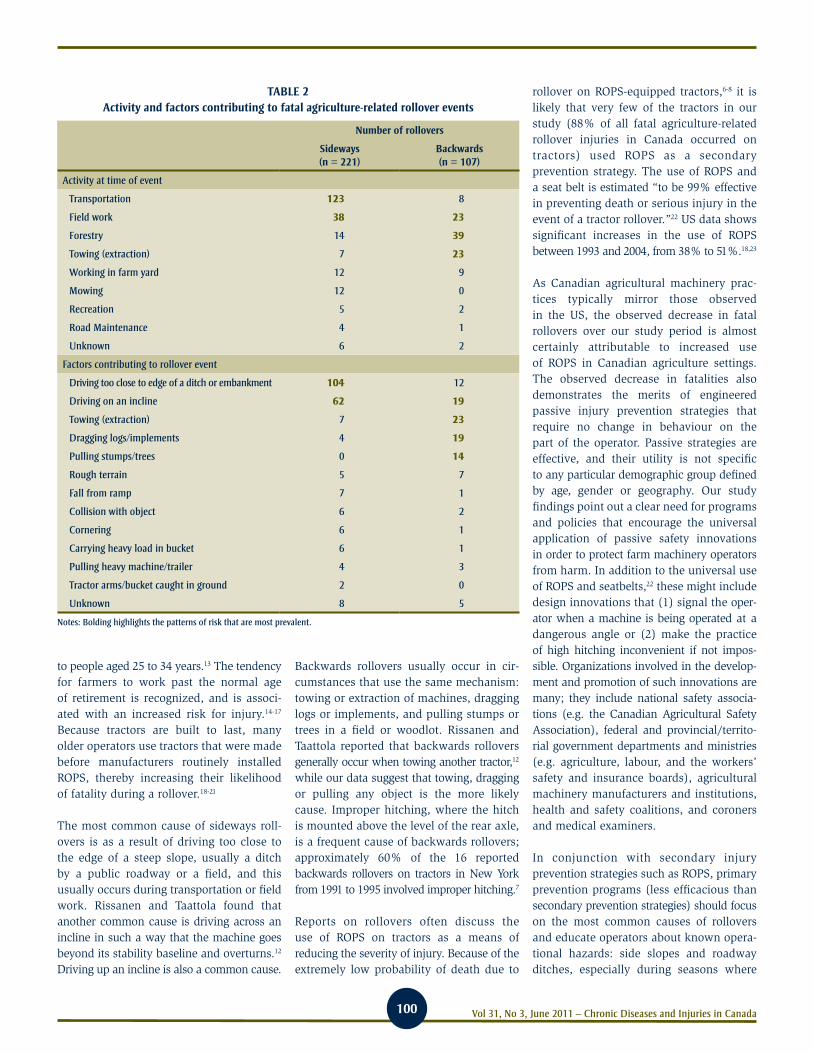
The most common activities contributing to sideways rollovers were transportation (particularly on public roadways) and field work. For backwards rollovers, the most common activities were forestry, field work and towing or extraction (Table 2). Factors contributing to the occurrence of sideways rollovers were (1) driving too close to the edge of a ditch or an embankment and (2)
driving on an incline. Most backwards roll-overs were associated with (1) attempting to free stuck machines with a tractor or tow-ing machines; (2) driving on an incline or dragging logs or implements; and (3) pull-ing stumps or trees.
Discussion
Our study describes a number of clear patterns of injury associated with fatal rollover injuries on Canadian farms. We found that men are much more frequently involved in a fatal rollover. Locker et al. reported an age-standardized rate ratio for males to females of 11.8 to 1 for rollovers that resulted in hospitaliza-tion or death.11 Similar patterns are found in other types of agriculture-related injuries.2,11-12 Adults aged 50 to 79 years account for the highest number of sideways and backwards rollover fatalities. This is consistent with US-based reports by Myers et al. who found that the risk of rollover fatality increases with age, with people aged 75 years and older having approxi-mately 6.5 times the rate of death compared
FIGURE 1 Number of fatal agriculture-related sideways and backwards rollovers by year with trend lines
20
25
15
10
5
0
Num
ber
1990
1992
1994
1996
1998
2000
2002
2004
Year
Slopes for regression lines: - 0.6 deaths per year (sideways rollovers) - 0.3 deaths per year (backwards rollovers)
Sideways
Backwards
100 Vol 31, No 3, June 2011 – Chronic Diseases and Injuries in Canada
to people aged 25 to 34 years.13 The tendency for farmers to work past the normal age of retirement is recognized, and is associ-ated with an increased risk for injury.14-17 Because tractors are built to last, many older operators use tractors that were made before manufacturers routinely installed ROPS, thereby increasing their likelihood of fatality during a rollover.18-21
The most common cause of sideways roll-overs is as a result of driving too close to the edge of a steep slope, usually a ditch by a public roadway or a field, and this usually occurs during transportation or field work. Rissanen and Taattola found that another common cause is driving across an incline in such a way that the machine goes beyond its stability baseline and overturns.12 Driving up an incline is also a common cause.
Backwards rollovers usually occur in cir-cumstances that use the same mechanism: towing or extraction of machines, dragging logs or implements, and pulling stumps or trees in a field or woodlot. Rissanen and Taattola reported that backwards rollovers generally occur when towing another tractor,12 while our data suggest that towing, dragging or pulling any object is the more likely cause. Improper hitching, where the hitch is mounted above the level of the rear axle, is a frequent cause of backwards rollovers; approximately 60% of the 16 reported backwards rollovers on tractors in New York from 1991 to 1995 involved improper hitching.7
Reports on rollovers often discuss the use of ROPS on tractors as a means of reducing the severity of injury. Because of the extremely low probability of death due to
rollover on ROPS-equipped tractors,6-8 it is likely that very few of the tractors in our study (88% of all fatal agriculture-related rollover injuries in Canada occurred on tractors) used ROPS as a secondary prevention strategy. The use of ROPS and a seat belt is estimated “to be 99% effective in preventing death or serious injury in the event of a tractor rollover.”22 US data shows significant increases in the use of ROPS between 1993 and 2004, from 38% to 51%.18,23
As Canadian agricultural machinery prac-tices typically mirror those observed in the US, the observed decrease in fatal rollovers over our study period is almost certainly attributable to increased use of ROPS in Canadian agriculture settings. The observed decrease in fatalities also demonstrates the merits of engineered passive injury prevention strategies that require no change in behaviour on the part of the operator. Passive strategies are effective, and their utility is not specific to any particular demographic group defined by age, gender or geography. Our study findings point out a clear need for programs and policies that encourage the universal application of passive safety innovations in order to protect farm machinery operators from harm. In addition to the universal use of ROPS and seatbelts,22 these might include design innovations that (1) signal the oper-ator when a machine is being operated at a dangerous angle or (2) make the practice of high hitching inconvenient if not impos-sible. Organizations involved in the develop-ment and promotion of such innovations are many; they include national safety associa-tions (e.g. the Canadian Agricultural Safety Association), federal and provincial/territo-rial government departments and ministries (e.g. agriculture, labour, and the workers’ safety and insurance boards), agricultural machinery manufacturers and institutions, health and safety coalitions, and coroners and medical examiners.
In conjunction with secondary injury prevention strategies such as ROPS, primary prevention programs (less efficacious than secondary prevention strategies) should focus on the most common causes of rollovers and educate operators about known opera-tional hazards: side slopes and roadway ditches, especially during seasons where
TABLE 2 Activity and factors contributing to fatal agriculture-related rollover events
Number of rollovers
Sideways (n = 221)
Backwards (n = 107)
Activity at time of event
Transportation 123 8
Field work 38 23
Forestry 14 39
Towing (extraction) 7 23
Working in farm yard 12 9
Mowing 12 0
Recreation 5 2
Road Maintenance 4 1
Unknown 6 2
Factors contributing to rollover event
Driving too close to edge of a ditch or embankment 104 12
Driving on an incline 62 19
Towing (extraction) 7 23
Dragging logs/implements 4 19
Pulling stumps/trees 0 14
Rough terrain 5 7
Fall from ramp 7 1
Collision with object 6 2
Cornering 6 1
Carrying heavy load in bucket 6 1
Pulling heavy machine/trailer 4 3
Tractor arms/bucket caught in ground 2 0
Unknown 8 5
Notes: Bolding highlights the patterns of risk that are most prevalent.

101Vol 31, No 3, June 2011 – Chronic Diseases and Injuries in Canada
these are soft; steep inclines; dragging logs or implements; towing machines or extracting stumps or logs or machines stuck in fields.
The number of fatal rollover injuries we observed among children aged less than 10 years point to a need for different primary prevention strategies. Foremost of these is the need to limit young children’s access to known occupational hazards on the farm, as described in a large existing case series.24 Young children typically do not possess the developmental abilities to recognize and react to dangerous occupational situations in an appropriate manner.25 It is also challenging for adults engaged in agricultural work to simultaneously supervise young children in the attentive, proximal and continuous manner that may be necessary to protect them from harm.25 The only truly effective solution for these rollover deaths is to prohibit young children from the agricultural worksite, including being on or in the vicinity of agricultural machinery.
Strengths and limitations
Our study was unique in that it examined the circumstances of rollovers in detail by mechanism. We made use of a robust dataset of national fatality data to describe patterns that are representative of agricultural rollover injuries in Canada. Our study also had its limitations. First, our analyses were restricted by the circumstance information recorded by the provincial abstractors, who in turn were limited by the information recorded on coroners’ investigation reports, police reports, and occupational safety and health agency investigation reports. We were particularly limited in the information about the victim and the rollover circumstances such as whether the victim was a full-time or part-time worker, the type of farm pro-duction where the injury occurred, and whether safety equipment (ROPS or seat-belts) was on the machine and/or in use. Second, as fatality information was not available from Quebec in 2004–05, counts of fatalities for these later years of surveillance represent slight underestimates of expected national totals. The observed decline in the occurrence of rollover fatalities from 1990 to 2005 should also be interpreted with caution, although the patterns of injury are most likely to be representative.
Summary
Machine rollovers are one of the most common, yet preventable, causes of fatal agricultural injury in Canada. Our study identified the groups most at risk for sideways and backwards rollovers, and we docu-mented the most common circumstances that led to these rollovers. By adhering to recommendations on ROPS and through understanding the circumstances in which these events most often occur, a substantial number of rollover fatalities could be avoided.
Acknowledgements
This work was funded by the Canadian Agricultural Safety Association.
The Canadian Agricultural Injury Surveillance Program (CAISP) was initiated in 1995. Collaborators representing each of Canada’s ten provinces have been integral to the data collection activities that formed the basis of the data presented here. As of 2010, CAISP has a new name: the Canadian Agricultural Injury Reporting program (CAIR). It is now managed by the Alberta Centre for Injury Control and Research. CAIR is funded and supported by a grant from the Canadian Agricultural Safety Association, and Agriculture and Agri-Food Canada. These groups were not involved in the study design, data collection, analysis, interpretation of data, or the writing of and decision to submit the paper for publication.
References
1. Pickett W, Hartling L, Brison RJ, Guernsey JR.
Fatal work-related farm injuries in Canada,
1991-1995. Canadian Agricultural Injury
Surveillance Program. CMAJ. 1999;160:1843-8.
2. Franklin RC, Mitchell RJ, Driscoll TR,
Fragar LJ. Agricultural work-related fatali-
ties in Australia, 1989-1992. J Agric Saf
Health. 2001;7:213-27.
3. Hard DL, Myers JR, Gerberich SG. Traumatic
injuries in agriculture. J Agric Saf Health.
2002;8:51-65.
4. Pickett W, Hartling L, Dimich-Ward H,
Guernsey JR, Hagel L, Voaklander DC, et al.
Surveillance of hospitalized farm injuries
in Canada. Inj Prev. 2001;7:123-28.
5. Hathaway LR, Riney LA, editors.
Fundamentals of machine operation:
agricultural safety. Moline (IL): Deere &
Company Service Training; 1987.
6. Centers for Disease Control and Prevention.
Public health focus: effectiveness of rollover
protective structures for preventing inju-
ries associated with agricultural tractors.
MMWR. 1993;42:57-9.
7. Centers for Disease Control and Prevention.
Fatalities associated with improper hitching
to farm tractors—New York, 1991-1995.
MMWR. 1996; 45:307-11.
8. Springfeldt B, Thorson J, Lee BC. Sweden’s
thirty-year experience with tractor rollovers.
J Agric Saf Health. 1998;4:173-80.
9. Conroy C, Fowler J. The Haddon matrix:
applying an epidemiologic research tool
as a framework for death investigation.
Am J Forensic Med Pathol. 2000;21:339-42.
10. Statistics Canada. 2006 Census of agriculture
[Internet]. Ottawa (ON): Statistics Canada;
[modified 2009 Oct 5; accessed 2010 Dec
30]. Available from: http://www.statcan
.gc.ca/ca-ra2006/index-eng.htm
11. Locker AR, Pickett W, Hartling L, Dorland JL.
Agricultural machinery injuries in Ontario,
1985-1996: a comparison of males and
females. J Agric Saf Health. 2002;8:215-23.
12. Rissanen P, Taattola K. Fatal injuries in
Finnish agriculture, 1988-2000. J Agric Saf
Health. 2003; 9:319-26.
13. Myers JR, Hendricks KJ. Agricultural tractor
overturn deaths: assessment of trends and
risk factors. Am J Ind Med. 2009;53:662-72.
14. Horsburgh S, Feyer A-M, Langley JD.
Fatal work related injuries in agricultural
production and services to agriculture
sectors of New Zealand, 1985-94. Occup
Environ Med. 2001; 58:489-95.
15. Myers JR, Hard DL. Work-related fatalities
in the agricultural production and services
sectors, 1980-1989. Am J Ind Med.
1995;27:51-63.

102 Vol 31, No 3, June 2011 – Chronic Diseases and Injuries in Canada
16. Soloman C. Accidental injuries in agriculture
in the UK. Occup Med. 2002; 52:461-6.
17. Voaklander DC, Hartling L, Pickett W,
Dimich-Ward H, Brison RJ. Work-related
mortality among older farmers in Canada.
Can Fam Physician. 1999; 45:2903-10.
18. Loringer KA, Myers JR. Tracking the
prevalence of rollover protective structures
on U.S. farm tractors: 1993, 2001, and
2004. J Safety Res. 2008;39:509-17.
19. May JJ, Sorensen JA, Burdick PA, Earle-
Richardson GB, Jenkins PL. Rollover
protection on New York tractors and
farmers’ readiness for change. J Agric Saf
Health. 2006;12:199-213.
20. Sanderson WT, Madsen MD, Rautiainen R,
Kelly KM, Zwerling C, Taylor CD, et al.
Tractor overturn concerns in Iowa: perspec-
tives from the Keokuk county rural health
study. J Agric Saf Health. 2006;12:71-81.
21. Wilkins JR III, Engelhardt HL, Bean TL,
Byers MV, Crawford JM. Prevalence
of ROPS-equipped tractors and farm/
farmer characteristics. J Agric Saf Health.
2003;9:107-18.
22. Murphy DJ, Buckmaster DR. Rollover
protection for farm tractor operators
[Internet]. Pennsylvania State University (PA):
Agricultural and Biological Engineering;
2003 [cited 2010 Dec 14.] Available from:
http://www.abe.psu.edu/extension/
factsheets/e/E42.pdf
23. Myers JR, Snyder K. Roll-over protective
structure use and cost of retrofitting tractors
in the United States, 1993. J Agric Saf
Health. 1995;1:185-97.
24. Brison RJ, Pickett W, Berg R, Linneman J,
Zentner J, Marlenga B. Fatal agricultural
injuries in preschool children: risks, injury
patterns and strategies for prevention.
CMAJ. 2006;174:1723-6.
25. Morrongiello B, Pickett W, Berg R,
Linneman J, Brison RJ, Marlenga BL. Adult
supervision and pediatric injuries in the
agricultural worksite. Accid Anal Prev.
2008; 40:1149-56

103Vol 31, No 3, June 2011 – Chronic Diseases and Injuries in Canada
Author references
1. Centre for Research on Inner City Health, The Keenan Research Centre of the Li Ka Shing Knowledge Institute, St. Michael’s Hospital, Toronto, Ontario, Canada 2. Institute for Clinical Evaluative Sciences, Toronto, Ontario, Canada3. Department of Health Policy Management and Evaluation, University of Toronto, Toronto, Ontario, Canada4. Dalla Lana School of Public Health, University of Toronto, Toronto, Ontario, Canada5. Department of Family and Community Medicine, University of Toronto, Toronto, Ontario, Canada.6. Department of Obstetrics and Gynecology, University of Toronto, Toronto, Ontario, CanadaCorrespondence: Marcelo Luis Urquia, Centre for Research on Inner City Health, The Keenan Research Centre of the Li Ka Shing Knowledge Institute, St. Michael’s Hospital, 30 Bond Street, Toronto ON M5B 1W8; Tel.: (416) 864 6060 x 77340; Fax: (416) 864 5558; Email: [email protected]
Estimating gestational age at birth: a population-based derivation-validation study
Introduction
Gestation starts on the day of conception and ends at birth, but it is typically measured from the first day of the last menstrual period. Gestational age (GA) is a major predictor of perinatal mortality and mor-bidity;1 it is important for dating for prenatal genetic screening2 and for the timing of fetal exposure to teratogens.3,4 It is also needed to correctly determine if an infant is small or large for GA, both for clinical practice and epidemiological research.2
In countries where antenatal maternal care is scarce, the collection of basic newborn statistics may be hampered by a lack of information on GA. On the other hand, in industrialized nations, GA is often not recorded in administrative health data-bases.3-5 Since all permanent residents of Canada receive universal health care, including prenatal, peripartum and newborn care, the Discharge Abstract Database of the Canadian Institute of Health Information (CIHI-DAD), an administrative database, has been recognized as an excellent source for population-based estimates for
perinatal research;6,7 however, prior to fiscal year 2002/03, CIHI-DAD did not collect data on GA at birth in Ontario,8 which could pose problems for some perinatal outcomes research.
The aim of this study is to develop and validate a GA prediction model for singleton births for use in epidemiological studies.
Methods
General design
We used a derivation-validation analytical method to estimate GA based on commonly available perinatal data. We completed a large population-based study of all singleton infants born in Ontario hospitals in 2007/08 and 2008/09, the period during which GA at birth was fully recorded by CIHI-DAD. The derivation cohort consisted of a ran-domly selected sample of 50% of all live births in this same period. This cohort was used to generate a predictive model based on infant characteristics. The other 50% of births formed the validation cohort, to test the derivation model’s prediction of GA at birth. Simulation studies have shown that split-sample validation is a reasonable approach when the overall sample size is very large, as in our study (N = 260 657).9
We excluded all stillbirths and multiple births from our sample. To minimize the influence of potential data errors and outliers, we also excluded infants born at or less than 23 completed weeks gestation or at or more than 43 completed weeks gestation; those with clinically implausible combina-tions of birth weight and GA;10 those who
Abstract
Introduction: Information on newborn gestational age (GA) is essential in research on perinatal and infant health, but it is not always available from administrative databases. We developed and validated a GA prediction model for singleton births for use in epidemiological studies.
Methods: Derivation of estimated GA was calculated based on 130 328 newborn infants born in Ontario hospitals between 2007 and 2009, using linear regression analysis, with several infant and maternal characteristics as the predictor (independent) variables. The model was validated in a separate sample of 130 329 newborns.
Results: The discriminative ability of the linear model based on infant birth weight and sex was reasonably approximate for infants born before the 37th week of gestation (r2 = 0.67; 95% CI: 0.65–0.68), but not for term births (37–42 weeks; r2 = 0.12; 95% CI: 0.12–0.13). Adding other infant and maternal characteristics did not improve the model discrimination.
Conclusion: Newborn gestational age before 37 weeks can be reasonably approximated using locally available data on birth weight and sex.
M. L. Urquia, PhD (1,2); T. A. Stukel, PhD (2,3); K. Fung, MSc (2); R. H. Glazier, MD (1,2,3,4,5); J. G. Ray, MD (2,3,6)
Keywords: gestational age, birth, neonate, infant health, derivation, validation, prediction, administrative datasets, Ontario

104 Vol 31, No 3, June 2011 – Chronic Diseases and Injuries in Canada
stayed in hospital for more than 90 days; those whose GA, birth weight or sex was not recorded; those born to mothers aged less than 16 years or over 50 years at the time of delivery; and extreme outliers of the birth weight distribution identified as values located outside the inter-quartile range exceeding two times its distance.11
Variables
In Ontario, GA is largely estimated by early ultrasound dating. Since 2002, hospital medical records departments have recorded GA based on the attending physician’s best interpretation of all clinical data, usually presented on the antenatal record.12,13 This, along with the infant’s sex and precisely measured birth weight, is recorded in the CIHI-DAD.14 We determined congenital anomalies and diseases of prematurity from the ICD-10-CA* codes15 entered in the 25 diag-nostic fields in the hospital records (Table 1).
Analysis
Derivation of the estimate of GA involved two steps.16 Using the derivation cohort, we performed a series of linear regression analyses with completed GA (in weeks) as the dependent variable and several independent variables, chosen a priori, as listed in Table 2.
We first modelled GA using a restricted cubic spline function of birth weight with four degrees of freedom.17 We added infant sex, congenital and chromosomal anomalies and the diseases of prematurity (respiratory distress syndrome, neonatal cerebral leu-komalacia or intraventricular hemorrhage, retinopathy of prematurity, necrotizing enterocolitis) to the basic model. The details of these variables are listed in Table 2.
We generated prediction models by multiply-ing the coefficients with each independent variable in the derivation models by the specific values that make up the profile of each individual in the validation cohort. We tested each prediction model using the validation cohort’s true GA as the dependent variable and estimated GA as the inde-pendent variable, rounded to the nearest completed week. As a measure of model
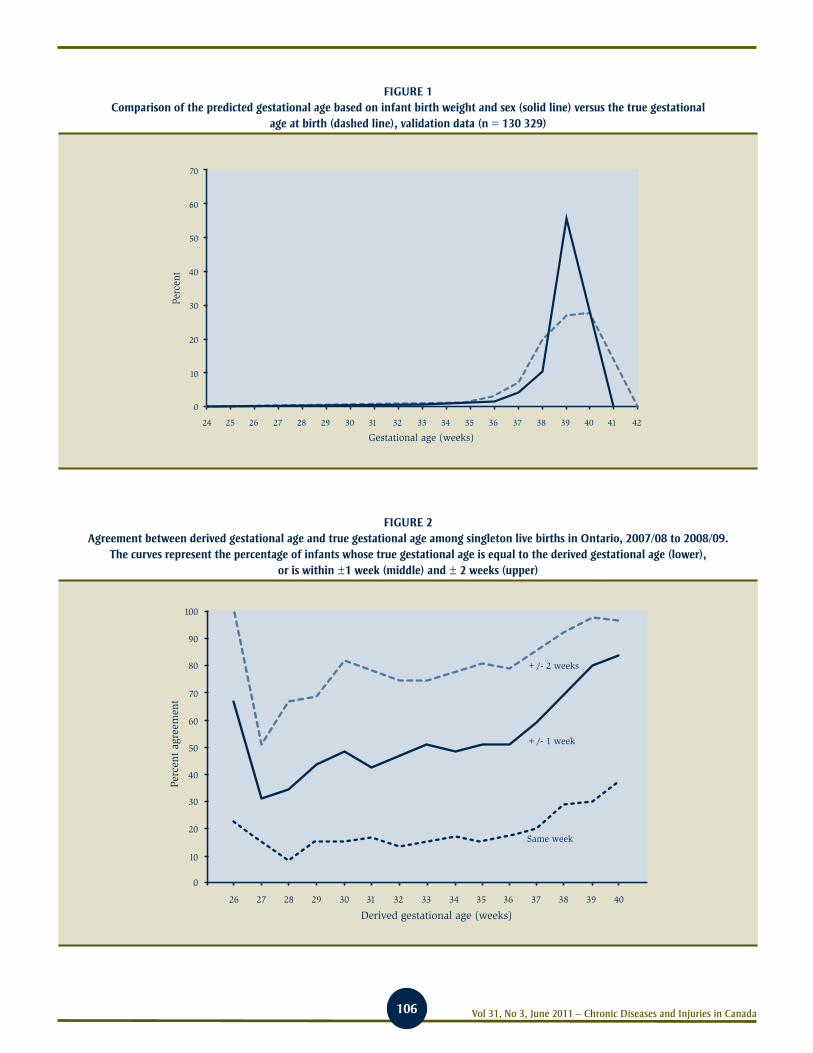
discrimination, we computed the coefficient of determination (r2) and its 95% confidence interval (CI). Models were validated for the entire birth cohort, and stratified by infant sex and by timing of birth (less than 37 weeks GA and equal or more than 37 weeks GA). The true versus estimated GA was plotted according to their respective frequency distributions (Figure 1).
We plotted the true positive rate of the derived model (i.e. the proportion of infants whose true GA is equal to the derived GA, is within 1 week of derived GA, or is within 2 weeks of derived GA) on a y-axis against the estimated GA on the x-axis (Figure 2).
All analyses were conducted using SAS ver-sion 9.1 (SAS Institute Inc., Cary, NC, US).
Results
There were 281 406 infant records in 2007/08 and 2008/09. After excluding stillbirths and multiple births and obvious outliers (7.4%), the final available dataset consisted of 260 657 singletons. Infant characteristics in both the derivation and validation cohorts were similar (Table 2).
The optimal model included a restricted cubic spline function of birth weight (in kilogram) as well as infant sex. The coefficient of deter-mination (r2) for this predictive model was 0.44 (95% CI: 0.43–0.45). Adding any con-genital or chromosomal anomaly or diseases of prematurity, or stratifying by infant sex to the above model did not appreciably affect the coefficient of determination (Table 3).
Stratifying by timing of birth, the discrimi-native ability of the model was poor for infants delivered at term (37–42 weeks: r2 = 0.12; 95% CI = 0.12–0.13), but much better for preterm births (24–36 weeks: r2 = 0.67; 95% CI = 0.65–0.68) (Table 3). Adding admission to a neonatal intensive care unit, infant hospital length of stay, maternal preeclampsia or gestational hypertension and mode of delivery to the pre-term model did not further improve the coefficient of determination (data not shown).
Up to about 36 weeks gestation, there was high concordance in the distribution curves for true versus derived GA, after which there was marked discordance (Figure 1). At term, predicted GA does not estimate the true GA well, especially at 39 weeks, when most infants are born (Figure 1).
The GA model that included infant birth weight and sex had a positive predictive value of 34% at 28 ± 1 weeks, 67% at 28 ± 2 weeks, 47% at 32 ± 1 weeks, 74% at 32 ± 2 weeks, 60% at 37 ± 1 weeks and 85% at 37 ± 2 weeks gestation (Figure 2).
We repeated the validation using the entire dataset instead of the validation dataset and the results did not change (data not shown).
Discussion
In a large population-based derivation-val-idation study, infant birth weight and sex together provided a reasonable estimate of GA among infants born before 37 weeks, but not among term infants.
The addition of other newborn and maternal characteristics did not improve the coefficient of determination of our model among preterm infants. Others have noted similar results in the development of newborn birth weight curves.18
A parsimonious model based on infant birth weight and sex has some advantages in that both variables are captured and recorded in nearly all clinical encounters within both poorer and wealthier nations and also within large administrative datasets in which GA is not available. It is noteworthy that infant birth weight and sex are the two main variables used for the construc-tion of population-based references of birth weight for GA.10,19,20 Therefore, in the absence of recorded GA, we recommend using information on infant birth weight and sex to approximate GA, and figures from local birth weight for GA charts, including the observed sex-specific 50th percentile of birth weight at each week of GA. Lower (5th, 10th) and upper (90th, 95th) percentiles of birth
* International Statistical Classification of Diseases and Related Health Problems, 10th Revision, Canadian Enhancement

105Vol 31, No 3, June 2011 – Chronic Diseases and Injuries in Canada
weight could also be used to express biological variability in GA at a given birth weight.
The finding that GA and birth weight are poorly correlated after 36 weeks gestation is noteworthy given that about 94% of sin-gleton infants are born at term. The poor prediction of GA at term is basically due to the large variability in birth weight as GA increases. For example, a recent Canadian birth weight chart for male newborns showed a minimum 1100-gram difference between the 10th and the 90th percentiles of birth weight at 37 to 41 weeks gestation.20 The latter reflects a large amount of vari-ability in birth weight within the “normal” range of birth weight. The better prediction of GA at earlier gestational periods is reflective of less biological variability. In addition, the birth weight slope is more linear and steeper at lower GAs than at term.20
Limitations
This study has a number of limitations. First, we relied on ICD-10-CA codes within an administrative database in which infant measurements were not performed for the purpose of this study. Second, we only included singleton live-born infants, so our approach may not apply to multiple preg-nancies. Unfortunately, population-based birth weight curves for multiple births are scarce.21,22 Third, the database did not contain information on other factors associated with length of gestation and newborn weight, such as parental ethnicity, maternal anthropometry and health behaviours during pregnancy, each of which may be used in the construction of customised newborn weight charts.23,24 Inclusion of these factors might improve our prediction model.25,26 Fourth, we based our analyses on the clinical estimate of GA (typically based on early ultrasound dating), which is known to differ from the estimate based on the date of last menstrual period.12,13 The latter has been found to overestimate preterm and postterm birth rates and present bimodal birth weight distributions between 28 and 34 weeks of gestation.20,25,27-29 Replication of our validation approach using the menstrual estimate of gestation as the “gold standard” may likely lead to poorer prediction. Finally, we caution others that our models were not designed to specifically estimate the GA of individual newborns.
TABLE 2 Characteristics of singleton live-born newborns in the derivation cohort (n = 130 328)
and validation cohort (n = 130 329), Ontario, 2007–09
Infant characteristicsDerivation cohort,
n (%)Validation cohort,
n (%)
Male 66 551 (51.06) 66 898 (51.33)
Gestational age at birth
Term, 37–42 weeks 122 723 (94.16)a 122 760 (94.19)b
Preterm, 24–36 weeks 7 605 (5.84) 7 569 (5.81)
Very preterm, 24–27 weeks 187 (0.14) 206 (0.16)
Mean birth weight ± SD, grams 3 392 ± 531 3 392 ± 532
Birth weightc
< 2500 grams 5 715 (4.39) 5 797 (4.45)
≥ 2500 grams 124 613 (95.61) 124 532 (95.55)
Congenital or chromosomal anomaliesd 5 655 (4.34) 5 677 (4.36)
Diseases of prematurityd,e 7 587 (5.82) 7 771 (5.96)
Respiratory distress syndrome 7 474 (5.73) 7 681 (5.89)
Neonatal cerebral leukomalacia or
intraventricular hemorrhage
206 (0.16) 207 (0.16)
Retinopathy of prematurity 111 (0.09) 112 (0.09)
Necrotizing enterocolitis 62 (0.05) 62 (0.05)
Abbreviations: ICD-10-CA, International Statistical Classification of Diseases and Related Health Problems, 10th Revision, Canadian Enhancement; n, sample size; SD, standard deviation.
aThe mean gestational age (± SD) at birth in this group was 39.2 (± 1.14) weeks.
bThe mean gestational age (± SD) at birth in this group was 39.2 (± 1.15) weeks.
cThe mean birth weight (± SD) was 3392 (± 531) grams for the derivation cohort and 3392 (± 532) grams for the validation cohort.
dCongenital or chromosomal anomalies and diseases or prematurity determined from ICD-10-CA codes in hospital records.
eMany newborns may have more than one disease of prematurity. Hence the percentages do not add up to 100.
TABLE 1 ICD-10-CA codes used to determine congenital anomalies, diseases of prematurity,
multiple births and stillbirths among singleton live-born newborns, Ontario, 2007–09
VariableCIHI-DAD record source
ICD-10-CA
Any congenital or chromosomal anomaly Infant Q00-Q99
Diseases of prematurity Infant
Necrotizing enterocolitis P77
Respiratory distress syndrome P22
Neonatal cerebral leukomalacia
or intraventricular hemorrhage
P91.2, P52
Retinopathy of prematurity H35.1
Multiple gestation Infant Q89.4, Z38.3-Z38.8
Multiple gestation Maternal O30, O31, Z37.2-Z37.7, Z38.3-Z38.8, Z37.9.0
Intrauterine death Infant P95
Intrauterine death Maternal O36.4, Z37.1, Z37.4, Z37.7
Abbreviations: CIHI-DAD, Discharge Abstract Database of the Canadian Institute of Health Information; ICD-10-CA, International Statistical Classification of Diseases and Related Health Problems, 10th Revision, Canadian Enhancement.
106 Vol 31, No 3, June 2011 – Chronic Diseases and Injuries in Canada
FIGURE 1 Comparison of the predicted gestational age based on infant birth weight and sex (solid line) versus the true gestational
age at birth (dashed line), validation data (n = 130 329)
70
60
50
40
30
20
10
0
Perc
ent
24 25 26 27 28 29 30 31 32 33 34 35 36 37 38 39 40 41 42
Gestational age (weeks)
FIGURE 2 Agreement between derived gestational age and true gestational age among singleton live births in Ontario, 2007/08 to 2008/09.
The curves represent the percentage of infants whose true gestational age is equal to the derived gestational age (lower), or is within ±1 week (middle) and ± 2 weeks (upper)
70
80
90
100
60
50
40
30
20
10
0
Perc
ent
agre
emen
t
26 27 28 29 30 31 32 33 34 35 36 37 38 39 40
Derived gestational age (weeks)
+/- 2 weeks
+/- 1 week
Same week

107Vol 31, No 3, June 2011 – Chronic Diseases and Injuries in Canada
In conclusion, in the absence of information on actual GA, newborn GA can be reasonably approximated at the population level as a continuous variable up to 36 weeks gesta-tion using birth weight and sex, although substantial uncertainty seems unavoidable, even after considering other predictors of GA.
Acknowledgements
This study was supported by the Institute for Clinical Evaluative Sciences (ICES), which is funded by an annual grant from the Ontario Ministry of Health and Long-Term Care (MOHLTC). The positions, results and conclusions reported in this paper are those of the authors and are independent from the funding sources. No endorse-ment by ICES or the Ontario MOHLTC is intended and nor should it be inferred.
References1. Cheng YW, Nicholson JM, Nakagawa S,
Bruckner TA, Washington AE, Caughey
AB. Perinatal outcomes in low-risk term
pregnancies: do they differ by week of
gestation? Am J Obstet Gynecol. 2008;
199(4):370-7.
2. Behrman RE, Butler AS, editors; Committee
on Understanding Premature Birth and
Assuring Healthy Outcomes. Preterm birth:
causes, consequences, and prevention. 1st
ed. Washington (DC): National Academies
Press; 2007.
3. Andrade SE, Raebel MA, Morse AN, Davis
RL, Chan KA, Finkelstein JA, et al. Use of
prescription medications with a potential
for fetal harm among pregnant women.
Pharmacoepidemiol Drug Saf. 2006;
15(8):546-54.
4. Hardy JR, Leaderer BP, Holford TR,
Hall GC, Bracken MB. Safety of medica-
tions prescribed before and during early
pregnancy in a cohort of 81,975 mothers
from the UK General Practice Research
Database. Pharmacoepidemiol Drug Saf.
2006;15(8):555-64.
5. Toh S, Mitchell AA, Werler MM,
Hernandez-Diaz S. Sensitivity and speci-
ficity of computerized algorithms to clas-
sify gestational periods in the absence of
information on date of conception. Am J
Epidemiol. 2008;167(6):633-40.
6. Joseph KS, Fahey J; Canadian Perinatal
Surveillance System. Validation of perinatal
data in the Discharge Abstract Database of
the Canadian Institute for Health Information.
Chronic Dis Can. 2009;29(3):96-100.
7. Wen SW, Liu S, Marcoux S, Fowler D. Uses
and limitations of routine hospital admission/
separation records for perinatal surveillance.
Chronic Dis Can. 1997;18(3):113-9.
8. Canadian Institute for Health Information.
Data quality documentation: Discharge
Abstract Database 2002–2003. Ottawa
(ON): CIHI; 2005.
9. Steyerberg EW, Harrell FE Jr, Borsboom GJ,
Eijkemans MJ, Vergouwe Y, Habbema JD.
Internal validation of predictive models:
efficiency of some procedures for logistic
regression analysis. J Clin Epidemiol.
2001;54(8):774-81.
10. Alexander GR, Himes JH, Kaufman RB,
Mor J, Kogan M. A United States national
reference for fetal growth. Obstet Gynecol.
1996;87(2):163-8.
11. Tukey JW. Exploratory data analysis.
Reading (MA): Addison-Wesley; 1977.
12. Wingate MS, Alexander GR, Buekens P,
Vahratian A. Comparison of gestational
age classifications: date of last menstrual
period vs. clinical estimate. Ann Epidemiol.
2007;17(6):425-30.
13. Qin C, Hsia J, Berg CJ. Variation between
last-menstrual-period and clinical estimates
of gestational age in vital records. Am J
Epidemiol. 2008;167(6):646-52.
TABLE 3 Discriminative ability of a model generated from the derivation cohort to predict
known gestational age at birth in the validation cohorta
Group Model variablesCoefficient of
determination, r2
(95% CI)b
All (n = 130 329) Birth weight and sex 0.44 (0.43–0.45)
Birth weight, sex, congenital or chromosomal anomalies, and diseases of prematurityc
0.45 (0.44–0.46)
Sex
Males (n = 66 898) Birth weight 0.46 (0.44–0.47)
Birth weight, congenital or chromosomal anomalies, and diseases of prematurityc
0.47 (0.45–0.48)
Females (n = 63 431) Birth weight 0.43 (0.41–0.44)
Birth weight, congenital or chromosomal anomalies, and diseases of prematurityc
0.44 (0.42–0.45)
Timing at birth
Term, 37–42 weeks (n = 122 760)
Birth weight and sex 0.12 (0.12–0.13)
Birth weight, sex, congenital or chromosomal anomalies, and diseases of prematurityc
0.13 (0.12–0.13)
Preterm, 24–36 weeks (n = 7569)
Birth weight and sex 0.67 (0.65–0.68)
Birth weight, sex, congenital or chromosomal anomalies, and diseases of prematurityc
0.68 (0.67–0.70)
Abbreviations: ICD-10-CA, International Statistical Classification of Diseases and Related Health Problems, 10th Revision, Canadian Enhancement; n, sample size.
a Cohorts are singleton infants live born in Ontario in 2007/08–2008/09.
b Birth weight is modeled as a restricted cubic spline with 4 degrees of freedom.
c Respiratory distress syndrome, neonatal cerebral leukomalacia or periventricular hemorrhage, retinopathy of prematurity, necrotizing enterocolitis based on ICD-10-CA codes.

108 Vol 31, No 3, June 2011 – Chronic Diseases and Injuries in Canada
14. Canadian Institute for Health Information.
DAD abstracting manual (for use with
ICD-10-CA/CCI) 2006-2007. Ottawa (ON):
CIHI; 2006.
15. Canadian Institute for Health Information.
Final report: the Canadian enhancement
of ICD-10 (International Statistical
Classification of Diseases and Related
Health Problems, Tenth Revision). Ottawa
(ON): CIHI; 2001.
16. Sullivan LM, Massaro JM, D’Agostino RB Sr.
Presentation of multivariate data for clinical
use: The Framingham Study risk score
functions. Stat Med. 2004;23(10):1631-60.
17. Durrleman S, Simon R. Flexible regression
models with cubic splines. Stat Med.
1989;8(5):551-61.
18. Hutcheon JA, Zhang X, Cnattingius S,
Kramer MS, Platt RW. Customised birth-
weight percentiles: does adjusting for
maternal characteristics matter? BJOG.
2008;115(11):1397-404.
19. Bonellie S, Chalmers J, Gray R, Greer I,
Jarvis S, Williams C. Centile charts
for birthweight for gestational age for
Scottish singleton births. BMC Pregnancy
Childbirth. 2008;8:5.
20. Kramer MS, Platt RW, Wen SW, Joseph KS,
Allen A, Abrahamowicz M, et al. A new
and improved population-based Canadian
reference for birth weight for gestational
age. Pediatrics. 2001;108(2):E35.
21. Ananth CV, Vintzileos AM, Shen-Schwarz S,
Smulian JC, Lai YL. Standards of birth
weight in twin gestations stratified by
placental chorionicity. Obstet Gynecol.
1998;91(6):917-24.
22. Glinianaia SV, Skjaerven R, Magnus P.
Birthweight percentiles by gestational age
in multiple births. A population-based
study of Norwegian twins and triplets. Acta
Obstet Gynecol Scand. 2000; 79(6):450-8.
23. Gardosi J, Francis A. A customized standard
to assess fetal growth in a US population.
Am J Obstet Gynecol. 2009;201(1):25.e1-7.
24. Gardosi J, Chang A, Kalyan B, Sahota D,
Symonds EM. Customised antenatal growth
charts. Lancet. 1992;339(8788):283-7.
25. Kierans WJ, Joseph KS, Luo ZC, Platt R,
Wilkins R, Kramer MS. Does one size fit
all? The case for ethnic-specific standards
of fetal growth. BMC Pregnancy Childbirth.
2008;8:1.
26. Ray JG, Jiang D, Sgro M, Shah R, Singh G,
Mamdani MM. Thresholds for small for
gestational age among newborns of East
Asian and South Asian ancestry. J Obstet
Gynaecol Can. 2009;31(4):322-30.
27. Joseph KS, Huang L, Liu S, Ananth CV,
Allen AC, Sauve R, et al. Reconciling the
high rates of preterm and postterm birth
in the United States. Obstet Gynecol.
2007;109(4):813-22.
28. Platt RW, Abrahamowicz M, Kramer
MS, Joseph KS, Mery L, Blondel B, et al.
Detecting and eliminating erroneous gesta-
tional ages: a normal mixture model. Stat
Med. 2001;20(23):3491-503.
29. Tentoni S, Astolfi P, De PA, Zonta LA.
Birthweight by gestational age in preterm
babies according to a Gaussian mixture
model. BJOG. 2004;111(1):31-7.

109Vol 31, No 3, June 2011 – Chronic Diseases and Injuries in Canada
Author references
1. Direction de santé publique de l’Agence de la santé et des services sociaux de Montréal, Montréal, Quebec, Canada2. Institut national de santé publique du Québec, Québec, Quebec, Canada3. Centre de recherche du Centre hospitalier de l’Université de Montréal, Montréal, Quebec, Canada Correspondence: Raynald Pineault, Direction de santé publique, Agence de la santé et des services sociaux, 1301 rue Sherbrooke Est, Montréal QC H2L 1M3; Tel.: (514) 528-2400 ext. 3480; Fax: (514) 528-2470; Email: [email protected]
The influence of primary health care organizational models on patients’ experience of care in different chronic disease situations
Abstract
Objectives: To examine the extent to which experience of care varies across chronic diseases, and to analyze the relationship of primary health care (PHC) organizational models with the experience of care reported by patients in different chronic disease situations.
Methods: We linked a population survey and a PHC organizational survey conducted in two regions of Quebec. We identified five groups of chronic diseases and contrasted these with a no–chronic-disease group.
Results: Accessibility of care is low for all chronic conditions and shows little variation across diseases. The contact and the coordination-integrated models are the most accessible, whereas the single-provider model is the least. Process and outcome indices of care experience are much higher than accessibility for all conditions and vary across diseases, with the highest being for cardiovascular-risk-factors and the lowest for respiratory diseases (for people aged 44 and under). However, as we move from risk factors to more severe chronic conditions, the coordination-integrated and community models are more likely to generate better process of care, highlighting the greater potential of these two models to meet the needs of more severely chronically ill individuals within the Canadian health care system.
Introduction
As our population ages, management of chronic diseases has become a prime concern for policy makers and clinicians alike.1,2 Health care systems need to shift from a disease-focused approach to one that is more holistic and comprehensive.2-5 One convincing argument for adopting case- rather than disease-management approaches is the high prevalence of comorbidities associated with the pres-ence of a chronic disease.1,5,6 Indeed, only 10% of chronically ill individuals present a single morbidity, whereas 60% present
at least four.7 For these reasons, the optimal setting for achieving case management for the chronically ill could arguably be in primary care.4,8
Several proposals have focused on approaches linked with primary health care (PHC) that advocate more accessible and coordinated patient-centred care, thus emphasizing health promotion and disease prevention.9-11 Modalities of care such as those proposed in the chronic care model and its derivatives have shown great potential for achieving such results.12-14
However, less attention has been paid to the organizational contexts in which these modalities of care are implemented.15 These integrated models of chronic care do not specify in which type of organization and under what organizational modalities such improvements in chronic care are most likely to occur. However, some studies have explored the association between structural features of PHC practices and their performance, including experience of care.14,16,17 A recent study in Ontario found that chronic disease management was superior in community health centres compared with other types of practices.18
Another Ontario study compared two models of primary care delivery where the main difference was the way physicians were paid, with one being enhanced fee-for-ser-vice and the other capitation.19 However, few studies have examined PHC practices as complex organizational entities.14,17,20,21 Further, to our knowledge no study has looked at variations in experience of care across different chronic conditions in relation to various PHC organizational models.
The objectives of this article are to examine the extent to which experience of care varies across chronic diseases and to analyze the relationship of PHC organizational models with the experience of care reported by patients in different chronic disease situations.
Methods
Research design
Our study consisted of two interrelated surveys. The first, a population-based telephone survey, involved 9206 randomly
R. Pineault, MD, PhD (1,2,3); S. Provost, MD, MSc (1,2); M. Hamel, MSc (1,2); A. Couture, MSc (1,2); J.F. Levesque, MD, PhD (1,2,3)
Keywords: chronic disease, organizational models, primary health care, continuity of care, accessibility of care, process of care, outcome of care, Quebec

110 Vol 31, No 3, June 2011 – Chronic Diseases and Injuries in Canada
selected adults (aged 18 years or older) in two regions of Quebec, in 2005. To ensure that the 23 territories of the Health and Social Service Centres were locally repre-sented, the sample was non-proportionally stratified. Accordingly, all analyses were done on weighted data to account for this characteristic of the sampling frame. The survey assessed respondents’ current affiliation with PHC organizations, their health services utilization level, the attributes
of their experience of care, and their perception of unmet care needs.22,23
The second survey was a mail survey with response from 473 PHC organizations in the same two regions of Quebec. This survey assessed aspects related to vision, structure, resources and practices of the PHC organiza-tions. In each organization, a key informant, generally a doctor designated by his or her colleagues, responded to the questionnaire.
A nominal link between the two surveys was established by asking population survey respondents to identify their usual source of PHC. Response rates were 64% for the population survey and 75% for the organizational survey; 89% of respondents were linked to one of the 473 PHC organi-zations. For this study, we used responses from the 6222 respondents who used services in the two years prior to the study (2003–2005) and who could be linked to one of
TABLE 1 Results of factor analysis for 23 variables of care experience according to survey
respondents (N = 6222) having a regular source of primary care, Quebec, 2003–2005
Experience of careNumber
of variablesCronbach reliability
coefficient
First-contact accessibility 4 0.579
If the doctor who is responsible for your care is not available, you can see another doctor at your regular clinic
If you need to see a doctor for a new health problem, you go to your regular clinic first
If you need to see a doctor on the same day for a health problem such as fever or a slight accident, you go to your regular clinic first
When you consult a doctor at your regular clinic, you go directly there without making an appointment
Process of care 14 0.848
Affiliation continuity
You see the same doctor when you go to your regular clinic
At your regular clinic, your medical history is known
At your regular clinic, the doctors/staff are aware of all the prescription medications you take
At your regular clinic, you can receive routine ongoing care for a chronic problem, for example, for high blood pressure (hypertension), diabetes or back pain, etc.
Comprehensiveness
At your regular clinic, the doctor takes the time to talk to you about prevention and asks you about your lifestyle habits
At your regular clinic, the doctors/staff help you get all the health care services you need
At your regular clinic, your opinion and your preferences are taken into account in the care that you receive
At your regular clinic, you are helped to weigh the pros and cons when you have to make decisions about your health
At your regular clinic, your questions are clearly answered by all the clinic staff
At your regular clinic, the doctors spend enough time with you
Responsiveness
You feel respected when you go to your regular clinic
You are greeted courteously at the reception of your regular clinic
Your physical privacy is respected at your regular clinic
The premises of your regular clinic are pleasant
Outcomes of care 5 0.849
The services you get at your regular clinic help you better understand your health problems
The services you get at your regular clinic help you prevent certain health problems before they appear
The services you get at your regular clinic help you control your health problems
The professionals you see at your regular clinic encourage you to follow the treatments prescribed
The professionals you see at your regular clinic help motivate you to adopt good lifestyle habits like quitting smoking, eating more healthy foods, etc.

111Vol 31, No 3, June 2011 – Chronic Diseases and Injuries in Canada
the 473 PHC organizations as their usual source of care. Further information about the surveys is available elsewhere.22-24
Variables
Two complex constructs were operational-ized in this study: experience of care and organizational model. Using a factor analysis of 23 items from the population survey, we constructed three indices of experience of care: first-contact accessibility, process of care and perceived outcomes of care. In this study, first-contact accessibility cor-responds to the ease with which individuals can access and use health services, and process of care corresponds to affiliation and follow-up continuity, namely, compre-hensiveness and responsiveness. Affiliation and follow-up continuity refer to conditions associated with having a regular source of care and its capacity to manage chronic diseases; comprehensiveness measures the organization’s ability to respond to a wide spectrum of needs expressed by the patient; responsiveness focuses on the respect and attention given to the dignity of the person and to the non-technical aspect of care. Table 1 shows the Cronbach reliability coef-ficients for the three indices of experience of care and the items making up these indices.
We operationalized the indices based on an approach that measures performance by recategorizing each multiple category item into dichotomous low/high variables.25,26 Responses in the low category received a score of zero and those in the high category a score of one. For each index, we averaged the dichotomized scores and placed each on a scale of 0 to 10. For the purpose of the analyses, we created three dichotomous variables with each index using a cut-off point of 7.5, based on its distribution and the judgment of a panel of three experts that a score of 7.5 or higher represented better performance, whereas a score below 7.5 represented lower, but not necessarily poor, performance. As such, we analyzed three dichotomous variables of first-contact accessibility (high vs. low), process of care (high vs. low), and perceived outcomes of care (high vs. low).
We conceptualized organizations as having four dimensions: vision, resources, structure and practices.27 Vision refers to the repre-sentation, values and orientation shared by members of the organization. Resources are expressed in terms of the number of professionals and the quantity and type of technical platforms and communications technologies available. Structure consists of rules, regulations and governance that give coherence to the functioning of organiza-tions and to relationships with their environ-ment. Finally, practices represent clinical and organizational mechanisms supporting delivery of services.27 In total, we allocated 43 variables (described in detail elsewhere23) to these dimensions. Based on these 43 variables, we performed a cluster analysis of the 473 PHC organizations, and derived a taxonomy of five different models: one community model and four professional models, namely, single-provider, contact, coordination and coordination-integrated models. (These models are described in greater detail elsewhere.23)
Table 2 presents distinctive characteristics of the models’ four dimensions. As we move from left to right in Table 2, the models clearly become increasingly complex in terms of their characteristics, the most com-plex ones being the professional coordina-tion-integrated model and the community models. Figure 1 shows the correspondence between currently existing types of PHC organizations in the two regions and the five models of the taxonomy.
Selection of diseases
As mentioned earlier, we used the responses from those respondents who had used services in the two years prior to the study (2003–2005) and who could be linked to one of the 473 PHC organizations as their usual source of care (N = 6222). We asked them about their experience of care and whether a doctor had ever told them they had one or more of the chronic diseases listed in the questionnaire.* Respondents were then classified according to whether or not they had a chronic disease. Individuals with only one morbidity were classified
in the corresponding morbidity category. Those with more than one morbidity were assigned to the first category of morbidity listed in decreasing order, as shown in the flow diagram (Figure 2). To ensure that the no–chronic-disease group (37.6%) did not include any chronic disease patients, people with chronic diseases other than those being studied (15.2%) were excluded from the analyses. Cardiovascular risk factors include diabetes, hypertension and hyper-cholesterolemia; for other chronic diseases, it was generally not possible to make finer distinctions within categories.
To assess the association of different organ-izational models with the care experience of chronic illness patients, we performed stratified logistic regressions of the three dichotomous variables of interest (access, process, outcomes) for each chronic illness group. All analyses included age, sex, income and educational level as covariates.
Results
Individual characteristics and affiliation of respondents
Table 3 shows the characteristics of respond-ents, including their affiliation with a com-munity or professional model of care. Each disease group, including the group with no chronic disease, is compared to the reference group “all users.” Compared with those in the “all users” reference group, indi-viduals in the no–chronic-disease group tend to be younger, in better health, male and better educated. On the other hand, the cardiovascular-risk-factors group is older, includes more men and has a lower level of education than the reference group. The arthritic, respiratory (≥ 45 years) and cardiac-disease groups share similar characteristics: individuals are older, in poorer health, and have lower education and income levels than the “all users” reference group. The arthritic and the respiratory-disease groups also include a higher percentage of women. Individuals in the respiratory disease group (≤ 44 years) are younger and tend to have higher levels of education and income.
* Cardiac (heart disease or heart failure), respiratory (chronic obstructive pulmonary disease [COPD], asthma), arthritic (arthritis, osteoarthritis, rheumatism), cardiovascular risk factor (hypertension, diabetes, hypercholesterolemia) or other (peripheral vascular disease, cancer).

112 Vol 31, No 3, June 2011 – Chronic Diseases and Injuries in Canada
TABLE 2 Primary health care (PHC) organizations (N = 473) surveyed, Quebec, 2003–2005
Professional models of care
Characteristics Single provider Contact CoordinationCoordination-integrated
Community model
Vision (values)
Responsibility Clientele** Individuals who present *** Clientele *** Population ** Population ***
Continuity - accessibility NS Accessibility > continuity *** Continuity > accessibility* NS Continuity > accessibility **
Team work Not important *** NS Important *** Important *** Important ***
Resources
MDs supply Low *** Average * Low *** High *** High ***
Professionals supply Low *** High *** High *** High *** Average ***
Technical platform Very low *** NS Average ** High *** Average ***
Information and commu-nication technologies
Very low *** NS NS High *** High ***
Structure
Governance Prof. private *** Prof. private *** Prof. private *** Prof. private *** Public ***
MD payment FFS *** FFS *** FFS *** FFS *** Time based ***
Internal collaboration None *** Informal ** Informal *** Formal *** Formal***
Link with primary care NS No ** No * Yes*** NS
Link with specialized services
NS No * No** Yes*** NS
Practices
Appointment/walk-in Mostly scheduled appointment***
Mostly walk-in *** NS NS NS
Scope of services Narrow *** Narrow ** Broad *** Very broad *** Very broad ***
Quality assessment None *** More or less *** More or less *** More *** More ***
Abbreviations: FFS, fee-for-service; N, overall sample size; NS, not significant; p, statistical significance; prof., professional
Difference between levels of the characteristics within each model * p ≤ .05 ** p ≤ .01 *** p ≤ .001
FIGURE 1 Correspondance between currently existing types of PHC organizations and models of the taxonomya
a Percentages read as follows: all (100%) of CLSC (left bar) fall into the community category (right bar) and constitute 100% of this categoryb CLSC: Centres locaux de services communautaires (Local community health centers)c FMG: Family medicine groups
100%
80%
60%
40%
20%
0Currently existing types of PHC
Solo (32)
Group (50)
FMG (6)c
CLSC (12)b
Models of PHC org.
Single provider (37)
Contact (14)
Coordination (22)
Coordination-integrated (15)
Community (12)
100 89
44 100
100 100
10035
2065
29 100
7
11

113Vol 31, No 3, June 2011 – Chronic Diseases and Injuries in Canada
There is little variation across disease groups with respect to affiliation to the various PHC organizational models (Table 3). An exception, however, is the no–chronic-disease group of respondents, who tend to concentrate more in the contact model and less in the single-provider model, com-pared with all service users. The single-provider model also attracts more than its share of individuals with cardiac diseases and less than its share of respiratory-dis-ease patients (≤ 44 years). Aside from these differences, the percentage of individuals affiliated with organizational models in the different chronic-disease groups is similar to the figures for all users. However, the percentage of users of services that identify each model as their regular source of care varies considerably, from 10.4% for the community model to 29.0% for the coordi-nation-integrated model.
As we move from the no–chronic-disease to the cardiac-disease group (Table 3), perceived health status tends to deteriorate, presumably reflecting an increasing gradient of disease severity.
Further analysis of the comorbidities associated with these chronic diseases confirms this increasing degree of severity, as the number of comorbidities associated with the main morbidity increases steadily from the no–chronic-disease to the cardiac-disease group (Table 4).
Experience of care by disease
Experience of care varies across disease conditions (Table 5). First-contact acces-sibility presents the lowest percentage of individuals with scores of 7.5 and more, and the least variation across diseases. First-contact accessibility is slightly lower for people in the no–chronic-disease group, although there is no statistically significant difference between each chronic disease category and the all-users one.
Process of care reveals a higher percentage of individuals with scores of 7.5 and more, and with greater variation across diseases than first-contact accessibility. The respiratory group aged 44 years and less has the low-est percentage of individuals with scores of 7.5 and more, even lower than the
no–chronic-disease group, whereas the cardiovascular-risk-factors group has the highest percentage. Outcomes of care follow the same pattern as process of care: the percentage of those with scores of 7.5 and more varies and is much lower for people aged 44 years and less with respiratory diseases, and higher for those with cardio-vascular risk factors.
Experience of care related to organizational models in different disease situations
Table 6 shows odds ratios (ORs) with 95% confidence intervals (CIs) for relationships between the organizational models and experience of care in the different chronic disease groups, with the professional contact model as reference. Data are adjusted for respondents’ characteristics except for perceived health status, which was highly correlated with the chronic diseases included in the analyses.
First-contact accessibility is better in the contact and coordination-integrated models (OR > 1 with lower limit of CI ≥ 1) and much worse in the single-provider model
FIGURE 2 Flow diagram for assignment of survey respondents to chronic disease group
Cardiac (7.8%)
Respiratory (≥ 45 years) (6.3%)
Respiratory (≤ 44 years) (6.3%)
Arthritic (15.7%)
Cardiovascular risk factors (11.1%)
Other chronic diseases (15.2%)
No chronic disease (37.6%)
Respondents (n = 6222)
Heart disease / heart failure
Chronic obstructive pulmonary disease (COPD)
Asthma
Arthritis / osteoarthritis / rheumatism
Hypertension / diabetes / hypercholesterolemia
Peripheral vascular disease / cancer / etc.
No
No
No
No
No
No

114 Vol 31, No 3, June 2011 – Chronic Diseases and Injuries in Canada
(OR < 1 with upper limit of CI < 1), for all the chronic disease and no–chronic-disease groups. The community model is also among the more accessible models for arthritic as well as respiratory diseases for both age groups.
The odds ratios for process of care also vary by organizational model across diseases. The contact model tends to offer a less favourable process of care than the other models in all disease groups, as well as the no–chronic-disease group, except in the cardi-ovascular-risk-factors and respiratory-diseases
(≤ 44 years) groups. For both these groups, all organizational models other than single provider show a less favourable experience of care.
Results for outcomes of care follow the same pattern as for process of care. Those for the no–chronic-disease group follow the pattern observed for process of care more closely. The other results are similar to those for process of care, but for the most part they fail to reach statistical significance.
Discussion
Our study sheds light on the range of care experience across chronic disease conditions. It also explores the extent to which the relationship between organizational PHC models and care experience varies across different types of chronic diseases.
Two major findings emerge from our study. First, accessibility of care is relatively low for all chronic conditions, as well as for those with no chronic disease, and shows little variation across diseases. Process
TABLE 3 Characteristics of population survey respondents (N = 6222) by chronic disease group, Quebec, 2003–2005
Chronic disease group, %
Respondent characteristic All users No chronic disease
Cardiovascular risk factors
Arthritic Respiratory (≤ 44 years)a
Respiratory (≥ 45 years)b
Cardiac
Age
18–39 35.3 53.8* 8.7* 8.3* 81.5 - 10.1*
40–54 31.0 34.8* 29.4 27.6 18.5 41.8 16.5*
55–69 21.5 9.4* 41.8* 37.8* - 36.5 34.8*
70 plus 12.2 2.0* 20.2* 26.3* - 21.7 38.5*
Sex
Male 44.3 48.7* 56.9* 31.6* 37.7* 37.8* 46.8
Female 55.7 51.3* 43.1* 68.4* 62.3* 62.2* 53.2
Perceived health status
Bad/average 17.5 5.3* 19.2 25.9* 17.5 35.5* 39.5*
Good 29.4 22.5* 37.0* 34.1* 37.7* 33.1 33.3
Excellent 53.1 72.2* 43.8* 40.0* 44.7* 31.4* 27.2*
Level of education completed
Primary (less than high school) 15.6 6.6* 20.5* 26.3* 7.7* 24.9* 34.4*
Secondary diploma 32.7 32.4 35.1 33.1 32.7 32.7 31.9
Post-secondary diploma 24.1 27.5* 19.3* 19.6* 32.0* 25.1 17.1*
University degree 27.5 33.5* 25.1 21.0* 27.6 17.3* 16.5*
Income, CAD
Less than 15,000 11.9 9.3* 10.3 15.0* 13.2 17.0* 18.8*
15,000–34,999 31.2 26.3* 33.9 36.8* 24.0* 35.8 42.1*
35,000–74,999 34.5 37.0 34.4 30.9 38.2 31.1 28.3*
75,000 plus 22.5 27.3* 21.4 17.3* 24.5 16.1* 10.7*
Model of organization as regular source of care
Contact 22.7 25.8* 19.2 20.6 26.0 21.9 20.8
Coordination 25.3 22.9 27.3 29.1 25.5 25.5 23.7
Coordination-integrated 29.0 29.5 27.9 26.6 27.6 28.5 28.9
Community 10.4 11.7 10.7 8.9 10.8 9.2 8.7
Single provider 12.5 10.1* 14.8 14.7 10.1 14.8 17.9*
Abbreviations: CAD, Canadian dollars; N, overall sample size; p, statistical significance.
a The main morbidity in this age group (≤ 44 years) is likely asthma.
b The main morbidity in this age group (≥ 45 years) is likely chronic obstructive pulmonary disease (COPD).
* p ≤ .05; reference is all users

115Vol 31, No 3, June 2011 – Chronic Diseases and Injuries in Canada
of care and outcomes of care indices are much higher for all conditions and these vary across diseases, with the highest being for the cardiovascular-risk-factors group and the lowest for respiratory-diseases (≤ 44 years) group.
Second, first-contact accessibility for all chronic disease conditions is more likely to be attained in the contact and the coordi-nation-integrated models than in the other models. Conversely, first-contact acces-sibility is likely to be lower for patients whose regular source of care is either the single-provider or the coordination model of PHC organization.
In contrast, for process of care and, to a lesser extent, outcomes of care, the single-provider model is associated with better results than the contact model for all chronic diseases and no chronic diseases. Patients with car-diovascular risk factors and respiratory dis-eases (≤ 44 years) report a worse process of care for all models other than the single-provider model, while for the no–chronic-disease, arthritic, respiratory (≥ 45 years) and cardiac-disease groups, all models sur-pass the contact model for process of care. The community model is superior for older patients (≥ 45 years) with respiratory dis-eases, as is the coordination model for those with cardiac diseases (Table 6).
These findings on accessibility deserve a lengthier explanation. First, in our study the percentage of individuals with high score (≥ 7.5 out of 10) of first-contact accessibility of PHC is rather low (range: 28.4%–32.1%), regardless of their condi-tion, and the percentage is much lower than for other aspects of care experi-ence (Table 5). Other studies have also alerted us to major problems of accessi-bility in the delivery of PHC services.28-30 Although the variation between models is small, logistic regression analysis reveals two interesting contrasting results: the single-provider model is the least acces-sible at first contact, whereas the con-tact model is the most accessible in all conditions. Since a higher proportion of patients affiliated with the single-provider model than with the contact model have regular doctors (94% vs. 64%), this sug-gests that having a regular doctor is not
among the most important factors fostering accessibility (Figure 3).29,31-33 At least for this dimension of care experience, having a regular doctor does not seem to be the sole important factor explaining the rela-tionship between first-contact accessibility and PHC organizational models; some intrinsic attributes of these various models, such as group practice, also seem to be important. This is due to the fact that access to health care is conceptualized in this study as having access to a specific general practitioner as well as to other doctors in the absence of one’s family doctor. Obviously, solo providers fail to address this broader view of first-contact access. Conversely, the contact model possesses intrinsic features that foster first-contact accessibility (Table 2).
In comparison with first-contact accessibil-ity, process of care and, to a lesser extent, outcomes of care show much higher per-centages of individuals having high scores for all diseases. There is also greater variation across diseases, with the respiratory-diseases (≤ 44 years) group having the lowest percentage and cardiovascular-risk-factors group the highest (Table 5). These differences may reflect the fact that patients in the respiratory-diseases (≤ 44 years) group are less likely to have a regular doctor (63%) than patients in the cardiovascular-risk-fac-tors group (93%) (Figure 4). Patients in the respiratory-diseases (≤ 44 years) group are also younger than those in the cardiovas-cular-risk-factor groups (Table 3). Studies reveal that older patients and those who have a regular doctor are more likely to report a favourable experience of care.29,31,32 In comparison to accessibility, process of care is much higher for patients in all the disease groups who are with the single-provider model of PHC (Table 6).
The two coordination models and the community model also generate better processes and outcomes of care than the contact model for no-chronic disease or arthritic and respiratory (≥ 45 years) diseases (Table 6). This indicates that, at least for these three conditions, organizational models influence these aspects of experience of care, although part of this influence can be mediated through age of patients and their having a regular doctor. This explanation
does not hold, however, for the younger no-chronic-disease group, in which a lower percentage of individuals have a regular doctor. Finally, these two factors—age and having a regular doctor—probably explain the lack of relationship, in the younger group of patients with respiratory diseases, between models and care experience, except for the single-provider model. These findings suggest a possible interaction between age and having a regular doctor that we did not explore further. The divergent pattern observed for the cardiovascular-risk-factors group is difficult to explain. Indeed, one would expect age and having a regular doctor to contribute to a better experience of care as compared to the contact model. The lack of difference among models probably reflects the fact that patients with cardiovascular risk factors are less sensitive to differential characteristics of PHC models and find their needs evenly met by the various organizational models. It is also plausible that these patients have fewer symptomatic conditions and thus require less diligent medical attention. This hypothesis remains to be tested in further analyses.
Overall, the professional coordination-inte-grated and the community models emerge as the ones more likely to cover the whole spec-trum of care experience, in terms of acces-sibility, process of care and outcomes of care for most conditions. Notably, these two models yield more favourable processes of care for more severe conditions, such as cardiac, respiratory (≥ 45 years) and arthritic diseases. As noted earlier, these more severe diseases also include a greater number of comorbidities and thus require a more comprehensive and integrated approach to fulfill the diversity of needs. Hence, the coordination-integrated and the community models are particularly well suited to face the growing challenge of chronic disease management.
Although the results for process of care and outcomes of care follow similar patterns, most results for outcomes of care fail to reach statistical significance. This could be due to a lack of statistical power but also to the lack of specificity of our outcomes indicators, which are largely related to pre-vention. The tenuous relationship between process and outcomes of care is a common

116 Vol 31, No 3, June 2011 – Chronic Diseases and Injuries in Canada
finding of studies reporting on experience of care and continuity.34
Finally, our findings must also be interpreted in light of the relative importance of the five PHC organizational models presented. As shown in Table 3, the three professional models—contact, coordination and coor-dination-integrated—share more than 75% of the utilization coverage, whereas the com-munity and single-provider models represent just over 10% each. Further, the single-pro-vider model is fading out as a model of PHC organization and the community model has not demonstrated the capacity to develop beyond its current level. Hence, major improvements to our health care system will likely come from the three most widely used professional models, either by their moving towards the best performing model, identified in our study as the coordination-integrated model, or by establishing networks
in which each model accomplishes specific and complementary functions in a coordi-nated and integrated way.
Strengths and limitations
Our study has some limitations. Firstly, the cross-sectional design makes it difficult to infer causal relationships between models of care and care experience reported in the last two years. In addition, a recall bias may limit the accuracy and reliability of informa-tion gathered on the experience of care.
Another limitation is self-reporting of chronic conditions. Although the wording of the ques-tion referred to validation of the diagnosis by a doctor (i.e. “Has a doctor ever told you that you have diabetes?”), the response is always limited by respondents’ subjective interpretation and their capacity to report medical information accurately. Likewise, it was not possible to obtain greater diagnostic
specificity. For example, we broke down the category of respiratory diseases into two age categories, assuming that people aged 44 years and younger were mainly reporting asthma, while for those aged 45 years plus the main morbidity was COPD, but we were unable to validate these assumptions.
Assigning morbidities to mutually exclusive categories adds more comorbidities to the first ones appearing in the scale. At the same time, this procedure increases the hetero-geneity of these categories. But given the correlation between perceived health status and categories of chronic diseases, we considered the inclusive order of categories of morbidities as accurately representing decreasing degrees of severity. However, since it remains a measure of prevalence of a diagnosis and not a true measure of health status, our analyses cannot claim to have fully controlled for severity of disease and
TABLE 4 Population survey respondents (N = 6222) with comorbidities associated with their chronic disease group
Comorbidities, %
Chronic disease groups Cardiac problems
Respiratory problems
Arthritic problems
Cardiovascular risk factors
Other health problems
Cardiac 100.0 24.3 45.9 65.4 74.9
Respiratory (≥ 45 years)a - 100.0 50.0 38.9 67.2
Respiratory (≤ 44 years)b - 100.0 9.9 3.6 38.2
Arthritic - - 100.0 39.1 51.1
Cardiovascular risk factors - - - 100.0 39.9
Other health problems - - - - 100.0
No chronic disease - - - - -
Abbreviations: N, overall sample size.
a The main morbidity in this age group (≥ 45 years) is likely chronic obstructive pulmonary disease (COPD).
b The main morbidity in this age group (≤ 44 years) is likely asthma.
TABLE 5 Population survey respondents (N = 6222) who experienced better carea by chronic disease group
Chronic disease group, %
Experience of care All users No chronic disease
Cardiovascular risk factors
Arthritic Respiratory (≤ 44 years)b
Respiratory (≥ 45 years)c
Cardiac
First-contact accessibility 29.7 28.4 31.7 32.1 29.1 30.7 30.3
Process of care 61.4 54.7* 79.1* 69.0* 48.8* 71.5* 69.5*
Outcomes of care 56.8 52.4* 73.4* 62.5* 42.5* 63.9* 62.9*
Abbreviations: N, sample size; p, statistical significance.
a Having a score of 7.5 out of 10 on a scale of 0 to 10 of dichotomized scores.
b The main morbidity in this age group (≤ 44 years) is likely asthma.
c The main morbidity in this age group (≥ 45 years) is likely chronic obstructive pulmonary disease (COPD).
*p ≤ .05; reference is all users

117Vol 31, No 3, June 2011 – Chronic Diseases and Injuries in Canada
its potential impact on the experience of care. Finally, self-selection of patients into different primary care organizational models cannot be totally discarded.
Our study also has distinctive strengths. By approaching a large sample of the entire population of the two most populous regions of Quebec, and sending the organizational questionnaire to all the PHC organizations in these two regions, we were able to link 89% of the respondents to one of the 473 PHC organizations surveyed.
Conclusion
Study findings reveal that different organi-zational models of PHC behave differently in different chronic disease situations. Accessibility of care is lowest for all chronic conditions and shows little variation across diseases. The contact and the coordination-integrated models are the most accessible, whereas the single-provider model is the least. Indices for process of care and outcomes of care are much higher than for accessibility for all conditions and vary across diseases, the highest being for patients with car-diovascular risk factors and the lowest for younger patients (≤ 44 years) with respira-tory diseases. The contact model seems to be at the forefront in terms of accessibility whereas the single-provider model is best when the focus is on process of care. However, these two models have severe limitations as far as other aspects of care experience are concerned. For chronic diseases of increased severity, the coordination-integrated and the community models are more likely to generate a better process of care and, consequently, to meet essential conditions for successful implementation of the chronic-care model. The coordina-tion-integrated model in particular emerges as the most complete model that can concomitantly achieve a higher level of accessibility and of process of care for nearly all chronic conditions and attain a higher level of utilization coverage. In this sense, it is probably the model with the greatest potential for bringing about important changes to our health care system.
TAB
LE 6
Ex
peri
ence
of
care
by
orga
niza
tion
al m
odel
and
by
chro
nic
dise
ase
grou
ps
Chr
onic
dis
ease
gro
up, %
No
chro
nic
dise
ase
Car
diov
ascu
lar
ri
sk f
acto
rsA
rthr
itic
Res
pira
tory
(≤
44
year
s)R
espi
rato
ry
(≥ 4
5 ye
ars)
Card
iac
Expe
rien
ce o
f ca
reO
Rb
(CI 9
5%)
OR
b(C
I 95%
)O
Rb
(CI 9
5%)
OR
b(C
I 95%
)O
Rb
(CI 9
5%)
OR
b(C
I 95%
)
Firs
t-con
tact
acc
essi
bilit
y
Coor
dina
tion
0.78
1(0
.604
–1.
009)
0.45
1(0
.282
– 0
.720
)0.
689
(0.4
73 –
1.0
02)
0.44
3(0
.238
– 0
.822
)0.
709
(0.3
75 –
1.3
38)
0.22
7(0
.122
– 0
.420
)
Coor
dina
tion-
inte
grat
ed1.
292
(1.0
27 –
1.6
24)
0.72
3(0
.462
– 1
.131
)0.
926
(0.6
36 –
1.3
48)
0.75
6(0
.425
– 1
.344
)1.
476
(0.8
14 –
2.6
77)
0.60
5(0
.358
– 1
.024
)
Com
mun
ity0.
753
(0.5
48 –
1.0
36)
0.25
0(0
.127
– 0
.491
)0.
678
(0.3
99 –
1.1
55)
0.89
7(0
.425
– 1
.894
)1.
085
(0.4
59 –
2.5
66)
0.45
8(0
.210
– 0
.997
)
Sing
le p
rovi
der
0.18
5(0
.113
– 0
.303
)0.
135
(0.0
67 –
0.2
71)
0.21
6(0
.124
– 0
.376
)0.
130
(0.0
39 –
0.4
31)
0.24
9(0
.096
– 0
.646
)0.
173
(0.0
83 –
0.3
58)
Proc
ess
of c
are
Coor
dina
tion
1.86
9(1
.475
– 2
.368
)0.
853
(0.4
83 –
1.5
07)
2.24
3(1
.528
– 3
.294
)1.
152
(0.6
56 –
2.0
25)
2.91
9(1
.538
– 5
.540
)4.
024
(2.1
39 –
7.5
72)
Coor
dina
tion-
inte
grat
ed1.
845
(1.4
78 –
2.3
04)
0.68
4(0
.396
– 1
.181
)1.
937
(1.3
14 –
2.8
55)
1.68
4(0
.963
– 2
.944
)1.
710
(0.9
50 –
3.0
77)
1.67
0(0
.980
– 2
.845
)
Com
mun
ity1.
292
(0.9
69 –
1.7
22)
0.90
2(0
.438
– 1
.858
)2.
345
(1.3
49 –
4.0
78)
1.46
6(0
.711
– 3
.024
)4.
959
(1.7
24 –
14.
266)
1.24
1(0
.591
– 2
.606
)
Sing
le p
rovi
der
4.25
4(3
.016
– 5
.999
)2.
558
(1.1
36 –
5.7
58)
5.06
7(2
.947
– 8
.711
)4.
208
(1.8
62 –
9.5
10)
2.86
9(1
.340
– 6
.140
)2.
577
(1.3
53 –
4.9
07)
Out
com
es o
f car
e
Coor
dina
tion
1.77
4(1
.402
– 2
.246
)1.
062
(0.6
40 –
1.7
64)
1.41
6(0
.977
– 2
.052
)1.
249
(0.7
02 –
2.2
22)
1.28
5(0
.705
– 2
.341
)1.
677
(0.9
44 –
2.9
80)
Coor
dina
tion-
inte
grat
ed1.
472
(1.1
82 –
1.8
34)
1.12
2(0
.678
– 1
.858
)1.
235
(0.8
48 –
1.7
98)
1.66
5(0
.944
– 2
.935
)1.
046
(0.5
83 –
1.8
77)
1.21
9(0
.717
– 2
.072
)
Com
mun
ity1.
308
(0.9
83 –
1.7
42)
1.28
1(0
.664
– 2
.471
)1.
510
(0.8
91 –
2.5
58)
1.55
6(0
.747
– 3
.242
)1.
588
(0.6
56 –
3.8
46)
0.62
5(0
.299
– 1
.307
)
Sing
le p
rovi
der
2.37
0(1
.731
– 3
.245
)1.
441
(0.7
88 –
2.6
37)
1.63
7(1
.042
– 2
.573
)2.
480
(1.1
65 –
5.2
77)
1.76
0(0
.850
– 3
.645
)1.
115
(0.6
09 –
2.0
42)
Abbr
evia
tions
: CI,
confi
denc
e in
terv
al; O
R, o
dds
ratio
a Adj
uste
d fo
r age
, sex
, inc
ome
and
leve
l of e
duca
tion
but n
ot fo
r per
ceiv
ed h
ealth
sta
tus
b Ref
eren
ce is
the
prof
essi
onal
con
tact
mod
el
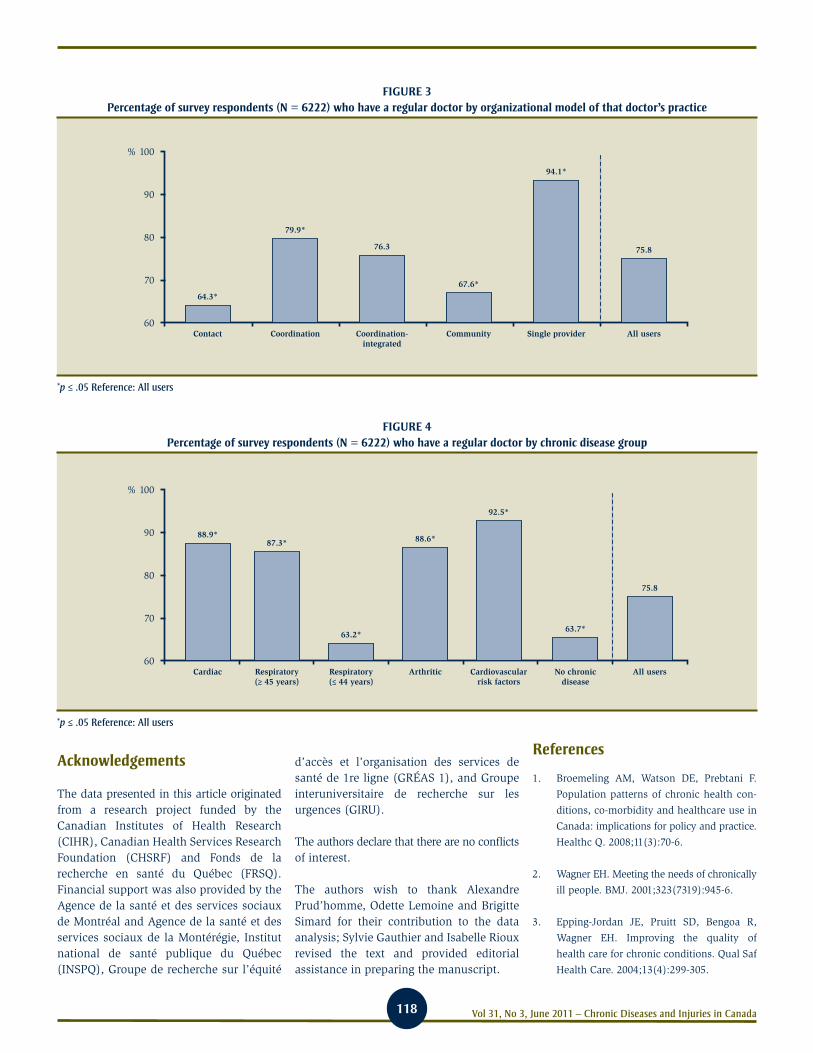
118 Vol 31, No 3, June 2011 – Chronic Diseases and Injuries in Canada
Acknowledgements
The data presented in this article originated from a research project funded by the Canadian Institutes of Health Research (CIHR), Canadian Health Services Research Foundation (CHSRF) and Fonds de la recherche en santé du Québec (FRSQ). Financial support was also provided by the Agence de la santé et des services sociaux de Montréal and Agence de la santé et des services sociaux de la Montérégie, Institut national de santé publique du Québec (INSPQ), Groupe de recherche sur l’équité
d’accès et l’organisation des services de santé de 1re ligne (GRÉAS 1), and Groupe interuniversitaire de recherche sur les urgences (GIRU).
The authors declare that there are no conflicts of interest.
The authors wish to thank Alexandre Prud’homme, Odette Lemoine and Brigitte Simard for their contribution to the data analysis; Sylvie Gauthier and Isabelle Rioux revised the text and provided editorial assistance in preparing the manuscript.
References
1. Broemeling AM, Watson DE, Prebtani F.
Population patterns of chronic health con-
ditions, co-morbidity and healthcare use in
Canada: implications for policy and practice.
Healthc Q. 2008;11(3):70-6.
2. Wagner EH. Meeting the needs of chronically
ill people. BMJ. 2001;323(7319):945-6.
3. Epping-Jordan JE, Pruitt SD, Bengoa R,
Wagner EH. Improving the quality of
health care for chronic conditions. Qual Saf
Health Care. 2004;13(4):299-305.
FIGURE 3 Percentage of survey respondents (N = 6222) who have a regular doctor by organizational model of that doctor’s practice
*p ≤ .05 Reference: All users
% 100
90
80
70
60
64.3*
Contact
79.9*
Coordination
76.3
Coordination-integrated
67.6*
Community
94.1*
Single provider
75.8
All users
FIGURE 4 Percentage of survey respondents (N = 6222) who have a regular doctor by chronic disease group
*p ≤ .05 Reference: All users
% 100
90
80
70
60
88.9*
Cardiac
87.3*
Respiratory(≥ 45 years)
63.2*
Respiratory(≤ 44 years)
88.6*
Arthritic
92.5*
Cardiovascularrisk factors
63.7*
No chronicdisease
75.8
All users

119Vol 31, No 3, June 2011 – Chronic Diseases and Injuries in Canada
4. Starfield B, Lemke KW, Bernhardt T,
Foldes SS, Forrest CB, Weiner JP.
Comorbidity: implications for the importance
of primary care in ‘case’ management. Ann
Fam Med. 2003;1(1):8-14.
5. Starfield B, Lemke KW, Herbert R,
Pavlovich WD, Anderson G. Comorbidity
and the use of primary care and specialist
care in the elderly. Ann Fam Med.
2005;3(2):215-22.
6. Grumbach K. Chronic illness, comorbidities,
and the need for medical generalism. Ann
Fam Med. 2003;1(1):4-7.
7. Broemeling AM, Watson DE, Black C. Chronic
conditions and co-morbidity among residents
of British Columbia. Vancouver (BC): Centre
for Health Services and Policy Research,
University of British Columbia; 2005.
8. Rothman AA, Wagner EH. Chronic illness
management: what is the role of primary
care? Ann Intern Med. 2003;138(3):256-61.
9. Davis K, Schoenbaum SC, Audet AM. A
2020 vision of patient-centered primary
care. J Gen Intern Med. 2005;20(10):953-7.
10. Starfield B, Shi L. The medical home, access
to care, and insurance: a review of evidence.
Pediatrics. 2004;113(5 Suppl):1493-8.
11. O’Connor PJ, Sperl-Hillen JM, Pronk NP,
Murray T. Primary care clinic-based chronic
disease care: Features of successful programs.
Dis Manag Health Out. 2001;9(12):691-8.
12. Bodenheimer T, Wagner EH, Grumbach K.
Improving primary care for patients with
chronic illness: the chronic care model,
Part 2. JAMA. 2002;288(15):1909-14.
13. Barr VJ, Robinson S, Marin-Link B,
Underhill L, Dotts A, Ravensdale D, et
al. The expanded Chronic Care Model:
an integration of concepts and strategies
from population health promotion and the
Chronic Care Model. Hosp Q. 2003;7(1):73-82.
14. Rundall TG, Shortell SM, Wang MC, Casalino
L, Bodenheimer T, Gillies RR, et al. As
good as it gets? Chronic care management
in nine leading US physician organizations.
BMJ. 2002;325(7370):958-61.
15. Levesque JF, Feldman D, Dufresne C,
Bergeron P, Pinard B, Gagné V. Barrières
et éléments facilitant l’implantation de
modèles intégrés de prévention et de gestion
des maladies chroniques. Prat Organ Soins.
2009;40(4):251-65. French.
16. Friedberg MW, Coltin KL, Safran DG,
Dresser M, Zaslavsky AM, Schneider EC.
Associations between structural capabilities
of primary care practices and performance
on selected quality measures. Ann Intern
Med. 2009;151(7):456-63.
17. Shortell SM, Marsteller JA, Lin M, Pearson ML,
Wu SY, Mendel P, et al. The role of perceived
team effectiveness in improving chronic ill-
ness care. Med Care. 2004;42(11):1040-8.
18. Russell GM, Dahrouge S, Hogg W, Geneau R,
Muldoon L, Tuna M. Managing chronic
disease in Ontario primary care: the impact
of organizational factors. Ann Fam Med.
2009;7(4):309-18.
19. Glazier RH, Klein-Geltink J, Kopp A,
Sibley LM. Capitation and enhanced fee-for-
service models for primary care reform:
a population-based evaluation. CMAJ.
2009;180(11):E72-E81.
20. Tsai AC, Morton SC, Mangione CM,
Keeler EB. A meta-analysis of interventions
to improve care for chronic illnesses. Am J
Manag Care. 2005;11(8):478-88.
21. Cretin S, Shortell SM, Keeler EB. An evalua-
tion of collaborative interventions to improve
chronic illness care: Framework and study
design. Eval Rev. 2004;28(1):28-51.
22. Levesque JF, Pineault R, Simard B,
Roberge D, Hamel M, Kapetanakis C, et
al. L’expérience de soins de la population:
portrait des variations intra-régionales
à Montréal et en Montérégie [Internet].
Montréal (QU): Institut national de santé
publique du Québec; 2007 [cited 2010
Nov 8]. Available from: http://www
.inspq.qc.ca/pdf/publications/627-Experi-
enceDeSoinsDeLaPopulation.pdf French.
Jointly published by Direction de santé
publique de l’Agence de la santé et des services
sociaux de Montréal.
23. Pineault R, Levesque JF, Roberge D,
Hamel M, Lamarche P, Haggerty J.
Accessibility and continuity of care: a study
of primary healthcare in Québec. Research
report presented to the Canadian Institutes
of Health Research and the Canadian
Health Services Research Foundation
[Internet]. Montréal (QU): Direction de
santé publique de l’Agence de la santé
et des services sociaux de Montréal;
2009 [cited 2010 Nov 8]. Available from:
http://www.inspq.qc.ca/pdf/publications
/911_ServicesPremLigneANGLAIS.pdf Jointly
published by Institut national de santé pub-
lique du Québec and Centre de recherche
de l’Hôpital Charles LeMoyne.
24. Hamel M, Pineault R, Levesque JF, Roberge D,
Lozier-Sergerie A, Prud’homme A, Simard B.
L’organisation des services de santé de
première ligne: portrait des services médi-
caux de première ligne à Montréal et en
Montérégie. Montréal (QU): Institut national
de santé publique du Québec; 2007 [cited
2010 Nov 8]. http://www.inspq.qc.ca/pdf/
publications/726-OrganisationServices.pdf
French. Jointly published by Direction de santé
publique de l’Agence de la santé et des services
sociaux de Montréal.
25. Nietert PJ, Wessell AM, Jenkins RG, Feifer C,
Nemeth LS, Ornstein SM. Using a summary
measure for multiple quality indicators in
primary care: the Summary QUality InDex
(SQUID). Implement Sci. 2007;2:11.
26. Feifer C, Nemeth L, Nietert PJ, Wessell AM,
Jenkins RG, Roylance L, et al. Different
paths to high-quality care: three archetypes
of top-performing practice sites. Ann Fam
Med. 2007;5(3):233-41.
27. Lamarche PA, Beaulieu MD, Pineault R,
Contandriopoulos AP, Denis JL, Haggerty
J. Choices for change: the path for restruc-
turing primary healthcare services in
Canada. Ottawa (ON): Canadian Health
Services Research Foundation; 2003.
28. Schoen C, Osborn R, Doty MM, Bishop M,
Peugh J, Murukutla N. Toward higher-per-
formance health systems: adults’ health care
experiences in seven countries, 2007. Health
Aff (Millwood). 2007;26(6):w717-34.

120 Vol 31, No 3, June 2011 – Chronic Diseases and Injuries in Canada
29. Canadian Institute for Health Information.
Experiences with primary health care in
Canada. Ottawa (ON): Canadian Institute
for Health Information; 2009 [cited 2010
May 4]. Available from: http://secure.cihi
.ca/cihiweb/products/cse_phc_aib_en.pdf
30. Sanmartin C, Ross N. Experiencing difficulties
accessing first-contact health services in
Canada: Canadians without regular doctors
and recent immigrants have difficulties
accessing first-contact healthcare services.
Reports on difficulties in accessing care
vary by age, sex and region. Healthc Policy.
2006;1(2):103-19.
31. Nutting PA, Goodwin MA, Flocke SA,
Zyzanski SJ, Stange KC. Continuity of
primary care: to whom does it matter and
when? Ann Fam Med. 2003;1(3):149-55.
32. Haggerty JL, Pineault R, Beaulieu MD,
Brunelle Y, Gauthier J, Goulet F, et al. Room for
improvement: patients’ experiences of pri-
mary care in Quebec before major reforms.
Can Fam Physician. 2007;53(6):1056-7.
33. Starfield B. Primary Care: Balancing health
needs, services and technology. New York:
Oxford University Press; 1998.
34. Christakis DA. Continuity of care: process or
outcome? Ann Fam Med. 2003;1(3):131-3.

121Vol 31, No 3, June 2011 – Chronic Diseases and Injuries in Canada
Author references
1. Chronic Disease & Injury Prevention Department; Haliburton, Kawartha, Pine Ridge District Health Unit, Port Hope, Ontario, Canada2. Epidemiology & Evaluation Services; Haliburton, Kawartha, Pine Ridge District Health Unit, Port Hope, Ontario, CanadaCorrespondence: Sarah Tsang, Public Health Dietitian, Chronic Disease and Injury Prevention Department, Haliburton, Kawartha, Pine Ridge District Health Unit, 200 Rose Glen Road; Port Hope ON L1A 3V6; Tel.: (905) 885-9100 ext 497; Fax: (905) 885-9551; Email: [email protected]
An assessment of the barriers to accessing food among food-insecure people in Cobourg, Ontario
Abstract
Introduction: Low-income people are most vulnerable to food insecurity; many turn to community and/or charitable food programs to receive free or low-cost food. This needs assessment aims to collect information on the barriers to accessing food programs, the opportunities for improving food access, the barriers to eating fresh vegetables and fruit, and the opportunities to increasing their consumption among food-insecure people in Cobourg, Ontario.
Methods: We interviewed food program clients using structured individual interviews consisting of mostly opened-ended questions.
Results: Food program clients identified barriers to using food programs as lack of trans-portation and the food programs having insufficient quantities of food or inconvenient operating hours. They also stated a lack of available vegetables and fruit at home, and income as barriers to eating more vegetables and fruit, but suggested a local fresh fruit and vegetable bulk-buying program called “Good Food Box” and community gardens as opportunities to help increase their vegetable and fruit intake.
Discussion: Many of the barriers and opportunities identified can be addressed by working with community partners to help low-income individuals become more food secure.
Introduction
The link between low-income and health is well documented: people at the lowest socio-economic level are at risk of developing chronic diseases, including heart disease, diabetes, chronic respiratory diseases and cancer, and of dying prematurely.1-13 Previous studies report that income greatly impacts food accessibility, which in turn influences food consumption, especially of nutritious food required to keep healthy.14-19 Individuals who have limited physical and economic access to safe, nutritious, and
personally acceptable food are defined as food insecure.20-21 People in low-income groups are most vulnerable to food inse-curity; they include single-parent families, those receiving social assistance, those who reside in rented dwellings, the home-less, the working poor, the unemployed, unskilled and semi-skilled workers, people with literacy needs, people with mental illness and addictions, teenage parents, and those with disabilities.22
In Ontario, 47.2% of households earning less than $10,000 before tax are food insecure, compared to only 1.8%, 5.2% and 14.4% for households in the highest, upper middle, and middle-income categories, respectively.23 Food-insecure individuals turn to community food programs, such as community gardens and kitchens, or charitable food programs, such as food banks, or both, to receive free or low-cost food to help alleviate some of their financial constraints.
The purpose of this needs assessment is to collect information on the barriers to accessing food programs, whether com-munity- or charity-based; the opportuni-ties for improving food access; the barriers to eating vegetables and fruit; and the opportunities to increasing the consumption of vegetables and fruit among food-insecure people in Cobourg, Ontario.
Background
Cobourg is located in the province of Ontario, approximately 110 kilometres east of Toronto. It is the largest urban-like centre in Northumberland County, which is made up of mostly rural communities. The popu-lation in 2006 was 18 210, with the majority aged over 25 years.24 At that time it was home to 5235 families, with 18% of these being single-parent families.24 The unem-ployment rate was 6.7%, compared to 6.4% for Ontario.24 About 7% of Cobourg’s popu-lation was low-income before tax.24
Cobourg has a public transportation system of two fixed bus routes. There are four major grocery chain stores, two of which
S. Tsang, MHSc, RD (1); A.M. Holt, MHSc (2); E. Azevedo, MSc, RD (1)
Keywords: nutrition, low-income population, poverty, healthy food, accessibility, fruit, vegetables, food insecurity, Ontario

122 Vol 31, No 3, June 2011 – Chronic Diseases and Injuries in Canada
are discount food stores. There is one food bank, one free lunch program, one community garden, and a handful of charitable community organizations that manage pantries of donated foods that are available for free to any food-insecure person. The food bank is open every Wednesday and Friday for three hours in the morning, and clients are able to access it two times per month. The free lunch program is available every day of the week for one hour to anyone in need. Charitable community organizations that manage food pantries are opened during their normal business hours.
Methods
We used a convenience sample to gather information from adults who had used services such as food banks and counselling programs at least once.
Potential respondents were recruited at two local non-governmental organizations that manage charitable food programs but whose primary mandate is not the provision of food. We chose these particular charitable food programs because they are located in safe and friendly neighbourhoods, which facilitated the recruitment and the interview process. Also, these two organizations reach people who use any of the available charitable food programs, as well as a broader spectrum of food-insecure people. Four members of a local food security committee volunteered to be trained to conduct interviews. The needs assessment was advertised on flyers posted at the designated locations. Interview respondents were recruited using two different sampling strategies: at one location, two trained interviewers approached food program clients with a standard script; at the other, an individual who had a relationship with many of the food program clients facilitated recruitment of potential respondents. Both recruitment methods requested voluntary participation. Potential respondents were told of the purpose of the needs assess-ment and assured confidentiality; consent was verbal. They were shown to a quiet corner or a separate room to be interviewed by the two trained interviewers using the interview guide. In total, 35 people completed the interview, after which every
respondent received an information letter describing the needs assessment and detailing the consent process.
The interview guide consisted of structured, open-ended questions and several closed-ended questions. Prior to starting this needs assessment, the interview guide was reviewed by a member of the local food security committee and health unit staff, and piloted-tested with a sample of food bank recipients from another municipality. The questions were about barriers to using and opportunities for improving access to food programs; barriers to and opportunities for eating vegetables and fruit; and the respond-ents’ own definitions of what it means to have enough food. The interviewers took notes of the respondents’ keywords and phrases, or explanations of their answers, and recorded descriptions of their body language to pro-vide additional context to the answer. The interviewers checked the trustworthiness of the data they had recorded by periodically repeating the response to verify their under-standing and interpretation of what the respondents had said.
At the end of each day, all the interviewers were debriefed so as to analyze the written responses and the interviewers’ thoughts, feelings and insights about each interview.
The needs assessment protocol was reviewed for ethical consideration in accordance with established standards of the Haliburton, Kawartha, Pine Ridge District Health Unit.
Data analysis
Using framework analysis, we qualitatively analyzed all the responses to open-ended questions and all field notes recorded for both open- and closed-ended questions.25 Framework analysis is a qualitative method ideally suited to studies with specific ques-tions, a limited time frame, a convenience sample and a priori objectives, such as the barriers and opportunities assessed in our study.26 Tallies and percentages to each closed-ended question and the demograph-ics were calculated separately. The data were analyzed throughout and after the data collection process, enabling the lead researcher to identify the point when data saturation was reached.
Using La Pelle’s methods, answers and field notes to all interview questions were entered into a table formatted in Microsoft Word.27 Data were coded using a thematic framework developed a priori from the needs assess-ment objectives.25 Expressions indicating barriers or opportunities were marked with colours and different fonts. A separate doc-ument was created to group all expressions of barriers and opportunities together.28 The grouped expressions were then separated into (1) barriers and opportunities according to their question number and reference to food programs in general; (2) reasons for accessing food programs more than once a month; and (3) vegetables and fruit consumption. These distinct clusters were then analyzed for common subthemes.
One question from the standard script interview, “What does ‘having enough food’ mean to you?” did not fit into the a priori framework. Rather, the question gave context and meaning to food insecurity as experienced locally by individuals and households. For this question, themes were generated as they surfaced from the data without the use of an a priori framework.
All of the raw data were analyzed indepen-dently by two investigators using the same framework, and their analysis was reviewed by a third. The three investigators discussed any discrepancies to reach a consensus on the categories.
Results
Table 1 shows the characteristics and the household make-up of the respondents.
Of the 35 respondents who completed an interview, 43% said that if there were no restrictions, they wished they could access food programs once a week (data not shown). All of the respondents said they enjoy eating vegetables, while 97% said they enjoy eating fruit. Only 23% said they are able to get as much vegetables and fruit as they want.
Barriers to using food programs
The most common barrier mentioned by the respondents was transportation, as 14 respondents (40%) either lacked the means

123Vol 31, No 3, June 2011 – Chronic Diseases and Injuries in Canada
TABLE 1 Characteristics of respondents (N = 35) who completed a needs assessment interview about barriers
to accessing food programs and to eating vegetables and fruit.
GroupNumber of respondents,
nPercentage of respondents,
%
Sex
Female 31 89
Male 4 11
Age
18–29 years 5 14
30–39 years 12 34
40–49 years 12 34
50–59 years 5 14
60–69 years 1 3
70+ years 0 0
Place of residence
Cobourg 30 86
Outside Cobourg 5 14
Interview request approach
Interviewers approached potential respondents directly 9 26
Interviewers introduced to potential respondents by an individual who had a relationship with the respondents
26 74
Children in the householda
None 12 34
Children 12 years and under 18 51
Children 13–18 years 10 29
People working in the household
0 13 37
1 15 43
2 5 14
3 2 6
Source of household incomeb
Ontario Works 10 29
Ontario Disability Support Program 11 31
Ontario Child Care Supplement for Working Families 5 14
Canada Pension Plan Disability (CPPD) 0 0
Canada Pension Plan (CPP) 3 9
Old Age Security Program 2 6
Ontario Student Assistance Program 0 0
Regular employment 22 63
Employment Insurance (EI) 22 63
Workplace Safety and Insurance Board (WSIB) Benefits 0 0
Other 2 6
None 0 0
a Some households include children in both age groups (less than 12 years, 13–18 years), hence the percentages add up to more than 100.
b Some households have more than one source of income, hence the percentages add up to more than 100.

124 Vol 31, No 3, June 2011 – Chronic Diseases and Injuries in Canada
to get to the program location (no vehicle, no access to rides) or had difficulty walking home with large boxes of food. Certain foodstuffs in the food banks, such as milk, pasta, and peanut butter, were quickly depleted, and 6 respondents (17%) men-tioned that they receive insufficient quan-tities of food for themselves and their household. One single, middle-aged woman exclaimed about the food banks’ food sup-ply in general, “It’s the food—running out of food all the time.” Another respondent, a mother of two younger children and two teenagers, explained, “The food bank don’t [sic] give enough food.” Ten respondents (29%) complained that the food programs are not open for long enough during the day or throughout the month, and that the times of operation conflict with their per-sonal schedules. One woman explained the current operation of the food bank: “[the food bank] now opens 10 [a.m.] to 1 [p.m.], but [I] would like [it to be open] from 9 [a.m.] to 4 [p.m.].” Other barriers were not knowing where food programs are located throughout the community; the quality of food, which is described as being mostly “junk food;” the need to show personal identification; not being able to choose preferred food; and that the food bank service area was too small and could not be accessed by people in wheelchairs or with children in strollers. Regarding food quality, a mother of two recounted, “I got home once to find 50 percent or more [of the food from the food bank] are [sic] fruit cakes, doughnuts, cookies, and I cried… I thought, how can I feed my child?”
Opportunities for improving food program access
Three respondents suggested opening food programs on more days of the week and during morning, afternoon and evening hours. One mother of three said, “Most programs [are] open Monday, Wednesday, Friday…[It would be] nice if something [was] available other than those days.” Several others expressed the theme of social support networks, where people help each other by growing food and sharing together or making sure there is enough
food remaining for the next individual. A part-time working mother of two children explained her ideal barrier-free food bank system, “Have to be fair to other people—don’t be greedy or selfish—don’t be taking too much, just enough to get by.” Finally, thirteen respondents (37%) reported very few or no barriers to using food programs.
Barriers to eating vegetables and fruit
Twelve respondents (34%) mentioned that not having enough vegetables and fruit was a barrier to eating them. A part-time working mother of one stated that she does not need encouragement to eat more vegetables and/or fruit. Rather, she said, “[I] don’t eat them because I don’t have them [in my home].” Another single mother of three explained why she does not eat more vegetables or fruit in the context of food insecurity, “If I knew I had enough for my boys, I myself would eat more.” Not having enough money to afford vegetables or fruit, and vegetables and fruit being expensive were other common themes. When asked “What would encourage you to eat more vegetables and/or fruit”, an unemployed, single, middle-aged man replied, “[I] don’t make enough money. If I had more money, I’[d] make sure to buy some fruit.” A working mother of two who is the sole breadwinner of the household described what might help her get more fruits and vegetables, “more money…they say [vegetables and fruit] are cheaper, but [they’re] not.”
Opportunities for increasing consumption of vegetables and fruit
Eleven respondents (31%) suggested that the food program use or offer a local fresh fruit and vegetable bulk-buying program, the “Good Food Box,”* as a way to help increase their vegetable and fruit consumption. Sixteen respondents (46%) stated that the affordability of vegetables and fruit and their availability at food programs are factors in how much they consume them. Ten respondents (29%) mentioned having or joining a gardening program, or having a garden or more room to grow their own vegetables and fruits. Ten respondents (29%) also mentioned that they would eat more
vegetables and fruit if they knew more about the benefits of eating these, if they had recipes and/or took cooking classes, and if they knew how to keep vegetables and fruit longer without spoilage.
Reasons for accessing food programs more than once a month
Seven respondents (20%) explained that they need to return to different food banks in the greater region several times each month because they do not receive enough food at any one particular location. A part-time working mother of two described her expe-rience with a food bank, “We get one can of tomato soup for two weeks and a bag of pasta for a family of six…It’s not enough!” Two respondents commented on the lack of variety of food at food banks; one full-time working mother of two explained why she visits several food outlets during the month, including food banks: “I don’t get balanced nutrition…I can’t hit all four food groups going to food banks.” Two respondents explained that visiting only one food bank limited their choice; one non-working mother of two teenagers stated, “[a certain food bank]—they decided for me…I don’t need mushrooms, beans and tomatoes.” Fourteen respondents (40%) said that they wish they could access several food programs each week.
Having enough food means…
For fourteen respondents (40%), having enough food meant being able to feed their children healthy, nutritious diets that included a variety of foods. A single, part-time employed mother of two had this to say about having enough food: “[It] doesn’t even mean choice…have one thing from each food group to give to [the] children and myself at every meal—make do with what you have.” Having peace of mind that “everyone in the family has all they need” and not worrying about budgeting or the children going hungry also represented having enough food. One part-time employed mother defined having enough food as “knowing there’s enough food in the fridge or cupboard until the next time I’m getting a cheque.”
*http://www.foodshare.net/goodfoodbox01.htm

125Vol 31, No 3, June 2011 – Chronic Diseases and Injuries in Canada
Five respondents (14%) equated having an adequate amount of food to being able to eat several times in the day or allowing the children to eat as much food as they could. Seven respondents (20%) also reported wanting to be able to eat healthy meals on a regular basis and “feed their entire family every day.”
Discussion
In this needs assessment, we found that (1) transportation, food quantity and food program hours limit food access; (2) that availability and income hinder vegetable and fruit consumption for food-insecure individuals; (3) that food quantity and quality caused respondents to visit food programs more than once a month; and that (4) being able to feed the children in the household adequate quantities of nutritious food was a common definition of having enough food.
Several studies assessing charitable food programs found that recipients commonly receive insufficient quantities of food and that what there is is of poor quality.29-31 Teron and Tarasuk assessed 85 food hampers received by Toronto Daily Food Bank clients and found that over half of the households with three or more persons received less than a three-day supply of food.29 In addition, over 78% of the food hampers contained at least one damaged or out-dated food item.29 Hamelin et al. suggested that for low-income food-insecure households meet-ing basic physical needs by having enough food to eat is just as important as having a diverse, balanced diet.32,33 Respondents in our needs assessment also expressed the importance of fulfilling their basic physical need through quantity and quality of food; not having this need met may be one of the reasons why almost half of the respondents wished they could access food programs and services more often, i.e. once a week.
Most of the respondents in our needs assessment were mothers. Other Canadian studies also found that it was vitally impor-tant to mothers that their children received optimal nutrition.33-36 They equated having enough food with providing for their chil-dren. These mothers go to great lengths
to satisfy their children’s hunger, opting to visit food programs several times each month, despite the stigma associated with using food banks and the feeling of loss of dignity33,37.
Because food banks and other similar types of programs are so dependent on charity or donated products, there is no guarantee of the stock levels or type of foods dis-tributed at any one location at a particular time. This makes them unreliable as a food outlet source for food-insecure individuals who depend on the programs simply to feed their families from day to day.22,29,32,33
Many respondents said that transportation is a barrier to their using food programs. This finding is not exclusive to low-income individuals, as a recent study conducted with all Northumberland County residents reported transportation as one of the top three concerns in the county.38 For low-income individuals who barely get by paying for basic living necessities, public transporta-tion is a luxury,39 and for the few who are able to afford a vehicle, these are typically unreliable or non-functioning.40 Our needs assessment indicated that walking is the primary or preferred mode of transportation because of its low cost; of course, carrying food supplies makes the return trip prob-lematic. Exploring the experiences of low-income mothers caring for children, Bostock pointed out that 82% of the mothers did not own a car and relied on walking to get to places;41 since they found walking stressful and physically tiring, they were confined to accessing only those resources that were within walking distance. In short, lack of transportation restricts an individual’s way of life and their access to resources, such as the quantity of food one can carry back home.
In our needs assessment, many interviewees commented that they would eat more veg-etables and fruit if such fresh produce was available in their homes. Further discussion revealed that the underlying reason for the lack of vegetables and fruit in the home is that fresh produce is unaffordable and not readily available through food programs. Previous studies show that individuals at the lowest socio-economic status tend to eat fewer vegetables and fruit than people of higher socio-economic status.42-48 Health
Canada recommends that adults aged 19 to 50 years eat a minimum of seven servings of vegetables and fruit daily.49 However, for those living on a low income, the price of vegetables and fruit often precludes eating the recommended number of servings. Along with other social determinants such as employment, housing, education, and access to services, income has a profound effect on individual health and the health of a community;50-52 some argue that it is the most important determinant of health.53,54
Although our findings are consistent with the literature on the barriers to food access, our study also has a number of limitations. First, to reduce intimidation and thus increase participation, interviews were not tape-recorded. The interviewers played a dual role as both interviewer and recorder. In such instances, interviewers may either elicit important information but forget to record it verbatim, or they may record diligently but forget to probe for clarification when necessary. There may also be interviewer bias as interviewers must quickly filter responses to note keywords, phrases, or sentences spoken by each respondent. This subjects the data to a preliminary level of sorting and analysis, which may vary slightly from interviewer to interviewer, and it is difficult to ascertain the extent to which interviewers have filtered the information.
Second, more interviews took place at one location than the other. Consequently, the sample population may not be representative of all food-insecure individuals.
Despite the limitations, this needs assessment has highlighted the need to address:
1) Food availability: working to ensure that certain types of food will be available at food programs and that sufficient quantities of food is given relative to household size;
2) Transportation: working to ensure that affordable public transportation is available to get to and from food program locations;
3) Supportive networks: working to enhance social networking opportunities so that people can support each other’s needs;

126 Vol 31, No 3, June 2011 – Chronic Diseases and Injuries in Canada
4) Local fresh fruit and vegetable bulk-buy-ing program: working to ensure that the program is affordable especially for low-income families and individuals.
5) Community gardening: working to generate interest and skills around community gardens to help increase vegetable and fruit intake.
Addressing these food access issues would present a new set of challenges that would need to be considered. It is crucial, then, that everyone, community partners and local communities alike, work together in a con-certed effort to overcome the obstacles.
Programs such as food banks and soup kitchens were never meant to be long-term services. They were originally intended to temporarily relieve people facing economic trouble so that they could direct their finances towards bill payments and other basic living necessities. However, such pro-grams have become permanent and will not be eliminated unless other socioeconomic factors, such as transportation, employ-ment, education, childcare and affordable housing, are addressed in tandem. While there is still a long way to go in eliminating such social challenges, individuals in the interim can help break down barriers and reduce the risk factors of chronic diseases by addressing food access first. This research will help inform local decision-making and strengthen programming in the area of food security.
Acknowledgements
We would like to thank the Canadian Cancer Society, GTA Cancer Prevention and Screening Network for their financial support of this research. We would like to acknowledge the two non-governmental organizations where we recruited the respondents for their assistance with data collection and recruitment. We thank the participants who shared their experiences and stories with us. We would also like to acknowledge Ms. Lesley Hamilton, executive director of Literacy Ontario Central South, and Ms. Sasha Korper, early literacy consultant, for their assistance with the readability and literacy level of our information letter to participants. Finally, we would like to thank Dr. Gayle Broad, assistant professor at
Algoma University, Dr. Lynn Scruby, assis-tant professor of the Faculty of Nursing at University of Manitoba, and Dr. Valerie Tarasuk, professor of the Dalla Lana School of Public Health at University of Toronto for their comments on the preliminary research methodology.
References
1. Gordon D, Shaw M, Dorling D, Davey
Smith G, editors. Inequalities in health:
the evidence presented to the independent
inquiry into inequalities in health. Bristol
(UK): Policy Press; 1999. (Studies in poverty,
inequality and social exclusion.)
2. Sram I, Ashton J. Millennium report to Sir
Edwin Chadwick. Br Med J. 1998;317:592-6.
3. Pantazis C, Gordon D. Tackling inequalities:
Where are we now and what can be done?
Bristol (UK): Policy Press; 2000. (Studies in
poverty, inequality and social exclusion.)
4. World Health Organization. Preventing
chronic diseases: a vital investment [Internet].
Geneva (CH): World Health Organization;
2005 [cited 2010 Jan 27]. Available from:
http://www.who.int/chp/chronic_disease
_report/contents/en/index.html
5. Lynch J, Smith GD, Hillemeier M, Shaw M,
Raghunathan T, Kaplan G. Income inequality,
the psychosocial environment, and health:
comparisons of wealthy nations. Lancet.
2001;358(9277):194-200.
6. Wilkins R, Berthelot JM, Ng E. Trends in
mortality by neighbourhood income in
urban Canada from 1971 to 1996. Health
Rep. 2002;13 Suppl: 45-71.
7. Gwatkin DR. Health inequalities and the
health of the poor: what do we know?
What can we do? Bull World Health Organ.
2000;78(1):3-18.
8. Williamson DL. The role of the health
sector in addressing poverty. Can J Public
Health. 2001;92(3):178-83.
9. Gyorfi-Dyke E. Poverty and chronic disease:
recommendations for action [Internet].
Ottawa (ON): Chronic Disease Prevention
Alliance of Canada; 2008 [cited 2010 Jan 27].
Available from: http://www.healthyenviro-
nmentforkids.ca/sites/healthyenvironmen-
tforkids.ca/files/cpche-resources/CDandPo-
verty_CDPAC.pdf
10. Archeson D. Independent inquiry into
inequalities in health [Internet]. United
Kingdom: Her Majesty Stationary Office;
1998 [cited 2009 Dec 9]. Available from:
http://www.archive.official-documents.co.uk
/document/doh/ih/ih.htm
11. Lightman E, Mitchell A, Wilson B. Poverty
is making us sick: a comprehensive survey
of income and health in Canada. Toronto
(ON): Wellesley Institute; 2008.
12. Wilson B. Sick and tired: the compromised
health of social assistance recipients and
the working poor in Ontario. Toronto (ON):
The Community Social Planning Council of
Toronto (CSPC-T); 2009.
13. Lightman E, Herd D, Mitchell A. Precarious
lives: work, health and hunger among wel-
fare recipients in Toronto. J Policy Prac.
2008;7(4):242-59.
14. Vozoris N, Davis B, Tarasuk V. The afford-
ability of a nutritious diet for households
on welfare in Toronto. Can J Public Health.
2002;93(1):36-41.
15. Riches G. Food banks and the welfare crisis.
Ottawa (ON): Lorimer; 1986.
16. Kirkpatrick SI, Tarasuk V. Adequacy
of food spending is related to hous-
ing expenditures among lower-income
Canadian households. Public Health Nutr.
2007;10(12);1464-73.
17. Williams PL, Johnson CP, Kratzmann ML,
Johnson CS, Anderson BJ, Chenhall C.
Can households earning minimum wage in
Nova Scotia afford a nutritious diet? Can J
Public Health. 2006;97(6):430-4.
18. Tarasuk V, McIntyre L, Li J. Low-income
women’s dietary intakes are sensitive to the
depletion of household resources in one
month. J Nutr. 2007;137:1980-7.
19. Kirkpatrick SI, Tarasuk V. Food insecurity
is associated with nutrient inadequacies

127Vol 31, No 3, June 2011 – Chronic Diseases and Injuries in Canada
among Canadian adults and adolescents.
J Nutr. 2008;138:604-12.
20. Agriculture and Agri-Food Canada. Canada’s
action plan for food security: in response
to the World Food Summit Plan for Action
[Internet]. Ottawa (ON): Agriculture and
Agri-Food Canada; 1998 [cited 2009 Oct
29]. Available from: http://www.agr.gc.ca
/misb/fsec-seca/pdf/action_e.pdf
21. Dietitians of Canada. Community food
security: position of Dietitians of Canada
[Internet]. Toronto: Dietitians of Canada;
2007 [cited 2009 Apr 9]. Available from:
http://www.dietitians.ca/Dietitians-View
/Community-Food-Security.aspx
22. Dietitians of Canada. Individual and house-
hold food insecurity in Canada: position of
Dietitians of Canada [Internet]. Toronto:
Dietitians of Canada; 2005 [cited 2009
Apr 9]. Available from: http://www.dieti-
tians.ca/Dietitians-View/Individual-and
-Household-Food-Insecurity.aspx
23. Vogt J, Tarasuk V. Analysis of Ontario
sample in cycle 2.2 of the Canadian
Community Health Survey, 2004 [Internet].
Ontario: Public Health Research, Education
and Development; 2007 [cited 2009 Jan 8].
Available from: http://www.phred-redsp
.on.ca/CCHSReport.htm
24. Statistics Canada. 2006 Community profiles
census division [Internet]. Ottawa (ON):
Statistics Canada; 2009 [cited 2009 Dec 3].
Available from: http://www12.statcan.ca/
census-recensement/2006/dp-pd/prof/92
-591/index.cfm
25. Lacey A, Luff D. Qualitative data analysis
[Internet]. Nottingham (UK): The NIHR
Research Design Service for the East
Midlands; 2007 [updated 2009; cited 2009
Oct 29]. Available from: http://www.rds
-eastmidlands.org.uk/resources/cat_view
/13-resource-packs.html?start=5
26. Srivastava A, Thomson SB. Framework anal-
ysis: a qualitative methodology for applied
policy research. JOAAG. 2009;4(2):72-9.
27. La Pelle N. Simplifying qualitative data
analysis using general purpose software
tools. Field Method. 2004;16(1):85-108.
28. Ryan GW. Using a word processor to tag
and retrieve blocks of text. Field Method.
2004;16(1):109-30.
29. Teron AC, Tarasuk V. Charitable food assis-
tance: what are food bank users receiving?
Can J Public Health. 1999;90(6):382-4.
30. Irwin JD, Ng VK, Rush TJ, Nguyen C, He M.
Can food banks sustain nutrient requirements?
A case study in Southwestern Ontario. Can
J Public Health. 2007;98(1):17-20.
31. Tse C, Tarasuk V. Nutritional assessment of
charitable meal programmes serving home-
less people in Toronto. Public Health Nutr.
2008;11(12):1296-305.
32. Hamelin AM, Mercier C, Bedard A.
Discrepancies in households and other
stakeholders viewpoints on the food security
experience: a gap to address. Health Educ
Res. 2010;25(3):401-2.
33. Hamelin AM, Beaudry M, Habicht JP.
Characterization of household food insecurity
in Québec: food and feelings. Soc Sci Med.
2002;54:119-32.
34. McIntyre L, Glanville NT, Raine KD, Dayle JB,
Anderson B, Battaglia N. Do low-income
lone mothers compromise their nutrition to
feed their children? CMAJ 2003;168:686-91.
35. McIntyre L, Glanville NT, Officer S,
Anderson B, Raine KD, Dayle JB. Food
insecurity of low-income lone mothers and
their children in Atlantic Canada. Can J
Public Health. 2002; 93(6):411-5.
36. Tarasuk V, Maclean H. The food problems of
low income single mothers: an ethnographic
study. Can Home Econ J. 1990;40:76-82.
37. Riches G. Food banks and food security:
welfare reform, human rights and social
policy. Lessons from Canada? Soc Policy
Admin. 2002;36(6):648-63.
38. Northumberland United Way. Community
matters: community consultation final
report [Internet]. Cobourg (ON); 2006
[cited 2010 Aug 25]. Available from:
http://www.cobourg.unitedway.ca/Local
_images/cobourg/CommunityMatters.pdf
39. Northumberland Poverty Reduction
Action Committee. Report from the
Northumberland Poverty Reduction Action
Committee community action day. Cobourg
(ON): Northumberland Poverty Reduction
Action Committee; 2008.
40. Garasky S, Fletcher CN, Jensen HH.
Transiting to work: the role of private
transportation for low-income households.
J Consum Aff. 2006;40(1):64-89.
41. Bostock L. Pathways of disadvantage?
Walking as a mode of transportation
among low-income mothers. Health Soc
Care Community. 2000;9(1):11-8.
42. Perez CE. Fruit and vegetable consumption.
Health Rep. 2002;13(3):23-31.
43. Subar AF, Heimendinger J, Patterson BH.
Fruit and vegetable intake in the United
States: the baseline survey of the Five-A-Day
for Better Health Program. Am J Health
Promot. 1995;9(5):352-60.
44. Xie B, Gilliland FD, Li YF, Rockett HRH.
Effects of ethnicity, family income, and
education on dietary intake among adoles-
cents. Prev Med. 2003;36:30-40.
45. Giskes K, Turrell G, Patterson C, Newman B.
Socioeconomic differences among Australian
adults in consumption of fruit and veg-
etables and intakes of vitamins A, C and
folate. J Hum Nutr Diet. 2002;15:375-85.
46. Mishra G, Ball K, Arbuckle J, Crawford D.
Dietary patterns of Australian adults and
their association with socioeconomic status:
results from the 1995 National Nutrition
Survey. Eur J Clin Nutr. 2002;56:687-93.
47. Reicks M, Randall RL, Haynes BJ. Factors
affecting consumption of fruits and vegetables
by low-income families. J Am Diet Assoc.
1994;94(11):1309-11.
48. Kirkpatrick S, Tarasuk V. The relationship
between low income and household food
expenditure patterns in Canada. Public
Health Nutr. 2003;6(6):589-97.
49. Health Canada. Eating well with Canada’s
Food Guide [Internet]. Ottawa (ON): Health
Canada; 2009 [cited 2009 Jan 7]. Available

128 Vol 31, No 3, June 2011 – Chronic Diseases and Injuries in Canada
from: http://www.hc-sc.gc.ca/fn-an/food
-guide-aliment/index-eng.php
50. Wilkinson R, Marmot M, editors. Social
determinants of health: the solid facts. 2nd
ed [Internet]. Copenhagen (DK): World
Health Organization; 2003 [cited on 2009
Dec 3]. Available from: http://www.euro
.who.int/DOCUMENT/E81384.PDF
51. Raphael D. Health effects of economic ine-
quality. Can Rev Soc Policy. 1999;44:25-40.
52. Raphael D. Health inequalities in Canada:
current discourses and implications for
public health action. Crit Public Health.
2000;10:193-216.
53. Raphael D. Poverty, income inequality,
and health in Canada [Internet]. Toronto
(ON): The CSJ Foundation for Research
and Education; 2002 [cited 2009 Dec 3].
Available from: http://www.socialjustice
.org/uploads/pubs/PovertyIncomeInequal-
ityandHealthinCanada.pdf
54. Commission on Social Determinants of
Health. Closing the gap in a generation:
health equity through action on the social
determinants of health. Final report of
the Commission on Social Determinants
of Health. Geneva (CH): World Health
Organization; 2008. Available from: http://
www.who.int/social_determinants/the-
commission/finalreport/en/index.html

129Vol 31, No 3, June 2011 – Chronic Diseases and Injuries in Canada
Author references
1. Department of Community Health Sciences and Hotchkiss Brain Institute, University of Calgary, Calgary, Alberta, Canada2. Mental Health Information Management, Evaluation & Research, Alberta Health Services, Addiction & Mental Health, Calgary Zone, Calgary, Alberta, CanadaCorrespondence: Andrew Bulloch, Mental Health Centre for Research and Education, Hotchkiss Brain Institute, TRW Building, University of Calgary, 3280 Hospital Dr NW, Calgary AB T2N 4Z6; Tel.: (403) 220-4586; Fax: (403) 210-8840; Email: [email protected]
Estimates of the treated prevalence of bipolar disorders by mental health services in the general population: comparison of results from administrative and health survey data
Abstract
Introduction: Informed provision of population mental health services requires accurate estimates of disease burden.
Methods: We estimated the treated prevalence of bipolar disorders by mental health services in the Calgary Zone, a catchment area in Alberta with a population of over one million. Administrative data in a central repository provides information of mental health care contacts for about 95% of publically funded mental health services. We compared this treated prevalence against self-reported data in the 2002 Canadian Community Health Survey: Mental Health and Well-Being (CCHS 1.2).
Results: Of the 63 016 individuals aged 18 years plus treated in the Calgary Zone in 2002–2008, 3659 (5.81%) and 1065 (1.70%) were diagnosed with bipolar I and bipolar II disorder, respectively. The estimated treated population prevalence of these disorders was 0.41% and 0.12%, respectively. We estimated that 0.44% to 1.17% of the Canadian population was being treated by psychiatrists for bipolar I disorder from CCHS 1.2.
Discussion: For bipolar I disorder the estimate based on local administrative data is close to the lower end of the health survey range. The degree of agreement in our estimates reinforces the utility of administrative data repositories in the surveillance of chronic mental disorders.
Introduction
Accurate estimates of the disease burden of mental disorders in the population are necessary to provide adequate mental health services. Traditionally, estimates of the preva-lence of mental disorders in the general population have used data from health surveys carried out either in person and/or by telephone. However, such health surveys suffer from a number of short-comings. For example, the 2002 Canadian Community Health Survey: Mental Health
and Well-Being (CCHS 1.2),1 which estimated the prevalence of mental disorders and the use of health services, relies on self-report data rather than on professional diagnosis. Though this data is obtained by trained personnel through face-to-face interviews, it is subject to recall bias; hence the possible value of estimates based on other sources of data.
In Canada, the public health care sector provides the majority of health services, including treatment for addictions and
mental disorders. Detailed information on the recipients of health services are captured in various administrative datasets. This information is easily accessible, and its use for research purposes is cost effective.2 Such databases provide a “real-world” perspec-tive on treatment of mental disorders that generalize to the actual practice of providing mental health services. Further, administrative datasets can provide precise estimates of treated prevalence and avoid the recall bias of health surveys.3 As such, they can con-tribute significantly towards increasing the capacity for national health surveillance.4
Administrative data on mental health has been used to research the effects of system changes on service use and quality of care,5 variations in treatment practices across set-tings,6 performance measurement including adherence to best practices,7 predictors of service utilization,8 determining the propor-tion of the general population with mental disorders who receive treatment,9,10 the cost effectiveness of mental health services,11 place-based population health research2 and long-term evaluation of changes in the use of psychiatric emergency services.12
The Calgary Zone is one of five defined catchment areas for the province of Alberta. All public health services in Alberta are under a single governing body called Alberta Health Services (AHS). The Calgary Zone covers a geographic area of 39 000 square kilometres and has a population of over 1.3 million inhabitants. It includes one large
A.G. Bulloch, PhD (1); S. Currie, PhD (2); L. Guyn, BSc, BA (2); J.V. Williams, MSc (1); D.H. Lavorato, MSc (1); S.B. Patten, MD, PhD (1)
Keywords: bipolar disorder, administrative data, health surveys, prevalence

130 Vol 31, No 3, June 2011 – Chronic Diseases and Injuries in Canada
urban city (Calgary) and several smaller cities and towns including Banff, Airdrie, Okotoks and Canmore. The Calgary Zone provides a wide range of adult addiction and mental health services including specialized inpatient treatment in three large urban hospitals, day hospital services, outpatient programs including one clinic that specializes in bipolar disorder, and community outreach programs. People with bipolar disorder can access any of these services at no personal cost.
The use of a central data repository created by linking administrative data from separate information systems is an innovative way of deriving period prevalence estimates for treated mental health conditions. It is a different approach to that taken by most record linkage studies in Canada, for which family doctor visits or hospitalizations are the primary patient encounters. The data repository maintained in the Calgary Zone links data from the entire spectrum of psy-chiatric services, including inpatient, day hospital, outpatient, and community outreach programs. As such, this data repository is unique, although it does resemble the now defunct Kingston Psychiatric Record Linkage System.13 The majority of research using administrative data is conducted on acute care service users. However, many people with mental disorders never require hospitalization or emergency psychiatric care. Physician billing records are also limited for estimating the prevalence of specific mental disorders; in Alberta, physicians are required to submit only the first three digits of the ICD-9* code that identifies the patient as having either a depressive or bipolar mood disorder, for example. In addition, alternative relationship plans may preclude access to physician billing data since these plans replace fee-for-service billings. For example, in a multidisciplinary setting physicians may be paid through sessional arrangements that do not require submission of a diagnostic code as part of a fee-for-service submission or they may not be required to submit a fee-for-service billing at all.
Bipolar disorders can be devastating; they usually begin in early life and are associ-ated with a high risk of suicide.14 Bipolar I disorder is characterized by one or more manic or mixed episodes that may or may not be accompanied by one or more episodes of major depression.15 Symptoms of mania include flight of ideas or racing thoughts, inflated self-esteem, decreased need for sleep, talkativeness and irritabil-ity. Bipolar II disorder is characterized by hypomanic episodes that, in contrast to manic episodes, are not severe enough to cause marked impairment in social or occupational functioning, or result in hos-pitalization. In order to meet DSM-IV-TR† diagnostic criteria for bipolar II disorder, there must also be one or more episodes of major depression.
Whereas it is often proposed that bipolar disorders are underdiagnosed, some authors postulate the opposite.16 One controversial proposal is to lower the threshold for diagnosis of bipolar disorder, which would substantially increase estimates of its preva-lence.17 Either way, it is apparent that there is a need to evaluate the actual prevalence in real world treatment.
The purpose of our study is to compare estimates of the treated prevalence of bipolar disorders from CCHS 1.2 and the mental health service data repository of the Calgary Zone.
Methods
This study is based on data from two sources. National estimates of the treated prevalence of bipolar disorder I in the general population came from CCHS 1.2. We compared these estimates to the calculated treated prevalence for both bipolar I and II disorders from administrative data in the Calgary Zone. In terms of physician type, the administrative data covers various mental health services (see below), but not general physicians (GPs). To be able to compare the 2 datasets, we restricted our analysis of CCHS 1.2 to psychiatrists alone.
National mental health survey
CCHS 1.2 has been described in detail elsewhere.18 Briefly, conducted in 2002, CCHS 1.2 was a population-based, cross-sectional survey designed to monitor the mental health of Canadians and their need and use of mental health services. Statistics Canada obtained a nationally representative sample of individuals aged 15 years or older in 2002 that did not include individuals from the three territories, armed forces, Aboriginal populations, or living in institutions or in some remote areas; the response rate was 77% (n = 36 984). In the majority of cases, trained personnel conducted face-to-face interviews, with telephone interviews being conducted when this was not possible.
We received approval to access the CCHS 1.2 Master File from the Social Sciences and Humanities Research Council, and accessed these data at the Statistics Canada Prairie Regional Research Data Centre at the University of Calgary. Ethical approval for access was acquired from the University of Calgary Conjoint Health Research Ethics Board.
Assessment of bipolar I disorder in CCHS 1.2 is based upon the diagnosis of manic or mixed episodes in accordance with DSM-IV-TR diagnostic criteria.13 The specific questions on mania were based on a World Mental Health version of the Composite International Diagnostic Interview (WMH-CIDI)19 modified for CCHS 1.2 and were delivered by trained interviewers. Respondents were not asked if they have bipolar disorder. Instead, they were asked series of ques-tions. Algorithms were then used to assess this disorder depending on the answers received. Two algorithms were used to determine if manic episodes occurred in either the last year (12-month prevalence) or during the respondents’ lifetime (lifetime prevalence). Separate questions asked whether a GP or psychiatrist was treating their disorder.
To calculate the treated prevalence of bipo-lar I disorder in the Canadian population,
*International Statistical Classification of Diseases and Related Health Problems, 9th Revision†Diagnostic and Statistical Manual of Mental Disorders Fourth Edition, Text Revision.

131Vol 31, No 3, June 2011 – Chronic Diseases and Injuries in Canada
we cross-tabulated the raw CCHS 1.2 data and calculated population estimates with 95% confidence intervals (CIs). (Note that CCHS 1.2 did not survey bipolar II disorder.) These estimates and CIs were both weighted and bootstrapped, using sampling weights and replicate bootstrap weights provided by Statistics Canada, to compensate for complex sampling proce-dures. For example, small provinces were oversampled so the impact of these results on the national estimate has to be reduced accordingly, i.e. given less weight. Since the sample size of bipolar cases in CCHS 1.2 was insufficient to create a separate, reliable estimate for the province of the Alberta, we used the national prevalence estimates as a surrogate. While there is no reason to believe that prevalence estimates vary substantially across Canada, research has shown regional differences in mental health service use,20 and these would influence estimates of treatment prevalence.
Administrative data
The administrative records of mental health service users in the Calgary Zone are maintained in a central data repository. All these users had been seen by a mental health professional (psychiatrist, psychiat-ric nurse, psychologist or social worker) licensed in Alberta to conduct diagnostic evaluations. For each service user there is a minimum dataset consisting of a unique lifetime identifier (ULI), referral source, admission and discharge dates, length of stay, program enrolment, age, gender, postal code, mental health diagnoses based on DSM-IV-TR nosology, and disposition at discharge. Records are extracted from over 95% of the mental health informa-tion systems used to provide services to adult, child and adolescent, geriatric and Aboriginal clients, and then linked into the central database; the remaining 5% of users engage in services in which complete data may not obtained from the client because of the nature of the service (e.g. in some crisis or outreach services the clients are not formally enrolled and ULI is not obtained). Based on the postal codes, the majority of mental health service users live within the Calgary Zone.
We defined cases of bipolar illness from the administrative dataset based on the
following criteria: (1) the patient was formally registered in a mental health service in the Calgary Zone; these services included inpatient services, day hospitals, psychiatric emergency services, outpatient clinics, and community outreach programs; and (2) the most responsible diagnosis (MRD) recorded for the registration was bipolar I or II disorder; the MRD represents the main reason the patient was admitted to the program in question. This case definition excluded patients treated by other health care workers for medical care unrelated to their bipolar condition (e.g. dietary consultation) and one-time visits to other professionals for non-specific social issues (e.g. housing). Most patients registered in mental health have multiple diagnoses. The presence of other diagnostic codes in the health record did not exclude patients as long as bipolar I or II disorder was listed as the MRD. We were concerned about including secondary (i.e. not MRD) diagnoses as these may often have been recorded as a “rule out” diagnosis on certain visits. In all mental health services, diag-nosis is made based on comprehensive clinical assessment, although the specific interview tools and other assessment instruments vary across programs.
The Calgary Zone does not have a long-term psychiatric institution although it does have long-term care facilities for geriatric patients. Data from these facilities are not linked to the central data repository for mental health services; as a result, elderly people with bipolar illness who live in nursing homes are not represented in our estimate of treated prevalence unless they had accessed one of the services covered.
We obtained aggregate estimates of the treated prevalence of bipolar disorders from the Information and Evaluation Unit in the Calgary Zone. These analyses were per-formed “in house” as part of the functioning of these units and did not require ethical approval. Results from the administrative database are expressed as a mean with 95% CI, and are not weighted since they are not samples.
All the data we present here are for indi-viduals 18 years and older.
Results
The basic demographics of the study popu-lations are shown in Table 1. In CCHS 1.2, 364 and 890 respondents scored positive in the 12-month and lifetime bipolar I algo-rithms, respectively. The higher proportion of women compared to men reflects the higher percentage of female respondents in CCHS 1.2; the prevalence of bipolar I disor-der has been estimated to be equal in men and women in this survey.21 Data from the Calgary Zone are very similar to that for CCHS 1.2 as assessed by lifetime criteria. In the case of the Calgary Zone, however, treated prevalence was sex dependent: significantly more men than women were being treated for bipolar I disorder, while the opposite was true for bipolar II disorder, with almost two-thirds of treated patients women. These discrepancies suggest dif-ferential help-seeking between the two disorders by gender.
Stratification by age group (Table 1) shows that the four study populations were similar in terms of age distribution. The only clear exception is the somewhat younger popu-lation that screened positive for 12-month bipolar I disorder in CCHS 1.2 when compared to the other 3 groups.
We used administrative data from the Calgary Zone to estimate the treated preva-lence for both bipolar disorders as 0.41% and 0.12% for bipolar I and II disorders, respectively (Table 2).
Data from CCHS 1.2 enabled us to estimate the proportion of Canadians with bipolar I disorder who sought help for their condi-tion. (Bipolar II disorder was not included in the survey.) We made both 12-month and lifetime estimates since these might be expected to bracket our 7-year administra-tive data estimate. These 12-month and lifetime estimates were 0.44% and 1.17% respectively (Table 3).
Discussion
To the best of our knowledge, we are the first to investigate the consistency of self-reported treatment rates with actual administrative records for a specific mental health disorder.

132 Vol 31, No 3, June 2011 – Chronic Diseases and Injuries in Canada
A key element of this study is the use of data repository rather than physician billing data. Our results indicate that the population survey estimate of the proportion of people with bipolar disorder who self-report receiving treatment from a psychiatrist approximates the treated prevalence estimate derived from actual administrative records of mental health
service users. The congruence of these estimates is an important finding and has implications for future prevalence studies: using administrative data could be a cost-effective and accessible way of accurately estimating prevalence of a disorder in general population.
Since we were unable to account for patients who were receiving treatment by GPs and not psychiatrists, the question arises as to what proportion of patients in the Calgary Zone are being treated only by GPs. Using data from CCHS 1.2 on respondents that screen positive for bipolar I disorder, we estimated the prevalence of lifetime bipolar
TABLE 1 Characteristics of bipolar patients in the general population of Canada, 2002, and the Calgary Zone, 2002–2008
Canadaa (2002)
Calgary Zoneb (2002–2008)
Bipolar I (12-month estimate)c
(n = 364)
Bipolar I (lifetime estimate)d
(n = 890)
Bipolar I (n = 3659)
Bipolar II (n = 1065)
Mean percentagee (95% CI)
Men 42.2% (35.2–49.3)
46.1% (41.6–50.5)
53.7% (52.1–55.3)
38.5% (35.6–41.4)
Women 57.7% (50.7–64.8)
53.9% (49.5–58.4)
46.3% (44.6–47.9)
61.5% (58.6–64.4)
Mean age, years 34.8 (33.0–36.5)
38.7 (37.6–39.9)
40.0 (39.5–40.5)
39.5 (38.7–40.3)
Age distribution in yearse (95% CI)
18–24 26.5% (19.9–33.1)
17.2% (13.5–20.9)
17.0% (15.8–18.2)
14.4% (12.3–16.5)
25–44 49.9% (42.7–57.0)
48.0% (43.4–52.6)
48.4% (46.8–50.0)
52.0% (49.0–55.0)
45–64 23.7% (17.7–29.6)
33.1% (28.8–37.4)
27.8% (26.3–29.2)
29.8% (27.0–32.5)
65+ —f 1.7% (0.8–2.6)
6.8% (6.0–7.6)
3.8% (2.7–5.0)
Abbreviations: CCHS 1.2: 2002 Canadian Community Health Survey: Mental Health and Well-Being; CI, confidence interval; n, sample size. aDerived from CCHS 1.2. bDerived from 2002–2008 Calgary Zone administrative data repository. cOne or more episodes in the preceding 12 months. dOne or more lifetime episodes. ePercentages may not add up to 100% due to rounding. fSample size is too small for release; Statistics Canada forbids the release of small cell sizes due to confidentiality concerns.
TABLE 2 Treatment by psychiatrists of bipolar I and II disorders in the population with mental health disorders, Calgary Zone, 2002–2008
Number of adults with bipolar disorder,
n
Percentage of mental health patients with
bipolar disordera, %
(95% CI)
Treated prevalence of bipolar disorder in the Calgary Zoneb,
% (95% CI)
Bipolar I 3659 5.81 (5.63–5.99)
0.41% (0.40–0.42)
Bipolar II 1065 1.70 (1.59–1.79)
0.12% (0.11–0.13)
Abbreviations: CI, confidence interval; n, sample size. aDenominator is 63 016, i.e. the number of adults diagnosed with a mental disorder, 2002–2008. bDenominator is 894 905, i.e., the estimated population of the Calgary Health Region aged 18 years and older at the mid-point between 2002 and 2008.

133Vol 31, No 3, June 2011 – Chronic Diseases and Injuries in Canada
I disorder in respondents aged 18 years and over to be 2.39% (95% CI: 2.19–2.60%)‡ and the proportion treated by GPs alone to be 0.46% (95% CI: 0.35–0.57%). In actuality, a higher proportion of respondents (1.17%; Table 3) receive psychiatric care, and hence the proportion of patients receiving psychi-atric care is 72%, i.e. [1.17/(1.17 + 0.46)] x 100. This suggests that the data repository has captured the majority (about 70%) of patients under medical care for bipolar I disorder in the Calgary Health Region.
What proportion of patients with bipolar disorders is not being treated by either a GP or a psychiatrist? From CCHS 1.2, we estimate that 0.73% (95% CI: 0.62–0.84%) of respondents with bipolar I disorder are not under medical care. Individuals with mild variants of bipolar disorder may not require treatment; others may have clinically significant disorders that could benefit from treatment, but issues such as fear of stigma or limited access to specialized care stop them from accessing treatment. These alternatives obviously have impor-tant implications; it is likely that the availa-bility of a variety of sources of information will help to distinguish between these possibilities. Survey data can estimate the proportion of a population that has a diagnosable disorder, whereas a treated prevalence is restricted to the proportion
actually receiving treatment. These results indicate that administrative data may pro-vide a valuable perspective on the treated prevalence of bipolar disorder.
A limitation of health surveys is that they rely upon self-report. On the other hand, administrative data provide an objective assessment of actual treatment received. For mental disorders that are relatively infrequent in the population, administrative data can provide substantially more cases for analysis than survey samples.3 This was evident in the present study in which the sample of bipolar I cases obtained from administrative data sources was substantially larger than the sample from a national mental health survey (Table 1).
Researchers have questioned the quality of administrative data, particularly regarding the coding of diagnoses.22,23 Local re-abstraction studies for inpatient encounters24,25 suggest that the Calgary Zone’s coding practices are reliable. Although sensitivity rates vary considerably by medical condition, speci-ficity rates in Calgary have been found to be 99% or better across all conditions examined (i.e. in nearly every case, the most responsible diagnosis on record for the inpatient encounter was verified by an independent medical expert). We acknowl-edge that there is limited research on the
validity of mental health diagnoses in administrative data.
It should be noted that we may have over-estimated actual treated prevalence since some individuals may contact a physician but not receive treatment. For this reason the term “contact prevalence” may be preferable when estimating the prevalence of an illness from administrative data sources.26
Limitations
A limitation of our study is that we were unable to assess the proportion of bipolar patients being treated by those private psy-chiatrists (about 30%) who do not have an affiliation with the psychiatric services in the Calgary Zone. Taken together these considerations suggest that the actual treated prevalence of bipolar disorders by psychiatrists in the Calgary Zone (Table 2) is even closer to the national-survey–based estimates (Table 3).
Second, CCHS 1.2 did not include Aboriginal peoples or those living in institutions. These individuals cannot be removed from the data repository so this limits the comparison of administrative data to that from CCHS 1.2.
Another limitation of CCHS 1.2 is that the criteria for bipolar I disorder do not fully
‡This differs slightly from the prevalence of 2.2% reported by Shaffer et al.21 because their result was for all respondents aged 15 years and over.
TABLE 3 Treatment of bipolar Ia disorder by psychiatrists based on CCHS 1.2, 2002, Canada
Prevalence estimates
12 months Lifetime
Number of survey respondents, n:
Overall 34 946b 34 921b
Who screened positive for bipolar I 357c 880c
Who were being treated for bipolar I 171 430
Percentage of those who screened positive for bipolar I who receive psychiatric treatment 48.7%d (41.8–55.6)
49.8%d (45.1–54.4)
Percentage of CCHS respondents who receive psychiatric treatment 0.44%d (0.36–0.52)
1.17%d (1.02–1.33)
Abbreviations: CCHS 1.2: 2002 Canadian Community Health Survey: Mental Health and Well-Being; CI, confidence interval; n, sample size. aBipolar II disorder was not included in CCHS 1.2. bNumbers less than the full number of CCHS 1.2 respondents (36 984) due to missing data. cNumbers lower than those shown in Table 1 due to missing data. dWeighted estimate.

134 Vol 31, No 3, June 2011 – Chronic Diseases and Injuries in Canada
conform with DSM-IV criteria. The latter requires manic symptoms to be present for 7 days unless hospitalization is required.15 Meanwhile, CCHS 1.2 requires manic symptoms to be present for 4 days, reducing the specificity compared with that obtainable by strict DSM-IV criteria. This considera-tion may in part explain the higher esti-mate of treatment of bipolar I disorder from CCHS 1.2 data relative to our local administrative data.
In summary, we found a significant degree of agreement between estimates of treated bipolar I disorder in local administrative data and national survey data. This observation reinforces the potential utility of adminis-trative data repositories in the surveillance of chronic mental disorders.
Acknowledgements
This project was funded by a grant from the Hotchkiss Brain Institute, Faculty of Medicine, University of Calgary. We thank Jim Si (Population Surveillance Group, Calgary Zone) for providing the estimated population of the Calgary Zone in 2005. CCHS 1.2 data were collected by Statistics Canada. However, the analyses and interpretations presented here are those of the authors and not Statistics Canada.
References
1. 2002 Canadian Community Health Survey:
Mental Health and Well-being [Internet].
Ottawa (ON): Health Canada; 2003 [cited
2010 Apr 6]. Available from: http://www
.statcan.gc.ca/pub/82-617-x/index-eng.htm
2. Frohlich KL, Dunn JR, McLaren L, Shiell A,
Potvin L, Hawe P, et al. Understanding
place and health: a heuristic for using
administrative data. Health Place.
2007;13:299-309.
3. Mortensen PB. The untapped potential of
case registers and record-linkage studies in
psychiatric epidemiology. Epidemiologic
Rev. 1995;17:205-9.
4. Advisory Committee on Population Health
and Health Security Surveillance Systems
for Chronic Disease Risk Factors Task Group.
Enhancing capacity for surveillance of
chronic disease risk factors and deter-
minants. Ottawa (ON): Public Health
Agency of Canada; 2005. Catalogue No.:
HP5-11/2005.
5. Greenberg GA, Rosenheck RA. Does system
reform reduce geographic variation in mental
health system performance. Psychiatric Q.
2005;76:231-42.
6. Speer DC, Newman FL. Mental health services
outcome evaluation. Clin Psychol Sci Pr.
1996;3:105-29.
7. Addington D, McKenzie E, Addington J,
Patten S, Smith H, Adair C. Performance
measures for early psychosis treatment ser-
vice. Psychiatric Serv. 2005;56:1570-82.
8. Karlin BE, Norris MP. Public mental health
care utilization by older adults. Adm Policy
Ment Health. 2006;33:730-6.
9. Andrews G, Issakidis C, Sanderson K,
Corry J, Lapsley H. Utilising survey data
to inform public policy: comparison of
the cost-effectiveness of treatment of
ten mental disorders. Br J Psychiatry.
2004;184:526-33.
10. Slomp M, Bland R, Patterson S, Whittaker L.
Three-year physician treated prevalence
rate of mental disorders in Alberta. Can J
Psychiatry. 2009;54:199-203.
11. Andrews G. It would be cost-effective to
treat more people with mental disorders.
Aust N Z J Psychiatry. 2006;40:613-5.
12. Paradis M, Woogh C, Marcotte D, Chaput
Y. Is psychiatric emergency service (PES)
use increasing over time? Int J Ment Health
Syst. 2009;3:3.
13. Woogh CM. An experience in psychiatric
record linkage. Can J Psychiatry. 1988;33:134-9.
14. Oswald P, Souery D, Kasper, Lecrubier Y,
Montgomery S, Wyckaert S, et al. Current
issues in bipolar disorder: a critical review.
Eur Neuropsychopharmacol. 2007;17:687-95.
15. American Psychiatric Association. Diagnostic
and statistical manual of mental disorders,
4th ed. rev. Washington (DC): American
Psychiatric Association; 2000.
16. Zimmerman M, Ruggero CJ, Chelminski
I, Young D. Is bipolar disorder overdiag-
nosed? J Clin Psychiatry. 2008;69:935-40.
17. Patten SB, Paris J. The bipolar spec-
trum—a bridge too far? Can J Psychiatry.
2008;53:762-8.
18. Gravel R, Beland Y. The Canadian
Community Health Survey: mental health
and well-being. Can J Psychiatry.
2005;10:573-9.
19. Kessler RC, Ustun TB. The World Mental
Health (WMH) Survey Initiative version
of the World Health Organization (WHO)
Composite International Diagnostic
Interview (CIDI). Int J Methods Psychiatr
Res. 2004;13:93-121.
20. Diaz-Granados N, Georgiades K, Boyle MH.
Regional and individual influences on use
of mental health services in Canada. Can J
Psychiatry. 2010;55:9-20.
21. Schaffer A, Cairney J, Cheung A,
Veldhuizen S, Levitt A. Community sur-
vey of bipolar disorder in Canada: lifetime
prevalence and illness characteristics. Can
J Psychiatry. 2006;51:9-16.
22. Roos LL, Soodeen R, Gupta S, Jebamani L.
Canadian administrative data: evaluating
the quality. Winnipeg (MB): University of
Manitoba; 2002.
23. Roos LL, Gupta S, Soodeen R, Jebamani L.
Data quality in an information-rich envi-
ronment: Canada as an example. Can J
Ageing. 2005;24, Suppl 1:153-70.
24. Quan H, Parsons GA, Ghali WA. Validity
of procedure codes in International
Classification of Diseases, 9th revision,
clinical modification of administrative
data. Med Care. 2004;42:801-9.
25. Quan H, Parsons GA, Ghali WA. Assessing
accuracy of diagnosis-type indicators for
flagging complications in administrative
data. J Clin Epidemiol. 2004;57:366-74.
26. Goldner EM, Jones W, Waraich P. Using
administrative data to analyze the preva-
lence and distribution of schizophrenic
disorders. Psychiatr Serv. 2003;54:1017-21.

135Vol 31, No 3, June 2011 – Chronic Diseases and Injuries in Canada
Author references
1. Chronic Disease Surveillance and Monitoring Division, Centre for Chronic Disease Prevention and Control, Public Health Agency of Canada, Ottawa, Ontario, CanadaCorrespondence: Siobhan O’Donnell, Centre for Chronic Disease Prevention and Control, Public Health Agency of Canada, 785 Carling Avenue, A/L 6806A, Ottawa ON K1A 0K9; Tel.: (613) 954-6557; Fax: (613) 941-2057; Email: [email protected]
Introduction
“Arthritis” describes more than 100 conditions that affect the joints, the tissues that surround joints and other connective tissue. These conditions range from relatively mild forms of tendonitis and bursitis to systemic illnesses, such as rheumatoid arthritis.
Life with arthritis in Canada: a personal and public health challenge presents the latest knowledge about arthritis in the Canadian population and its wide-ranging impact. It provides an overview of the impact of arthritis, and is designed to increase public awareness of the importance of prevention and timely management. Although progress has been made on interventions, arthritis remains common, disabling and costly. Increasing participation in physical activity and maintaining a healthy body weight may help to mitigate the effects of arthritis.
Highlights
How common is arthritis?
In 2007–2008, arthritis was the second and third most common chronic condition among Canadian women and men, respec-tively, affecting over 4.2 million people (16% of the population) 15 years and older. As our population ages, this number is expected to increase to approximately 7 million (20%) by 2031. However, despite common myths about arthritis, it is not confined to the elderly—nearly three in five Canadians with arthritis were between the ages of 15 and 64 years.
While prevalence estimates of arthritis among First Nations (on and off-reserve) and Métis adult populations were 1.3 to 1.6 times higher than those among the Canadian adult population, those in the Inuit adult population were similar.
The impact of arthritis
Many individuals with arthritis perceived their general and mental health as fair or poor, and needed help with daily activities and in their work, community, social and civic life. Of the 15% of Canadians living with a disability in 2001, one-quarter reported arthritis as the main cause; of these, over one-quarter between 25 and 44 years of age were not in the labour force because of their arthritis.
Economic burden of arthritis
In 2000, musculoskeletal diseases were the most costly group of diseases; arthritis was estimated to cost $6.4 billion (29% of the total cost). Of the total arthritis-related costs, the greatest impact was due to the indirect costs ($4.3 billion) as a result of lost productivity attributable to long-term dis-ability and premature death.
Arthritis-related medications
In 2007, Canadians were prescribed over 4 million non-steroidal anti-inflammatory drugs (NSAIDs), over 1 million disease-modifying anti-rheumatic drugs (DMARDs), close to 1 million corticosteroids, and approximately 150 000 biological response modifiers (BRMs).
Health services utilization
In 2005–2006, approximately 14% of Canadians over 15 years made at least one visit to a physician (usually a primary care physician) for any type of arthritis—an esti-mated total of 8.5 million visits in Canada (excluding the territories). Arthritis was associated with 6% of the total hospitali-zations, of which surgical hospitalizations (71%) were more common than medical ones (29%). Nearly two-thirds of the arthritis-related surgical hospitalizations were joint replacements (63%). Between 2001 and 2006, the total number of joint replacements increased by 54%.
Mortality burden
While deaths from arthritis are uncommon, 777 women and 296 men died from an arthritis condition in 2005; rheumatoid arthritis, systemic lupus erythematosus and other connective tissue diseases accounted for approximately 60% of all the arthritis-related deaths.
Reducing the risks of developing osteoarthritis and gout
The risk of developing osteoarthritis and gout can be reduced. Maintaining a healthy body weight and healthy joints and muscles through physical activity while protecting joints from injuries or overuse can help prevent osteoarthritis. Likewise, maintaining a healthy body weight, keeping physically active, and reducing consumption of purine-rich foods
Report summary
Life with arthritis in Canada: a personal and public health challenge
S. O’Donnell, MSc (1); C. Lagacé, MSc (1); L. McRae, BSc (1); C. Bancej, PhD (1)

136 Vol 31, No 3, June 2011 – Chronic Diseases and Injuries in Canada
and drinks, such as red meat, certain types of seafood and alcohol, reduces the risk of developing gout.
Living with arthritis
Although there is no known cure for arthritis, people with all types of arthritis can prevent disability and improve their quality of life by maintaining a healthy weight, being physically active, avoiding joint injuries, participating in self-management programs, and—particularly for inflammatory types of arthritis—getting an early diagnosis and treatment. Nevertheless, high proportions of Canadians with arthritis are physically inactive (59%) and overweight/obese (63%).
Life with arthritis in Canada: a personal and public health challenge is available at: http://www.phac-aspc.gc.ca/cd-mc/arthri-tis-arthrite/lwaic-vaaac-10/index-eng.php

137Vol 31, No 3, June 2011 – Chronic Diseases and Injuries in Canada
Written in collaboration with Jolene D. Smyth and Leah Melani Christian, Internet, Mail and Mixed-Mode Surveys: The Tailored Design Method (2009) is the third edition of Don A. Dillman’s seminal work on survey development and administration. The first edition of this text, published in 1978, tar-geted the opportunities and challenges of mail and telephone surveys, and raised the credibility of these survey methods at a time when face-to-face interviews were considered the gold standard. Since then, his work has been a go-to reference for count-less researchers and survey developers. In 2000, Dillman published a second edition to respond to changes in the technological and social climate of surveying. This was followed by an update in 2007.
Compared to the updated second edition, there are three main features that make this third edition a worthwhile read. First, while the second edition had a brief section devoted to Internet survey methods, this edition incorporates Web-relevant considerations into each chapter. Second, in addition to a chapter dedicated to mixed-mode surveys, the utility of hybrid survey methods is emphasized throughout the text. Finally, the importance of visual design is highlighted and considered in detail. In a time when respondents are being approached with increased frequency, this text provides insight on how researchers can obtain high-quality responses using non-traditional survey modes and current technology.
The authors’ goal was to create a complete guide to planning and conducting surveys using the Internet, mail, telephone and/or a mixture of modes. Clear introductions, distinct subsections and summarized guide-lines help readers access detailed information in each chapter.
Chapter 1 starts off with a vivid description of the evolution of survey development and administration. From a time when mail surveys were considered inferior to telephone and in-person interviews, to the prominence of electronic mail surveys today, the authors describe the social and technological variables that have contributed to these changes.
Chapter 2 presents the psychology behind survey responses and describes the different types of survey errors, building the founda-tion for first-time survey developers. Using a perspective of positive social exchange, the authors describe how one can increase the benefits of participation while decreasing the costs. The language used is simple and the explanations are easy to grasp, making this an excellent introductory chapter. However, for a more thorough understand-ing of these concepts, supplementary texts would be needed.
Chapter 3 describes the fundamental concepts of survey coverage and sampling. Using straightforward definitions and descriptive examples, the authors highlight differences
between Internet, mail and telephone modes within the context of coverage and sampling.
Chapter 4 presents the basics of crafting high-quality survey questions. The authors underscore the importance of visual pres-entation with helpful examples and figures.
Chapter 5 provides guidelines for con-structing open and close-ended questions. The authors explore numerical, item-list and description responses to open-ended questions, and nominal scale and ordinal scale responses for close-ended questions. Extensive guidelines are provided for each response type.
Chapter 6 outlines how researchers can transition from a list of questions to a respondent-friendly questionnaire while maximizing response and minimizing measurement error. In describing this process, the authors elaborate on question order, technological considerations and the importance of visual design.
Chapter 7 discusses strategies for imple-menting population-based surveys on the Internet and through mail. In presenting guidelines for these two modes, the authors use a consistent format to highlight fundamental principles, such as the impor-tance of simple language.
Book review
Internet, Mail and Mixed-Mode Surveys: The Tailored Design Method
K.K.Y. Poon, M.Sc. (Candidate), Queen’s University, Kingston, Ontario, Canada
Authors: Don A. Dillman, Jolene D. Smyth, Leah Melani Christian Publisher: John Wiley & Sons, Inc. Publication date: 2009 Number of pages: 499 Format: Hardcover Price: $96.00 ISBN: 978-0-471-69868-5

138 Vol 31, No 3, June 2011 – Chronic Diseases and Injuries in Canada
Chapter 8 describes the utility of mixed modal surveys with guidelines to help read-ers select the most effective combination of survey modes. The authors provide a useful chart to describe the motivations and limitations of four identified types of mixed modal surveys.
Chapter 9 discusses longitudinal and Internet panel surveys. These surveys involve the use of multiple questionnaires, which present unique challenges common to both survey types. The authors explore important methodological concerns such as loss to follow-up and respondent conditioning.
Chapter 10 focuses on developing surveys to collect customer feedback. The authors discuss sampling methods and measurement issues. In particular, interactive voice response technology, diaries and group administration are presented as unique delivery methods to improve the accuracy of customer responses.
Chapter 11 explores the legal considerations of data collection. The authors point out that interpretations of privacy laws can often conflict with best practices for survey administration. They also discuss the effects of sponsorship with an emphasis on research ethics.
Chapter 12 elaborates on the opportunities and challenges of surveying businesses and establishments. The authors provide a useful list of questions for researchers to consider and present to establishments in order to optimize a survey’s success.
Chapter 13 postulates on the future of Internet, mail and telephone surveying. Particularly, the potential for increased use of Internet surveys is discussed along with the continued relevance of mail and paper surveys.
Overall, the authors succeeded in creating a comprehensive guide to survey development and administration. From fundamental sur-vey principles to the unique challenges of multiple questionnaires, this text covers an excellent range of survey considerations. In particular, it serves as a useful reference for students and researchers looking to expand their survey methodology to obtain high quality responses in today’s techno-logically centered society.

139Vol 31, No 3, June 2011 – Chronic Diseases and Injuries in Canada
We are grateful to the following people for their significant contribution to Chronic Diseases in Canada as peer reviewers in 2010. Their expertise ensures the quality of our journal and promotes the sharing of new knowledge among peers in Canada and internationally.
Devendra Amre Kelly Anderson Chris Andrews Sten Ardal Megan Aston George Beaton Nicholas Birkett Carole Blanchet Larry Chambers Yves Chaput Yue Chen Margaret Cheney Mary Chipman Wong Ho Chow Lynda Corby Simone Dahrouge Carl D’Arcy Joseph DiFranza Roland Dyck Grace Egeland Garry Egger Daniel Fuller Tracey Galloway Didier Garriguet Leslie Gaudette William Gnam Katherine Gray-Donald Judy Guernsey Leona Hakkaart-Van Roijen Anne-Marie Hamelin Trevor Hancock Lisa Hartling Ken Hoffman Janie Houle Jennifer Hutcheon Brian Hutchison K. S. Joseph Anita Koushik Yvonne Lamers Jérôme Lavoué Nancy Lightfoot Shiliang Liu Lisa Lix Francine Lortie-Monette Pat Martens
Jane McCusker Rena Mendelson Les Mery Christiana Miewald Anthony Miller Judy Morona John Myers Bruce Newbold Jill Newstead-Angel Edward Ng Michael Otterstatter Gordon Phaneuf Will Pickett Robert Platt Kevin Pottie Sampsa Puttonen Georgia Roberts Elizabeth Robinson Edmond Ryan Diana Schendel Cindy Scythes Monique Séguin David Streiner Paul Taenzer Mary Thompson Ross Tsuyuki Ana Velly Harth Volker Kitty Wilkins Kristy Wittmeier Margareth Zanchetta
With thanks to our 2010 peer reviewers

To promote and protect the health of Canadians through leadership, partnership, innovation and action in public health. — Public Health Agency of Canada
Published by authority of the Minister of Health. © Her Majesty the Queen in Right of Canada, represented by the Minister of Health, 2011
ISSN 1925-6515
This publication is also available online at www.publichealth.gc.ca/cdic Également disponible en français sous le titre : Maladies chroniques et blessures au Canada
CDIC: Information for authors
Chronic Diseases and Injuries in Canada (CDIC) is a
quarterly scientific journal focusing on the prevention
and control of non‑communicable diseases and injuries
in Canada. Its feature articles are peer reviewed.
The content of articles may include research from
such fields as epidemiology, public/community
health, biostatistics, the behavioural sciences, and
health services or economics. CDIC endeav ours to
foster communication on chronic diseases and injuries
among public health practitioners, epidemiolo gists
and researchers, health policy plan ners and health
educators. Submissions are selected based on scientific
quality, public health relevance, clarity, concise ness
and technical accuracy. Although CDIC is a publication
of the Public Health Agency of Canada, contributions
are welcomed from both the public and pri vate sectors.
Authors retain responsibility for the contents of their
papers, and opinions expressed are not necessarily
those of the CDIC editorial committee nor of the
Public Health Agency of Canada.
Article Types
Peer‑reviewed Feature Article: Maximum 4000
words for main text body (excluding abstract,
tables, figures, references) in the form of original
research, surveillance reports, meta‑analyses or
methodological papers.
Status Report: Describe ongoing national programs,
studies or information systems bearing on Canadian
public health (maximum 3000 words). Abstract
not required.
Workshop/Conference Report: Summarize significant,
recently held events relat ing to national public health
(maximum 1200 words). Abstract not required.
Cross‑Canada Forum: For authors to present or
exchange information and opin ions on regional or
national surveillance findings, programs under
development or public health policy initiatives
(maximum 3000 words). Abstract not required.
Letter to the Editor: Comments on articles recently
published in CDIC will be consid ered for publication
(maximum 500 words). Abstract not required.
Book/Software Review: Usually solicited by the
editors (500‑1300 words), but requests to review
are welcomed. Abstract not required.
Submitting Manuscripts
Submit manuscripts to the Managing Editor,
Chronic Diseases and Injuries in Canada, Public
Health Agency of Canada, 785 Carling Avenue,
Address Locator 6805B, Ottawa, Ontario K1A 0K9,
email: cdic‑mcbc@phac‑aspc.gc.ca.
Since CDIC adheres in general (section on illustrations
not applicable) to the “Uniform Requirements for
Manuscripts Submitted to Biomedical Journals”
as approved by the International Committee of
Medical Journal Editors, authors should refer to this
document for complete details before submitting a
manuscript to CDIC (see <www.icmje.org>).
Checklist for Submitting Manuscripts
Cover letter: Signed by all authors, stating that all have
seen and approved the final manuscript and have met
the authorship criteria including a full statement
regarding any prior or duplicate publi cation or
submission for publication.
First title page: Concise title; full names of all
authors and institutional affiliations; name, postal
and email addresses, tele phone and fax numbers
for corresponding author; separate word counts for
abstract and text.
Second title page: Title only; start page numbering
here as page 1.
Abstract: Unstructured (one paragraph, no headings),
maximum 175 words (100 for short reports); include
3‑8 keywords (preferably from the Medical Subject
Headings [MeSH] of Index Medicus).
Text: Double‑spaced, 1 inch (25 mm) margins,
12 point font size.
Acknowledgements: Include disclosure of financial
and material support in acknowledgements; if anyone
is credited in acknowledgements with substantive
scientific contributions, authors should state in the
cover letter that they have obtained written permission.
References: In Vancouver style (consult a recent CDIC
issue for examples); num bered in superscript in the
order cited in text, tables and figures; listing up to
six authors (first six and et al. if more); without any
automatic reference numbering feature used in
word processing; any unpublished observations/
data or personal communications used (discouraged)
to be cited in the text in parentheses (authors
responsible for obtaining written per mis sion); authors
are responsible for verifying accuracy of references.
Tables and Figures: Send vector graphics only.
Each on a separate page and in electronic file(s)
separate from the text (not imported into the text
body); as self‑explanatory and succinct as possible;
not too numerous; numbered in the order that they
are mentioned in the text; explanatory material for
tables in footnotes, identified by lower‑case
superscript letters in alpha betical order; figures
limited to graphs or flow charts/templates (no
photographs), with software used specified and
titles/footnotes on a separate page.
Number of copies: If submitting by mail, one
complete copy, including tables and figures; one
copy of any related supple men tary material, and a
copy of the manuscript on diskette. If submitting by
email to cdic‑mcbc@phac‑aspc.gc.ca, please fax or
mail the covering letter to the address on the inside
front cover.
Chronic Diseases and Injuries in Canadaa publication of the Public Health Agency
of Canada
Howard Morrison, PhD Editor-in-Chief (613) 941-1286
Robert A. Spasoff, MD Associate Scientific Editor
Claire Infante-Rivard, MD Associate Scientific Editor
Elizabeth Kristjansson, PhD Associate Scientific Editor
Michelle Tracy, MA Managing Editor
CDIC Editorial Board
Lesley Doering, MSW Public Health Agency of Canada
Robert Geneau, PhD Public Health Agency of Canada
Isra Levy, MB, FRCPC, FACPM Ottawa Public Health
Lesli Mitchell, MA Centers for Disease Control and Prevention
Scott Patten, MD, PhD, FRCPC University of Calgary
Barry Pless, CM, MD, FRCPC Montreal Children’s Hospital
Kerry Robinson, PhD Public Health Agency of Canada
Fabiola Tatone-Tokuda, MSc University of Ottawa
Andreas T. Wielgosz, MD, PhD, FRCPC Public Health Agency of Canada
Don Wigle, MD, PhD University of Ottawa
Russell Wilkins, MUrb Statistics Canada
Chronic Diseases and Injuries in Canada (CDIC) is a quarterly scientific journal focussing on current evidence relevant to the control and prevention of chronic (i.e. non-communicable) diseases and injuries in Canada. Since 1980 the journal has published a unique blend of peer-reviewed feature articles by authors from the public and private sectors and which may include research from such fields as epidemiology, public/community health, biostatistics, the behavioural sciences, and health services or economics. Only feature articles are peer reviewed. Authors retain responsibility for the content of their articles; the opinions expressed are not necessarily those of the CDIC editorial committee nor of the Public Health Agency of Canada.
Chronic Diseases and Injuries in Canada Public Health Agency of Canada
785 Carling Avenue Address Locator 6805B
Ottawa, Ontario K1A 0K9
Fax: (613) 941-9502 E-mail: [email protected]
Indexed in Index Medicus/MEDLINE, SciSearch® and Journal Citation Reports/
Science Edition

Chronic Diseases and Injuries in Canada
Volume 31 · Number 3 · June 2011
Inside this issue94 Preface – What’s in a name: Chronic Diseases
and Injuries in Canada H. Morrison, M. Tracy
95 Editorial – Non-communicable diseases – finally on the global agenda
A. T. Wielgosz
97 Patterns of fatal machine rollovers in Canadian agriculture
J. M. DeGroot, C. Isaacs, W. Pickett, R. J. Brison
103 Estimating gestational age at birth: a population-based derivation-validation study
M. L. Urquia, T. A. Stukel, K. Fung, R. H. Glazier, J. G. Ray
109 The influence of primary health care organizational models on patients’ experience of care in different chronic disease situations
R. Pineault, S. Provost, M. Hamel, A. Couture, J. F. Levesque
121 An assessment of the barriers to accessing food among food-insecure people in Cobourg, Ontario
S. Tsang, A. M. Holt, E. Azevedo
129 Estimates of the treated prevalence of bipolar disorders by mental health services in the general population: comparison of results from administrative and health survey data
A. G. Bulloch, S. Currie, L. Guyn, J. V. Williams, D. H. Lavorato, S. B. Patten