christie · belgrade the cee hotel market 3 city of opportunities hotel market performance belgrade...
TRANSCRIPT

christie.com

2
CEE Hotel Market Overview
We are delighted to present our latest report on the Central & Eastern
Europe (CEE) hotel market that examines market trends in major
capitals across the region.
Hotels located in CEE’s capital cities have had an incredibly successful
2016 with cumulative RevPAR growth in excess of 10%,
outperforming many other capitals in neighbouring regions of
Europe. Tourism is booming and underpinned by strong economic
indicators, the region’s hoteliers foresee this positive trend to
continue.
Hotel investors are taking note and increasingly looking to unlock
value in CEE capitals. The prospect of hotel assets with higher yields,
increasing tourism demand and significant economic growth are
proving to be highly attractive for a wide range of international
investors and early adaptors are positioned to benefit from an
upswing in these relatively immature investment markets.
This review gives you insight into the fundamentals and trends of key
cities in the region including Belgrade, Bratislava, Bucharest,
Budapest, Prague and Warsaw.
We hope you will enjoy reading our report and we would be happy to
discuss opportunities with you in the near future.
The CEE Hotel Market
Unlocking opportunities
Lukas Hochedlinger MRICS
Managing Director
Germany, Austria & CEE
Budapest
Bucharest
Prague
Belgrade
Warsaw
Bratislava
Marvin Kaiser
Senior Consultant Investment & Letting
Austria & CEE
Belgrade
The CEE Hotel Market
3
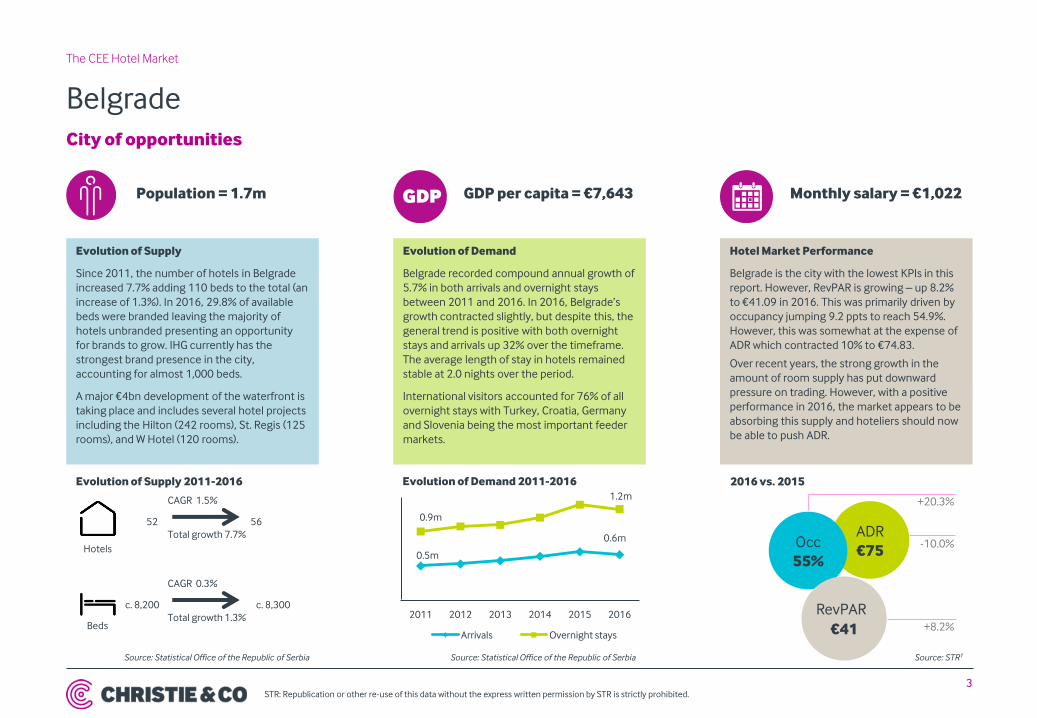
City of opportunities
Hotel Market Performance
Belgrade is the city with the lowest KPIs in this
report. However, RevPAR is growing – up 8.2%
to €41.09 in 2016. This was primarily driven by
occupancy jumping 9.2 ppts to reach 54.9%.
However, this was somewhat at the expense of
ADR which contracted 10% to €74.83.
Over recent years, the strong growth in the
amount of room supply has put downward
pressure on trading. However, with a positive
performance in 2016, the market appears to be
absorbing this supply and hoteliers should now
be able to push ADR.
Evolution of Supply
Since 2011, the number of hotels in Belgrade
increased 7.7% adding 110 beds to the total (an
increase of 1.3%). In 2016, 29.8% of available
beds were branded leaving the majority of
hotels unbranded presenting an opportunity
for brands to grow. IHG currently has the
strongest brand presence in the city,
accounting for almost 1,000 beds.
A major €4bn development of the waterfront is
taking place and includes several hotel projects
including the Hilton (242 rooms), St. Regis (125
rooms), and W Hotel (120 rooms).
Evolution of Demand
Belgrade recorded compound annual growth of
5.7% in both arrivals and overnight stays
between 2011 and 2016. In 2016, Belgrade’s
growth contracted slightly, but despite this, the
general trend is positive with both overnight
stays and arrivals up 32% over the timeframe.
The average length of stay in hotels remained
stable at 2.0 nights over the period.
International visitors accounted for 76% of all
overnight stays with Turkey, Croatia, Germany
and Slovenia being the most important feeder
markets.
ADR
€75 Occ
55%
RevP
€41
+20.3%
-10.0%
+8.2%
Source: STR1
STR: Republication or other re-use of this data without the express written permission by STR is strictly prohibited.
Population = 1.7m GDP per capita = €7,643 Monthly salary = €1,022
0.5m
0.6m
0.9m
1.2m
2011 2012 2013 2014 2015 2016
Arrivals Overnight stays
Evolution of Demand 2011-2016 2016 vs. 2015
Source: Statistical Office of the Republic of Serbia Source: Statistical Office of the Republic of Serbia
Hotels
56
CAGR 1.5%
Total growth 7.7%
52
c. 8,300
Beds
c. 8,200
CAGR 0.3%
Total growth 1.3%
Evolution of Supply 2011-2016
RevPAR

Bratislava
The CEE Hotel Market
4
Highest RevPAR growth in 2016
Hotel Market Performance
Strong economic growth and the 2016 EU
presidency fuelled demand for hotel rooms and
gave trading performance a boost. Both
occupancy and ADR improved (by 6.2 ppts and
9.5% respectively) and pushed up RevPAR by an
astonishing 20.8% in 2016. As the presidency
moved to Malta in January 2017, we expect
RevPAR growth to decelerate this year.
Generally speaking, Bratislava is growing
steadily even though it is starting from a low
base. It is worth noting however, the city looses
out to Vienna on some MICE and corporate
business due to its close proximity.
Evolution of Supply
Since 2011, the number of hotels and beds has
remained generally stable posting marginal
growth of 0.5% p.a. and 0.3% p.a. respectively.
Circa 40% of hotels (or 5,100 beds) in Bratislava
are branded. In contrast to other CEE capitals,
no brand has a particularly strong presence.
Although Accor and IHG have also two flags on
the market, Starwood is market leader,
covering 17% (880 beds) of all branded beds.
Pipeline is currently limited with no new hotel
openings expected.
Evolution of Demand
Since 2011, arrivals and overnight stays have
grown exponentially by 59.5% and 62.4%
respectively. On a compound annual growth
basis, the market has grown 9.8% p.a. in arrivals
and 10.2% p.a. in overnight stays. The average
length of stay remained stable at 1.7 nights
over the period.
International arrivals account for just over half
of overnight stays at 56%. Among the most
important source markets are the Czech
Republic, Germany, Russia and the UK.
ADR
€63 Occ
67%
RevP
€42
+10.3%
+9.5%
+20.8%
Population = 0.6m
Hotels
76
CAGR 0.5%
Total growth 2.7%
74
c. 12,000
Beds
c. 11,800
CAGR 0.3%
Total growth 1.5%
GDP per capita = €35,352 Monthly salary = €1,427
0.7m
1.1m 1.1m
1.8m
2011 2012 2013 2014 2015 F 2016
Arrivals Overnight stays
STR: Republication or other re-use of this data without the express written permission by STR is strictly prohibited.
2016 vs. 2015 Evolution of Supply 2011-2016 Evolution of Demand 2011-2016
Source: STR1 Source: Statistical Office of the Republic of Slovenia Source: Statistical Office of the Republic of Slovenia
RevPAR

Bucharest
The CEE Hotel Market
5
Opportunity knocks
Hotel Market Performance
Due to an overall increase in demand,
Bucharest witnessed strong trading growth in
2016. Occupancy improved 3.2 ppts to 71.2%
while ADR rose 5.8% to €77.88 resulting to a
10.8% boost in RevPAR.
We expect that this positive trend will carry
forward into 2017 based on country’s
increasing attractiveness as a meetings and
events destination in addition to important
developments in Bucharest’s infrastructure.
Evolution of Supply
Since 2011, the number of hotels grew 3.5%
p.a. while the number of beds grew 0.4% p.a.
which corresponds to total growth of 19.0%
and 2.1% respectively over the period.
Circa 54% (or 10,300) of beds are branded in
Bucharest and Accor is the most prevalent
brand accounting for almost 10% of the 19,000
available beds. Over the next few years, several
new hotel openings are expected, the majority
of which will be internationally branded
including a Mercure and Hilton Garden Inn.
Evolution of Demand
Bucharest has witnessed continuous growth in
arrivals and overnight stays over the past five
years recording 53% and 57% growth
respectively (CAGR of 9.5% and 8.9%). Over the
same period, there was a slight drop in average
length of stay from 1.7 to 1.6 nights.
60% of all overnight stays were generated by
international visitors, which is a contrast to the
rest of Romania where the majority of
overnights are generated by the domestic
market.
ADR
€78 Occ
71%
RevP
€55
+4.7%
+5.8%
+10.8%
Population = 1.8m
Hotels
119
CAGR 3.5%
Total growth 19.0%
100
c. 19,000
Beds
c. 18,600
CAGR 0.4%
Total growth 2.1%
GDP per capita = €22,300 Monthly salary = €820
1.2m
1.9m 2.0m
3.0m
2011 2012 2013 2014 2015 2016
Arrivals Overnight stays
STR: Republication or other re-use of this data without the express written permission by STR is strictly prohibited.
2016 vs. 2015 Evolution of Supply 2011-2016 Evolution of Demand 2011-2016
Source: STR1 Source: National Institute of Statistics - Romania Source: National Institute of Statistics - Romania
RevPAR

Budapest
The CEE Hotel Market
6
One of CEE’s most important economic hubs
Hotel Market Performance
Budapest’s hotel market recorded remarkable
improvements in trading performance over
recent years, albeit from a low base.
Occupancy grew 2.0 ppts to 75.3% in 2016,
while ADR increased 6.1% to €76.02. Overall,
hoteliers witnessed a 9.0% increase in RevPAR
to €57.25.
Based on the trading numbers, we expect this
positive development to continue in the future.
In addition, several new hotel operators will
enter the market in the near future and may
have an impact on the market’s performance.
Evolution of Supply
Since 2011, the number of hotels grew 2.0%
p.a. and the number of beds by 0.9% p.a., which
corresponds to 10.6% and 4.6% total growth.
Almost half the bed supply (49%) is branded
and the clear market leader is the domestic
favourite, Danubius Hotels, accounting for a
third of all branded hotels.
An additional 1,000 bedrooms are expected to
come online by 2019 including two new
brands, 184-room Meininger and a 300-room
IntercityHotel, to enter the market.
Evolution of Demand
Over the past five years, overnight stays grew
55% while arrivals grew 50%. On a compound
annual growth basis, the market has grown
6.9% p.a. in arrivals and 6.3% p.a. in overnight
stays. The average length of stay remained
stable between 2.3 and 2.4 nights over the
same period.
In 2016, 90% of overnights were generated by
international visitors. The most important
source markets were the UK (contributing 9.5%
of all overnight stays), followed by the US
(6.7%), Germany (6.4%) and Italy (6.4%).
ADR
€76 Occ
75%
RevP
€57
+2.7%
+6.1%
+9.0%
Population = 1.7m
Hotels
198
CAGR 2.0%
Total growth 10.6%
179
c. 42,900
Beds
c. 41,000
CAGR 0.9%
Total growth 4.6%
GDP per capita = €22,970 Monthly salary = €1,037
2.7m
3.7m
6.2m
8.4m
2011 2012 2013 2014 2015 2016
Arrivals Overnight stays
STR: Republication or other re-use of this data without the express written permission by STR is strictly prohibited.
2016 vs. 2015 Evolution of Supply 2011-2016 Evolution of Demand 2011-2016
Source: STR1 Source: Hungarian Central Statistical Office Source: Hungarian Central Statistical Office
RevPAR

Prague
The CEE Hotel Market
7
The largest hotel market in CEE with the strongest RevPAR
Hotel Market Performance
Prague’s hoteliers achieve the strongest
occupancy, ADR and RevPAR in the CEE region.
In 2016, RevPAR grew 6.0% to €62.81 based on
rises in both occupancy and ADR.
Hotel performance has been growing steadily
and consistently and the city is still proving
attractive to business and leisure tourists alike.
Although strong supply growth may have an
impact on performance over the next few
years, we expect Prague to remain CEE’s
strongest market and absorb the new supply
with increasing demand.
Evolution of Supply
Since 2012, the number of hotels in Prague
grew 1.0% while the number of beds grew 2.0%.
In 2016, about a third of all rooms in Prague
were branded. The local hotel company
EuroAgentur operates most (11) of the branded
hotels while Hilton also has a strong presence
in the market with almost 2,200 beds.
The pipeline is strong with new brands, such as
B&B Hotels and Motel One, entering the
market. Meanwhile other brands such as
Marriott also plan on strengthening their
position by adding a 154-room W Hotel.
Evolution of Demand
Over the past five years, tourist arrivals grew
28.4% while overnights rose by 17.2% . 2016
marked an all time high, with 14.7m overnight
hotel stays. The average length of stay in hotels
recorded a slight decrease from 2.6 nights to
2.3 nights since 2011.
Just more than 90% of overnight stays were
originated by international visitors with
Germany (12%), Russia (7%), the US (7%), and
the UK (6%) being the most important source
markets.
ADR
€82 Occ
77%
RevP
€63
+2.5%
+3.4%
+6.0%
Population = 1.6m
Hotels
482
CAGR 0.2%
Total growth 1.0%
477
c. 68,900
Beds
c. 67,500
CAGR 0.4%
Total growth 2.0%
GDP per capita = €32,620 Monthly salary = €1,277
4.9m 6.3m
12.5m
14.7m
2011 2012 2013 2014 2015 2016
Arrivals Overnight stays
STR: Republication or other re-use of this data without the express written permission by STR is strictly prohibited.
2016 vs. 2015 Evolution of Supply 2012-2016 Evolution of Demand 2011-2016
Source: STR1 Source: Czech Statistical Office Source: Czech Statistical Office
RevPAR

Warsaw
The CEE Hotel Market
8
A city ready for business
Hotel Market Performance
Warsaw’s hotel market recorded healthy growth
in trading performance over recent years, with
a high share of business travellers to leisure
guests.
Warsaw experienced strong growth in 2016
with occupancy up 2.1 ppts to 76.6% while ADR
grew 3.1% to €67.87. This resulted in 6.0%
RevPAR growth to €51.99.
The strong hotel supply of different hotel
categories coming to the market may have an
impact on the overall performance, similar to
the situation in Budapest and Prague.
Evolution of Supply
Since 2011, the number of hotels in Warsaw
grew 37.1% while bed numbers grew 21.7%.
In contrast to other CEE capitals, branded hotel
supply accounts for the majority at c. 64% of
total supply (or 8,300 beds).
Furthermore, more internationally branded
hotels are expected to enter the market or
strengthen their position in the next few years
including Motel One, Moxy, Raffles and IHG
brands Indigo and Holiday Inn.
Evolution of Demand
Over the last five years, demand for hotel
rooms has witnessed continuous growth. The
market registered a compound annual growth
of 5.4% in arrivals and 6.2% in overnight stays.
In 2016, Warsaw reached remarkable numbers
and saw a total increase of 30.1% in arrivals and
34.8% in overnight stays. The average length of
stay showed marginal growth approaching 1.7
nights. Warsaw benefits from strong domestic
and international demand , with 42% of
overnights being generated by international
visitors with the UK, the US, Germany and Spain
being the top source markets.
ADR
€68 Occ
77%
RevP
€52
+2.8%
+3.1%
+6.0%
Population = 1.7m
Hotels
85
CAGR 6.5%
Total growth 37.1%
62
c. 13,000
Beds
c. 10,700
CAGR 4.0%
Total growth 21.7%
GDP per capita = €30,345 Monthly salary = €1,340
2.2m
3.0m 3.5m
5.0m
2011 2012 2013 2014 2015 2016
Arrivals Overnight stays
STR: Republication or other re-use of this data without the express written permission by STR is strictly prohibited.
2016 vs. 2015 Evolution of Supply 2011-2016 Evolution of Demand 2011-2016
Source: STR1 Source: Central Statistical Office of Poland Source: Central Statistical Office of Poland
RevPAR

christie.com
Christie & Co
Overview

UK OFFICES
BIRMINGHAM
BRISTOL
CARDIFF
EDINBURGH
EXETER
GLASGOW
IPSWICH
LONDON
LEEDS
MAIDSTONE
MANCHESTER
NEWCASTLE
NOTTINGHAM
READING
WINCHESTER
10
The CEE Hotel Market
– Christie & Co was founded over 80 years ago, and has been
publicly listed on the Alternative Investment Market (AIM) for
more than 10 years
– We are the leading valuers, consultants and brokers across
Europe in our specialist sectors with unrivalled experience in
hotel real estate
– With 280 professionals across 32 offices we have the largest
team of dedicated specialists
– We act on behalf of:
– International investors and developers
– International lending and investment banks
– Major, regional and multiple operators
– We complete 500 valuations annually and currently have more
than 400 hotel sale instructions
– In 2015 we launched a dedicated Asia desk and have become
exclusive advisors to some of Asia’s largest investors
BARCELONA
BERLIN
BORDEAUX
DUBLIN
FRANKFURT
HELSINKI
LYON
MADRID
MUNICH
PARIS
RENNES
STOCKHOLM
VIENNA
WARSAW
EUROPEAN OFFICES
AIX EN PROVENCE
We are the leading hotel and leisure advisers in Europe
An introduction to Christie & Co

Hotel team CEE
The CEE Hotel Market
11
Our hotel experts in Vienna and Warsaw
Vienna Office
Stallburggasse 2/3a,
A-1010 Vienna
T +43 (0)1 890 53 57 0
Andreas Scriven
International Managing Director &
Managing Director Consultancy
T +44 20 7227 0782
M +44 7795 640 463
Adam Konieczny Country Head
Poland
T +48 22 223 05 00
M +48 501 522 913
Lukas Hochedlinger MRICS Managing Director
Germany, Austria & CEE
T +43 1 890 53 57 2
M +43 699 1997 1365
Simon Kronberger Senior Consultant Investment &
Letting Austria & CEE
T +43 1 890 53 57 3
M +43 699 1997 1333
Marvin Kaiser Senior Consultant Investment &
Letting Austria & CEE
T +43 1 890 53 57 4
M +43 699 1997 1334
Sandra Pechac Marketing Manager
Germany, Austria & CEE
Warsaw Office
Warsaw Trade Tower, Dago Centrum, 36. pietro
Ul. Chłodna 51. 00-867 Warsaw
T +48 (0) 22 223 05 00
T +43 1 890 53 57 0
DD +43 1 890 53 57 1
Joanne Jia Head of Investment
Asia
T +44 20 7227 0775
M +44 7736 615 868

christie.com
Christie & Co Austria GmbH
Stallburggasse 2/3a
A-1010 Vienna
Austria
T +43 (0) 1 890 53 57 0
W christie.com
Christie & Co
All rights reserved. Republication or other re-use of this data without the express written permission by STR and Christie & Co Austria GmbH is strictly prohibited, 2017.