chosen project deliverable - europa
TRANSCRIPT

Cooperative Hybrid Objects Sensor Networks
Contract Number: INFSO-ICT-224327
Copyright CHOSeN Consortium
2008-2011
CHOSeN
Project Deliverable
DELIVERABLE NO D2.2 (Final Version)
DELIVERABLE TITLE System Model Definition and Simulation Results
AUTHORS J. Blanckenstein (EADS), J. Klaue (EADS),
G. Zennaro (CRF), A. Roat (CRF), N. Peroni (CRF), L. D’Orazio (CRF), D. Gordon (KIT)
DISCLOSURE LEVEL Public
VERSION V2.0

Cooperative Hybrid Objects Sensor Networks
Contract Number: INFSO-ICT-224327
Copyright CHOSeN Consortium
2008-2011
Table of contents
EXECUTIVE SUMMARY ................................................................... 6
1 INTRODUCTION ....................................................................... 7
2 COMMON SIMULATION FRAMEWORK .......................................... 8
2.1 OPNET Framework ............................................................. 8
2.2 Reconfiguration & Parameter Tuning .................................... 9
2.2.1 Model parameterization ................................................ 9
2.2.2 Simulation configuration .............................................. 10
2.3 Channel Model ................................................................. 12
2.3.1 Pipeline stages ........................................................... 12
2.3.2 Packet segmentation ................................................... 15
2.4 Node Models .................................................................... 16
2.4.1 Common node model .................................................. 16
2.4.2 Middleware Node ........................................................ 20
2.4.3 Generic Node ............................................................. 21
2.4.4 Application Model ........................................................ 21
2.5 Transceiver models........................................................... 22
2.5.1 Simulation model description ....................................... 22
2.5.2 Main transceiver hardware description ........................... 25
2.5.3 Wake-up receiver hardware description ......................... 27
2.6 Energy model .................................................................. 27
2.6.1 Root process “energy_chosen” ..................................... 28
2.6.2 Child process “sensor” ................................................. 29
2.7 Medium Access Control ..................................................... 32
2.7.1 IEEE 802.15.4 ............................................................ 32
2.7.2 X-MAC ....................................................................... 33
2.7.3 WoR-MAC .................................................................. 35
2.7.4 BP-MAC ..................................................................... 36
2.8 Collaboration protocols / Data Fusion .................................. 38
2.8.1 Message format .......................................................... 38
2.8.2 Data Fusion ............................................................... 43
3 Simulations Results and Performance Evaluation ........................ 43
3.1 CHOSeN vs. Atmel AT86RF212 ........................................... 43
3.2 Performance WorMAC versus X-MAC ................................... 53
3.2.1 Delay ........................................................................ 53
3.2.2 Packet Loss ................................................................ 55

Cooperative Hybrid Objects Sensor Networks
Contract Number: INFSO-ICT-224327
Copyright CHOSeN Consortium
2008-2011
3.2.3 Energy Consumption ................................................... 55
3.3 Application scenarios ........................................................ 57
3.3.1 Aeronautic application scenario .................................... 58
3.3.2 Automotive application scenario ................................... 61
4 Conclusions ............................................................................ 62

Cooperative Hybrid Objects Sensor Networks
Contract Number: INFSO-ICT-224327
Copyright CHOSeN Consortium
2008-2011
List of figures
Figure 1: hierarchy of OPNET Models; network – node – processor ..... 8
Figure 2: settings for the transceiver model .................................... 10
Figure 3: settings for the configuration node "controller" .................. 11
Figure 4: attributes overview of transmitter and receiver processors .. 14
Figure 5: compound attribute "Rayleigh” ........................................ 15
Figure 6: packet segmentation, because of interfering packets .......... 16
Figure 7: common node model ...................................................... 17
Figure 8: connectivity of collaboration processor ............................. 18
Figure 9: connectivity of transceiver processor ................................ 19
Figure 10: settings for a statistic wire ............................................ 20
Figure 11: transceiver processor – state diagram ............................ 23
Figure 12: Block diagram of the CHOSeN Transceiver ...................... 25
Figure 13: WuRx block diagram of first test chip.............................. 27
Figure 14: attributes of the “energy_chosen” process ...................... 28
Figure 15: attributes of the “sensor” process adjustable at the energy
processor ............................................................................... 30
Figure 16: child process “sensor” – state diagram ........................... 31
Figure 17: Protocol Diagram of the 802.15.4 Evaluation MAC ............ 33
Figure 18: Protocol Diagram of X-MAC Behavior .............................. 34
Figure 19: X-MAC Process Model from the Simulation Environment .... 34
Figure 20: WoR-MAC Process Model from the Simulation Environment ............................................................................................ 35
Figure 21: Protocol Diagram of WoR-MAC Behavior in a Cluster ......... 36
Figure 22: “bpmac” processor - state diagram ................................ 37
Figure 23: three nodes contend for the channel using BP-Mac ........... 38
Figure 24: Generic Message frame format ...................................... 39
Figure 25: Publish Message format ................................................ 39
Figure 26: Demand Message format .............................................. 40
Figure 27: Subscribe Message format ............................................ 41
Figure 28: Data Message format.................................................... 42
Figure 29: Control Message format ................................................ 43
Figure 30: Simulation scenario for CHOSeN vs. Atmel212 ................. 44
Figure 31: proportion of energy consumption per duty cycle ............. 45
Figure 32: state diagram for the Atmel212 ..................................... 46
Figure 33: composition of energy consumption for the CHOSeN node. 47

Cooperative Hybrid Objects Sensor Networks
Contract Number: INFSO-ICT-224327
Copyright CHOSeN Consortium
2008-2011
Figure 34: energy consumption during CSMA for “most unfortunate”
nodes .................................................................................... 49
Figure 35: total length of CSMA phase ........................................... 50
Figure 36: energy consumption values for "most unfortunate" nodes during CSMA .......................................................................... 51
Figure 37: total energy consumption per node - system average ....... 52
Figure 38: energy consumption after 12 h against wake-up delay...... 52
Figure 39: Average Latency with Respect to the Number of Nodes ..... 54
Figure 40: Packet Loss with Respect to the Number of Nodes ............ 55
Figure 41: Average Energy Consumed with Respect to the Number of
Nodes ................................................................................... 56
Figure 42: Topology for the Aeronautic DSID Scenario ..................... 58
Figure 43: WoR-MAC/CSMA-CA and /TDMA Simulations for DSID ...... 59
Figure 44: Packet Loss over the Number of Nodes ........................... 60

Cooperative Hybrid Objects Sensor Networks
Contract Number: INFSO-ICT-224327
Copyright CHOSeN Consortium
2008-2011
EXECUTIVE SUMMARY
This document is the final D2.2 “System Model Definition and
Simulation Results”, which aims to show the functional specification of the CHOSeN system models, as well as the achieved simulation results
within T2.2.
Based on the whole protocol stack (from PHY to Application layer), this document reports the circuit model design and implementation, the
protocol implementation and simulation, and the overall system design and implementation plan based on a common simulation framework.
The CHOSeN system has been decomposed into 2 main sub-systems:
1. RF & PHY (Circuit-Chip) level
2. Protocol (MAC, network, application) level
Each sub-system is further decomposed into a set of components,
which are further separated into implementable sub-components. Each component and set of sub-components has been allocated a number of
work resources covering implementation design and subsequent development activities, interface specification, sub-component
integration and testing.
The performance of the components and system was analyzed
regarding the requirements from WP1 and the results are presented in
this document.
This detailed view of the CHOSeN system forms the overall system
simulation work, helping the design process performed in WP3.

Cooperative Hybrid Objects Sensor Networks
Contract Number: INFSO-ICT-224327
Copyright CHOSeN Consortium
2008-2011
1 INTRODUCTION
This document describes the common simulation framework, the architecture of the network simulation and the implementation of the
single components as well as the performance evaluation and
application scenario feasibility simulations.
The simulation framework is used to assess the performance of the
developed communication protocols in combination with the developed hardware components under the measured environment conditions.
Standard communication protocols (IEEE802.15.4, X-MAC) were also implemented serving as a reference in the performance evaluation.
The description of the simulation framework is done top-down: from the overall setup, over the network nodes and their components (data
sources, transceiver, WUR, microcontroller), and the implementation of the protocols. The models of the components, the channel model based
on the measurement campaigns, and the implementation of the protocols is quite detailed in order to provide a good documentation for
all partners contributing to the simulation development.
Performance evaluation has been done to show the limits of the
developed hardware and protocols in the relevant environments and
compare it to the limits of state-of-the art solutions.
Application scenario feasibility simulations were performed in order to
guide the prototype development in WP4. These results are presented in the end of this document.

Cooperative Hybrid Objects Sensor Networks
Contract Number: INFSO-ICT-224327
Copyright CHOSeN Consortium
2008-2011
2 COMMON SIMULATION FRAMEWORK
2.1 OPNET Framework
OPNET is a simulator built on top of a discrete event system. It
simulates the system behavior by modeling each event happening in the system and processes it by user-defined processes. It uses a
hierarchical strategy to organize all the models to build a whole network. The hierarchy models entities from physical link transceivers,
antennas, to CPU running processes to manage queues or running protocols, to devices modeled by nodes with process modules and
transceivers, to network model that connects all different kinds of nodes together.
As shown in Figure 1 the network model is the highest entity and consists of node models; the node model is the subordinate tier, which
consists of processors and build-in transceivers. Then, the lowest tier is the processor model.
Figure 1: hierarchy of OPNET Models; network – node – processor

Cooperative Hybrid Objects Sensor Networks
Contract Number: INFSO-ICT-224327
Copyright CHOSeN Consortium
2008-2011
To simulate in OPNET, a network has to be designed, which consists of
node models. These node models consist of processors, which represent the different entities of the node and are actually written in
C/C++. The following chapters will specify the models, which were developed for the CHOSeN simulation and how to reconfigure them.
2.2 Reconfiguration & Parameter Tuning
To ease the process of (re)configuring the simulation scenarios some methods for rapid configuration where implemented.
2.2.1 Model parameterization
The first method is model based and provides a rapid configuration tool for individual nodes. It is possible for several models to load a
predefined text file at start-up to define the behavior of it. Therefore,
the path to this text file has to be set in the setting dialog of the model before simulation start.
This method will be explained in more detail for the transceiver model and for the energy model.

Cooperative Hybrid Objects Sensor Networks
Contract Number: INFSO-ICT-224327
Copyright CHOSeN Consortium
2008-2011
Figure 2: settings for the transceiver model
In Figure 2 you can see the setting “name of channel init file”, this setting has to be set to the path of the text file, which defines the
channel parameters used for this node or alternatively has to be set to the predefined value NONE, which indicates, that no setting file shall be
used at all. The setting file itself is then a comma separated list in which the channel parameters are listed. Following the same approach
it is possible to set the harvesting device for the energy model. But keep in mind, that with this setting method, only the individual node
can be configured rapidly; in order to configure all nodes at once and set even further simulation wide parameters a special configuration
node is provided.
2.2.2 Simulation configuration
Contrary to the above a method to (re)configure the whole simulation
scenario at once is provided by a special configuration node, the

Cooperative Hybrid Objects Sensor Networks
Contract Number: INFSO-ICT-224327
Copyright CHOSeN Consortium
2008-2011
“controller”. This “controller” can be seen in the top left corner of
Figure 30. If this configuration node is used, it can change all parameters for all models within the simulation scenario. It even can
use the model based rapid configuration methods described in chapter 2.2.1. With this, for instance, it is possible to define several transceiver
description files and then simulate the same scenario with different
transceivers, as done for the simulation runs in chapter 3.1 - CHOSeN vs. Atmel AT86RF212. Figure 3 shows exemplarily the settings for the
configuration node.
Figure 3: settings for the configuration node "controller"
As can be seen it is possible for example to set the “number of nodes
to use”. So a common scenario can be created and with the
configuration node, it is easy to only activate a subset of nodes within this scenario. This simplifies the scenario creation a lot, because then
you don’t have to create a new scenario, if you want to use fewer nodes for your simulation. Additionally, the configuration node is
structured in such a way that it is easy to implement additional setting

Cooperative Hybrid Objects Sensor Networks
Contract Number: INFSO-ICT-224327
Copyright CHOSeN Consortium
2008-2011
interfaces. With that the configuration node is ready for future
simulation changes.
2.3 Channel Model
In OPNET the wireless transmission of packets between nodes is done
over communication links between the transmitter processor and each receiver processor. OPNET uses a “Radio Transceiver Pipeline” to model
this link. To make the link flexible for any kind of radio transmission the Radio Transceiver Pipeline consists of 14 separate stages, which
are subdivided into two groups; one group for the transmitter processor and one for each receiver processor.
2.3.1 Pipeline stages
Each stage fulfils a special task in the radio link and can be changed separately.
The stages at the transmitter module are:
Stage 0 - Receiver Group: In this stage all possible receivers will be calculated for each transmitter. This can be necessary for very
large environments, such as by satellite communication. But in the CHOSeN scenarios, it is applicable to neglect this stage.
Therefore, to accept all receivers, but the receiver within the transmitting node, the pipeline stage “rxgroup_no_self” was
written. Stage 1 – Transmission Delay: In this stage the transmission
delay of the packet will be calculated. It is sufficient to use the build-in pipeline model “dra_txdel”.
Stage 2 – Closure: In the closure stage it will be determined, if the signal can reach a receiver at all. The build-in model “NONE”
is sufficient here. With this pipeline model all transmissions might have an impact on each other.
Stage 3 – Channel Match: In this stage it will be determined, if
the transmitting and receiving channel matches. Three results are possible: the receiving packet will be treated as valid, noise,
or it will be ignored. It is sufficient to use the build-in pipeline model “dra_chanmatch”.
Stage 4 – Transmission Antenna Gain: In this stage, it is possible to calculate the transmitter antenna gain in the direction of the

Cooperative Hybrid Objects Sensor Networks
Contract Number: INFSO-ICT-224327
Copyright CHOSeN Consortium
2008-2011
receiving node. Own antenna patterns can be set. For our
purposes, it is sufficient to use the build-in model “dra_tagain” Stage 5 – Propagation Delay: The delay of the packet, caused by
the propagation of the signal wave, will be calculated in this stage. The build-in model “dra_propdel” will suit here, as well.
The next 8 stages at each receiver module are: Stage 6 – Receiver Antenna Gain: In this stage, it is possible to
calculate the receiver antenna gain in the direction of the transmitting node. Own antenna patterns can be set. Use the
build-in pipeline model “dra_ragain”. Stage 7 – Receiver Power: In this stage the received power of the
signal will be calculated. A further description about the new written pipeline model “power_rayleigh” follows in the section
above. Stage 8 – Interference Noise: In stage 8 noise from interfering
packets will be accumulated. Therefore the receiving packet will be divided into different segments for each interfering packet
(see chapter 2.3.2). The build-in model “dra_inoise” is sufficient for our purposes.
Stage 9 – Background Noise: the background noise of the
channel and the amplifiers etc. will be calculated here. Use the build-in model “dra_bgnoise”.
Stage 10 – Signal to Noise Ratio: For each segment of the packet the interference noise will be calculated. The build-in model
“dra_snr” will suit here. Stage 11 – Bit Error Rate: The bit error rate for each segment
will be calculated. Use the build-in model “dra_ber”. Stage 12 – Error Allocation: the bit errors per segment will be
determined. Use the build-in model “dra_err”. Stage 13 – Error Correction: The packet is set to valid or invalid,
depending on the possible bit error correction. Use the build-in model “dra_ecc”.
Figure 4 shows the overview of the attributes of the transmitter and
receiver.

Cooperative Hybrid Objects Sensor Networks
Contract Number: INFSO-ICT-224327
Copyright CHOSeN Consortium
2008-2011
Figure 4: attributes overview of transmitter and receiver processors
2.3.1.1 Pipeline model “rxgroup_no_self”
The custom pipeline model “rxgroup_no_self” creates one great receiver group for all transmitters, but excludes the receivers in the
transmitting node. Thus, the own packet will not be transmitted to the own receiver.
As well as the pipeline model “dra_rxgroup”, this model populates the state information of the receiver group channels used in the power and
ecc pipeline stages to lock on a packet. When a new packet arrives, the channel will be locked at the receiver;
all packets which arrive during the reception of the locked packet will be treated as noise. After the reception is finished, the channel will be
unlocked.
Cooperative Hybrid Objects Sensor Networks
Contract Number: INFSO-ICT-224327
Copyright CHOSeN Consortium
2008-2011
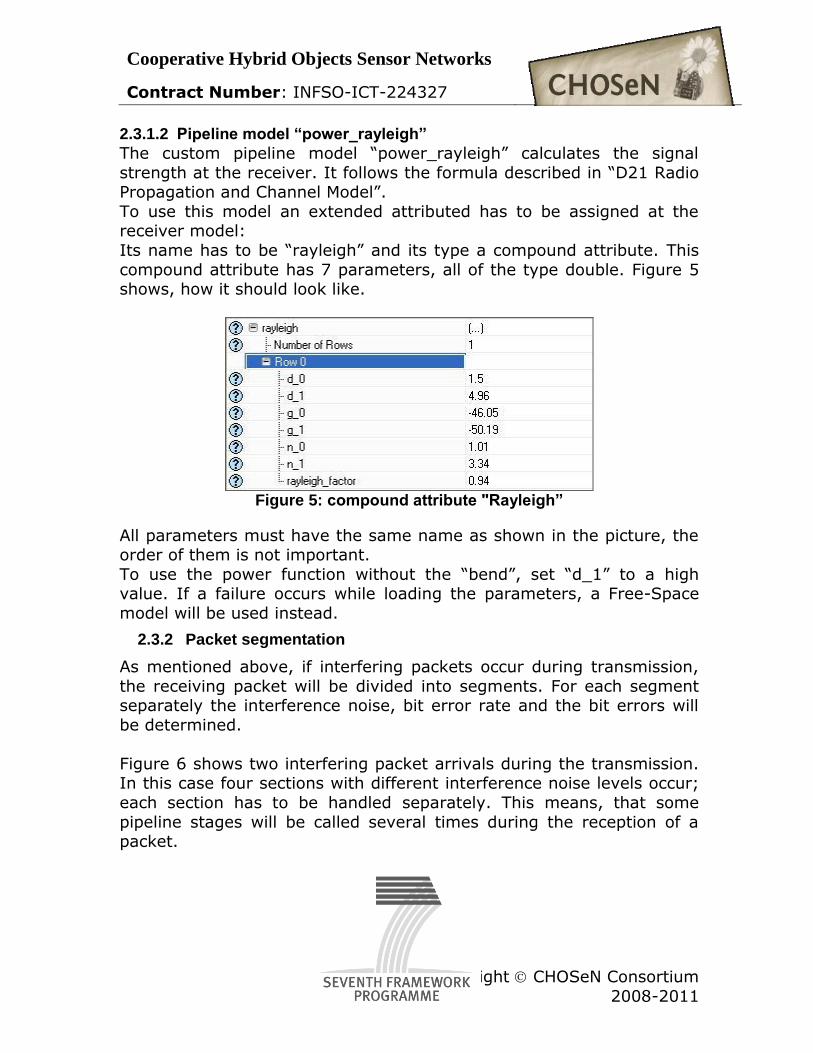
2.3.1.2 Pipeline model “power_rayleigh”
The custom pipeline model “power_rayleigh” calculates the signal
strength at the receiver. It follows the formula described in “D21 Radio Propagation and Channel Model”.
To use this model an extended attributed has to be assigned at the receiver model:
Its name has to be “rayleigh” and its type a compound attribute. This
compound attribute has 7 parameters, all of the type double. Figure 5 shows, how it should look like.
Figure 5: compound attribute "Rayleigh”
All parameters must have the same name as shown in the picture, the order of them is not important.
To use the power function without the “bend”, set “d_1” to a high value. If a failure occurs while loading the parameters, a Free-Space
model will be used instead.
2.3.2 Packet segmentation
As mentioned above, if interfering packets occur during transmission,
the receiving packet will be divided into segments. For each segment separately the interference noise, bit error rate and the bit errors will
be determined.
Figure 6 shows two interfering packet arrivals during the transmission. In this case four sections with different interference noise levels occur;
each section has to be handled separately. This means, that some
pipeline stages will be called several times during the reception of a packet.

Cooperative Hybrid Objects Sensor Networks
Contract Number: INFSO-ICT-224327
Copyright CHOSeN Consortium
2008-2011
Figure 6: packet segmentation, because of interfering packets
In the end, the whole packet is marked as valid or invalid. Invalid packets will be dropped at the receiver processor; valid packets will be
forwarded to the corresponding output packet stream.
2.4 Node Models
As mentioned in chapter 2.1 a node model consists of several processors, which are connected by packet streams and statistic wires.
To provide a kind of interface for the processors a common node model
was created.
2.4.1 Common node model
As shown in Figure 7, the processors are connected by packet streams
symbolized by the blue lines and they are connected by statistic wires symbolized by the dashed red lines.

Cooperative Hybrid Objects Sensor Networks
Contract Number: INFSO-ICT-224327
Copyright CHOSeN Consortium
2008-2011
Figure 7: common node model
Packet streams are accessible to the processors over input and output
ports and they present the flow of packets from one processor to

Cooperative Hybrid Objects Sensor Networks
Contract Number: INFSO-ICT-224327
Copyright CHOSeN Consortium
2008-2011
another. In contrast, statistic wires only have input ports and present
the passing of information from one processor to another.
2.4.1.1 Stream interrupts
To give a common declaration of port assignment, downstream ports
are connected from output port 0 to input port 0; therefore upstream ports are connected from the lowest free output port to the lowest free
input port. In Figure 8 you can see as an example the connectivity of
the collaboration processor.
Figure 8: connectivity of collaboration processor
By starting with the downstream connections, the source output port 0 is connected to the collaboration input port 0; the collaboration
processor is then connected to the mac processor again from output port 0 to input port 0. And for the upstream connection, the mac
output port 1 is connected to the collaboration input port 1; but now a minor change, the collaboration ouput port 1 is connected to the sink
input port 0, because the sink has no downstream input port.
The same changes apply for the transceiver processor. As you can see in Figure 7 the transceiver processor has no downstream output port.
Therefore the stream connectivity changes again. In Figure 9 the connectivity of the transceiver processor is shown.

Cooperative Hybrid Objects Sensor Networks
Contract Number: INFSO-ICT-224327
Copyright CHOSeN Consortium
2008-2011
Figure 9: connectivity of transceiver processor
2.4.1.2 Statistic wires
As you can see in Figure 9 another type of connection from the
transceiver processor are the statistic wires. Statistic wires don’t have an output port; they only have an output statistic and an input port at
the connected processor. In contrast to packet streams, statistic wires can share a common input
port, but for our purposes, different input ports are the better choice.
If a new statistic value / a new set of information is written, the
statistic wire can trigger an interrupt at the connected processor. There are different strategies possible, how to do this. The first degree of
freedom is, when the interrupt shall be triggered. It is possible to trigger the interrupt instantaneously, when the set of information is
written – the forced mode, or the schedule the interrupt. To schedule a statistic interrupt means, to put it in the event list of OPNET. This
interrupt will then occur, when it is at the head of the event list. In contrast to this, when a statistic interrupt is forced, it is triggered
within the event of the processor, which writes the statistic. The second degree of freedom is under what circumstances an
interrupt shall be triggered. Figure 10 shows the possible settings for a statistic wire:
rising edge trigger
falling edge trigger repeated value trigger
zero crossing trigger low threshold trigger
high threshold trigger

Cooperative Hybrid Objects Sensor Networks
Contract Number: INFSO-ICT-224327
Copyright CHOSeN Consortium
2008-2011
With these settings it is possible to control if an interrupt should occur,
dependent on the value written.
Figure 10: settings for a statistic wire
2.4.2 Middleware Node
The middleware nodes which also conduct bridging between the
wireless sensor network and the CAN/AFDX busses are only modeled in the simulator in so far as they affect network behavior. In the
simulation packets travelling towards the applications, end at the middleware nodes, meaning the internal busses of each demonstrator
are not included.
The middleware itself is modeled as a latency distribution which incurs
a certain amount of latency for each packet passing through it based on a Gaussian distribution. The reason for this approximation is that
the complex hardware of the middleware nodes is very difficult to model deterministically and is outside the scope of the project.
Furthermore, the middleware node models produce randomly timed commands to change the danger level of the system, thus allowing the
reaction and system behavior under these conditions to be tested without having to model the entire application back-end. Finally, the
middleware node models also allow for node registration and removal in order to model scalability in the simulator.
Cooperative Hybrid Objects Sensor Networks
Contract Number: INFSO-ICT-224327
Copyright CHOSeN Consortium
2008-2011
2.4.3 Generic Node
A generic node performs the data acquisition and processing tasks of
the CHOSeN project. These tasks are mainly performed in the application and middleware layers.
It is possible to define a set of roles that a generic node can assume by the functionalities provided by the application layer depending on the
capabilities of the node:
SENSOR NODE: when a node manages a set of sensors providing the sampled data to the rest of the network
FUSION NODE: when a node is able to run a set of DATAFUSION computations that provide new data streams
as virtual sensors ACTUATOR NODE: when a node is able to actuate a
feedback mechanism that can be driven remotely. This classification is not mutually exclusive, that means that a node
may perform one or more of roles above at the same time.
2.4.4 Application Model
The application is oriented on a source-sink model. It is possible to classify the exchanged data depending on how they are originated:
L1 data: Real measurements sampled by sensors. L2 data: Virtual measurements as result of data fusion operations
of L1 or other L2 data.
The source-sink model requires that each kind of data stream is enumerated in order to bind a source to a sink that can effectively
handle that data. Each data stream is univocally identified as a union of:
DATA TYPE , which specify the physical meaning of the data, ZONE, which specify the zone of the vehicle from which this data
is sampled. This field is inherited from the node which owns the sensor.
It is important to point that the union [DATA TYPE, ZONE] must be unique, that is there must not be present two different sensors with
same pair in the network.

Cooperative Hybrid Objects Sensor Networks
Contract Number: INFSO-ICT-224327
Copyright CHOSeN Consortium
2008-2011
A node must publish the list of produced streams to the middleware
which will promote them when another node will require a binding to one of them.
The published and required stream may be seen as ports on the network where a service is respectively offered and used. In figure 9
the concept is exemplified.
Details about the automotive application scenario are
available in the confidential version of D2.2.
2.5 Transceiver models
The switching time of a real transceiver between transmit and receive
state has a big influence on the accuracy of the simulation. Also, the
power consumption of the transceivers in each state will have a big influence on the overall power consumption. Therefore, a transceiver
processor is implemented to represent these constraints based on the real hardware features.
2.5.1 Simulation model description
In Figure 11 the state diagram of the “transceiver_chosen” processor is shown. The transceiver is modeled with the following 7 states, which
are defined as symbolic constants in the header file “transceiver_chosen.h”:
INIT POWER_DOWN
DEEP_SLEEP SLEEP
TX RCV
SWITCH

Cooperative Hybrid Objects Sensor Networks
Contract Number: INFSO-ICT-224327
Copyright CHOSeN Consortium
2008-2011
Figure 11: transceiver processor – state diagram
Each functional state has an own power consumption value, as well as
a time value, which describes the time it takes to switch to other states. All these values are stored in the struct “info” defined in the
header file “transceiver_chosen.h” and are transceiver attributes, which are only adjustable before the simulation starts. In order to switch a
state, an interrupt has to occur at the statistic wire port 0 with the state to switch to as its value.
Because of the undefined behavior while the transceiver is switching, the SWITCH state was defined. Before the transceiver is switching to
another state, it switches to the state SWITCH. While this state is
active, the transceiver won’t process any packets. Then, after the correct amount of time, the transceiver switches to the new state and

Cooperative Hybrid Objects Sensor Networks
Contract Number: INFSO-ICT-224327
Copyright CHOSeN Consortium
2008-2011
informs all other processors by the statistic wire “ack state change”
that the switching is over.
It has to be pointed out, that the receiver only forwards packets to the upstream output port, if the transceiver state RCV is active. The same
applies for the downstream; Packets will be forwarded to the
transmitter, only if the receiver state TX is active. If packets arrive while the transceiver is in any other state, they will be discarded.
As can be seen in Figure 7, there are no downstream packet streams
which leave the transceiver. This is due to the multi-channel capacity of the transceiver. The transceiver can be set to a specific channel over a
statistic wire interrupt at port 1. This channel corresponds to the transmitter input port; downstream packets will be forwarded directly,
so no downstream packet stream is necessary. While the transceiver switches the channel, the transceiver state SWITCH will be active, after
the channel switch the transceiver will be in the origin state again. To make it possible for the transceiver to reach the transmitter /
receiver, both names have to be set as a transceiver attribute.
To pass the power consumption info to the energy module, the
transceiver has two output statistics, which have to be connected: transceiver state change
transceiver channel change Both statistic interrupts shall be scheduled interrupts. For “transceiver
state change” interrupt, only the rising and falling edge triggers shall be enabled. And for the “transceiver channel change” interrupt, the
repeated value trigger shall be enabled, additionally. These statistic interrupts will be called, each time, a state changes, or when a channel
switch is over.
Because this transceiver model shall be capable of modeling both, the transceiver processor and the wake-up receiver (WUR) processor, the
stream input port 0 is reserved for an incoming downstream packet stream. This means, that when this model represents the WUR
processor, the incoming upstream packet stream has to be connected
to port 1, although port 0 is free.

Cooperative Hybrid Objects Sensor Networks
Contract Number: INFSO-ICT-224327
Copyright CHOSeN Consortium
2008-2011
2.5.2 Main transceiver hardware description
Figure 12 shows the basic block diagram of the CHOSeN main transceiver. A detailed description is given in Deliverable D3.3. The
transceiver contains a sophisticated power management unit (PMU), which controls the multi-stage power supply. When a certain functional
unit is not needed, its power supply is switched off. This concept is
implemented with a very high granularity including analog as well as digital building blocks. Besides the power down mode, where
everything is switched off, a very energy efficient deep sleep mode is available where an ultra-low power real time clock (RTC) is running and
the content of the transceiver’s configuration RAM is retained.
RX Frontend
TX Frontend
Protocol
Processor
Power
Management
Unit
Matching
+-
Qu
artz
Ba
ttery
External Filter
Antenna
Dig
ital B
ase
ba
nd
Figure 12: Block diagram of the CHOSeN Transceiver

Cooperative Hybrid Objects Sensor Networks
Contract Number: INFSO-ICT-224327
Copyright CHOSeN Consortium
2008-2011
Fehler! Verweisquelle konnte nicht gefunden werden. gives an
overview of the available power states together with their corresponding power consumption and the transition times from each
state to its neighbors.
Details about the CHOSeN transceiver are available in the
confidential version of D2.2.
These states, power consumption values and transition times are used by the transceiver model in the simulation in order to ensure realistic
results in the performance evaluation and application feasibility studies.

Cooperative Hybrid Objects Sensor Networks
Contract Number: INFSO-ICT-224327
Copyright CHOSeN Consortium
2008-2011
2.5.3 Wake-up receiver hardware description
The basic blocks of the WuRx are shown in Figure 15. A more detailed
description of them is given in Deliverable D3.3.
Filter &
Matching
Network
Envelope Detector
WuRx ASIC
LNA Filter
SPI -
Interface
RF LF IRQ
D
A
Mixed
Signal
Correlator
Configuration
Registers SDO
4
Power
Management
Chip
Enable
ULP Current/Voltage
References
CLK
PWM
SARTest
Interface
Analog Digital
Figure 13: WuRx block diagram of first test chip
The Wake-up Receiver itself can operate in one of three power states
which are illustrated in Figure 16. In active state, the WuRx is listening for incoming wake-up calls via a pattern match detection unit. In the
power-save state, the configuration registers retain their contents, while in power-down state, the whole WuRx is shut down which results
in the lowest power consumption, especially at elevated temperature.
Details about the CHOSeN WUR are available in the
confidential version of D2.2.
The values given are measurement results of the first WuRx ASIC samples that are currently under test by Technical University of Vienna.
2.6 Energy model
A main goal of the simulations is to determine the power consumption
of the whole wireless sensor node since it is foreseen that some sensor
nodes shall be driven by energy harvesting. Therefore an energy

Cooperative Hybrid Objects Sensor Networks
Contract Number: INFSO-ICT-224327
Copyright CHOSeN Consortium
2008-2011
module is created, which tracks the drawn energy as well as the
harvested energy. The energy module processor consists of the process “energy_chosen” as the root process and of the process “sensor” as a
child process of the “energy_chosen” process. In the root process “energy_chosen” all energy tracking will be done, the child process will
represent the possible states of the attached sensor.
2.6.1 Root process “energy_chosen”
The root process “energy_chosen” has several attributes which define its behavior. An overview of these attributes is shown in Figure 14.
Figure 14: attributes of the “energy_chosen” process
The attribute “energy start value” defines the value of the available
energy the process will start with. The attribute “endsim intrpt” enables the calculation of the energy value at the end of the simulation. It is
preferred to enable this attribute.
As mentioned in chapter 2.5.1 the energy processor is connected to statistic wires from the transceiver processors. Following definitions are
made for the statistic wire ports: Port 1: state change from transceiver
Port 2: state change from wur
Port 3: channel change from transceiver Port 4: channel change from wur

Cooperative Hybrid Objects Sensor Networks
Contract Number: INFSO-ICT-224327
Copyright CHOSeN Consortium
2008-2011
To handle the connected statistic wires from the transceivers, the name
of the transceivers have to be set in the attributes “transceiver name” and “wur name”. Then, each time a statistic wire interrupt occurs, the
“energy_chosen” process will update its energy value with the drawn energy from the transceivers. If the names are not set properly, the
interrupts will be ignored.
To calculate the harvested energy, the attribute “harvesting active” has
to be enabled and the attribute “harvesting efficiency” has to be set accordingly.
If “harvesting active” is enabled, the “energy_chosen” process will load the external file, defined in the attribute “harvest list file name”.
In this file, it is possible to define several harvest profile files and the time, when these profiles shall start. In this context a harvest profile
defines the power profile of the harvesting device over time. Now, if “own harvesting interrupt” is enabled (the preferred setting)
each time a new power value is available, dependent on the resolution of the profile, the process will update its energy value with the
harvested energy. If “own harvesting interrupt” is disabled, the harvested energy value will be updated each time a statistic wire
interrupt occurs.
Because the power management system is lossy, the “harvesting efficiency” will be multiplied with the harvested energy to represent the
real harvested energy values. To represent the drawn energy by the attached sensor, it is possible to
enable a sensor with the attribute “sensor active”. If the sensor is enabled, each “draw update time” the “energy_chosen” process will
invoke the “sensor” process and updates its energy value with the return value – the energy drawn by the sensor.
Therefore, at the beginning of the simulation the “energy_chosen” process creates a child process “sensor” which keeps track of the
drawn energy by the sensor.
2.6.2 Child process “sensor”
The attributes for the child process are set at the energy processor, as
well. These attributes can be seen in Figure 15.

Cooperative Hybrid Objects Sensor Networks
Contract Number: INFSO-ICT-224327
Copyright CHOSeN Consortium
2008-2011
Figure 15: attributes of the “sensor” process adjustable at the energy
processor
There are several settings for the “sensor” process. The most important
one is the “invoking interrupt code”; this code must match the interrupt code, the root process uses to invoke the child process. In the actual
setting of both processes these values match. Then, with the setting
“start mode” it is possible to define in which state the “sensor” process shall be after creating it.
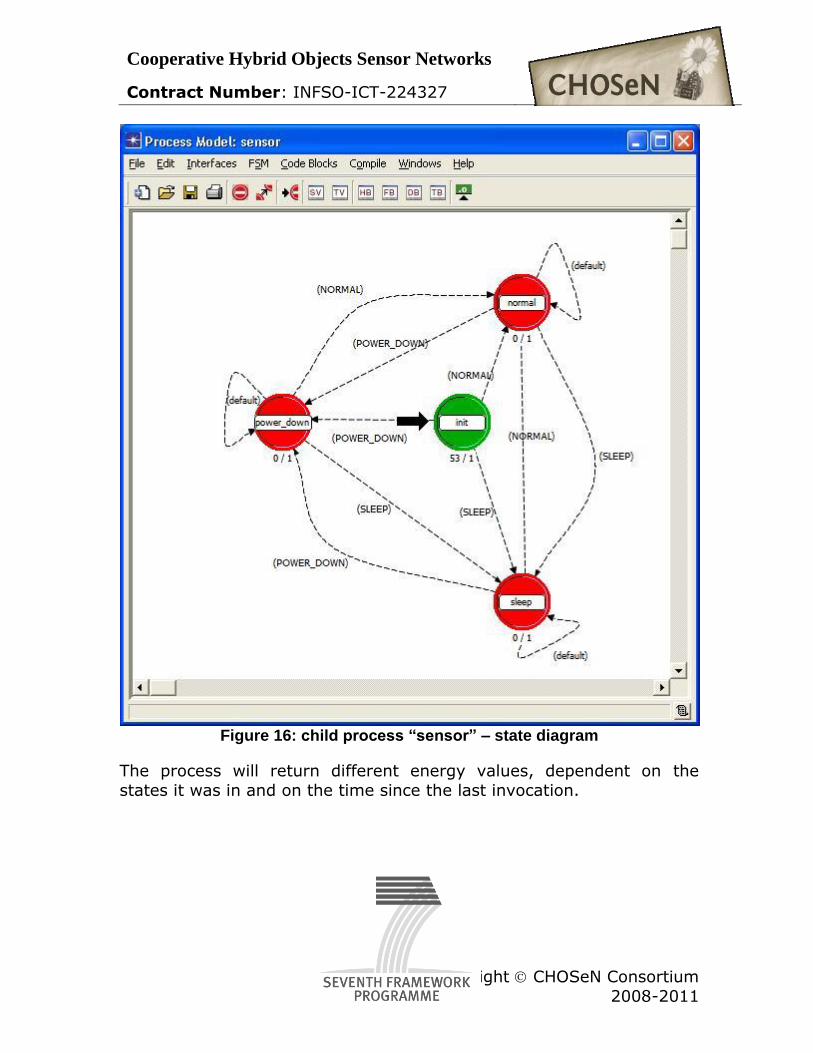
As can be seen in Figure 16, the sensor process has three different
states with different power values, which are adjustable also. These values are:
NORMAL SLEPP
POWER_DOWN
Cooperative Hybrid Objects Sensor Networks
Contract Number: INFSO-ICT-224327
Copyright CHOSeN Consortium
2008-2011
Figure 16: child process “sensor” – state diagram
The process will return different energy values, dependent on the
states it was in and on the time since the last invocation.

Cooperative Hybrid Objects Sensor Networks
Contract Number: INFSO-ICT-224327
Copyright CHOSeN Consortium
2008-2011
To control the state change of the “sensor” process it loads an external
file, defined by the attribute “name list”. This file defines either a periodic or an event based behavior. Therefore, the attribute “periodic
mode change” has to be set accordingly.
Event based behavior: An event is defined by its start time and the
state to switch to. Several of these events can be defined in the list.
Periodic behavior: In contrast, a period is defined by several values; its absolute start time, the residence time for the first state, the first
state, the residence time for the second state, the second state, the third state, the time after all starts again and the relative time, when
this period is ended.
To clarify this, for example following values were loaded: [1 sec, 1 sec, SLEEP, 0.5 sec, NORMAL, POWER_DOWN, 5 sec, 20 sec]
At time 1 the period starts and the process changes to the state SLEEP
after one second it changes to the state NORMAL again after 0.5 seconds it changes to the state POWER_DOWN
and stays there for 3.5 seconds (5 sec – (0.5 sec + 1 sec))
At time 5 the period starts again and changes to state SLEEP And so on…
At time 21 (1 sec + 20 sec) this period ends and remains in the last active state
It is possible, to disable a state change, if the resident time is set to 0.
Then this state change will just be skipped.
2.7 Medium Access Control
2.7.1 IEEE 802.15.4
In order to be able to assess the progress beyond the state of the art
of the CHOSeN wireless network stack and the protocols developed within the project, an evaluative 802.15.4 MAC layer has been
implemented to function as a reference. The MAC is based on a repeating superframe format which begins with a beacon, followed by a

Cooperative Hybrid Objects Sensor Networks
Contract Number: INFSO-ICT-224327
Copyright CHOSeN Consortium
2008-2011
TDMA period, a CSMA period, and finally a sleep period with no activity.
The MAC superframe structure is shown in Figure 17.
Figure 17: Protocol Diagram of the 802.15.4 Evaluation MAC
This static protocol is used to generate a statistical base-line for the evaluation of the CHOSeN MAC protocols. By substituting other MAC
protocols, such as X-MAC, WoR-MAC or BP-MAC for the individual frames of the 802.15.4 evaluation MAC it is possible to isolate the real
effect of each of these protocols. By substituting all of them at once, the improvement of the CHOSeN stack over 802.15.4 or ZigBee can be
evaluated.
2.7.2 X-MAC
X-MAC is a low-power listening protocol which leverages a duty-cycled sensor node to save energy. It implements strobed preambles to
reduce power consumption at the transmitting node by reducing the
amount of time during which the node is transmitting. At the same time it uses addressed preambles to reduce losses due to overhearing
at other nodes in range which are not the designated target node. Thirdly, it uses an ACKed preamble which allows the target node to end
a preamble sequence prematurely and further conserve energy reserves.

Cooperative Hybrid Objects Sensor Networks
Contract Number: INFSO-ICT-224327
Copyright CHOSeN Consortium
2008-2011
Figure 18: Protocol Diagram of X-MAC Behavior
The X-MAC protocol behavior is shown in Figure 18. This protocol has been implemented in the simulation environment and is used to further
augment the 802.15.4 stack and give a further state-of-the-art benchmark for evaluating the effects of WoR-MAC on system behavior.
A screen shot of the automata which defines the protocol in the simulation environment is displayed in Figure 19.
Figure 19: X-MAC Process Model from the Simulation Environment

Cooperative Hybrid Objects Sensor Networks
Contract Number: INFSO-ICT-224327
Copyright CHOSeN Consortium
2008-2011
2.7.3 WoR-MAC
The behavior of the WoR-MAC is detailed in Figure 20 which shows how
single addressed wake-up preambles affect a grouped cluster. It also demonstrates how missed preambles are handled by the system where
preambles are repeated until a certain threshold is reached and the system continues and begins communication.
Figure 20: WoR-MAC Process Model from the Simulation Environment
Currently, the protocol design phase has been completed and the
protocol has been implemented in the CHOSeN OPNET simulation environment. The protocol has also been integrated with the
transceiver, wake-up receiver and energy model in the simulation environment (see Figure 7). It has also been implemented for
evaluation purposes on proprietary test hardware in the laboratory at the Karlsruhe Institute for Technology and is currently being tested.

Cooperative Hybrid Objects Sensor Networks
Contract Number: INFSO-ICT-224327
Copyright CHOSeN Consortium
2008-2011
Figure 21: Protocol Diagram of WoR-MAC Behavior in a Cluster
2.7.4 BP-MAC
Another MAC protocol is the BP-MAC protocol1, already presented in
WP2 of the first review.
1 A. Klein, J. Klaue, and J. Schalk, "BP-MAC: A High Reliable Backoff Preamble MAC Protocol for Wireless Sensor Networks", EJSE, Special
Issue: Sensor Network on Building Monitoring: from Theory to Real Application, 2009

Cooperative Hybrid Objects Sensor Networks
Contract Number: INFSO-ICT-224327
Copyright CHOSeN Consortium
2008-2011
Figure 22: “bpmac” processor - state diagram
In short form, the BP-Mac is a kind of CSMA/CA scheme, but instead of
backing off quietly, it sends back-off preambles to contend for the
channel. The node which sends the longest preamble, wins the channel; Figure 22 shows the state diagram of the “bpmac” processor
and Figure 23 shows the contention for the channel with three nodes.

Cooperative Hybrid Objects Sensor Networks
Contract Number: INFSO-ICT-224327
Copyright CHOSeN Consortium
2008-2011
Figure 23: three nodes contend for the channel using BP-Mac2
As depicted in Figure 23 a node has to listen three times, before it is
allowed to start sending its back-off preamble. This is necessary,
because of the time it takes a transceiver to switch from transmit to receive mode and vice versa. If the initial sensing of the channel is
longer than the switching time, it is more probable for a node to detect a busy channel. Therefore the three times listening is implemented.
2.8 Collaboration protocols / Data Fusion
2.8.1 Message format
The communication between application and middleware consists in a
set of 5 messages encapsulated in a generic transport frame. They are identified through a 3 bits long header that contains the type
information.
The available messages are:
o Publish message (type=0)
2 Picture from A. Klein, J. Klaue, and J. Schalk, "BP-MAC: A High Reliable Backoff Preamble MAC Protocol for Wireless Sensor Networks",
EJSE, Special Issue: Sensor Network on Building Monitoring: from Theory to Real Application, 2009

Cooperative Hybrid Objects Sensor Networks
Contract Number: INFSO-ICT-224327
Copyright CHOSeN Consortium
2008-2011
o Demand message (type=1)
o Subscribe message (type=2) o Data message (type=3)
o Control message (type=4) Considering the variable length of the fields, it has been chosen to
adopt the formatted packet in order to define the fields and the size of a packet directly from the proto-C code.
Publish message
In this message the application declares the streams that it provides
(outputs). Streams are defined only by DATA TYPE because they are
under the same ZONE of the sensor. The zone is also declared in a 6
bits field. The field n declares the number of following stream IDs. Demand message
In this message the application requests the streams that it needs (inputs) for DATAFUSION or monitoring purposes. Streams are defined
msg
type
Payload
3 bits variable
Figure 24: Generic Message frame format
ZONE
6 bits
N
6 bits
N x 6 bits
DATA TYPE
DATA TYPE
DATA TYPE
…
Figure 25: Publish Message format

Cooperative Hybrid Objects Sensor Networks
Contract Number: INFSO-ICT-224327
Copyright CHOSeN Consortium
2008-2011
by DATA TYPE and ZONE because they are can be originated in several
zones of the vehicles by different nodes. The field n declares the number of following unions [DATA TYPE,ZONE].
Subscribe message
With this message, the middleware subscribe itself to the application for a list of data streams that has been remotely requested by other
nodes. The data streams are listed into a list of DATA TYPE. Zone is implicit and is the one set into the Application layer and that was
communicated in the Publish message. The field N indicates the
number of the following elements.
N
6 bits
N x 12 bits
DATA TYPE
ZONE DATA TYPE
ZONE DATA TYPE
ZONE …
Figure 26: Demand Message format

Cooperative Hybrid Objects Sensor Networks
Contract Number: INFSO-ICT-224327
Copyright CHOSeN Consortium
2008-2011
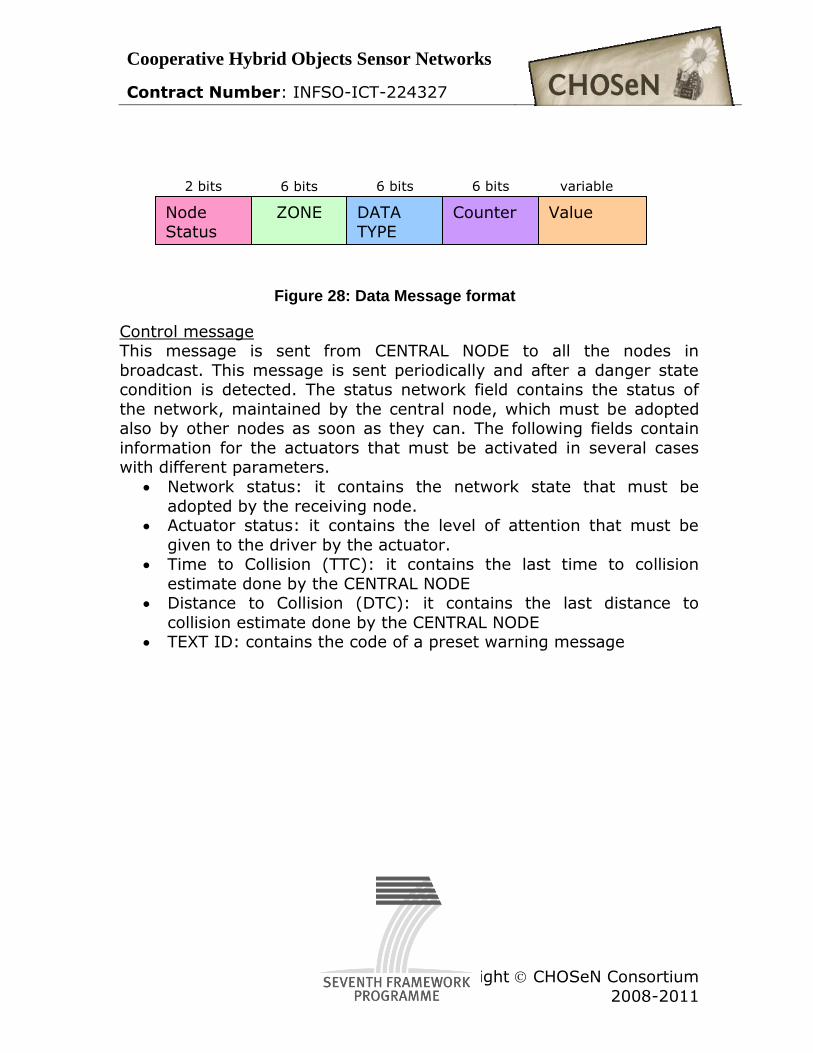
Data message
This message is sent from the application to the middleware every time some data stream has been subscribed by the middleware.
Moreover, it is also used when a remote data arrives at middleware and need to be notified to the application.
Node status: it contains the value of the status register of the sender node. It can have one of the following values:
o MONITORING STATUS (0) o SAFE STATUS (1) o ACTIVE STATUS (2) o DANGEROUS (3) o INACTIVE (-1) only for simulation o ERROR (-2) only for simulation
ZONE: it indicates the zone of which the sender node belongs.
DATA TYPE: it is the DATA TYPE that together the zone allows to identify the stream univocally.
Value: it is the value of the data. Its length depends from the DATA TYPE.
Counter: it contains the sequence number of the data that is used to check the coherence of the flow.
N
6 bits
N x 6 bits
DATA TYPE
DATA TYPE
DATA TYPE
…
Figure 27: Subscribe Message format
Cooperative Hybrid Objects Sensor Networks
Contract Number: INFSO-ICT-224327
Copyright CHOSeN Consortium
2008-2011
Control message This message is sent from CENTRAL NODE to all the nodes in
broadcast. This message is sent periodically and after a danger state condition is detected. The status network field contains the status of
the network, maintained by the central node, which must be adopted also by other nodes as soon as they can. The following fields contain
information for the actuators that must be activated in several cases with different parameters.
Network status: it contains the network state that must be
adopted by the receiving node. Actuator status: it contains the level of attention that must be
given to the driver by the actuator. Time to Collision (TTC): it contains the last time to collision
estimate done by the CENTRAL NODE Distance to Collision (DTC): it contains the last distance to
collision estimate done by the CENTRAL NODE TEXT ID: contains the code of a preset warning message
ZONE
6 bits 6 bits
Value
variable
DATA TYPE
Node Status
2 bits
Counter
6 bits
Figure 28: Data Message format

Cooperative Hybrid Objects Sensor Networks
Contract Number: INFSO-ICT-224327
Copyright CHOSeN Consortium
2008-2011
Counter: it contains the sequence number of the data that is used to check the coherence of the flow.
2.8.2 Data Fusion
Details about the automotive application scenario are
available in the confidential version of D2.2.
3 SIMULATIONS RESULTS AND PERFORMANCE
EVALUATION
The results section is separated into two parts: performance evaluation
regarding the limits of the system in terms of throughput, latency, loss, energy consumption and number of supported wireless data sources,
and application scenario feasibility in terms of performance of the implemented application scenarios regarding the requirements.
In sections 3.1 and 3.2 the results of the performance evaluation
regarding the limits of the system are shown, while Section 3.3 shows the results of the performance evaluation of the application scenarios
regarding their requirements.
3.1 CHOSeN vs. Atmel AT86RF212
In order to evaluate the performance of the CHOSeN node and to
outline typical simulation behavior, we compared the CHOSeN node
TTC
9 bits 8 bits
TEXT ID
6 bits
DTC Network Status
2 bits
Counter
6 bits
Actuator Status
2 bits
Figure 29: Control Message format

Cooperative Hybrid Objects Sensor Networks
Contract Number: INFSO-ICT-224327
Copyright CHOSeN Consortium
2008-2011
with a node that uses the Atmel AT86RF212 as its transceiver. The
Atmel212 is chosen, because this transceiver is operating in the 868 kHz band and has some low power modes available as well. Therefore
following setup is created.
Figure 30: Simulation scenario for CHOSeN vs. Atmel212
Figure 30 shows the network scenario for this comparing simulation. 20
sensor nodes are distributed over the aircraft cabin. In the middle of the aircraft the access point is located and receives all the traffic of the
nodes. Thereby the nodes are transmitting with 10dBm and it is possible for them to reach the access point with sufficient SNR to
maintain a communication according to the channel model obtained by the measurement campaign. The CHOSeN nodes have their WuRx
enabled in active listening mode and its transceiver in power down
mode. In contrast to that the Atmel212 will be duty cycled for saving energy. Thereby, within a duty cycle the transceiver is always 48 ms in
RCV mode to listen for the beacon. Following figure gives an overview of the proportion of power consumption per duty cycle. Exemplary a
cycle of 10 seconds is chosen, which leads to a maximum wake-up delay from 10 sec.

Cooperative Hybrid Objects Sensor Networks
Contract Number: INFSO-ICT-224327
Copyright CHOSeN Consortium
2008-2011
Figure 31: proportion of energy consumption per duty cycle
As shown in is that even with a duty cycle of 0.048% - 48 ms / 10 sec
– the main energy consumption is during RCV mode and, in this case one cycle yields to approximately 0.156 mJ. In both simulation
scenarios, after 12 hours of flight the access point sends a beacon to indicate to the nodes that they shall start transmitting their stored
data. For the MAC scheme a simple acked CSMA is used. The CSMA phase for a node is defined as finished, when the ack for its packet
arrives. Keep in mind, that this scenario is deliberately that simple to have a
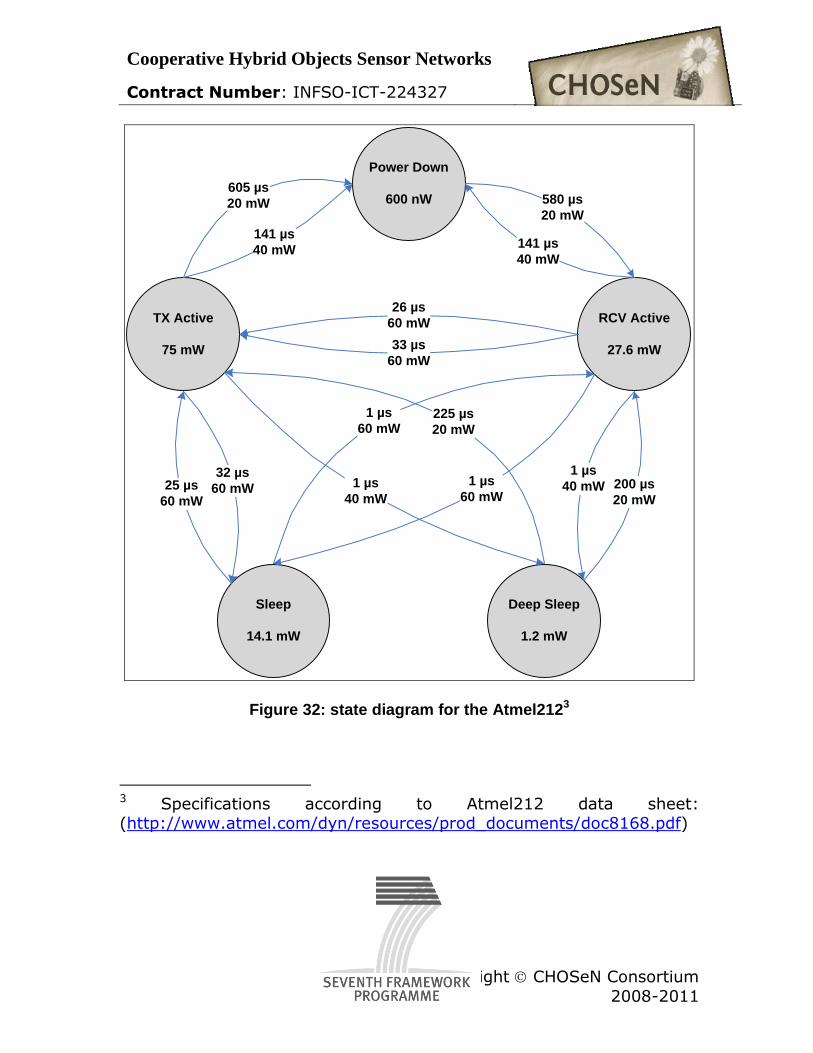
good basis to compare both nodes. Following figure show the overview
of the available power states together with their corresponding power consumption and the transition times from each state to its neighbors
for the Atmel212.
Cooperative Hybrid Objects Sensor Networks
Contract Number: INFSO-ICT-224327
Copyright CHOSeN Consortium
2008-2011
Power Down
600 nW
TX Active
75 mW
RCV Active
27.6 mW
Sleep
14.1 mW
Deep Sleep
1.2 mW
33 µs
60 mW
26 µs
60 mW
141 µs
40 mW
580 µs
20 mW
605 µs
20 mW
1 µs
40 mW32 µs
60 mW25 µs
60 mW
200 µs
20 mW
141 µs
40 mW
225 µs
20 mW
1 µs
40 mW
1 µs
60 mW
1 µs
60 mW
Figure 32: state diagram for the Atmel2123
3 Specifications according to Atmel212 data sheet: (http://www.atmel.com/dyn/resources/prod_documents/doc8168.pdf)

Cooperative Hybrid Objects Sensor Networks
Contract Number: INFSO-ICT-224327
Copyright CHOSeN Consortium
2008-2011
According to the specifications for the Atmel212 the data rate is 40
kbps contrary to the transceiver on the CHOSeN node with 50 kbps. As mentioned above all nodes start the CSMA process after 12 hours of
flight and want to transmit one packet each with a packet size of 200 bit and an ack size of 64 bit. This leads to a network load of 8% for the
CHOSeN node and 10% for the Atmel212. Due to the fact that for this
scenario it is possible for all nodes to reach the access point with a sufficient receiving power, mainly all transmission failures originate
from collisions. The reference values will be the energy consumption and the maximum
delivery delay. The following figure shows the composition of the total energy consumption for the CHOSeN node.
Figure 33: composition of energy consumption for the CHOSeN node
In
Figure 33 it can be seen, that the total energy consumption – the green line – consists of the drawn energy by the transceiver (here the new

Cooperative Hybrid Objects Sensor Networks
Contract Number: INFSO-ICT-224327
Copyright CHOSeN Consortium
2008-2011
smartTrans) and the drawn energy by the WuRx.4 The WuRx has
constant energy consumption, because it is always in active listening mode. Due to the fact, that the main transceiver is most of the time in
power down mode, its energy consumption can be even lower, than the consumption of the WuRx. As can be seen further, the switching times
between different transceiver states are important, because they are
mainly responsible for collisions. With increasing switching time the probability that the clear channel access (CCA) mechanism fails
increases as well and this leads to collisions. To illustrate this further Figure 34 shows the energy consumption
during the CSMA phase. Different to Figure 37, these values are not a system average, but they are values for one specific node out of one
simulation run. For both scenarios the “most unfortunate”5 node was chosen.
4 For ease of comparison all other sources of energy consumption are
neglected. Mainly these two sources will provide the highest consumption, anyway. 5 “most unfortunate” in the meaning of energy consumption, so the node with the highest energy consumption was chosen

Cooperative Hybrid Objects Sensor Networks
Contract Number: INFSO-ICT-224327
Copyright CHOSeN Consortium
2008-2011
Figure 34: energy consumption during CSMA for “most unfortunate” nodes
The graphs are normalized at the beginning of the CSMA phase, so
both start at time zero with zero energy consumption. As can be seen, after start of the CSMA phase the graph for the Atmel212 ends earlier
than the graph for the CHOSeN node. Because of the longer switching times of the transceiver used in the CHOSeN nodes there are more
collisions in the system. From this it follows that more retransmissions are needed and the whole CSMA phase gets longer.

Cooperative Hybrid Objects Sensor Networks
Contract Number: INFSO-ICT-224327
Copyright CHOSeN Consortium
2008-2011
Figure 35: total length of CSMA phase
Figure 35 shows the total time it takes to send all packets to the access
point. It can be seen, that despite the 20% lower bitrate of the Atmel212 roughly 6.8% of the time is needed to transmit all packets.
As already mentioned this is mainly due to the higher collision probability when the rx/tx switching time is higher.
This fact can be seen in Figure 36 as well, which shows the energy
consumption values for the CSMA phase. Each large peak corresponds with the (re)transmitting of the packet. From this follows directly that
in this case the Atmel212 needed two (re)transmissions and the
CHOSeN node needed lots more. Again these graphs are taken out of a single simulation run and therefore are not representative - they are
shown only for clarification. Additionally CSMA might not be a good solution for this scenario, but is chosen due to its simplicity for
comparison purposes only.

Cooperative Hybrid Objects Sensor Networks
Contract Number: INFSO-ICT-224327
Copyright CHOSeN Consortium
2008-2011
Figure 36: energy consumption values for "most unfortunate" nodes during CSMA
Figure 37 shows now the total energy consumption per node – in the
case of the Atmel a duty cycle of 0.48% is chosen. The graph for the CHOSeN node is a system average. So it’s the energy consumption for
the whole system divided by the number of nodes within the system.

Cooperative Hybrid Objects Sensor Networks
Contract Number: INFSO-ICT-224327
Copyright CHOSeN Consortium
2008-2011
Figure 37: total energy consumption per node - system average
The CHOSeN node has a lower energy consumption comparing to the Atmel212, after 12 h the difference is about 516 mJ.
To have a better feeling for the impact of the duty cycling Figure 38 shows the consumed energy against the delay which is introduced by
the wake-up process – either the WuRx or the duty cycling.
Figure 38: energy consumption after 12 h against wake-up delay

Cooperative Hybrid Objects Sensor Networks
Contract Number: INFSO-ICT-224327
Copyright CHOSeN Consortium
2008-2011
It can be seen, that the CHOSeN node outperforms the duty cycled
Atmel212 system by far.
3.2 Performance WorMAC versus X-MAC
The performance of WoR-MAC was evaluated using the following
metrics as a function of the number of nodes in the network:
Packet Success Ratio The packet success ratio is defined as the number of packets recognized by the receiver on the sink node, divided
by the number of packets sent by all nodes in the cluster. The main reason for lost packets is collisions on the channel and noise resulting
in bit errors during transmission. Transmission Delay We define transmission delay as the time
between the start of the communication period until the packet is
received at the sink. This excludes the time, where the packet is stored during the flight and only accounts for the delay added by the protocol.
The values shown here are the averages of all packets during a single simulation run with a fixed number of nodes and a specific protocol.
Energy Consumption The energy consumption represents the electrical energy spent by each node during the complete simulated
time. Only the power consumed by the transceiver is considered, since the utilization of the other parts of the sensor node is nearly
identical for all protocols.
3.2.1 Delay

Cooperative Hybrid Objects Sensor Networks
Contract Number: INFSO-ICT-224327
Copyright CHOSeN Consortium
2008-2011
Figure 39: Average Latency with Respect to the Number of Nodes
Figure 39 shows the results of the simulation with respect to packet
latency caused by the protocols examined. As indicated by the figure, TDMA and CSMA-CA consistently incurred the lowest latency. Similarly,

Cooperative Hybrid Objects Sensor Networks
Contract Number: INFSO-ICT-224327
Copyright CHOSeN Consortium
2008-2011
WoR-CSMA and WoR-TDMA also performed similarly respectively,
maintaining a certain positive latency offset but maintaining the general slope characteristics of the standard protocols. X-MAC on the
other hand, performed significantly worse than the other two protocols, with 700 milliseconds of latency for only 5 nodes in the
cluster, up to over 6 seconds for large numbers of nodes. This value
scaled linearly with respect to the number of nodes in the cluster.
3.2.2 Packet Loss
Figure 40: Packet Loss with Respect to the Number of Nodes
Figure 40 indicates that the values indicated for latency are valid for comparison as the effective packet loss, meaning packets which are not
(eventually) delivered to the sink is close to zero for all protocols. These values oscillated between 0% and values less than 0.4% which
can be attributed to timing and channel anomalies in the simulator.
3.2.3 Energy Consumption

Cooperative Hybrid Objects Sensor Networks
Contract Number: INFSO-ICT-224327
Copyright CHOSeN Consortium
2008-2011
Figure 41: Average Energy Consumed with Respect to the Number of Nodes
When observing energy consumption for the scenario, CSMA-CA
maintained a constant power consumption of approximately 11440 mW per node, regardless of how many nodes are in the cluster.

Cooperative Hybrid Objects Sensor Networks
Contract Number: INFSO-ICT-224327
Copyright CHOSeN Consortium
2008-2011
The cause of this is simple, since CSMA-CA is not capable of duty-
cycling or receiving remote wake-ups, all nodes must remain in listen-mode on the channel for the BCA during the entire flight. As a result,
since the costs for receiving and transmitting data are similar, the amount of energy consumed by a node is not dependent on how
many other nodes are in the communication cluster. Similarly to
CSMA-CA, nodes running TDMA must also remain in receive mode constantly as there is no mechanism to duty-cycle while waiting
for the beacon. The consumption for TDMA is constant around 12056 mW per node, which is slightly higher than CSMA-CA due to
the fact that the nodes remain in transmit throughout the duration of their slot period.
X-MAC on the other hand has a far lower energy consumption as each node is awakened asynchronously, transmits its data without
contention, and then returns to sleep mode until after the next flight. This consumption behavior is also independent of the number of
nodes in the cluster, as each node is able to sleep until it is up to communicate, after which it returns to sleep. Figure 41 compares the
protocols in terms of energy consumption, and then adjusts the scale to detail the three duty-cycled protocols.
WoR-TDMA performs only slightly worse, with an average consumption
per node of only 1.2% more than X-MAC for 85 nodes. WoR-CSMA is only slightly worse, climbing linearly to 3.4% greater than that of X-
MAC for 85 nodes. It is also interesting to note that both WoR-CSMA and WoR-TDMA consume 0.8% and 0.9% less energy
respectively for small amounts of nodes when compared to X-MAC, and WoR-TDMA consumes 0.1% less than X-MAC for 15 nodes.
Unlike X-MAC, the consumption of WoR-CSMA and WoR-TDMA is dependent on the number of nodes in the network. This is due to
contention during the communication period for one, and the energy required to collaboratively optimizing the contention period using the
parameterized ACKs.
3.3 Application scenarios

Cooperative Hybrid Objects Sensor Networks
Contract Number: INFSO-ICT-224327
Copyright CHOSeN Consortium
2008-2011
3.3.1 Aeronautic application scenario
In order to confirm the applicability of the novel protocols for the aeronautic scenario, the DSID scenario was simulated.
Figure 42: Topology for the Aeronautic DSID Scenario
The topology used for the evaluation is the Door Surrounding Impact Detection (DSID) scenario, which was selected because it is the most
stringent in terms of its requirements. The topology used simulates many wireless acceleration sensors placed around an aircraft door as
can be seen in Figure 42. For this scenario 2 hour flights were repeatedly simulated, where each node repeatedly generated a packet
containing acceleration data every 10 minutes. After the two hours, a taxying period of 10 minutes was simulated during which the nodes
were woken and allowed to communicate. During this period, the
latency, packet loss and power consumption of each node was monitored.

Cooperative Hybrid Objects Sensor Networks
Contract Number: INFSO-ICT-224327
Copyright CHOSeN Consortium
2008-2011
Figure 43: WoR-MAC/CSMA-CA and /TDMA Simulations for DSID
The results of the simulation can be seen in Figure 43. The first graph
shows the average delay over all nodes and all flights for WoR-MAC with embedded CSMA-CA (WoR-CSMA) as compared to WoR-MAC with
embedded TDMA (WoR-TDMA). The results indicate that WoR-TDMA achieves far better latencies which are much more scalable than WoR-
CSMA. This is due to the fact that WoR-TDMA avoids the complications which come with clear channel assessment and avoids packet collisions
all together.

Cooperative Hybrid Objects Sensor Networks
Contract Number: INFSO-ICT-224327
Copyright CHOSeN Consortium
2008-2011
Figure 44: Packet Loss over the Number of Nodes
For these same reasons, the power graph in Figure 43 shows that TDMA incurs slightly lower power consumption than CSMA. Figure 44
indicates the number of packets lost by each of the protocols with respect to the number of nodes, once again showing that WoR-TDMA is
advantageous. Since TDMA is a collision free protocol, loss is due to the dynamic channel as modeled in the simulator. For CSMA on the
other hand, collision may occur when two nodes transmit synchronously, incurring retries and back-offs, and therefore greater
latency and power consumption. Packet loss for CSMA then implies that the maximum number of back-offs has been reached, which is
inefficient.

Cooperative Hybrid Objects Sensor Networks
Contract Number: INFSO-ICT-224327
Copyright CHOSeN Consortium
2008-2011
3.3.2 Automotive application scenario
Details about the automotive application scenario are
available in the confidential version of D2.2.

Cooperative Hybrid Objects Sensor Networks
Contract Number: INFSO-ICT-224327
Copyright CHOSeN Consortium
2008-2011
4 CONCLUSIONS
The common simulation framework has been set-up and all contributing partners have a common understanding of the architecture
and the components implementation. The distributed development and
implementation of the single components is coordinated by means of a common SVN repository.
The channel models are obtained from the measurement campaigns
and implemented in the simulation. The models of the network nodes are defined and implemented as well as their components. The
components are modeled according to the hardware data sheets in order to provide realistic state transition timing and energy
consumption. Models of the communication protocols have been implemented namely the newly developed MAC protocols WoR-MAC
and BP-MAC, and the state-of-the-art protocols X-MAC and IEEE 802.15.4 MAC for comparison.
This enables us to assess the performance of the developed hardware
components and communication protocols under realistic environment
conditions, so that the risk for the application prototype development is minimized.
Performance evaluation and comparison as well as application scenario
feasibility simulations were performed and show that the CHOSeN node outperforms state-of-the-art sensor nodes in terms of power
consumption in relation to achievable latency and throughput. The developed MAC protocols outperform standard MACs (802.15.4, X-
MAC) in the relevant application scenarios. The application scenarios feasibility analysis showed that the CHOSeN hard- and software is well
fitted in terms of the defined requirements.