choosing a probability distribution - charles yoe
TRANSCRIPT

US Army Corps of EngineersBUILDING STRONG®
Choosing a Probability DistributionCharles YoeProfessor of Economics, Notre Dame of Maryland University
Huntington District
March, 2015
BUILDING STRONG®
Learning Objectives
At the end of this session participants will be able to: Systematically identify the best
distribution to use for a single uncertain variable
BUILDING STRONG®
RISK = CONSEQUENCE X PROBABILITY
Quantitative risk assessment requires you to use probability
BUILDING STRONG®
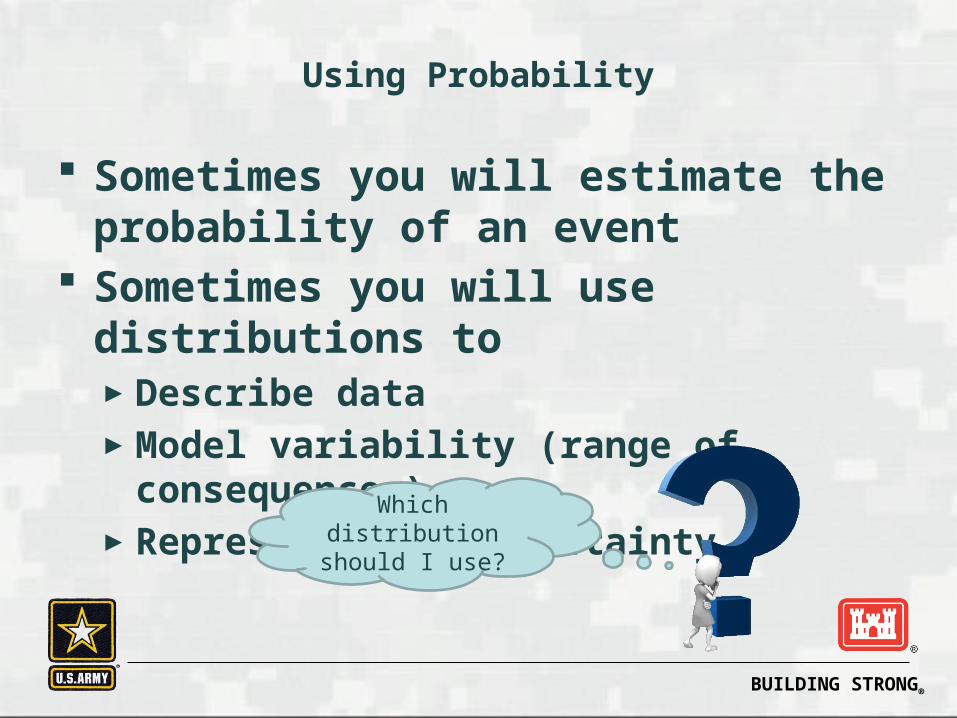
Using Probability
Sometimes you will estimate the probability of an event
Sometimes you will use distributions to►Describe data►Model variability (range of consequences)►Represent your uncertainty
Which distribution should I use?

BUILDING STRONG®
Basic Distinctions
Constant Variables
• Some things vary predictably• Some things vary unpredictably
Random variables• It can be something known but not
known by us

BUILDING STRONG®
A probability distribution issimply a list or picture of allpossible outcomes and theircorresponding probabilities

BUILDING STRONG®
When the outcomes arecontinuous, like lockage times, then the notion of probability takes on somesubtleties.

BUILDING STRONG®
Probability Mass Functionwhen sample space consistsof discrete outcomes, numberof tainter gate failures this year,we can talk about the probabilityof each outcome.

BUILDING STRONG®
Probability Density FunctionFor continuous outcomespaces, we can “discretize”the space into a finite setof mutually exclusive andexhaustive “bins”. We can divide lockage times intointervals: 0-50, >50-100, >100-103.7 and so on.
BUILDING STRONG®
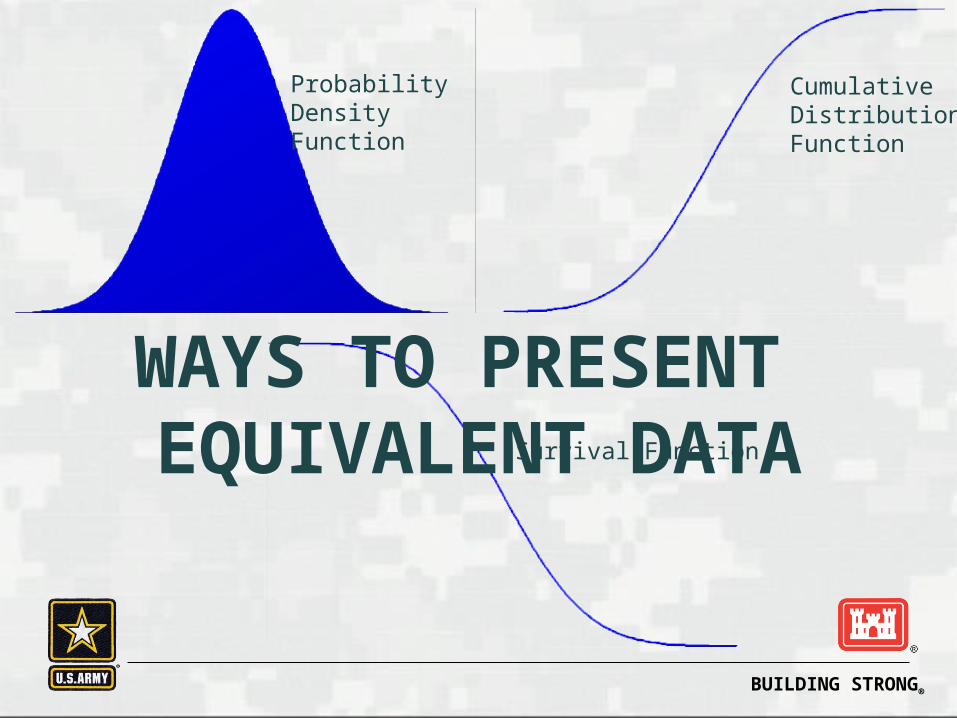
ProbabilityDensityFunction
CumulativeDistributionFunction
Survival Function
WAYS TO PRESENT EQUIVALENT DATA

BUILDING STRONG®
-20
24
68
1012
0.00
0.05
0.10
0.15
0.20
0.25
This measures the x variable value
This measures p(x), for a discrete variablethis is the probability of a corresponding x

BUILDING STRONG®
7580
8590
9510
010
511
011
512
012
5
0.000
0.005
0.010
0.015
0.020
0.025
0.030
0.035
0.040
This measures the x variable value
This measures p(x), for a continuous variablethis is density and not the probability of x
BUILDING STRONG®
7580
8590
9510
010
511
011
512
012
5
0.000
0.005
0.010
0.015
0.020
0.025
0.030
0.035
0.040
99.7
599
.80
99.8
599
.90
99.9
510
0.00
100.
0510
0.10
100.
1510
0.20
100.
25
0.0
0.5
1.0
1.5
2.0
2.5
3.0
3.5
4.0
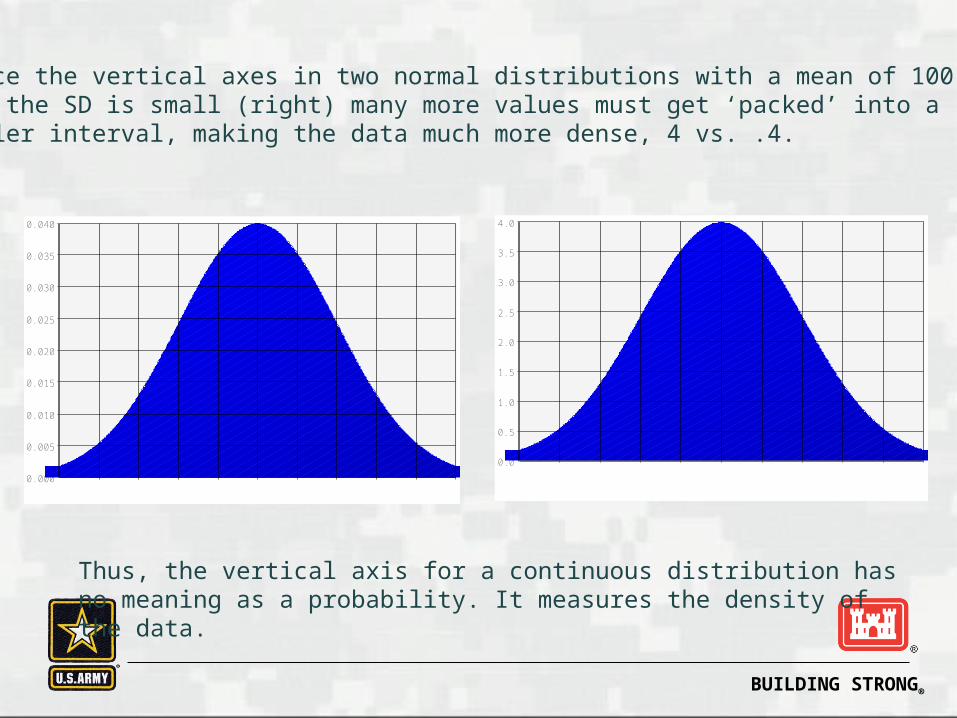
Notice the vertical axes in two normal distributions with a mean of 100.When the SD is small (right) many more values must get ‘packed’ into a smaller interval, making the data much more dense, 4 vs. .4.
Thus, the vertical axis for a continuous distribution has no meaning as a probability. It measures the density of the data.

BUILDING STRONG®
Applying the Principles How many probability distributions can
we name without help?
BUILDING STRONG®
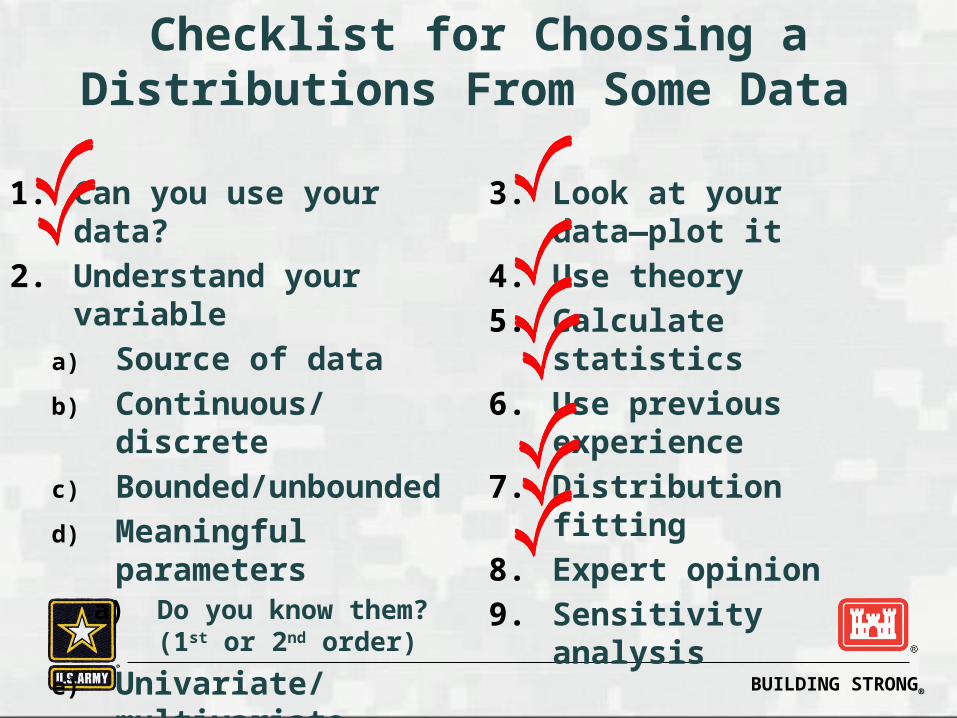
Checklist for Choosing a Distributions From Some Data
1. Can you use your data?2. Understand your variable
a) Source of datab) Continuous/discretec) Bounded/unboundedd) Meaningful
parametersa) Do you know them? (1st
or 2nd order)e) Univariate/multivariate
3. Look at your data—plot it
4. Use theory 5. Calculate statistics6. Use previous
experience7. Distribution fitting8. Expert opinion9. Sensitivity analysis
BUILDING STRONG®
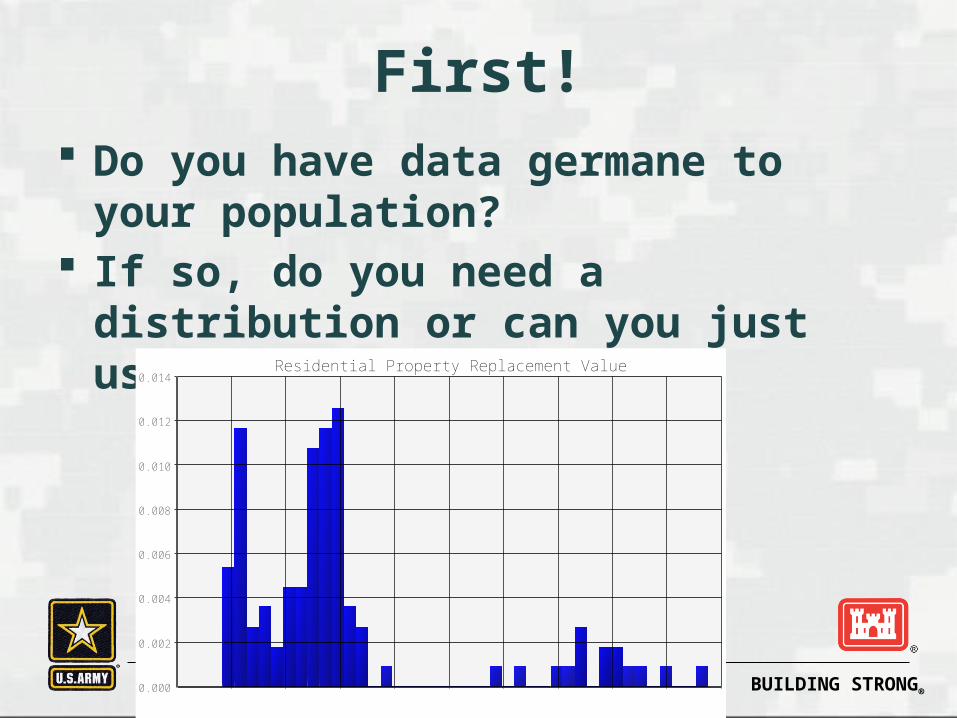
First! Do you have data germane to your
population? If so, do you need a distribution or can
you just use your data?
050
100
150
200
250
300
350
400
450
500
0.000
0.002
0.004
0.006
0.008
0.010
0.012
0.014Residential Property Replacement Value
BUILDING STRONG®
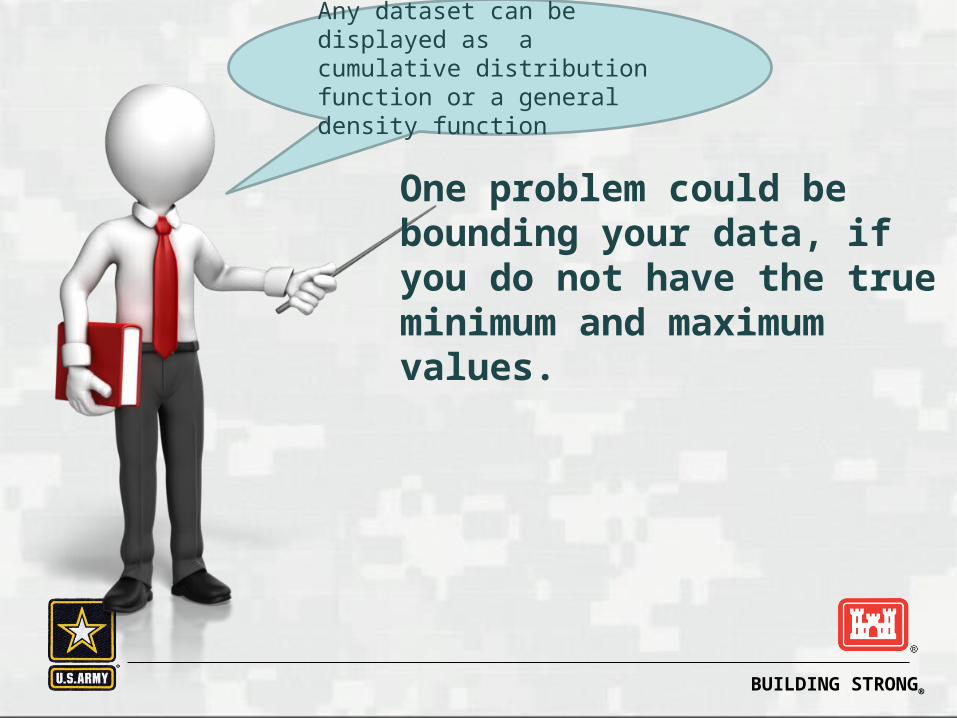
One problem could be bounding your data, ifyou do not have the true minimum and maximumvalues.
Any dataset can be displayed as a cumulative distribution function or a general density function

BUILDING STRONG®
Display Either Way
050
100
150
200
250
300
350
400
450
500
0.0
0.2
0.4
0.6
0.8
1.0Residential Property Replacement Value
050
100
150
200
250
300
350
400
450
500
0.000
0.002
0.004
0.006
0.008
0.010
0.012
0.014Residential Property Replacement Value

BUILDING STRONG®19
Applying the Principles Go to @RISK What are advantages of PDF? CDF?
BUILDING STRONG®
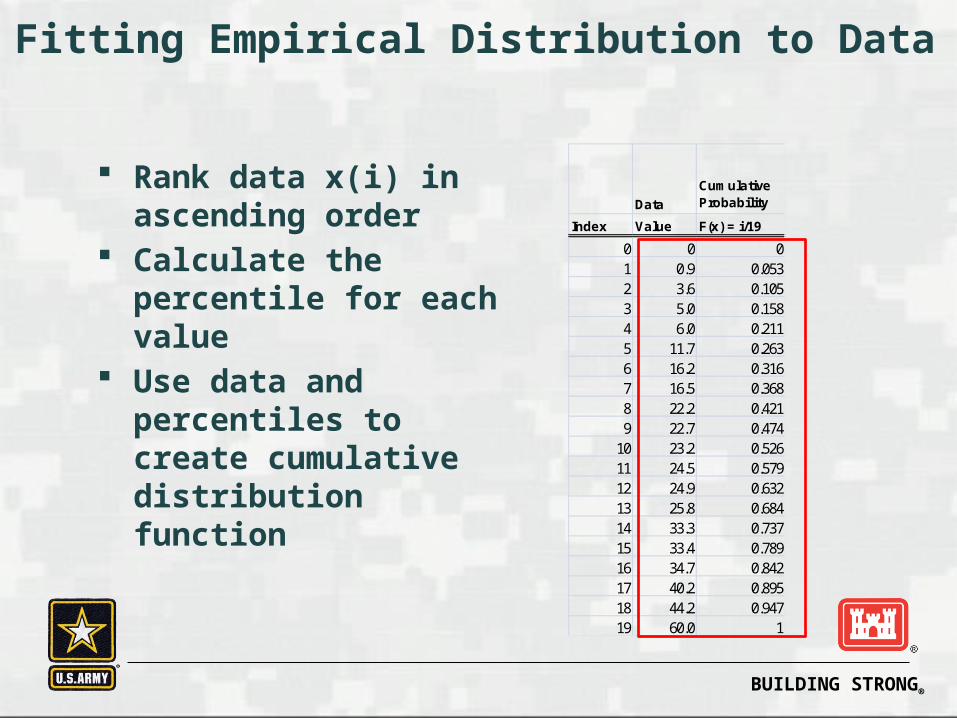
Fitting Empirical Distribution to Data
Rank data x(i) in ascending order
Calculate the percentile for each value
Use data and percentiles to create cumulative distribution function
DataCumulative Probability
Index Value F(x) = i/190 0 01 0.9 0.0532 3.6 0.1053 5.0 0.1584 6.0 0.2115 11.7 0.2636 16.2 0.3167 16.5 0.3688 22.2 0.4219 22.7 0.474
10 23.2 0.52611 24.5 0.57912 24.9 0.63213 25.8 0.68414 33.3 0.73715 33.4 0.78916 34.7 0.84217 40.2 0.89518 44.2 0.94719 60.0 1

BUILDING STRONG®
For Thursday Everybody Buy M&M’s at UC Davis Store 1.69 oz bag of Milk Chocolate M&M’s

BUILDING STRONG®
When You Can’t Use Your Data
Given wide variety of distributions it is not always easy to select the most appropriate one

BUILDING STRONG®
Does Distribution Matter? Wrong assumption => Incorrect results=> Poor decisions=> Undesirable outcomes

BUILDING STRONG®
Understand Your Data
►Experiments►Observation►Surveys►Computer databases►Literature searches►Simulations►Test case
Where did my data come
from?

BUILDING STRONG®
►Discrete variables take one of a set of identifiable values, you can calculate its probability of occurrence
►Continuous distributions- a variable that can take any value within a defined range, you can’t calculate the probability of a single value
Is my variable discrete or
continuous?

BUILDING STRONG®
Barges in a tow
Houses in floodplain
People at a meeting
Results of a diagnostic test
Casualties per year
Relocations and acquisitions
Average number of barges per towWeight of an adult striped bass
Sensitivity or specificity of a diagnostic test
Transit time
Expected annual damages
Duration of a storm
Shoreline eroded
Sediment loads
BUILDING STRONG®
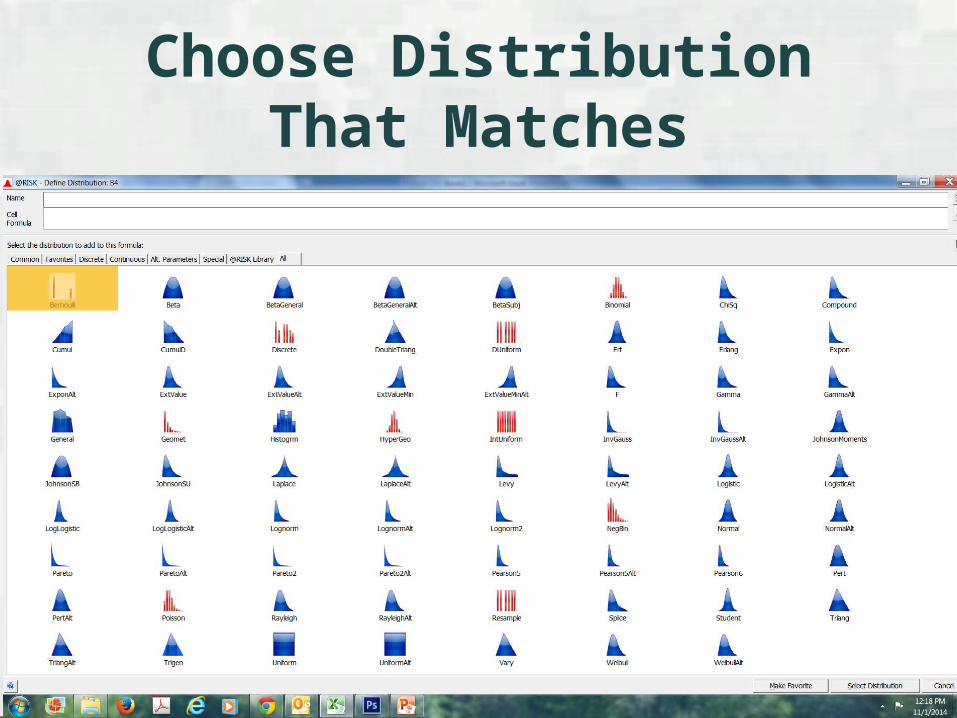
Choose Distribution That Matches

BUILDING STRONG®
What Values Are Possible?
►Bounded-value confined to lie between two determined values
►Unbounded-value theoretically extends from minus infinity to plus infinity
►Partially bounded-constrained at one end (truncated distributions)
Is my variable bounded or unbounded?
BUILDING STRONG®
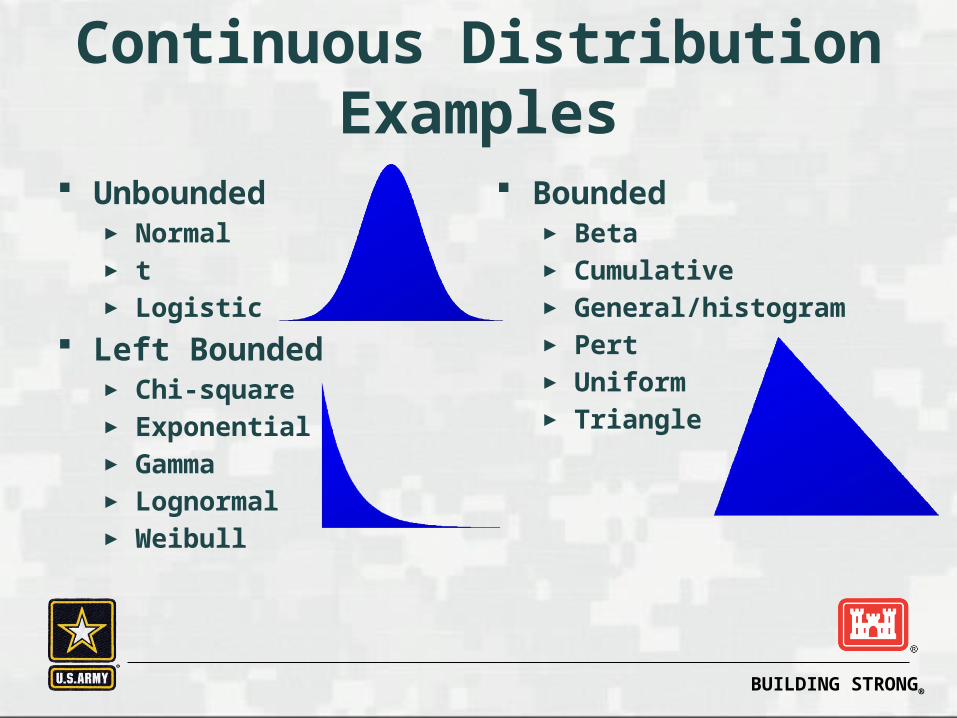
Continuous Distribution Examples
Unbounded► Normal► t► Logistic
Left Bounded► Chi-square► Exponential► Gamma► Lognormal► Weibull
Bounded► Beta► Cumulative► General/histogram► Pert ► Uniform► Triangle

BUILDING STRONG®
Discrete Distribution Examples
Unbounded► None
Left Bounded► Poisson► Negative binomial► Geometric
Bounded► Binomial► Hypergeometric► Discrete► Discrete Uniform

BUILDING STRONG®
Are There Parameters
►Parametric--shape is determined by mathematics of a conceptual probability model
►Non-parametric—empirical distributions whose mathematics is defined by the shape required
Does my variable have meaningful
parameters?
BUILDING STRONG®
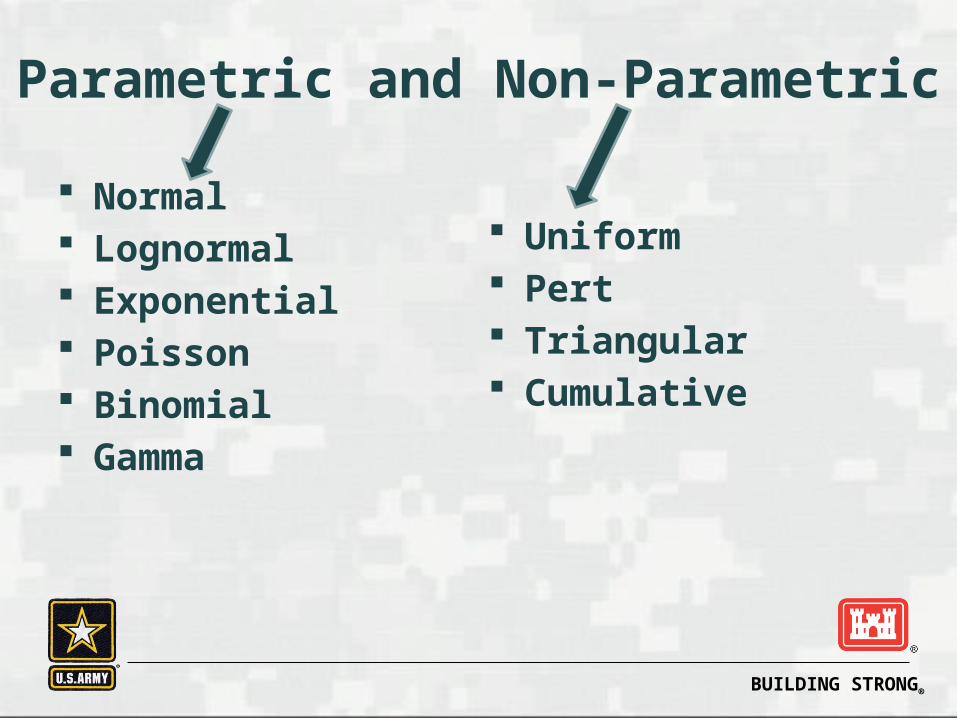
Parametric and Non-Parametric
Normal Lognormal Exponential Poisson Binomial Gamma
Uniform Pert Triangular Cumulative

BUILDING STRONG®
Do You Know the Parameters?
1st order distribution- known parameters►Risknormal(100,10)
2nd order distribution- uncertain parameters► Risknormal(risktriang(90,100,10
3),riskuniform(8,11))
Do I know the parameters?
BUILDING STRONG®
Choose a parametric distribution under these circumstances
Theory supports choice Distribution proven accurate
for modelling your specific variable
Distribution matches observed data well
Need distribution with tail extending beyond the observed minimum or maximum

BUILDING STRONG®
Choose a nonparametric distribution under these circumstances
Theory is lacking There is no commonly used
model Data are severely limited Knowledge is limited to general
beliefs and some evidence
BUILDING STRONG®
Is It Dependent on Other Variables?
►Univariate--not probabilistically linked to any other variable in the model
►Multivariate--are probabilistically linked in some way
►Engineering relationships are often multivariate
Do the values of my variable depend
on the values of other variables?

BUILDING STRONG®
Distribution TypeNo Bounds
Bounded Left & Right
Left Bound Only Category Shape
Empirical Distribution
Beta Continuous No Yes No Non-parametric Shape shifter No
Binomial Discrete No Yes No Parametric Some Flexibility No
Chi Squared Continuous No No Yes Parametric Basic Shape No
Cumulative ascending Continuous No Yes No Non-parametric Shape shifter Yes
Cumulative descending Continuous No Yes No Non-parametric Shape shifter Yes
Discrete Discrete No Yes No Non-parametric Shape shifter Yes
Discrete uniform Discrete No Yes No Non-parametric Basic Shape No
Erlang Continuous No No Yes Parametric Basic Shape No
Error Continuous Yes No No Parametric Some Flexibility No
Exponential Continuous No No Yes Parametric Basic Shape No
Extreme value Continuous No No Yes Parametric Basic Shape No
Gamma Continuous No No Yes Parametric Shape shifter No
General Continuous No Yes No Non-parametric Shape shifter Yes
Geometric Discrete No No Yes Parametric Some Flexibility No
Histogram Continuous No Yes No Non-parametric Shape shifter Yes
Hypergeometric Discrete No Yes No Parametric Some Flexibility No
Integer uniform Discrete No Yes No Non-parametric Basic Shape No
Inverse Gaussian Continuous No No Yes Parametric Basic Shape No
Logarithmic Discrete No No Yes Parametric Some Flexibility No
Logistic Continuous Yes No No Parametric Basic Shape No
Lognormal Continuous No No Yes Parametric Basic Shape No
Lognormal2 Continuous No No Yes Parametric Basic Shape No
Negative Binomial Discrete No No Yes Parametric Some Flexibility No
Normal Continuous Yes No No Parametric Basic Shape No
Pareto Continuous No No Yes Parametric Basic Shape No
Pareto2 Continuous No No Yes Parametric Basic Shape No
Pearson V Continuous No No Yes Parametric Some Flexibility No
Pearson VI Continuous No No Yes Parametric Some Flexibility No
PERT Continuous No Yes No Non-parametric Shape shifter No
Poisson Discrete No No Yes Parametric Basic Shape No
Rayleigh Continuous No No Yes Parametric Basic Shape No
Student Continuous Yes No No Parametric Basic Shape No
Triangle (various) Continuous No Yes No Non-parametric Some Flexibility No
Weibull Continuous No No Yes Parametric Shape shifter No
How can I make this table legible?

BUILDING STRONG®
Always plot your data.
Don’t just calculate Mean & SD and assume its normal
BUILDING STRONG®
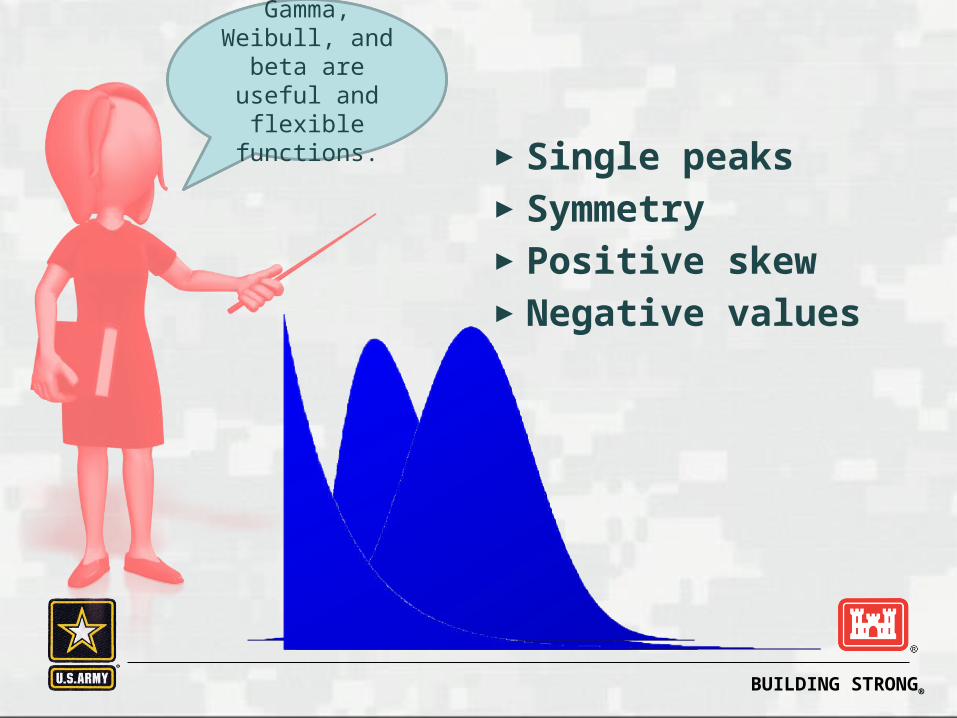
Look for distinctive
shapes and features of your
data. ►Single peaks►Symmetry►Positive skew►Negative values
Gamma, Weibull, and
beta are useful and flexible functions.

BUILDING STRONG®
►Low coefficient of variation & mean = median => Normal►Positive skew & mean =standard deviation =>Exponential►Consider outliers
Try calculating some statistics to get a feel.

BUILDING STRONG®
Formal theory, e.g., CLT Theoretical knowledge of
the variable►Behavior or math
Informal theory►Sums normal,
products lognormal►Study specific►Your best documented
thoughts on subject
Theory is your most compelling reason for
choosing a distribution.
BUILDING STRONG®
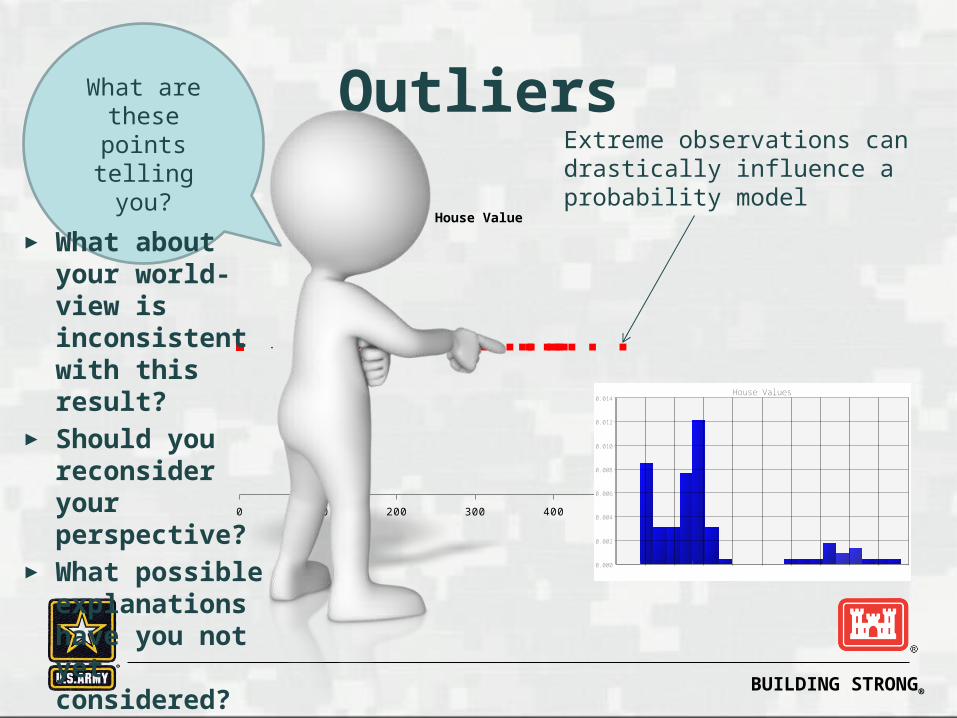
Outliers
0 100 200 300 400 500 600
House Value
Extreme observations can drastically influence a probability model
What are these points telling you?
050
100
150
200
250
300
350
400
450
500
0.000
0.002
0.004
0.006
0.008
0.010
0.012
0.014House Values
► What about your world-view is inconsistent with this result?
► Should you reconsider your perspective?
► What possible explanations have you not yet considered?

BUILDING STRONG®
If observation is an error, remove it.
Your explanation mustbe correct, not justplausible.
If you must keep it and can’t explain it, just live with the results.

BUILDING STRONG®
Previous Experience
Have I dealtwith this before?
What did other riskassessments use?
What does theLiterature reveal?

BUILDING STRONG®
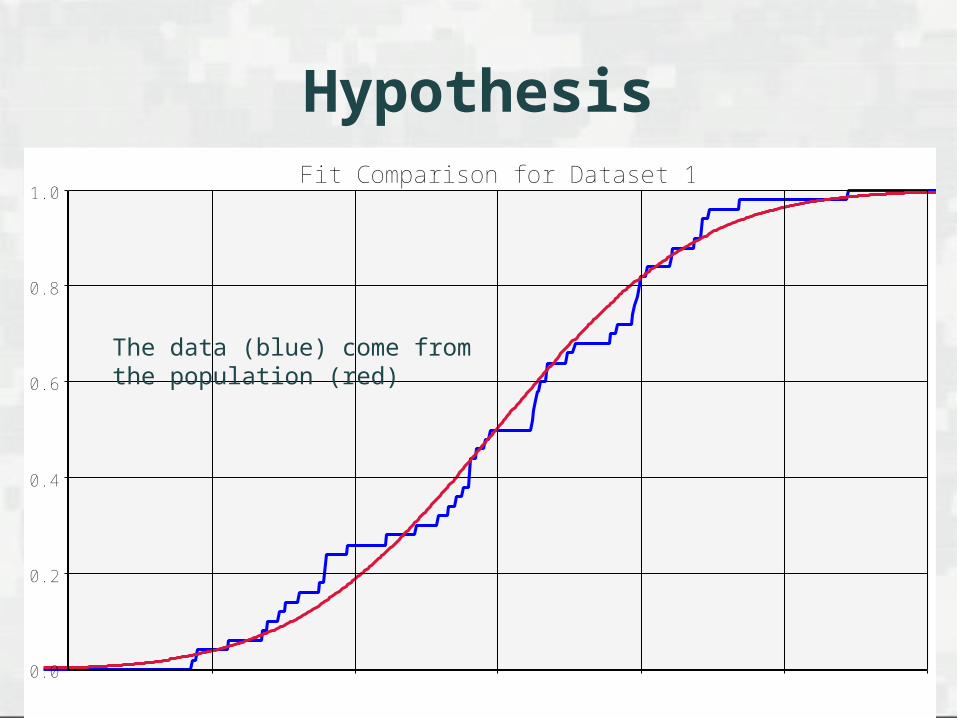
Goodness of Fit Provides statistical evidence to test
hypothesis that your data could have come from a specific distribution
H0 these data come from an “x” distribution
Small test statistic and large p mean accept H0
It is another piece of evidence not a determining factor
Geek slide warning
BUILDING STRONG®
7080
9010
011
012
013
0
0.0
0.2
0.4
0.6
0.8
1.0Fit Comparison for Dataset 1
Hypothesis
The data (blue) come from the population (red)

BUILDING STRONG®
GOF Tests
Akaike Information Criterion (AIC)
Bayesian Information Criterion (BIC) Chi-Square Test Kolomogorov-Smirnov
Test Andersen-Darling Test
Geek slide warning
Better fit for means than tails
Better fit at extreme tails of distribution
Better fit for means than tails
Use AIC or BIC unless you have reason not to

BUILDING STRONG®
►Data never collected►Data too expensive or
impossible►Past data irrelevant►Opinion needed to fill
holes in sparse data►New area of inquiry,
unique situation that never existed
Why use an expert?
BUILDING STRONG®
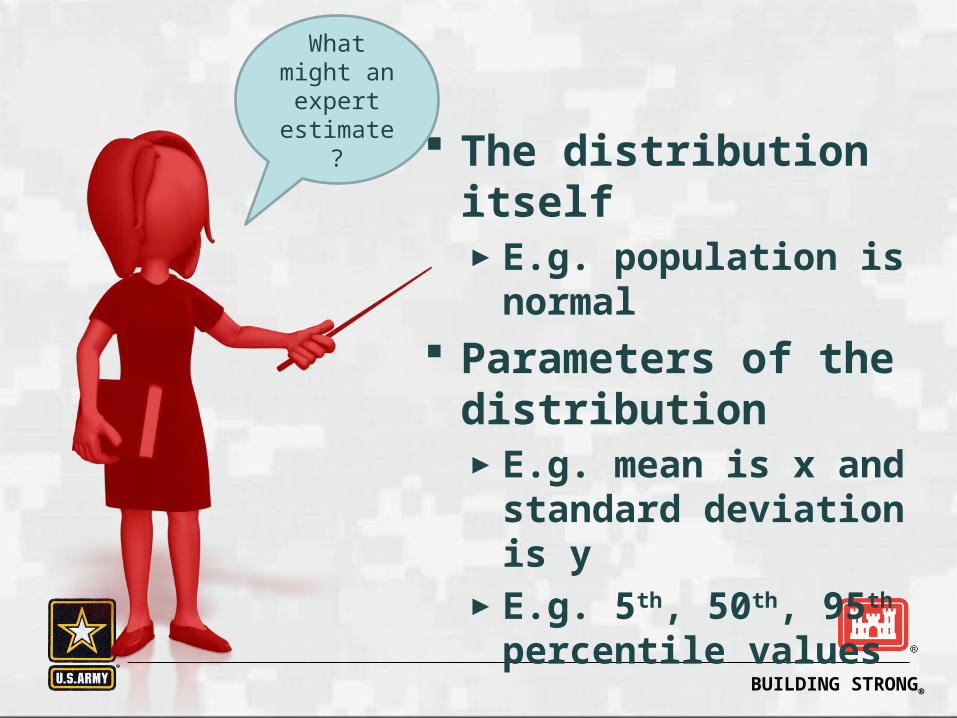
The distribution itself►E.g. population is
normal Parameters of the
distribution►E.g. mean is x and
standard deviation is y►E.g. 5th, 50th, 95th
percentile values
What might an expertestimate?
BUILDING STRONG®
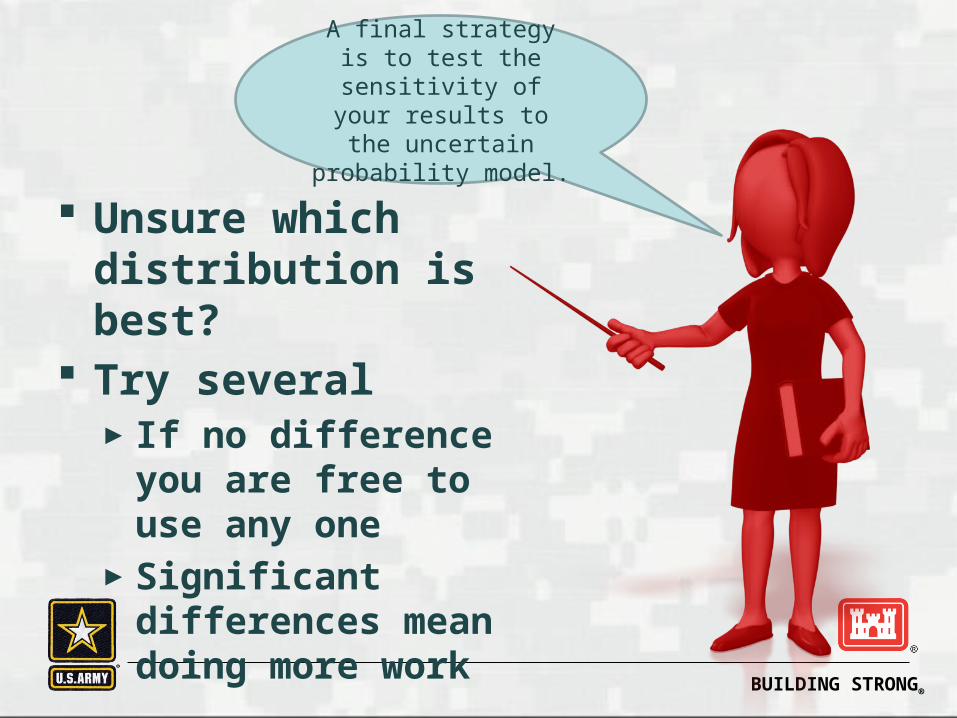
Unsure which distribution is best?
Try several►If no difference you
are free to use any one
►Significant differences mean doing more work
A final strategy is to test the sensitivity of your
results to the uncertain probability model.

BUILDING STRONG®51
Applying the Principles Do exercise

BUILDING STRONG®
Example
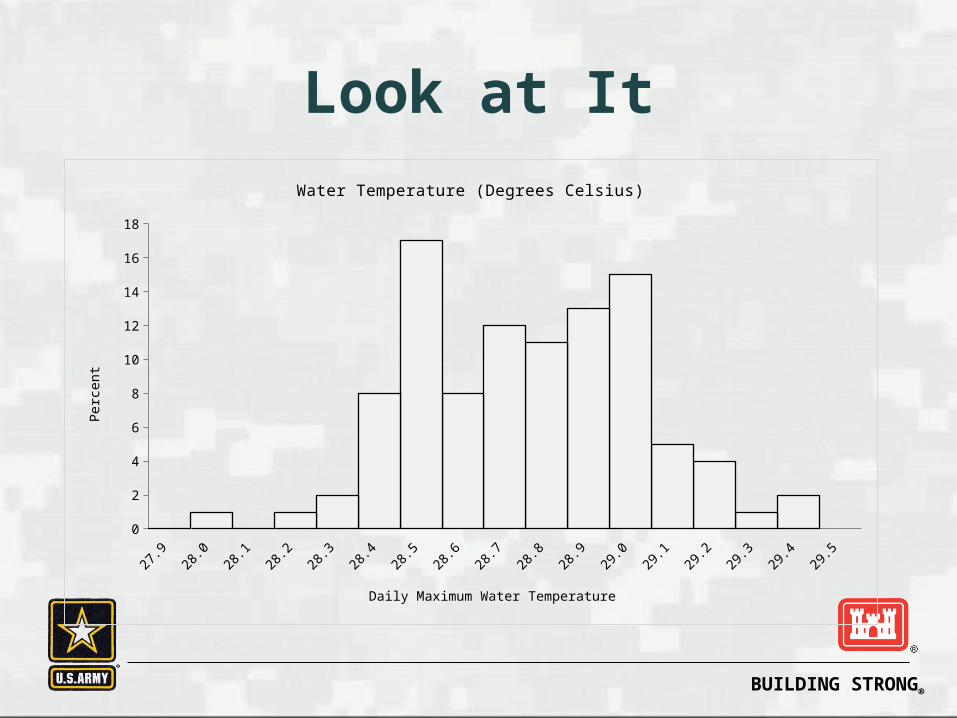
28.1 28.3 29.0 28.8 29.1 28.8 28.9 28.7 28.5 28.8 28.328.6 29.1 28.9 28.7 29.3 28.9 29.4 29.4 28.8 29.5 28.529.0 28.6 28.7 29.1 29.1 28.6 28.6 28.8 29.2 29.2 28.429.5 28.9 28.9 28.9 28.7 28.3 28.7 28.9 28.4 28.7 29.229.2 29.7 29.1 29.2 28.5 28.9 28.6 28.7 28.5 28.5 29.128.8 28.2 28.6 28.9 29.5 28.9 29.0 29.1 28.8 29.2 28.729.3 28.7 28.8 29.1 29.4 29.0 29.2 28.8 28.5 29.0 29.329.1 29.0 28.6 28.6 29.5 29.5 28.8 29.6 29.0 29.5 28.728.9 28.2 29.2 29.0 28.7 28.9 28.6 28.5 29.6 29.6 28.328.7 29.0 29.0 29.3 28.5 28.9 28.4 28.7 28.9 28.9 29.0
Summer Water Temperature in Degrees Celsius

BUILDING STRONG®
Know Your Data
Data are continuous. Practical minimum and maximum temperatures for these
coastal waters during the summer are indefinite. Fuzzy bounds mean you can treat quantity as unbounded over a limited range of the number line.
Choose a normal (parametric) distribution because some theory supports choice, distribution matches the observed data well, and distribution has a tail extending beyond the observed minimum and maximum. That information will be revealed in subsequent steps.
Parameters estimates mean a first order distribution. Univariate.
BUILDING STRONG®
Look at It
27.9
28.0
28.1
28.2
28.3
28.4
28.5
28.6
28.7
28.8
28.9
29.0
29.1
29.2
29.3
29.4
29.5
0
2
4
6
8
10
12
14
16
18
Water Temperature (Degrees Celsius)
Daily Maximum Water Temperature
Per
cent

BUILDING STRONG®
Look Again!
27.8 28 28.2 28.4 28.6 28.8 29 29.2 29.4 29.6
Water Temperature Boxplot
Daily Maximum Water Temperature
The boxplot confirms a slight skew to the left in the sample data and in the interquartile range.

BUILDING STRONG®
Theory
The “system” that produces a daily maximum temperature is complex enough and random enough that we believe deviations about the mean are likely to be symmetrical.

BUILDING STRONG®
Statistics
Descriptive statistics
Count 100 Mean 28.8 Median 28.8 Sample standard deviation 0.3 Minimum 28.1 Maximum 29.5 Range 1.4 Standard error of the mean 0.027 Confidence interval 95.% lower 28.7 Confidence interval 95.% upper 28.9 Coefficient of variation 0.9
Daily Maximum Water Temperature
Mean and median are approximately equal
Coefficient of variation (0 to 100+ scale) is small.
There are no outliers in this dataset.
BUILDING STRONG®
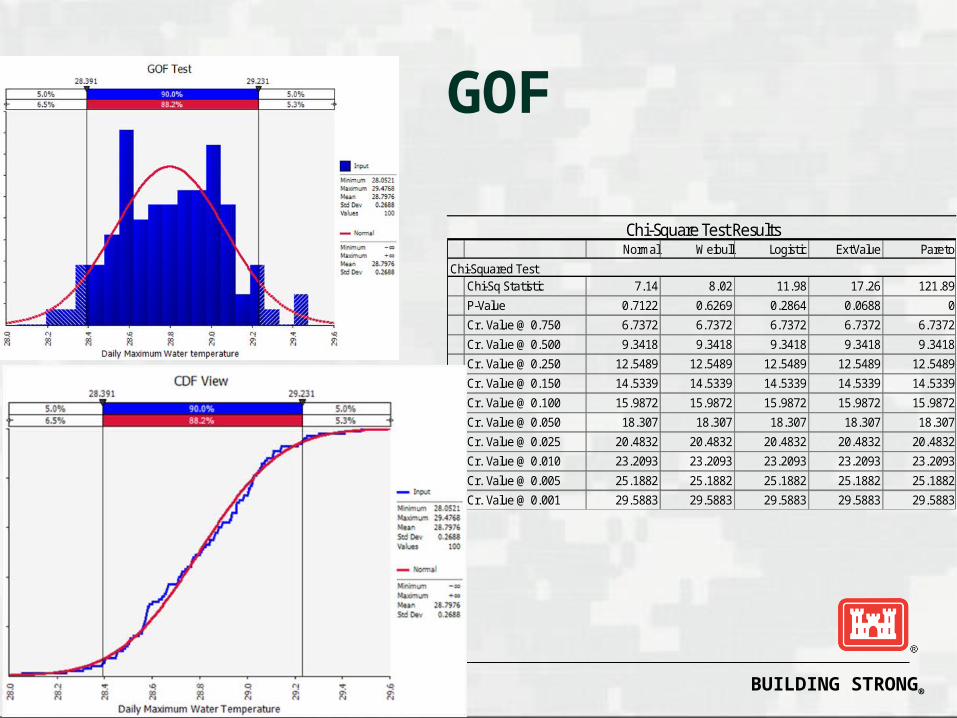
GOF
Normal Weibull Logistic ExtValue ParetoChi-Squared Test
Chi-Sq Statistic 7.14 8.02 11.98 17.26 121.89P-Value 0.7122 0.6269 0.2864 0.0688 0Cr. Value @ 0.750 6.7372 6.7372 6.7372 6.7372 6.7372Cr. Value @ 0.500 9.3418 9.3418 9.3418 9.3418 9.3418Cr. Value @ 0.250 12.5489 12.5489 12.5489 12.5489 12.5489Cr. Value @ 0.150 14.5339 14.5339 14.5339 14.5339 14.5339Cr. Value @ 0.100 15.9872 15.9872 15.9872 15.9872 15.9872Cr. Value @ 0.050 18.307 18.307 18.307 18.307 18.307Cr. Value @ 0.025 20.4832 20.4832 20.4832 20.4832 20.4832Cr. Value @ 0.010 23.2093 23.2093 23.2093 23.2093 23.2093Cr. Value @ 0.005 25.1882 25.1882 25.1882 25.1882 25.1882Cr. Value @ 0.001 29.5883 29.5883 29.5883 29.5883 29.5883
Chi-Square Test Results
BUILDING STRONG®
Choice
An expert opinion is not necessary. Sensitivity analysis will not be necessary. The normal distribution is continuous,
parametric, consistent with my theory, successfully used in the past, and statistically consistent with a my data. Therefore I will use it.

BUILDING STRONG®
Take Away Points
Choosing the best distribution is where most new risk assessors feel least comfortable.
Choice of distribution matters. Distributions come from data and
expert opinion. Distribution fitting should never be the
basis for distribution choice.