chip-based nanoelectrospray mass spectrometry for protein … · 2019-06-21 · chip-based...
TRANSCRIPT

Review
10.1586/14789450.1.4.449 © 2004 Future Drugs Ltd ISSN 1478-9450 449
CONTENTS
Current state of microchip device technologies for nano-ESI/MS
Selected proteomic applications of the ESI Chip system
Expert opinion & five-year view
Key issues
References
Affiliations
www.future-drugs.com
Chip-based nanoelectrospray mass spectrometry for protein characterizationSheng Zhang† and Colleen K Van PeltIn the last several years, significant progress has been made in the development of microfluidic-based analytical technologies for proteomic and drug discovery applications. Chip-based nanoelectrospray coupled to a mass spectrometer detector is one of the recently developed analytical microscale technologies. This technology offers unique advantages for automated nanoelectrospray including reduced sample consumption, improved detection sensitivity and enhanced data quality for proteomic studies. This review presents an overview and introduction of recent developments in chip devices coupled to electrospray mass spectrometers including the development of the automated nanoelectrospray ionization chip device for protein characterization. Applications using automated chip-based nanoelectrospray ionization technology in proteomic and bioanalytical studies are also extensively reviewed in the fields of high-throughput protein identification, protein post-translational modification studies, top-down proteomics, biomarker screening by pattern recognition, noncovalent protein–ligand binding for drug discovery and lipid analysis. Additionally, future trends in chip-based nanoelectrospray technology are discussed.
Expert Rev. Proteomics 1(4), 449–468 (2004)
†Author for correspondenceProteomics & Mass Spectrometry Core Facility, Cornell University, 135 Biotechnology Building, Cornell University Campus, Ithaca, NY 14853, USATel.: +1 607 255 6802Fax: +1 607 254 [email protected]
KEYWORDS: automation, ESI Chip™, high-throughput, mass spectrometry, microfluidic device, miniaturization, nanoelectrospray, noncovalent binding interaction, post-translational modifications, proteomics
With the completion of the Human GenomeProject and the sequencing of numerous otherorganism genomes, characterization of the pro-teome has become the focus of many scientificlaboratories. This focus evolved from the studyof one gene, protein or pathway in an organ-ism, towards the systematic identification andquantitation of all expressed cellular compo-nents, to comprehensively characterize all pro-teins present in a cell under specific conditions[1]. This is particularly important due to theevidence found for the poor abundance correla-tion between expressed proteins and those sim-ply encoded at the messenger RNA (mRNA)level [2,3]. Focus has also been placed on study-ing dynamic protein regulation, includingmodification state, and protein–protein inter-actions in a given biologic compartment at agiven time [4–6]. These new approaches to large-scale biology have triggered many analyticalchallenges and produced an increasing demandfor rapid, low-cost, automated instrumenta-tion, with high detection sensitivity that hasthe capability of analyzing trace amounts of
samples. To face these challenges, develop-ments in miniaturized analytical systems suchas microfabricated chip devices have thereforebecome of increasing importance.
Compared with conventional instrumentation,the potential benefits of analytical microfluidicdevices include reduced sample/reagent con-sumption, fast analysis speed and readiness forautomation and system integration [7–11]. Severalon-chip detection methods are being developedfor microfluidic devices such as ultraviolet (UV)absorption, fluorescence and electrochemistry[12]. However, the analysis of proteomic samplespresent at low abundance often requires the useof mass spectrometry (MS) for the desired sensi-tivity and selectivity [12]. With a proper interfaceor built-in device, analytes from a microchip canbe delivered to the external mass spectrometricdetector. As a result, MS has gained increasedpopularity in chip-based analyses [13,14].
MS plays an essential role in proteomic ana-lysis and research. Current technologies usedfor proteomic studies are based on a variety ofseparation techniques followed by identification

Zhang & Van Pelt
450 Expert Rev. Proteomics 1(4), (2004)
of the separated proteins and proteolytic peptides using MS[1,15]. In recent years, it has been increasingly recognized that thekey to proteomics relies not only on the instrument itself, butalso on front-end analytical strategies and sample-handling tech-niques [16,17]. Electrospray facilitates the atmospheric pressureionization of a liquid sample by creating highly charged dropletsthrough which the processes of evaporation and droplet fissioncreate gas-phase ions representative of the analytes in solution.Nanoelectrospray ionization (nano-ESI)/MS, introduced byWilm and Mann [18,19], has become a widely used technique formany proteomics studies, due to its low flow rates with low sam-ple consumption and improved detection limits. Unlike conven-tional ESI, in which pneumatically assisted nebulization isrequired, nano-ESI is typically an electrostatic means for aerosolgeneration and droplet dispersion [18,20,21]. As a result, nano-ESIsignificantly improves analyte desolvation, ionization and trans-fer efficiencies into the mass spectrometer [18]. Recent experi-ments indicate that the low flow rates of nano-ESI effect thefundamental ionization by reduction of matrix suppressionobserved in both infusion [22,23] and liquid chromatography(LC) [24] sample introductory methods. Ultra-low flow rates of1–2 nl/min have been shown to improve overall transfer effi-ciency and yield higher sensitivity [25]. The low flow rates andenhanced sensitivity offered by nano-ESI/MS make it an idealchoice for chip–MS coupling. In addition, nano-ESI favors thegeneration of multiply protonated peptides and proteins, whichin turn promotes more facile amide bond fragmentation whenthe ions are activated for dissociation. Furthermore, in applica-tions such as drug screening, the soft nano-ESI process allowsfor a straightforward study of noncovalent binding interactions.However, disadvantages of nano-ESI include:
• Low sample throughput due to the tedious task of individuallyaligning each nano-ESI tip for optimal spray characteristics
• Potential sample-to-sample carryover
• Tip blockage if the nano-ESI tip is used to analyze multiplesamples
• Poor reproducibility of the relative intensities of analytesbetween tips due to the variable shape of the spray tip and thevariable capillary-sampling cone orifice distance for eachrepeat analysis
In this article, an overview of the recent developments inchip-based nano-ESI/MS technologies is provided. An empha-sis is placed on the development of nano-ESI chip technologiesand their extensive applications for protein characterization andproteomics-based drug discovery. Results generated from thepast several years in the authors’ and several other laboratoriesare discussed.
Current state of microchip device technologies for nano-ESI/MSDuring the past 5 years, many different approaches were takenin the design and development of a nano-ESI interface for cou-pling microchip devices with MS, and interfacing on-chip sam-ple preparation with MS analysis. Limbach and coworkers were
the first to classify the chip-based nano-ESI/MS techniques aseither off- or on-chip ion production, referring to how samplesare introduced to the mass spectrometer [13]. Many researchgroups have taken the off-chip ion production approach, wherethe samples are transferred indirectly from the chip device intothe ion source of the mass spectrometer. This approach was car-ried out by gluing or bonding a fused-silica capillary or a nano-electrospray needle into a microchannel on a glass or polymermicrochip [28–31]. A modified technique based on the aboveapproaches attached a separate spraying capillary or a needlewith a liquid junction interface at the chip outlet [32–36]. Analternative method using external micro-ion sprayers has beendescribed by Henion [37–39]. The published data from the aboveapproaches clearly demonstrates the potential utility of cou-pling microchip devices with MS. For example, Liu andcoworkers demonstrated direct infusion of peptide samples at arate of 5 s/sample using an array of 96 fused-silica capillaries[40]. Li and coworkers employed on-chip capillary electrophore-sis (CE)/ESI/MS with a nano-ESI emitter for sequential injec-tion, preconcentration and separation of tryptic digests.Throughput of up to 12 samples/h and a detection limit of25 fmol was achieved [41]. Quantitative on-chip CE/MS analy-sis of carnitines in human plasma, and a chip-based P450 reac-tor for kinetic analysis of the P450 biotransformation of imi-pramine into desipramine, has also been successfullyaccomplished by Henion and coworkers [35,39]. However, anunfavorable characteristic of these devices is the increased deadvolume at the chip device/transfer capillary interface. The deadvolume can lead to loss of resolution in the upstream separationstep and the transfer line itself can be a potential source ofchemical noise due to background contamination.
The alternative approach to integrating chip devices with MSis to use on-chip ion production. During this process, ion pro-duction is directly integrated onto the microchip by fabricationof a nano-ESI emitter as an internal chip part. This approach isexpected to reduce the dead volume and improve performance.The first report of a direct electrospray from the planar openend of a microchannel at the edge of a glass chip was by Karger[42], and a similar interface was also used by Ramsey [43]. Inboth cases, the devices provided a flat hydrophilic glass surfacefor the formation of an electrospray. However, these devicesrequired an impractically high voltage to overcome the fluidsurface tension to initiate and maintain stable spray. As a result,widespread use of this approach has not occurred.
In recent years, various constructions have been demon-strated for on-chip ion production from an integrated micro-chip. On-chip ESI devices have been fabricated from mono-lithic silicon substrate [44] and silicon dioxide [27]. Sharpintegrated spray emitter devices have also been fabricated froma variety of polymers including parylene [45], poly(ethyleneterephthalate) [46], polycarbonate [47], poly(methyl metha-crylate) [48–50] and poly(dimethylsiloxane) [51–54]. Beyond fabri-cation, the investigators also demonstrated the performance oftheir devices in a variety of application fields such as drugquantitation, peptide sequencing and protein analysis.

Automated nanoelectrospray for proteomics studies
www.future-drugs.com 451
Despite the considerable progress made for various chipdevices, very few laboratories have developed a true miniatur-ized proteomic platform referred to as proteomics-on-a-chip[55], which is virtually a microfluidic device with integratedsample preparation, preconcentration and even multidimen-sional separation on-chip for direct MS analysis. Thibault andcoworkers recently reported an integrated glass microsystem foranalysis of in-gel digest samples [41]. The system included alarge injection port (2.4 µl), a CE separation channel and a lowdead volume-glued nano-ESI emitter for interfacing withESI/MS. Sample preconcentration was achieved by packingC18 beads or immobilized metal affinity chromatography(IMAC) beads into the injection port for the enrichment of tar-get peptides prior to CE separation and MS detection. Thedevice was used for rapid identification of 72 proteins fromhuman prostate cancer cells at a rate of 12 samples/h [41].IMAC affinity capture and separation in the device of phos-phopeptides from gel samples was also demonstrated [41]. Thisdevice is the first fully integrated chip-based proteomic plat-form for MS analysis, although the detection sensitivity of thedevice still needs to be improved for low-abundant proteins.
The ESI Chip™ device is a silicon-based on-chip nano-electrospray microchip device developed by Advion BioSciences,Inc. using deep reactive ion etching (DRIE) technologies [44,201].DRIE is used to form high-aspect ratio structures from the sur-face of a substrate with a high degree of anisotropy. DRIE meth-ods allow multiple devices to be formed simultaneously, creatinglow-cost, highly reproducible devices. The ESI Chip is one ofthe more advanced designs consisting of 100 out-of-plane tips(nozzles) with an inner and outer diameter of 10 and 20 µm,respectively, for each nozzle (FIGURE 1). There is a 10-µm (inter-nal diameter [i.d.]) channel through the wafer connecting eachspray nozzle on one planar surface with the inlet on the oppositeplanar surface. This through-chip channel has a dead volume ofonly 25 pl [44,56]. The 10 × 10 array of nozzles on the ESI Chipoffers the capability of 100 samples to be sequentially analyzedmaking high-throughput, automated nano-ESI/MS analysispossible (FIGURE 1). Another unique feature of the chip is theincorporation of the ESI ground potential or counter electrodeinto the spray nozzle. This is very different from conventionalelectrospray devices, which define the electric field by the poten-tial difference between the spray device (fluid potential) and themass spectrometer inlet or atmospheric pressure ionization(API) interface. In the ESI Chip, the electric field around thenozzle tip is formed from the potential difference between themicrofabricated silicon substrate as an integrated counter elec-trode and the voltage applied to the fluid via the conductivepipette tip [201]. As the distance between the electrodes is only afew microns and constant, an extremely strong and stable elec-tric field is reproducibly generated, essentially decoupling theESI process from the inlet of the mass spectrometer [201].
The ESI Chip is supported and positioned in front of theion-sampling orifice of the mass spectrometer through a roboticplatform referred to as the NanoMate® (Advion BioSciences).The platform serves as a robotic liquid handing device that
sequentially delivers samples from a 96-well plate through aconductive pipette tip to a nano-ESI nozzle in the ESI chip-based array and then initiates the nano-ESI spray process(FIGURE 1). There is a dedicated pipette tip and nozzle for eachsample to ensure that the system provides a fully automatednano-ESI/MS infusion analysis without any carryover or crosscontamination between samples [57,58].
Selected proteomic applications of the ESI Chip systemCurrently, there are many proteomic applications of chip-based MS. In addition, the use of microchip devices with MSdetection for pharmaceutical and environmental analyses isalso increasing [9,13]. During the last 10 years, genomics bene-fited from the trend towards miniaturization. Proteomics nowappears poised to benefit in a similar manner from thedevelopments in miniaturization technologies. Ideally, allsteps upstream from sample preparation and separation wouldbe integrated onto a single microfabricated device for directMS analysis, which will provide the potential for dramatic
B
Disposablepipette tip
Nanoelectrosprayplume
Nozzle
MS orifice
Sample
ESI Chip
A
Figure 1. The ESI Chip system. (A) Sequential photographs of the ESI Chip demonstrating the array of microfabricated nanoelectrospray nozzles with successive enlargements of an individual nozzle. This final scanning electron micrograph shows a single nanoelectrospray emitter with dimensions of 10 µm internal diameter and 20 µm outer diameter. (B) Schematic representation for a cross-section of a portion of an ESI Chip. A disposable pipette tip, containing sample, presses and seals against the inlet side of the chip with the nanoelectrospray plume spraying towards the mass spectrometer ion orifice entrance. Nanoelectrospray is initiated by applying a head pressure and voltage to the sample in the pipette tip. Reproduced with permission from [57].ESI: Electrospray ionization; MS: Mass spectrometry.

Zhang & Van Pelt
452 Expert Rev. Proteomics 1(4), (2004)
advancements in the field of proteomics. This application sec-tion highlights six selected proteomics application areas usingnano-ESI chip-based MS.
Protein identificationDetection and identification of proteins from a biologic sampleis the most basic task in proteomics. To tackle the current chal-lenges in this field, sensitivity and high throughput is becomingincreasingly important due to the dynamic nature of proteinexpression, protein–protein interactions and protein modifica-tions, which require analysis as a function of time and cell state[17,59]. Current technologies for protein identification are basedon a variety of separation techniques followed by identificationof the separated proteins and proteolytic peptides using MSanalysis [1,15]. 2D gel electrophoresis and 2D-LC, as well as thecombination of the above approaches, are widely employed forupstream separation prior to MS analysis.
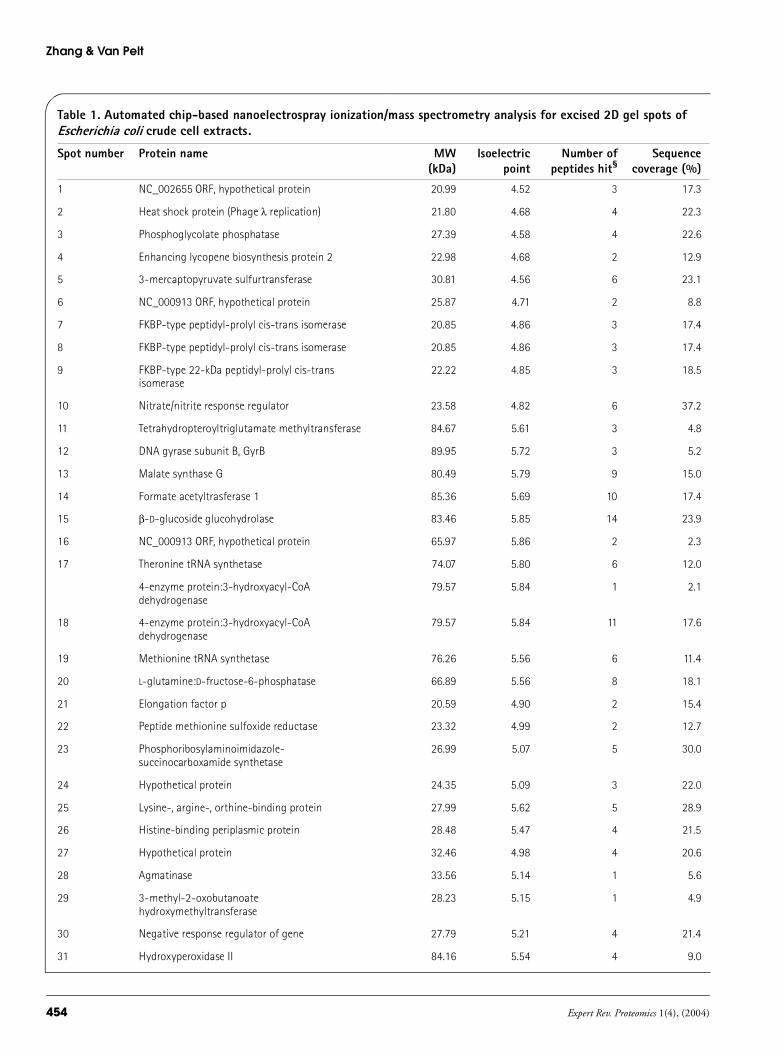
Initial experiments using an automated nano-ESI device cou-pled with ion trap MS for protein solution digests and bovineserum albumin (BSA) gel spots demonstrated the detectionsensitivity, feasibility and reproducibility of the automatednano-ESI device. The detection sensitivity of 500 amol/µl ofmyoglobin digest and 150 fmol of BSA loaded on-gel werereported from infusion analysis [57]. Further results obtained for2D gel spots of Escherichia coli and yeast crude cell extracts bythe fully automated device indicate that the automated nano-ESI system is a valuable tool for high-throughput protein iden-tification with 96 samples being fully analyzed in approxi-mately a 6-h period [57]. An important advantage of nano-ESItandem MS (MS/MS; MSn) infusion is that it permits low-vol-ume sample consumption and a flexible MS acquisition time.Throughout the infusion analysis, the mass spectrometer isoperated in the data-dependant acquisition (DDA) mode withdynamic exclusion enabled, allowing extended time to acquiremore scans in both MS and MS/MS modes. Thus, unlikeonline LC/MS/MS with narrow peak elution times for detec-tion, this infusion approach provides sufficient acquisition timefor selecting the low-abundance ions for MS/MS in DDAexperiments and therefore improves detection sensitivity as wellas protein sequence coverage. The extended, flexible acquisitiontime in DDA experiments offered by the infusion approach canpartially compensate for its loss of concentration effect com-pared with the online LC/MS method. Additionally, as thisapproach is infusion-based nano-ESI MS, the front-end samplehandling and preparation are particularly important comparedwith online LC/MS analysis. Recently, the detection sensitivityfor BSA gel spots has been improved to 75 fmol loaded on-gelby modifying the procedures for in-gel digestion, extraction,and robotic ZipTipC18 cleanup. Two to three BSA tryptic pep-tides were consistently detected across five gel spots, each from75 fmol loaded on-gel, yielding an average sequence coverage of6.5% [UNPUBLISHED OBSERVATIONS]. Using the modified experi-mental protocol, 40 2D gel spots of E. coli crude extract thatwere located in two regions of the gel with relatively faint spotswere selected for evaluation of the improved protocol (FIGURE 2).
Following robotic ZipTipC18 cleanup and NanoMate/LCQ-Deca mass spectrometer analysis, all 40 spots were unambigu-ously identified as shown in TABLE 1. Several extremely faintspots (barely visible with colloidal Coomassie blue stain) suchas spot numbers three, six, ten and 12 were identified with twoto six peptides being detected (FIGURE 2). Recently, Rutherfordand coworkers developed and reported a new approach for theidentification of proteins in complex biologic matrices by com-bining three technologies [60]. Microwave power was used fordecreasing enzymatic digestion time from overnight to 10 min,a robotic ESI chip-based nano-ESI analysis was employed forsample infusion, and finally a gas-phase fractionation (GPF)method [61] was employed to further deconvolute sample com-plexity [60]. In their experiments, 19 GPF segments, each withan increasing mass-to-charge (m/z) range covering 25 atomicmass units (amu), were acquired 1 min each by data-dependentMS/MS for a mixture of ten protein digests and serum samples.The results demonstrated that all ten proteins were identifiedwith 20–70% sequence coverage in the digest mixture. Morethan 300 proteins were identified in a serum sample in just onesingle run. The results suggest that GPF using MS as a massfractionation device identifies more proteins, while chip-basedinfusion make the GPF analysis possible by extending theacquisition time for each segment [60].
Traditionally, with the advantages of improved salt toleranceand higher throughput compared with nano-ESI/MS/MS,matrix-assisted laser desorption/ionization (MALDI)-MS hasbeen the preferred screening method for protein identification.Most proteomics data available in the literature use MALDI-MS to identify proteins resolved on a 2D gel. However, theautomated nano-ESI system with MS/MS analysis for 2D gel-separated proteins can generate high-quality MS/MS spectrafor unambiguous protein identification, as well as performde novo sequencing. The offline sample preparation processhas been automated and is therefore essentially the same forboth MALDI-MS and automated nano-ESI/MS/MS. Thedetection sensitivity provided in nano-ESI/MS/MS appears tobe comparable with that of MALDI-MS, in which tens offemtomoles of in-gel protein are required. Therefore, the auto-mated nano-ESI system is an effective high-throughput com-plement to the present MALDI-MS approach as a screeningmethod for gel-based protein identification.
Effort has also focused on a new approach with ESI chip-based infusion analysis for offline-collected capillary LC(CapLC) fractions to achieve better detection sensitivity andhigher sequence coverage for gel samples [62,63]. OnlineLC/MS/MS with either a CapLC column or a nano-LC col-umn is widely used for analysis of complex protein samples. InCapLC, a 300 µm column is used with flow rates of4–8 µl/min. The LC running times can be as short as 30 min.However, the technique suffers from relatively low detectionsensitivity and poor sequence coverage due to high flow rates(requiring fast MS scanning) compared with nano-LC, where75 µm columns at flow rates of 200 nl/min are used. However,the analysis times for nano-LC/MS can be as long as 2 h,

Automated nanoelectrospray for proteomics studies
www.future-drugs.com 453
resulting in relatively low throughput forprotein identification. In order to speedup the analysis while maintaining a gooddetection sensitivity and sequence cover-age for protein identification, offlineCapLC fractions were collected with anautomated robotic collection system in a96-well plate and only fractions of inter-est were directly interrogated using chip-based automated nano-ESI/MS/MS[62,63]. The chip-based infusion analysis ofoffline-collected CapLC fractions yieldedconsistently higher sequence coverageresults than online CapLC/MS/MS forBSA digest and for a four-protein digestmixture (500 fmol each), but the resultswere comparable with the data fromonline nano-LC/MS/MS [62]. The com-parison results were obtained betweenonline nano-LC/MS/MS and offlineCapLC fractionation followed by chip-based infusion nano-MS/MS analysis of a60-kDa gel band of E. coli crude cellextract. Results from the two methodswere surprisingly complementary. A totalof 18 proteins were identified, with eightbeing identified by both approaches. Fiveproteins were uniquely detected by onlinenano-LC, suggesting that this methodprovided the best detection sensitivitythrough enrichment of low-abundantpeptides with minimal ion suppressiondue to better separation. Interestingly,there were also five proteins detecteduniquely by chip-based infusion analysis.This result suggests that infusion-basednano-ESI/MS/MS is a good complementto the online nano-LC/MS/MS method,being more likely to identify the low-abundance peptides (proteins) that co-eluted with other higher abundance pep-tides (proteins) and therefore failed to bedetected by online nano-LC. In addition,chip-based infusion also required lessoverall MS analysis time and eliminatesthe need for spray optimization over awide organic gradient as is required foronline LC analysis. Consistent with theabove findings, Lund and coworkersreported the complementary nature ofonline nano-LC/MS/MS and chip-basedinfusion when identifying proteins froma ribosomal fraction of yeast cell lysate[63]. Out of a total of 81 proteins identi-fied, 47 were identified by both
26
1 2
330
7
5
4
2827
23
91024
25
29
22
6
21
1211
131415 18
17
1619 20
3132
33
35
36 373839
40
5 4
1
87
3
6 27
10 9
232
21
22
24
25
26
28
29
30
2124
25
5 4
1
87
3
6 27
10 9
232
21
22
24
25
2628
29
2124
33
36
40
3738 39
35 34
313211
19
1213
15
14
20
1716
18
33
36
40
3738 39
35 34
3132
11
19
1213
15
14
20
1716
18
MW(kD) pH 4.0 7.0
B
C
A
34
8
Figure 2. 2D electrophoresis gel of 80 µg of Escherichia coli crude cell extract. (A) The gel was colloidal Coomassie blue-stained and the gel regions and spots selected for identification are boxed and numbered. (B) Expanded view of gel spots in the low mass region with 3D image analyzed by Progenesis software. (C) Expanded view of gel spots in the high mass region with 3D image analyzed by Progenesis software.MW: Molecular weight.
Zhang & Van Pelt
454 Expert Rev. Proteomics 1(4), (2004)
Table 1. Automated chip-based nanoelectrospray ionization/mass spectrometry analysis for excised 2D gel spots of Escherichia coli crude cell extracts.
Spot number Protein name MW(kDa)
Isoelectricpoint
Number ofpeptides hit§
Sequencecoverage (%)
1 NC_002655 ORF, hypothetical protein 20.99 4.52 3 17.3
2 Heat shock protein (Phage λ replication) 21.80 4.68 4 22.3
3 Phosphoglycolate phosphatase 27.39 4.58 4 22.6
4 Enhancing lycopene biosynthesis protein 2 22.98 4.68 2 12.9
5 3-mercaptopyruvate sulfurtransferase 30.81 4.56 6 23.1
6 NC_000913 ORF, hypothetical protein 25.87 4.71 2 8.8
7 FKBP-type peptidyl-prolyl cis-trans isomerase 20.85 4.86 3 17.4
8 FKBP-type peptidyl-prolyl cis-trans isomerase 20.85 4.86 3 17.4
9 FKBP-type 22-kDa peptidyl-prolyl cis-trans isomerase
22.22 4.85 3 18.5
10 Nitrate/nitrite response regulator 23.58 4.82 6 37.2
11 Tetrahydropteroyltriglutamate methyltransferase 84.67 5.61 3 4.8
12 DNA gyrase subunit B, GyrB 89.95 5.72 3 5.2
13 Malate synthase G 80.49 5.79 9 15.0
14 Formate acetyltrasferase 1 85.36 5.69 10 17.4
15 β-D-glucoside glucohydrolase 83.46 5.85 14 23.9
16 NC_000913 ORF, hypothetical protein 65.97 5.86 2 2.3
17 Theronine tRNA synthetase 74.07 5.80 6 12.0
4-enzyme protein:3-hydroxyacyl-CoA dehydrogenase
79.57 5.84 1 2.1
18 4-enzyme protein:3-hydroxyacyl-CoA dehydrogenase
79.57 5.84 11 17.6
19 Methionine tRNA synthetase 76.26 5.56 6 11.4
20 L-glutamine:D-fructose-6-phosphatase 66.89 5.56 8 18.1
21 Elongation factor p 20.59 4.90 2 15.4
22 Peptide methionine sulfoxide reductase 23.32 4.99 2 12.7
23 Phosphoribosylaminoimidazole-succinocarboxamide synthetase
26.99 5.07 5 30.0
24 Hypothetical protein 24.35 5.09 3 22.0
25 Lysine-, argine-, orthine-binding protein 27.99 5.62 5 28.9
26 Histine-binding periplasmic protein 28.48 5.47 4 21.5
27 Hypothetical protein 32.46 4.98 4 20.6
28 Agmatinase 33.56 5.14 1 5.6
29 3-methyl-2-oxobutanoate hydroxymethyltransferase
28.23 5.15 1 4.9
30 Negative response regulator of gene 27.79 5.21 4 21.4
31 Hydroxyperoxidase II 84.16 5.54 4 9.0

Automated nanoelectrospray for proteomics studies
www.future-drugs.com 455
approaches, 18 by the infusion approach exclusively and 16 byonline nano-LC/MS/MS alone. Again, these results indicatethat both analytical approaches are complementary in proteinidentification analysis.
Protein post-translational modification studiesCharacterization of protein post-translational modifications(PTMs) is one of the most difficult challenges facing the pro-teomics field. Although MS has proven to be the most powerfulmethod for mapping post-translationally modified proteins [64],the reality is that PTM analysis is far more complicated thansimple protein identification. A number of practical issues lie atthe root of this complication. First, proteins are often modifiedwith a low stoichiometry and have a wide dynamic variationover time requiring a highly sensitive detection method. Sec-ond, identification of PTMs requires the isolation of the spe-cific peptides containing the modified residues and to discernthese PTM sites, high protein sequence coverage is necessary.Furthermore, peptides containing PTMs often undergo rapiddegradation and may even have poor ionization efficiency inMS analysis. Finally, more than 200 different modifications arereported, making the potential for a multiply modified proteinvery likely, and consequently the protein would be even morecomplex [4]. In this section, focus will be placed on the applica-tion of chip-based nano-ESI/MS for the two most commonand important PTMs: phosphorylation and glycosylation.
Protein phosphorylation
Protein phosphorylation is one of the few modifications describedto date that has been shown to be reversible. Thus, it plays animportant regulatory role in various cell activities includinggrowth, differentiation, division and metabolism. Pinpointing thesites of phosphorylation in a protein is necessary in order to
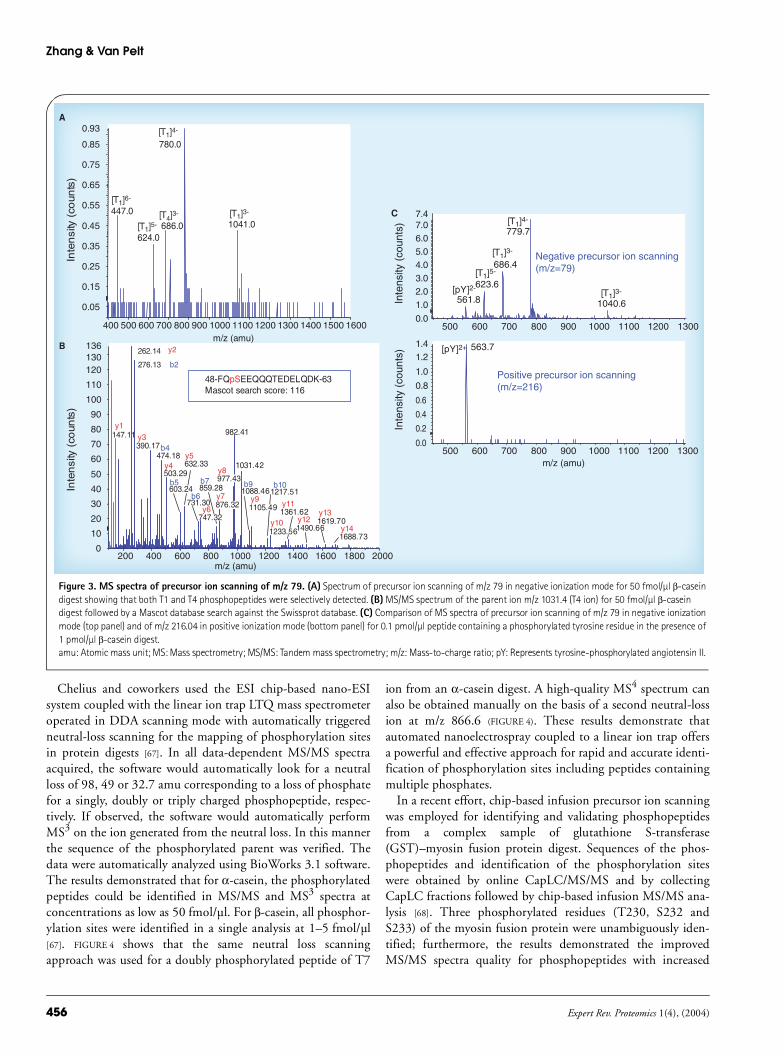
understand regulatory mechanisms [65,66]. MS has been proven themost efficient means to identify the precise phosphorylated resi-dues in a protein mixture if the phosphorylated peptides can beselectively isolated from a protein digest by either affinity enrich-ment (such as IMAC) or MS-based selective detection (such asprecursor ion scanning in the negative ionization mode for m/z 79and neutral loss scanning for phosphopeptides). Several differentapproaches for mapping phosphorylation sites in protein digestswere reported using ESI chip-based infusion on a variety of differ-ent mass spectrometers. Initial experiments were performed usingchip-based nano-ESI in combination with precursor ion scanningon a QSTAR® Pulsar i quadrupole time-of-flight (QTOF) tan-dem mass spectrometer (Applied Biosystems) for the identificationof phosphorylation sites of bovine β-casein digest. The standardphosphoprotein digest was analyzed with negative ionization pre-cursor ion scanning of m/z 79 followed by positive ionizationproduct ion scanning. In addition, the above digest was fortifiedwith a synthetic tyrosine-phosphorylated angiotensin II peptide,and positive precursor ion scanning of m/z 216.04 was per-formed. The results demonstrated that using the chip-based nano-ESI coupled with precursor ion scanning, it was possible to mapthe phosphorylation sites of β-casein in a 50 fmol/µl digest(FIGURE 3A & B). Precursor ion scanning of m/z 216.04 providedhigh sensitivity and better selectivity for the identification of tyro-sine-phosphorylated peptides (100 fmol/µl) in serine/threonine-phosphorylated complex digests (1 pmol/µl), as shown inFIGURE 3C. The chip-based infusion approach allows for extendedanalysis times to perform slow precursor ion scanning across abroad mass range for improved detection of phosphopeptides inthe complex mixture (one scan requires 36 s at a dwell time of30 ms with a step size of 1 Da across m/z 400–1700). It also per-mits the increased multiple channel averaging (MCA) scan num-bers in the subsequent product ion scan of the phosphopeptides.
Spot number Protein name MW(kDa)
Isoelectricpoint
Number ofpeptides hit§
Sequencecoverage (%)
32 Putative multimodular enzyme 82.42 5.34 5 10.3
33 Phosphate acetyl transferase 77.14 5.23 12 24.5
34 Glycine tRNA synthetase, β subunit 76.81 5.29 19 32.4
35 Putative GTP-binding factor 65.45 5.10 8 18.3
36 Heat shock protein 95.59 5.37 10 15.9
37 Tansketolase 1 isozyme 72.20 5.43 5 10.1
Tansketolase 2 isozyme 73.04 5.43 1 2.0
38 Acetyl-CoA synthetase 72.09 5.50 12 24.7
39 L-glutamine:D-fructose-6-phosphatase 66.89 5.56 5 11.8
40 Aspartate tRNA synthetase 65.91 5.47 13 27.3§MS/MS spectra were searched using BioWorks 3.1 against ecoli.fasta database with filter of xcorr versus charge state: (+1, +2, +3) > 1.50, 2.00, 2.50.MW: Molecular weight; ORF: Open reading frame; tRNA: Transfer RNA.
Table 1. Automated chip-based nanoelectrospray ionization/mass spectrometry analysis for excised 2D gel spots of Escherichia coli crude cell extracts (cont.).
Zhang & Van Pelt
456 Expert Rev. Proteomics 1(4), (2004)
Chelius and coworkers used the ESI chip-based nano-ESIsystem coupled with the linear ion trap LTQ mass spectrometeroperated in DDA scanning mode with automatically triggeredneutral-loss scanning for the mapping of phosphorylation sitesin protein digests [67]. In all data-dependent MS/MS spectraacquired, the software would automatically look for a neutralloss of 98, 49 or 32.7 amu corresponding to a loss of phosphatefor a singly, doubly or triply charged phosphopeptide, respec-tively. If observed, the software would automatically performMS3 on the ion generated from the neutral loss. In this mannerthe sequence of the phosphorylated parent was verified. Thedata were automatically analyzed using BioWorks 3.1 software.The results demonstrated that for α-casein, the phosphorylatedpeptides could be identified in MS/MS and MS3 spectra atconcentrations as low as 50 fmol/µl. For β-casein, all phosphor-ylation sites were identified in a single analysis at 1–5 fmol/µl[67]. FIGURE 4 shows that the same neutral loss scanningapproach was used for a doubly phosphorylated peptide of T7
ion from an α-casein digest. A high-quality MS4 spectrum canalso be obtained manually on the basis of a second neutral-lossion at m/z 866.6 (FIGURE 4). These results demonstrate thatautomated nanoelectrospray coupled to a linear ion trap offersa powerful and effective approach for rapid and accurate identi-fication of phosphorylation sites including peptides containingmultiple phosphates.
In a recent effort, chip-based infusion precursor ion scanningwas employed for identifying and validating phosphopeptidesfrom a complex sample of glutathione S-transferase(GST)–myosin fusion protein digest. Sequences of the phos-phopeptides and identification of the phosphorylation siteswere obtained by online CapLC/MS/MS and by collectingCapLC fractions followed by chip-based infusion MS/MS ana-lysis [68]. Three phosphorylated residues (T230, S232 andS233) of the myosin fusion protein were unambiguously iden-tified; furthermore, the results demonstrated the improvedMS/MS spectra quality for phosphopeptides with increased
400 500 600 700 800 900 1000 1100 1200 1300 1400 1500 1600
0.05
0.15
0.25
0.35
0.45
0.55
0.65
0.75
0.85
0.93
Inte
nsi
ty (
coun
ts)
780.0
447.01041.0
[T1]6-
[T1]5-
624.0686.0[T4]3-
[T1]4-
[T1]3-
A
200 400 600 800 1000 1200 1400 1600 1800 2000m/z (amu)
0
10
20
30
40
50
60
70
80
90
100
110
120130136
Inte
nsi
ty (
coun
ts)
262.14
276.13
982.41147.11390.17
474.181031.42
503.29632.33
859.28
1688.73y14
1619.70y13
y121361.62y11
y10
y9
y8
y7
y6
y5y4
y3
y2
y1
b2
b4
b5
731.30b6
b7 b91088.46
b101217.51
48-FQpSEEQQQTEDELQDK-63Mascot search score: 116
B
Inte
nsity
(co
unts
)In
tens
ity (
coun
ts)
C
500 600 700 800 900 1000 1100 1200 13000.0
1.02.03.04.05.06.07.07.4
779.7
686.4
623.6
561.8 1040.6
500 600 700 800 900 1000 1100 1200 13000.0
0.2
0.4
0.6
0.8
1.0
1.21.4 563.7
Positive precursor ion scanning (m/z=216)
[pY]2+
Negative precursor ion scanning (m/z=79)[T1]5-
[T1]3-
[T1]4-
[T1]3-[pY]2-
m/z (amu)
1490.661233.56
1105.49
977.43
747.32
876.32
603.24
m/z (amu)
Figure 3. MS spectra of precursor ion scanning of m/z 79. (A) Spectrum of precursor ion scanning of m/z 79 in negative ionization mode for 50 fmol/µl β-casein digest showing that both T1 and T4 phosphopeptides were selectively detected. (B) MS/MS spectrum of the parent ion m/z 1031.4 (T4 ion) for 50 fmol/µl β-casein digest followed by a Mascot database search against the Swissprot database. (C) Comparison of MS spectra of precursor ion scanning of m/z 79 in negative ionization mode (top panel) and of m/z 216.04 in positive ionization mode (bottom panel) for 0.1 pmol/µl peptide containing a phosphorylated tyrosine residue in the presence of 1 pmol/µl β-casein digest.amu: Atomic mass unit; MS: Mass spectrometry; MS/MS: Tandem mass spectrometry; m/z: Mass-to-charge ratio; pY: Represents tyrosine-phosphorylated angiotensin II.

Automated nanoelectrospray for proteomics studies
www.future-drugs.com 457
Xcorr scores achieved by chip-infusionnano-ESI analysis of the offline CapLCfractions [68]. The fractionation approachsignificantly improves the signal-to-noise(S/N) ratio for the MS/MS spectra by sig-nal averaging the ion current from the tar-get analyte permitted in extended infusiontimes compared with the few scans fromthe elution profile of a typical online chro-matographic peak. To explore the feasibilityof affinity capture of phosphopeptides fol-lowed by chip-based nano-ESI analysis, anin-house created monolithic IMAC col-umn and ovalbumin digest were investi-gated [56]. After the column was chargedwith Fe(III), sample was loaded, washedand the captured peptides were eluteddirectly into a 96-well plate. The elutedsample was then subjected to nano-ESI/MSanalysis using a 2000 Q Trap® linear iontrap mass spectrometer (Applied Biosys-tems). The full-scan MS spectra for a tryp-tic digest of 250 fmol/µl ovalbumin beforeand after affinity capture showed that theexpected T30 phosphopeptide, doublycharged at m/z 1045, was selectivelyenriched. MS/MS was performed and aMascot database search confirmed S345 asthe site of phosphorylation [56]. The com-bined use of IMAC affinity capture andautomated chip-based nano-ESI/MS/MSdemonstrates one of many possibleapproaches for phosphorylation studies.
Protein glycosylation
Glycosylation is one of the most commonPTMs. It is estimated that over 50% ofall proteins are glycosylated [69]. Glycansin a protein can influence protein func-tion by affecting its folding, solubility,stability and recognition of a bindingpartner. Alterations in protein glycosyl-ation have often been associated with dis-eases. Characterization of the detailedstructure of glycoproteins is very impor-tant in biomedical research and drug dis-covery. Structural elucidation of glycans ishistorically difficult as they are typicallyhighly heterogenous and have poor ion-ization efficiency. Glycans are structurallybranched in a nonlinear nature, with avariety of types of intersaccharide link-ages. Generally, a comprehensive analysisof a glycoprotein consists of identificationof glycosylated peptides, identification of
400 600 800 1000 1200 1400 1600 1800m/z
0
10
20
30
40
50
60
70
80
90
100R
ela
tive
ab
un
da
nce
915.49
x5 x5
58 - DIGPSEPSTEDQAMEDIK-73
Xcorr score: 3.6
y3375.42
y4504.34
y5635.31
y6706.50
y7835.10
y8950.20
y91079.20
y101179.90
y111346.90
b151782.30
b141668.90b13
1553.80
1425.00
b11
b101222.94
b91094.44
b8979.54
b7851.04
b5b4
Loss of phosphate (-49 amu)
A[M+2H]2+
400 600 800 1000 1200 1400 1600 1800m/z
0
10
20
30
40
50
60
70
80
90
100
Re
lativ
e a
bu
nd
an
ce
866.55
x5 x5
58 - DIGSEPSTEDQAMEDIK - 73
Xcorr score: 3.4
y3375.26
y4504.27
y5635.32
y6
y7835.10
y8949.40
y91079.20
y101180.19
y11
y121378.49
y141602.39
b151683.70
b141570.90b13
1455.61b12b11
1195.35b10b9
b8881.64
b7852.68
b6651.74
Loss of phosphate (-49 amu)
B[M+2H]2+
400 600 800 1000 1200 1400 1600 1800m/z
0
10
20
30
40
50
60
70
80
90
100
Re
lativ
e a
bu
nd
an
ce x5 x5
58 - DIGSESTEDQAMEDIK - 73Xcorr score: 3.4
y3375.26
y4504.35
y5635.32
y6y7
835.00
y8
y91079.20
y101180.19 y11
1249.19b141473.30
b151586.90b13
1357.80
b121229.20b11
1095.90
b10
b9898.60
b8783.50
b6553.70
b5484.40
C
1027.40
1125.04
453.34582.04
b121293.54
949.40
706.50
1326.63996.85
706.50
1249.49
Figure 4. ESI chip-based nano-ESI/linear ion trap MSn analysis for mapping the diphosphorylated T7 peptide of α-casein digest. (A) MS2 spectrum derived by collision-induced dissociation of the (M+2H)2+ precursor ion of the α-casein phosphorylated peptide, m/z = 964.6 and database searching by BioWorks 3.1 software. (B) MS3 spectrum derived by DDA triggered neutral-loss scanning of the (M+2H)2+ precursor ion of the α-casein phosphorylated peptide, m/z 964.6 → m/z 915.5. (C) MS4 spectrum derived by collision-induced dissociation of the secondary neutral-loss ion, m/z = 964.6 → m/z 915.5 → m/z 866.0 and identification using BioWorks 3.1 software.amu: Atomic mass unit; DDA: Data-dependant acquisition; ESI: Electrospray ionization; MS: Mass spectrometry; MSn: Tandem mass spectrometry; m/z: Mass-to-charge ratio.

Zhang & Van Pelt
458 Expert Rev. Proteomics 1(4), (2004)
the location of the glycosylation sites andelucidation of the glycan structure.Although ESI/MS/MS remains widelyrecognized as an effective means for oligo-saccharide characterization (sequence,linkage and branching), the hydrophilicnature of glycans has often been cited asthe cause of poor ESI sensitivity requiringeither derivatization [70] or nanoelectro-spray [71,72] to improve ionization effi-ciency. Nano-ESI offers improved ioniz-ation efficiency and low flow rates,providing extended analysis time for com-pleting MSn analyses on oligosaccharides[71]. Zamfir and coworkers first reportedthe implementation of an ESI chip-basednano-ESI system in combination withQTOF-MS/MS for mapping, sequencingand computer-assisted structure assign-ment of oligosaccharide amino acids incomplex mixtures associated with two dif-ferent glycosylation disorder diseases [73].Urine samples from a patient diagnosedwith hereditary N-acetyllactosamine defi-ciency (BPy) and a patient with a glyco-sylation congenital disorder (M5) wereused to investigate the capabilities ofautomated nano-ESI for carbohydrateionization and sequencing. The nano-ESIsystem and QTOF mass spectrometerwere operated in negative ion mode forboth MS and MS/MS analyses, and com-puterized assignment of the detected spe-cies was performed. The results confirmeda complex mixture of O-glycosylatedamino acids and dipeptides in the BPycase and demonstrated the presence ofmixtures of O- and N-linked glycanseither as free oligosaccharides or attachedto one or more amino acids in the M5case [73]. Classical nano-ESI/MS/MS wasfound to be useful for improving the S/Nratio of low-abundance ions in complexmixtures, but it is often associated withspray instability. However, the ability ofthe ESI Chip device to provide a con-stant, extended electrospray signal createsreliable conditions for high sensitivity,which is particularly useful for detectionand sequencing of minor glycopeptidecomponents. For example, a doublycharged ion at m/z 890.32 in the MS spec-trum for the BPy sample (FIGURE 5A) can besuccessfully fragmented (FIGURE 5B & C)
and identified as O-glycosylated sialylated
300 350 400 450 500 550 600 650 700
x6 x7 x5x16x2 774.28
525.19
290.09 481.17
376.19308.11
760.26
532.69 707.79
571.23580.19
580.70
716.77
1065.35
775.28912.88
853.31827.21
890.32
919.88
1066.35
1067.36
532.19
1-
1-
2-
2-
1-
2-
1-1-
2-
2-
2-
2-
1-
1-
A
30035040045050055060065070075080085090095010001050110011501200125013000
100
%
x4x2x4 x6x4
308.10
580.18
598.12
890.31
881.30
868.73
790.
858.
890.81
1080.36
894.1037.
1019.
1081.36
1141.22
1200.27
1201.271224.26
760.
1-
-H201-
0,4A6
1-
0,4A/B3β
Y1β1-
2-Y5β or Y2α
C1α or C1β1-
1-
1-
1-B3α/B1β
B5β
B
290 673
NeuAc-Gal-GlcNAc -Gal-GlcNAc
GalNAc-Ser
NeuAc-Gal
-NeuAc
2- m/z=745
-2NeuAc
1- m/z=1199
o
NHCOCH 3
O
Gal
NeuAc
HO
CH2 O 0,4A6: m/z=1080-NeuAc
m/z=789
-GalGalNAc
1037
470760
-NeuAc469
1141
m/z=424
308
364
C
750 800 850 900 950 1000 1050 11000
100
%
451.61419.43
518.22
533.19
708.29714.77
964.33920.38
673.24715.26
608.11599.20
671.09
B1α or B1β
Y1α/B1β
364.13 424.16599.12
Y1β-CO2
C3β
1-
716.22
Y3β
[M-2H]2-
[M-2H]2-
Y5β/B1α
1-
Y2α/B1β
or
A6/B1α
1-
1-
705.16
1051.35
426.52
m/z
m/z
Figure 5. Automated electrospray ionization chip-based nanoelectrospray ionization/MS analysis of a complex mixture of O-glycosylated peptide mixture. (A) Full-scan MS for the sample extracted from urine of the BPy case with singly and doubly charged states assigned. (B) Tandem MS spectrum of NeuAc2Gal3GlcNAc2 GalNAc-Ser detected as a doubly charged ion at m/z 890.32, [M-2H]2-. (C) Fragmentation scheme of NeuAc2Gal3GlcNAc2 GalNAc-Ser detected as a doubly charged ion at m/z 890.32. Reproduced with permission from [73]. BPy: N-acetyllactosamine deficiency; MS: Mass spectrometry; m/z: Mass-to-charge ratio.

Automated nanoelectrospray for proteomics studies
www.future-drugs.com 459
serine (NeuAc2Gal3GlcNAc2 GalNAc-Ser) with direct chip-based infusion nano-ESI/MS/MS [73]. Previously, the onlymeans possible for fragmentation of such an ion from a complexmixture was by online CE/ESI-QTOF-MS in a data-dependentanalysis [74]. This work demonstrates that chip-based nano-ESIprovides great potential for high-performance glycoscreeningand structure elucidation as well as for discovery of novel carbo-hydrate variants in complex biologic mixtures. Recently, Cheliusand coworkers reported another approach using the ESI Chipcombined with MSn. The linear ion trap enabled the detailedexamination and mapping of glycosylation sites and glycanstructures [75]. Bovine ribonuclease B (RNase B) digest contain-ing high mannose-type N-glycosylation, without prior separa-tion or modification of the isoforms, and two standard syntheticglycans were used to test feasibility. A linear ion trap LTQ massspectrometer, operated in both positive and negative ionizationmodes, was used. In the MS spectrum of a 1 pmol/µl RNase Bdigest, a pattern of ions was observed at a spacing of 81 amu,which is a pattern typical of high mannose-type glycopeptidesfor doubly charged species [75]. The subsequent MSn analysis foreach of five selected potential glycopeptide ions led to completesequencing of the high mannose glycan structure and unambig-uous identification of the amino acid sequence of the RNase Bglycopeptide. The sequence of the glycopeptides was achievedby performing MS4 on m/z 475, identifying the site of glyco-sylation as residue N34 [75]. This work also demonstrates thatthe glycan structure can be obtained using MS/MS up to MS5
with extended chip-based infusion without the release of freeglycans from the complex tryptic digest. Furthermore the resultsindicate that the major benefit of chip-based nano-ESI is theallowance of sufficient spray time with stable, sensitive MS sig-nal for complete acquisition of multiple MS/MS experiments ina single analysis.
Top-down nano-ESI/MS for proteome characterizationThe bottom-up approach consists of sequencing tryptic peptidesfrom proteolyzed intact protein samples, as described in theabove sections, and has been the gold standard for proteomecharacterization using conventional mass spectrometers. Thelimitations of this method include increased sample complexitydue to enzymatic digestion and the inability to achieve completesequence coverage in most cases. In the past few years, a comple-mentary technique to peptide-based proteomics known as top-down proteomics has been gaining popularity in characterizingthe proteome. This approach involves high-resolution measure-ment of an intact molecular weight value and direct MS/MSanalysis of intact protein ions primarily using Fourier transformion cyclotron resonance (FTICR)/MS [76,77]. Particularly withthe development of the gentle MS/MS process of electron cap-ture dissociation (ECD) by McLafferty [78,79], the top-downapproach offers informatic advantages in both protein identifica-tion with 100% sequence coverage and PTM characterization[80–82]. However, the intact proteins present significant chal-lenges in sensitivity and throughput for analysis and automatedfront-end sample handling, as well as computer-assisted data
reduction [77]. Recently, Kelleher has developed an automatedsystem for data acquisition using nano-ESI/FTMS and a dataretrieval software program coupled to a 2D separation plat-form for top-down proteomics [83,84]. The nano-ESI chip-based device in a fully automated robotic system was success-fully integrated into the automated data detection and proc-ess system for high-throughput top-down analysis withimproved detection sensitivity [85,86]. Typically, 10-µl frac-tions collected from an upstream 2D-LC separation wereenough for more than 50 min of stable nanoelectrospray, pro-viding ample time to acquire high-quality MS and MS/MSscans of two to four intact proteins per sample [87]. Using ageneral format of automated data detection and processingset, Patrie and coworkers were able to characterize up to sixproteins in 45 min [85]. Meng and coworkers used the inte-grated system to demonstrate the top-down approach on areasonably large scale for the Saccharomyces cerevisiae celllysate. MS/MS data from approximately 210 proteinsbetween 5 and 39 kDa were generated in a hybrid quadrupoleFTMS. The subsequent database search resulted in character-ization of 117 gene products harboring 31 PTMs [87]. Ren-frow and coworkers also used the ESI chip device withFTICR/MS for successful identification and determinationof aberrant O-glycosylation in the immunoglobulin A1 hingeregion [88]. These results demonstrate that this chip-baseddevice is becoming an attractive infusion-based nano-ESI ionsource in the rapidly growing field of top-down proteomics.
Proteomic pattern recognition for biomarker screeningThe field of MS-based biomarker discovery is at an early stage ofevolution [89]. Study of protein expression profiles is becomingincreasingly attractive in the areas of both functional and clinicalproteomics, since protein expression profiles can be used foridentifying novel therapeutic targets and diagnostic biomarkersin a variety of human diseases. In practice, biomarkers may beexpressed as either single or multiple markers whose patterns ofup- and downregulation may signal disease susceptibility, onset,progression, therapeutic response, drug efficacy or toxicity.Recently, several groups successfully developed a novel technol-ogy by combining surface-enhanced laser desorption/ionization(SELDI)-TOF serum profiling with bioinformatics analysis tomove beyond single marker discovery to multimarker patternanalysis [90,91]. The serum biomarker patterns are being devel-oped to correlate with several disease states such as ovarian, pros-tate and breast cancer [92–94]. In 2003, Schultz and coworkersapplied chip-based nano-ESI/MS technology to a high-through-put serum analysis after which the data were analyzed using abioinformatics algorithm. The result was the successful discrim-ination between the sera of ovarian cancer patients and those ofhealthy people [95]. A total of 275 serum samples obtained from95 healthy individuals and 180 individuals affected with ovariancancer were analyzed using automated chip-based infusion on aQSTAR mass spectrometer operated in TOF/MS positive ionmode. To first build a model with ProteomeQuest software(Correlogic Systems, Inc.), 57 control samples and 97 cancer

Zhang & Van Pelt
460 Expert Rev. Proteomics 1(4), (2004)
samples were randomly selected. The model identified featuresunique to the cancer serum samples compared with the controls.The remaining 121 samples (38 control and 83 cancer cases)were then analyzed based on the model. The model scores eachsample based on a probability match to the features identified inthe mass spectra of the control and cancer samples. The resultswere evaluated using two criteria: sensitivity, which is the per-centage of positive samples identified by the model as true posi-tive, and selectivity, which is the percentage of negative samplesidentified by the model as true negative. When considering all175 serum samples, the model had a sensitivity of 87%, a selec-tivity of 84%, and successfully identified ten out of 11 Stage Iovarian cancer patients [95]. Recently, a modified approach usingsummed data generated in MCA mode improved the sensitivityof the model to 97% and the selectivity to 94%, and correctlyidentified eight out of ten Stage I cancer samples [96]. Despitethe fact that bioinformatics software is able to differentiate con-trol versus disease samples by spectral differences, these changescould not be identified by visual comparison of spectra. How-ever, this approach may provide great potential as an additionalcomplement to SELDI techniques for clinical biomarker tests.
Noncovalent binding interactions & drug screeningNoncovalent interactions between pro-teins, as well as between proteins and lig-ands, are critically important in cellularprocesses such as cell signaling and celldivision. An important new technique toprobe these noncovalent interactions isMS. To determine protein–protein orprotein–ligand noncovalent interactionsby MS, a soft ionization process, allow-ing the noncovalent interaction toremain intact, is required. Electrospray aswell as nanoelectrospray have provenvaluable in determining noncovalentinteractions. For this application, nano-electrospray offers several benefits overconventional electrospray includingdecreased sample consumption,increased tolerance to salts, and the for-mation of smaller droplets leading toincreased ionization efficiency [18,97].
With the increasing costs associatedwith the development of novel drugs, thereis pressure on the pharmaceutical industryto streamline research and development.This is achieved by screening a target pro-tein against a combinatorial library. Withthe low sample consumption of nano-electrospray, less protein is required toscreen more ligands. By examining theresults, the chemists and biologists gain agreater understanding of the structure
activity relationship between the protein–ligand. Furthermore,by identifying ligands that bind selectively and with high affin-ity to target proteins, lower drug dosages can be prescribed topatients, which in turn will minimize the chances of adverseside effects.
The ESI Chip has recently been used to detect and screen fordrug candidates by protein–ligand interactions [98]. Benkestockand coworkers coupled chip-based nano-ESI with a Q-TOF 1mass spectrometer to assess the binding affinity of a subset of acombinatorial library to two different human fatty acid-bind-ing proteins (FABP); heart (H)-FABP and adipose (A)-FABP.FIGURE 6A depicts the spectrum of H-FABP, while FIGURE 6B–E
show the resulting mass spectra of H-FABP incubated individ-ually with four different ligands. The spectra from FIGURE 6A & B
are very similar, indicating that ligand 647 does not form anoncovalent interaction with H-FABP. However, inFIGURES 6C–E, ions corresponding to the protein–ligand com-plexes are observed, suggesting that each of these ligands formsa noncovalent interaction with H-FABP. In addition to simplyobserving whether or not the protein and ligand formed a non-covalent interaction, some quantitative information is also
1960 1980 2000 2020 2040 2060 2080 2100 2120 2140 2160 2180 2200m/z
0
100
%
0
100
%
0
100
%
0
100
%
0
100
%
P+L
H-FABP + ligand 46
H-FABP + ligand 592
H-FABP + ligand 681
H-FABP + ligand 1794
P
P
P
No interaction
P+L
P+L
H-FABP
(P+L)-P=182 Da
(P+L)-P=156 Da
(P+L)-P=354 Da
A
B
C
D
E
P
Protein (P)
P+acetic acid P+natural ligand
Figure 6. MS spectra of H-FABP. (A) H-FABP (23 µM) without ligand. (B-E) (blowup of charge state +8) Potential ligands to H-FABP. P = m/z of H-FABP and P+L = m/z of complex. (P+L)-P = molecular mass of the ligand. Reproduced with permission from [98].H-FABP: Heart fatty acid-binding protein; m/z: Mass-to-charge ratio.

Automated nanoelectrospray for proteomics studies
www.future-drugs.com 461
observed. For example, if one considers the relative intensity of‘P’ versus ‘P+L’ for FIGURE 6C compared with FIGURE 6E, itbecomes apparent that ligand 592 from FIGURE 6C has a higherbinding affinity for H-FABP than ligand 1794 from FIGURE 6E.Furthermore, Benkestock and coworkers showed that when acocktail of seven ligands, only one of which was known to havean affinity for H-FABP, was incubated with H-FABP, the lig-and with the known affinity for H-FABP was easily identified[98]. Benkestock compared the results of the ligand screeningby chip-based nano-ESI with results obtained from nuclear
magnetic resonance (NMR) screening. The results for the 23ligands screened against H- and A-FABP by NMR and MS areshown in TABLE 2. The two techniques demonstrated very goodcorrelation for all ligands except for one, 2500. Interestingly,the MS results showed a selectivity difference between ligands3081 and 3084 and the two FABP proteins. It is this ligandselectivity difference between two very similar proteins that ismost interesting and crucial for the development of novelpharmaceuticals. The authors concluded that chip-based auto-mated nano-ESI could be used as a primary screening method
Table 2. Comparison of ligand binding between nuclear magnetic resonance and mass spectrometry screening.
Ligand MW(theor.) (Da) H-FABP A-FABP
MS hit ∆M (Da) NMR hit MS hit ∆M (Da) NMR hit293 200 N - N N - N
592 182 Y§§ 0 Y Y§§ 0 Y
596 153 N - N N - N
601 174 N - N N - N
647 123 N - N N - N
663 147 N - N N - N
681 155 Y +1 Y Y 0 Y
1379 154 N - N N - N
1794 354 Y 0 Y Y 0 Y
1892 138 Y 0 Y Y -2 Y
2281 163 N - N N - N
2396 151 Y§ - Y Y§ - Y
2497 172 Y 0 Y Y 0 Y
2500 142 N - Y N - Y
2506 172 Y -1 Y Y -3 Y
3081 182 Y 0 Y Y§§ -1 Y
3084 202 Y§§ -2 Y y -1 Y
3559 197 N - N N - N
4033 183 Y§§ -1 Y Y§§ -2 Y
4438 189 Y§§ 0 Y Y§§ -2 Y
4465 225 N - N N - N
BVT.1960 166 Y 0 Y Y 0 Y
BVT.1961 208 Y§§ 0 Y Y§§ 0 Y
Comp. mixture 168 Y§§ +1 Y Y§§ -3 Y
§Very weak binder.§§Potentially strong binder.∆M = MW(theor.)–MW(exp.).Reproduced with permission from [98].A/H-FABP: Adipose/heart fatty acid-binding protein; MS: Mass spectrometry; MW: Molecular weight; N: No; NMR: Nucelar magnetic resonance; Y: Yes.

Zhang & Van Pelt
462 Expert Rev. Proteomics 1(4), (2004)
in the early phases of drug development. The authors estimatedthat a sample capacity of 2200 compounds/week could bescreened individually [98]. This was 50-times faster than NMRfor single compounds and approximately fivefold faster forscreens of mixtures. The speed, in combination with low proteinconsumption, renders this approach very promising.
Robinson and coworkers used chip-based nanoelectrospray toscreen the binding affinity of various synthetic ligands to the tetra-meric plasma protein transthyretin (TTR), a 55-kDa multiproteintarget [99]. It is known that TTR has two binding sites and thatwhen ligands are bound to the tetramer, the complex is more stablethan its apo- form and dissociation of the tetramer is significantlyreduced [100,101]. The authors showed the resulting mass spectrumof TTR incubated with thyroxine. Ions corresponding to apo-TTR-tetramer, tetramer complexed with one thyroxine moleculeand tetramer complexed with two thyroxine molecules were clearlyobserved. Furthermore, by changing the cone voltage, it was dem-onstrated that the ESI Chip could be used to access the stability ofTTR in the presence of ligands. The authors also showed a highdegree of nozzle-to-nozzle reproducibility using this chip-basedapproach. By analyzing TTR across five different nozzles andfocusing on the most intense ion in the +15 charge state of thetetramer, the relative standard deviation was calculated as 5.3%.The authors also made some comparisons between the chip-basedapproach and the conventional pulled-capillary approach. It wasfound that although the chip-based approach had only half thesensitivity of the pulled-capillary method, the chip-based approachhad a tenfold increase in signal stabilitycompared with pulled-capillary. Theauthors conclude that measuring the abil-ity of small molecules to stabilize proteincomplexes using the chip-based approachwill enable high-throughput screening ofmultiprotein complexes.
The ESI Chip device holds an additionalbenefit in that the nozzles within a chip, aswell as between chips, are identical to oneanother. A high degree of nozzle-to-nozzlereproducibility has been previously dem-onstrated [58,99,102]. This high reproducibil-ity is absolutely imperative when perform-ing quantitative studies, such as for thedetermination of dissociation constants aswas reported recently using a Q-TOFmicro-mass spectrometer [103]. The reportinvestigated the well-characterized inter-actions between RNase A and the ligandscytidine 2´-monophosphate (2´-CMP)and cytidine triphosphate (CTP). FIGURE 7A
shows the mass spectrum of 10 µM RNaseA in 10 mM ammonium acetate, pH 6.8,and the resulting spectra of RNase A–lig-and complexes are shown in FIGURE 7B–D.The three charge states from +8 to +6 ofthe protein and its complexes are observed.
In these spectra, not only are the ions indicating the presence offree RNase A apparent, but a second set of ions, shifted to ahigher m/z, is also present. This second set of ions corresponds tothe RNase A–2´-CMP or RNase A–CTP complex, unambigu-ously indicating the presence of this noncovalent protein–ligandinteraction. A similar scenario is observed in FIGURE 7D, where10 µM of both 2´-CMP and CTP have been added to theRNase A solution, and once again the ion series corresponding tofree RNase A is present, as well as an additional ion series corre-sponding to both protein–CMP and protein–CTP complexesshifted to higher m/z values. The peak areas from three chargestates were summed for both free RNase A and RNase A–ligandcomplex(es) and used for quantitative noncovalent binding inter-action studies. Two different means were used for determiningdissociation constants (Kds) of RNase A–ligand complexes. Thefirst was through a titration experiment where the protein con-centration was held constant and the ligand concentration wassystematically varied. Then, by plotting [RL]/[R] versus [Li]-[RL], according to the equation [RL]/[R] = 1/Kd ([Li] - [RL]) fora single binding site, the Kd can be determined from the inverseof the slope [103]. The second means was using a competitivebinding experiment. By using an equimolar concentration ofRNase A, 2´-CMP and CTP, the dissociation constants could bedetermined using the two equations, KdRL1 =[R]([R]+[RL2])/[RL1] and KdRL2 = [R]([R]+[RL1])/[RL2]. Theexperimentally determined Kds for RNase A–CMP and RNaseA–CTP by both titration and competitive binding are consistent,
Relative intensity (%)
1600 1800 2000 2200 2400m/z
0
100
%
0
100
%
0
100
%
0
100
%8+
7+
6+
RNase A
RNase A+2’-CMP
RNase A+CTP
RNase A+CMP+CTP
A
B
C
D
Figure 7. Representative nanoelectrospray mass spectra of the noncovalent interactions of RNase A with 2´-CMP and CTP obtained in 10 mM ammonium acetate, pH 6.8. Arrows indicate the mass shift at each charge state for complexes formed. (A–D) Mass spectra of (A) 10 µM RNase A, (B) 10 µM RNase A plus 10 µM 2´-CMP, (C) 10 µM RNase A plus 10 µM 2´-CTP, (D) 10 µM RNase A plus 10 µM 2´-CMP and 10 µM 2´-CTP. Reproduced with permission from [103].
CMP: Cytidine monophosphate; CTP: Cytidine triphosphate; RNase: Ribonuclease.

Automated nanoelectrospray for proteomics studies
www.future-drugs.com 463
suggesting that nonspecific binding in this assay was minimized.Furthermore, these results obtained from chip-based nano-ESI/MS are comparable with those published from other con-ventional techniques such as calorimetry and circular dichroism[104-106]. It was demonstrated that the chip-based approach is inrelatively good agreement with previously reported values.
In this report, the authors also investigated the noncovalentinteractions between an endocellulase mutant protein, Cel6AD117Acd, and four oligosaccharide ligands. Dissociation con-stants were determined through both titration and competitivebinding experiments. This was the first report of Kds for threeendocellulase–ligand complexes. The only system whose disso-ciation constant had previously been determined was Cel6AD117Acd-cellotriose. The Kd of this complex, as determinedby spectrofluorimetry, is 68.0 ± 6.6 µM [107], and determinedby chip-based nano-ESI is 77.5 ± 9.2 µM. Again, the chip-based results were in very good agreement with those obtainedby conventional techniques. The authors concluded that chip-based nanoelectrospray can be used to determine micromolarand submicromolar solution binding constants.
Not only is this chip-based nano-ESI system being deemeduseful for drug discovery by screening protein–ligand andmultiprotein–ligand complexes, but also through its quantita-tive and qualitative capabilities for pharmaceutical compounds.The value of the system in quantitative determination of non-covalent interactions has been discussed. However the quantita-tive utility of the system for drug discovery does not end there.
The automated chip-based infusion nano-ESI platform hasalso been employed in the quantitation of drug molecules frombiologic matrices. Kapron and coworkers reported the quantita-tion of midazolam from fortified human plasma using alpra-zolam as an internal standard [102]. The intra- and interassay pre-cision and accuracy were acceptable for rapid drug discoveryanalyses. Six different plasma lots provided variability and accu-racy within 20% at the lower limit of quantitation and 15% atthe upper limit of quantitation. Dethy and coworkers reportedquantitation of verapamil and norverapamil from human plasmausing gallopamil as an internal standard [108]. Acceptable preci-sion and accuracy values were acquired over the range of5–500 ng/ml. The chip-based system has also been used forCaco-2 analysis, an in vitro permeability test of a drug candidateacross the intestine membrane used in the drug discovery process[109]. The results from an offline desalt step followed by chip-based automated nano-ESI/MS/MS were compared with thosefrom an LC/MS/MS approach. The permeability and recoverydata obtained from a parallel analysis of Caco-2 samples by con-ventional LC/MS/MS and by chip-based nano-ESI/MS/MS werein excellent agreement [109]. The results demonstrate that thechip-based approach is an alternative for rapid Caco-2 analysis.
In recent reports, the utility of infusion chip-based nano-ESIfor the structure elucidation of metabolites has been high-lighted. It is important that the pharmaceutical industry hasknowledge of the metabolites formed in vivo to avoid a drugbeing removed from the market because of unexpected toxicmetabolites that were overlooked in the development phase.
Consequently, it is invaluable for pharmaceutical companies tohave a means of identifying all metabolites formed by a particu-lar drug. Hofgartner and coworkers have shown that by collect-ing LC fractions and then infusing each fraction with the chip-based nano-ESI system, data can be acquired for a longer dura-tion and summed, improving the S/N ratios in the resultingmass spectra [110]. By infusing an LC fraction containing ametabolite of interest, Hofgartner and coworkers reported a 20-fold gain in sensitivity and increased structural information,compared with online LC/MS/MS results [110,111]. This gain isapparently attributed to infusion providing the time to opti-mize MS/MS conditions, followed by the ability to sum spectraover a 2 min analysis time. Hofgartner points out that nano-ESI also allows one to perform many different types of experi-ments such as MS, selective reaction monitoring, precursorscanning and MSn, in positive or negative ionization mode.Miller and coworkers successfully demonstrated the potentialof chip-based infusion with precursor ion scanning for metabo-lite identification [112]. Consequently, chip-based nano-ESI willaid this very challenging metabolite identification application.
LipidomicsLipidomics is an expanding research field, due in part to recentadvances in technologies and novel applications of ESI/MS.Lipidomics focuses on quantitative and qualitative identificationof lipid metabolism, biologically active lipids, biomembrane andlipid-mediated signaling transduction that regulates cellularhomeostasis during health and disease. Several excellent andextensive reviews covering these developments and applicationshave recently been published [113,114]. ESI/MS has proven to beone of the most sensitive, discriminating and direct methods toassess alterations in the cellular lipidome [114]. This is mainlysince ESI/MS can provide rapid and sensitive quantitative analy-sis of lipid classes, subclasses and individual molecular specieswithout prior chromatographic separation or derivatization. Pre-cursor ion or neutral loss scanning in a classic nano-ESI/MS/MSanalysis has been demonstrated as particularly useful for qualita-tive and quantitative analysis of complex membrane lipid mix-tures at the subpicomole level [115]. As current ESI/MS-basedlipidomic analysis is mainly focused on the infusion approach,one can expect that chip-based infusion would be an ideal nano-ESI source in this relatively new and expanding research field. Asa good example, Ejsing and coworkers recently developed a newapproach toward shotgun lipidomics for high-throughput profil-ing of the molecular composition of phospholipids [116]. Thedescribed chip-based nano-ESI system was used to acquire auto-mated acquisition for the profiling (both qualitative and quanti-tative) of the various phospholipids by multiple precursor ionscanning for the head groups and fatty acid groups in both nega-tive and positive ion modes on a Q-STAR mass spectrometer.The subsequent identification and quantification of detectedlipid species was performed by computer-assisted data analysiswith the newly developed Lipid Profiler software. The spectragenerated from multiple precursor ion scans showed that sevendifferent glycerophospholipids were simultaneously detected [116]

Zhang & Van Pelt
464 Expert Rev. Proteomics 1(4), (2004)
and quantified in the automated analysis, with 27 min per run(1 min for initial TOF/MS, 25 min for multiple precursor ionscanning and 1 min for TOF/MS). Consistent TOF/MS signalintensity between the first and last minute of acquisition wereachieved for ten runs of the same aliquot of sample, demonstrat-ing that automated chip-based nano-ESI provides a constantinfusion spray for multiple precursor ion analysis throughout anentire 27-min acquisition time with reproducibility suitable forhigh-throughput lipidomics studies [116].
Expert opinion & five-year viewThe use of microfluidic devices with MS detection has now pro-gressed to commercialization. Proteomic applications using chip-based devices coupled to MS is an active field motivated by thelarge-scale need to characterize low-abundance proteins with lim-ited available quantity of sample. The studies outlined in thisreview demonstrate that automated chip-based nano-ESI is apromising technique, offering not only automation and highthroughput, but also many other benefits to a wide variety of pro-teomic applications. These benefits include low sample consump-tion, ease of use, no sample-to-sample cross-contamination andextended acquisition times that yield improved MS data quality.The ongoing developments promise even greater future improve-ments. For example, the development of high-density (400 noz-zles) ESI Chips can reduce the cost per sample. Design of an ESIChip with a single inlet leading to multiple nozzle outlets allowingspray from a multiplex of nozzles simultaneously could providenanoelectrospray benefits of lower ion suppression and higher sen-sitivity even at relatively high flow rates. The coupling of a nano-LC column to the ESI Chip or the coupling of a pipette tip,packed with stationary phase, to the ESI Chip offers online sepa-ration capability in an automated format [117]. In addition, as thereduction or absence of signal suppression was demonstrated bynano-ESI/MS at minimal flow rates below 20 nl/min [22,24],development of small i.d. spray nozzles or emitter devices wouldprovide a true nano-ESI platform for MS analysis, which could beextremely useful in further improved detection sensitivity for avariety of proteomics applications.
Despite the substantial progress made in recent years, thereremain many challenges in the field still requiring investigation.Thus far, major research has focused on the development ofindividual reaction, separation and detection platforms on achip. Therefore, the integration of sample preparation and liq-uid delivery techniques to the chip making a true proteomicslab-on-a-chip platform will be a key and significant step for-ward. The glass-based microsystem device introduced byThibault’s laboratory is closest to fulfilling the requirements asan integrated device for proteomics study [41]. However, noproduct has yet been commercialized. Other developments inthis field have already been presented including a chip with abuilt-in single LC column by Agilent Technologies [118], andplacement of monolithic stationary phase within the 100 flowpaths on the ESI Chip [119] and within the microchannel of theSU-8-based microsystem [120]. Development of multidimen-sional LC capabilities integrated into the chip will make the
device more powerful in deconvoluting complex samples. Anarray of multiple integrated LC columns on a chip for eitherrepeat or single use would be another direction for the technol-ogy but is a challenging task. Incorporating affinity techniquesdirectly onto the chip through either an integrated LC columnor by coating the surface of the chip device for improving sepa-ration would be extremely attractive for PTMs studies. Thesefully integrated, chip-based affinity techniques could also possi-bly lead to the development of microarray and microfluidicdevices for ESI/MS analysis. In addition, the application ofmicrofluidic devices in pharmaceutical analyses has great poten-tial. Fast screening of drug candidates from combinatory chem-istry, the assessment of drug metabolites, and the rapid quanti-tation of early ADME studies could potentially be conductedusing chip-based ESI/MS.
AcknowledgementsAuthors are grateful for the following collaboration: 2D gelwork (Theodore Thannhauser and Yong Yang, USDA-ARS atCornell); Generation of LTQ data (Dirk Chelius, ThermoElec-tron). We thank Kevin Howe for his technical support in pro-tein identification. Authors also would like to thank Jack Hen-ion, Mark Allen, Gary Schultz, Tom Corso and Jie Li forreviewing the manuscript and for providing helpful comments.
Key issues
• Nanoelectrospray offers many benefits over conventional electrospray including improved ionization efficiency, reduced matrix suppression and low sample consumption.
• However, using conventional pulled-capillaries, the nanoelectrospray technique suffers from shortcomings including tedious and intensive optimization processes requiring a skilled user, limited sample throughput and poor reproducibility between capillaries.
• Automated chip-based nanoelectrospray takes advantage of all the benefits of nanoelectrospray and offers a solution to all the shortcomings of the conventional pulled-capillary technique.
• Chip-based nanoelectrospray offers an easy-to-use, high-throughput means of performing nanoelectrospray with a high degree of nozzle-to-nozzle reproducibility to meet the needs of proteomic analyses.
• This infusion nanoelectrospray device provides sufficient time for data averaging, improving data quality and for providing the time required to perform tandem mass spectrometry, precursor ion scanning, neutral-loss scanning and other slower scanning techniques.
• Automated, infusion, chip-based nanoelectrospray can be used in a variety of proteomic applications such as protein identification, post-translational modification characterization, top-down proteomics, noncovalent interactions and lipid analysis.
• Integration of sample preparation and liquid chromatography on chip-based nanoelectrospray devices for future products.

Automated nanoelectrospray for proteomics studies
www.future-drugs.com 465
ReferencesPapers of special note have been highlighted as:• of interest•• of considerable interest
1 Peng J, Gygi SP. Proteomics: the move to mixtures. J. Mass Spectrom. 36, 1083–1091 (2001).
2 Anderson L, Seilhamer J. A comparison of selected mRNA and protein abundances in human liver. Electrophoresis 18, 533–537 (1997).
3 Gygi SP, Rochon Y, Franza BR, Aebersold R. Correlation between protein and mRNA abundance in yeast. Mol. Cell. Biol. 19, 1720–1730 (1999).
4 Aebersold R, Goodlett DR. Mass spectrometry in proteomics. Chem. Rev. 101, 269–295 (2001).
5 Mann M, Hendrickson RC, Pandey A. Analysis of proteins and proteomes by mass spectrometry. Ann. Rev. Biochem. 70, 437–473 (2001).
6 Yarmush ML, Jayaraman A. Advances in proteomic technologies. Ann. Rev. Biomed. Eng. 4, 349–373 (2002).
7 Reyes DR, Iossifidis D, Auroux PA, Manz A. Micro total analysis systems. 1. Introduction, theory, and technology. Anal. Chem. 74, 2623–2636 (2002).
8 Auroux PA, Iossifidis D, Reyes DR, Manz A. Micro total analysis systems. 2. Analytical standard operations and applications. Anal. Chem. 74, 2637–2652 (2002).
9 Huikko K, Kostiainen R, Kotiaho T. Introduction to micro-analytical systems: bioanalytical and pharmaceutical applications. Eur. J. Pharm. Sci. 20, 149–171 (2003).
10 Marko-Varga G, Nilsson J, Laurell T. New directions of miniaturization within the proteomics research area. Electrophoresis 24, 3521–3532 (2003).
11 Mouradian S. Lab-on-a-chip: applications in proteomics. Curr. Opin. Chem. Biol. 6, 51–56 (2002).
12 Uchiyama K, Nakajima H, Hobo T. Detection method for microchip separations. Anal. Bioanal. Chem. 379, 375–382 (2004).
13 Limbach PA, Meng Z. Integrating micromachined devices with modern mass spectrometry. Analyst 127, 693–700 (2002).
•• Classifies chip-based nanoelectrospray ionization (ESI)/mass spectrometry (MS) techniques as either off- or on-chip ion production.
14 Spikmans V, Lane SJ, Leavens B, Manz A, Smith NW. On-line on-chip post-column derivatization reactions for pre-ionization of analytes and cluster analysis in gradient micro-liquid chromatography/electrospray mass spectrometry. Rapid Commun. Mass Spectrom. 16, 1377–1388 (2002).
15 Gygi SP, Aebersold R. Mass spectrometry and proteomics. Curr. Opin. Chem. Biol. 4, 489–494 (2000).
16 Mo W, Karger BL. Analytical aspects of mass spectrometry and proteomics. Curr. Opin. Chem. Biol. 6, 666–675 (2002).
17 Hancock WS, Wu SL, Shieh P. The challenges of developing a sound proteomics strategy. Proteomics 2, 352–359 (2002).
18 Wilm M, Mann M. Analytical properties of the nanoelectrospray ion source. Anal. Chem. 68, 1–8 (1996).
• Presents and extensively characterizes the fundamental differences between nano-ESI and conventional ESI.
19 Wilm M, Shevchenko A, Houthaeve T et al. Femtomole sequencing of proteins from polyacrylamide gels by nano-electrospray mass spectrometry. Nature 379, 466–469 (1996).
20 Valaskovic GA, Murphy JP III, Lee MS. Automated orthogonal control system for electrospray ionization. J. Am. Soc. Mass Spectrom. 15, 1201–1215 (2004).
21 Mora JF, Van Berkel GJ, Enke CG, Cole RB, Martinez-Sanchez M, Fenn JB. Electrochemical processes in electrospray ionization mass spectrometry. J. Mass Spectrom. 35, 939–952 (2000).
22 Schmidt A, Karas M, Dulcks T. Effect of different solution flow rates on analyte ion signals in nano-ESI MS, or: when does ESI turn into nano-ESI? J. Am. Soc. Mass Spectrom. 14, 492–500 (2003).
23 Juraschek R, Dulcks T, Karas M. Nanoelectrospray – more than just a minimized-flow electrospray ionization source. J. Am. Soc. Mass Spectrom. 10, 300–308 (1999).
• First paper to associate the low flow rate of nano-ESI with reduced matrix suppression.
24 Gangl ET, Annan MM, Spooner N, Vouros P. Reduction of signal suppression effects in ESI-MS using a nanosplitting device. Anal. Chem. 73, 5635–5644 (2001).
25 Geromanos S, Freckleton G, Tempst P. Tuning of an electrospray ionization source for maximum peptide-ion transmission into a mass spectrometer. Anal. Chem. 72, 777–790 (2000).
26 Gabelica V, Vreuls C, Filee P, Duval V, Joris B, Pauw ED. Advantages and drawbacks of nanospray for studying noncovalent protein–DNA complexes by mass spectrometry. Rapid Commun. Mass Spectrom. 16, 1723–1728 (2002).
27 Sjodahl J, Melin J, Griss P, Emmer A, Stemme G, Roeraade J. Characterization of micromachined hollow tips for two-dimensional nanoelectrospray mass spectrometry. Rapid Commun. Mass Spectrom. 17, 337–341 (2003).
28 Figeys D, Gygi SP, McKinnon G, Aebersold R. An integrated microfluidics-tandem mass spectrometry system for automated protein analysis. Anal. Chem. 70, 3728–3734 (1998).
29 Lazar IM, Ramsey RS, Ramsey JM. On-chip proteolytic digestion and analysis using ‘wrong-way-round’ electrospray time-of-flight mass spectrometry. Anal. Chem. 73, 1733–1739 (2001).
30 Li J, Thibault P, Bings NH et al. Integration of microfabricated devices to capillary electrophoresis-electrospray mass spectrometry using a low dead volume connection: application to rapid analyses of proteolytic digests. Anal. Chem. 71, 3036–3045 (1999).
31 Chartogne A, Tjaden UR, Van der Greef J. A free-flow electrophoresis chip device for interfacing capillary isoelectric focusing on-line with electrospray mass spectrometry. Rapid Commun. Mass Spectrom. 14, 1269–1274 (2000).
32 Zhang B, Liu H, Karger BL, Foret F. Microfabricated devices for capillary electrophoresis-electrospray mass spectrometry. Anal. Chem. 71, 3258–3264 (1999).
33 Zhang B, Foret F, Karger BL. A microdevice with integrated liquid junction for facile peptide and protein analysis by capillary electrophoresis/electrospray mass spectrometry. Anal. Chem. 72, 1015–1022 (2000).
34 Deng Y, Henion J, Li J, Thibault P, Wang C, Harrison DJ. Chip-based capillary electrophoresis/mass spectrometry determination of carnitines in human urine. Anal. Chem. 73, 639–646 (2001).
35 Deng Y, Zhang H, Henion J. Chip-based quantitative capillary electrophoresis/mass spectrometry determination of drugs in human plasma. Anal. Chem. 73, 1432–1439 (2001).
36 Kameoka J, Craighead HG, Zhang H, Henion J. A polymeric microfluidic chip for CE/MS determination of small molecules. Anal. Chem. 73, 1935–1941 (2001).

Zhang & Van Pelt
466 Expert Rev. Proteomics 1(4), (2004)
37 Wachs T, Henion J. Electrospray device for coupling microscale separations and other miniaturized devices with electrospray mass spectrometry. Anal. Chem. 73, 632–638 (2001).
38 Tan A, Benetton S, Henion JD. Chip-based solid-phase extraction pretreatment for direct electrospray mass spectrometry analysis using an array of monolithic columns in a polymeric substrate. Anal. Chem. 75, 5504–5511 (2003).
39 Benetton S, Kameoka J, Tan A, Wachs T, Craighead H, Henion JD. Chip-based P450 drug metabolism coupled to electrospray ionization-mass spectrometry detection. Anal. Chem. 75, 6430–6436 (2003).
40 Liu H, Felten C, Xue Q et al. Development of multichannel devices with an array of electrospray tips for high-throughput mass spectrometry. Anal. Chem. 72, 3303–3310 (2000).
41 Li J, LeRiche T, Tremblay TL et al. Application of microfluidic devices to proteomics research: identification of trace-level protein digests and affinity capture of target peptides. Mol. Cell. Proteomics 1, 157–168 (2002).
•• Develops and demonstrates the first fully integrated proteomics-on-a-chip microsystem for ESI/MS-based high throughput analysis of in-gel digested sample.
42 Xue Q, Foret F, Dunayevskiy YM, Zavracky PM, McGruer NE, Karger BL. Multichannel microchip electrospray mass spectrometry. Anal. Chem. 69, 426–430 (1997).
• First report of a glass chip with direct electrospray from the planar open end of a microchannel at the edge of a chip.
43 Ramsey SR, Ramsey JM. Generating electrospray from microchip devices using electroosmotic pumping. Anal. Chem. 69, 1174–1178 (1997).
44 Schultz GA, Corso TN, Prosser SJ, Zhang S. A fully integrated monolithic microchip electrospray device for mass spectrometry. Anal. Chem. 72, 4058–4063 (2000).
•• Describes development of a silicon-based on-chip nano-ESI microchip device (ESI Chip) using deep reactive ion etching technologies and demonstrates automated nano-ESI/MS analysis.
45 Licklider L, Wang XQ, Desai A, Tai YC, Lee TD. A micromachined chip-based electrospray source for mass spectrometry. Anal. Chem. 72, 367–375 (2000).
46 Rohner TC, Rossier JS, Girault HH. Polymer microspray with an integrated thick-film microelectrode. Anal. Chem. 73, 5353–5357 (2001).
47 Tang K, Lin Y, Matson DW, Kim T, Smith RD. Generation of multiple electrosprays using microfabricated emitter arrays for improved mass spectrometric sensitivity. Anal. Chem. 73, 1658–1663 (2001).
48 Yuan CH, Shiea J. Sequential electrospray analysis using charp-tip channels fabrication on a plastic chip. Anal. Chem. 73, 1080–1083 (2001).
49 Schilling M, Nigge W, Rudzinski A, Neyer A, Hergenroder R. A new on-chip ESI nozzle for coupling of MS with microfluidic devices. Lab. Chip 4, 220–224 (2004).
50 Muck A, Svatos A. Atmospheric molded poly(methylmethacrylate) microchip emitters for sheathless electrospray. Rapid Commun. Mass Spectrom. 18, 1459–1464 (2004).
51 Kim JS, Knapp DR. Microfabricated PDMS multichannel emitter for electrospray ionization mass spectrometry. J. Am. Soc. Mass Spectrom. 12, 463–469 (2001).
52 Jiang Y, Wang PC, Locascio LE, Lee CS. Integrated plastic microfluidic devices with ESI-MS for drug screening and residue analysis. Anal. Chem. 73, 2048–2053 (2001).
53 Huikko K, Ostman P, Grigoras K et al. Poly(dimethylsiloxane) electrospray devices fabricated with diamond-like carbon-poly(dimethylsiloxane) coated SU-8 masters. Lab. Chip 3, 67–72 (2003).
54 Svedberg M, Veszelei M, Axelsson J, Vangbo M, Nikolajeff F. Poly(dimethylsiloxane) microchip: microchannel with integrated open electrospray tip. Lab. Chip 4, 322–327 (2004).
55 Figeys D, Pinto D. Proteomics on a chip: promising developments. Electrophoresis 22, 208–216 (2001).
56 Van Pelt CK, Zhang S, Kapron JT, Huang X, Henion J. Chip-based automated nanoelectrospray mass spectrometry. American Laboratory 35, 14–21 (2003).
57 Zhang S, Van Pelt CK, Henion JD. Automated chip-based nanoelectrospray-mass spectrometry for rapid identification of proteins separated by two-dimensional gel electrophoresis. Electrophoresis 24, 3620–3632 (2003).
• First extensive evaluation of a fully automated chip-based nano-ESI/tandem MS analysis for high-throughput protein identification of 2D gel samples.
58 Van Pelt CK, Zhang S, Henion JD. Characterization of a fully automated nanoelectrospray system with mass
spectrometric detection for proteomic analyses. J. Biomol. Techniques 13, 72–84 (2002).
• Describes and characterizes the utilities of a chip-based nano-ESI system for proteomics applications.
59 Lin D, Tabb DL, Yates JR. Large-scale protein identification using mass spectrometry. Biochim. Biophys. Acta 1646, 1–10 (2003).
60 Rutherford JL, Bonapace J, Nguyen M, Pekar T, Hinerfeld D, Pirro J. MS gas phase fractionation of albumin depleted and associated serum: a sixty minute MudPIT approach. Proceedings of the 52nd ASMS Conference on Mass Spectrometry and Allied Topics, TN, USA (2004).
61 Yi EC, Marelli M, Lee H et al. Approaching complete peroxisome characterization by gas-phase fractionation. Electrophoresis 23, 3205–3216 (2002).
62 Van Pelt CK, Zhang S, Howe KJ. Automated nanoelectrospray mass spectrometry analysis of off-line collected liquid chromatography fractions: a powerful new technique for increasing sequence coverage. Proceedings of the 51st ASMS Conference on Mass Spectrometry and Allied Topics, Montreal, Canada (2003).
63 Lund AL, Van Pelt CK, Nold MJ, Martin LB, Li JB. Comparison of peak parking versus automated fraction analysis of a complex protein mixture. Proceedings of the 51st ASMS Conference on Mass Spectrometry and Allied Topics, Montreal, Canada (2003).
64 Annan RS, Carr SA. The essential role of mass spectrometry in characterizing protein structure: mapping posttranslational modifications. J. Protein Chem. 16, 391–402 (1997).
65 Quadroni M. Specific detection and analysis of phosphorylated peptides by mass spectrometry. In: Proteome Research: Mass Spectrometry. James P (Ed.), Springer-Verlag, Berlin, Germany, 187–206 (2001).
66 Kinter M, Sherman NE. The characterization of post-translationally modified proteins using tandem mass spectrometry. In: Protein Sequencing and Identification Using Tandem Mass Spectrometry. Desiderio DM, Nibbering NM (Eds), Wiley-Intersciences, Inc., NY, USA, 269–293 (2000).
67 Corso TN, Zhang S, Chelius D. Identification of phosphorylation sites using automated chip-based nanoelectrospray coupled to a linear ion trap mass spectrometer. Proceedings of the 52nd ASMS Conference on Mass Spectrometry and Allied Topics, TN, USA (2004).

Automated nanoelectrospray for proteomics studies
www.future-drugs.com 467
68 Zhang S, Legesse-Miller A, Van Pelt CK, Brescher AP. Mapping phosphorylation sites of yeast myosin using chip-based nanoelectrospray with precursor ion scanning quadrupole TOF mass spectrometry. Proceedings of the 52nd ASMS Conference on Mass Spectrometry and Allied Topics, TN, USA (2004).
69 Apweiler R, Hermjakob H, Sharon N. On the frequency of protein glycosylation, as deduced from analysis of the SWISS-PROT database. Biochim. Biophys. Acta 1473, 4–8 (1999).
70 Zaia J. Mass spectrometry of oligosaccharides. Mass Spectrom. Rev. 23, 161–227 (2004).
71 Bahr U, Pfenninger A, Karas M, Stahl B. High-sensitivity analysis of neutral underivatized oligosaccharides by nanoelectrospray mass spectrometry. Anal. Chem. 69, 4530–4535 (1997).
72 Sandra K, Devreese B, Van Beeumen J, Stals I, Claeyssens M. The Q-Trap mass spectrometer, a novel tool in the study of protein glycosylation. J. Am. Soc. Mass Spectrom. 15, 413–423 (2004).
73 Zamfir A, Vakhrushev S, Sterling A, Niebel HJ, Allen M, Peter-Katalinic J. Fully automated chip-based mass spectrometry for complex carbohydrate system analysis. Anal. Chem. 76, 2046–2054 (2004).
•• Presents the first implementation of the ESI Chip-based nano-ESI system for glycosylation studies on complex mixtures associated with two different glycosylation disorder diseases.
74 Zamfir A, Peter-Katalinic J. Glycoscreening by on-line sheathless capillary electrophoresis/electrospray ionization-quadrupole time of flight-tandem mass spectrometry. Electrophoresis 22, 2448–2457 (2001).
75 Zhang S, Chelius D. Characterization of protein glycosylation using chip-based infusion nanoelectrospray linear in trap tandem mass spectrometry. J. Biomol. Tech. 15, 120–133 (2004).
76 Ferguson PL, Smith RD. Proteome analysis by mass spectrometry. Ann. Rev. Biophys. Biomol. Struct. 32, 399–424 (2003).
77 Kelleher NL. Top-down proteomics. Anal. Chem. 76, 197A–203A (2004).
78 Zubarev RA, Horn DM, Fridriksson EK et al. Electron capture dissociation for structural characterization of multiply charged protein cations. Anal. Chem. 72, 563–573 (2000).
79 Zubarev RA, Kelleher NL, McLafferty FW. Electron capture dissociation of multple
charged protein cations. A nonergodic process. J. Am. Chem. Soc. 120, 3265–3266 (1998).
80 Forbes AJ, Mazur MT, Patel HM, Walsh CT, Kelleher NL. Toward efficient analysis of >70 kDa proteins with 100% sequence coverage. Proteomics 1, 927–933 (2001).
81 Ge Y, El-Naggar M, Sze SK et al. Top down characterization of secreted proteins from Mycobacterium tuberculosis by electron capture dissociation mass spectrometry. J. Am. Soc. Mass Spectrom. 14, 253–261 (2003).
82 Ge Y, Lawhorn BG, El-Naggar M et al. Top down characterization of larger proteins (45 kDa) by electron capture dissociation mass spectrometry. J. Am. Chem. Soc. 124, 672–678 (2002).
83 Johnson JR, Meng F, Forbes AJ, Cargile BJ, Kelleher NL. Fourier-transform mass spectrometry for automated fragmentation and identification of 5–20 kDa proteins in mixtures. Electrophoresis 23, 3217–3223 (2002).
84 Taylor GK, Kim YB, Forbes AJ, Meng F, McCarthy R, Kelleher NL. Web and database software for identification of intact proteins using ‘top down’ mass spectrometry. Anal. Chem. 75, 4081–4086 (2003).
85 Patrie SM, Robinson DE, Meng F, Du Y, Kelleher NL. Stratagies for automating top-down protein analysis with Q-FTICR MS. Int. J. Mass Spectrom. 234, 175–184 (2004).
86 Forbes AJ, Patrie SM, Taylor GK, Kim YB, Jiang L, Kelleher NL. Targeted analysis and discovery of posttranslational modifications in proteins from methanogenic archaea by top-down MS. Proc. Natl Acad. Sci. USA 101, 2678–2683 (2004).
87 Meng F, Du Y, Miller LM, Patrie SM, Robinson DE, Kelleher NL. Molecular-level description of proteins from Saccharomyces cerevisiae using quadrupole FT hybrid mass spectrometry for top down proteomics. Anal. Chem. 76, 2852–2858 (2004).
88 Renfrow MB, Cooper HJ, Tomana M et al. Determination of aberrant O-glycosylation in the IgA1 hinge region by electron capture dissociation Fourier transform ion cyclotron resonance mass spectrometry. J. Biol. Chem. (2004) (In Press).
89 Petricoin EF, Fishman DA, Conrads TP, Veenstra TD, Liotta LA. Lessons from Kitty Hawk: from feasibility to routine clinical use for the field of proteomic pattern diagnostics. Proteomics 4, 2357–2360 (2004).
90 Tang N, Tornatore P, Weinberger SR. Current developments in SELDI affinity technology. Mass Spectrom. Rev. 23, 34–44 (2004).
91 Merchant M, Weinberger SR. Recent advancements in surface-enhanced laser desorption/ionization-time of flight-mass spectrometry. Electrophoresis 21, 1164–1177 (2000).
92 Petricoin EF, Ornstein DK, Paweletz CP et al. Serum proteomic patterns for detection of prostate cancer. J. Natl Cancer Inst. 94, 1576–1578 (2002).
93 Petricoin EF, Ardekani AM, Hitt BA et al. Use of proteomic patterns in serum to identify ovarian cancer. Lancet 359, 572–577 (2002).
94 Adam BL, Qu Y, Davis JW et al. Serum protein fingerprinting coupled with a pattern-matching algorithm distinguishes prostate cancer from benign prostate hyperplasia and healthy men. Cancer Res. 62, 3609–3614 (2002).
95 Schultz GA, Zhang S, Howe KJ, Van Pelt CK. Development of a proteome marker model for ovarian cancer by direct analysis of diluted serum by automated nano-ESI-TOF/MS. Proceedings of the 51st ASMS Conference on Mass Spectrometry and Allied Topics, Montreal, Canada (2003).
96 Hao Z, Howe K, Van Pelt CK et al. Application of chip-based, automated nanoelectrospray mass spectrometry for proteomic pattern recognition. CHI’s Protein Biomarkers: Applications in Diagnostics, Drug Development, and Toxicoproteomics, PA, USA (2003).
97 Mann M, Wilm M. Error-tolerant identification of peptides in sequence databases by peptide sequence tags. Anal. Chem. 66, 4390–4399 (1994).
98 Benkestock K, Van Pelt CK, Akerud T, Sterling A, Edlund PO, Roeraade J. Automated nano-electrospray mass spectrometry for protein-ligand screening by noncovalent interaction applied to human H-FABP and A-FABP. J. Biomol. Screen. 8, 247–256 (2003).
•• First report of screening drug candidates through protein–ligand interactions using ESI Chip-based nano-ESI/MS. The results were compared with these obtained from nuclear magnetic resonance.
99 Keetch CA, Hernanndez H, Sterling A, Baumert M, Allen MH, Robinson CV. Use of a microchip device coupled with mass spectrometry for ligand screening of a multi-protein target. Anal. Chem. 75, 4937–4941 (2003).
100 Baures PW, Peterson SA, Kelly JW. Discovering transthyretin amyloid fibril
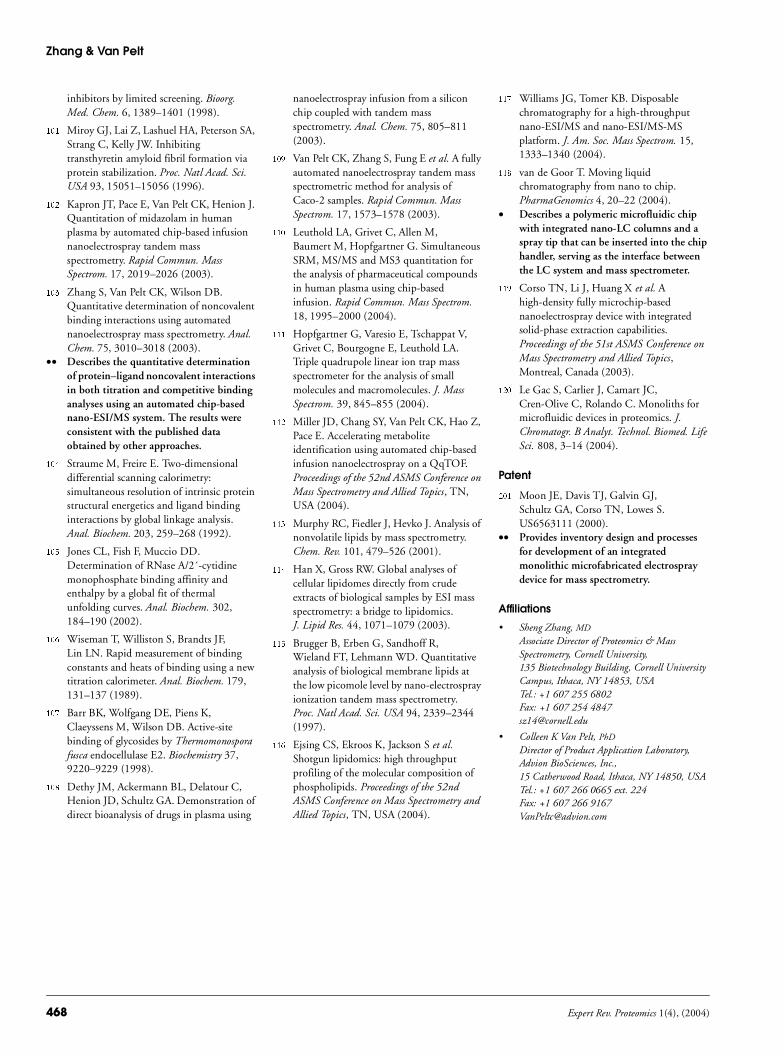
Zhang & Van Pelt
468 Expert Rev. Proteomics 1(4), (2004)
inhibitors by limited screening. Bioorg. Med. Chem. 6, 1389–1401 (1998).
101 Miroy GJ, Lai Z, Lashuel HA, Peterson SA, Strang C, Kelly JW. Inhibiting transthyretin amyloid fibril formation via protein stabilization. Proc. Natl Acad. Sci. USA 93, 15051–15056 (1996).
102 Kapron JT, Pace E, Van Pelt CK, Henion J. Quantitation of midazolam in human plasma by automated chip-based infusion nanoelectrospray tandem mass spectrometry. Rapid Commun. Mass Spectrom. 17, 2019–2026 (2003).
103 Zhang S, Van Pelt CK, Wilson DB. Quantitative determination of noncovalent binding interactions using automated nanoelectrospray mass spectrometry. Anal. Chem. 75, 3010–3018 (2003).
•• Describes the quantitative determination of protein–ligand noncovalent interactions in both titration and competitive binding analyses using an automated chip-based nano-ESI/MS system. The results were consistent with the published data obtained by other approaches.
104 Straume M, Freire E. Two-dimensional differential scanning calorimetry: simultaneous resolution of intrinsic protein structural energetics and ligand binding interactions by global linkage analysis. Anal. Biochem. 203, 259–268 (1992).
105 Jones CL, Fish F, Muccio DD. Determination of RNase A/2´-cytidine monophosphate binding affinity and enthalpy by a global fit of thermal unfolding curves. Anal. Biochem. 302, 184–190 (2002).
106 Wiseman T, Williston S, Brandts JF, Lin LN. Rapid measurement of binding constants and heats of binding using a new titration calorimeter. Anal. Biochem. 179, 131–137 (1989).
107 Barr BK, Wolfgang DE, Piens K, Claeyssens M, Wilson DB. Active-site binding of glycosides by Thermomonospora fusca endocellulase E2. Biochemistry 37, 9220–9229 (1998).
108 Dethy JM, Ackermann BL, Delatour C, Henion JD, Schultz GA. Demonstration of direct bioanalysis of drugs in plasma using
nanoelectrospray infusion from a silicon chip coupled with tandem mass spectrometry. Anal. Chem. 75, 805–811 (2003).
109 Van Pelt CK, Zhang S, Fung E et al. A fully automated nanoelectrospray tandem mass spectrometric method for analysis of Caco-2 samples. Rapid Commun. Mass Spectrom. 17, 1573–1578 (2003).
110 Leuthold LA, Grivet C, Allen M, Baumert M, Hopfgartner G. Simultaneous SRM, MS/MS and MS3 quantitation for the analysis of pharmaceutical compounds in human plasma using chip-based infusion. Rapid Commun. Mass Spectrom. 18, 1995–2000 (2004).
111 Hopfgartner G, Varesio E, Tschappat V, Grivet C, Bourgogne E, Leuthold LA. Triple quadrupole linear ion trap mass spectrometer for the analysis of small molecules and macromolecules. J. Mass Spectrom. 39, 845–855 (2004).
112 Miller JD, Chang SY, Van Pelt CK, Hao Z, Pace E. Accelerating metabolite identification using automated chip-based infusion nanoelectrospray on a QqTOF. Proceedings of the 52nd ASMS Conference on Mass Spectrometry and Allied Topics, TN, USA (2004).
113 Murphy RC, Fiedler J, Hevko J. Analysis of nonvolatile lipids by mass spectrometry. Chem. Rev. 101, 479–526 (2001).
114 Han X, Gross RW. Global analyses of cellular lipidomes directly from crude extracts of biological samples by ESI mass spectrometry: a bridge to lipidomics. J. Lipid Res. 44, 1071–1079 (2003).
115 Brugger B, Erben G, Sandhoff R, Wieland FT, Lehmann WD. Quantitative analysis of biological membrane lipids at the low picomole level by nano-electrospray ionization tandem mass spectrometry. Proc. Natl Acad. Sci. USA 94, 2339–2344 (1997).
116 Ejsing CS, Ekroos K, Jackson S et al. Shotgun lipidomics: high throughput profiling of the molecular composition of phospholipids. Proceedings of the 52nd ASMS Conference on Mass Spectrometry and Allied Topics, TN, USA (2004).
117 Williams JG, Tomer KB. Disposable chromatography for a high-throughput nano-ESI/MS and nano-ESI/MS-MS platform. J. Am. Soc. Mass Spectrom. 15, 1333–1340 (2004).
118 van de Goor T. Moving liquid chromatography from nano to chip. PharmaGenomics 4, 20–22 (2004).
• Describes a polymeric microfluidic chip with integrated nano-LC columns and a spray tip that can be inserted into the chip handler, serving as the interface between the LC system and mass spectrometer.
119 Corso TN, Li J, Huang X et al. A high-density fully microchip-based nanoelectrospray device with integrated solid-phase extraction capabilities. Proceedings of the 51st ASMS Conference on Mass Spectrometry and Allied Topics, Montreal, Canada (2003).
120 Le Gac S, Carlier J, Camart JC, Cren-Olive C, Rolando C. Monoliths for microfluidic devices in proteomics. J. Chromatogr. B Analyt. Technol. Biomed. Life Sci. 808, 3–14 (2004).
Patent
201 Moon JE, Davis TJ, Galvin GJ, Schultz GA, Corso TN, Lowes S. US6563111 (2000).
•• Provides inventory design and processes for development of an integrated monolithic microfabricated electrospray device for mass spectrometry.
Affiliations
• Sheng Zhang, MD
Associate Director of Proteomics & Mass Spectrometry, Cornell University, 135 Biotechnology Building, Cornell University Campus, Ithaca, NY 14853, USATel.: +1 607 255 6802Fax: +1 607 254 [email protected]
• Colleen K Van Pelt, PhD
Director of Product Application Laboratory, Advion BioSciences, Inc., 15 Catherwood Road, Ithaca, NY 14850, USATel.: +1 607 266 0665 ext. 224Fax: +1 607 266 [email protected]