chinook salmon escapement and run timing in the gulkana river
TRANSCRIPT

Fishery Data Series No. 13-07
Chinook Salmon Escapement and Run Timing in the Gulkana River, 2011–2012
by Scott H. Maclean
March 2013
Alaska Department of Fish and Game Divisions of Sport Fish and Commercial Fisheries

Symbols and Abbreviations The following symbols and abbreviations, and others approved for the Système International d'Unités (SI), are used without definition in the following reports by the Divisions of Sport Fish and of Commercial Fisheries: Fishery Manuscripts, Fishery Data Series Reports, Fishery Management Reports, and Special Publications. All others, including deviations from definitions listed below, are noted in the text at first mention, as well as in the titles or footnotes of tables, and in figure or figure captions. Weights and measures (metric) centimeter cm deciliter dL gram g hectare ha kilogram kg kilometer km liter L meter m milliliter mL millimeter mm Weights and measures (English) cubic feet per second ft3/s foot ft gallon gal inch in mile mi nautical mile nmi ounce oz pound lb quart qt yard yd Time and temperature day d degrees Celsius °C degrees Fahrenheit °F degrees kelvin K hour h minute min second s Physics and chemistry all atomic symbols alternating current AC ampere A calorie cal direct current DC hertz Hz horsepower hp hydrogen ion activity pH (negative log of) parts per million ppm parts per thousand ppt, ‰ volts V watts W
General Alaska Administrative Code AAC all commonly accepted abbreviations e.g., Mr., Mrs.,
AM, PM, etc. all commonly accepted professional titles e.g., Dr., Ph.D., R.N., etc. at @ compass directions:
east E north N south S west W
copyright corporate suffixes:
Company Co. Corporation Corp. Incorporated Inc. Limited Ltd.
District of Columbia D.C. et alii (and others) et al. et cetera (and so forth) etc. exempli gratia (for example) e.g. Federal Information Code FIC id est (that is) i.e. latitude or longitude lat. or long. monetary symbols (U.S.) $, ¢ months (tables and figures): first three letters Jan,...,Dec registered trademark trademark United States (adjective) U.S. United States of America (noun) USA U.S.C. United States
Code U.S. state use two-letter
abbreviations (e.g., AK, WA)
Mathematics, statistics all standard mathematical signs, symbols and abbreviations alternate hypothesis HA base of natural logarithm e catch per unit effort CPUE coefficient of variation CV common test statistics (F, t, χ2, etc.) confidence interval CI correlation coefficient (multiple) R correlation coefficient (simple) r covariance cov degree (angular ) ° degrees of freedom df expected value E greater than > greater than or equal to ≥ harvest per unit effort HPUE less than < less than or equal to ≤ logarithm (natural) ln logarithm (base 10) log logarithm (specify base) log2, etc. minute (angular) ' not significant NS null hypothesis HO percent % probability P probability of a type I error (rejection of the null hypothesis when true) α probability of a type II error (acceptance of the null hypothesis when false) β second (angular) " standard deviation SD standard error SE variance population Var sample var

FISHERY DATA SERIES NO. 13-07
CHINOOK SALMON ESCAPEMENT AND RUN TIMING IN THE GULKANA RIVER, 2011–2012
By Scott H. Maclean
Alaska Department of Fish and Game, Division of Sport Fish, Fairbanks
Alaska Department of Fish and Game Division of Sport Fish, Research and Technical Services 333 Raspberry Road, Anchorage, Alaska, 99518-1599
March 2013
Development and publication of this manuscript were partially financed under Grant Numbers F10AF00553 and F11AF01015, and by the Federal Aid in Sport fish Restoration Act (16 U.S.C.777-777K) under Project F-10-26 and 27, Job No. S-3-1(a).

ADF&G Fishery Data Series was established in 1987 for the publication of Division of Sport Fish technically oriented results for a single project or group of closely related projects, and in 2004 became a joint divisional series with the Division of Commercial Fisheries. Fishery Data Series reports are intended for fishery and other technical professionals and are available through the Alaska State Library and on the Internet: http://www.adfg.alaska.gov/sf/publications/ This publication has undergone editorial and peer review.
Scott H. Maclean, Alaska Department of Fish and Game, Division of Sport Fish,
Mile 186 Glenn Hwy, Glennallen, AK 99588, USA This document should be cited as: Maclean, S. H. 2013. Chinook salmon escapement and run timing in the Gulkana River, 2011-2012. Alaska
Department of Fish and Game, Fishery Data Series No. 13-07, Anchorage.
The Alaska Department of Fish and Game (ADF&G) administers all programs and activities free from discrimination based on race, color, national origin, age, sex, religion, marital status, pregnancy, parenthood, or disability. The department administers all programs and activities in compliance with Title VI of the Civil Rights Act of 1964, Section 504 of the Rehabilitation Act of 1973, Title II of the Americans with Disabilities Act (ADA) of 1990, the Age Discrimination Act of 1975, and Title IX of the Education Amendments of 1972.
If you believe you have been discriminated against in any program, activity, or facility please write: ADF&G ADA Coordinator, P.O. Box 115526, Juneau, AK 99811-5526
U.S. Fish and Wildlife Service, 4401 N. Fairfax Drive, MS 2042, Arlington, VA 22203 Office of Equal Opportunity, U.S. Department of the Interior, 1849 C Street NW MS 5230, Washington DC 20240
The department’s ADA Coordinator can be reached via phone at the following numbers: (VOICE) 907-465-6077, (Statewide Telecommunication Device for the Deaf) 1-800-478-3648,
(Juneau TDD) 907-465-3646, or (FAX) 907-465-6078 For information on alternative formats and questions on this publication, please contact:
ADF&G, Division of Sport Fish, Research and Technical Services, 333 Raspberry Road, Anchorage AK 99518 (907) 267-2375

i
TABLE OF CONTENTS Page LIST OF TABLES..........................................................................................................................................................i LIST OF FIGURES ...................................................................................................................................................... ii
ABSTRACT .................................................................................................................................................................. 1
INTRODUCTION ......................................................................................................................................................... 1
OBJECTIVES ................................................................................................................................................................ 3
METHODS .................................................................................................................................................................... 3
Chinook Salmon Escapement ........................................................................................................................................ 3 Data Analysis ........................................................................................................................................................... 4
Sockeye Salmon Escapement ........................................................................................................................................ 6 RESULTS ...................................................................................................................................................................... 6
Chinook Salmon Escapement ........................................................................................................................................ 6 Sockeye Salmon Escapement ........................................................................................................................................ 7 DISCUSSION ................................................................................................................................................................ 7 CONCLUSION ........................................................................................................................................................... 27
ACKNOWLEDGMENTS ........................................................................................................................................... 27
REFERENCES CITED ............................................................................................................................................... 28
LIST OF TABLES Table Page 1. Water clarity classification scheme. ................................................................................................................ 7 2. Daily counts, expanded counts, and the cumulative estimated escapement of Chinook salmon at the
Gulkana River tower, 2011. ............................................................................................................................ 8 3. Daily counts, expanded counts, interpolations, and the cumulative estimated escapement of Chinook
salmon at the Gulkana River tower, 2012. .................................................................................................... 10 4. Daily expanded counts, including interpolations, of Chinook salmon at the Gulkana River tower,
2002–2012. .................................................................................................................................................... 13 5. Daily average water level at the Gulkana River tower, 2002–2012. ............................................................. 15 6. Daily maximum water temperature at the Gulkana River tower, 2002–2012. .............................................. 17 7. Percent of Gulkana River Chinook salmon run past the counting tower by 1 July and average
maximum water temperature between 10 June and 30 June, 2002–2012, including the percent of return interpolated each year. ........................................................................................................................ 19
8. Escapement, standard error, aerial count, and proportion of escapement by survey date of Chinook salmon upstream of the tower in the Gulkana River, 2002–2012, excluding 2003 and 2008. ...................... 20
9. Daily counts, expanded counts, and the cumulative estimated escapement of sockeye salmon at the Gulkana River tower, 2011. .......................................................................................................................... 22
10. Daily counts, expanded counts, interpolations, and the cumulative estimated escapement of sockeye salmon at the Gulkana River tower, 2012. .................................................................................................... 24

ii
LIST OF FIGURES Figure Page 1. The Gulkana River drainage and location of the counting tower. ................................................................... 2 2. Estimated diel migratory pattern for 2011 and 2012, the cumulative proportion of average daily counts
by hour of day for Chinook salmon migrating past the Gulkana River counting tower. ............................... 12 3. Estimated run timing pattern for Gulkana River Chinook salmon past the counting tower in 2011 and
2012, compared to the 2002–2010 average. .................................................................................................. 12 4. June 10–30 average maximum water temperature and the arcsine transformed percentage of the
Chinook salmon run on June 30 at the Gulkana River fish counting tower, 2003–2012. ............................. 19 5. Percent of Gulkana River Chinook salmon run past the counting tower by 1 July, 2002–2012. ................. 20 6. Counting tower escapement estimates with 95% confidence intervals compared with aerial index
counts for Gulkana River Chinook, 2002–2012 excluding 2003 and 2008. .................................................. 21

1
ABSTRACT Counting tower techniques were used for the 10th and 11th consecutive years on the Gulkana River to estimate the escapement of Chinook salmon Oncorhynchus tshawytscha upstream of the West Fork Gulkana River. During 2011 and 2012, the Gulkana River counting tower was in operation from 2 June through 10 August and 5 June through 10 August, respectively. This time period accounted for the entire Chinook salmon run and a portion of the sockeye salmon O. nerka run. The estimated escapement of Chinook salmon was 3,804 (SE=257) in 2011 and 1,730 (SE=157) in 2012. The estimated minimum escapement of sockeye salmon was 38,048 (SE=1,683) in 2011 and 41,953 (SE=1,951) in 2012. Analysis of 10 years of Gulkana River Chinook salmon counting tower data revealed a significant positive correlation between water temperature and run timing. Results indicate 88% of the variation in run timing prior to 1 July can be explained by average maximum water temperature. The majority of the run migrates upstream of the counting tower before 1 July in years when average maximum water temperatures are considered warm (16o–18oC) versus a smaller proportion when the water temperatures are considered cool (9o–14oC). The temperature and run timing relationship may aid managers when making inseason decisions about the Gulkana River Chinook salmon sport fishery.
Key words: Chinook salmon, Oncorhynchus tshawytscha, sockeye salmon, O. nerka, Copper River, Gulkana River, counting tower, escapement, run timing, water temperature
INTRODUCTION The Gulkana River supports spawning populations of Chinook salmon Oncorhynchus tshawytscha, sockeye salmon O. nerka, rainbow/steelhead trout O. mykiss, and Arctic grayling Thymallus arcticus. The mainstem of the river is fed by the East Fork, Middle Fork, and West Fork Gulkana rivers (Figure 1). The river is one of six major spawning tributaries for Chinook salmon in the Copper River drainage and it supports the largest Chinook salmon sport fishery in the Copper River drainage and Upper Copper-Upper Susitna Management Area (Jennings et al. 2009a, 2009b, 2010). Annual sport harvest and effort has increased substantially from 606 Chinook salmon in 1978 (Mills 1979) to an average of 2,687 Chinook salmon during 2000–2009 (Somerville 2011). In addition to the inriver sport fishery, the Gulkana River Chinook salmon stock is subject to harvest in commercial fisheries located near the mouth of the Copper River and subsistence and personal use (PU) fisheries located in the mainstem of the Copper River. There are no stock specific estimates of harvest available for these fisheries, but similar to the Gulkana River sport harvest, these mixed stock fisheries have also shown an overall increase in harvest until recently (Botz and Somerville 2011).
In 2003, the Alaska Board of Fisheries amended the Copper River King Salmon Management Plan to include a sustainable escapement goal of 24,000 or more Chinook salmon for the Copper
River drainage. Inriver abundance is estimated annually and inriver harvest is subtracted post-season to obtain an estimate of drainagewide escapement. In contrast, there is no information available regarding stock-specific escapements or exploitation rates, and there are no established escapement goals for any of the Copper River tributaries.
The section of the Gulkana River upstream of Sourdough Landing (Figure 1) has been designated by the U.S. Congress as a “wild river,” which makes it part of the National Wild and Scenic Rivers System. The Bureau of Land Management (BLM) manages the adjacent lands along both banks within this area and has the authority to limit the number of trips per year or number of people per trip. To date, no permit system isin place; however, increased fishing effort coupled with diminishing Chinook salmon escapements during the beginning of this century led stakeholders to submit proposals to the Alaska Board of Fisheries to limit motor boat use. In 2002, a multi-year cooperative project was initiated between ADF&G and BLM to monitor Chinook salmon escapement on the Gulkana River using counting tower techniques. The Gulkana River was selected because (1) the stock on average makes up a significant percentage (~ 20%) of the total Copper River escapement (Savereide 2005), (2) it supports the largest sport

2
Figure 1.–The Gulkana River drainage and location of the counting tower.
Denali Hwy
To Delta Junction
Richardson Hwy
Middle Fork Gulkana River
10 km
Copper
River
West Fork Gulkana River
East Fork
Gulkana River
Mainstem Gulkana River
Paxson Lake
Counting Tower
Sourdough
Landing
Summit Lake
To Glennallen

3
fishery in the Copper River drainage, (3) fishing pressure had increased, (4) the accuracy of annual aerial escapement surveys was unknown, and (5) it is the only tributary in the Copper River drainage supporting a substantial Chinook salmon sport fishery that is not glacially occluded. Managers need inseason information on run size, run timing, and an escapement goal to better manage the sport fishery and ensure escapements are adequate enough to sustain production. The long-term goal of this project is to collect Chinook salmon escapement data to establish an escapement goal and aid in developing inseason management guidelines for (i.e., whether to close, restrict, or liberalize) the Gulkana River sport fishery.
OBJECTIVES The 2011–2012 project objectives were to:
1. Estimate escapement of Chinook salmon, within 15 percent of the actual value 95 percent of the time, upstream of an established counting tower site on the mainstem Gulkana River;
2. Describe inriver run timing for Chinook salmon past the counting tower; and
3. Enumerate sockeye salmon passage at the counting tower during the period of tower operation.
METHODS CHINOOK SALMON ESCAPEMENT The number of Chinook salmon migrating upstream of the counting tower in the mainstem Gulkana River was estimated using counting tower techniques. Anecdotal information from sport fishers and guides and the results from previous aerial surveys (Taube 2002) and radiotelemetry studies (Savereide 2005) indicated that the majority (>80%) of spawning in the Gulkana River drainage occurred upstream of the selected tower site (Figure 1). Counting begins on or about 1 June and continues into August until there are three continuous days with no net upstream migration of Chinook salmon.
The number of Chinook salmon that migrate past the counting tower is equal to escapement above the tower if there is no harvest upstream of the tower site. Even though this is not true, the harvest upstream of the tower has been relatively small (<5%) compared to the estimate of escapement and its associated uncertainty. Since 2007, the Statewide Harvest Survey has delineated the harvest between Paxson and Sourdough Landing to estimate the harvest above the counting tower, which averaged 102 Chinook salmon from 2007–2010.
The counting tower was located approximately 2.5 km upstream from the confluence of the West Fork and the mainstem Gulkana River and 72.4 km from the mouth of the Gulkana at the Copper River and 296 km from the mouth of the Copper River (Figure 1). This location was chosen because the majority of spawning occurs upstream of this site and to avoid the often turbid discharge of the West Fork. A small island splits the mainstem into two channels at the tower site. Steel scaffolding platforms approximately 4 m above the water were located on each side of the island to provide a comprehensive view of the entire river (approximately 30 m wide per channel). The towers supported dome-shaped pole frames that were covered on the top and three sides with camouflage-print tarps to prevent shadows on the water and to provide the observer with protection from wind and rain. Maximum depth in both channels ranged from 1 to 1.5 m. To ensure migrating fish were clearly visible a continuous band of white vinyl panels, approximately 2.5 m wide, was anchored to the river bottom across each river channel. There was also a 2–3 m section of picket weir placed near the base of each tower to ensure no fish were able to pass undetected directly beneath the towers. To ensure optimal viewing conditions, the panels were cleaned of debris, silt, gravel, and fish carcasses between scheduled counts as necessary. During periods of low ambient light, exterior-grade floodlights were used to illuminate the panels across each channel. Once the lights were turned on, they remained on between counts to maintain consistent conditions until no longer needed. This was done to reduce any associated

4
effect that lighting changes may have had on salmon migration. Six technicians (two three-person crews) were assigned to enumerate the salmon escapement in the Gulkana River in 2011 and 2012. Two 10-min counting periods (one per channel, 20 min total) were scheduled every hour, for 24 h each day. Each day was divided into three 8-h shifts. Shift I began at 0600 and ended at 1359; Shift II began at 1400 and ended at 2159 hour; Shift III began at 2200 hour and ended at 0559 hour. The 10-min count for the west channel began between the top of the hour and 10 min past, and the 10-min count for the east channel immediately followed. Numbers of Chinook and sockeye salmon were tallied and recorded on data forms at the end of each 10-min counting period. Separate data forms were maintained for each day and channel. Migration (upstream and downstream) was recorded to provide a net upstream migration during each 10-min count. Migration was defined as passage across the full width of the vinyl panels. In addition, at the beginning of each hour, water level (relative level on a staff gauge) and water clarity (Table 1) were recorded. Conditions that might affect the counts (e.g., heavy rain or strong winds) and general observations were recorded in the comments column. Water and air temperature were recorded at the beginning of each shift. Data Analysis Estimates of Chinook salmon escapement were stratified by day. Daily estimates of escapement were a single-stage direct expansion from the 10-min counting periods. The 10-min counting periods were considered a systematic sample because the counting periods were not chosen randomly. Hourly count data were combined across channels before calculating estimates in order to account for the covariance between channel-specific hourly counts. An analysis of data collected during 2002 revealed that Chinook salmon had a distinct diel migratory pattern where the majority of salmon migration takes place in the evening and early morning hours (Taras and Sarafin 2005). To account for this pattern of migration, a “count day” was defined as 1600 to 1559. Taras and Sarafin (2005) also demonstrated that
interpolating for undercounts (a rank of 4.5 or 5) using this diel migratory pattern yielded more accurate estimates of escapement than using a direct expansion of the successful counts within eight-hour shifts for that day. The diel pattern is derived from all days with complete counts (no missing hours). A diel pattern consists of 24 proportion estimates, which indicate the hourly proportion of fish passing through the tower over the entire day. In order to estimate the diel pattern, all fish counts in a particular hour over all complete count days are summed to determine a total fish count for this hour throughout the entire counting season. The proportion of this hour’s counts out of the total counts of all the passing fish is one element of the diel pattern.
To be reliable, interpolations based on the diel pattern must have at least some counts that were successfully completed during the period of peak migration. Peak migration is defined and estimated as the shortest, continuous period of time during a count day that accounted for 80% of the upstream migration of Chinook salmon. Therefore, daily escapement and its variance were estimated using one of three scenarios depending on water clarity conditions (Table 1):
1. When water clarity was excellent to poor (rank 1–4) for all scheduled counts during a day, actual counts were expanded to estimate daily escapement (equations 1–3);
2. When a small portion (defined below) of a day’s counts were conducted under very poor or unobservable water clarity (rank 4.5 or 5), daily escapement was estimated using a combination of expanded actual (equations 1–3) and interpolated (equations 1–4) counts; and
3. When most or all of a day’s counts were conducted under very poor or unobservable water clarity (rank 4.5 or 5), escapement for the entire day was interpolated (equations 5–6) using a moving average estimate of daily passage estimates before and after the missing day(s).

5
Scenario 1: For days when all counts were conducted under excellent to poor conditions, daily escapement, dN̂ , was calculated by expanding counts within a shift for day d (Cochran 1977):
∑=
=dm
jdj
d
dd y
mM
N1
ˆ . (1)
The period sampling is systematic, because the sample (or primary unit) has secondary units taken within every hour in a day (i.e., systematically throughout the day). As provided in Wolter (1985), the variance associated with periods was calculated as:
( ) ( )∑=
−−−
=dm
jjddj
dd yy
ms
2
2)1(
212
1. (2)
The variance for the expanded daily escapement was estimated as:
( )d
dd
d
dd m
sMMmNV
221ˆˆ
−= . (3)
where:
d = day;
j = paired 10-min counting period (a paired 10-min counting period consists of the two 10-min counts, one per channel, during a given hour);
y = observed period count (both channels combined);
m = number of paired 10-min counting periods sampled;
M = total number of possible paired 10-min counting periods.
Scenario 2: If counts were conducted successfully for a portion of the day that represents 25% or more of the expected migration for that day (as defined by the diel relationship), and if at least 25% of the periods during peak migration were successfully counted, then the channel-specific interpolated count was calculated as the product of the sum of successful counts for the day and the ratio of the expected daily
escapement not represented to the daily escapement that was represented, or:
edp
edpldcdc p
pyy
−×=
1actua,interp, , (4)
where:
interp,dcy = interpolated sum of counts for missing (i.e. very poor or unobservable) 10-min periods by channel;
actual,dcy = daily sum of successful 10-min counts by channel; and,
edpp = proportion of expected daily escapement successfully counted.
The interpolated count was then allocated among missed 10-min counting periods based on the diel pattern for the current year. For example, if four 10-min counting periods were missed and the interpolated count for that period was 10 Chinook salmon, those 10 fish would be allocated to each of the missed periods in proportion to the diel pattern.
Daily escapement and variances were calculated using a combination of actual and interpolated counts. Treating interpolated counts as “known” would result in underestimating the daily variances. Therefore, daily variance estimates were inflated by decreasing the number of 10-min counting periods, md, sampled each day by the proportion of the expected daily migration successfully counted on that day. For example, if 85% of the expected run was successfully counted on a given day, then the adjusted md = 0.85 x md = 0.85 x 24. For the channel-combined counts the proportion successfully counted was the channel-specific proportions weighted by the proportion of the overall run passing each channel. Although inflating the variance calculations guards against a negative bias in estimation of the total variance, this approach could still lead to unacceptably large biases if days with diel interpolations contribute substantially to the overall variance. Therefore, daily variances are estimated using this approach as long as interpolations using the diel pattern account for a small proportion of the total variance.

6
Scenario 3: If counts were conducted for a portion of the day that represented less than 25% of the expected escapement for that day, or if less than 25% of the periods during peak migration were counted successfully, then the moving average estimate for the missing day i was calculated as:
∑∑
+
−=
+
−== ki
kij
ki
kij ji
sampledwasjdayI
NsampledwasjdayIN
)(
ˆ)(ˆ (5)
where:
k = number of days missed due to adverse viewing conditions; and
otherwisetrueisconditionthewhen
01
)(I
=⋅ (6)
is an indicator function.
The interpolated values were used as the point estimates for the daily counts and the daily variation for undercounted days was the maximum variance of the k days before and the k days after the undercounted day i.
Escapement upstream of the counting tower and its associated variance incorporated all three daily migration estimation scenarios, and was estimated as (Cochran 1977):
∑=
=D
ddPT NN
1ˆˆ ; and (7)
( ) ∑=
=D
ddPT NVNV
1)ˆ(ˆˆˆ , (8)
where:
D = total number of possible days.
Prior to the initiation of the counting tower project in 2002, escapement of Chinook salmon in the Gulkana River was monitored by aerial survey counts. Aerial surveys were continued and provided data to investigate the relationship between the index counts and escapement measured at the towers. Analysis of all years of Gulkana River Chinook salmon counting tower data was completed to test for significant correlations between water temperature and run
timing. Regression analysis was used to define the relationship of 2002–2012 escapements to: aerial survey counts, water level, and water temperature.
SOCKEYE SALMON ESCAPEMENT The number of sockeye salmon migrating past the counting tower was estimated using the methods described for estimating Chinook salmon escapement. Because the sockeye salmon run was known to continue after counting ceased each year, the escapement estimate reflects an unknown portion of the total run and should be considered a minimum estimate of escapement.
RESULTS CHINOOK SALMON ESCAPEMENT In 2011, the Gulkana River counting tower was in operation from 2 June through 10 August. In 2012, the tower was in operation from 5 June through 10 August. Inclement weather resulted in less than favorable viewing conditions for zero days in 2011 and 7+ days in 2012 (Tables 2 and 3). The estimated Chinook salmon escapement upstream of the counting tower was 3,804 (SE = 257) in 2011 and 1,730 (SE = 157) in 2012. Interpolated estimates of daily passage, for days when visibility precluded counting, represented 0.0% of the total escapement estimate in 2011 and 6.0% of the total estimate in 2012. During 2011 and 2012, the estimated diel migratory pattern encompassed 82% and 81% of the daily migration from 0000 through 0700, respectively (Figure 2). The first Chinook salmon was observed on 12 and 11 June during each year respectively. The run was considered complete each year on 10 August. The 2011 and 2012 run timing pattern observed past the counting tower was later than the average over all years (2002–2010; Figure 3). Analysis of 10 years of Gulkana River Chinook salmon counting tower data revealed a significant positive correlation between water temperature and run timing. However, Chinook salmon run timing was not significantly related to water level (p > 0.05; Tables 4 and 5). The lowest water level recorded was during 2004 when 82% of the escapement returned by 1 July compared to an average of 33% for the other 10 years. Since

7
Table 1.–Water clarity classification scheme. Rank Description Salmon Viewing Water Condition 1 Excellent All passing salmon are
observable Virtually no turbidity or glare, “drinking water” clarity; all routes of migration observable
2 Good All passing salmon are observable
Minimal to very low levels of turbidity or glare; all routes of migration observable
3 Fair All passing salmon are observable
Low to moderate levels of turbidity or glare; all routes of migration observable
4 Poor Possible, but not likely, that some passing salmon may be missed
Moderate to high levels of turbidity or glare; a few likely routes of migration are partially obscured
4.5a Very poor Likely that some
passing salmon may be missed
Moderate to high levels of turbidity or glare; some, to many, likely routes of migration are obscured
5 Unobservable Passing fish are not observable
High level of turbidity or glare; ALL routes of migration obscured
a The ranking of 4.5 was inserted in 2007 to emphasize that further delineation was necessary for
defining “poor” visibility. This allows continuity with the scale used in previous years rather than change the scale to 1–6.
2002, over 81% of the Chinook salmon escapement passed the tower between 17 June and 31 July. The earliest count occurred on 3 June 2005. On average, the date 10 June is equivalent to the 1st percentile and 30 June the 41st percentile of the cumulative daily observations.
A higher percentage of Chinook salmon returned early (by 1 July) in 2004 (82%) and 2005 (60%), which coincided with warmer water temperatures. In contrast, a lower percentage of Chinook salmon returned by 1 July in 2009 (11%), which coincided with cooler water temperatures. A significant exponential relationship was revealed between the transformed percent of the run by 1 July and the average maximum water temperature between 10 June and 30 June (r2 = 0.88, p < 0.05, Tables 4, 6 and 7, Figure 4). Water temperature data was incomplete during 2002. Overall, the Chinook run timing has been trending later in recent years and experiencing cooler temperatures (Table 7; Figure 5).
A statistically significant relationship was also found between aerial index counts and escapement of Chinook salmon upstream of the tower (r2 = 0.84, p < 0.05; Table 8; Figure 6). Aerial survey data was incomplete during 2003 and inclement weather prohibited conducting a survey in 2008.
SOCKEYE SALMON ESCAPEMENT In 2011 and 2012, the minimum escapement estimate for sockeye salmon was 38,048 (SE = 1,683) and 41,953 (SE = 1,951). These were among the highest three escapements recorded since 2002 and more than 1.7 times higher than the 2002–2010 average of 22,955. The first sockeye salmon was observed on 3 and 6 June of each year respectively and counting ceased on 10 August (Tables 9 and 10).
DISCUSSION The main objective of an escapement monitoring project is to estimate total escapement for a particular stock, or provide an index of escapement that is relatively consistent over time with respect to the proportion of the escapement that is enumerated. In 2011 and 2012, the entire Chinook salmon run was assessed and enumerated successfully providing precise estimates of Chinook salmon escapement of 3,804 (SE = 257) and 1,730 (SE = 157) above the counting tower.
The run timing patterns of Chinook salmon past the tower, since 2003, are positively correlated with increasing water temperature. In other words, the majority of the run migrates upstream of the counting tower before 1 July in years

8
Table 2.–Daily counts, expanded counts, and the cumulative estimated escapement of Chinook salmon at the Gulkana River tower, 2011.
-continued-
Combined Total Date Daily Expanded Daily Expanded Daily Expanded Escapement2-Jun 0 0 0 0 0 0 03-Jun 0 0 0 0 0 0 04-Jun 0 0 0 0 0 0 05-Jun 0 0 0 0 0 0 06-Jun 0 0 0 0 0 0 07-Jun 0 0 0 0 0 0 08-Jun 0 0 0 0 0 0 09-Jun 0 0 0 0 0 0 0
10-Jun 0 0 0 0 0 0 011-Jun 0 0 0 0 0 0 012-Jun 0 0 1 6 1 6 613-Jun 1 6 1 6 2 12 1814-Jun 1 6 0 0 1 6 2415-Jun 0 0 0 0 0 0 2416-Jun 4 24 0 0 4 24 4817-Jun 3 18 1 6 4 24 7218-Jun 2 12 0 0 2 12 8419-Jun 7 42 1 6 8 48 13220-Jun 4 24 5 30 9 54 18621-Jun 5 30 2 12 7 42 22822-Jun 1 6 1 6 2 12 24023-Jun 3 18 1 6 4 24 26424-Jun 0 0 2 12 2 12 27625-Jun 9 54 7 42 16 96 37226-Jun 27 162 23 138 50 300 67227-Jun 11 66 7 42 18 108 78028-Jun 6 36 0 0 6 36 81629-Jun 0 0 0 0 0 0 81630-Jun 3 18 1 6 4 24 8401-Jul 4 24 -1 -6 3 18 8582-Jul 2 12 1 6 3 18 8763-Jul 31 186 32 192 63 378 1,2544-Jul 8 48 1 6 9 54 1,3085-Jul 5 30 1 6 6 36 1,3446-Jul -1 -6 0 0 -1 -6 1,3387-Jul 15 90 1 6 16 96 1,4348-Jul 22 132 4 24 26 156 1,590
West Channel East Channel

9
Table 2.–Page 2 of 2.
Combined Total Date Daily Expanded Daily Expanded Daily Expanded Escapement9-Jul 36 216 25 150 61 366 1,95610-Jul 2 12 7 42 9 54 2,01011-Jul 8 48 2 12 10 60 2,07012-Jul 22 132 1 6 23 138 2,20813-Jul 0 0 2 12 2 12 2,22014-Jul 15 90 10 60 25 150 2,37015-Jul 0 0 0 0 0 0 2,37016-Jul 0 0 0 0 0 0 2,37017-Jul 2 12 0 0 2 12 2,38218-Jul 2 12 2 12 4 24 2,40619-Jul 0 0 2 12 2 12 2,41820-Jul 1 6 2 12 3 18 2,43621-Jul 7 42 9 54 16 96 2,53222-Jul 8 48 4 24 12 72 2,60423-Jul 10 60 0 0 10 60 2,66424-Jul 14 84 19 114 33 198 2,86225-Jul 1 6 7 42 8 48 2,91026-Jul 3 18 -1 -6 2 12 2,92227-Jul 3 18 7 42 10 60 2,98228-Jul 5 30 4 24 9 54 3,03629-Jul 12 72 7 42 19 114 3,15030-Jul 13 78 7 42 20 120 3,27031-Jul 18 108 9 54 27 162 3,4321-Aug 17 102 6 36 23 138 3,5702-Aug 4 24 6 36 10 60 3,6303-Aug 8 48 14 84 22 132 3,7624-Aug 4 24 1 6 5 30 3,7925-Aug 1 6 0 0 1 6 3,7986-Aug 1 6 0 0 1 6 3,8047-Aug 0 0 0 0 0 0 3,8048-Aug 0 0 0 0 0 0 3,8049-Aug 0 0 0 0 0 0 3,804
10-Aug 0 0 0 0 0 0 3,804
West Channel East Channel

10
Table 3.–Daily counts, expanded counts, interpolations, and the cumulative estimated escapement of Chinook salmon at the Gulkana River tower, 2012. Shading identifies days with counts that included interpolation.
-continued-
Cumulative Date Daily Expanded Interpolated Daily Expanded Interpolated Daily Expanded Interpolated Escapement6-Jun 0 0 0 0 0 0 0 0 0 07-Jun 0 0 0 0 0 0 0 0 0 08-Jun 0 0 0 0 0 0 0 0 0 09-Jun 0 0 0 0 0 0 0 0 0 0
10-Jun 0 0 0 0 0 0 0 0 0 011-Jun 0 0 0 0 0 0 0 0 0 012-Jun 0 0 0 0 0 0 0 0 2.3 213-Jun 0 0 0.9 0 0 1.3 0 0 4.7 714-Jun 0 0 1.7 0 0 1.3 0 0 6.2 1315-Jun 0 0 1.7 0 0 4.0 0 0 6.9 2016-Jun 0 0 2.6 0 0 13.3 0 0 11.4 3217-Jun 0 0 4.3 0 0 12.7 0 0 24.2 5618-Jun 0 0 6.9 0 0 12.7 0 0 23.4 7919-Jun 1 6 6 0 0 12.7 1 6 18.7 9820-Jun 1 6 6 0 0 12.7 1 6 18.7 11621-Jun 0 0 0 2 12 12 2 12 12 12822-Jun 1 6 6 0 0 0 1 6 6 13423-Jun 2 12 12 4 24 24 6 36 36 17024-Jun 3 18 18 14 84 84 17 102 102 27225-Jun 0 0 0 -1 -6 -6 -1 -6 -6 26626-Jun 1 6 6 0 0 0 1 6 6 27227-Jun 0 0 0 0 0 0 0 0 0 27228-Jun 1 6 6 0 0 0 1 6 6 27829-Jun 1 6 6 1 6 6 2 12 12 29030-Jun 1 6 6 2 12 12 3 18 18 3081-Jul 2 12 12 1 6 6 3 18 18 3262-Jul 1 6 6 3 18 18 4 24 24 3503-Jul 4 24 24 4 24 24 8 48 48 3984-Jul 0 0 0 1 6 6 1 6 6 4045-Jul 5 30 30 0 0 0 5 30 30 4346-Jul 2 12 12 1 6 6 3 18 18 4527-Jul 1 6 6 5 30 30 6 36 36 4888-Jul 2 12 12 3 18 18 5 30 30 5189-Jul 0 0 0 2 12 12 2 12 12 53010-Jul 1 6 6 0 0 0 1 6 6 53611-Jul 2 12 12 0 0 0 2 12 12 54812-Jul 5 30 30 4 24 24 9 54 54 60213-Jul 2 12 12 1 6 6 3 18 18 62014-Jul 2 12 12 1 6 6 3 18 18 63815-Jul 2 12 12 2 12 12 4 24 24 66216-Jul 0 0 0 1 6 6 1 6 6 66817-Jul 2 12 12 0 0 0 2 12 12 68018-Jul 0 0 0 0 0 0 0 0 0 680
CombinedWest Channel East Channel

11
Table 3.–Page 2 of 2.
Cumulative Date Daily Expanded Interpolated Daily Expanded Interpolated Daily Expanded Interpolated Escapement
19-Jul 7 42 42 3 18 18 10 60 60 74020-Jul 5 30 30 2 12 12 7 42 42 78221-Jul 16 96 96 11 66 66 27 162 162 94422-Jul 3 18 18 4 24 24 7 42 42 98623-Jul 5 30 30 0 0 0 5 30 30 1,01624-Jul 6 36 36 -1 -6 -6 5 30 30 1,04625-Jul 7 42 42 6 36 36 13 78 78 1,12426-Jul 17 102 102 8 48 48 25 150 150 1,27427-Jul 10 60 60 7 42 42 17 102 102 1,37628-Jul 19 114 114 6 36 36 25 150 150 1,52629-Jul 4 24 24 4 24 24 8 48 48 1,57430-Jul 9 54 54 0 0 0 9 54 54 1,62831-Jul 4 24 24 -1 -6 -6 3 18 18 1,6461-Aug 4 24 24 5 30 30 9 54 54 1,7002-Aug 3 18 18 0 0 0 3 18 18 1,7183-Aug 1 6 6 0 0 0 1 6 6 1,7244-Aug 0 0 0 0 0 0 0 0 0 1,7245-Aug 1 6 6 0 0 0 1 6 6 1,7306-Aug 0 0 0 0 0 0 0 0 0 1,7307-Aug 0 0 0 0 0 0 0 0 0 1,7308-Aug 0 0 0 0 0 0 0 0 0 1,7309-Aug 0 0 0 0 0 0 0 0 0 1,730
10-Aug 0 0 0 0 0 0 0 0 0 1,730 Totals 166 996 1,014 105 630 701 271 1,626 1,730 1,730
West Channel East Channel Combined

12
Figure 2.–Estimated diel migratory pattern for 2011 and 2012, the cumulative proportion of average
daily counts by hour of day for Chinook salmon migrating past the Gulkana River counting tower.
Figure 3.–Estimated run timing pattern for Gulkana River Chinook salmon past the counting tower in
2011 and 2012, compared to the 2002–2010 average.
0.00
0.25
0.50
0.75
1.00
16:0
017
:00
18:0
019
:00
20:0
021
:00
22:0
023
:00
0:00
1:00
2:00
3:00
4:00
5:00
6:00
7:00
8:00
9:00
10:0
011
:00
12:0
013
:00
14:0
015
:00
Cum
ulat
ive P
ropo
rtion
24-Hour Time
20112012
0.00
0.25
0.50
0.75
1.00
0 10 20 30 40 50 60
Cum
ulat
ive P
ropo
rtion
Day of Run
Average 2002-201020112012

13
Table 4.–Daily expanded counts, including interpolations, of Chinook salmon at the Gulkana River tower, 2002–2012. Shading identifies days with counts that included interpolation.
Day 2002 2003 2004 2005 2006 2007 2008 2009 2010 2011 2012 27-May 28 May 29 May 30 May 31-May 0 0 0 0 0 1-Jun 0 0 0 0 0 0 2-Jun 0 0 0 0 0 0 0 3-Jun 0 0 6 0 0 0 0 0 4-Jun 0 0 12 0 0 0 0 0 0 5-Jun 0 0 6 0 0 0 0 0 0 0 6-Jun 0 54 12 0 0 0 0 0 0 0 7-Jun 0 0 114 6 0 0 0 0 0 0 0 8-Jun 0 0 42 6 0 0 6 0 6 0 0 9-Jun 0 6 6 0 0 -6 6 12 0 0 0 10-Jun 0 6 18 6 0 12 0 -6 42 0 0 11-Jun 0 6 24 12 0 24 12 0 0 0 0 12-Jun 18 54 6 48 6 12 24 4.5 6 6 2.3 13-Jun 0 24 0 72 18 18 6 4.5 0 12 4.7 14-Jun 0 30 6 78 36 66 24 10.5 0 6 6.2 15-Jun 0 42 24 96 42 0 42 12 0 0 6.9 16-Jun 18 90 42 54 24 48 72 12 6 24 11.4 17-Jun 48 36 48 114 18 6 90 6 24 24 24.2 18-Jun 78 30 42 282 84 30 120 24 36 12 23.4 19-Jun 96 36 174 120 48 36 90 24 42 48 18.7 20-Jun 408 36 372 90 46 90 48 48 18 54 18.7 21-Jun 198 120 342 12 42 66 96 18 30 42 12 22-Jun 218 42 360 0 12 60 126 12 54 12 6 23-Jun 90 138 318 78 6 120 42 0 54 24 36 24-Jun 156 78 234 120 92 168 24 6 66 12 102 25-Jun 282 30 390 90 100 90 46 6 24 96 -6 26-Jun 132 18 324 48 103 114 54 12 48 300 6 27-Jun 126 6 534 54 107 306 72 30 30 108 0 28-Jun 348 24 360 30 111 252 66 60 42 36 6 29-Jun 210 528 54 48 141 312 6 36 18 0 12 30-Jun 678 444 54 126 318 168 48 54 39 24 18 1-Jul 342 648 0 90 120 90 60 108 54 18 18 2-Jul 84 438 -18 66 120 132 30 90 18 18 24 3-Jul 336 66 48 78 132 72 156 36 144 378 48 4-Jul 30 30 12 54 72 66 60 276 48 54 6 5-Jul 80 102 18 36 216 84 318 180 12 36 30 6-Jul 38 138 6 6 138 54 198 342 18 -6 18 7-Jul 90 108 6 48 96 36 66 24 96 36 8-Jul 120 36 18 12 210 12 142 48 156 30
-continued-

14
Table 4.–Page 2 of 2. Day 2002 2003 2004 2005 2006 2007 2008 2009 2010 2011 2012 9-Jul 276 66 6 30 60 36 137 276 42 366 12 10-Jul 156 174 24 60 96 30 123 342 66 54 6 11-Jul 228 180 0 18 150 6 85 126 84 60 12 12-Jul 54 96 -6 6 228 36 40 132 30 138 54 13-Jul 78 114 72 42 186 72 90 138 6 12 18 14-Jul 156 102 78 30 372 150 72 66 6 150 18 15-Jul 78 96 12 6 108 192 36 54 12 0 24 16-Jul 132 54 30 48 18 210 54 42 24 0 6 17-Jul 204 12 18 24 30 132 18 12 102 12 12 18-Jul 96 36 0 12 84 168 18 6 108 24 0 19-Jul 66 30 18 18 18 126 48 6 126 12 60 20-Jul 66 18 0 30 54 132 24 12 60 18 42 21-Jul 66 0 12 6 24 60 6 0 72 96 162 22-Jul 66 18 6 24 24 120 30 0 108 72 42 23-Jul 66 18 0 18 18 42 12 0 69 60 30 24-Jul 12 0 0 36 132 84 6 6 57 198 30 25-Jul 42 -6 -12 12 54 54 102 0 50 48 78 26-Jul 6 6 -6 24 36 42 132 12 36 12 150 27-Jul 12 -12 -12 12 60 24 66 6 12 60 102 28-Jul 0 42 0 72 78 36 36 0 42 54 150 29-Jul 0 -12 12 6 96 12 61 0 24 114 48 30-Jul 0 72 78 30 48 18 58 12 30 120 54 31-Jul 54 30 66 24 108 12 58 18 0 162 18 1-Aug 6 114 60 18 36 6 50 0 30 138 54 2-Aug 42 24 54 12 42 0 40 12 54 60 18 3-Aug 60 30 102 30 66 42 25 6 6 132 6 4-Aug 24 30 72 36 18 12 88 6 -12 30 0 5-Aug 12 48 -24 18 114 30 0 12 60 6 6 6-Aug 36 72 6 0 30 0 12 0 12 6 0 7-Aug 48 24 18 0 0 0 0 0 0 0 0 8-Aug 30 0 18 0 0 0 0 0 0 0 0 9-Aug 0 24 0 0 0 0 0 0 0 0 0 10-Aug 0 0 0 0 0 0 0 0 0 0 0 Total 6,396 4,890 4,734 2,718 4,846 4,422 3,677 2,720 2,267 3,804 1,730

15
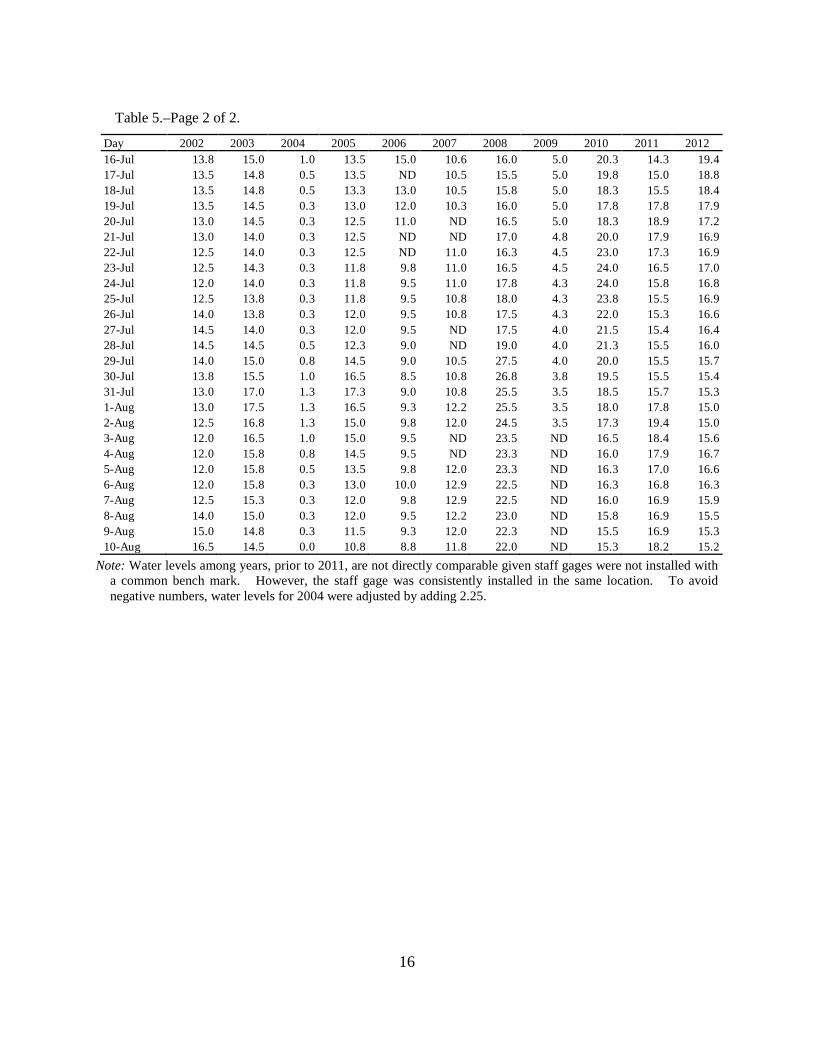
Table 5.–Daily average water level (nearest 10ths of an inch) at the Gulkana River tower, 2002–2012. Day 2002 2003 2004 2005 2006 2007 2008 2009 2010 2011 2012 27-May ND 24.0 13.8 23.0 ND ND ND ND ND ND ND 28-May ND 23.5 17.3 21.5 ND ND ND ND ND ND ND 29-May ND 23.0 16.3 20.5 ND ND ND 20.0 ND ND ND 30-May ND 23.0 14.8 19.3 ND ND ND 19.0 ND ND ND 31-May ND 23.5 13.3 18.8 ND ND ND 18.0 ND ND ND 1-Jun ND 25.0 12.5 19.0 ND 19.5 ND 16.0 ND ND ND 2-Jun ND 26.0 15.3 19.5 ND 19.5 ND 15.5 ND ND ND 3-Jun ND 24.0 18.0 19.0 16.5 19.0 ND 14.5 ND 22.6 ND 4-Jun ND 22.5 15.3 18.5 15.3 18.5 ND 14.5 ND 21.6 ND 5-Jun ND 21.5 13.8 18.0 14.5 18.0 ND 13.0 ND 20.8 26.0 6-Jun ND 21.5 12.3 17.5 13.5 17.5 ND 12.0 14.3 19.9 26.3 7-Jun ND 21.5 11.3 17.3 12.5 17.0 ND 11.0 14.0 19.1 26.8 8-Jun 21.5 21.0 13.3 16.3 12.0 16.5 ND 10.5 14.8 18.5 26.6 9-Jun 20.5 20.3 15.3 16.0 11.5 16.0 14.5 10.3 15.5 18.3 26.5 10-Jun 18.5 20.0 16.3 16.5 10.8 15.5 15.3 9.8 15.5 17.9 26.8 11-Jun 18.0 19.5 14.3 16.0 10.5 15.0 16.3 9.5 ND 17.6 26.5 12-Jun 18.5 19.5 12.8 15.8 10.3 14.5 16.0 11.0 ND 17.3 29.1 13-Jun 16.5 19.5 11.8 15.8 10.0 14.5 17.0 16.0 20.5 17.0 34.1 14-Jun 16.0 19.0 10.5 15.8 ND 13.8 16.5 17.0 19.4 16.6 34.5 15-Jun 16.0 19.0 9.5 16.3 9.8 ND 16.0 ND 18.6 16.4 33.1 16-Jun 15.5 19.0 8.5 15.5 10.0 ND 15.0 13.8 17.8 16.3 31.2 17-Jun 15.0 19.0 7.5 15.3 11.5 13.5 15.0 13.8 18.0 16.4 29.5 18-Jun 14.5 19.0 7.3 16.3 14.8 13.0 14.5 13.8 17.5 16.5 27.8 19-Jun 14.5 19.0 6.3 19.0 18.5 13.0 14.0 14.3 17.0 16.1 26.2 20-Jun 20.0 19.5 6.0 18.0 15.5 12.5 13.8 14.0 16.8 16.0 25.2 21-Jun 23.0 20.8 5.3 16.8 13.5 12.5 13.3 13.0 16.0 16.7 24.8 22-Jun 22.0 21.0 5.0 17.0 16.3 ND 13.3 13.0 16.0 16.9 24.4 23-Jun 20.5 20.0 4.5 16.8 ND ND 13.3 14.0 16.5 17.1 23.7 24-Jun 19.0 19.5 4.3 16.5 24.0 11.5 15.5 14.0 16.5 17.0 22.8 25-Jun 17.5 19.0 3.8 16.0 26.0 11.0 20.3 14.3 16.5 16.0 21.9 26-Jun 17.0 18.8 3.5 15.8 26.0 11.0 18.0 13.0 16.5 15.6 22.0 27-Jun 16.5 18.0 3.3 15.8 27.8 10.5 16.5 12.5 16.5 15.3 23.9 28-Jun 15.5 17.5 3.0 15.8 25.5 10.5 15.8 11.8 18.0 15.0 24.6 29-Jun 15.0 17.0 2.8 14.8 22.0 ND 15.8 11.3 21.2 14.6 24.1 30-Jun 14.8 16.8 2.8 14.8 20.5 11.0 16.3 10.5 20.5 14.8 23.2 1-Jul 15.0 16.5 2.5 15.3 18.0 11.0 16.0 9.8 19.8 15.1 23.4 2-Jul 18.0 16.5 2.5 17.3 15.5 11.0 16.6 9.0 18.5 15.9 23.4 3-Jul 20.0 18.0 2.5 19.0 13.5 11.8 15.8 8.5 18.0 16.5 23.4 4-Jul 21.0 20.5 2.3 17.3 13.0 13.0 15.0 8.0 20.8 16.3 23.4 5-Jul 21.0 20.3 2.3 16.5 12.0 13.4 14.5 8.0 19.8 16.0 22.4 6-Jul 19.0 19.0 2.8 16.3 12.0 ND 14.3 7.0 19.0 16.0 21.5 7-Jul 18.0 18.0 2.5 15.8 ND ND 21.3 7.0 19.0 16.2 21.1 8-Jul 17.5 17.5 2.3 15.0 ND 12.5 24.0 7.0 18.0 16.4 21.2 9-Jul 16.5 16.8 2.3 14.8 ND 12.0 23.5 7.0 17.0 16.6 20.6 10-Jul 15.5 16.3 2.3 16.0 12.3 12.0 23.0 6.5 16.0 16.0 20.1 11-Jul 15.5 16.0 1.8 15.8 11.5 11.6 21.0 6.5 15.0 15.5 22.0 12-Jul 14.5 15.8 1.5 15.0 11.0 11.5 20.3 6.5 15.0 14.9 22.4 13-Jul 14.5 15.5 1.3 14.8 11.5 ND 19.0 6.5 15.0 14.8 21.2 14-Jul 14.5 15.0 1.0 13.8 ND ND 18.0 5.0 15.3 14.7 20.7 15-Jul 14.5 15.0 1.0 13.5 ND 10.8 17.0 5.0 16.0 14.5 20.1
-continued-
16
Table 5.–Page 2 of 2.
Day 2002 2003 2004 2005 2006 2007 2008 2009 2010 2011 2012 16-Jul 13.8 15.0 1.0 13.5 15.0 10.6 16.0 5.0 20.3 14.3 19.4 17-Jul 13.5 14.8 0.5 13.5 ND 10.5 15.5 5.0 19.8 15.0 18.8 18-Jul 13.5 14.8 0.5 13.3 13.0 10.5 15.8 5.0 18.3 15.5 18.4 19-Jul 13.5 14.5 0.3 13.0 12.0 10.3 16.0 5.0 17.8 17.8 17.9 20-Jul 13.0 14.5 0.3 12.5 11.0 ND 16.5 5.0 18.3 18.9 17.2 21-Jul 13.0 14.0 0.3 12.5 ND ND 17.0 4.8 20.0 17.9 16.9 22-Jul 12.5 14.0 0.3 12.5 ND 11.0 16.3 4.5 23.0 17.3 16.9 23-Jul 12.5 14.3 0.3 11.8 9.8 11.0 16.5 4.5 24.0 16.5 17.0 24-Jul 12.0 14.0 0.3 11.8 9.5 11.0 17.8 4.3 24.0 15.8 16.8 25-Jul 12.5 13.8 0.3 11.8 9.5 10.8 18.0 4.3 23.8 15.5 16.9 26-Jul 14.0 13.8 0.3 12.0 9.5 10.8 17.5 4.3 22.0 15.3 16.6 27-Jul 14.5 14.0 0.3 12.0 9.5 ND 17.5 4.0 21.5 15.4 16.4 28-Jul 14.5 14.5 0.5 12.3 9.0 ND 19.0 4.0 21.3 15.5 16.0 29-Jul 14.0 15.0 0.8 14.5 9.0 10.5 27.5 4.0 20.0 15.5 15.7 30-Jul 13.8 15.5 1.0 16.5 8.5 10.8 26.8 3.8 19.5 15.5 15.4 31-Jul 13.0 17.0 1.3 17.3 9.0 10.8 25.5 3.5 18.5 15.7 15.3 1-Aug 13.0 17.5 1.3 16.5 9.3 12.2 25.5 3.5 18.0 17.8 15.0 2-Aug 12.5 16.8 1.3 15.0 9.8 12.0 24.5 3.5 17.3 19.4 15.0 3-Aug 12.0 16.5 1.0 15.0 9.5 ND 23.5 ND 16.5 18.4 15.6 4-Aug 12.0 15.8 0.8 14.5 9.5 ND 23.3 ND 16.0 17.9 16.7 5-Aug 12.0 15.8 0.5 13.5 9.8 12.0 23.3 ND 16.3 17.0 16.6 6-Aug 12.0 15.8 0.3 13.0 10.0 12.9 22.5 ND 16.3 16.8 16.3 7-Aug 12.5 15.3 0.3 12.0 9.8 12.9 22.5 ND 16.0 16.9 15.9 8-Aug 14.0 15.0 0.3 12.0 9.5 12.2 23.0 ND 15.8 16.9 15.5 9-Aug 15.0 14.8 0.3 11.5 9.3 12.0 22.3 ND 15.5 16.9 15.3 10-Aug 16.5 14.5 0.0 10.8 8.8 11.8 22.0 ND 15.3 18.2 15.2
Note: Water levels among years, prior to 2011, are not directly comparable given staff gages were not installed with a common bench mark. However, the staff gage was consistently installed in the same location. To avoid negative numbers, water levels for 2004 were adjusted by adding 2.25.

17
Table 6.–Daily maximum water temperature (Celsius) at the Gulkana River tower, 2002–2012.
Day 2003 2004 2005 2006 2007 2008 2009 2010 2011 2012 1-Jun 9.0 10.0 ND ND 12.0 7.0 7.0 15.0 ND ND 2-Jun 9.0 9.0 ND ND ND 9.0 10.0 14.5 ND ND 3-Jun 9.0 9.0 ND 9.0 ND 8.0 10.0 13.0 9.0 ND 4-Jun 10.0 10.0 ND 9.0 ND 8.0 8.0 11.0 9.0 ND 5-Jun 10.0 12.0 ND 9.0 ND 15.0 8.0 12.0 9.0 ND 6-Jun 11.0 14.0 ND 8.0 ND 8.0 12.0 13.0 10.0 9.0 7-Jun 10.0 12.0 ND 11.0 10.0 9.0 12.0 14.0 9.0 10.0 8-Jun 11.0 12.0 ND 12.0 10.0 10.0 15.0 13.0 10.0 10.0 9-Jun 12.0 9.0 ND 15.0 13.0 10.0 15.0 13.0 10.0 9.0 10-Jun 14.0 8.0 13.0 15.0 14.0 11.0 18.0 13.0 12.0 11.0 11-Jun 15.0 9.0 11.0 14.0 14.0 11.0 12.0 12.0 10.0 9.0 12-Jun 18.0 9.0 13.0 15.0 13.0 10.0 8.0 10.0 11.0 8.0 13-Jun 16.0 11.0 14.0 15.0 13.0 9.0 7.0 9.0 11.0 7.0 14-Jun 15.0 12.0 15.0 16.0 14.0 9.0 7.0 11.5 10.0 9.0 15-Jun 14.0 13.0 19.0 16.0 14.0 11.0 10.0 10.0 10.0 10.0 16-Jun 14.0 15.0 25.0 18.0 14.0 12.0 12.0 10.0 9.0 10.0 17-Jun 14.0 18.0 24.0 19.0 11.0 13.0 9.0 11.0 11.0 11.0 18-Jun 14.0 19.0 22.0 18.0 19.0 10.0 9.0 11.0 12.0 12.0 19-Jun 12.0 22.0 22.0 12.0 22.0 11.0 9.0 12.0 12.0 14.0 20-Jun 13.0 21.0 14.0 12.0 13.0 12.0 8.0 13.0 11.0 13.0 21-Jun 12.0 22.0 19.0 12.0 18.0 14.0 9.0 13.0 11.0 14.0 22-Jun 12.5 23.0 19.0 10.0 16.0 11.0 8.0 14.0 12.0 15.0 23-Jun 13.0 22.0 13.0 9.0 16.0 8.0 8.0 14.0 13.0 16.0 24-Jun 12.0 23.0 14.0 8.0 16.0 7.0 9.0 15.0 16.0 14.0 25-Jun 12.0 23.0 19.0 8.0 16.0 9.0 9.0 16.0 16.0 14.0 26-Jun 12.0 24.0 10.0 8.0 16.0 10.0 6.0 14.0 16.0 13.0 27-Jun 14.0 23.0 14.0 11.0 18.0 10.0 7.0 14.0 15.0 10.0 28-Jun 16.0 22.0 16.0 14.0 12.0 10.0 8.0 13.0 13.0 10.0 29-Jun 17.0 22.0 17.0 14.0 18.0 10.0 8.0 12.0 14.0 12.0 30-Jun 19.0 19.0 21.5 17.0 18.0 10.0 13.0 12.0 13.0 11.0 1-Jul 19.0 20.0 20.0 14.0 12.0 9.0 14.0 14.0 14.0 11.0 2-Jul 18.0 20.0 14.0 13.0 13.0 11.0 14.0 16.0 14.0 12.0 3-Jul 13.0 18.0 18.0 14.0 12.0 13.0 17.0 14.0 12.0 12.0 4-Jul 15.0 20.0 18.0 15.0 15.0 13.0 15.0 13.0 12.0 11.0 5-Jul 16.0 17.0 18.0 17.0 14.0 15.0 16.0 13.0 12.0 12.0 6-Jul 15.5 20.0 20.0 18.0 11.0 14.0 18.0 13.0 13.0 14.0 7-Jul 15.5 20.0 14.0 15.0 14.0 9.0 18.0 13.0 14.0 13.0 8-Jul 17.5 20.0 16.0 16.0 14.0 6.0 19.0 14.5 14.0 14.0 9-Jul 19.0 19.0 16.0 17.0 13.0 7.0 18.0 16.0 14.0 13.0 10-Jul 20.0 18.0 15.0 18.0 15.0 10.0 17.0 15.5 15.0 11.0 11-Jul 20.0 22.0 15.0 17.0 16.0 10.0 17.0 13.0 16.0 12.0 12-Jul 20.0 22.0 15.0 18.0 15.0 13.0 17.0 15.0 15.0 12.0 13-Jul 19.0 23.0 15.0 19.0 15.0 11.0 18.0 13.0 15.0 12.0 14-Jul 20.0 22.0 22.0 15.0 15.0 11.0 18.0 14.0 14.0 14.0 15-Jul 18.0 22.0 23.0 19.0 15.0 13.0 14.0 13.0 16.0 13.0
-continued-

18
Table 6.– Page 2 of 2.
Day 2003 2004 2005 2006 2007 2008 2009 2010 2011 2012 17-Jul 15.0 20.0 14.0 18.0 18.0 10.0 15.0 15.0 14.0 14.0 18-Jul 17.5 21.0 20.0 18.0 16.0 8.0 14.0 14.0 14.0 15.0 19-Jul 18.0 21.0 17.5 19.0 19.0 9.0 13.0 14.0 12.0 17.0 20-Jul 21.0 21.0 17.0 15.0 19.0 10.0 13.0 15.0 14.0 16.0 21-Jul 18.0 21.0 14.0 15.0 20.0 9.0 14.0 14.0 15.0 15.0 22-Jul 17.0 20.0 14.0 15.0 17.0 8.0 13.0 14.0 15.0 15.0 23-Jul 17.0 18.0 15.0 16.0 17.0 9.0 12.0 14.0 15.0 14.0 24-Jul 18.0 17.0 13.0 14.0 16.0 8.0 12.0 13.0 14.0 14.0 25-Jul 16.0 19.0 12.0 16.0 15.0 9.0 13.0 13.0 14.0 15.0 26-Jul 15.0 14.0 14.0 16.0 17.0 9.0 12.0 13.0 14.0 17.0 27-Jul 11.0 15.0 14.0 17.0 18.0 8.0 14.0 14.0 15.0 18.0 28-Jul 13.0 16.0 16.0 17.0 18.0 7.0 16.0 14.0 15.0 17.0 29-Jul 13.0 17.0 14.0 17.0 18.0 5.0 15.0 14.0 14.0 16.0 30-Jul 14.0 17.0 10.0 19.0 17.0 7.0 15.0 15.0 14.0 12.0 31-Jul 14.0 18.0 9.0 19.0 17.5 7.0 14.0 15.0 13.0 14.0 1-Aug 12.0 15.0 15.0 18.0 17.5 7.0 13.0 17.0 12.0 13.0 2-Aug 14.0 16.0 17.0 18.0 17.0 9.0 14.0 17.0 11.0 13.0 3-Aug 12.0 17.0 14.0 14.0 16.0 10.0 14.0 17.0 12.0 12.0 4-Aug 13.5 17.0 11.0 14.0 15.0 9.0 15.0 17.0 14.0 12.0 5-Aug 14.0 20.0 12.0 14.0 15.0 8.0 13.0 15.0 11.0 12.0 6-Aug 15.0 21.0 12.0 14.0 17.0 9.0 12.0 15.0 11.0 13.0 7-Aug 16.0 20.0 13.0 18.0 16.0 7.0 14.0 14.0 11.0 14.0 8-Aug 16.0 21.0 13.0 18.0 15.0 7.0 14.0 14.0 11.0 16.0 9-Aug 17.0 19.0 15.0 15.0 15.0 8.0 12.0 15.0 10.0 15.0 10-Aug 16.5 20.0 16.0 ND ND ND ND ND ND 14.0

19
Table 7.–Percent of Gulkana River Chinook salmon run past the counting tower by 1 July and average maximum water temperature between 10 June and 30 June, 2002–2012, including the percent of return interpolated each year.
Figure 4.–June 10–30 average maximum water temperature and the arcsine transformed percentage of
the Chinook salmon run on June 30 at the Gulkana River fish counting tower, 2003–2012. Note, the year 2008 had 20 days of very poor to no visibility resulting in interpolations for 25% of the return.
Percent Average Max Percent ReturnYear Return Acsin ( ) Temperature Interpolated
2002 49 ND ND 62003 37 0.65 14.2 02004 82 1.13 18.1 02005 60 0.88 16.9 12006 28 0.56 13.4 152007 45 0.74 15.5 12008 30 0.58 10.4 262009 11 0.34 9.2 12010 26 0.54 12.4 62011 22 0.49 12.3 02012 18 0.44 11.6 6
'03
'04
'05
'06
'07
'08
'09
'10'11
'12
y = 0.1294e0.1146x
R² = 0.8765
0
0.2
0.4
0.6
0.8
1
1.2
7 9 11 13 15 17 19
Arc
sin
(√
Per
cent
age)
Average Maximum Temperature (oC)

20
Figure 5.–Percent of Gulkana River Chinook salmon run past the counting tower by 1 July, 2002–
2012.
Table 8.–Escapement, standard error (SE), aerial count, and proportion of escapement by survey date
of Chinook salmon upstream of the tower in the Gulkana River, 2002–2012, excluding 2003 and 2008.
R² = 0.4879
0
10
20
30
40
50
60
70
80
90
2000 2002 2004 2006 2008 2010 2012
Perc
ent
Year
Year Day/Month Twr Esc SE Aerial Count Proportion of Esc2002 19-Jul 5448 340 2037 0.372004 24-Jul 4302 302 2014 0.472005 22-Jul 2370 174 804 0.342006 19-Jul 3808 279 1163 0.312007 21-Jul 3888 273 1131 0.292009 2-Aug 2696 179 623 0.232010 30-Jul 2117 130 716 0.342011 22-Jul 2604 228 493 0.192012 31-Jul 1646 154 445 0.27

21
Figure 6.–Counting tower escapement estimates with 95% confidence intervals compared with aerial
index counts for Gulkana River Chinook, 2002–2012 excluding 2003 and 2008.
y = 1.8484x + 1272.9R² = 0.8411
0
1000
2000
3000
4000
5000
6000
7000
0 500 1000 1500 2000 2500
Esca
pem
ent E
stim
ate
Aerial Survey Count

22
Table 9.–Daily counts, expanded counts, and the cumulative estimated escapement of sockeye salmon at the Gulkana River tower, 2011.
West Channel East Channel Combined Daily
Total Escapement Date Daily Expanded Daily Expanded Expanded
2-Jun 0 0 0 0 0 0 0 3-Jun 0 0 1 6 1 6 6 4-Jun 0 0 0 0 0 0 6 5-Jun 0 0 0 0 0 0 6 6-Jun 0 0 1 6 1 6 12 7-Jun 35 210 2 12 37 222 234 8-Jun 105 630 15 90 120 720 954 9-Jun 35 210 10 60 45 270 1,224 10-Jun 32 192 49 294 81 486 1,710 11-Jun 153 918 62 372 215 1,290 3,000 12-Jun 53 318 36 216 89 534 3,534 13-Jun 20 120 20 120 40 240 3,774 14-Jun 60 360 40 240 100 600 4,374 15-Jun 144 864 68 408 212 1,272 5,646 16-Jun 399 2,394 144 864 543 3,258 8,904 17-Jun 345 2,070 161 966 506 3,036 11,940 18-Jun 164 984 78 468 242 1,452 13,392 19-Jun 209 1,254 150 900 359 2,154 15,546 20-Jun 201 1,206 186 1,116 387 2,322 17,868 21-Jun 192 1,152 129 774 321 1,926 19,794 22-Jun 220 1,320 207 1,242 427 2,562 22,356 23-Jun 80 480 105 630 185 1,110 23,466 24-Jun 45 270 70 420 115 690 24,156 25-Jun 60 360 177 1,062 237 1,422 25,578 26-Jun 30 180 102 612 132 792 26,370 27-Jun 13 78 91 546 104 624 26,994 28-Jun 13 78 131 786 144 864 27,858 29-Jun 4 24 36 216 40 240 28,098 30-Jun 14 84 44 264 58 348 28,446 1-Jul 2 12 27 162 29 174 28,620 2-Jul 10 60 80 480 90 540 29,160 3-Jul 11 66 74 444 85 510 29,670 4-Jul 11 66 55 330 66 396 30,066 5-Jul 3 18 15 90 18 108 30,174 6-Jul 4 24 40 240 44 264 30,438 7-Jul 4 24 83 498 87 522 30,960 8-Jul 17 102 73 438 90 540 31,500
-continued-

23
Table 9.–Page 2 of 2.
West Channel East Channel Combined Daily
Total Escapement Date Daily Expanded Daily Expanded Expanded
9-Jul 12 72 39 234 51 306 31,806 10-Jul 4 24 13 78 17 102 31,908 11-Jul 1 6 52 312 53 318 32,226 12-Jul 9 54 47 282 56 336 32,562 13-Jul 3 18 14 84 17 102 32,664 14-Jul 0 0 27 162 27 162 32,826 15-Jul 7 42 16 96 23 138 32,964 16-Jul 0 0 14 84 14 84 33,048 17-Jul 0 0 17 102 17 102 33,150 18-Jul 16 96 53 318 69 414 33,564 19-Jul 2 12 34 204 36 216 33,780 20-Jul 8 48 2 12 10 60 33,840 21-Jul 26 156 26 156 52 312 34,152 22-Jul 3 18 40 240 43 258 34,410 23-Jul 1 6 20 120 21 126 34,536 24-Jul 18 108 51 306 69 414 34,950 25-Jul 5 30 20 120 25 150 35,100 26-Jul 1 6 9 54 10 60 35,160 27-Jul 4 24 21 126 25 150 35,310 28-Jul 8 48 41 246 49 294 35,604 29-Jul 11 66 31 186 42 252 35,856 30-Jul 3 18 11 66 14 84 35,940 31-Jul 9 54 21 126 30 180 36,120 1-Aug 24 144 18 108 42 252 36,372 2-Aug 13 78 11 66 24 144 36,516 3-Aug 17 102 21 126 38 228 36,744 4-Aug 5 30 27 162 32 192 36,936 5-Aug 15 90 31 186 46 276 37,212 6-Aug 0 0 17 102 17 102 37,314 7-Aug 3 18 13 78 16 96 37,410 8-Aug 4 24 27 162 31 186 37,596 9-Aug 3 18 19 114 22 132 37,728 10-Aug 12 72 41 246 53 318 38,046

24
Table 10.–Daily counts, expanded counts, interpolations, and the cumulative estimated escapement of
sockeye salmon at the Gulkana River tower, 2012. Shading identifies days with counts that included interpolation.
-continued-
Cumulative Date Daily Expanded Interpolated Daily Expanded Interpolated Daily Expanded Interpolated Escapement6-Jun 0 0 0 3 18 18 3 18 18 187-Jun 0 0 0 6 36 36 6 36 36 548-Jun 1 6 6 1 6 6 2 12 12 669-Jun 7 42 42 4 24 24 11 66 66 132
10-Jun 3 18 18 3 18 18 6 36 36 16811-Jun 6 36 36 3 18 18 9 54 54 22212-Jun 0 0 0 2 12 12 2 12 12 23413-Jun 0 0 25 0 0 57 0 0 87 32114-Jun 0 0 67 0 0 117 0 0 170 49115-Jun 0 0 105 0 0 194 0 0 278 76916-Jun 0 0 205 0 0 235 0 0 468 1,23717-Jun 0 0 346 0 0 293 0 0 654 1,89118-Jun 0 0 684 0 0 301 0 0 1,059 2,95019-Jun 12 72 72 0 0 321 33 198 393 3,34320-Jun 49 294 294 54 324 324 103 618 618 3,96121-Jun 45 270 270 83 498 498 128 768 768 4,72922-Jun 124 744 744 108 648 648 232 1,392 1,392 6,12123-Jun 168 1,008 1,008 56 336 336 224 1,344 1,344 7,46524-Jun 400 2,400 2,400 81 486 486 481 2,886 2,886 10,35125-Jun 47 282 282 14 84 84 61 366 366 10,71726-Jun 34 204 204 30 180 180 64 384 384 11,10127-Jun 31 186 186 9 54 54 40 240 240 11,34128-Jun 29 174 174 0 0 0 29 174 174 11,51529-Jun 55 330 330 50 300 300 105 630 630 12,14530-Jun 109 654 654 141 846 846 250 1,500 1,500 13,6451-Jul 62 372 372 55 330 330 117 702 702 14,3472-Jul 67 402 402 60 360 360 127 762 762 15,1093-Jul 67 402 402 77 462 462 144 864 864 15,9734-Jul 18 108 108 15 90 90 33 198 198 16,1715-Jul 27 162 162 16 96 96 43 258 258 16,4296-Jul 47 282 282 40 240 240 87 522 522 16,9517-Jul 91 546 546 39 234 234 130 780 780 17,7318-Jul 77 462 462 48 288 288 125 750 750 18,4819-Jul 54 324 324 9 54 54 63 378 378 18,85910-Jul 46 276 276 21 126 126 67 402 402 19,26111-Jul 33 198 198 7 42 42 40 240 240 19,50112-Jul 20 120 120 12 72 72 32 192 192 19,69313-Jul 26 156 156 16 96 96 42 252 252 19,94514-Jul 40 240 240 10 60 60 50 300 300 20,24515-Jul 74 444 444 19 114 114 93 558 558 20,80316-Jul 41 246 246 12 72 72 53 318 318 21,12117-Jul 45 270 270 13 78 78 58 348 348 21,46918-Jul 105 630 630 29 174 174 134 804 804 22,273
West Channel East Channel Combined

25
Table 10.–Page 2 of 2.
Cumulative Date Daily Expanded Interpolated Daily Expanded Interpolated Daily Expanded Interpolated Escapement
19-Jul 158 948 948 31 186 186 189 1,134 1,134 23,40720-Jul 175 1,050 1,050 60 360 360 235 1,410 1,410 24,81721-Jul 144 864 864 36 216 216 180 1,080 1,080 25,89722-Jul 83 498 498 30 180 180 113 678 678 26,57523-Jul 155 930 930 37 222 222 192 1,152 1,152 27,72724-Jul 72 432 432 13 78 78 85 510 510 28,23725-Jul 147 882 882 27 162 162 174 1,044 1,044 29,28126-Jul 467 2,802 2,802 212 1,272 1,272 679 4,074 4,074 33,35527-Jul 195 1,170 1,170 181 1,086 1,086 376 2,256 2,256 35,61128-Jul 94 564 564 129 774 774 223 1,338 1,338 36,94929-Jul 161 966 966 20 120 120 181 1,086 1,086 38,03530-Jul 27 162 162 2 12 12 29 174 174 38,20931-Jul 21 126 126 3 18 18 24 144 144 38,3531-Aug 42 252 252 -2 -12 -12 40 240 240 38,5932-Aug 53 318 318 -1 -6 -6 52 312 312 38,9053-Aug 49 294 294 3 18 18 52 312 312 39,2174-Aug 75 450 450 7 42 42 82 492 492 39,7095-Aug 20 120 120 0 0 0 20 120 120 39,8296-Aug 41 246 246 4 24 24 45 270 270 40,0997-Aug 55 330 330 2 12 12 57 342 342 40,4418-Aug 92 552 552 3 18 18 95 570 570 41,0119-Aug 134 804 804 3 18 18 137 822 822 41,833
10-Aug 20 120 120 0 0 0 20 120 120 41,953
West Channel East Channel Combined

26
when average maximum water temperatures are considered warm (16o–18oC) versus a smaller proportion when the water temperatures are considered cool (9o–14oC). This could be an expected behavioral response of an ectothermic organism such as salmon. In which water temperature can greatly affect metabolic rate, maturation and activity that influences their migration timing past the counting tower.
Not surprisingly, salmon adapt their migration patterns to minimize energy expenditure. For example, adult salmon swim along shore to avoid stronger currents and select water depths that maximize swimming efficiency during their upstream migration (Brett 1995; Hinch and Rand 2000; Hughes 2004). Therefore, one would expect a similar behavioral response in salmon to temperature; especially, in a river like the Gulkana where Chinook salmon may be residing for a month or more before spawning.
Brett (1995) determined that metabolic energy demand of salmon increases as the water temperature increases above an optimum around 15oC. Temperatures greater than 15oC can also increase susceptibility to disease (Kocan et al. 2003), increase prespawning mortality (Keefer et al. 2010) and decrease gamete quality and viability during migration (Beacham and Murray, 1990). Migration delays and blockages occur consistently in the temperature range of 19o–23oC (McCullough et al. 2001; Goniea et al. 2006).
Drought conditions existed during 2004 and a significantly smaller proportion (50%) of radiotagged spawners was recorded upstream of the tower compared to 81% in 2002 and 86% in 2003 (Savereide 2005). Although low water is a likely reason for the smaller proportion of spawners above the tower, high water temperatures were also prevalent. During 2004, water temperatures exceeded 19oC for 33 days during the spawning migration and were consistently the highest recorded among the past ten years, peaking at 24oC. Despite the warm water temperatures experienced during 2004, over 700 Chinook salmon continued to migrate upstream of the tower after 1 July.
It’s plausible that Chinook salmon are moving upstream in response to the elevated water
temperatures to seek an optimal temperature. For example, adult Chinook salmon in the Columbia River were found holding near cool water tributaries during their upstream migration in response to high water temperatures (Goniea et al. 2006). However, there are no substantial tributaries on the lower 68 river kilometers of the Gulkana River, downstream of the West Fork. The Middle Fork Gulkana River was found to be 2oC cooler on average during the month of July 2011 compared to the mainstem Gulkana River at the fish counting tower (ADF&G, unpublished data). This difference in water temperature may be more pronounce during warm years, in particular in the lower reaches of the Gulkana River, and warrants a drainage wide temperature investigation.
Quinn and Adams (1996) found a trend in the median passage date of adult sockeye salmon at Bonneville Dam, Columbia River, with the first day of the year when the river warmed to 15.5oC. Similar analyses showed shifts in earlier migration timing of steelhead over the past decades (Robards and Quinn 2002). In contrast, the Gulkana River has not been modified by the construction of storage dams and the Chinook salmon run timing at the tower has been trending later in recent years and experiencing cooler temperatures.
It is essential to identify environmental conditions that influence timing to implement effective management measures because management of fisheries for anadromous species is based on expected time of arrival in harvest areas (Mundy 1982; Quinn and Adams 1996; Cooke et al. 2004; Keefer et al. 2010; Anderson and Beer 2009). A delay in the arrival of migrating Yukon River Chinook salmon was found to coincide with cold spring temperatures, shorten the time interval of migrations, and reduce the effect of daily environmental changes on migratory behavior. Whereas, warm springs portended an early arrival and an extended migration. Recent investigations by Mundy and Evenson (2011) combined sea surface and air temperatures to explain 59% of the annual variation in migratory timing of Chinook salmon at the mouth of the Yukon River.

27
Results here indicate 88% of the variation in run timing prior to 1 July can be explained by average maximum water temperature. The current results also suggest actively migrating Chinook salmon are selecting for optimal temperatures. Additional years of data should test the integrity of the relationship between average maximum water temperature and run timing. Additional years of data will also clarify the type of relationship (e.g., polynomial or exponential). This relationship may aid managers when making inseason decisions about the Gulkana River Chinook salmon sport fishery. Aerial surveys during peak spawning in late July are good indices of the magnitude of escapement in the Gulkana River. On average one third of the Chinook salmon are counted during aerial surveys. Additional years of data should test the integrity of the relationship between aerial counts and escapement of Chinook salmon upstream of the tower. In particular, years with high escapement, such as 1996 when 11,684 Chinook salmon were counted through a weir on the Gulkana River near Sourdough (LaFlamme 1997). To establish a Chinook salmon escapement goal for the Gulkana River a long time series of escapement, total run, and age composition estimates are required. Estimates of escapement are available from 2002–2011; however, Copper River Chinook salmon range from age 1.1 to age 1.6 and 10 years of escapement information is only equivalent to five complete brood year returns. Stock specific estimates of harvest in the mixed stock commercial, PU, or subsistence fisheries are required to estimate the total run. Currently, there are no such estimates but a recent genetic study has provided the means to derive these estimates (Seeb et. al 2009). These methods will be used to obtain stock-specific estimates of the harvest and age composition. Age composition estimates of the escapement are not available, but they can be inferred from previous age composition estimates of the sport fishery.
CONCLUSION Even though all of the information needed to establish an escapement goal is limited at this
time, an escapement goal analysis should be conducted and enumeration of Chinook salmon migrating upstream of the counting tower should continue. In the absence of an escapement goal, another objective of area sport fish management is to establish an inseason guideline to use for making a determination as to whether a management action (e.g., close the fishery) is needed to address low numbers of Chinook salmon. Continued estimates of escapement and run timing may indicate a number and corresponding date that could be used as a guideline. For example, the water temperature in June may prove to be a predictor of run timing and escapement.
ACKNOWLEDGMENTS Partial funding for this project was provided by the Bureau of Land Management. The author would like to thank the ADF&G field crew: Mark Schlenker, Ben Tyler, Mark Roti, and Dustin Canniff. Thanks also go to BLM, for their assistance with project logistics, student technicians and volunteer: Ellie Bowman, Eli Morse, and Willow Schlenker. The author is grateful for the support and lease of the cabin from Bruce and Ian Griggs. Jiaqi Huang completed the biometric review and Rachael Kvapil finalized the report for publication.

28
REFERENCES CITEDAnderson, J. J., and W. N. Beer. 2009. Oceanic,
riverine, and genetic influences on spring Chinook salmon migration timing. Ecological Applications, 19: 1989–2003.
Beacham, T. D., and C. B. Murray. 1990. Temperature, egg size, and development of embryos and alevins of five species of Pacific Salmon; a comparative analysis. Trans. Am. Fish. Soc. 119: 927-945.
Botz, J., and M. A. Somerville. 2011. Management of salmon stocks in the Copper River, Report to the Alaska Board of Fisheries: December 2-7, 2011, Valdez, Alaska. Alaska Department of Fish and Game, Special Publication No. 11-13, Anchorage.
Brett, J. R. 1995. Energetics in Physiological ecology of Pacific salmon. Edited by C. Groot, L. Margolis, and W.C. Clarke. University of British Columbia Press, Vancouver. pp. 3–68.
Cochran, W. G. 1977. Sampling Techniques. 3rd edition, John Wiley, New York.
Cooke, S. J., S. G. Hinch, A. P. Farrell, M. F. Lapointe, S. R. M. Jones, J. S. Macdonald, D. A. Patterson, et al. 2004. Abnormal migration timing and high en route mortality of sockeye salmon in the Fraser River, BC. Fisheries, 29: 22–33.
Goniea, T., M. L. Keefer, T. C. Bjornn, C. A. Peery, and D. H. Bennett. 2006. Behavioral thermoregulation and slowed migration by adult fall Chinook salmon in response to high Columbia River water temperatures. Trans. Am. Fish. Soc. 135: 408-419.
Hinch, S. G., and P. S. Rand. 2000. Optimal swimming speeds and forward-assisted propulsion: energy-conserving behaviours of upriver-migrating adult salmon. Can. J. Fish. Aquat. Sci. 57: 2470–2478.
Hughes, N. F., 2004. The wave-drag hypothesis: An explanation for size-biased lateral segregation during the upstream migration of salmonids. Can. J. Fish. Aquat. Sci. 61: 103–109.
Jennings, G. B., K. Sundet, and A. E. Bingham. 2009a. Estimates of participation, catch, and harvest in Alaska sport fisheries during 2005. Alaska Department of Fish and Game, Fishery Data Series No. 09-47 Anchorage.
Jennings, G. B., K. Sundet, and A. E. Bingham. 2009b. Estimates of participation, catch, and harvest in Alaska sport fisheries during 2006. Alaska Department of Fish and Game, Fishery Data Series No. 09-54, Anchorage.
Jennings, G. B., K. Sundet, and A. E. Bingham. 2010. Estimates of participation, catch, and harvest in Alaska sport fisheries during 2007. Alaska Department of Fish and Game, Fishery Data Series No. 10-02, Anchorage.
Keefer, M. L., G. A. Taylor, D. F. Garletts, G. A. Gauthier, T. M. Pierce, and C. C. Caudill, 2010. Prespawn mortality in adult spring Chinook salmon outplanted abouve barrier dams. Ecology of Freshwater Fish, 19:361-372. John Wiley & Sons.
Kocan, R., P. Hershberger, and J. Winton. 2003. Effects of Ichthyophonus on Survival and Reproductive Success of Yukon River Chinook Salmon. Federal Subsistence Fisheries Resource Monitoring Program, Final Project Report No. FIS 01-200. U. S. Fish and Wildlife Service, Office of Subsistence Management, Fisheries Information Services Division, Anchorage.
LaFlamme, T. R. 1997. Creel and escapement estimates for Chinook salmon on the Gulkana River, 1996. Alaska Department of Fish and Game, Fishery Data Series No. 97-12, Anchorage.
McCullough, D. A., S. Spalding, D. Sturdevant, and M. Hicks. 2001. Summary of technical literature examining the physiological effects of temperature on salmonids. U.S. Environmental Protection Agency, Report EPA-910-D-01-005, Seattle.
Mills, M. J. 1979. Alaska statewide sport fish harvest studies. Alaska Department of Fish and Game, Federal Aid in Fish Restoration, Annual Performance Report 1978-1979, Project F-9-11, 20 (SW-I-A), Juneau.
Mundy, P. R. 1982. Computation of migratory timing statistics for adult chinook salmon in the Yukon River, Alaska, and their relevance to fisheries management. North American Journal of Fisheries Management, 4: 359–370.

29
REFERENCES CITED (Continued)Mundy, P. R., and D. F. Evenson. 2011.
Environmental controls of phenology of high-latitude Chinook salmon populations of the Yukon River, North America, with application to fishery management. ICES Journal of Marine Science, 68: 1155–1164.
Quinn, T. P., and D. J. Adams. 1996. Environmental changes affecting the migratory timing of American shad and sockeye salmon. Ecology, 77: 1151–1162.
Robards, M. D., and T. P. Quinn. 2002. The migratory timing of adult summer-run steelhead trout (Oncorhynchus mykiss) in the Columbia River: Six decades of environmental change. Trans. Am. Fish. Soc. 131: 523-536.
Savereide, J. W. 2005. Inriver Abundance, Spawning Distribution and Run Timing of Copper River Chinook Salmon, 2002-2004. Alaska Department of Fish and Game, Fishery Data Series No. 05-50, Anchorage.
Seeb, L. W., N. A. DeCovich, A. W. Barclay, C. T. Smith, and W. D. Templin. 2009. Timing and origin of Chinook salmon stocks in the Copper River and adjacent ocean fisheries using DNA markers. Alaska Department of Fish and Game, Fishery Data Series No. 09-58, Anchorage.
Somerville, M. A. 2011. Fishery management report for the recreational fisheries of the Upper Copper/Upper Susitna River management area, 2009. Alaska Department of Fish and Game, Fishery Management Report No. 11-38, Anchorage.
Taras, B. D., and D. R. Sarafin. 2005. Chinook salmon escapement in the Gulkana River, 2002. Alaska Department of Fish and Game, Fishery Data Series No. 05-02, Anchorage.
Taube, T. T. 2002. Area management report for the recreational fisheries of the Upper Copper/Upper Susitna river management area, 2000-2001. Alaska Department of Fish and Game, Fishery Data Series No. 02-7, Anchorage.
Wolter, K. M. 1985. Introduction to variance estimation. Springer-Verlag, New York.