1983, unalakleet river escapement project
TRANSCRIPT
NORION SOUNDI KOIEZEBUE ESCAEMENT REPORT 32
1983 UNALAKLEET RIVER ESCAPEMENT PROJECT
SALMON ESCAPEMENT REPORT 32
Compiled by Charles Lean Don Peterson
Alaska Department of Fish and Game Division of Commercial Fisheries
Nome Alaska 99762
CONTENTS
List of Figures bullbullbullbullbullbullbullbullbullbullbullbullbullbullbullbullbullbullbullbullbullbullbullbullbullbullbullbullbullbullbullbullbullbullbullbullbullbullbullbullbull i
List of Tables iii Introduction 1
Methods bullbullbullbullbullbull 2
Project Deployment middot 2 Sonar bullbullbullbullbullbullbullbull 2 Test Fishing bullbullbull middot 5 Counting Towers bullbullbullbullbullbullbullbullbull middot 6 Drift SetsBeach Seines 7
bull bullbullbullbullbull bull bull s bull bullbullbullbullbullbullbullbullbullbullbullRiver Surveys bullbullbullbullbullbullbullbullbullbullbullbullbullbullbullbullbull 7Subsistence Survey bullbullbullbullbullbullbullbullbullbullbullbullbullbullbull 7
Results bullbullbullbullbullbullbullbullbullbullbullbullbullbullbullbullbull middot 8
Subsistence Survey middot middot 8 Sonar bullbullbullbullbull 8 Test Fishing bullbullbullbullbullbullbullbullbullbullbullbull middot 9 Age Sex and Size Composition of Test Net Catches bullbullbull l~ Counting Towers bullbullbullbullbullbullbullbullbullbullbullbull bull bull 10 Drift SetsBeach Seines l~ River SurveysAerial Surveys bullbullbullbull 11 King Salmon Sport Fish Survey middot 11
Discussion 11
Conclusion 13
-i shy
LIST OF FIGURES Page
Figure 1 Unalakleet Escapement Project bullbullbullbullbullbullbullbullbullbullbullbullbullbullbullbullbull 14
Figure 2 Sonar Site Schematic bullbullbullbullbullbullbullbullbullbullbullbullbullbullbullbullbullbullbullbullbullbullbullbullbullbull 15
Figure 3 Unalakleet King Salmon Subsistence Survey 1983 bullbullbullbullbullbullbullbullbullbullbullbullbullbullbullbullbull 16
Figure 4A Specie Apportionment King Salmon Unalakleet Sonar 1983 bullbullbullbullbullbullbullbullbullbullbullbullbullbullbullbullbullbullbullbullbullbullbullbull 17
Figure 4B Specie Apportionment Coho Salmon Unalakleet Sonar 1983 bullbullbullbullbullbullbullbullbullbullbullbullbullbullbullbullbullbullbullbullbullbullbullbull 18
Figure 4C Specie Apportionment Pink Sa1monr Unalakleet Sonar 1983 bullbullbullbullbullbullbullbullbullbull ~ bullbullbullbullbullbullbullbullbullbullbullbullbull 19
Figure 4D Specie Apportionment Chum Salmon Unalakleet Sonar 1983 bullbullbullbullbullbullbullbullbullbullbullbullbullbullbullbullbullbullbullbullbullbullbullbull 2~
Figure 5 Specie Apportionment Unalakleet Sonar 1983 bullbull 21
Figure 6 Sector Distribution of Counts Unalakleet Sonar 1983 bullbullbullbullbullbullbullbullbullbullbullbullbullbullbullbullbullbullbullbullbullbull 22
Figure 7 Hourly Distribution of Counts Unalakleet Sonar 1983 bullbullbullbullbullbullbullbullbullbullbullbullbullbullbullbullbullbullbullbullbullbullbullbull 23
Figure 8 Unalakleet River Test Fishing Daily King CPUE in 8 14 Mesh 1983 bullbullbullbullbullbullbullbullbullbullbullbullbullbullbullbullbullbullbullbullbull 24
Figure 9 Unalakleet River Test Fishing Cumulative King CPUE in 8 14 Mesh 1983 bullbullbullbullbullbullbullbullbullbullbullbullbullbullbullbull 25
Figure 1~ Unalakleet River Test Fishing Daily Coho CPUE in 5 78 Mesh 1983 bullbullbullbullbullbullbullbullbullbullbullbullbullbullbullbullbullbullbullbullbull 26
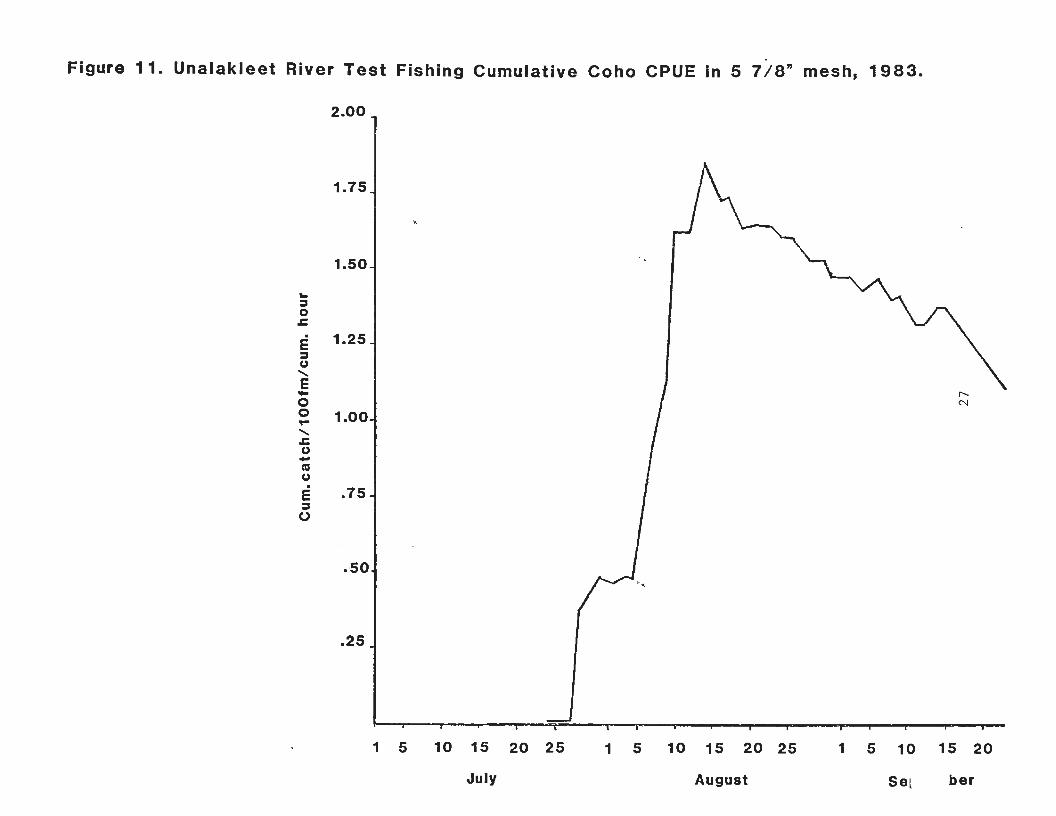
Figure 11 Unalakleet River Test Fishing Cumulative Coho CPUE in 5 78 Mesh 1983 bullbullbullbullbullbullbullbullbullbullbullbullbullbullbullbull 27
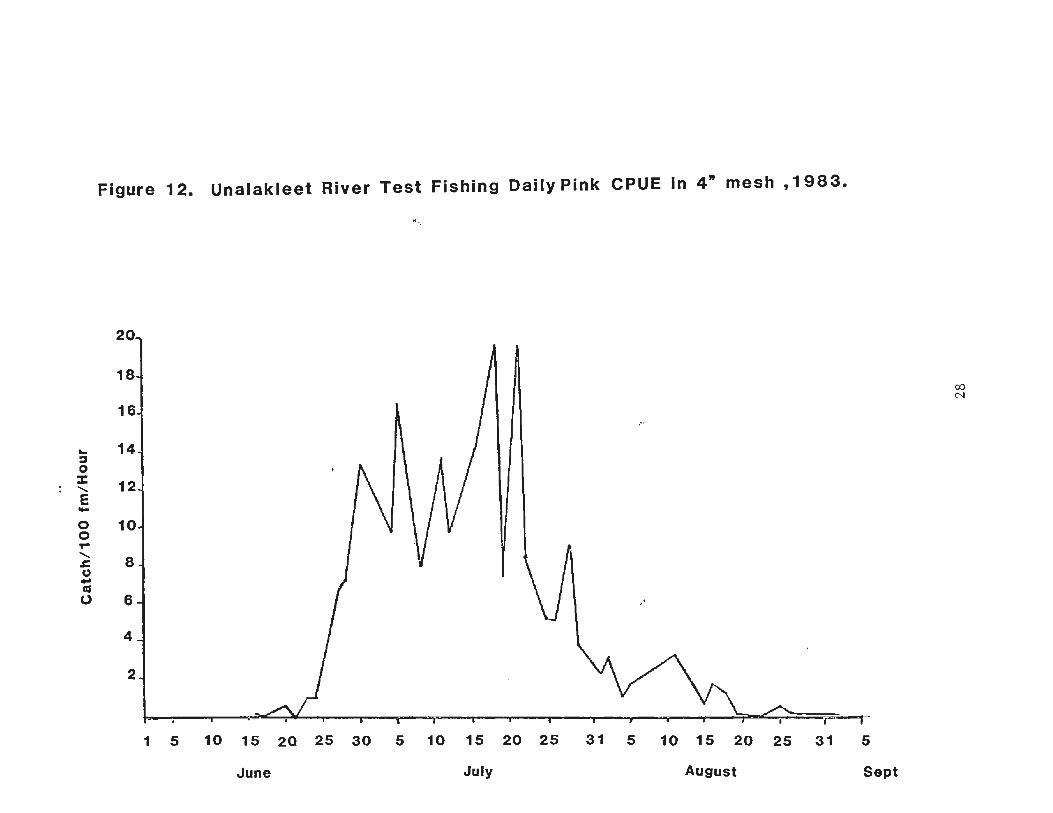
Figure 12 Unalakleet River Test Fishing Daily Pink CPUE in 4 Mesh 1983 bullbullbullbullbullbullbullbullbullbullbullbullbullbullbullbullbullbullbullbullbullbullbullbullbull 28
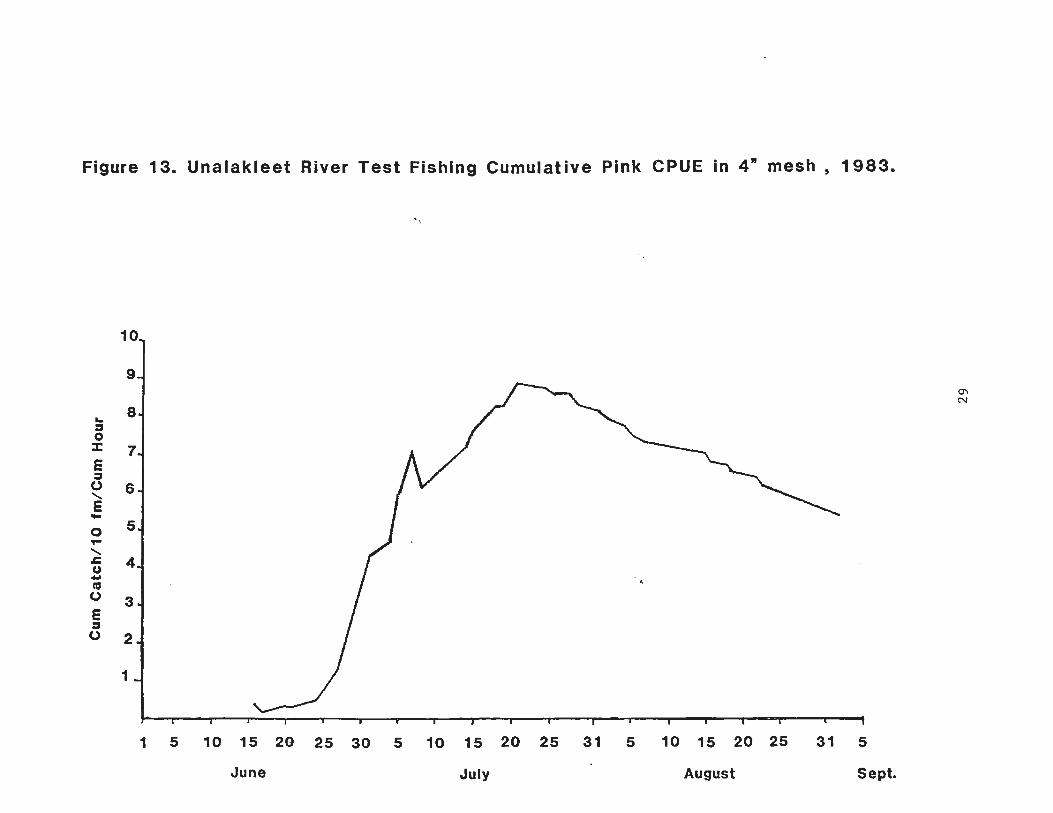
Figure 13 Unalakleet River Test Fishing Cumulative Pink CPUE in 4 Mesh 1983 bullbullbullbullbullbullbullbullbullbullbullbullbullbullbullbullbullbullbullbull 29
-ii shy
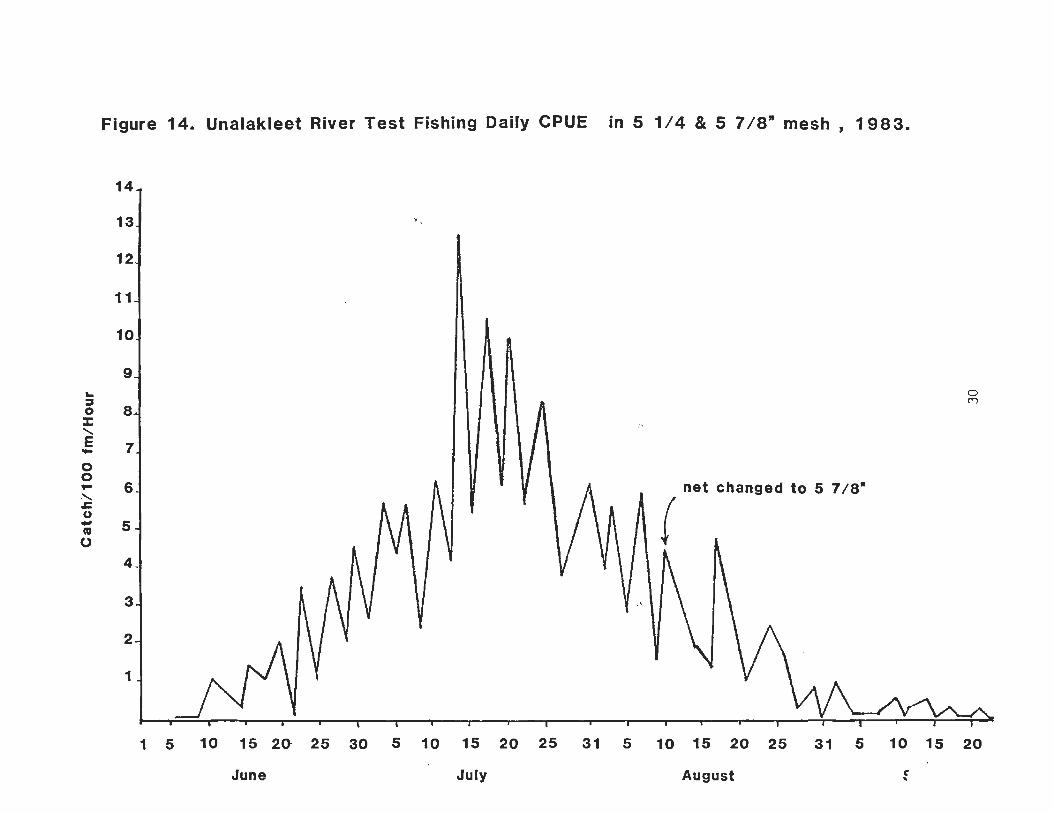
Page Figure 14 Unalakleet River Test Fishing Daily CPUE in
5 14 and 5 78 Mesh 1983 bullbullbullbullbullbullbullbullbullbullbullbullbullbullbullbullbullbull 3~
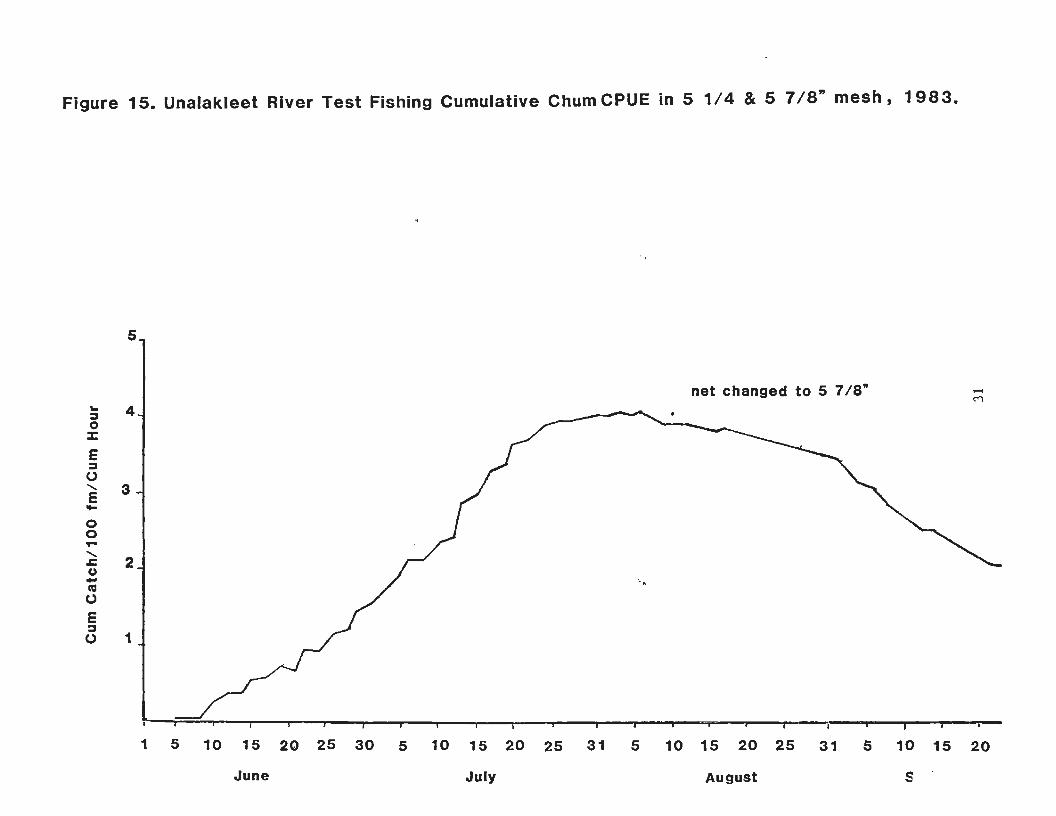
Figure 15 Unalakleet River Test Fishing Cumulative Chum CPUE in 5 14 and 5 78 Mesh 1983 bullbullbullbullbull 31
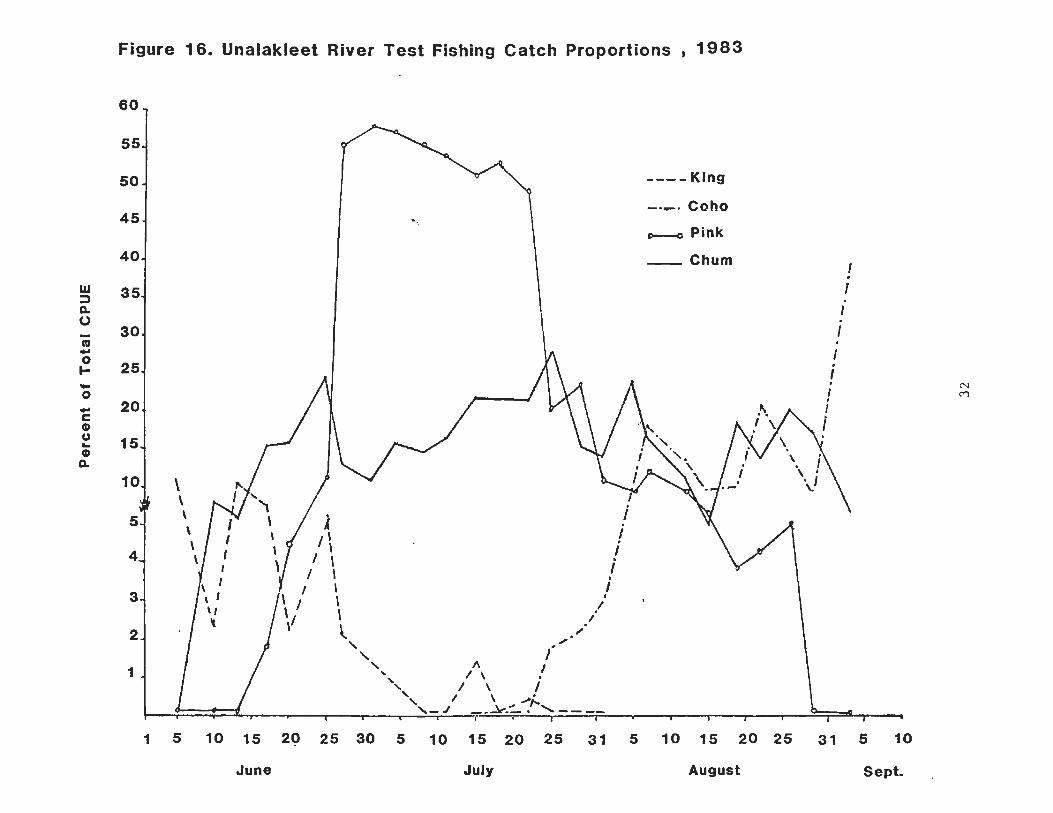
Figure 16 Unalakleet River Test Fishing Catch Proportions1983 bullbullbullbullbullbullbullbullbullbullbullbullbullbullbullbullbullbullbullbullbullbullbullbullbullbullbullbullbullbull 32
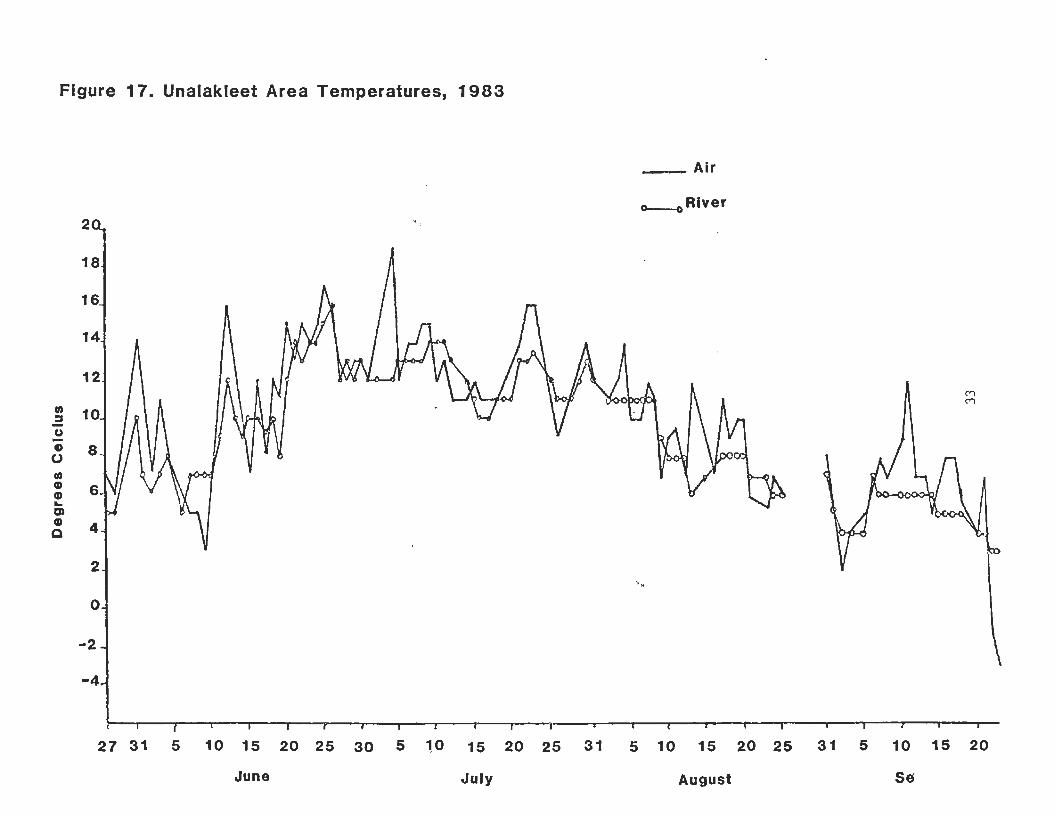
Figure 17 Unalakleet Area Temperatures 1983 bullbullbullbullbullbullbullbullbullbullbullbull 33
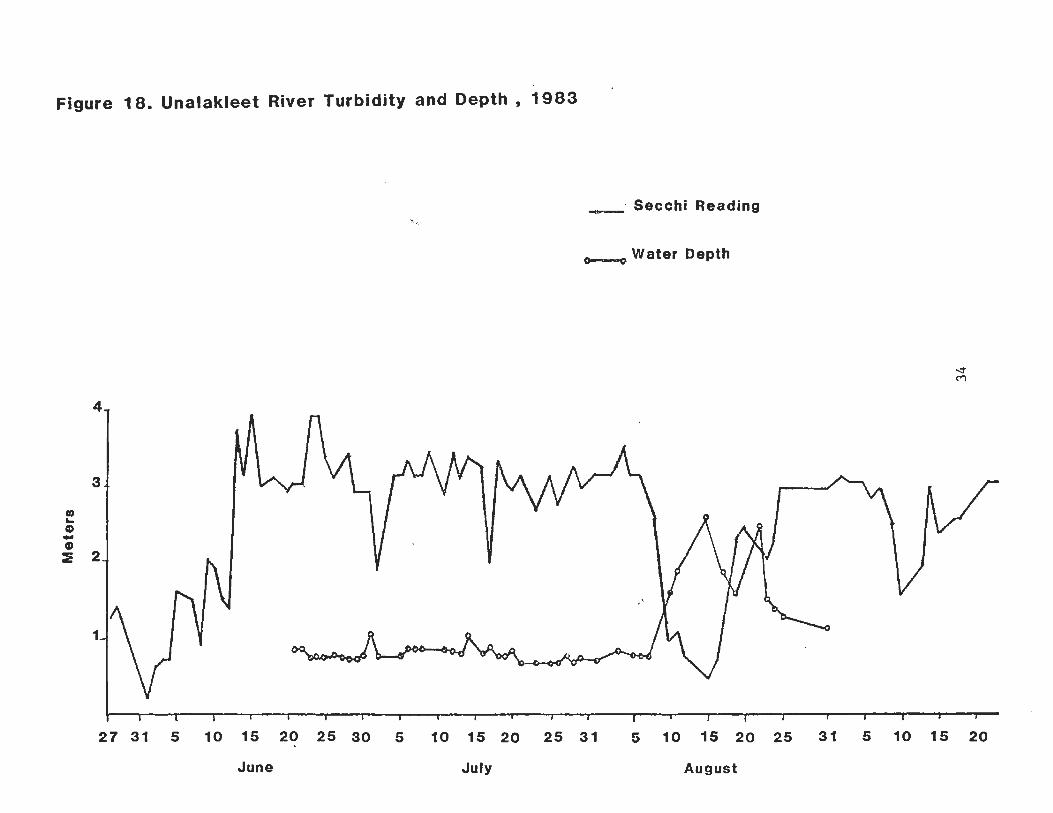
Figure 18 Unalakleet River Turbidity and Depth 1983 bullbullbullbull 34
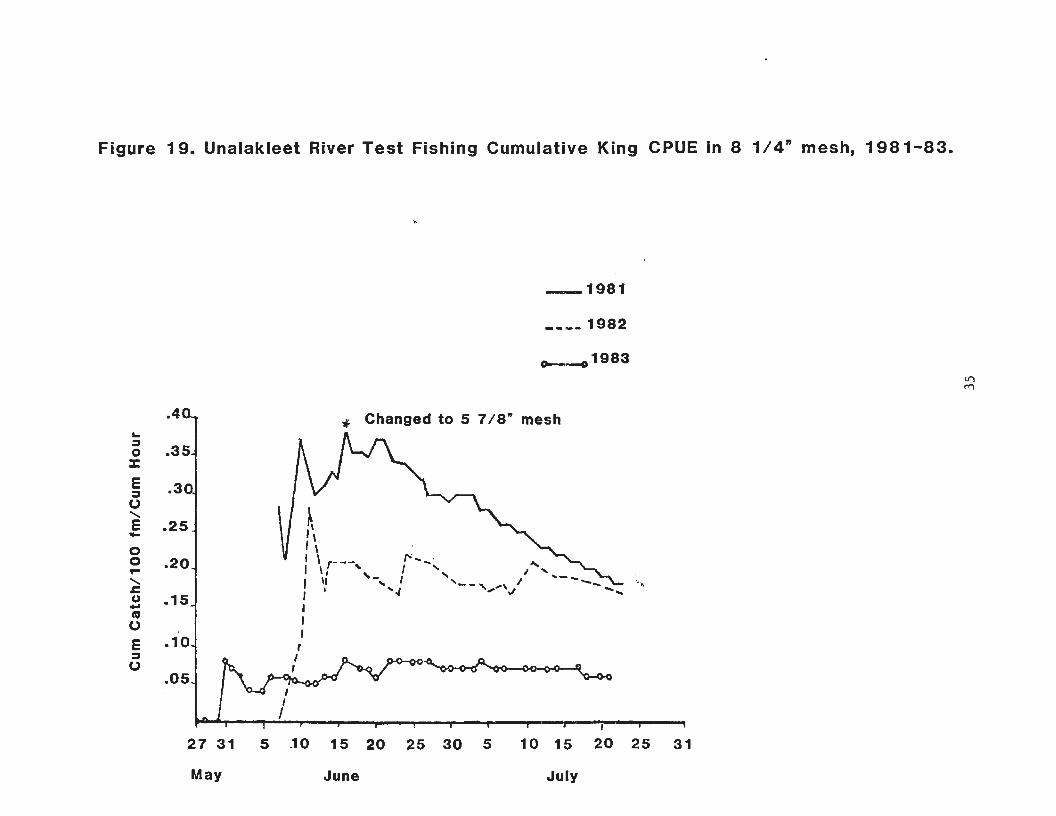
Figure 19 Unalakleet River Test Fishing Cumulative King CPUE in 8 14 Mesh 1981-1983 bullbullbullbullbullbullbullbullbullbullbull 35
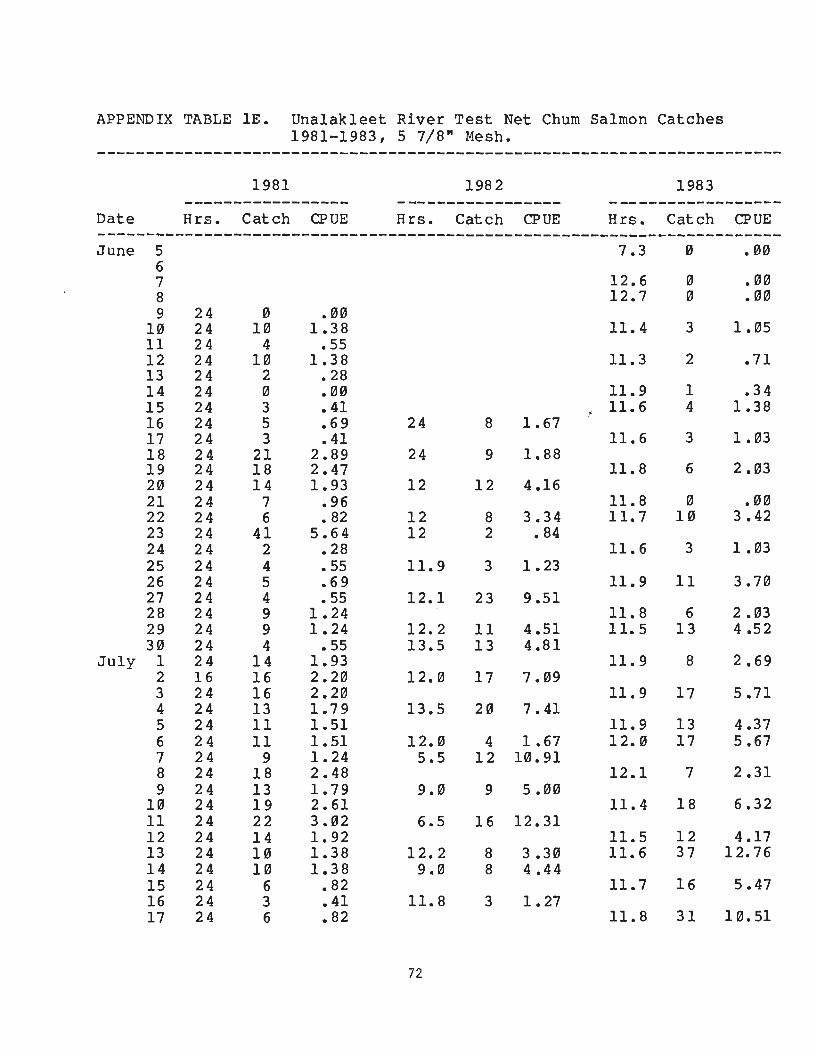
Figure 2~ middotUna1ak1eet River Test Fishing Cuciu1ative Chum CPUE in 5 78 Mesh 1981-1983 bullbullbullbullbullbullbullbullbullbullbull 36
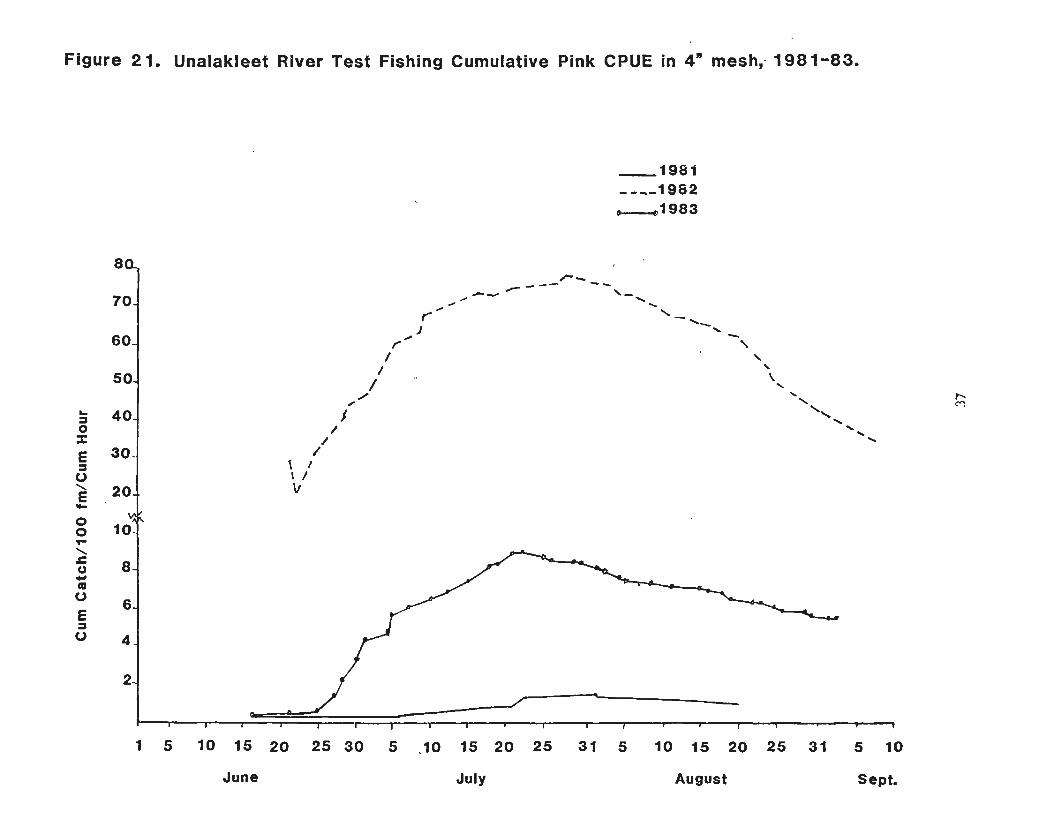
Figure 21 Unalakleet River Test Fishing Cumulative Pink CPUE in 4 Mesh 1981-1983 bullbullbullbullbullbullbullbullbullbullbullbullbullbullbullbullbullbullbullbull 37
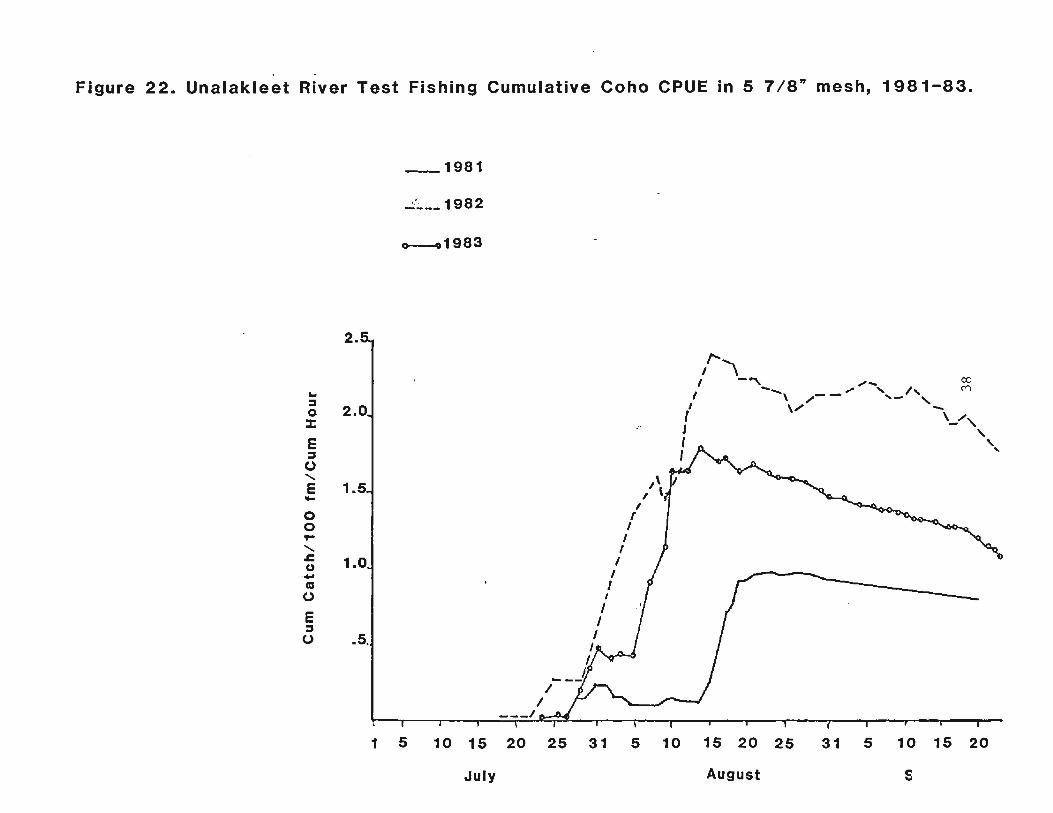
Figure 22 Unalakleet River Test Fishing Cumulative Coho CPUE in 5 78 Mesh 1981-1983 bullbullbullbullbullbullbullbullbullbullbullbullbullbullbullbull 38
-iii shy
LIST OF TABLES
Table 1 Page
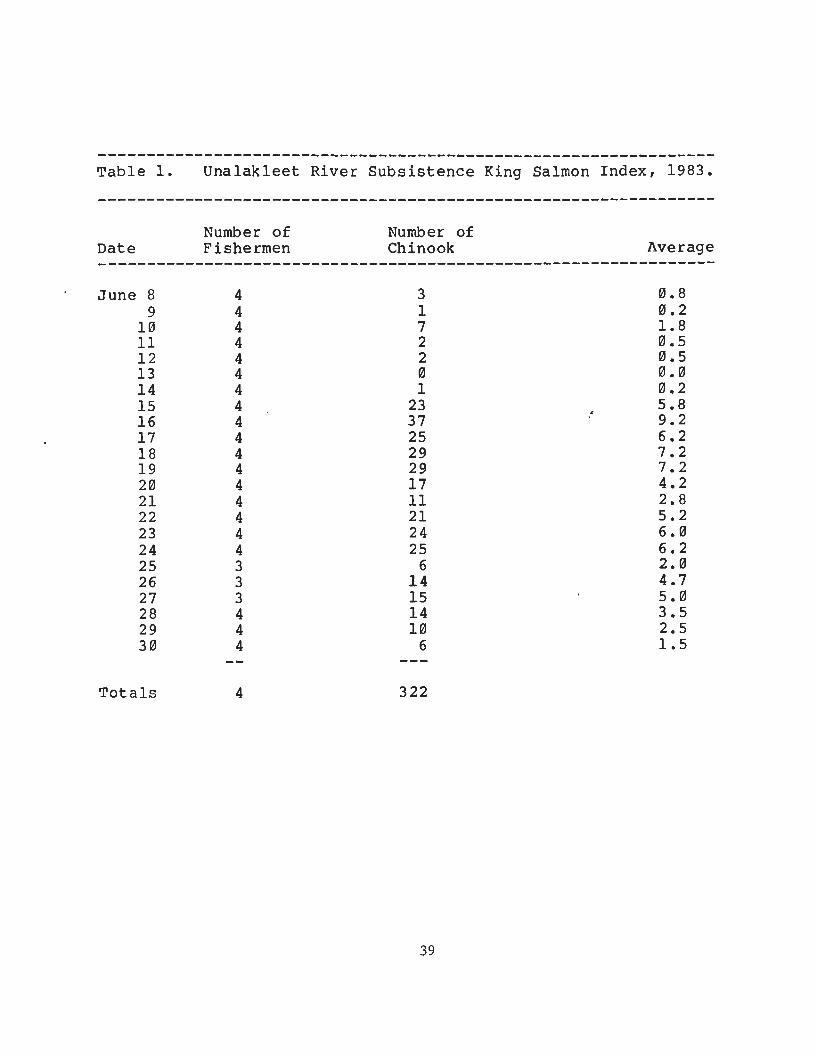
Unalakleet River Subsistence King Salmon Index 1983 bullbullbullbullbullbullbullbullbullbullbullbullbullbullbullbullbullbullbullbullbullbull 39
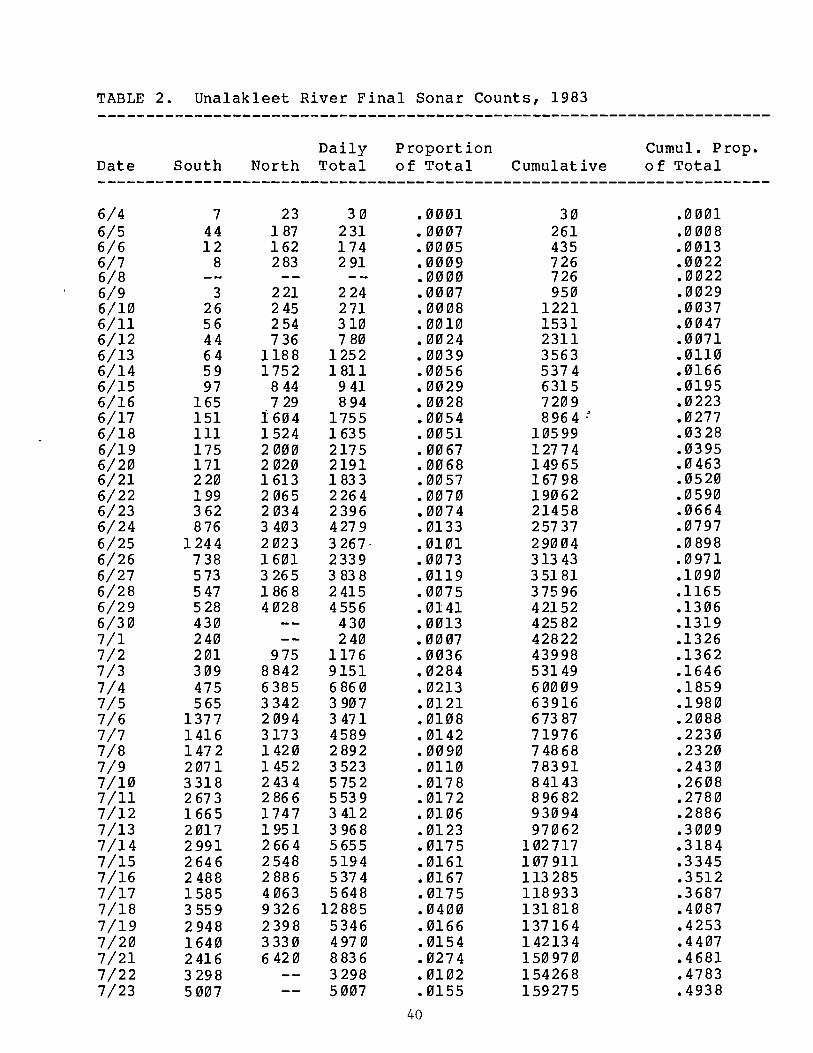
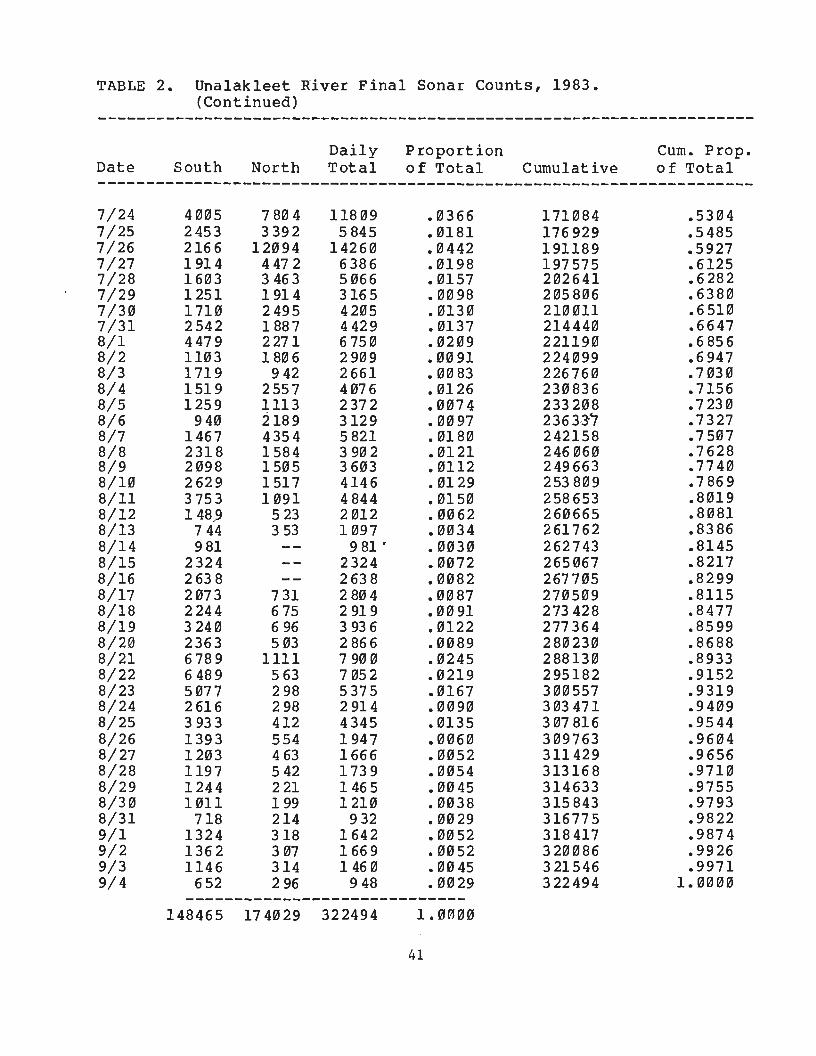
Table 2 Unalakleet River Final Sonar Counts 1983 bullbullbullbullbull 40
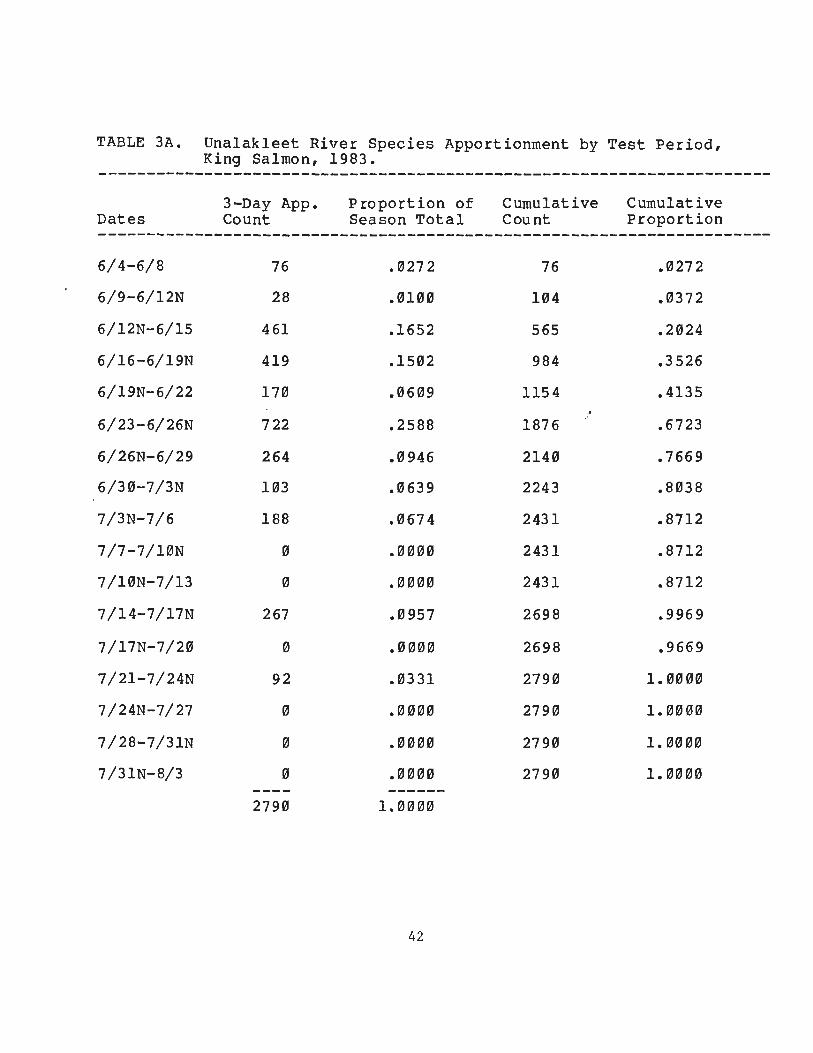
Table 3A Unalakleet River Species Apportionment by Test Period - King Salmon 1983 bullbullbullbullbullbullbullbullbullbullbullbullbullbullbull 42
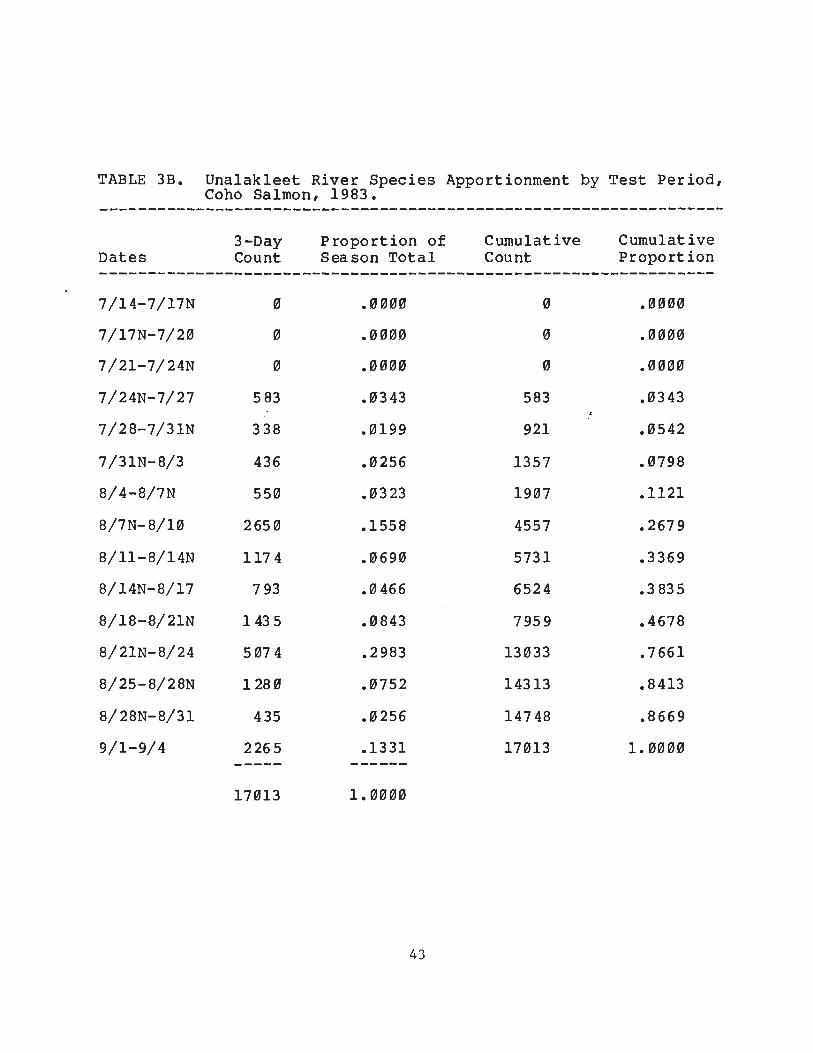
Table 3B Unalakleet River Species Apportionment by Test Period - Coho Salmon 1983 bullbullbullbullbullbullbullbullbullbullbullbullbullbullbull 43
Table 3C
Table 3D
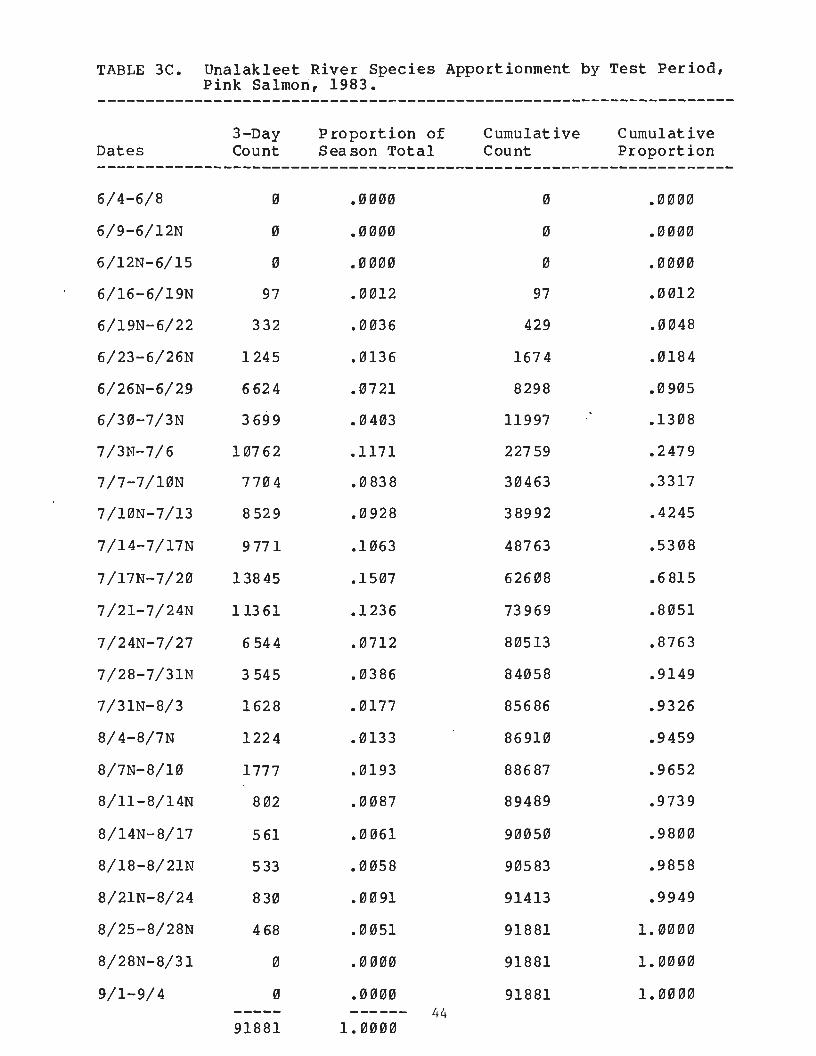
Unalakleet River Species Apportionment by Test Period - Pink Salmon 1983 bullbullbullbullbullbullbullbullbullbullbullbullbullbullbull 44
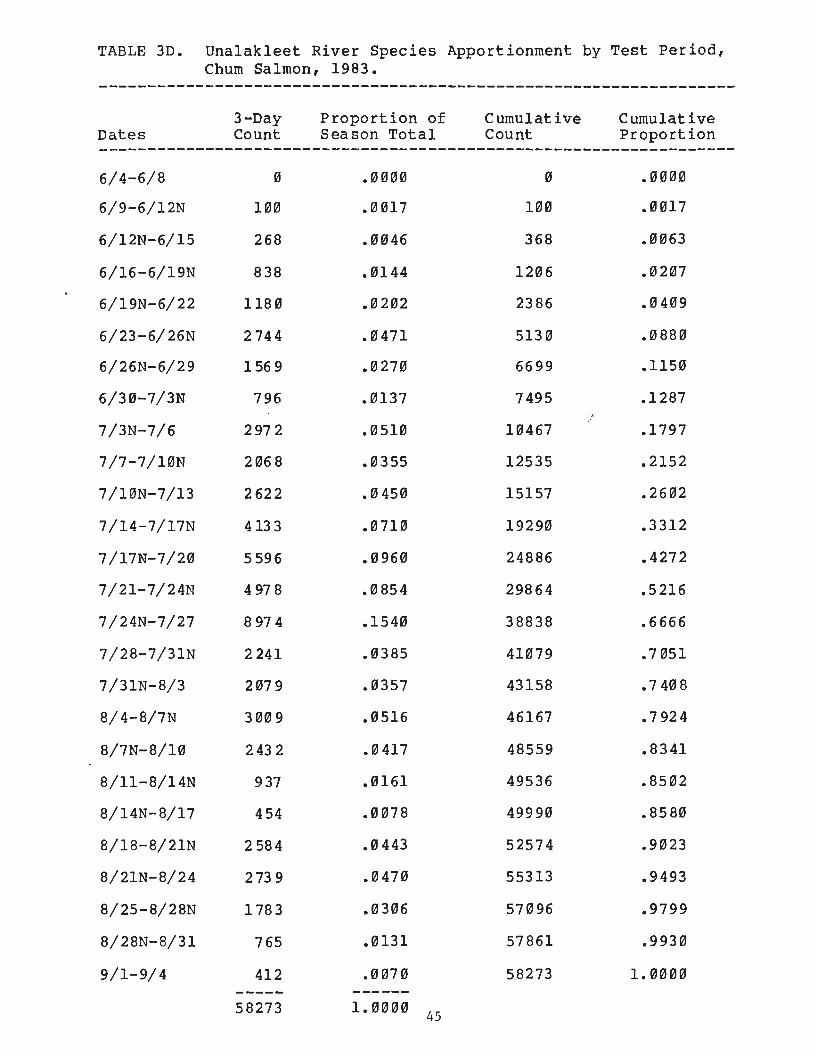
Unalakleet River Species Apportionment by Test Period - Chum Salmon 1983 bullbullbullbullbullbullbullbullbullbullbullbullbullbullbull 45
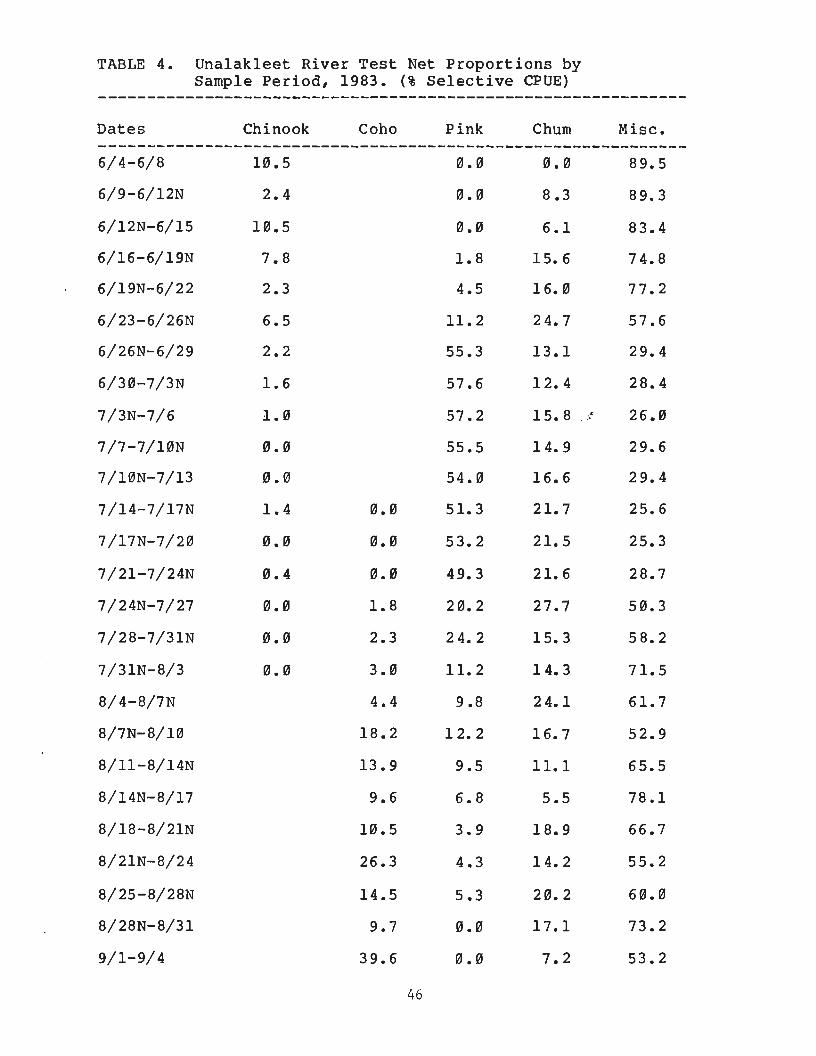
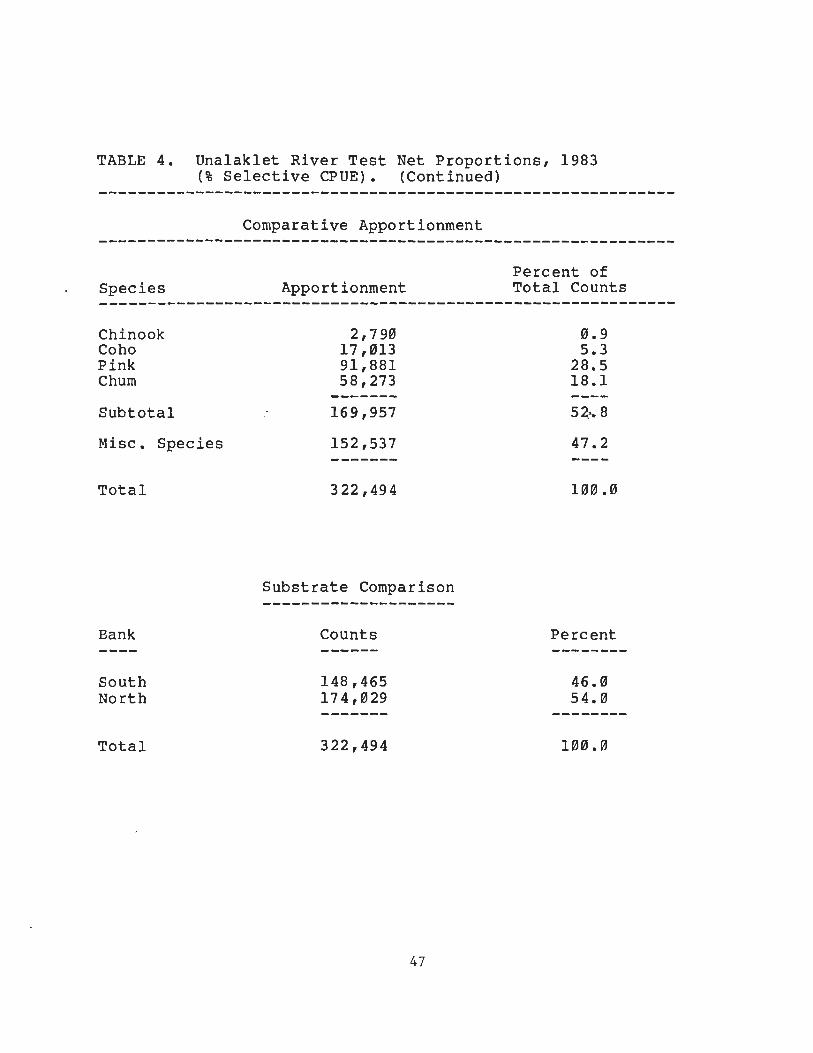
Table 4 Unalakleet River Test Net Proportions by Sample Period 1983 (selective CPUE) bullbullbullbullbullbullbullbullbullbull 46
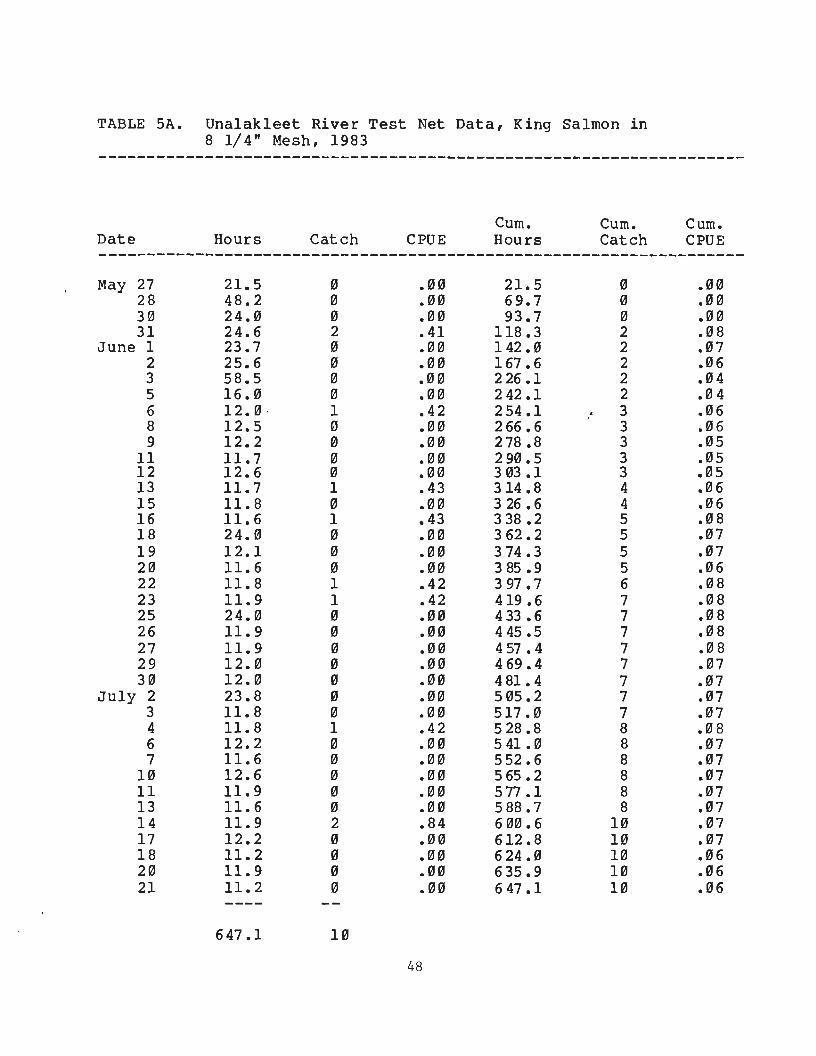
Table SA Unalakleet River Test Net Data King Salmon in 8 14 Mesh 1983 bullbullbullbullbull 48
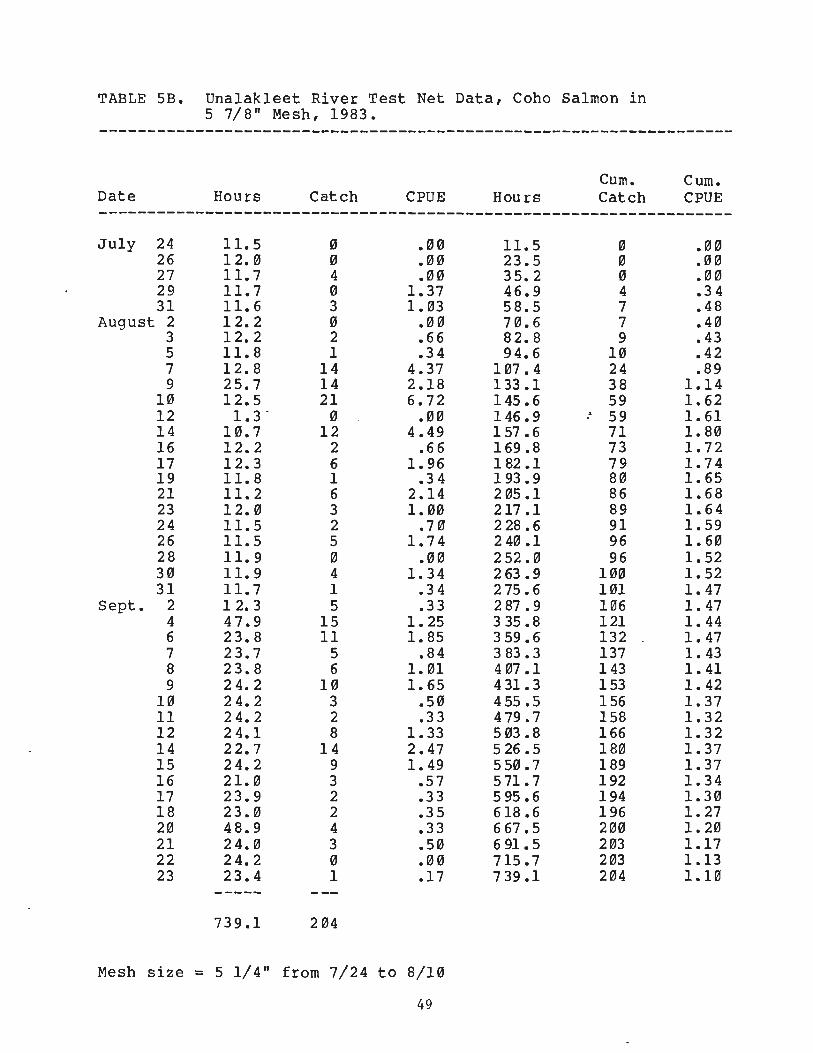
Table 5B Unalakleet River Test Net Data Coho Salmon in 5 78 Mesh 1983 bullbullbull 49
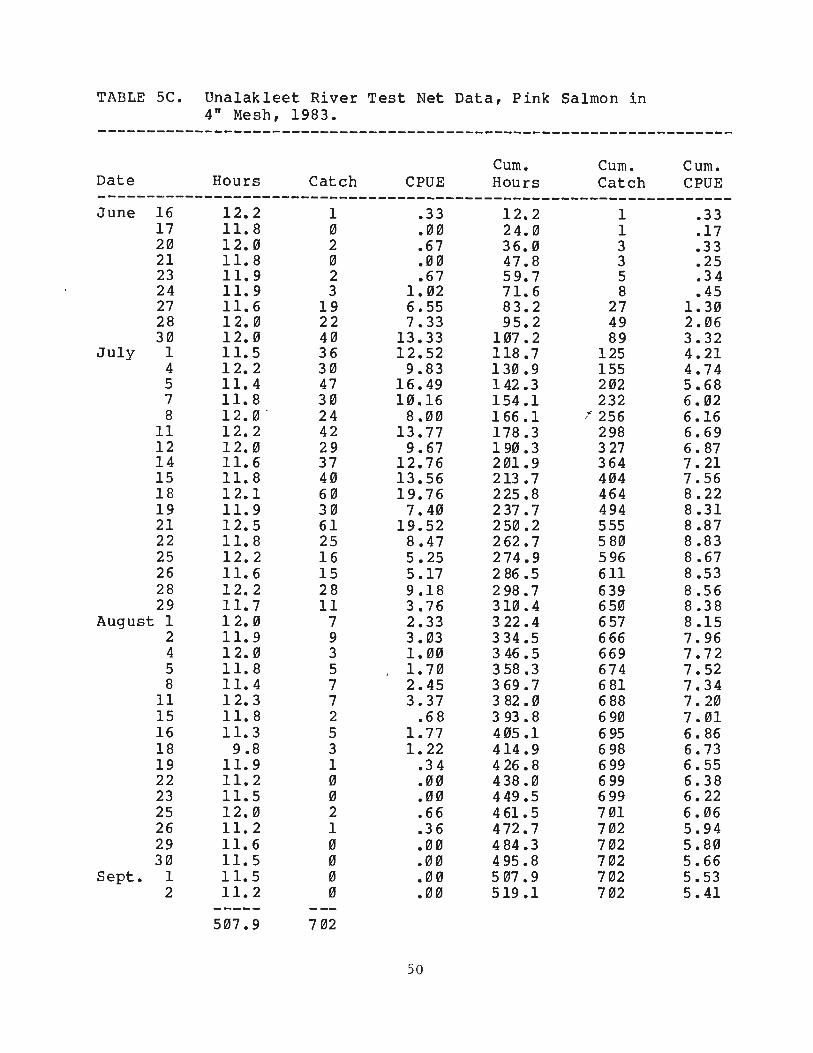
Table 5C Unalakleet River Test Net Data Pink Salmon in 4 Mesh 1983 bullbull 5~
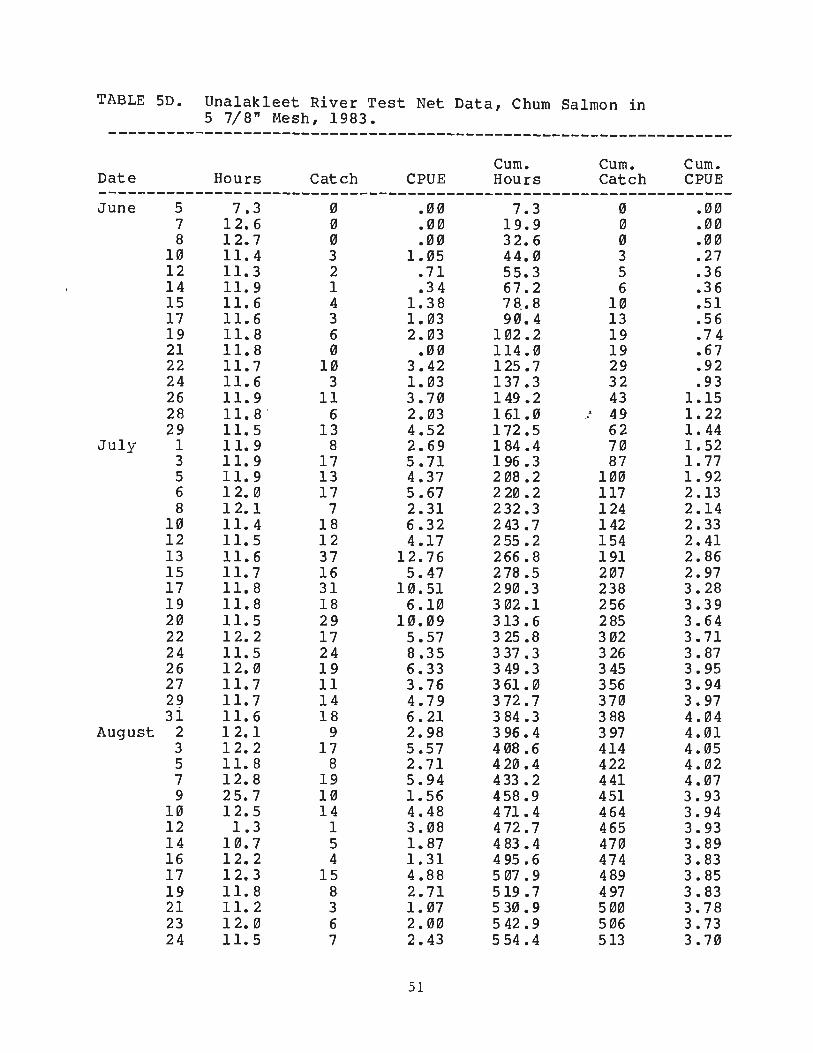
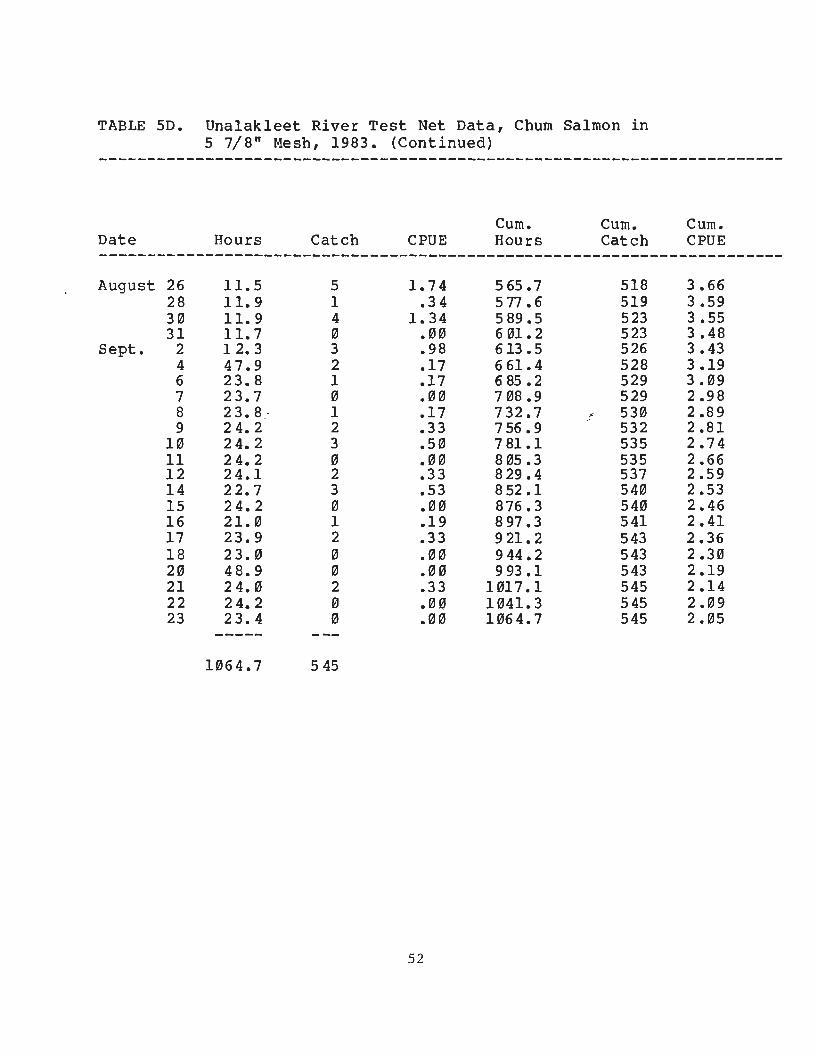
Table 5D Unalakleet River Test Net Data Chum Salmon in 5 78 Mesh 1983 bullbullbullbullbullbullbullbullbullbullbullbullbullbullbullbullbullbullbull 51
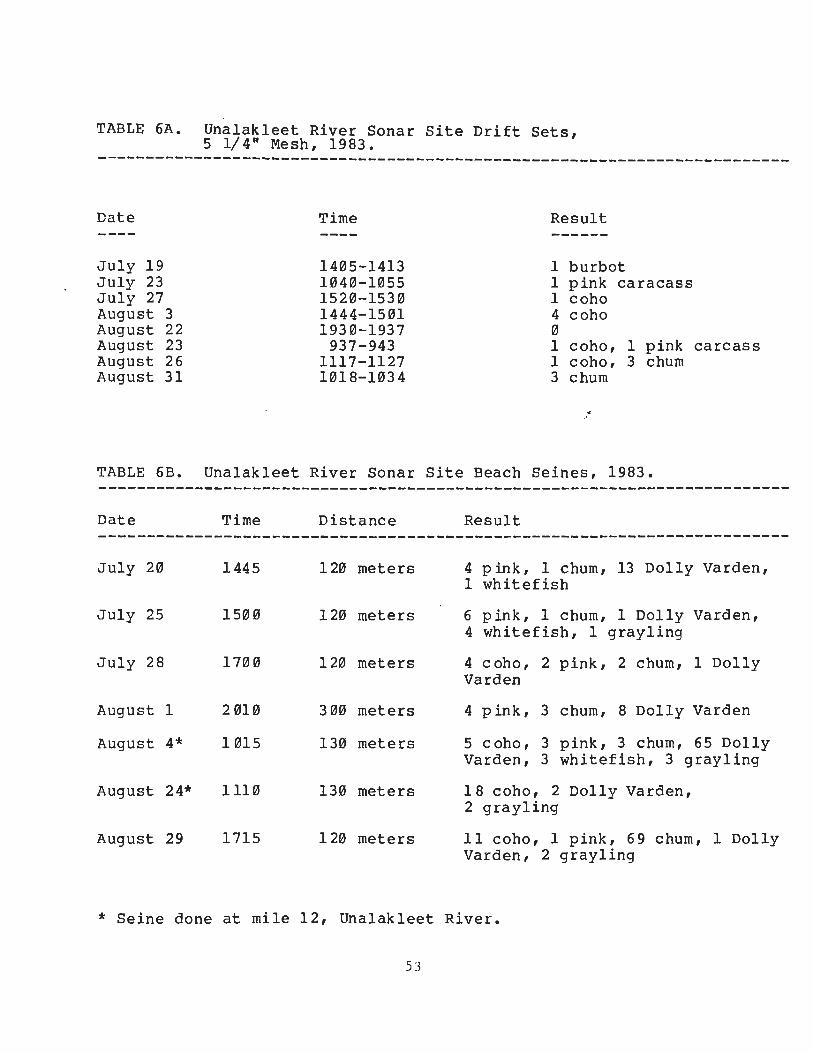
Table 6A Unalakleet River Sonar Site Drift Sets 5 14 Mesh 1983 bullbullbullbullbullbullbullbullbullbullbullbullbullbull 53
Table 6B Unalakleet River Sonar Site Beach Seines 1983 bullbullbullbullbullbullbullbullbull ~ 53
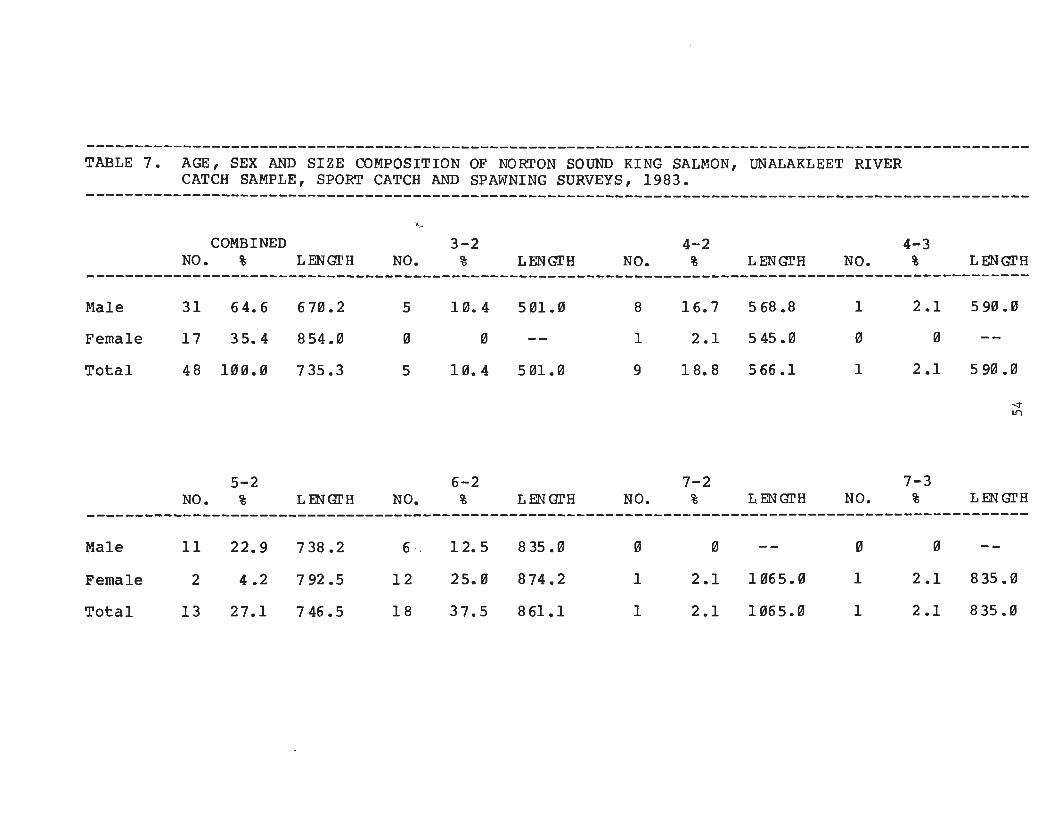
Table 7 Age Sex and Size Composition of Norton Sound King Salmon Unalakleet River Catch Sample Sport Catch and Spawning Surveys 1983 bullbullbullbullbullbullbullbull 54
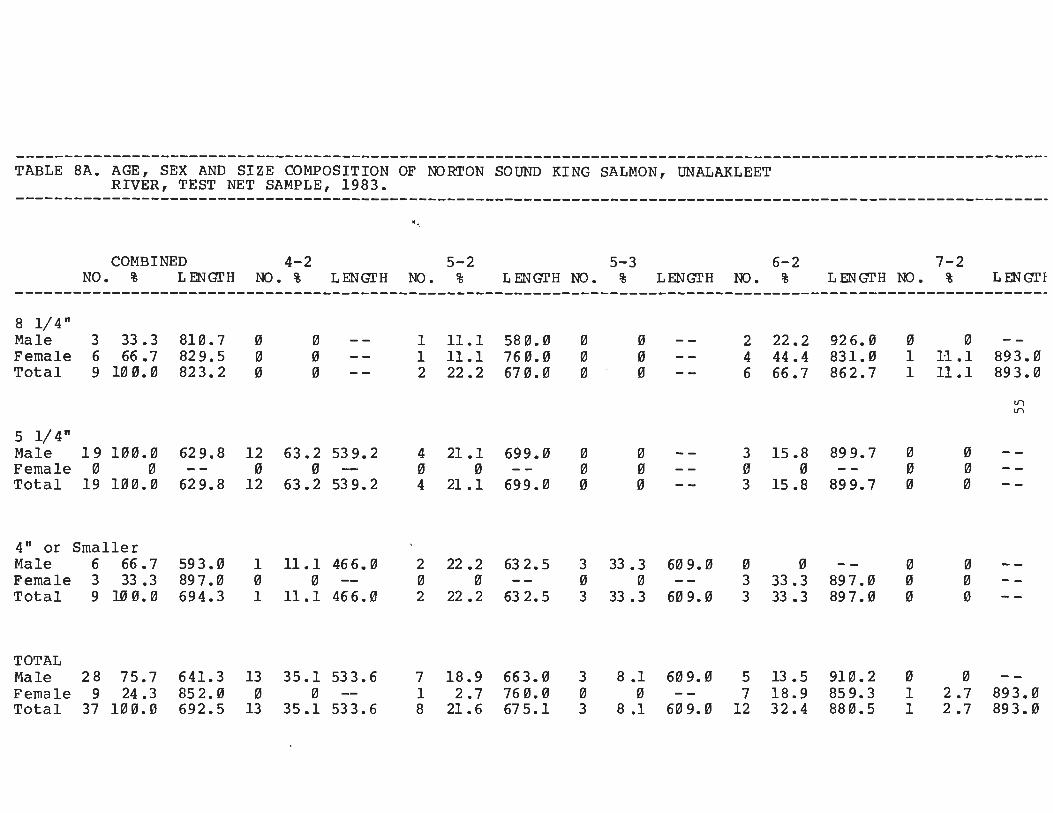
Table 8A Age Sex and Size Composition of Norton Sound King Salmon Unalakleet River Test Net Sample 1983 bullbullbullbullbullbullbullbull 55
-ivshy
Page Table 8B Age Sex and Size Composition of Norton Sound
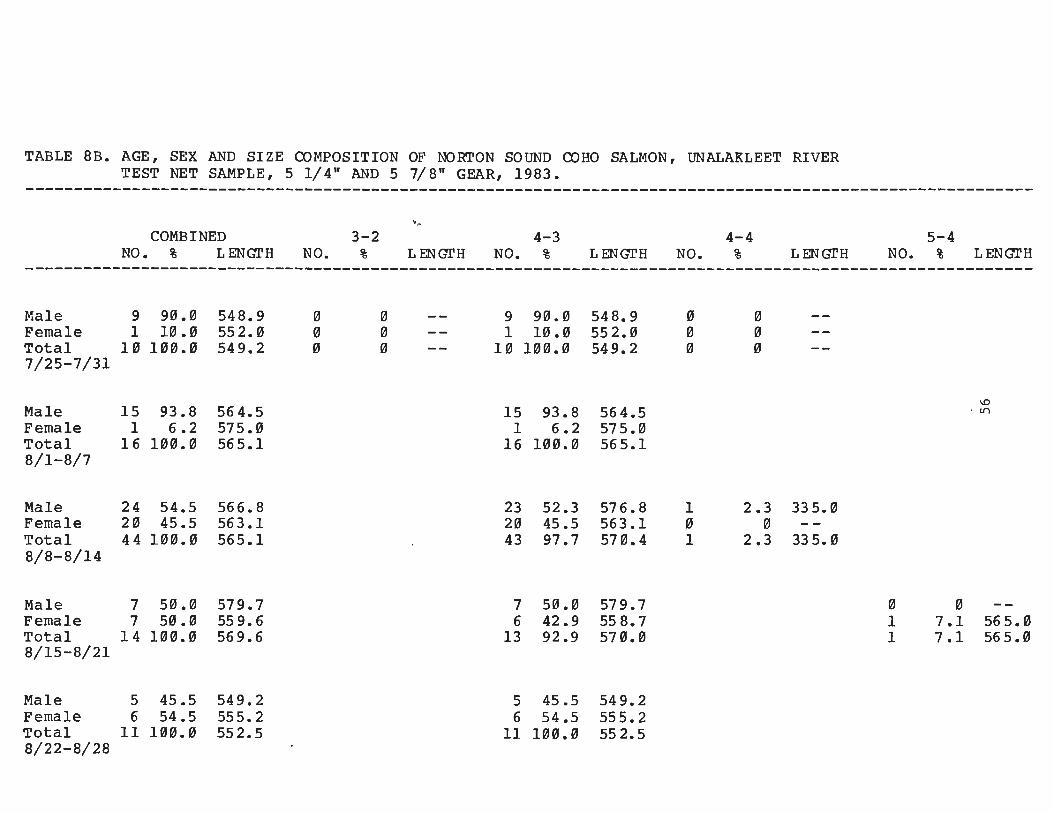
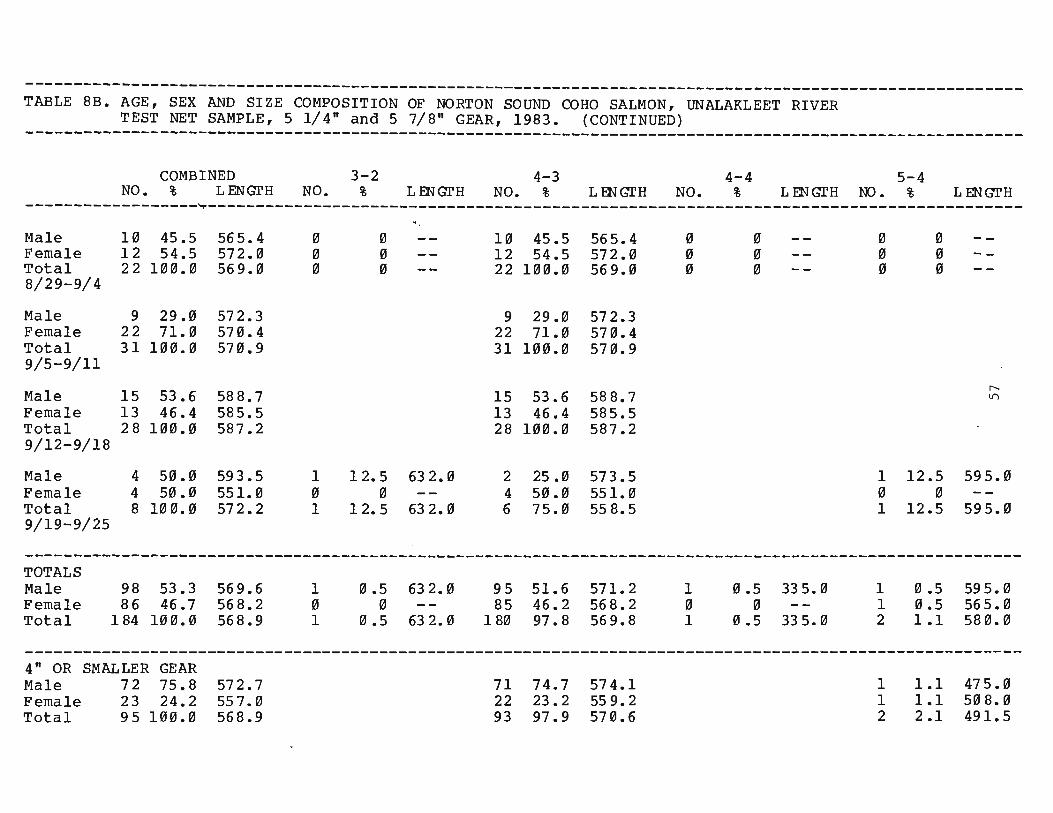
Coho Salmon Unalakleet River Test Net Sample 5 14n and 57811 Gear 1983 bullbullbullbullbullbullbullbullbullbullbullbullbullbullbullbullbullbull 56
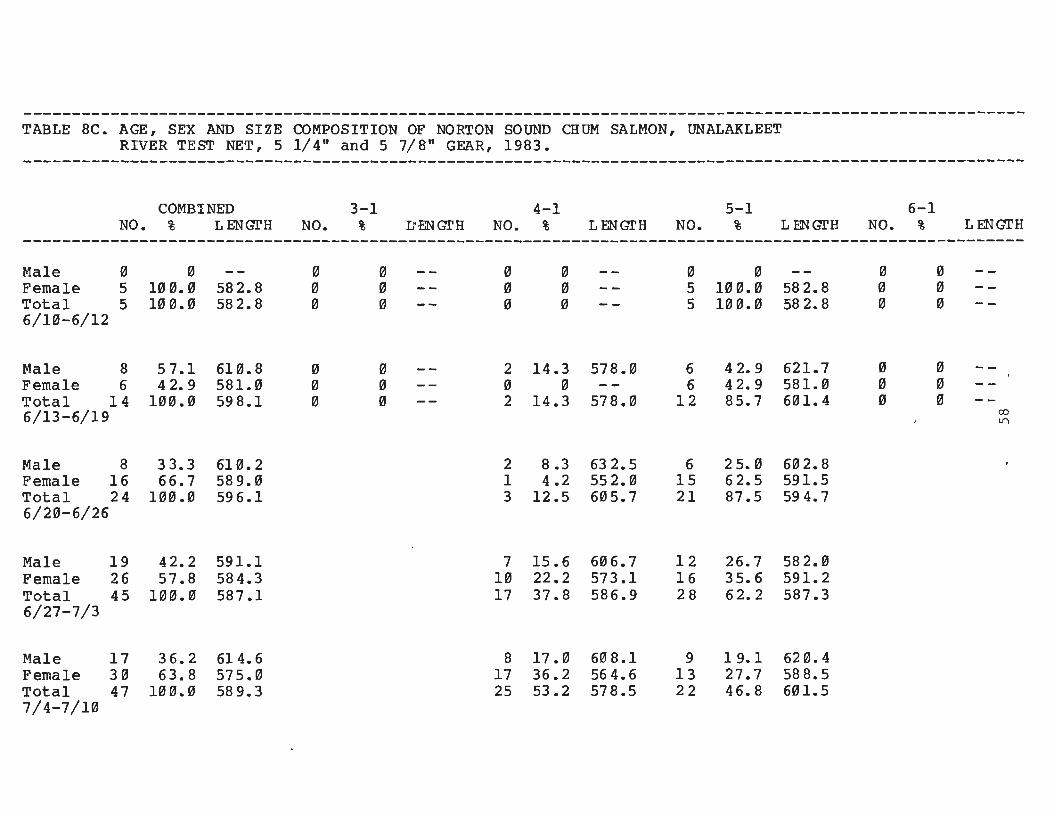
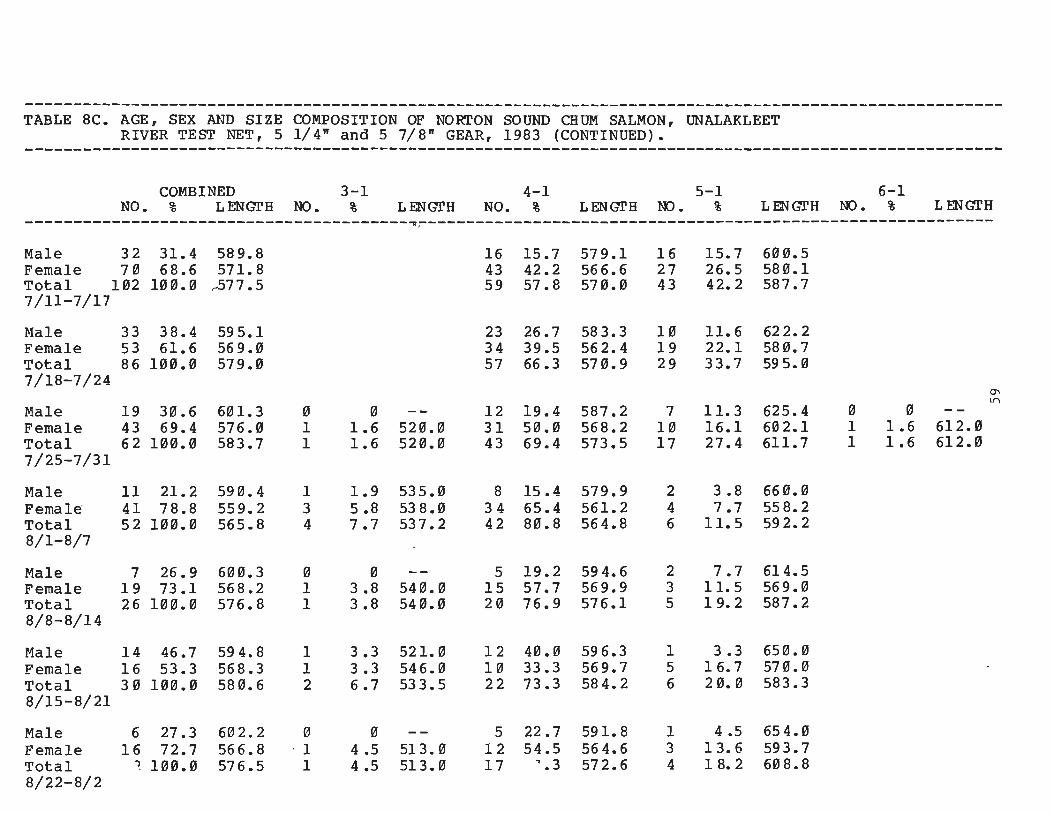
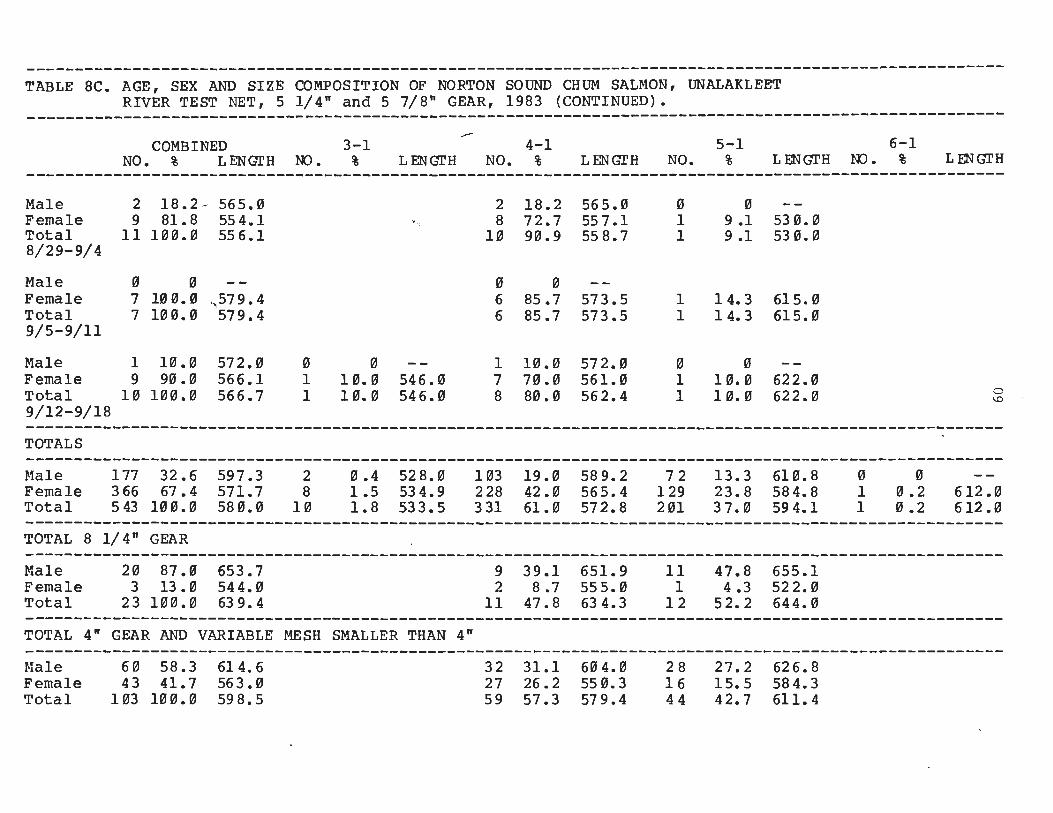
Table 8C Age Sex and Size Composition of Norton Sound Chum Salmon Unalakleet River Test Net 5 1 4 n and 5 7 8 Gea r 19 8 3 bull bull bull bull bull bull bull bull bull bull bull bull bull bull bull bull bull 5 8
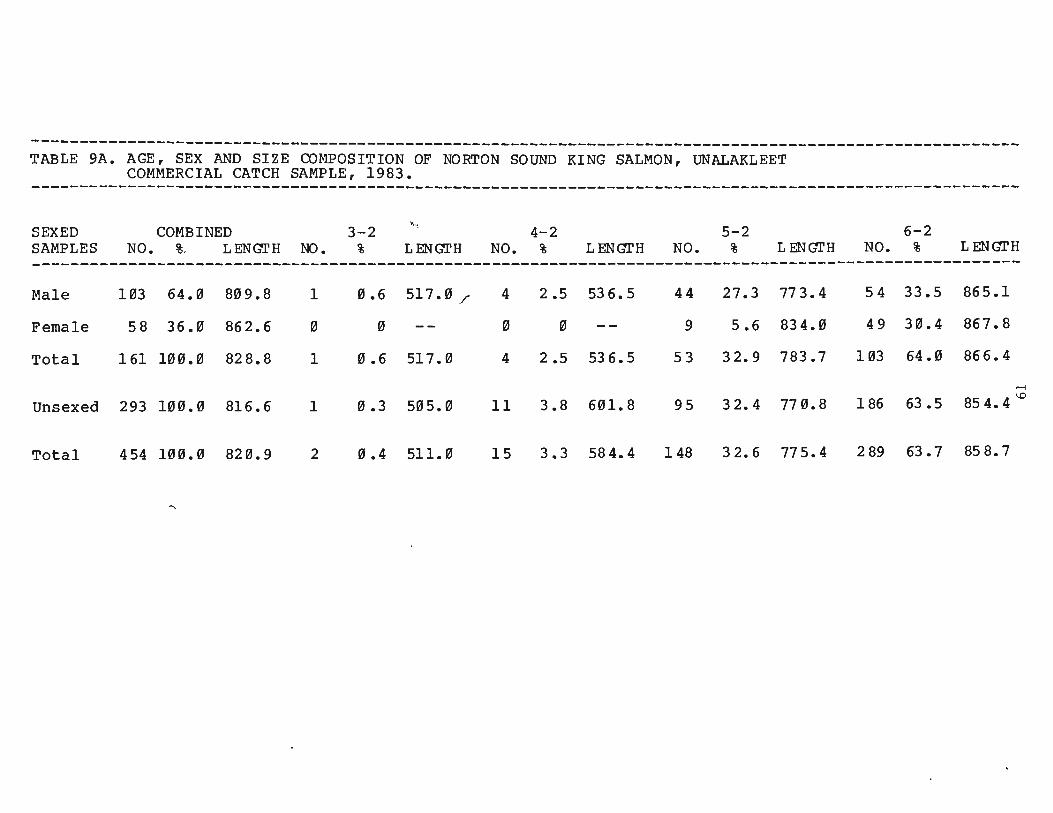
Table 9A Age Sex and Size Composition of Norton Sound King Salmon Unalakleet Commercial Catch Sample 1983 bullbullbullbullbullbull 61
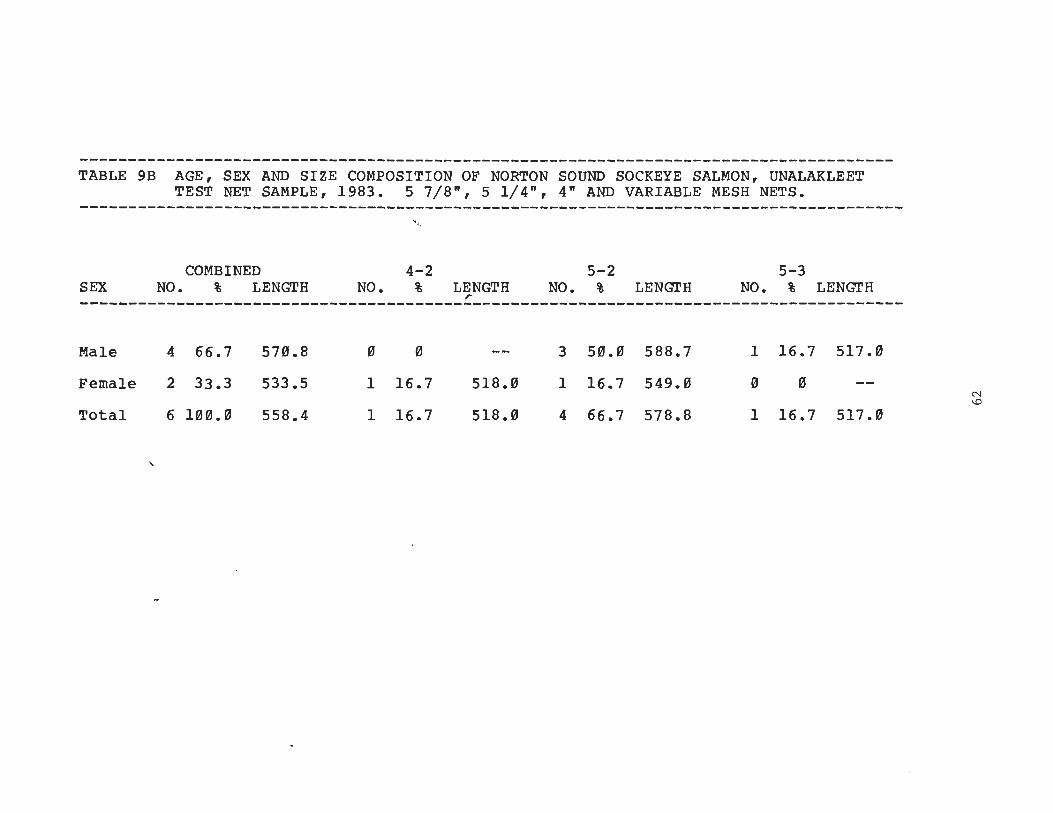
Table 9B Age Sex and Size Composition of Norton Sound Sockeye Salmon Unalakleet Test Net Sample 5 78 11 5 14 n 4n and Variable Mesh Nets 1 98 3 bull bull bull bull bull bull bull bull bull bull bull bull bull bull bull bull bull bull bull bull bull bull bull bull bull bull bull bull e $ bull bull bull bull bull bull bull bull bull bull bull 6 2
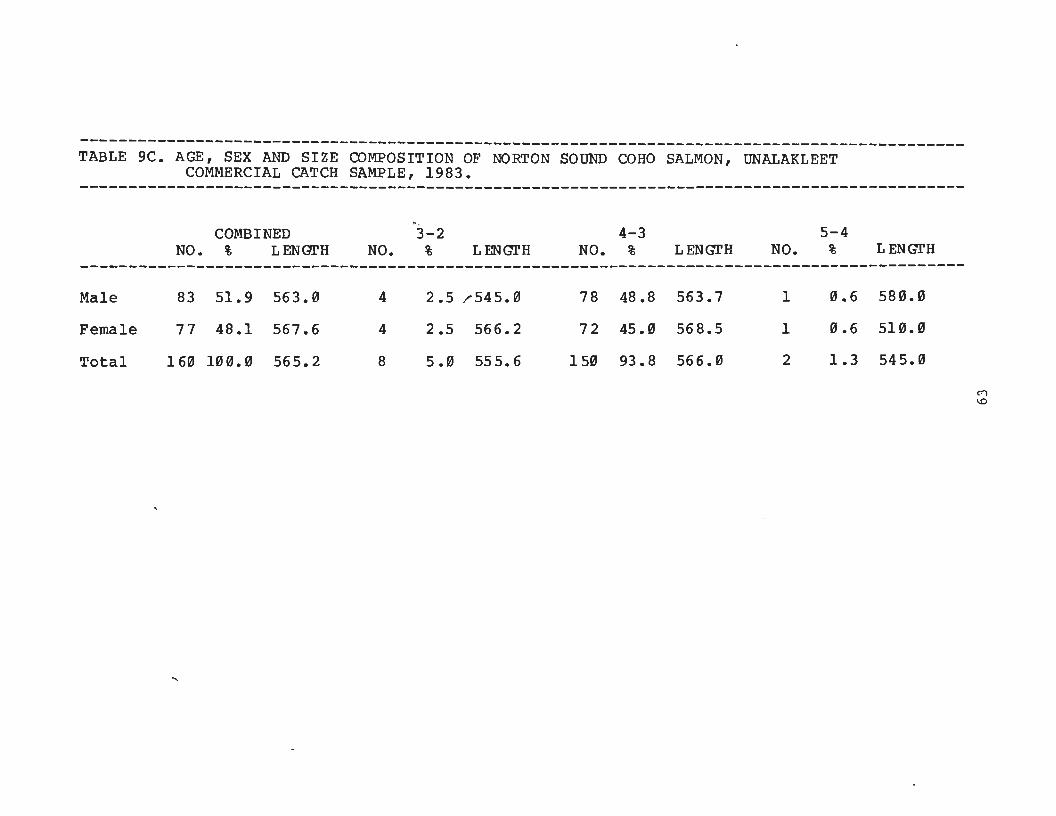
Table 9C Age Sex and Size Composition of Norton Sound Coho Salmon Unalakleet Commercial Catch Sample 1983 bullbullbullbullbullbullbullbull 63
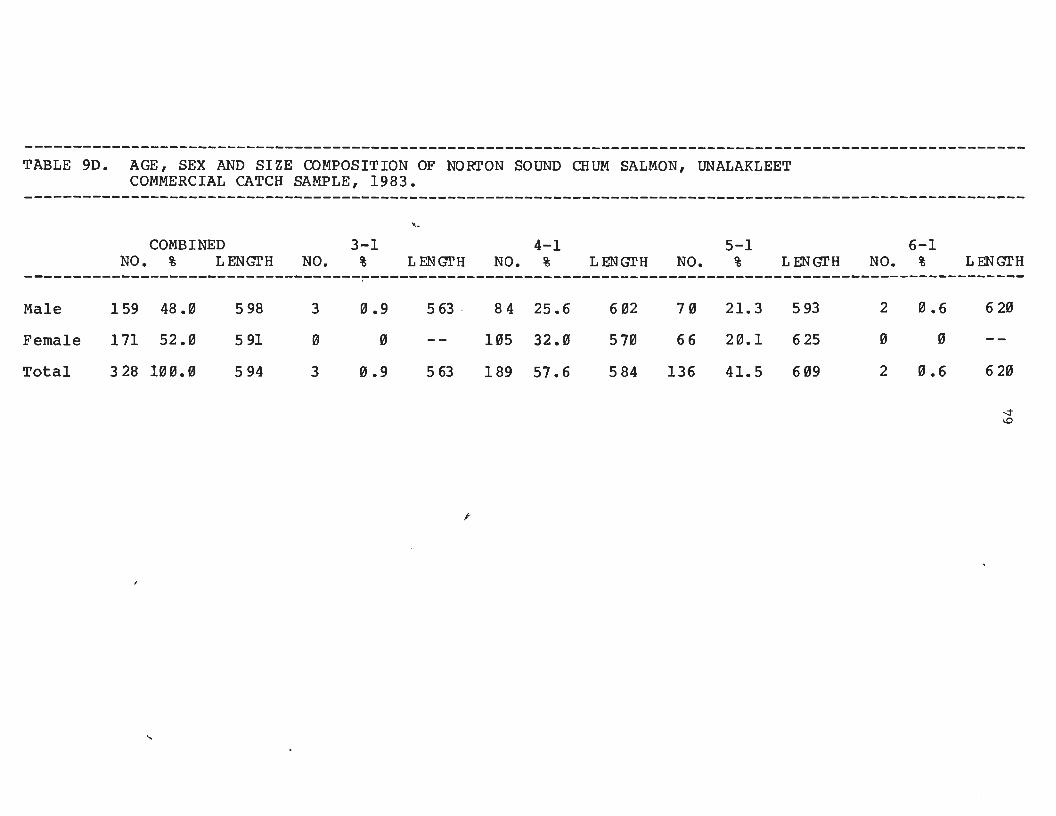
Table 9D Age Sex and Size Composition of Norton Sound Chum Salmon Unalakleet Commercial Catch Sample 1983 bullbullbullbullbullbullbullbullbullbullbull 64
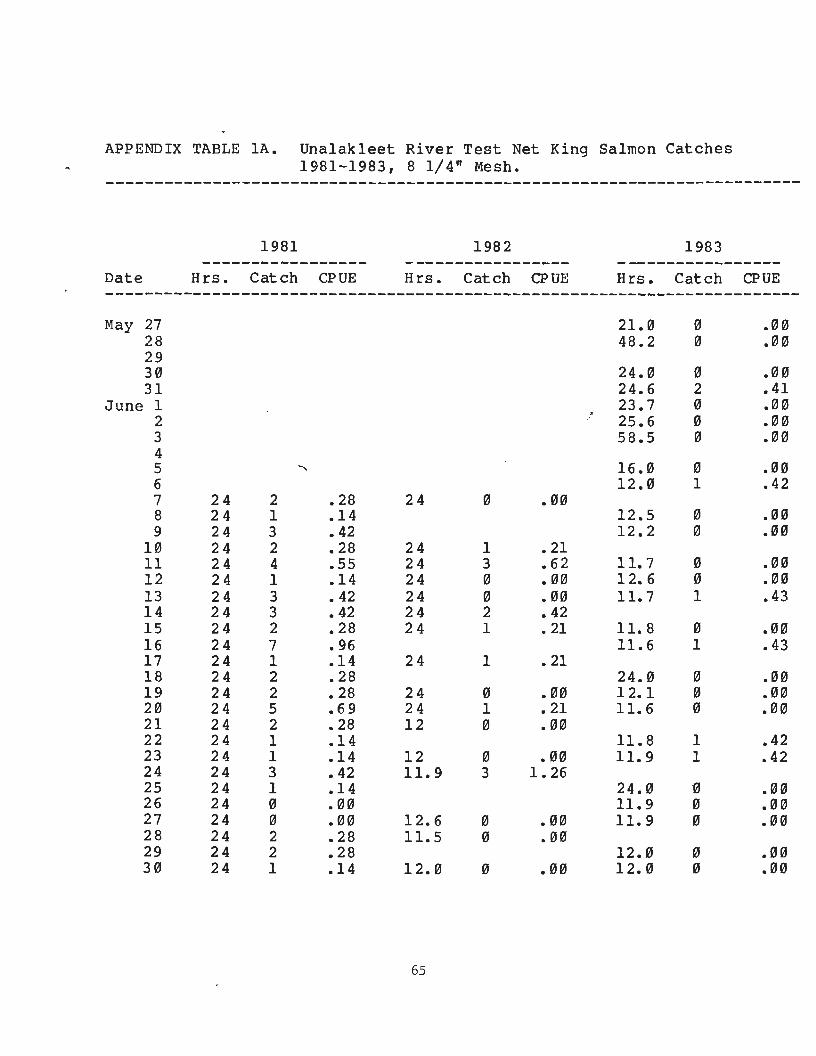
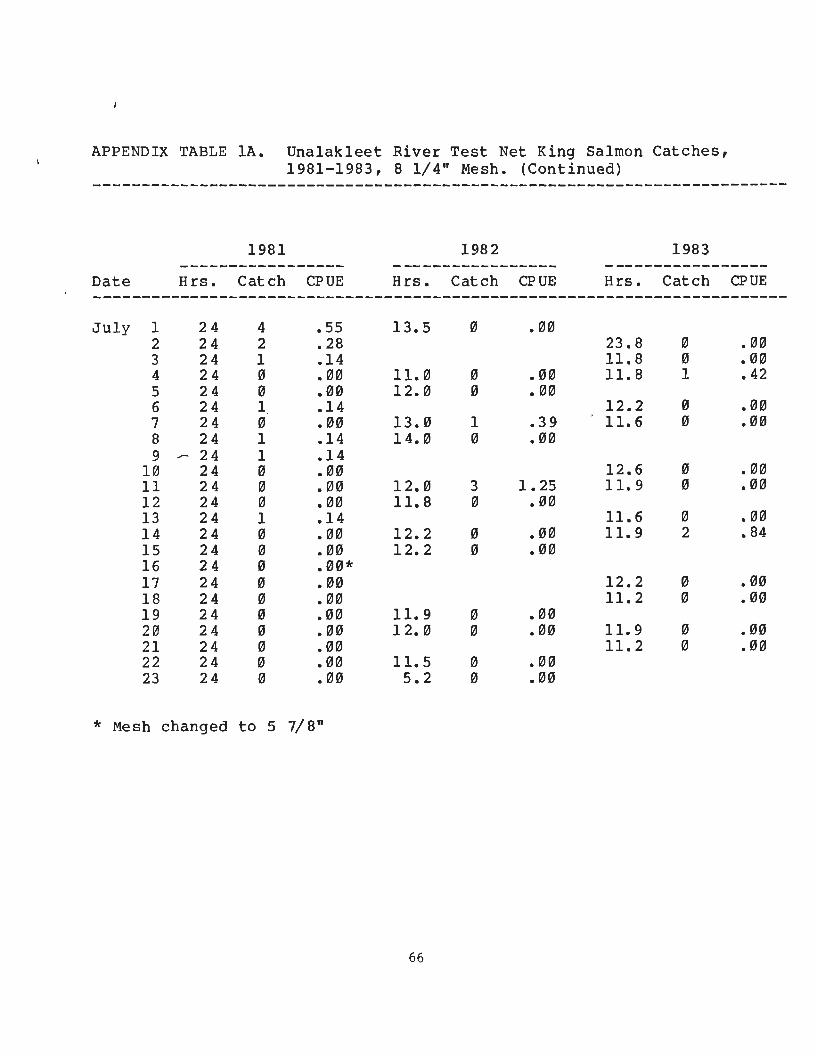
Appendix Table lAo Unalakleet River Test Net King Salmon Catches 1981-1983 8 1411 Mesh bullbullbullbullbullbullbullbullbullbullbullbullbullbullbullbullbullbullbullbullbullbullbullbull 65
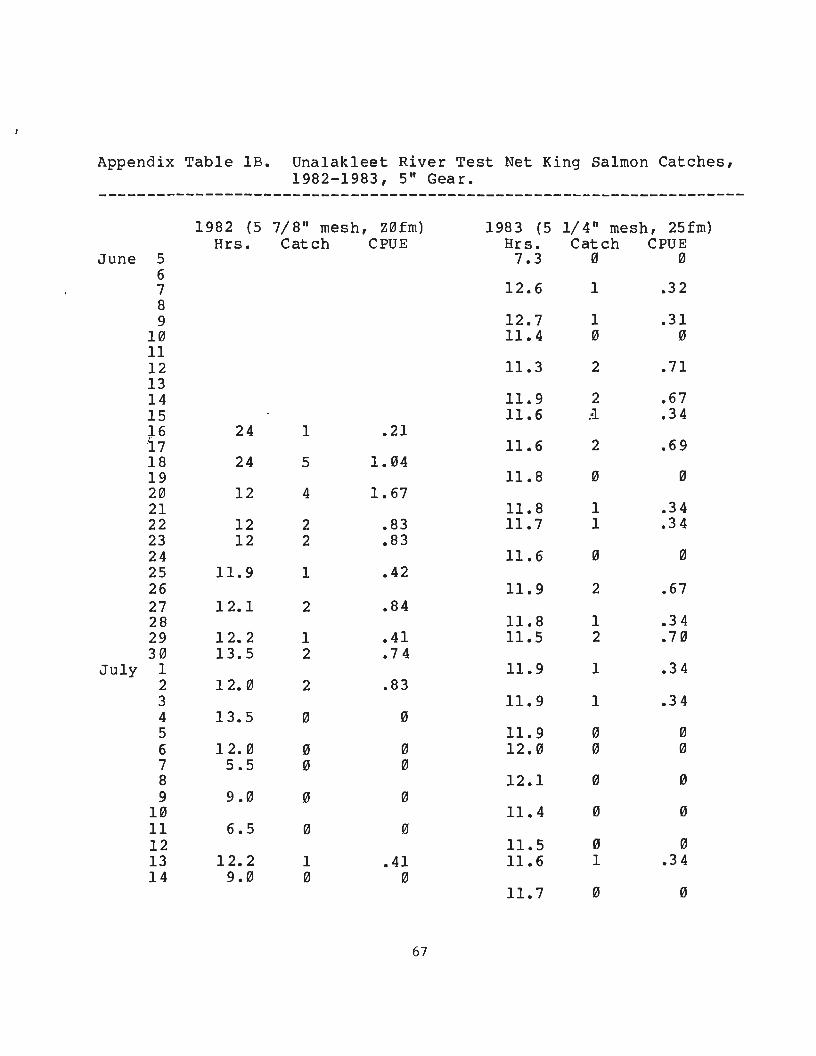
Appendix Table lB Unalakleet River Test Net King Salmon Catches 1982-1983 5 Gear bullbullbullbullbullbullbullbullbullbullbullbullbullbullbullbullbullbullbullbullbullbullbullbullbullbullbullbull 67
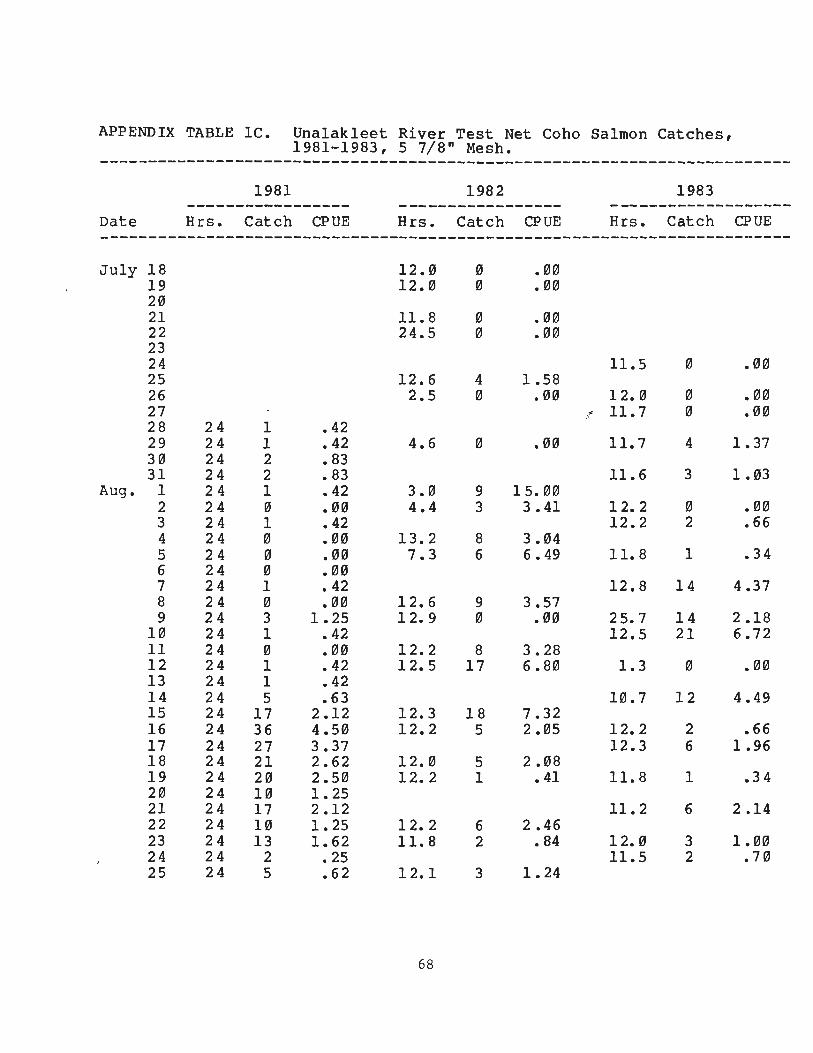
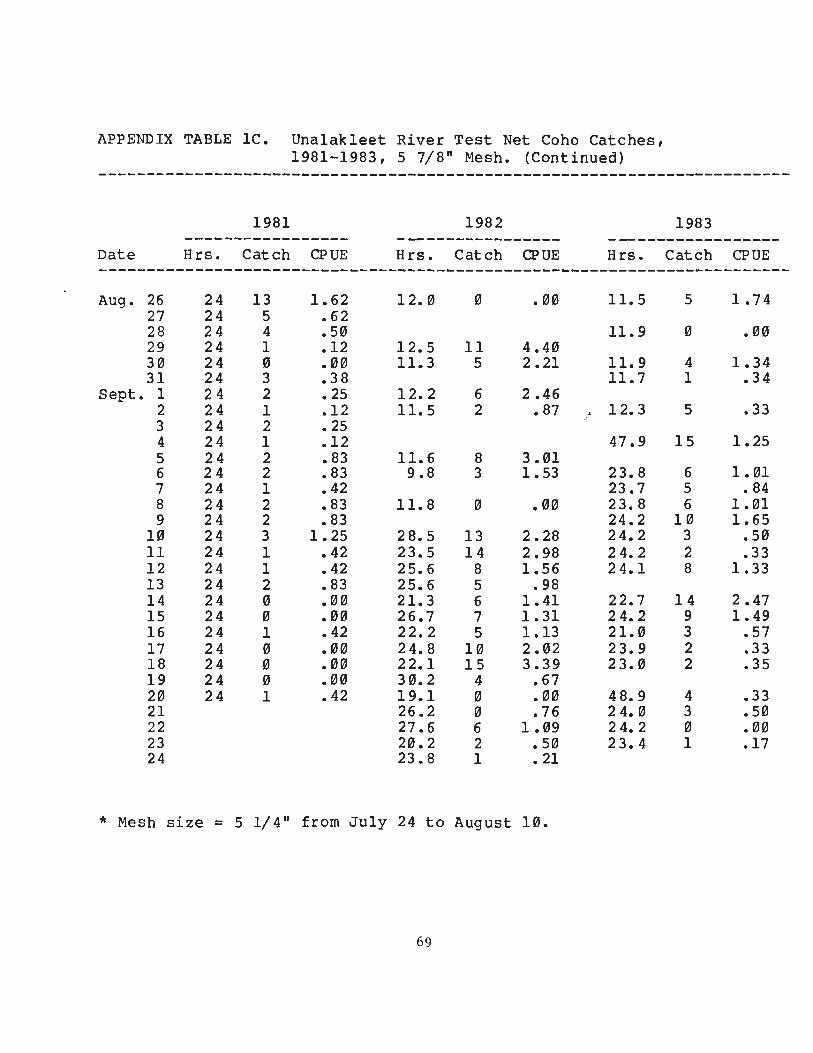
Appendix Table lC Unalakleet River Test Net Coho Salmon Catches 1981-1983 5 78 n Mesh bullbullbullbullbullbullbullbullbullbullbullbullbullbullbullbullbullbullbullbullbullbullbullbull 68
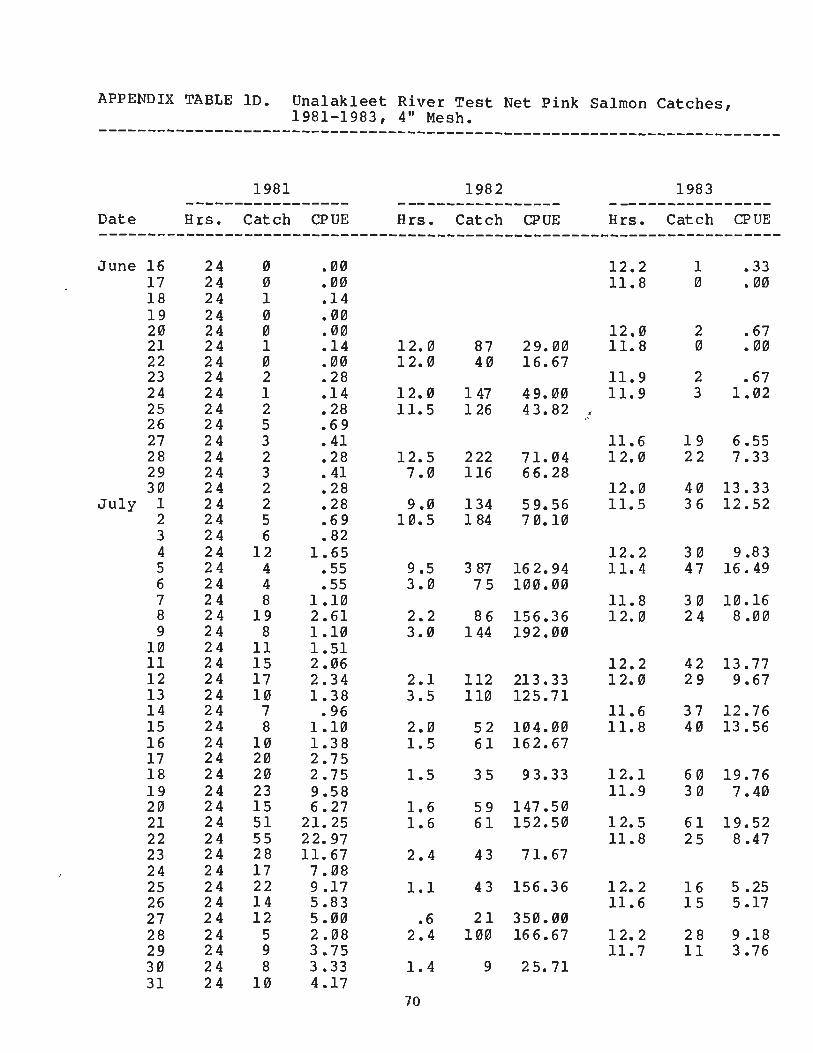
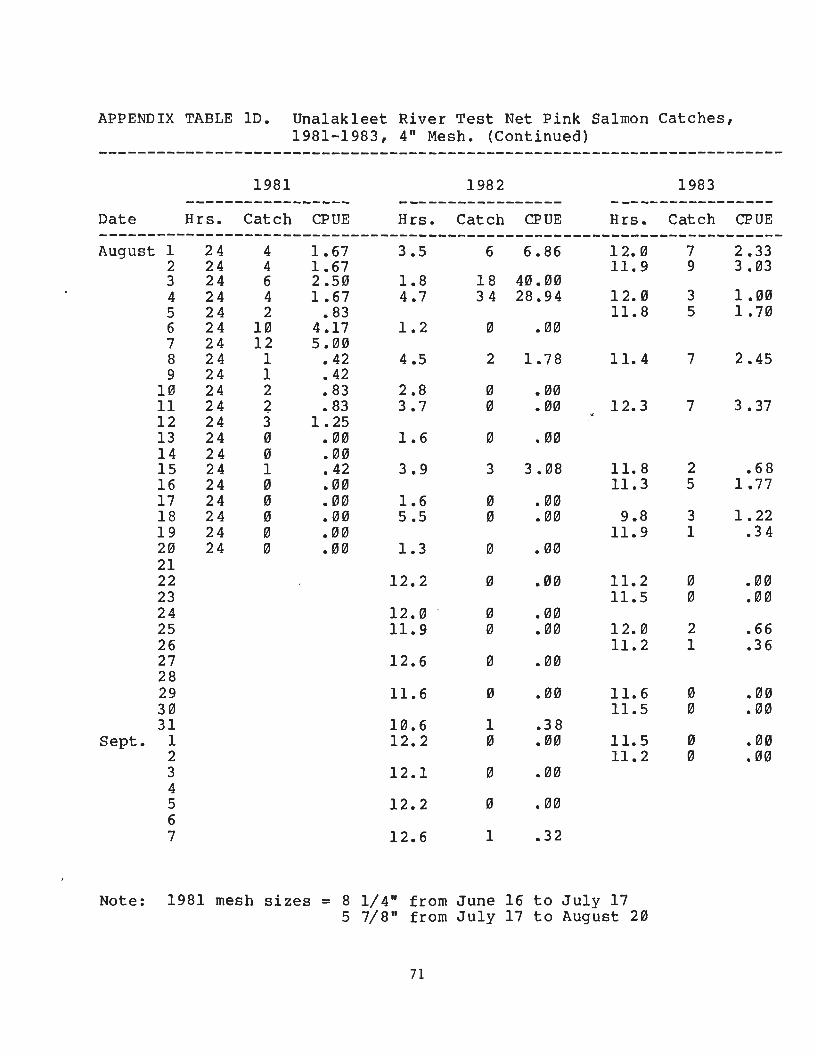
Appendix Table ID Unalakleet River Test Net Pink Salmon Catches 1981-1983 4 n Me sh bullbullbullbullbullbullbullbullbullbullbullbullbullbullbullbullbullbullbullbullbullbullbullbullbullbullbullbull 70
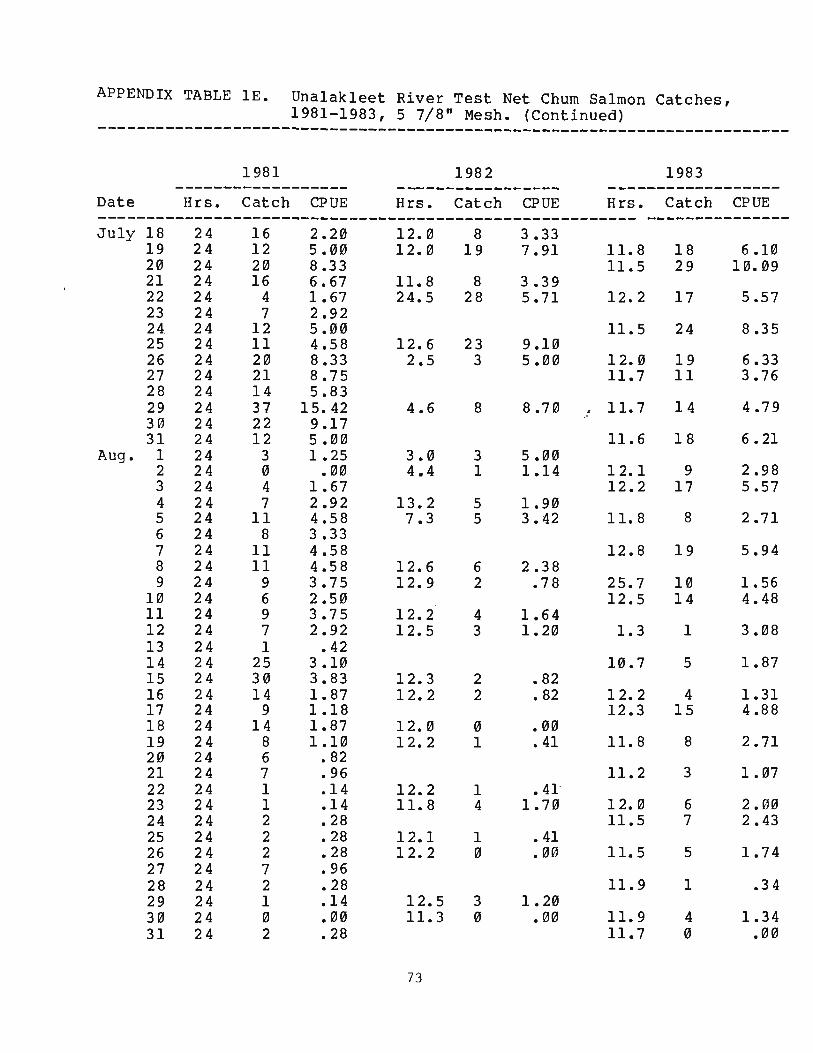
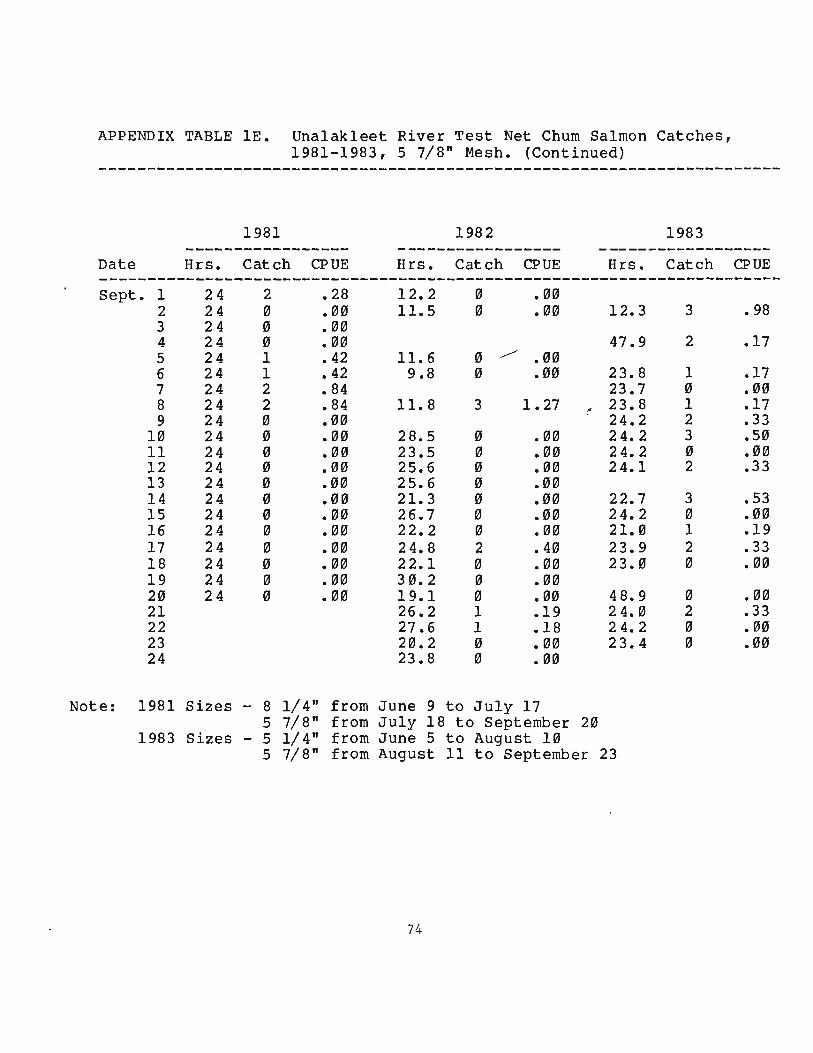
Appendix Table IE Unalakleet River Test Net Chum Salmon Catches 1981-1983 5 78 Mesh bullbullbullbullbullbullbullbull bull bullbullbullbullbullbullbullbullbullbullbullbullbullbull 72
-vshy
INTRODUCTION
The Unalakleet River empties into Norton Sound approximately 130 miles southeast of Nome is approximately 130 miles in length and drains an area of 1087 square miles The Unalakleet River flows from the Nulato hills westward to the town of Unalakleet on the Bering Sea coast Five major tributaries comprise the river all of which support spawning salmon
The town of Unalakleet is situated at the mouth of the Unalakleet River the most important salmon producing river in Norton ~ound Historically the people of the area have depended on the salmon runs for their liveli~ood first as food for themselves and their dogs and more recently as the basis of their cash economy
Attempts to assess salmon escapement to the system have been made annually by aerial stream surveys counting towers on the North River in 1973 and 1974 and on the Chirosky River during 1975 and 1976 Weather and water clarity have often limited these enumeration efforts but escapement estimates have ranged as high as 1477 king (1977) 28600 churn (1978) 491706 pink (1978) and 1184 coho salmon (1980) not including major tributaries
A salmon subsistence survey is conducted by the Commercial Fisheries Division each year in Unalakleet Results have indicated that sUbsistence catch averages have been increasing in recent years The recent five-year average 1978 to 1982 subsistence salmon catches were 922 king 4694 coho 13019 pink and 3840 chum salmon Coho and pink salmon catches have shown the greatest increases due largely to increased returns of these species
Commercial catches in the Unalakleet subdistrict have also increased due to increased effort better technology and the increased returns of coho and pink salmon The recent five-year average (1978-1982) commercial catch for the Unalakleet subdistrict is 5629 king 28427 coho 131016 pink and 43086 chum salmon In 1982 the average commercial fisherman received approximately $6000 from the sale of salmon
Because of the importance of the commercial and subsistence
-1shy
fisheries and the problems of estimating escapement in this subdistrict side-scanning sonar was installed in 1982 in the Unalakleet River in hopes of gaining a more accurate estimate of escapement and at the very least a more consistent index of salmon migration
A test fishing program was in operation in 1981 in the lower four miles of the Unalakleet River Indices from this study were instrumental in helping the area biologist set some commercial fishing periods In 1982 sonar counts proved useful as an index of the coho salmon escapement and were used by the area biologist in extending the coho fishery
A number of problems affecting sonar counts became more apparent during the 1983 season These problems brought on by low river velocity (13 to 17 fps) and tidal f1uctuationi included milling salmon and allocating counts to five different fish classifications
With increased harvest effort on the chinook population a limited sport fish survey was begun
This report presents the results of the Unalakleet sonar projects second year of operation and comparison of test fishing indices from 1981 to 1983
METHODS
Project Deployment
Supplies and equipment were on-site and camp construction was completed on May 28 Both north and south bank counters were in operation on June 4 Sonar counter operation ceased on September 4 91 days after counting was initiated By September 6 the sonar camp had been dismantled and the equipment stored for the winter
Test fishing began on May 27 and ended on September 23
Sonar
The Electrodynamics Division of the Bendix Corporation developed a side- scanning hydroacoustic counter during the 1970s capable of detecting and counting salmon migrating along the banks of tributary streams The side-scan sonar counter is designed to transmit a sonic beam along a 60 foot aluminum tube or substrate
-2shy
Echoes from fish passing through the beam are reflected to the transducer The systems electronics interpret the strength and number of the echoes and tally fish counts
Two Bendix side-scan counters 1981 models were used on the Unalakleet River The respective 60-foot tubular aluminum substrates were deployed from opposite banks of the Unalakleet River Both substrates were positioned so there was at least two feet of water over the sonar beam that is projected immediately above the substrate that is two feet over the transducer housing and seven feet over the target end of the substrate It was found that three feet of water was needed as a buffer to eliminate debris counts due to wind ripples flotsam and sudden water level changes A small weir _ was placed to prevent fish passage inshore from the transducer on both sides of the riverThe substrates were not located directly opposite each other The north bank substrate was located 400 feet upstream from the south bank substrate which was placed in a nearly ideal river bottom profile Unfortunately mud shallows were opposite the south bank During the season fish behavior necessitated movement of the north bank substrate to a site 300 feet downstream of the south bank substrate
The river width at this site is approximately 200 feet The deepest channel is located about 80 feet from shore at the north bank substrate and about 100 feet from shore at the south bank substrate Although one-third of the river is isonified by the sonar beams if fish follow a depth contour then more than two-thirds of the possible fish paths would be covered by the sonar counters
The substrates were moved several times during the summer because of water level changes or for cleaning The substrates were guyed to two dead men each in the form of buried logs held in place with fence posts Stainless steel aircraft cable fastened to each end of the substrate was attached to respective dead men on shore
The cables were roughly parallel and adjusted to hold the substrate perpendicular to shore The inshore cable was long enough to allow the substrate to remain perpendicular to shore even though it might be moved 15 feet from shore The easiest method of movement of the substrate was to use the hydrodynamic shape of the substrate to raise itself and push against the substrate with a handy man jack The inshore footing could then be relocated with a minimum of
-3shy
effort
Although the current at the sonar site was insufficient to raise the tube to the surface it did help in pulling it up to a point where it could be cleaned
Calibration (a comparison of oscilloscope fish counts and sonar fish counts) was scheduled four times daily on both banks The magnitude of the fish milling problem compounded by slow fish passage made this schedule impractical much of the summer Calibration was attempted when usable results seemed impossible it was not attempted at extreme rates of fish passage Calibration was done by comparing echoes on a Tektronix 221 oscilloscope with counts of the sonar counter Salmon passing through the sonar beam produce a distinctive oscilloscope trace A count of 100 fish within 30 minutes the maximum calibration period was required before resetting the sonar fish velocity controls
agreement = Sonar computer count Oscilloscope count
The agreement was then used to adjust the daily counts Agreement of less than 1 indicates the sonar was undercounting and greater than 1 indicates overcounting
When the count agreement varied more than 15 then the following equation was used to derive a new fish velocity
agreement x existing velocity = new velocity
Milling fish became a problem on June 28 on the north bank when slow migrating and milling pink salmon oscars started riding the substrate turbulence wave Based on counting tower observations it was determined that all sixteen sectors were affected On July 1 and 2 the substrate was moved approximately 700 feet downstream to the base of a small cliff with somewhat faster water velocity Pink salmon began riding the substrate at the new site within hours Oscars were not a problem on the south bank during this time therefore in order to estimate the passage on the north bank the average hourly passage rate (percent per hour of the daily total) of the preceding three day period of the south bank was used to calculate daily totals for the
-4shy
north bank based upon hours which were not apparently effected by oscars
Total of Preceding 3-day valid hourly sum of daily
Daily total--North = counts--north x counts--South Total of corresponding hourly counts for preceding 3 days--south
After two weeks of attempting to deal with milling fish the following policy was decided on The sonar beam was raised slightly so that a strong target was seen in the four degree mode but a decrease in target strength was barely apparent in the two degree mode The offshore end of the substrate was moved middotfive feet downstream from the perpendicular placement used earlier The beam was extended as far as possible beyond the target These measures seemed to eliminate fish avoidance of the substrate as a problem
Other milling problems were not satisfactorily resolved Salmon moving downstream were not counted by the sonar but those same fish moving upstream could be counted by the sonar It was decided to invalidate an hourly count if milling fish were observed from a tower or oscilloscope or if sonar criteria were not met Disqualifying sonar criteria were hourly debris checks or a large fish count over 15 The large fish count indicated fish moving over the substrate in a tight school which was characteristic of milling behavior King salmon in the Unalakleet did not seem to reflect a long enough signal to register as large fish however two or three small salmon could register if they were close to the same distance from the transducer and spaced in an overlapping manner
Records of changes in counter settings river conditions and other unusual occurrences were also used in adjusting daily sonar counts
The large fish counter on the 1981 model sonar counter was ignored except as an index of milling fish
Test Fishing
The same test fishing site as in 1981 and 1982 was used during the 1983 season
-5shy
The ten fathom 8 14 gillnet was set from May 27 to May 31 A twenty fathom 8 14 gillnet was set on June 1 and fished until June 4 From June 5 to September 4 the period of sonar operation a rotating schedule of twelve hour time blocks over a period of three days was used The nets used included
1 20 fm 8 14 mesh 2 25 fm 5 14 mesh (June 5-August l025 fm 5 78
mesh (August II-September 4) 3 25 fm 4 mesh 4 15 fm variable mesh
The 25 fm 5 78 mesh gillnet was fished from September 5 to September 25 The 8 14 mesh net and the v~riable mesh net were fished concurrently The three-day rotation schedule allowed each net to be fished during one 12-hour high tidedaylight period and one 12-hour low tidenight period Nets were rotated at 0900 and 2HJ0 daily The 8 14 mesh net was removed from the rotation on July 21 because the chinook migration was completed
The CPUE (catch100 fm-hr) was calculated for the two most efficient nets for each species to be used in apportioning sonar counts These CPUEs for chinook coho pink chum and other species presumably detectable by sonar were totaled and the species CPUE divided by the total CPUE for all species to give the percent of the periods sonar counts to each specie The seventh day of the week was apportioned by using the previous 3-day proportions for one half of the counts and the following 3-day proportions for the second half of the counts
Test net data (Tables 5A 5B 5C and 5D) was calculated for the single most effective net for each species for separate analys is
Weights lengths and scale samples were taken from all chinook coho and chum captured Pink salmon were counted only Tissue samples were taken from test net chinook salmon for electrophoretic studies coordinated by the Stock Separation Section of the Commercial Fisheries Division
Counting Towers
Counting towers were erected immediately adjacent to the
-6shy
onshore end of each substrate (Figure 2) As in 1982 the use of visual tower counts for comparison with sonar counts could not be relied upon due to river width surface disturbances etc however several short comparisons were possible The towers proved invaluable in determining the presence of moribund fish debris passage presence of oscars fish swimming behavior etc The 1983 low river level and generally less turbidity as compared to 1982 allowed more rapid and concrete identification of the milling fish Without use of the tower the severity of the milling fish problem may not have been discovered
Drift SetsBeach Seines
Drift sets and beach seines were done for comparison with test net species apportionment and to determine fish passage beyond the sonar counting range Drjft sets were accomplished by drifting a 25 fm 5 14 gillnet perpendicular to the shore The 25 fm net allowed the major portion of the river to be fished thus only one drift was done per set as opposed to 1982 when a drift set was done near each bank Set durations ranged from 5 to 17 minutes dependent upon boat traffic wind conditions etc Drift sets were done on July 19 23 and 27 and August 3 22 23 26 and 31
Beach seines were accomplished by using a 25 fm 3 mesh seine immediately downstream of the south bank substrate Shoreline conditions prevented se1n1ng near either north bank site Beach seines on the south bank were done on July 20 25 and 28 and August 1 and 29 Beach Unalakleet River were done on August 4 and levels prevented seining from August 4 to
seines 24
24
at High
mile 12 water
Riyer Surveys
Two river surveys were attempted during 1983 A jet boat was taken up the North River on July 29 This proved to be early for carcass sampling but weather and equipment problems prevented a later survey
A float trip of the Old Woman and upper Main River was also made A plane landing mishap greatly reduced the scope of this trip Weather prevented any follow up work
Subsistence Surveys
A daily survey of three to five sUbsistence fishermen is
-7shy
made from the time the first king salman is caught early in June through the remainder of that month These people must be trustworthy conscientious about checking their nets and fairly successful The average daily catch is compared to the previous day to develope the annual trend and the total catches and the annual trend is compared to past years Commercial catch and effort data and the up-river test net data are used in conjuction with the subsistence catch to anticipate strategies
future catches and management
During late September made of Unalakleet
an The
extensive door to door survey is Annual Management Report covers
subsistence surveys in detail
RESULTS
~istence Survey
The Unalakleet subsistence survey made in late September interviewed 74 subsistence fishermen 68 of whom fished in the river and 17 who fished in the ocean The catch was predominantly from the river with 1480 king 6311 coho 13458 pink and 4124 chum salmon reported The ocean subsistence catch was 388 king 577 coho 350 pink and 277 chum salmon
The mean chinook salmon catch per fisherman peaked on June 16 This compares with July 3 in 1982 and June 19-22 in 1981 All subsistence fishermen surveyed in 1983 were fishing within one mile of the river mouth
Chinook subsistence survey results are presented in Table 1 and Figure 3 As in 1981 and 1982 the variances in nets fishing times and net locations call for calculation of mean catch per fisherman as opposed to catch per unit effort
Sonar
During the period from June 4 to September 4 the final sonar count was 322494 148465 (460) counts were tallied on the south bank and 174029 (540) counts were tallied on the north bank
The daily sonar counts (Table 2) were adjusted by the test net proportions (Table 4) to give the following escapement estimates for the period June to September 4
-8shy
Species Total Count LQf Total
Chinook 2790 09 Coho 17013 53 Pink 91881 285 Chum 58273 181 Other 152537 AL2
322494 1000
Tables 3A 3B 3C 3D and 4D present this data by 3-day sample period Based on discussions with Al Menin and Dave Gaudet about the ability of sonar counters to discriminate between various target shapes and sizes any fish two and one half pounds or laterally compressed fish ~f one pound or larger could be counted by a sonar calibrated for pink salmon Fish other than salmon considered countable by the sonar counter included arctic char grayling burbot and broad humpback and Alaska whitefish
Peak adjusted apportioned sonar counts were on June 23 for chinook August 21 for coho July 18 for pink and July 25 for chum salmon (Tables 3A 3B 3C and 3D Figures 4A 4B 4C and 4D)
Representative passage rates on the south bank by sector and by hour for July 3-5 and August 21-23 are presented in Figures 6 and 7 These periods were chosen because of minimal adjustments to raw counts north bank counts are not presented due to lack of relatively clean data for those periods
Test Fishing
A total of 19 chinook (74 male - 26 female) 294 coho (61 male 39 female) 1156 pink (52 male - 48 female) and 915 chum (54 male - 46 female) was captured from May 27 to September 23 The fish were sampled and delivered to Hartha Nanouk a local subsistence fisherman as per agreement for the use of her traditional set-net site
Based on the single most effective test net CPUE the chinook migration did not peak as such but rather showed most consistent catches on June 22 and 23 coho migration peaked from August 10-14 pinks from July 18-22 and chum on July 13
-9shy
Comparisons of daily CPUE and cumulative CPUE for all salmon species are presented in Tables SA 58 5C and 5D and Figures 8 thru 15 Of interest although not as useful for annual comparison due to different test net methods net mesh sizes fishing time etc the actual fish caught from 1981 to 1983 are
~ 1982 un 41 chinook 39 chinook 39 chinook
107 coho 310 coho 294 coho 1463 pink 5114 pink 1156 pink
722 chum 375 chum 915 chum
f
Age Sex and Size Composition of Test Net Catches
An age analysis of scales collected during the project indicated the following age compositions king salmon all gear sizes (4-2131 5-2 22~ 5-3816-23217-2 3) coho salmon 5 14 and 5 78 gear (3-2 051 4-3 981 4-4 051 5-4 l) chum salmon 5 14 and 5 78 gear (3-1 21 4-1 611 5-1 37) Tables 7 thru 9D show the age composition of the various species broken down by date and the mesh sizes used during the project
Counting Towers
As cited visual tower counts could not be made on the Unalakleet River due to river width surface disturbances turbidity etc However visual observations proved invaluable in identifying spawning behavior etc and resulted in the downstream relocation of the north bank substrate and development of the method used to adjust north bank sonar counts
Drift SetsBeach Seines
Tables 6A and 68 present the results of drift sets and beach seines respectively Drift set results indicate that the portion of the river not isonified was not used by migrating salmon ie the species most countable coho pink and chum salmon would seem to follow the banks and were counted by the side-scan sonar
Beach seines proved useful in verifying the high presence of
-10shy
species other than salmon the relative abundance of coho salmon in August and the presence of spawning churn salmon in the south bank substrate area
Riyer SurveysAerial SurVeys
On July 29th 32 miles of the North River were surveyed by a two-person crew for the purpose of counting live chinook and sampling chinook carcasses A total of 166 live chinook were counted and 3 chinook carcasses were sampled with approximately half of the chinook counted between mile 25 and mile 32
Originally the Old Woman River survey was to be a six-day trip Due to the damage the plane suffered dropping the first crew member off the second member and support gear was not av~ilable for the survey as planned~ The survey of the Old Woman River August 6-8 counted 60 king salmon but only four samples were collected Weather prevented the survey of the main river
King Salmon Spo rt Fish Survey
A sport fishing lodge on the Unalakleet River is responsible for the majority of the sport fishing effort Periodic surveying of lodge personnel indicates that a fair quantity of king salmon are harvested by sport fishing A quantitative survey was not done however due to limited time available A total of 43 chinook was sampled from sport fishing catches
DISCUSSION
River levels were lower than normal during the spring of 1983 due to the lack of snow accumulation the previous winter The Unalakleet River cleared early and became quite low during late June and early July The low water allowed the counting towers at the sonar site to be used during calm survey days which wasnt possible during 1982
Tower observations made as early as June 28 showed serious milling problems at the north bank sonar site The sonar was moved to a new site on July 2 Milling fish were still a considerable problem at the new site but about half the hourly count were considered acceptable during mid-July Milling salmon were a problem through most of the field season Milling salmon of all four species were observed
-11shy
during the latter half of each respective migration Pink salmon presented the worst problem and churn the least Unfortunately milling pinks invalidated the churn count since the two runs overlap Coho salmon exhibited some milling but an accurate evaluation of this problem was hampered by turbid water Milling coho became a problem after August 20
The milling observed from the towers was not apparent to the observer at the oscilloscope because of the overwhelming number of spikes present at that stage of the salmon migration During 1982 when tower observations were not possible the oscilloscope appeared to have an extraordinary number of spikes The large pink salmon count recorded in 1982 may have been an artifact of milling behavior that was unobservable then Commercial catch and test net catch statistics indicate a large pink salmon run f However it is likely fish milling over the substrate exaggerated the sonar count although without tower observations it can not be proven
Another problem observed during the 1983 field season was avoidance of the substrate by all fish species This problem was at its worst when water was low and clear Angling the substrate slightly downstream as it was after July 15 helped considerably By extending the sonar beam periodically it was determined that as visibility decreased so did avoidance
Species apportionment of the sonar count was done using test net catches Some of the problems encountered with the sampling scheme should be pointed out Test nets were assumed to sample the same portion of the river as the sonar Since three net lengths were used this seemed suspect Different species migrate at different depths The non-salmon species tend to migrate in shallow water near shore and generally the larger species migrate in deeper water nearer mid-stream Since only a IS-fathom net of the most efficient type for non-salmon species was fished in the preferred habitat for these fish it is likely that the calculated efficiency was too high The other test nets were longer and also sampled some preferred areas for the targeted species
The opposite case is true for king salmon The 8 14 net is 20 fathoms longS fathoms shorter than the other nets used on this project This net does not cover all of the area preferred by king salmon This means king salmon
-12shy
escapement is probably underestimated but the 20 fathom net samples an area further out than the sonar counter even with its beam extended So the number of king salmon counted by the sonar is over estimated King salmon make up such a small percentage of the total salmon run that counting errors are more significant than this apportionment error
Very few churn and pink salmon were caught in the offshore end of the nets It is assumed these long nets had very little effect on the sonar count species apportionment
CONCLUSION
The feasibility of counting salmon in the Unalakleet River using side-scanning sonar is unlikely due to milling fish and the inal1ility to accurately apportion the sonar count to the various fish species It is possible that a partial escapement count could be made further up river above one or more of the major tributaries to the system The new north bank sonar site that showed some improvement over the former site had two differences that seemed to affect salmon migration The current was faster over the substrate at the second site and the river gravels were less ideal spawning habitat The new site was located below a rock bluff on the outside of a river bend
There are two similar sites up river about ten miles where the current is faster and the bottom is even less conducive to spawning During the 1984 field season a comparison of the smoother running south bank site and these up-river sites could be made The best time to do this would be during August when only coho salmon are migrating The counter should be operating by August 15 prior to milling activity and maintained for a week to evaluate if milling salmon became apparent later after the migration peaked The south bank site could be used as a control for comparison to 1983
-13shy
I I
5 1 2
Miles No tt h _
shy
R Iv er
Figure 1 Unalakleet Escapement Project
lt
Son sr
Fig u r e 2 S 0 0 a r Sit eSc hem a tic
ITower
Original Ninth Bank Sonar
Drift sets 5 minutes
Lf)
So t h Ban k Son a
lTower
o Work Tent
B Living Quarters
Figure 3Unalakleet Subsistence Survey 1983
Kin g- S a I m 0 n
1bull
10
9
c 8aI
-lE 11 t a til 7 ~ II 6 ~ U
5 til
0
c 4 til til
E 3 I
1 V
~ 2
1
27 1 5 10 15 20 25 30
~ June
Figure 4A Specie apportionment king salmon Un-alakleet sonar 1983
~
25
-l20
c 1 5 III () III
11
10
5
I
J
27 31 5 10 15 20 25 30 5 10 15 20 25 31
June Ju Iy
Figure 4B Specie middotapp~~tionment coho salmon Unalakleet sonar 1983
30
25
co ~
20
1 t~
C $
u 1 5 CD a
10
5
5 10 15 20 25 31 5 10 15 20 25 31 5
Ju August Sept e
Figure 4C Specie apportionment pink salmon Unalakleet sonar 1983
1 6
1 5
14
1 3
12
1 1
c II U CII
Ashy
10
9
a
7
01 ~
6
5
4
3
2
1
1 5 10 1 5
June
2 O 25 30 5 10 15 20
Ju Iy
25 31 5 10 15 20
August
25 31 5 10
Septem
Figure 40 Species apportionment chum salmon Unalakleet sonar 1983
16
1 5
1 4
13
1 2
1 1
10
9 c 8GI U
GI middot7 A
6
5
4
3
2
1
~
o N
~
1 5 10 15 20 25 30 5 10 15 20 25 3 1 5 10 15 20 25 31 5 10
June Ju Iy August Sept e
Figure 5 Specie apportionment Unalakleet sonar 1983
50
4
40
35
c J 30 0 U
~ 0 25 0 c Q)
u ~
Q) 20a
15
10
5
o L-_lt---__
King Coho Pink Chum Misc
21
----
Figure 6 Sector distribution of counts Unalakleet sonar1983
35
30
25
c 20 G)
() G) 15
0
10
5
35
30
25 c G)
() 20
G)
0 15
10
5
( s ()u t h ban k )
July 3-5
~-2 4 6 8 1 0 1 2 1 4 1 6shy
Sector
August 21-23
2 4 6 8 10 12 14 16
Sector
22
Figure 7 Hourly distribution of counts Unalakleet sonar 1983
(south bank)
14
12
10
c 8 GI U ~
6
July 3-5
~GI
I =~ Q
4
2 0
2 4 6 8 10 12 14 1 6 18 20 22 24
TIme
9
8
7
6
5 c GI U ~ 4 GI
Q
3
2
August 21-23
1
0
2 4 6 8 10 12 14
TIme
16
23
18 20 22 24
Figure 8 Unalakleet River Test Fishing Daily King CPUE in 8 14 mesh 1983
10
9 N
8 shy
7 I 0 c 6E
n
l J I I
0 0 5 c (J 4 co 0
3
2
1
I I
27 1 5 10 15 20 25 1 5 10 15 20 25 31
~ June July
Figure 9 Unalakleet River Test Fishing Cumulative King CPUE in 8 14 mesh 1983bull
~
middot10
09 U N
I 08 0 c 07E I ()
- 06 E-0 0 05 shy~ () 04 ca - ()
03E I 0 02
01
27 1 5 10 15 2Q 25 1 5 10 15 20 25 31
June July
Figure 10 Unalakleet River Test Fishing Daily Coho CPUE in 5 78 mesh 1983
1
6
5
I 0
NI II I 0 t
E 4
0 0 c 3() cu 0
2
1
1 5 10 15 20 25 1 5 10 15 20 25 1 5 10 15 20
July August Sept U
Figure 11 Unalakleet River Test Fishing Cumulative Coho CPUE in 5 78 mesh 1983
200
175
150
I 0 c 125E I ()
E
r-shy-0 I I N 0 100 c ()-as ()
75E I 0
50
25
1 5 10 15 20 25 1 5 10 15 20 25 1 5 10 15 20
July August Sel ber
20
Figure 12 Unalakleet River Test Fishing Daily Pink CPUE in 4 mesh 1983
18
I
0) N
II
16
I ishy
14 J 0 t 12shyE 0 10 0 shys 8 () as
0 6 1 I V 4
2
~ I
1 5 10 15 2Q 25 30 5 10 15 20 25 31 5 10 15 20 25 31 5
June July August Sept
--
Figure 13 Unalakleet River Test Fishing Cumulat ive Pink CPUE in 4 mesh 1983
10
9 01 N 8
J 0 J 7 E J 0 6 E- 50 ~
amp 4() ca
0 3 E J
0 2
1
1 5 10 15 20 25 30 5 10 15 20 25 31 5 10 15 20 25 31 5
June July August Sept
Figure 14 Unalakleet River Test Fishing Daily CPUE in 5 14 amp 5 78 mesh 1983
14
13shy
12
11
10
9 J 0 8
I z shy-E 7 0 0 shys ~u aI 0
4 I
31
2
1
II
0 C1)I 11
I I I II
bull y AA(net changed to 5 78
AA A 11 I
~ I~ V ~
- I
VI
1 5 10 15 20- 25 30 5 10 15 20 25 31 5 10 15 20 25 31 5 10 15 20
cJune July August
Figure 15 Unalakleet River Test Fishing Cumulative Chum CPUE in 5 14 amp 5 78 mesh 1983
It
5
--l C)
net changed to 5 78
~ 4 o
c E (J ~
3E o o c 2 u ~ -(J
E ~ (J 1
1 5 10 15 2Q 25 30 5 10 15 20 25 31 5 10 15 20 25 31 5 10 15 20
June July August s
Figure 16 Unalakleet River Test Fishing Catch Proportions 1983
60
55
---- King50
__ Coho 45
P--Q Pink
40 __ Chum
I LU 35J D I 0
30 ICQ 0 25 I
N Cl0 20
c G)
15u G)
D
10
5 A 1 I
I 4 I
I I
3 lt
~
2
I I1 - I bull I
I ~ ~ ~ t -J ~~ - _
r
1 5 10 15 20 25 30 5 10 15 20 25 31 5 10 15 20 25 31 5 10
June July August Sept
Figure 17 Unalakleet Area Temperatures 1983
18
16
14
12
til 10I
u-G) 80 CI) G) G) 6 C) G)
Q 4
2
C) C)
__ Air
0--0 River 2
0
-2
-4
---------~ ~
27 31 5 10 15 20 25 30 5 10 15 20 25 31 5 10 15 20 25 31 5 10 15 20
June July August 5e
4
Figure 18 Unalakleet River Turbidity and Depth 1983
__ Secchi Reading
-t ()
II) G)-G)
3
iE 2
1
27 31 5 10 15 20 25 30 5 10 15 20 25 31 5 10 15 20 25 31 5 10 15 20
June July August
~ 1 _ ~ r--- I shy I __ I 01 --shy
Figure 19 Unalakleet River Test Fishing Cumulative King CPUE in 8 14 mesh 1981-83
27 31 5
May
_1981
____ 1982
o 0 1983 11) C)
Changed to 5 78 mesh
I
t
~-~o-~ Q-O--Oolt)-(IQ-----l
--1
_10 15 20 25 30 5 10 15 20 25 31
June July
I I I
~
0 ~
r E ~
CJ shyE 0 0 I
shyr u-cu CJ
E ~
CJ
4
35
30
25
20
15
10
05
Figure 20 Unalakleet River Test Fishing Cumulative Chum CPUE in 5 78 mesh 1981-83
5
4 lI 0
z
E lI 0 3 E-0 0 2 r CJ-cu 0
E lI 1 0
__1981 ~~
~ ___1982
a 01983 5 148 mesh from 65-810
_----shy-- 0 - -- C1) A - _ - ~
~ I
I
II I I I I I
I I
1
~ -
-
1 5 10 15 20 25 30 5 10 15 20 25 31 5 10 15 20 25 31 5 10 15 20
June July August s
Figure 21 Unalakleet River Test Fishing Cumulative Pink CPUE in 4 mesh- 1981-83
8
70
60
50
40 0
r 30E
0 20E-0 0 10 s= u 8 tV 0 6E 0 4
2
__1981 ____ 1982
_1983
shy--- -- shy--- shy J - -
I
I
C1- J
I
-----l---l ~--~r---------------r--
1 5 10 15 20 25 30 5 10 15 20 25 31 5 10 15 20 25 31 5 10
June July August Sept
Figure 22 Unalakleet River Test Fishing Cumulative Coho CPUE in 5 78 mesh 1981-83
_1981
~ __ 1982
~1983
25
00I _ __ _ _ C)~ I __ _ I
I V o 20 rt I I
E I AshyI o E 15-o o z u 10 tU o E I o 5
I
1 5 10 15 20 25 31 5 10 15 20 25 31 5 10 15 20
July August 5
----------------------------------------------------------------
Table 1 Unalakleet River Subsistence King Salmon Index 1983
Number of Number of Date Fishermen Chinook Average
08 02 18 05 05 00 02 58 92 62 72 72 42 28 52 60 62 20 47 50 35 25 15
June 8 9
10 11 12 13 14 15 16 17 18 19 20 21 22 23 24 25 26 27 28 29 30
Totals
4 4 4 4 4 4 4 4 4 4 4 4 4 4 4 4 4 3 3 3 4 4 4
4
3 1 7 2 2 o 1
23 37 25 29 29 17 11 21 24 25
6 14 15 14 H~
6
322
~
39
---------------------- ---------- --------------------------------------
----------------------------------------------------------------------
TABLE 2 Unalakleet River Final Sonar Counts 1983
Daily Proportion Cumu1 Prop Date South North Total of Total Cumulative of Total
64 7 23 30 1313131 313 013131 65 44 187 231 00137 261 01308 66 12 162 174 01305 435 01313 67 8 283 291 1313139 726 01322 68 0000 726 13022 69 3 221 224 013137 950 13029 610 26 245 271 131308 1221 13037 611 56 254 310 131310 1531 131347 612 44 736 780 013 24 2311 13071 613 64 1188 1252 01339 3563 01113 614 59 1752 1811 0056 5374 0166 615 97 844 941 01329 6315 0195 616 165 729 894 0028 7209 0223 617 151 i 604 1755 0054 8964 middot 0277 618 i ll 1524 1635 0051 10599 13328 619 175 2000 2175 0067 12774 13395 620 171 21320 2191 0068 14965 0463 621 220 1613 1833 0057 16798 0520 622 199 2065 2264 0070 19062 0590 623 362 21334 2396 0074 21458 13664 624 876 3403 4279 13133 25737 0797 625 1244 2023 3267- 0101 29004 0898 626 738 1601 2339 0073 31343 0971 627 573 3265 3838 0119 35181 1090 628 547 1868 2415 0075 37596 1165 629 528 4028 4556 0141 42152 1306 630 430 430 0013 42582 1319 71 240 240 01307 42822 1326 72 201 975 1176 0036 43998 1362 73 309 8842 9151 0284 53149 1646 74 475 6385 6860 0213 60009 1859 75 565 3342 3907 0121 63916 1980 76 1377 2094 3471 0108 67387 2088 77 1416 3173 4589 0142 71976 2230 78 1472 1420 2892 0090 74868 2320 79 2071 1452 3523 01113 78391 2430 710 3318 2434 5752 0178 84143 2608 711 2673 2866 5539 13172 89682 2780 712 1665 1747 3412 13106 93094 2886 713 21317 1951 3968 13123 97062 3009 714 2991 2664 5655 0175 102717 3184 715 2646 2548 5194 13161 107911 3345 716 2488 2886 5374 0167 113285 3512 717 1585 4063 5648 0175 118933 3687 718 3559 9326 12885 0400 131818 4087 719 2948 2398 5346 13166 137164 4253 720 1640 3330 4970 0154 142134 4407 721 2416 6420 8836 0274 150970 4681 722 3298 3298 0102 154268 4783 723 5007 5007 0155 159275 4938
40
--------------------------------------------------------------------
--------------------------------------------------------------------
-----------------------------
TABLE 2 Unalakleet River Final Sonar Counts 1983 (Continued)
Daily Proportion Cum Prop Date South North Total of Total Cumu1at i ve of Total
724 4005 7804 11809 0366 171084 5304 725 2453 3392 5845 0181 176929 5485 726 2166 12094 14260 0442 191189 5927 727 1914 4472 6386 0198 197575 6125 728 1603 3463 5066 0157 202641 6282 729 1251 1914 3165 0098 205806 6380 730 1710 2495 4205 en30 210011 6510 731 2542 1887 4429 0137 214440 6647 81 4479 2271 6750 0209 221190 6856 82 1103 1806 2909 0091 224099 6947 83 1719 942 2661 0083 226760 bull 7030 84 1519 2557 4076 0126 230836 7156 85 1259 1113 2372 0074 233208 7230 86 940 2189 3129 0097 236337 7327 87 1467 4354 5821 0180 242158 7507 88 2318 1584 3902 0121 246060 7628 89 2098 1505 3603 0112 249663 7740 810 2629 1517 4146 bull 0129 253809 7869 811 3753 1091 4844 0150 258653 8019 812 1489 523 2012 0062 260665 8081 813 744 353 1097 0034 261762 8386 814 981 981 bull 0030 262743 8145 815 2324 2324 0072 265067 8217 816 2638 2638 0082 267705 8299 817 2073 731 2804 0087 270509 8115 818 2244 675 2919 0091 273428 8477 819 3240 696 3936 0122 277364 8599 820 2363 503 2866 0089 280230 8688 821 6789 1111 7900 0245 288130 8933 822 6489 563 7052 0219 295182 9152 823 5077 298 5375 0167 300557 9319 824 2616 298 2914 0090 303471 9409 825 3933 412 4345 0135 307816 9544 826 1393 554 1947 0060 309763 9604 827 1203 463 1666 0052 311429 9656 828 1197 542 1739 0054 313168 9710 829 1244 221 1465 0045 314633 9755 830 1011 199 1210 0038 315843 9793 831 718 214 932 0029 316775 9822 91 1324 318 1642 0052 318417 9874 92 1362 307 1669 0052 320086 9926 93 1146 314 1460 0045 321546 9971 94 652 296 948 bull 0029 322494 10000
148465 174029 322494 10000
41
----------------------------------------------------------------------
-------------------------------------------------------------------- --
------
TABLE 3A Unalakleet River Species Apportionment by Test Period King Salmon 1983
3-Day App Proportion of Cumulative Cumulative Dates Count Season Total Count Proportion
64-68 76 0272 76 0272
69-612N 28 0100 104 0372
612N-615 461 1652 565 2024
616-619N 419 1502 984 3526
619N-622 170 0609 1154 4135
623-626N 722 2588 1876 6723
626N-629 264 0946 2140 7669
630-73N 103 0639 2243 8038
73N-76 188 0674 2431 8712
77-710N 0 0000 2431 8712
710N-713 0 0000 2431 8712
714-717N 267 0957 2698 9969
717N-720 0 0000 2698 9669
721-724N 92 0331 2790 1 0000
724N-727 0 0000 2790 10000
728-731N 0 0000 2790 1 0000
731N-83 0 0000 2790 1 0000
2790 10000
42
Dates
714-717N
717N-720
721-724N
724N-727
728-731N
731N-83
84-87N
87N-810
811-814N
814N-817
818-821N
821N-824
825-828N
828N-831
91-94
TABLE 3B Unalakleet River Species Apportionment by Test Period Coho Salmon
3-Day Count
583
338
436
550
2650
1174
793
1435
5074
1280
435
2265
171H3
1983
Proportion of Season Total
0000
0000
0000
0343
0199
0256
0323
1558
0690
0466
0843
2983
0752
0256
1331
Cumulative Count
583
921
1357
1907
4557
5731
6524
7959
13033
14313
14748
17013
Cumulative Proportion
0000
0000
0000
0343
0542
0798
1121
2679
3369
3835
4678
7661
8413
8669
10000
43
------------------------------------------------------------------
------------------------------------------------------------------
----- ------
TABLE 3C Unalakleet River Species Apportionment by Test Period Pink Salmon 1983
3-Day P roport ion of Cumulative Cumulative Dates Count Season Total Count Proportion
64-68 0 0000
69-612N 0 0000
6l2N-615 0 0000
616-6l9N 97 0012
6l9N-622 332 0036
623-626N 1245 0136
626N-629 6624 0721
630-73N 3699 0403
73N-76 10762 1171
77-7l0N 7704 0838
710N-7l3 8529 0928
714-717N 9771 1063
717N-720 13845 1507
721-724N 11361 1236
724N-727 6544 0712
728-731N 3545 0386
731N-83 1628 0177
84-87N 1224 0133
87N-810 1777 0193
811-814N 802 0087
814N-817 561 0061
818-821N 533 0058
821N-824 8313 13091
825-828N 468 0051
828N-831 0 0000
91-94 0 0000
91881 10000
0 0000
0 0000
0 0000
97 0012
429 0048
1674 0184
8298 0905
11997 1308
22759 2479
30463 3317
38992 4245
48763 5308
62608 6815
73969 8051
80513 8763
84058 9149
85686 9326
86910 9459
88687 9652
89489 9739
90050 9800
90583 9858
91413 9949
91881 10000
91881 10000
91881 1 0000 44
------------------------------------------------------------------
------------ ------------------------------------------------------
----- ------
TABLE 3D Unalakleet River Species Apportionment by Test Period Chum Salmon 1983
3-Day Proportion of Cumulative Cumulative Dates Count Season Total Count Proportion
64-68 0 0000
69-612N 100 0017
612N-615 268 0046
616-619N 838 0144
619N-622 1180 0202
623-626N 2744 0471
626N-629 1569 0270
630-73N 796 0137
73N-76 2972 0510
77-710N 2068 0355
710N-713 2622 0450
714-717N 4133 0710
717N-720 5596 0960
721-724N 4978 0854
724N-727 8974 1540
728-731N 2241 0385
731N-83 2079 ~0357
84-87N 3009 0516
87N-810 2432 0417
811-814N 937 0161
814N-817 454 0078
818-821N 2584 0443
821N-824 2739 0470
825-828N 1783 0306
828N-831 765 0131
91-94 412 0070
58273 10000 45
0 0000
100 0017
368 0063
1206 0207
2386 0409
5130 0880
6699 1150
7495 1287 f
10467 1797
12535 2152
15157 2602
19290 3312
24886 4272
29864 5216
38838 6666
41079 7051
43158 7408
46167 7924
48559 8341
49536 8502
49990 8580
52574 9023
55313 9493
57096 9799
57861 9930
58273 1 0000
-------------------------------------------------------------
------------------------- ------------------------------------
TABLE 4 Unalakleet River Test Net Proportions by Sample Perio-d 1983 ( Selective CPUE)
Dates Chinook Coho Pink Chum Misc
64-68 105 00 00 895
69-612N 24 00 83 893
612N-615 1C~ 5 00 61 834
616-619N 78 18 156 748
619N-622 23 45 160 772
623-626N 65 112 247 576
626N-629 22 553 131 294
630-73N 16 576 124 284
73N-76 10 572 158 260
77-710N 00 555 149 296
710N-713 00 540 166 294
714-717N 14 00 513 217 256
717N-720 00 00 532 215 253
721-724N 04 00 493 216 287
724N-727 00 18 202 277 503
728-731N 00 23 242 153 582
731N-83 00 30 112 143 715
84-87N 44 98 241 617
87N-810 182 122 167 529
811-814N 139 95 111 655
814N-B17 96 68 55 7B1
B18-B21N 105 39 1B9 667
821N-824 263 43 142 552
825-B28N 145 53 202 600
828N-831 97 00 171 732
91-94 396 00 72 532
46
--------
--------
TABLE 4 Una1ak1et River Test Net Proportions 1983 ( Selective CPUE) (Continued)
Comparative Apportionment
Species Apportionment
Chinook 2790 Coho 17013 Pink 91881 Churn 58273
------shySubtotal 169957
Misc Species 152537 ------shy
Total 322494
Substrate Comparison -------------------shy
Bank Counts -----shy
South 148465 North 174029
------shy
Total 322494
Percent of Total Counts
09 53
285 181
5408
472
1000
Percent
460 540
1000
47
-------------------------------------------------------------------
TABLE 5A Unalakleet River Test Net Data King Salmon in 8 14 Mesh 1983
Cum Cum Cum Date Hours Catch CPUE Hours Catch CPUE
May 27 28
21 5 482
13 13
1313
1313 21 5 697
13 13
1313
1313 30 240 0 013 937 0 00 31 246 2 41 1183 2 08
June 1 237 0 00 1420 2 07 2 3
256 585
13 13
013 bull 13 13
1676 2 261
2 2
6bull 13 4
5 6 8
160 120 middot 125
13 1
13 42 130
2 421 2541 2666
~ 2 3 3
bull 13 4 136 136
9 122 0 130 2788 3 05 11 117 00 2905 3 05 12 126 13 00 3031 3 05 13 117 1 43 3148 4 06 15 118 0 013 3266 4 136 16 116 1 43 3382 5 138 18 240 13 130 3622 5 07 19 121 0 00 3743 5 07 20 116 0 00 3859 5 136 22 118 1 42 3977 6 138 23 119 1 42 4196 7 08 25 240 0 013 4336 7 138 26 119 13 1313 4455 7 138 27 119 13 1313 4574 7 138 29 1213 13 130 4694 7 137 313 1213 13 00 4814 7 07
July 2 238 0 1313 51352 7 07 3 118 13 013 51713 7 07 4 118 1 42 5288 8 138 6 122 0 00 5410 8 07 7 116 13 00 5526 8 07
10 126 0 1313 5652 8 07 11 119 0 013 5771 8 07 13 116 13 130 5887 8 07 14 119 2 84 6006 10 07 17 122 0 00 6128 10 07 18 112 0 1313 6240 10 136 20 119 13 00 6359 10 06 21 112 0 013 6471 10 06
6471 10
48
------------------------------------------------------------------
------------------------------------------------------------------
TABLE 5B Unalakleet River Test Net Data Coho Salmon in 5 78 Mesh 1983
Cum Cum Date Hours Catch CPUE Hours Catch CPUE
July 24 26
115 120 0 00
115 235
0 0
00
00 27 117 4 00 352 0 00 29 117 0 137 469 4 34 31 116 3 103 585 7 48
August 2 122 0 00 706 7 40 3 122 2 66 828 9 43 5 118 1 34 946 10 42 7 128 14 437 1074 24 89 9 257 14 218 1331 38 114
10 125 21 672 1456 59 162 12 13 middot- 0 00 1469 x 59 161 14 10 7 12 449 1576 71 180 16 122 2 66 1698 73 172 17 123 6 196 1821 79 174 19 118 1 34 1939 80 165 21 112 6 214 2051 86 168 23 120 3 100 217 1 89 164 24 115 2 70 2286 91 159 26 115 5 174 2401 96 160 28 119 0 00 2520 96 152 30 119 4 1 34 2639 100 152 31 117 1 34 2756 101 147
Sept 2 123 5 33 2879 106 147 4 479 15 125 3358 121 144 6 238 11 185 3596 132 147 7 237 5 84 3833 137 143 8 238 6 1 01 4071 143 141 9 242 10 1 65 4313 153 142
10 242 3 50 4555 156 137 11 242 2 33 4797 158 132 12 241 8 133 5038 166 132 14 227 14 247 5265 180 137 15 242 9 149 5507 189 137 16 210 3 57 5717 192 134 17 239 2 33 5956 194 130 18 230 2 35 6186 196 127 20 489 4 33 6675 200 120 21 24 3 50 6915 203 117 22 242 0 00 7157 203 113 23 234 1 17 7391 204 110
----shy
7391 204
Mesh size = 5 14 from 724 to 810
49
------------------------------------------------------------------
TABLE 5C Unalakleet River Test Net Data Pink Salmon in 4 Mesh 1983
Cum Cum Cum Date Hours Catch CPUE Hours Catch CPUE ------~-----------------------------------------------------------June 16 122 1 33 122 1 33
17 118 0 bull 0 0 240 1 17 20 120 2 67 360 3 33 21 118 0 00 478 3 25 23 119 2 67 597 5 34 24 119 3 102 716 8 45 27 116 19 655 832 27 130 28 120 22 733 952 49 206 30 120 40 1333 1072 89 332
July 1 115 36 1252 1187 125 421 4 122 30 983 1309 155 474 5 114 47 1649 1423 202 568 7 118 30 1016 1541 232 602 8 120 shy 24 800 1661 -$ 256 616
11 122 42 1377 1783 298 669 12 120 29 967 1903 327 687 14 116 37 1276 2019 364 721 15 118 40 1356 2137 404 756 18 121 60 1976 2258 464 822 19 119 30 740 2377 494 831 21 125 61 1952 2502 555 887 22 118 25 847 2627 580 883 25 122 16 525 2749 596 867 26 116 15 517 2865 611 853 28 122 28 918 2987 639 856 29 117 11 376 3104 650 838
August 1 120 7 233 3224 657 815 2 119 9 303 3345 666 796 4 120 3 100 3465 669 772 5 118 5 170 3583 674 752 8 114 7 245 3697 681 734
11 123 7 337 3 82 0 688 720 15 118 2 68 3938 690 701 16 113 5 177 4051 695 686 18 98 3 122 4149 698 673 19 119 1 34 4268 699 655 22 112 0 00 4380 699 638 23 115 0 00 4495 699 622 25 120 2 66 4615 701 606 26 112 1 36 4727 702 594 29 116 0 00 4843 702 580 30 11 5 0 00 4958 702 566
Sept 1 115 0 00 5079 702 553 2 112 0 00 5191 702 541
----shy5079 702
50
-----------------------------------------------------------------
------------------------------------------------------------------
TABLE 5D Unalakleet River Test Net Data Chum Salmon in 5 78 Mesh 1983
Cum Cum Cum Date Hours Catch CPUE Hours Catch CPUE
June 5 73 0 00 73 0 00 7 126 0 00 199 0 00 8 127 0 00 326 0 bull 0 0
10 11 4 3 105 440 3 27 12 113 2 71 553 5 36 14 119 1 34 672 6 36 15 116 4 138 788 10 51 17 116 3 103 904 13 56 19 118 6 203 1022 19 74 21 118 0 00 1140 19 67 22 117 10 342 1257 29 92 24 116 3 103 1373 32 93 26 119 11 370 1492 43 115 28 11 8 6 203 1610 $ 49 122 29 115 13 452 1725 62 144
July 1 119 8 269 1844 70 152 3 119 17 571 1963 87 177 5 119 13 437 2082 100 192 6 12 0 17 567 2202 117 213 8 121 7 231 2323 124 214
10 11 4 18 632 2437 142 233 12 115 12 417 2552 154 241 13 116 37 1276 2668 191 286 15 117 16 547 2785 207 297 17 11 8 31 1051 290 3 238 328 19 118 18 610 3021 256 339 20 115 29 1009 3136 285 364 22 122 17 557 3258 302 371 24 115 24 835 3373 326 387 26 120 19 633 3493 345 395 27 117 11 376 3610 356 394 29 117 14 479 3727 370 397 31 116 18 621 3843 388 404
August 2 121 9 298 3964 397 401 3 122 17 557 4086 414 405 5 11 8 8 271 4204 422 402 7 128 19 594 4332 441 407 9 257 10 156 4589 451 393
10 125 14 448 4714 464 394 12 13 1 308 4727 465 393 14 107 5 187 4834 470 389 16 122 4 131 4956 474 383 17 123 15 488 5079 489 385 19 118 8 271 5197 497 383 21 112 3 107 5309 500 378 23 120 6 200 5429 506 373 24 115 7 243 5544 513 370
51
-----------------------------------------------------------------------
TABLE 5D Unalakleet River Test Net Data Chum Salmon in 5 78 Mesh 1983 (Continued)
Cum Cum Cum Date Hours Catch CPUE Hours Catch CPUE
August 26 115 5 174 5657 518 366 28 119 1 34 577 6 519 359 30 119 4 134 5895 523 355 31 117 0 00 6012 523 3 48
Sept 2 123 3 98 613 5 526 343 4 479 2 17 6614 528 319 6 238 1 17 6852 529 309 7 237 0 00 7089 529 298 8 9
238 242
1 2
17
33 7327 7569
clt
530 532
289 281
10 242 3 50 7811 535 274 11 242 0 00 8053 535 266 12 241 2 33 8294 537 259 14 227 3 53 8521 540 253 15 242 0 00 8763 540 246 16 210 1 19 8973 541 241 17 239 2 33 9212 543 236 18 230 0 00 9442 543 230 20 489 0 00 9931 543 219 21 240 2 33 10171 545 214 22 242 0 0 10413 545 209 23 234 0 00 10647 545 205
----shy
10647 545
52
------------------------------------------------------------------------
------
TABLE 6A Unalakleet River Sonar Site Drift Sets5 1 4n Me sh 19 83 bull
Date Time Result
July 19 1405-1413 1 burbot July 23 1040-1055 1 pink caracass July 27 1520-1530 1 coho August 3 1444-1501 4 coho August 22 1930-1937 0 August 23 937-943 1 coho 1 pink carcass August 26 1117-1127 1 coho 3 churn August 31 1018-1034 3 churn
TABLE 6B Unalakleet River Sonar Site Beach Seines 1983
Date Time Distance Result
July 20 1445 120 meters 4 pink 1 churn 13 Dolly Varden 1 whitefish
July 25 1500 120 meters 6 pink 1 churn 1 Dolly Varden 4 whitefish 1 grayling
July 28 1700 120 meters 4 coho 2 pink 2 churn 1 Dolly Varden
August 1 2010 300 meters 4 pink 3 churn 8 Dolly Varden
August 4 1015 130 meters 5 coho 3 pink 3 churn 65 Dolly Varden 3 whitefish 3 grayling
August 24 1110 130 meters 18 coho 2 Dolly Varden 2 grayling
August 29 1715 120 meters 11 coho 1 pink 69 churn 1 Dolly Varden 2 grayling
Seine done at mile 12 Unalakleet River
53
--------------------------------------------------------------------------------------------------
--------------------------------------------------------------------------------------------------
TABLE 7 AGE SEX AND SIZE COMPOSITION OF NORTON SOUND KING SALMON UNALAKLEET RIVER CATCH SAMPLE SPORT CATCH AND SPAWNING SURVEYS 1983
II
COMBINED 3-2 4-2 4-3 NO LENGlH NO LENGlH NO LENGlH NO LENGlH
Male 31 646 6702 5 104 5010 8 167 5688 1 21 5900
Female 17 354 8540 o o 1 21 5450 o o
Total 48 1000 7353 5 104 5010 9 188 5661 1 21 5900
~ 11)
5-2 6-2 7-2 7-3 NO LENGlH NO LENGlH NO LENGlH NO LENGlH
Male 11 229 7382 6 125 8350 0 0 0 0
Female 2 42 7925 12 250 8742 1 21 10650 1 21 8350
Total 13 271 7465 18 375 8611 1 21 10650 1 21 8350
TABLE 8A AGE SEX AND SIZE COMPOSITION OF NORTON SOUND KING SALMON UNALAKLEET RIVER TEST NET SAMPLE 1983
-----~-------------------------------------------------------------------------------------------------------
gt
COMBINED 4-2 5-2 5-3 6-2 7-2 NO LENGIH NO LENGIH NO LENGIH NO LENGTH NO LENGTH NO LENGTr
8 14 n
Male 3 333 8107 0 1 111 5800 o 0 2 222 9260 0 0 Female 6 667 8295 0 0 1 111 7600 o o 4 444 8310 1 111 8930 Total 9 10 e 0 8232 0 o 2 222 6700 o o 6 667 8627 1 111 8930
If) If)
5 14 Male 19 1000 6298 12 632 5392 4 211 6990 0 o 3 158 8997 0 0 Female o 0 o o o o o o 0 0 0 0 Total 19 1000 6298 12 632 5392 4 211 6990 o o 3 158 8997 0 0
4 n or Smaller Male 6 667 5930 1 111 4660 2 222 6325 3 333 6090 0 o 0 o Female 3 333 8970 o o o o o o 3 333 8970 0 o Total 9 1000 6943 1 111 466 2 222 6325 3 33 3 6090 3 33 3 8970 0 0
TOTAL Hale 28 757 6413 13 351 5336 7 189 6630 3 8 1 6090 5 13 5 9102 o 0 Female 9 243 852 o o 1 27 7600 o o 7 189 8593 1 2 7 8930 Total 37 1000 6925 13 351 5336 8 216 6751 3 8 1 6090 12 324 88 e 5 1 2 7 8930
---------------------------------------------------------------------------------------------------------
---------------------------------------------------------------------------------------------------------
TABLE 8B AGE SEX AND SIZE COMPOSITION OF NORTON SOUND COHO SALMON UNALAKLEET RIVER TEST NET SAMPLE 5 14 AND 5 78 GEAR 1983
COMBINED 3-2 4-3 4-4 5-4 NO LENGIH NO LENGIH NO LENGTH NO LENGIH NO LENGTH
Male 9 900 5489 0 0 9 900 5489 0 0 Female 1 10 bull 0 552 QJ QJ 0 1 10QJ 5520 0 0 Total 10 1000 5492 0 0 10 1000 5492 0 0 725-731
bull LI)Male 15 938 5645 15 938 5645 Female 1 62 575 QJ 1 62 575 QJ Total 16 lQJ0QJ 5651 16 100QJ 5651 81-87
Male 24 545 5668 23 523 5768 1 23 3350 Female 20 455 5631 20 455 5631 0 0 Total 441QJ0QJ 5651 43 977 57 QJ 4 1 23 335 QJ 88-814
Male 7 500 5797 7 500 5797 QJ 0 Female 7 500 5596 6 429 5587 1 71 5650 Total 14 1000 5696 13 929 1 71 5650570 815-821
Male 5 455 5492 5 455 5492 Female 6 545 5552 6 545 5552 Total 11 lQJ00 5525 11 100QJ 5525 822-828
----------------- --------- ----------- ----------------------------------------- ------- -------------------
----- ----------------- - - ---- -------------------------------------------------------- --- -----------------
----------- - - --------------------------------------------- -------------------------------- - - ------------
TABLE 8B AGE SEX AND SIZE COMPOSITION OF NORTON SOUND COHO SALMON UNALAKLEET RIVER TEST NET SAMPLES 14 and 5 78 GEAR 1983 (CONTINUED)
COMBINED 3-2 4-3 4-4 5-4 NO LENGlH NO LENGlH NO LENGlH NO LENGlH NO LENGTH
------------------~------------------------------------------------------------------------------------- Male 10 455 5654 o o 10 455 5654 o o o o Female 12 545 5720 o o 12 545 5720 o o o Total 22 1000 5690 o o 22 1000 5690 o o o 829-94 Male 9 290 5723 9 290 5723 Female 22 710 5704 22 710 5704 Total 31 1000 5709 31 1000 5709 95-911
tI)Male 15 536 5887 15 536 5887 r-
Female 13 464 5855 13 464 5855 Total 28 1000 5872 28 1000 5872 912-918
Male 4 500 5935 1 125 6320 2 250 5735 1 125 5950 Female 4 500 5510 o o 4 500 5510 o o Total 8 1000 5722 1 125 6320 6 750 5585 1 125 5950 919-925
TOTALS Male Female Total
98 533 86 467
184 1000
5696 5682 5689
1 0 1
05 0
05
6320
6320
95 85
180
516 462 978
571 2 5682 5698
1 0 1
05 0
0 5
3350
3350
1 1 2
o 5 05 11
5950 5650 5800
4 OR SMALLER GEAR Male 72 758 Female 23 242 Total 95 1000
5727 557 5689
71 22 93
747 232 979
5741 5592 576
1 1 2
11 11 21
4750 5080 4915
--------------------------------------------------------------------------------------------------------
--------------------------------------------------------------------------------------------------------
--------------------------------------------------------------------------------------------------------
TABLE 8C AGE SEX AND SIZE COMPOSITION OF NORTON SOUND CHUM SAL~ION UNALAKLEET RIVER TEST NET 5 14 and 5 78 GEAR 1983
COMBINED 3-1 4-1 5-1 6-1 NO L ENGIH NO LENGIH NO L ENGIH NO L ENGIH NO L ENGIH
~1ale 0 0 0 0 0 0 0 0 0 0 Female 5 1000 5828 0 0 0 0 5 1000 5828 0 0 Total 5 1000 5828 0 0 0 0 5 1000 5828 0 0 610-612
Male 8 571 6108 0 0 2 143 5780 6 429 621 7 0 0 Female 6 429 5810 0 0 0 0 6 429 581 0 0 0 Total 14 1000 5981 0 0 2 143 5780 12 857 601 4 0 0 613-619 00
tr1
Male 8 333 6102 2 8 3 6325 6 250 6028 Female 16 667 5890 1 42 5520 15 625 5915 Total 24 1000 5961 3 125 6057 21 875 5947 620-626
Male 19 422 5911 7 156 6067 12 267 5820 Female 26 578 5843 10 222 5731 16 356 5912 Total 45 1000 5871 17 378 5869 28 622 5873 627-73
Male 17 362 6146 8 170 6081 9 191 620 4 Female 30 638 5750 17 362 5646 13 277 5885 Total 47 10QJQJ 5893 25 532 5785 22 468 6015 74-710
TABLE 8C AGE SEX AND SIZE COMPOSITION OF NORTON SOUND CHUM SALMON UNALAKLEET RIVER TEST NET 5 14 n and 5 78 n GEAR 1983 (CONTINUED)
COMBINED 3-1 4-1 5-1 6-1 NO L ENGlH NO L ENGlH NO L ENGlH ID LENGTH NO LENGTH
----------------------------------------~~-----------------------------------------------------------
Male 32 314 Female 7~ 686 Total 1~2 1~0~ 711-717
5898 5718
h775
16 43 59
157 422 578
5791 5666 5700
16 27 43
157 265 422
6005 5801 5877
Male Female Total 718-724
Male Female Total
33 384 53 616 86 H~00
19 306 43 694 62 1000
5951 5690 57 9~
6013 5760 5837
o 1 1
~
16 16
5200 5200
23 34 57
12 31 43
267 395 663
194 500 694
5833 5624 5709
5872 5682 5735
10 19 29
7 10 17
116 221 337
113 161 274
6222 5807 5950
6254 6021 6117
o 1 1
o 16 1 6
6120 6120
01 LI)
725-731
Male Female Total 81-87
11 212 41 788 52 1000
5904 5592 5658
1 3 4
19 58 77
5350 5380 5372
8 34 42
154 654 808
5799 5612 5648
2 4 6
38 77
115
6600 5582 5922
Male Female Total 88-814
7 269 19 731 26 1000
6003 5682 5768
o 1 1
~ 3 8 3 8
5400 5400
5 15 20
192 577 769
5946 5699 5761
2 3 5
77 115 192
6145 5690 5872
Male Female Total 815-821
14 467 16 533 30 1000
5948 5683 5806
1 1 2
33 3 3 67
521 0 5460 5335
12 10 22
400 333 733
5963 5697 5842
1 5 6
3 3 167 200
6500 5700 5833
Male Female Total
6 16
273 727
10~0
6022 5668 5765
middot o 1 1
o 4 5 4 5
5130 5130
5 12 17
227 545
3
5918 5646 5726
1 3 4
4 5 136 182
6540 5937 6088
822-82
------------------------------------------------------------------------------------------------------
------------------------------------------------------------------------------------------------------
------------------------------------------------------------------------------------------------------
------------------------------------------------------------------------------------------------------
------------------------------------------------------------------------------------------------------
TABLE 8C AGE SEX AND SIZE COMPOSITION OF NORTON SOUND CHUM SALl-lON UNALAKLEET RIVER TEST NET 5 14 and 5 78 GEAR 1983 (CONTINUED)
COMBINED 3-1 --- 4-1 5-1 6-1 NO LENGlH 00 LENGlH NO LENGlH NO LENGIH 00 LENGIH
Male 2 182 - 5650 2 182 5650 0 0 Female 9 818 5541 8 727 5571 1 9 1 5300II~-
Total 11 1000 5561 10 909 5587 1 9 1 5300 829-94
Male 0 0 0 0 Female 7 1000 gt5794 6 857 5735 1 143 6150 Total 7 1000 5794 6 857 5735 1 143 6150 95-911
Male 1 100 5720 0 0 1 100 5720 0 0 Female 9 900 5661 1 100 5460 7 700 5610 1 100 6220
0Total 10 1000 5667 1 100 5460 8 800 5624 1 100 6220 0
912-918
TOTALS
l-1a1e 177 326 5973 2 04 5280 103 190 5892 72 133 6108 0 0 Female 366 674 5717 8 15 5349 228 420 5654 129 238 5848 1 o 2 6120 Total 543 100 580 10 18 5335 331 61 5728 201 370 5941 1 o 2 6120
TOTAL 8 14 GEAR
~~a1e Female Total
20 870 3 13
23 1000
6537 5440 6394
9 2
11
391 87
478
6519 5550 6343
11 1
12
478 43
522
6551 5220 6440
TOTAL 4 GEAR AND VARIABLE MESH SMALLER THAN 4
l-1ale Female Total
60 583 43 417
103 1000
6146 5630 5985
32 27 59
311 262 573
6040 5503 5794
28 16 44
272 155 427
6268 5843 611 4
-------------------------------------------------------------------------------------------------------
-------------------------------------------------------------------------------------------------------
TABLE 9A AGE SEX AND SIZE COMPOSITION OF NORTON SOUND KING SALMON UNALAKLEET COMMERCIAL CATCH SAMPLE 1983 bull
I~
SEXED COMBINED 3-2 4-2 5-2 6-2 SAMPLES NO LENGlH NO LENGlH NO LENGlH NO L ENGlH NO L ENGlH
Male 1 03 64 0 8098 1 06 5170 4 25 5365 4 4 27 3 77 3 4 54 335 8651
Female 58 360 8626 o o o o 9 56 8340 49 304 8678
Tota1 1 61 100 0 8288 1 o6 5170 4 255365 53 3297837 1036408664
M
Unsexed 293 1000 8166 1 03 5050 11 38 601 8 95 324 7708 186 635 854 4 ~
Total 454 1000 8209 2 o4 511 0 15 33 5844 148 326 7754 289 637 8587
-
TABLE 9B AGE SEX AND SIZE COMPOSITION OF NORTON SOUND SOCKEYE SALMON UNALAKLEET TEST NET SAMPLE 1983 5 78 5 14 4 AND VARIABLE MESH NETS bull
COMBINED 4-2 5-2 5-3 SEX NO LENGTH NO LENGTH NO LENGTH NO LENGTH________________________________________C_____________________________________________
Male 4 667 57e8 e e 3 5ee 5887 1 167 517e
Female 2 333 5335 1 167 518e 1 167 549e e e N 0
Total 6 10ee 5584 1 167 518e 4 667 5788 1 167 517e
--------------------------------------------------------------------------------------------
--------------------------------------------------------------------------------------------
TABLE 9C AGE SEX AND SIZE COMPOSITION OF NORTON SOUND COHO SALMON UNALAKLEET COMMERCIAL CATCH SAMPLE 1983
COMBINED 3-2 4-3 5-4 NO LENGTH NO LENGTH NO LENGTH NO LENGTH
Male 83 519 5630 4 25 5450 78 488 5637 1 06 5800
Female 77 481 5676 4 25 5662 72 450 5685 1 06 5100
Total 160 100 0 565 2 8 50 5556 1 50 93 bull 8 566 0 2 13 5450
C)
0
TABLE 9D AGE SEX AND SIZE COMPOSITION OF COMMERCIAL CATCH SAMPLE 1983
NORTON SOUND CHUM SALMON UNALAKLEET
COMBINED NO L ENGlH NO
3-1
L ENGlH NO 4-1
LENGTH NO 5-1
LENGTH NO 6-1
LENGTH
Male
Female
Total
159 48
171 52
328 1
598
591
594
3
3
9
09
563
563
84
15
189
256
32
576
62
570
584
70
66
136
213
21
415
593
625
609
2
o
2
06
o
06
62
620
t
r
----------------- ----------------- -----------------
------------------------------------------------------------------------
APPENDIX TABLE 1A Unalakleet River Test Net King Salmon Catches 1981-1983 8 14 Mesh
1981 1982 1983
Date Hrs Catch CPUE Hrs Catch CPUE Hrs Catch CPUE
May 27 21 0 0 00 28 482 0 00 29 30 240 0 00 31 246 2 41
June 1 237 0 00 2
~
256 0 00 3 585 0 00 4 5 160 0 00 6 120 1 42 7 24 2 28 24 00 8 24 1 14 125 0 00 9 24 3 42 122 0 00
10 24 2 28 24 1 21 11 24 4 55 24 3 62 117 0 00 12 24 1 14 24 0 00 126 0 00 13 24 3 42 24 0 00 117 1 43 14 24 3 42 24 2 42 15 24 2 28 24 1 21 118 0 00 16 24 7 96 11 6 1 43 17 24 1 14 24 1 21 18 24 2 28 240 0 00 19 24 2 28 24 0 00 121 0 00 20 24 5 69 24 1 21 116 0 00 21 24 2 28 12 0 00 22 24 1 14 118 1 42 23 24 1 14 12 0 00 119 1 42 24 24 3 42 119 3 126 25 24 1 14 240 0 00 26 24 0 00 11 9 0 00 27 24 0 00 126 0 00 11 9 0 00 28 24 2 28 115 0 00 29 24 2 28 120 0 00 30 24 1 14 120 0 00 120 0 00
65
----------------- ----------------- -----------------------------------------------------------------------------------------
APPENDIX TABLE 1A Unalakleet River Test Net King Salmon Catches 1981-1983 8 14 Mesh (Continued)
1981 1982 1983
Date Hrs Catch CPUE Hrs Catch CPUE Hrs Catch CPUE
July 1 24 4 55 135 0 00 2 24 2 28 238 0 00 3 24 1 14 11 8 0 00 4 24 0 00 110 0 00 118 1 42 5 24 0 00 120 0 00 6 24 1 14 122 0 00 7 24 0 00 130 1 39 fS 116 0 00 8 24 1 14 140 0 00 9 24 1 14
10 24 0 00 126 0 00 11 24 0 00 120 3 125 119 0 00 12 24 0 00 118 0 00 13 24 1 14 11 6 0 00 14 24 0 00 122 0 00 119 2 84 15 24 0 00 122 0 00 16 24 0 00 17 24 0 00 122 0 00 18 24 0 00 11 2 0 bull 00 19 24 0 00 119 0 00 20 24 0 00 120 0 00 119 0 00 21 24 0 00 11 2 0 00 22 24 0 00 115 0 00 23 24 0 00 52 0 00
Mesh changed to 5 78
66
-------------------------------------------------------------------
Appendix Table lB Unalakleet River Test Net King Salmon Catches 1982-1983 5 Gear
1982 (5 78 mesh Z~fm) 1983 (5 14 mesh 25 fm) Hrs Catch CPUE Hrs Catch CPUE
June 5 73 til 0 6 7 126 1 32 8 9 127 1 31
1~ 114 0 0 11 12 113 2 71 13 14 119 2 67 15 116 1 34 16 24 1 21 17 116 2 69 18 24 5 104 19 118 0 0 20 12 4 167 21 118 1 34 22 12 2 83 117 1 34 23 12 2 83 24 116 0 0 25 119 1 42 26 119 2 67 27 121 2 84 28 118 1 34 29 122 1 41 115 2 70 30 135 2 74
July 1 119 1 34 2 120 2 83 3 119 1 34 4 135 0 0 5 119 0 0 6 120 0 0 120 0 0 7 55 0 0 8 121 0 0 9 90 0 0
10 114 0 0 11 65 0 0 12 115 0 0 13 122 1 41 116 1 34 14 90 0 0
117 til til
67
------------------------------------------------------------------------
----------------- ----------------- -------------------
APPENDIX TABLE 1C Unalakleet River Test Net Coho Salmon Catches 1981-1983 5 78 Mesh
1981 1982 1983
Date Hrs Catch CPUE Hrs Catch CPUE Hrs Catch CPUE -------------shy ---------------------------------------------------------shy
July 18 120 0 00 19 120 0 00 20 21 118 0 00 22 245 0 00 23 24 115 0 00 25 126 4 158 26 25 0 00 120 0 00 27 28 24 1 42
117 0 00
29 24 1 42 46 00 117 4 137 30 24 2 83 31 24 2 83 116 3 1 03
Aug 1 24 1 42 30 9 1500 2 24 0 00 44 3 341 122 0 00 3 24 1 42 122 2 66 4 24 0 00 132 8 304 5 24 0 00 73 6 649 118 1 34 6 24 0 00 7 24 1 42 128 14 437 8 24 0 00 126 9 357 9 24 3 125 129 0 00 257 14 218
10 24 1 42 125 21 672 11 24 0 00 122 8 328 12 24 1 42 125 17 680 13 0 00 13 24 1 42 14 24 5 63 107 12 449 15 24 17 212 123 18 732 16 24 36 450 122 5 205 122 2 66 17 24 27 337 123 6 196 18 24 21 262 120 5 208 19 24 20 250 122 1 41 118 1 34 20 24 10 125 21 24 17 212 112 6 2 14 22 24 10 125 122 6 246 23 24 13 162 118 2 84 120 3 100 24 24 2 25 115 2 70 25 24 5 62 121 3 124
68
------------------------------------------------------------------------
----------------- ----------------- ------------------
------------------------------------------------------------------------
APPENDIX TABLE 1C Unalakleet River Test Net Coho Catches 1981-1983 5 78 Mesh (Continued)
1981 1982 1983
Date Hrs Catch CPUE Hrs Catch CPUE Hrs Catch CPUE
Aug 26 27
24 24
13 5
162 62
12 0 0 115 5 174
28 24 4 5 119 0 29 24 1 12 125 11 440 30 24 Iil Iillil 113 5 221 119 4 134 31 24 3 38 117 1 34
Sept 1 2
24 24
2 1
25
12 122 115
6 2
246 87 ~ 123 5 33
3 24 2 25
4 24 1 12 479 15 125 5 24 2 83 116 8 3fil1 6 24 2 83 98 3 153 238 6 1 fill 7 24 1 42 237 5 bull 84 8 24 2 83 118 fil fil0 238 6 1 fill 9 24 2 83 242 10 165
1fil 24 3 125 285 13 228 242 3 50 11 24 1 42 235 14 298 242 2 33 12 24 1 42 256 8 156 241 8 133 13 24 2 83 256 5 98 14 24 fil filfil 213 6 141 227 14 247 15 24 Iil Iilfil 267 7 131 242 9 149 16 24 1 42 222 5 113 21fil 3 57 17 24 0 fil0 248 10 2fil2 239 2 33 18 24 fil 00 221 15 339 230 2 35 19 24 fil0 3fil2 4 67 20 24 1 42 191 fil filfil 489 4 33 21 262 fil 76 24 fil 3 50 22 276 6 1fil9 242 0 bull filfil 23 2fil2 2 50 234 1 17 24 238 1 21
Mesh size = 5 14 from July 24 to August 10
69
-----------------------------------------------------------------------
----------------- ----------------- -----------------
-----------------------------------------------------------------------
APPENDIX TABLE ID Unalakleet River Test Net Pink Salmon Catches 1981-1983 4 Mesh
1981 1982 1983
Date Hrs Catch CPUE Hrs Catch CPUE Hrs Catch CPUE
June 16 24 0 00 122 1 33 17 24 0 00 118 0 00 18 24 1 14 19 24 0 00 20 24 0 00 120 2 67 21 24 1 14 120 87 2900 118 0 00 22 24 0 00 120 40 1667 23 24 2 28 119 2 67 24 24 1 14 120 147 4900 119 3 102 25 26
24 24
~ 5
28
69 115 126 4382 t
27 24 3 41 116 19 655 28 24 2 28 125 222 7104 120 22 733 29 24 3 41 70 116 6628 30 24 2 28 120 40 1333
July 1 24 2 28 90 134 5956 115 36 1252 2 24 5 69 U~ 5 184 7010 3 24 6 82 4 24 12 165 122 30 983 5 24 4 55 95 387 16294 114 47 1649 6 24 4 55 30 75 10000 7 24 8 110 118 30 1016 8 24 19 261 22 86 15636 120 24 800 9 24 8 110 30 144 19200
10 24 11 151 11 24 15 206 122 42 1377 12 24 17 234 21 112 21333 120 29 967 13 24 10 138 35 110 12571 14 24 7 96 116 37 1276 15 24 8 110 20 52 10400 118 40 1356 16 24 10 138 15 61 16267 17 24 20 275 18 24 20 275 15 35 9333 121 60 1976 19 24 23 958 119 30 740 20 24 15 627 16 59 14750 21 24 51 21 25 16 61 15250 125 61 1952 22 24 55 2297 118 25 847 23 24 28 11 67 24 43 7167 24 24 17 708 25 24 22 917 11 43 15636 122 16 5 25 26 24 14 583 116 15 517 27 24 12 500 6 21 35000 28 24 5 208 24 100 16667 122 28 9 18 29 24 9 375 117 11 376 30 24 8 333 14 9 2571
middot 31 24 10 417 70
-----------------------------------------------------------------------
----------------- ----------------- -----------------
-----------------------------------------------------------------------
APPENDIX TABLE 1D Unalakleet River Test Net Pink Salmon Catches 1981-1983 4 Mesh (Continued)
1981 1982 1983
Date Hrs Catch CPUE Hrs Catch CPUE Hrs Catch CPUE
August 1 2
24 24
4 4
167 167
35 6 686 12 QJ 11 9
7 9
233 3 03
3 24 6 250 18 18 4000 4 24 4 167 47 34 2894 120 3 100 5 24 2 83 118 5 1 70 6 24 10 417 12 0 00 7 24 12 500 8 24 1 42 45 2 178 114 7 245 9 24 1 42
10 11 12
24 24 24
2 f 3
83
83 125
28 37
0 0
bull 00 bull QJ0
~
123 7 337
13 24 0 bull 00 16 0 bull 00 14 24 0 00 15 24 1 42 39 3 308 118 2 68 16 24 0 00 113 5 177 17 18 19
24 24 24
0 0 0
bull 00 00 00
16 55
0 0
bull 00 bull 00 98
11 9 3 1
122 34
20 24 0 00 13 0 bull 00 21 22 122 0 00 112 0 00 23 115 QJ 0QJ 24 120 0 QJQJ 25 119 QJ 00 120 2 66 26 11 2 1 36 27 126 QJ QJ0 28 29 30
116 QJ QJ0 116 115
0 QJ
QJQJ
QJQJ 31 106 1 38
Sept 1 2
122 0 0QJ 115 112
QJ QJ
QJQJ
QJ0 3 121 0 QJ0 4 5 122 QJ bull 00 6 7 126 1 32
Note 1981 mesh sizes = 8 14 from June 16 to July 17 5 78 from July 17 to August 20
71
-----------------------------------------------------------------------
----------------- ----------------- -----------------------------------------------------------------------------------------
APPENDIX TABLE IE Unalakleet River Test Net Chum Salmon Catches 1981-1983 5 78 Mesh
1981 1982 1983
Date Hrs Catch CPUE Hrs Catch CPUE Hrs Catch CPUE
June 5 73 0 00 6 7 126 0 00 8 127 0 00 9 24 0 00
10 24 10 138 114 3 105 11 24 4 55 12 24 10 138 113 2 71 13 24 2 28 14 24 0 00 119 1 34 15 16
24 24
3 5
41
69 24 8 167 $
116 4 138
17 24 3 41 116 3 103 18 24 21 289 24 9 188 19 24 18 247 118 6 203 20 24 14 193 12 12 416 21 24 7 96 118 0 00 22 24 6 82 12 8 334 117 10 3 42 23 44 41 564 12 2 84 24 24 2 28 116 3 1 03 25 24 4 55 119 3 123 26 24 5 69 119 11 370 27 24 4 55 121 23 951 28 24 9 124 - 118 6 2 03 29 24 9 124 122 11 451 115 13 4 52 30 24 4 55 135 13 481
July 1 24 14 193 119 8 2 69 2 16 16 220 1213 17 709 3 24 16 220 119 17 571 4 24 13 179 135 213 741 5 24 11 151 119 13 437 6 24 11 151 1213 4 1 67 120 17 567 7 24 9 124 55 12 1091 8 24 18 248 121 7 231 9 24 13 179 913 9 500
10 24 19 261 114 18 632 11 24 22 302 65 16 1231 12 24 14 192 115 12 417 13 24 10 138 122 8 330 116 37 1276 14 24 10 138 90 8 444 15 24 6 82 117 16 547 16 24 3 41 118 3 127 17 24 6 82 118 31 11351
72
---------------- ----- --- ---- -------------------- ------------ ------------
------------- - - --- ----------------- ---------- --------
---- ---------------------------------------------------- ---- ---- - ------
APPENDIX TABLE IE Unalakleet River Test Net Chum Salmon Catches 1981-1983 5 78 Mesh (Continued)
1981 1982 1983
Date Hrs Catch CPUE Hrs Catch CPUE Hrs Catch CPUE
middotJu1y 18 24 16 220 120 8 333 19 24 12 500 120 19 791 118 18 610 20 24 20 833 115 29 1009 21 24 16 667 11 8 8 339 22 24 4 167 245 28 571 122 17 557 23 24 7 292 24 24 12 500 115 24 835 25 24 11 458 126 23 910 26 24 20 833 25 3 500 120 19 633 27 24 21 875 117 11 376 28 24 14 583 29 30
24 24
37 22
1542 917
46 8 870 ~ 117 14 479
31 24 12 500 116 18 621 Aug 1 24 3 125 30 3 500
2 24 0 00 44 1 114 121 9 298 3 24 4 167 122 17 557 4 24 7 292 132 5 190 5 24 11 458 73 5 342 118 8 271 6 24 8 333 7 24 11 458 128 19 594 8 24 11 458 126 6 238 9 24 9 375 129 2 78 257 10 156
10 24 6 250 125 14 448 11 24 9 375 122 4 164 12 24 7 292 125 3 120 13 1 308 13 24 1 42 14 24 25 310 107 5 187 15 24 30 383 123 2 82 16 24 14 187 122 2 82 122 4 131 17 24 9 118 123 15 488 18 24 14 187 120 0 00 19 24 8 110 122 1 41 118 8 271 20 24 6 82 21 24 7 96 112 3 107 22 24 1 14 122 1 41 23 24 1 14 118 4 170 120 6 200 24 24 2 28 115 7 243 25 24 2 28 121 1 41 26 24 2 28 122 0 00 115 5 174 27 24 7 96 28 24 2 28 119 1 34 29 24 1 14 125 3 120 30 24 0 00 113 0 00 119 4 134 31 24 2 28 117 0 00
73
----------------- ----------------- ------------------
-----------------------------------------------------------------------
APPENDIX TABLE IE Unalakleet River Test Net Chum Salmon Catches 1981-1983 5 78 Mesh (Continued)
1981 1982 1983
Date Hrs Catch CPUE Hrs Catch CPUE Hrs Catch CPUE
Sept 1 24 2 28 122 0 00 2 24 0 00 115 0 00 123 3 98 3 24 0 00 4 24 0 00 479 2 17 5 24 1 42 116 0 ~ 00 6 24 1 42 98 0 00 238 1 17 7 24 2 84 237 0 00 8 24 2 84 118 3 127 ~
238 1 17 9 24 e 00 242 2 33
10 24 0 00 285 0 00 242 3 50 11 24 0 00 235 0 00 242 0 00 12 24 0 00 256 0 00 241 2 33 13 24 0 00 256 0 00 14 24 0 00 213 0 00 227 3 53 15 24 0 00 267 0 00 242 0 00 16 24 0 00 222 0 00 210 1 19 17 24 0 00 248 2 40 239 2 33 18 24 0 00 221 0 00 230 0 00 19 24 0 00 302 0 00 20 24 0 00 191 0 bull 00 489 0 00 21 262 1 19 240 2 33 22 276 1 18 242 0 00 23 202 0 00 234 0 00 24 238 0 00
Note 1981 Sizes - 8 14 from June 9 to July 17 5 78 from July 18 to September 20
1983 Sizes - 5 14 from June 5 to August 10 5 78 from August 11 to September 23
74
CONTENTS
List of Figures bullbullbullbullbullbullbullbullbullbullbullbullbullbullbullbullbullbullbullbullbullbullbullbullbullbullbullbullbullbullbullbullbullbullbullbullbullbullbullbullbull i
List of Tables iii Introduction 1
Methods bullbullbullbullbullbull 2
Project Deployment middot 2 Sonar bullbullbullbullbullbullbullbull 2 Test Fishing bullbullbull middot 5 Counting Towers bullbullbullbullbullbullbullbullbull middot 6 Drift SetsBeach Seines 7
bull bullbullbullbullbull bull bull s bull bullbullbullbullbullbullbullbullbullbullbullRiver Surveys bullbullbullbullbullbullbullbullbullbullbullbullbullbullbullbullbull 7Subsistence Survey bullbullbullbullbullbullbullbullbullbullbullbullbullbullbull 7
Results bullbullbullbullbullbullbullbullbullbullbullbullbullbullbullbullbull middot 8
Subsistence Survey middot middot 8 Sonar bullbullbullbullbull 8 Test Fishing bullbullbullbullbullbullbullbullbullbullbullbull middot 9 Age Sex and Size Composition of Test Net Catches bullbullbull l~ Counting Towers bullbullbullbullbullbullbullbullbullbullbullbull bull bull 10 Drift SetsBeach Seines l~ River SurveysAerial Surveys bullbullbullbull 11 King Salmon Sport Fish Survey middot 11
Discussion 11
Conclusion 13
-i shy
LIST OF FIGURES Page
Figure 1 Unalakleet Escapement Project bullbullbullbullbullbullbullbullbullbullbullbullbullbullbullbullbull 14
Figure 2 Sonar Site Schematic bullbullbullbullbullbullbullbullbullbullbullbullbullbullbullbullbullbullbullbullbullbullbullbullbullbull 15
Figure 3 Unalakleet King Salmon Subsistence Survey 1983 bullbullbullbullbullbullbullbullbullbullbullbullbullbullbullbullbull 16
Figure 4A Specie Apportionment King Salmon Unalakleet Sonar 1983 bullbullbullbullbullbullbullbullbullbullbullbullbullbullbullbullbullbullbullbullbullbullbullbull 17
Figure 4B Specie Apportionment Coho Salmon Unalakleet Sonar 1983 bullbullbullbullbullbullbullbullbullbullbullbullbullbullbullbullbullbullbullbullbullbullbullbull 18
Figure 4C Specie Apportionment Pink Sa1monr Unalakleet Sonar 1983 bullbullbullbullbullbullbullbullbullbull ~ bullbullbullbullbullbullbullbullbullbullbullbullbull 19
Figure 4D Specie Apportionment Chum Salmon Unalakleet Sonar 1983 bullbullbullbullbullbullbullbullbullbullbullbullbullbullbullbullbullbullbullbullbullbullbullbull 2~
Figure 5 Specie Apportionment Unalakleet Sonar 1983 bullbull 21
Figure 6 Sector Distribution of Counts Unalakleet Sonar 1983 bullbullbullbullbullbullbullbullbullbullbullbullbullbullbullbullbullbullbullbullbullbull 22
Figure 7 Hourly Distribution of Counts Unalakleet Sonar 1983 bullbullbullbullbullbullbullbullbullbullbullbullbullbullbullbullbullbullbullbullbullbullbullbull 23
Figure 8 Unalakleet River Test Fishing Daily King CPUE in 8 14 Mesh 1983 bullbullbullbullbullbullbullbullbullbullbullbullbullbullbullbullbullbullbullbullbull 24
Figure 9 Unalakleet River Test Fishing Cumulative King CPUE in 8 14 Mesh 1983 bullbullbullbullbullbullbullbullbullbullbullbullbullbullbullbull 25
Figure 1~ Unalakleet River Test Fishing Daily Coho CPUE in 5 78 Mesh 1983 bullbullbullbullbullbullbullbullbullbullbullbullbullbullbullbullbullbullbullbullbull 26
Figure 11 Unalakleet River Test Fishing Cumulative Coho CPUE in 5 78 Mesh 1983 bullbullbullbullbullbullbullbullbullbullbullbullbullbullbullbull 27
Figure 12 Unalakleet River Test Fishing Daily Pink CPUE in 4 Mesh 1983 bullbullbullbullbullbullbullbullbullbullbullbullbullbullbullbullbullbullbullbullbullbullbullbullbull 28
Figure 13 Unalakleet River Test Fishing Cumulative Pink CPUE in 4 Mesh 1983 bullbullbullbullbullbullbullbullbullbullbullbullbullbullbullbullbullbullbullbull 29
-ii shy
Page Figure 14 Unalakleet River Test Fishing Daily CPUE in
5 14 and 5 78 Mesh 1983 bullbullbullbullbullbullbullbullbullbullbullbullbullbullbullbullbullbull 3~
Figure 15 Unalakleet River Test Fishing Cumulative Chum CPUE in 5 14 and 5 78 Mesh 1983 bullbullbullbullbull 31
Figure 16 Unalakleet River Test Fishing Catch Proportions1983 bullbullbullbullbullbullbullbullbullbullbullbullbullbullbullbullbullbullbullbullbullbullbullbullbullbullbullbullbullbull 32
Figure 17 Unalakleet Area Temperatures 1983 bullbullbullbullbullbullbullbullbullbullbullbull 33
Figure 18 Unalakleet River Turbidity and Depth 1983 bullbullbullbull 34
Figure 19 Unalakleet River Test Fishing Cumulative King CPUE in 8 14 Mesh 1981-1983 bullbullbullbullbullbullbullbullbullbullbull 35
Figure 2~ middotUna1ak1eet River Test Fishing Cuciu1ative Chum CPUE in 5 78 Mesh 1981-1983 bullbullbullbullbullbullbullbullbullbullbull 36
Figure 21 Unalakleet River Test Fishing Cumulative Pink CPUE in 4 Mesh 1981-1983 bullbullbullbullbullbullbullbullbullbullbullbullbullbullbullbullbullbullbullbull 37
Figure 22 Unalakleet River Test Fishing Cumulative Coho CPUE in 5 78 Mesh 1981-1983 bullbullbullbullbullbullbullbullbullbullbullbullbullbullbullbull 38
-iii shy
LIST OF TABLES
Table 1 Page
Unalakleet River Subsistence King Salmon Index 1983 bullbullbullbullbullbullbullbullbullbullbullbullbullbullbullbullbullbullbullbullbullbull 39
Table 2 Unalakleet River Final Sonar Counts 1983 bullbullbullbullbull 40
Table 3A Unalakleet River Species Apportionment by Test Period - King Salmon 1983 bullbullbullbullbullbullbullbullbullbullbullbullbullbullbull 42
Table 3B Unalakleet River Species Apportionment by Test Period - Coho Salmon 1983 bullbullbullbullbullbullbullbullbullbullbullbullbullbullbull 43
Table 3C
Table 3D
Unalakleet River Species Apportionment by Test Period - Pink Salmon 1983 bullbullbullbullbullbullbullbullbullbullbullbullbullbullbull 44
Unalakleet River Species Apportionment by Test Period - Chum Salmon 1983 bullbullbullbullbullbullbullbullbullbullbullbullbullbullbull 45
Table 4 Unalakleet River Test Net Proportions by Sample Period 1983 (selective CPUE) bullbullbullbullbullbullbullbullbullbull 46
Table SA Unalakleet River Test Net Data King Salmon in 8 14 Mesh 1983 bullbullbullbullbull 48
Table 5B Unalakleet River Test Net Data Coho Salmon in 5 78 Mesh 1983 bullbullbull 49
Table 5C Unalakleet River Test Net Data Pink Salmon in 4 Mesh 1983 bullbull 5~
Table 5D Unalakleet River Test Net Data Chum Salmon in 5 78 Mesh 1983 bullbullbullbullbullbullbullbullbullbullbullbullbullbullbullbullbullbullbull 51
Table 6A Unalakleet River Sonar Site Drift Sets 5 14 Mesh 1983 bullbullbullbullbullbullbullbullbullbullbullbullbullbull 53
Table 6B Unalakleet River Sonar Site Beach Seines 1983 bullbullbullbullbullbullbullbullbull ~ 53
Table 7 Age Sex and Size Composition of Norton Sound King Salmon Unalakleet River Catch Sample Sport Catch and Spawning Surveys 1983 bullbullbullbullbullbullbullbull 54
Table 8A Age Sex and Size Composition of Norton Sound King Salmon Unalakleet River Test Net Sample 1983 bullbullbullbullbullbullbullbull 55
-ivshy
Page Table 8B Age Sex and Size Composition of Norton Sound
Coho Salmon Unalakleet River Test Net Sample 5 14n and 57811 Gear 1983 bullbullbullbullbullbullbullbullbullbullbullbullbullbullbullbullbullbull 56
Table 8C Age Sex and Size Composition of Norton Sound Chum Salmon Unalakleet River Test Net 5 1 4 n and 5 7 8 Gea r 19 8 3 bull bull bull bull bull bull bull bull bull bull bull bull bull bull bull bull bull 5 8
Table 9A Age Sex and Size Composition of Norton Sound King Salmon Unalakleet Commercial Catch Sample 1983 bullbullbullbullbullbull 61
Table 9B Age Sex and Size Composition of Norton Sound Sockeye Salmon Unalakleet Test Net Sample 5 78 11 5 14 n 4n and Variable Mesh Nets 1 98 3 bull bull bull bull bull bull bull bull bull bull bull bull bull bull bull bull bull bull bull bull bull bull bull bull bull bull bull bull e $ bull bull bull bull bull bull bull bull bull bull bull 6 2
Table 9C Age Sex and Size Composition of Norton Sound Coho Salmon Unalakleet Commercial Catch Sample 1983 bullbullbullbullbullbullbullbull 63
Table 9D Age Sex and Size Composition of Norton Sound Chum Salmon Unalakleet Commercial Catch Sample 1983 bullbullbullbullbullbullbullbullbullbullbull 64
Appendix Table lAo Unalakleet River Test Net King Salmon Catches 1981-1983 8 1411 Mesh bullbullbullbullbullbullbullbullbullbullbullbullbullbullbullbullbullbullbullbullbullbullbullbull 65
Appendix Table lB Unalakleet River Test Net King Salmon Catches 1982-1983 5 Gear bullbullbullbullbullbullbullbullbullbullbullbullbullbullbullbullbullbullbullbullbullbullbullbullbullbullbullbull 67
Appendix Table lC Unalakleet River Test Net Coho Salmon Catches 1981-1983 5 78 n Mesh bullbullbullbullbullbullbullbullbullbullbullbullbullbullbullbullbullbullbullbullbullbullbullbull 68
Appendix Table ID Unalakleet River Test Net Pink Salmon Catches 1981-1983 4 n Me sh bullbullbullbullbullbullbullbullbullbullbullbullbullbullbullbullbullbullbullbullbullbullbullbullbullbullbullbull 70
Appendix Table IE Unalakleet River Test Net Chum Salmon Catches 1981-1983 5 78 Mesh bullbullbullbullbullbullbullbull bull bullbullbullbullbullbullbullbullbullbullbullbullbullbull 72
-vshy
INTRODUCTION
The Unalakleet River empties into Norton Sound approximately 130 miles southeast of Nome is approximately 130 miles in length and drains an area of 1087 square miles The Unalakleet River flows from the Nulato hills westward to the town of Unalakleet on the Bering Sea coast Five major tributaries comprise the river all of which support spawning salmon
The town of Unalakleet is situated at the mouth of the Unalakleet River the most important salmon producing river in Norton ~ound Historically the people of the area have depended on the salmon runs for their liveli~ood first as food for themselves and their dogs and more recently as the basis of their cash economy
Attempts to assess salmon escapement to the system have been made annually by aerial stream surveys counting towers on the North River in 1973 and 1974 and on the Chirosky River during 1975 and 1976 Weather and water clarity have often limited these enumeration efforts but escapement estimates have ranged as high as 1477 king (1977) 28600 churn (1978) 491706 pink (1978) and 1184 coho salmon (1980) not including major tributaries
A salmon subsistence survey is conducted by the Commercial Fisheries Division each year in Unalakleet Results have indicated that sUbsistence catch averages have been increasing in recent years The recent five-year average 1978 to 1982 subsistence salmon catches were 922 king 4694 coho 13019 pink and 3840 chum salmon Coho and pink salmon catches have shown the greatest increases due largely to increased returns of these species
Commercial catches in the Unalakleet subdistrict have also increased due to increased effort better technology and the increased returns of coho and pink salmon The recent five-year average (1978-1982) commercial catch for the Unalakleet subdistrict is 5629 king 28427 coho 131016 pink and 43086 chum salmon In 1982 the average commercial fisherman received approximately $6000 from the sale of salmon
Because of the importance of the commercial and subsistence
-1shy
fisheries and the problems of estimating escapement in this subdistrict side-scanning sonar was installed in 1982 in the Unalakleet River in hopes of gaining a more accurate estimate of escapement and at the very least a more consistent index of salmon migration
A test fishing program was in operation in 1981 in the lower four miles of the Unalakleet River Indices from this study were instrumental in helping the area biologist set some commercial fishing periods In 1982 sonar counts proved useful as an index of the coho salmon escapement and were used by the area biologist in extending the coho fishery
A number of problems affecting sonar counts became more apparent during the 1983 season These problems brought on by low river velocity (13 to 17 fps) and tidal f1uctuationi included milling salmon and allocating counts to five different fish classifications
With increased harvest effort on the chinook population a limited sport fish survey was begun
This report presents the results of the Unalakleet sonar projects second year of operation and comparison of test fishing indices from 1981 to 1983
METHODS
Project Deployment
Supplies and equipment were on-site and camp construction was completed on May 28 Both north and south bank counters were in operation on June 4 Sonar counter operation ceased on September 4 91 days after counting was initiated By September 6 the sonar camp had been dismantled and the equipment stored for the winter
Test fishing began on May 27 and ended on September 23
Sonar
The Electrodynamics Division of the Bendix Corporation developed a side- scanning hydroacoustic counter during the 1970s capable of detecting and counting salmon migrating along the banks of tributary streams The side-scan sonar counter is designed to transmit a sonic beam along a 60 foot aluminum tube or substrate
-2shy
Echoes from fish passing through the beam are reflected to the transducer The systems electronics interpret the strength and number of the echoes and tally fish counts
Two Bendix side-scan counters 1981 models were used on the Unalakleet River The respective 60-foot tubular aluminum substrates were deployed from opposite banks of the Unalakleet River Both substrates were positioned so there was at least two feet of water over the sonar beam that is projected immediately above the substrate that is two feet over the transducer housing and seven feet over the target end of the substrate It was found that three feet of water was needed as a buffer to eliminate debris counts due to wind ripples flotsam and sudden water level changes A small weir _ was placed to prevent fish passage inshore from the transducer on both sides of the riverThe substrates were not located directly opposite each other The north bank substrate was located 400 feet upstream from the south bank substrate which was placed in a nearly ideal river bottom profile Unfortunately mud shallows were opposite the south bank During the season fish behavior necessitated movement of the north bank substrate to a site 300 feet downstream of the south bank substrate
The river width at this site is approximately 200 feet The deepest channel is located about 80 feet from shore at the north bank substrate and about 100 feet from shore at the south bank substrate Although one-third of the river is isonified by the sonar beams if fish follow a depth contour then more than two-thirds of the possible fish paths would be covered by the sonar counters
The substrates were moved several times during the summer because of water level changes or for cleaning The substrates were guyed to two dead men each in the form of buried logs held in place with fence posts Stainless steel aircraft cable fastened to each end of the substrate was attached to respective dead men on shore
The cables were roughly parallel and adjusted to hold the substrate perpendicular to shore The inshore cable was long enough to allow the substrate to remain perpendicular to shore even though it might be moved 15 feet from shore The easiest method of movement of the substrate was to use the hydrodynamic shape of the substrate to raise itself and push against the substrate with a handy man jack The inshore footing could then be relocated with a minimum of
-3shy
effort
Although the current at the sonar site was insufficient to raise the tube to the surface it did help in pulling it up to a point where it could be cleaned
Calibration (a comparison of oscilloscope fish counts and sonar fish counts) was scheduled four times daily on both banks The magnitude of the fish milling problem compounded by slow fish passage made this schedule impractical much of the summer Calibration was attempted when usable results seemed impossible it was not attempted at extreme rates of fish passage Calibration was done by comparing echoes on a Tektronix 221 oscilloscope with counts of the sonar counter Salmon passing through the sonar beam produce a distinctive oscilloscope trace A count of 100 fish within 30 minutes the maximum calibration period was required before resetting the sonar fish velocity controls
agreement = Sonar computer count Oscilloscope count
The agreement was then used to adjust the daily counts Agreement of less than 1 indicates the sonar was undercounting and greater than 1 indicates overcounting
When the count agreement varied more than 15 then the following equation was used to derive a new fish velocity
agreement x existing velocity = new velocity
Milling fish became a problem on June 28 on the north bank when slow migrating and milling pink salmon oscars started riding the substrate turbulence wave Based on counting tower observations it was determined that all sixteen sectors were affected On July 1 and 2 the substrate was moved approximately 700 feet downstream to the base of a small cliff with somewhat faster water velocity Pink salmon began riding the substrate at the new site within hours Oscars were not a problem on the south bank during this time therefore in order to estimate the passage on the north bank the average hourly passage rate (percent per hour of the daily total) of the preceding three day period of the south bank was used to calculate daily totals for the
-4shy
north bank based upon hours which were not apparently effected by oscars
Total of Preceding 3-day valid hourly sum of daily
Daily total--North = counts--north x counts--South Total of corresponding hourly counts for preceding 3 days--south
After two weeks of attempting to deal with milling fish the following policy was decided on The sonar beam was raised slightly so that a strong target was seen in the four degree mode but a decrease in target strength was barely apparent in the two degree mode The offshore end of the substrate was moved middotfive feet downstream from the perpendicular placement used earlier The beam was extended as far as possible beyond the target These measures seemed to eliminate fish avoidance of the substrate as a problem
Other milling problems were not satisfactorily resolved Salmon moving downstream were not counted by the sonar but those same fish moving upstream could be counted by the sonar It was decided to invalidate an hourly count if milling fish were observed from a tower or oscilloscope or if sonar criteria were not met Disqualifying sonar criteria were hourly debris checks or a large fish count over 15 The large fish count indicated fish moving over the substrate in a tight school which was characteristic of milling behavior King salmon in the Unalakleet did not seem to reflect a long enough signal to register as large fish however two or three small salmon could register if they were close to the same distance from the transducer and spaced in an overlapping manner
Records of changes in counter settings river conditions and other unusual occurrences were also used in adjusting daily sonar counts
The large fish counter on the 1981 model sonar counter was ignored except as an index of milling fish
Test Fishing
The same test fishing site as in 1981 and 1982 was used during the 1983 season
-5shy
The ten fathom 8 14 gillnet was set from May 27 to May 31 A twenty fathom 8 14 gillnet was set on June 1 and fished until June 4 From June 5 to September 4 the period of sonar operation a rotating schedule of twelve hour time blocks over a period of three days was used The nets used included
1 20 fm 8 14 mesh 2 25 fm 5 14 mesh (June 5-August l025 fm 5 78
mesh (August II-September 4) 3 25 fm 4 mesh 4 15 fm variable mesh
The 25 fm 5 78 mesh gillnet was fished from September 5 to September 25 The 8 14 mesh net and the v~riable mesh net were fished concurrently The three-day rotation schedule allowed each net to be fished during one 12-hour high tidedaylight period and one 12-hour low tidenight period Nets were rotated at 0900 and 2HJ0 daily The 8 14 mesh net was removed from the rotation on July 21 because the chinook migration was completed
The CPUE (catch100 fm-hr) was calculated for the two most efficient nets for each species to be used in apportioning sonar counts These CPUEs for chinook coho pink chum and other species presumably detectable by sonar were totaled and the species CPUE divided by the total CPUE for all species to give the percent of the periods sonar counts to each specie The seventh day of the week was apportioned by using the previous 3-day proportions for one half of the counts and the following 3-day proportions for the second half of the counts
Test net data (Tables 5A 5B 5C and 5D) was calculated for the single most effective net for each species for separate analys is
Weights lengths and scale samples were taken from all chinook coho and chum captured Pink salmon were counted only Tissue samples were taken from test net chinook salmon for electrophoretic studies coordinated by the Stock Separation Section of the Commercial Fisheries Division
Counting Towers
Counting towers were erected immediately adjacent to the
-6shy
onshore end of each substrate (Figure 2) As in 1982 the use of visual tower counts for comparison with sonar counts could not be relied upon due to river width surface disturbances etc however several short comparisons were possible The towers proved invaluable in determining the presence of moribund fish debris passage presence of oscars fish swimming behavior etc The 1983 low river level and generally less turbidity as compared to 1982 allowed more rapid and concrete identification of the milling fish Without use of the tower the severity of the milling fish problem may not have been discovered
Drift SetsBeach Seines
Drift sets and beach seines were done for comparison with test net species apportionment and to determine fish passage beyond the sonar counting range Drjft sets were accomplished by drifting a 25 fm 5 14 gillnet perpendicular to the shore The 25 fm net allowed the major portion of the river to be fished thus only one drift was done per set as opposed to 1982 when a drift set was done near each bank Set durations ranged from 5 to 17 minutes dependent upon boat traffic wind conditions etc Drift sets were done on July 19 23 and 27 and August 3 22 23 26 and 31
Beach seines were accomplished by using a 25 fm 3 mesh seine immediately downstream of the south bank substrate Shoreline conditions prevented se1n1ng near either north bank site Beach seines on the south bank were done on July 20 25 and 28 and August 1 and 29 Beach Unalakleet River were done on August 4 and levels prevented seining from August 4 to
seines 24
24
at High
mile 12 water
Riyer Surveys
Two river surveys were attempted during 1983 A jet boat was taken up the North River on July 29 This proved to be early for carcass sampling but weather and equipment problems prevented a later survey
A float trip of the Old Woman and upper Main River was also made A plane landing mishap greatly reduced the scope of this trip Weather prevented any follow up work
Subsistence Surveys
A daily survey of three to five sUbsistence fishermen is
-7shy
made from the time the first king salman is caught early in June through the remainder of that month These people must be trustworthy conscientious about checking their nets and fairly successful The average daily catch is compared to the previous day to develope the annual trend and the total catches and the annual trend is compared to past years Commercial catch and effort data and the up-river test net data are used in conjuction with the subsistence catch to anticipate strategies
future catches and management
During late September made of Unalakleet
an The
extensive door to door survey is Annual Management Report covers
subsistence surveys in detail
RESULTS
~istence Survey
The Unalakleet subsistence survey made in late September interviewed 74 subsistence fishermen 68 of whom fished in the river and 17 who fished in the ocean The catch was predominantly from the river with 1480 king 6311 coho 13458 pink and 4124 chum salmon reported The ocean subsistence catch was 388 king 577 coho 350 pink and 277 chum salmon
The mean chinook salmon catch per fisherman peaked on June 16 This compares with July 3 in 1982 and June 19-22 in 1981 All subsistence fishermen surveyed in 1983 were fishing within one mile of the river mouth
Chinook subsistence survey results are presented in Table 1 and Figure 3 As in 1981 and 1982 the variances in nets fishing times and net locations call for calculation of mean catch per fisherman as opposed to catch per unit effort
Sonar
During the period from June 4 to September 4 the final sonar count was 322494 148465 (460) counts were tallied on the south bank and 174029 (540) counts were tallied on the north bank
The daily sonar counts (Table 2) were adjusted by the test net proportions (Table 4) to give the following escapement estimates for the period June to September 4
-8shy
Species Total Count LQf Total
Chinook 2790 09 Coho 17013 53 Pink 91881 285 Chum 58273 181 Other 152537 AL2
322494 1000
Tables 3A 3B 3C 3D and 4D present this data by 3-day sample period Based on discussions with Al Menin and Dave Gaudet about the ability of sonar counters to discriminate between various target shapes and sizes any fish two and one half pounds or laterally compressed fish ~f one pound or larger could be counted by a sonar calibrated for pink salmon Fish other than salmon considered countable by the sonar counter included arctic char grayling burbot and broad humpback and Alaska whitefish
Peak adjusted apportioned sonar counts were on June 23 for chinook August 21 for coho July 18 for pink and July 25 for chum salmon (Tables 3A 3B 3C and 3D Figures 4A 4B 4C and 4D)
Representative passage rates on the south bank by sector and by hour for July 3-5 and August 21-23 are presented in Figures 6 and 7 These periods were chosen because of minimal adjustments to raw counts north bank counts are not presented due to lack of relatively clean data for those periods
Test Fishing
A total of 19 chinook (74 male - 26 female) 294 coho (61 male 39 female) 1156 pink (52 male - 48 female) and 915 chum (54 male - 46 female) was captured from May 27 to September 23 The fish were sampled and delivered to Hartha Nanouk a local subsistence fisherman as per agreement for the use of her traditional set-net site
Based on the single most effective test net CPUE the chinook migration did not peak as such but rather showed most consistent catches on June 22 and 23 coho migration peaked from August 10-14 pinks from July 18-22 and chum on July 13
-9shy
Comparisons of daily CPUE and cumulative CPUE for all salmon species are presented in Tables SA 58 5C and 5D and Figures 8 thru 15 Of interest although not as useful for annual comparison due to different test net methods net mesh sizes fishing time etc the actual fish caught from 1981 to 1983 are
~ 1982 un 41 chinook 39 chinook 39 chinook
107 coho 310 coho 294 coho 1463 pink 5114 pink 1156 pink
722 chum 375 chum 915 chum
f
Age Sex and Size Composition of Test Net Catches
An age analysis of scales collected during the project indicated the following age compositions king salmon all gear sizes (4-2131 5-2 22~ 5-3816-23217-2 3) coho salmon 5 14 and 5 78 gear (3-2 051 4-3 981 4-4 051 5-4 l) chum salmon 5 14 and 5 78 gear (3-1 21 4-1 611 5-1 37) Tables 7 thru 9D show the age composition of the various species broken down by date and the mesh sizes used during the project
Counting Towers
As cited visual tower counts could not be made on the Unalakleet River due to river width surface disturbances turbidity etc However visual observations proved invaluable in identifying spawning behavior etc and resulted in the downstream relocation of the north bank substrate and development of the method used to adjust north bank sonar counts
Drift SetsBeach Seines
Tables 6A and 68 present the results of drift sets and beach seines respectively Drift set results indicate that the portion of the river not isonified was not used by migrating salmon ie the species most countable coho pink and chum salmon would seem to follow the banks and were counted by the side-scan sonar
Beach seines proved useful in verifying the high presence of
-10shy
species other than salmon the relative abundance of coho salmon in August and the presence of spawning churn salmon in the south bank substrate area
Riyer SurveysAerial SurVeys
On July 29th 32 miles of the North River were surveyed by a two-person crew for the purpose of counting live chinook and sampling chinook carcasses A total of 166 live chinook were counted and 3 chinook carcasses were sampled with approximately half of the chinook counted between mile 25 and mile 32
Originally the Old Woman River survey was to be a six-day trip Due to the damage the plane suffered dropping the first crew member off the second member and support gear was not av~ilable for the survey as planned~ The survey of the Old Woman River August 6-8 counted 60 king salmon but only four samples were collected Weather prevented the survey of the main river
King Salmon Spo rt Fish Survey
A sport fishing lodge on the Unalakleet River is responsible for the majority of the sport fishing effort Periodic surveying of lodge personnel indicates that a fair quantity of king salmon are harvested by sport fishing A quantitative survey was not done however due to limited time available A total of 43 chinook was sampled from sport fishing catches
DISCUSSION
River levels were lower than normal during the spring of 1983 due to the lack of snow accumulation the previous winter The Unalakleet River cleared early and became quite low during late June and early July The low water allowed the counting towers at the sonar site to be used during calm survey days which wasnt possible during 1982
Tower observations made as early as June 28 showed serious milling problems at the north bank sonar site The sonar was moved to a new site on July 2 Milling fish were still a considerable problem at the new site but about half the hourly count were considered acceptable during mid-July Milling salmon were a problem through most of the field season Milling salmon of all four species were observed
-11shy
during the latter half of each respective migration Pink salmon presented the worst problem and churn the least Unfortunately milling pinks invalidated the churn count since the two runs overlap Coho salmon exhibited some milling but an accurate evaluation of this problem was hampered by turbid water Milling coho became a problem after August 20
The milling observed from the towers was not apparent to the observer at the oscilloscope because of the overwhelming number of spikes present at that stage of the salmon migration During 1982 when tower observations were not possible the oscilloscope appeared to have an extraordinary number of spikes The large pink salmon count recorded in 1982 may have been an artifact of milling behavior that was unobservable then Commercial catch and test net catch statistics indicate a large pink salmon run f However it is likely fish milling over the substrate exaggerated the sonar count although without tower observations it can not be proven
Another problem observed during the 1983 field season was avoidance of the substrate by all fish species This problem was at its worst when water was low and clear Angling the substrate slightly downstream as it was after July 15 helped considerably By extending the sonar beam periodically it was determined that as visibility decreased so did avoidance
Species apportionment of the sonar count was done using test net catches Some of the problems encountered with the sampling scheme should be pointed out Test nets were assumed to sample the same portion of the river as the sonar Since three net lengths were used this seemed suspect Different species migrate at different depths The non-salmon species tend to migrate in shallow water near shore and generally the larger species migrate in deeper water nearer mid-stream Since only a IS-fathom net of the most efficient type for non-salmon species was fished in the preferred habitat for these fish it is likely that the calculated efficiency was too high The other test nets were longer and also sampled some preferred areas for the targeted species
The opposite case is true for king salmon The 8 14 net is 20 fathoms longS fathoms shorter than the other nets used on this project This net does not cover all of the area preferred by king salmon This means king salmon
-12shy
escapement is probably underestimated but the 20 fathom net samples an area further out than the sonar counter even with its beam extended So the number of king salmon counted by the sonar is over estimated King salmon make up such a small percentage of the total salmon run that counting errors are more significant than this apportionment error
Very few churn and pink salmon were caught in the offshore end of the nets It is assumed these long nets had very little effect on the sonar count species apportionment
CONCLUSION
The feasibility of counting salmon in the Unalakleet River using side-scanning sonar is unlikely due to milling fish and the inal1ility to accurately apportion the sonar count to the various fish species It is possible that a partial escapement count could be made further up river above one or more of the major tributaries to the system The new north bank sonar site that showed some improvement over the former site had two differences that seemed to affect salmon migration The current was faster over the substrate at the second site and the river gravels were less ideal spawning habitat The new site was located below a rock bluff on the outside of a river bend
There are two similar sites up river about ten miles where the current is faster and the bottom is even less conducive to spawning During the 1984 field season a comparison of the smoother running south bank site and these up-river sites could be made The best time to do this would be during August when only coho salmon are migrating The counter should be operating by August 15 prior to milling activity and maintained for a week to evaluate if milling salmon became apparent later after the migration peaked The south bank site could be used as a control for comparison to 1983
-13shy
I I
5 1 2
Miles No tt h _
shy
R Iv er
Figure 1 Unalakleet Escapement Project
lt
Son sr
Fig u r e 2 S 0 0 a r Sit eSc hem a tic
ITower
Original Ninth Bank Sonar
Drift sets 5 minutes
Lf)
So t h Ban k Son a
lTower
o Work Tent
B Living Quarters
Figure 3Unalakleet Subsistence Survey 1983
Kin g- S a I m 0 n
1bull
10
9
c 8aI
-lE 11 t a til 7 ~ II 6 ~ U
5 til
0
c 4 til til
E 3 I
1 V
~ 2
1
27 1 5 10 15 20 25 30
~ June
Figure 4A Specie apportionment king salmon Un-alakleet sonar 1983
~
25
-l20
c 1 5 III () III
11
10
5
I
J
27 31 5 10 15 20 25 30 5 10 15 20 25 31
June Ju Iy
Figure 4B Specie middotapp~~tionment coho salmon Unalakleet sonar 1983
30
25
co ~
20
1 t~
C $
u 1 5 CD a
10
5
5 10 15 20 25 31 5 10 15 20 25 31 5
Ju August Sept e
Figure 4C Specie apportionment pink salmon Unalakleet sonar 1983
1 6
1 5
14
1 3
12
1 1
c II U CII
Ashy
10
9
a
7
01 ~
6
5
4
3
2
1
1 5 10 1 5
June
2 O 25 30 5 10 15 20
Ju Iy
25 31 5 10 15 20
August
25 31 5 10
Septem
Figure 40 Species apportionment chum salmon Unalakleet sonar 1983
16
1 5
1 4
13
1 2
1 1
10
9 c 8GI U
GI middot7 A
6
5
4
3
2
1
~
o N
~
1 5 10 15 20 25 30 5 10 15 20 25 3 1 5 10 15 20 25 31 5 10
June Ju Iy August Sept e
Figure 5 Specie apportionment Unalakleet sonar 1983
50
4
40
35
c J 30 0 U
~ 0 25 0 c Q)
u ~
Q) 20a
15
10
5
o L-_lt---__
King Coho Pink Chum Misc
21
----
Figure 6 Sector distribution of counts Unalakleet sonar1983
35
30
25
c 20 G)
() G) 15
0
10
5
35
30
25 c G)
() 20
G)
0 15
10
5
( s ()u t h ban k )
July 3-5
~-2 4 6 8 1 0 1 2 1 4 1 6shy
Sector
August 21-23
2 4 6 8 10 12 14 16
Sector
22
Figure 7 Hourly distribution of counts Unalakleet sonar 1983
(south bank)
14
12
10
c 8 GI U ~
6
July 3-5
~GI
I =~ Q
4
2 0
2 4 6 8 10 12 14 1 6 18 20 22 24
TIme
9
8
7
6
5 c GI U ~ 4 GI
Q
3
2
August 21-23
1
0
2 4 6 8 10 12 14
TIme
16
23
18 20 22 24
Figure 8 Unalakleet River Test Fishing Daily King CPUE in 8 14 mesh 1983
10
9 N
8 shy
7 I 0 c 6E
n
l J I I
0 0 5 c (J 4 co 0
3
2
1
I I
27 1 5 10 15 20 25 1 5 10 15 20 25 31
~ June July
Figure 9 Unalakleet River Test Fishing Cumulative King CPUE in 8 14 mesh 1983bull
~
middot10
09 U N
I 08 0 c 07E I ()
- 06 E-0 0 05 shy~ () 04 ca - ()
03E I 0 02
01
27 1 5 10 15 2Q 25 1 5 10 15 20 25 31
June July
Figure 10 Unalakleet River Test Fishing Daily Coho CPUE in 5 78 mesh 1983
1
6
5
I 0
NI II I 0 t
E 4
0 0 c 3() cu 0
2
1
1 5 10 15 20 25 1 5 10 15 20 25 1 5 10 15 20
July August Sept U
Figure 11 Unalakleet River Test Fishing Cumulative Coho CPUE in 5 78 mesh 1983
200
175
150
I 0 c 125E I ()
E
r-shy-0 I I N 0 100 c ()-as ()
75E I 0
50
25
1 5 10 15 20 25 1 5 10 15 20 25 1 5 10 15 20
July August Sel ber
20
Figure 12 Unalakleet River Test Fishing Daily Pink CPUE in 4 mesh 1983
18
I
0) N
II
16
I ishy
14 J 0 t 12shyE 0 10 0 shys 8 () as
0 6 1 I V 4
2
~ I
1 5 10 15 2Q 25 30 5 10 15 20 25 31 5 10 15 20 25 31 5
June July August Sept
--
Figure 13 Unalakleet River Test Fishing Cumulat ive Pink CPUE in 4 mesh 1983
10
9 01 N 8
J 0 J 7 E J 0 6 E- 50 ~
amp 4() ca
0 3 E J
0 2
1
1 5 10 15 20 25 30 5 10 15 20 25 31 5 10 15 20 25 31 5
June July August Sept
Figure 14 Unalakleet River Test Fishing Daily CPUE in 5 14 amp 5 78 mesh 1983
14
13shy
12
11
10
9 J 0 8
I z shy-E 7 0 0 shys ~u aI 0
4 I
31
2
1
II
0 C1)I 11
I I I II
bull y AA(net changed to 5 78
AA A 11 I
~ I~ V ~
- I
VI
1 5 10 15 20- 25 30 5 10 15 20 25 31 5 10 15 20 25 31 5 10 15 20
cJune July August
Figure 15 Unalakleet River Test Fishing Cumulative Chum CPUE in 5 14 amp 5 78 mesh 1983
It
5
--l C)
net changed to 5 78
~ 4 o
c E (J ~
3E o o c 2 u ~ -(J
E ~ (J 1
1 5 10 15 2Q 25 30 5 10 15 20 25 31 5 10 15 20 25 31 5 10 15 20
June July August s
Figure 16 Unalakleet River Test Fishing Catch Proportions 1983
60
55
---- King50
__ Coho 45
P--Q Pink
40 __ Chum
I LU 35J D I 0
30 ICQ 0 25 I
N Cl0 20
c G)
15u G)
D
10
5 A 1 I
I 4 I
I I
3 lt
~
2
I I1 - I bull I
I ~ ~ ~ t -J ~~ - _
r
1 5 10 15 20 25 30 5 10 15 20 25 31 5 10 15 20 25 31 5 10
June July August Sept
Figure 17 Unalakleet Area Temperatures 1983
18
16
14
12
til 10I
u-G) 80 CI) G) G) 6 C) G)
Q 4
2
C) C)
__ Air
0--0 River 2
0
-2
-4
---------~ ~
27 31 5 10 15 20 25 30 5 10 15 20 25 31 5 10 15 20 25 31 5 10 15 20
June July August 5e
4
Figure 18 Unalakleet River Turbidity and Depth 1983
__ Secchi Reading
-t ()
II) G)-G)
3
iE 2
1
27 31 5 10 15 20 25 30 5 10 15 20 25 31 5 10 15 20 25 31 5 10 15 20
June July August
~ 1 _ ~ r--- I shy I __ I 01 --shy
Figure 19 Unalakleet River Test Fishing Cumulative King CPUE in 8 14 mesh 1981-83
27 31 5
May
_1981
____ 1982
o 0 1983 11) C)
Changed to 5 78 mesh
I
t
~-~o-~ Q-O--Oolt)-(IQ-----l
--1
_10 15 20 25 30 5 10 15 20 25 31
June July
I I I
~
0 ~
r E ~
CJ shyE 0 0 I
shyr u-cu CJ
E ~
CJ
4
35
30
25
20
15
10
05
Figure 20 Unalakleet River Test Fishing Cumulative Chum CPUE in 5 78 mesh 1981-83
5
4 lI 0
z
E lI 0 3 E-0 0 2 r CJ-cu 0
E lI 1 0
__1981 ~~
~ ___1982
a 01983 5 148 mesh from 65-810
_----shy-- 0 - -- C1) A - _ - ~
~ I
I
II I I I I I
I I
1
~ -
-
1 5 10 15 20 25 30 5 10 15 20 25 31 5 10 15 20 25 31 5 10 15 20
June July August s
Figure 21 Unalakleet River Test Fishing Cumulative Pink CPUE in 4 mesh- 1981-83
8
70
60
50
40 0
r 30E
0 20E-0 0 10 s= u 8 tV 0 6E 0 4
2
__1981 ____ 1982
_1983
shy--- -- shy--- shy J - -
I
I
C1- J
I
-----l---l ~--~r---------------r--
1 5 10 15 20 25 30 5 10 15 20 25 31 5 10 15 20 25 31 5 10
June July August Sept
Figure 22 Unalakleet River Test Fishing Cumulative Coho CPUE in 5 78 mesh 1981-83
_1981
~ __ 1982
~1983
25
00I _ __ _ _ C)~ I __ _ I
I V o 20 rt I I
E I AshyI o E 15-o o z u 10 tU o E I o 5
I
1 5 10 15 20 25 31 5 10 15 20 25 31 5 10 15 20
July August 5
----------------------------------------------------------------
Table 1 Unalakleet River Subsistence King Salmon Index 1983
Number of Number of Date Fishermen Chinook Average
08 02 18 05 05 00 02 58 92 62 72 72 42 28 52 60 62 20 47 50 35 25 15
June 8 9
10 11 12 13 14 15 16 17 18 19 20 21 22 23 24 25 26 27 28 29 30
Totals
4 4 4 4 4 4 4 4 4 4 4 4 4 4 4 4 4 3 3 3 4 4 4
4
3 1 7 2 2 o 1
23 37 25 29 29 17 11 21 24 25
6 14 15 14 H~
6
322
~
39
---------------------- ---------- --------------------------------------
----------------------------------------------------------------------
TABLE 2 Unalakleet River Final Sonar Counts 1983
Daily Proportion Cumu1 Prop Date South North Total of Total Cumulative of Total
64 7 23 30 1313131 313 013131 65 44 187 231 00137 261 01308 66 12 162 174 01305 435 01313 67 8 283 291 1313139 726 01322 68 0000 726 13022 69 3 221 224 013137 950 13029 610 26 245 271 131308 1221 13037 611 56 254 310 131310 1531 131347 612 44 736 780 013 24 2311 13071 613 64 1188 1252 01339 3563 01113 614 59 1752 1811 0056 5374 0166 615 97 844 941 01329 6315 0195 616 165 729 894 0028 7209 0223 617 151 i 604 1755 0054 8964 middot 0277 618 i ll 1524 1635 0051 10599 13328 619 175 2000 2175 0067 12774 13395 620 171 21320 2191 0068 14965 0463 621 220 1613 1833 0057 16798 0520 622 199 2065 2264 0070 19062 0590 623 362 21334 2396 0074 21458 13664 624 876 3403 4279 13133 25737 0797 625 1244 2023 3267- 0101 29004 0898 626 738 1601 2339 0073 31343 0971 627 573 3265 3838 0119 35181 1090 628 547 1868 2415 0075 37596 1165 629 528 4028 4556 0141 42152 1306 630 430 430 0013 42582 1319 71 240 240 01307 42822 1326 72 201 975 1176 0036 43998 1362 73 309 8842 9151 0284 53149 1646 74 475 6385 6860 0213 60009 1859 75 565 3342 3907 0121 63916 1980 76 1377 2094 3471 0108 67387 2088 77 1416 3173 4589 0142 71976 2230 78 1472 1420 2892 0090 74868 2320 79 2071 1452 3523 01113 78391 2430 710 3318 2434 5752 0178 84143 2608 711 2673 2866 5539 13172 89682 2780 712 1665 1747 3412 13106 93094 2886 713 21317 1951 3968 13123 97062 3009 714 2991 2664 5655 0175 102717 3184 715 2646 2548 5194 13161 107911 3345 716 2488 2886 5374 0167 113285 3512 717 1585 4063 5648 0175 118933 3687 718 3559 9326 12885 0400 131818 4087 719 2948 2398 5346 13166 137164 4253 720 1640 3330 4970 0154 142134 4407 721 2416 6420 8836 0274 150970 4681 722 3298 3298 0102 154268 4783 723 5007 5007 0155 159275 4938
40
--------------------------------------------------------------------
--------------------------------------------------------------------
-----------------------------
TABLE 2 Unalakleet River Final Sonar Counts 1983 (Continued)
Daily Proportion Cum Prop Date South North Total of Total Cumu1at i ve of Total
724 4005 7804 11809 0366 171084 5304 725 2453 3392 5845 0181 176929 5485 726 2166 12094 14260 0442 191189 5927 727 1914 4472 6386 0198 197575 6125 728 1603 3463 5066 0157 202641 6282 729 1251 1914 3165 0098 205806 6380 730 1710 2495 4205 en30 210011 6510 731 2542 1887 4429 0137 214440 6647 81 4479 2271 6750 0209 221190 6856 82 1103 1806 2909 0091 224099 6947 83 1719 942 2661 0083 226760 bull 7030 84 1519 2557 4076 0126 230836 7156 85 1259 1113 2372 0074 233208 7230 86 940 2189 3129 0097 236337 7327 87 1467 4354 5821 0180 242158 7507 88 2318 1584 3902 0121 246060 7628 89 2098 1505 3603 0112 249663 7740 810 2629 1517 4146 bull 0129 253809 7869 811 3753 1091 4844 0150 258653 8019 812 1489 523 2012 0062 260665 8081 813 744 353 1097 0034 261762 8386 814 981 981 bull 0030 262743 8145 815 2324 2324 0072 265067 8217 816 2638 2638 0082 267705 8299 817 2073 731 2804 0087 270509 8115 818 2244 675 2919 0091 273428 8477 819 3240 696 3936 0122 277364 8599 820 2363 503 2866 0089 280230 8688 821 6789 1111 7900 0245 288130 8933 822 6489 563 7052 0219 295182 9152 823 5077 298 5375 0167 300557 9319 824 2616 298 2914 0090 303471 9409 825 3933 412 4345 0135 307816 9544 826 1393 554 1947 0060 309763 9604 827 1203 463 1666 0052 311429 9656 828 1197 542 1739 0054 313168 9710 829 1244 221 1465 0045 314633 9755 830 1011 199 1210 0038 315843 9793 831 718 214 932 0029 316775 9822 91 1324 318 1642 0052 318417 9874 92 1362 307 1669 0052 320086 9926 93 1146 314 1460 0045 321546 9971 94 652 296 948 bull 0029 322494 10000
148465 174029 322494 10000
41
----------------------------------------------------------------------
-------------------------------------------------------------------- --
------
TABLE 3A Unalakleet River Species Apportionment by Test Period King Salmon 1983
3-Day App Proportion of Cumulative Cumulative Dates Count Season Total Count Proportion
64-68 76 0272 76 0272
69-612N 28 0100 104 0372
612N-615 461 1652 565 2024
616-619N 419 1502 984 3526
619N-622 170 0609 1154 4135
623-626N 722 2588 1876 6723
626N-629 264 0946 2140 7669
630-73N 103 0639 2243 8038
73N-76 188 0674 2431 8712
77-710N 0 0000 2431 8712
710N-713 0 0000 2431 8712
714-717N 267 0957 2698 9969
717N-720 0 0000 2698 9669
721-724N 92 0331 2790 1 0000
724N-727 0 0000 2790 10000
728-731N 0 0000 2790 1 0000
731N-83 0 0000 2790 1 0000
2790 10000
42
Dates
714-717N
717N-720
721-724N
724N-727
728-731N
731N-83
84-87N
87N-810
811-814N
814N-817
818-821N
821N-824
825-828N
828N-831
91-94
TABLE 3B Unalakleet River Species Apportionment by Test Period Coho Salmon
3-Day Count
583
338
436
550
2650
1174
793
1435
5074
1280
435
2265
171H3
1983
Proportion of Season Total
0000
0000
0000
0343
0199
0256
0323
1558
0690
0466
0843
2983
0752
0256
1331
Cumulative Count
583
921
1357
1907
4557
5731
6524
7959
13033
14313
14748
17013
Cumulative Proportion
0000
0000
0000
0343
0542
0798
1121
2679
3369
3835
4678
7661
8413
8669
10000
43
------------------------------------------------------------------
------------------------------------------------------------------
----- ------
TABLE 3C Unalakleet River Species Apportionment by Test Period Pink Salmon 1983
3-Day P roport ion of Cumulative Cumulative Dates Count Season Total Count Proportion
64-68 0 0000
69-612N 0 0000
6l2N-615 0 0000
616-6l9N 97 0012
6l9N-622 332 0036
623-626N 1245 0136
626N-629 6624 0721
630-73N 3699 0403
73N-76 10762 1171
77-7l0N 7704 0838
710N-7l3 8529 0928
714-717N 9771 1063
717N-720 13845 1507
721-724N 11361 1236
724N-727 6544 0712
728-731N 3545 0386
731N-83 1628 0177
84-87N 1224 0133
87N-810 1777 0193
811-814N 802 0087
814N-817 561 0061
818-821N 533 0058
821N-824 8313 13091
825-828N 468 0051
828N-831 0 0000
91-94 0 0000
91881 10000
0 0000
0 0000
0 0000
97 0012
429 0048
1674 0184
8298 0905
11997 1308
22759 2479
30463 3317
38992 4245
48763 5308
62608 6815
73969 8051
80513 8763
84058 9149
85686 9326
86910 9459
88687 9652
89489 9739
90050 9800
90583 9858
91413 9949
91881 10000
91881 10000
91881 1 0000 44
------------------------------------------------------------------
------------ ------------------------------------------------------
----- ------
TABLE 3D Unalakleet River Species Apportionment by Test Period Chum Salmon 1983
3-Day Proportion of Cumulative Cumulative Dates Count Season Total Count Proportion
64-68 0 0000
69-612N 100 0017
612N-615 268 0046
616-619N 838 0144
619N-622 1180 0202
623-626N 2744 0471
626N-629 1569 0270
630-73N 796 0137
73N-76 2972 0510
77-710N 2068 0355
710N-713 2622 0450
714-717N 4133 0710
717N-720 5596 0960
721-724N 4978 0854
724N-727 8974 1540
728-731N 2241 0385
731N-83 2079 ~0357
84-87N 3009 0516
87N-810 2432 0417
811-814N 937 0161
814N-817 454 0078
818-821N 2584 0443
821N-824 2739 0470
825-828N 1783 0306
828N-831 765 0131
91-94 412 0070
58273 10000 45
0 0000
100 0017
368 0063
1206 0207
2386 0409
5130 0880
6699 1150
7495 1287 f
10467 1797
12535 2152
15157 2602
19290 3312
24886 4272
29864 5216
38838 6666
41079 7051
43158 7408
46167 7924
48559 8341
49536 8502
49990 8580
52574 9023
55313 9493
57096 9799
57861 9930
58273 1 0000
-------------------------------------------------------------
------------------------- ------------------------------------
TABLE 4 Unalakleet River Test Net Proportions by Sample Perio-d 1983 ( Selective CPUE)
Dates Chinook Coho Pink Chum Misc
64-68 105 00 00 895
69-612N 24 00 83 893
612N-615 1C~ 5 00 61 834
616-619N 78 18 156 748
619N-622 23 45 160 772
623-626N 65 112 247 576
626N-629 22 553 131 294
630-73N 16 576 124 284
73N-76 10 572 158 260
77-710N 00 555 149 296
710N-713 00 540 166 294
714-717N 14 00 513 217 256
717N-720 00 00 532 215 253
721-724N 04 00 493 216 287
724N-727 00 18 202 277 503
728-731N 00 23 242 153 582
731N-83 00 30 112 143 715
84-87N 44 98 241 617
87N-810 182 122 167 529
811-814N 139 95 111 655
814N-B17 96 68 55 7B1
B18-B21N 105 39 1B9 667
821N-824 263 43 142 552
825-B28N 145 53 202 600
828N-831 97 00 171 732
91-94 396 00 72 532
46
--------
--------
TABLE 4 Una1ak1et River Test Net Proportions 1983 ( Selective CPUE) (Continued)
Comparative Apportionment
Species Apportionment
Chinook 2790 Coho 17013 Pink 91881 Churn 58273
------shySubtotal 169957
Misc Species 152537 ------shy
Total 322494
Substrate Comparison -------------------shy
Bank Counts -----shy
South 148465 North 174029
------shy
Total 322494
Percent of Total Counts
09 53
285 181
5408
472
1000
Percent
460 540
1000
47
-------------------------------------------------------------------
TABLE 5A Unalakleet River Test Net Data King Salmon in 8 14 Mesh 1983
Cum Cum Cum Date Hours Catch CPUE Hours Catch CPUE
May 27 28
21 5 482
13 13
1313
1313 21 5 697
13 13
1313
1313 30 240 0 013 937 0 00 31 246 2 41 1183 2 08
June 1 237 0 00 1420 2 07 2 3
256 585
13 13
013 bull 13 13
1676 2 261
2 2
6bull 13 4
5 6 8
160 120 middot 125
13 1
13 42 130
2 421 2541 2666
~ 2 3 3
bull 13 4 136 136
9 122 0 130 2788 3 05 11 117 00 2905 3 05 12 126 13 00 3031 3 05 13 117 1 43 3148 4 06 15 118 0 013 3266 4 136 16 116 1 43 3382 5 138 18 240 13 130 3622 5 07 19 121 0 00 3743 5 07 20 116 0 00 3859 5 136 22 118 1 42 3977 6 138 23 119 1 42 4196 7 08 25 240 0 013 4336 7 138 26 119 13 1313 4455 7 138 27 119 13 1313 4574 7 138 29 1213 13 130 4694 7 137 313 1213 13 00 4814 7 07
July 2 238 0 1313 51352 7 07 3 118 13 013 51713 7 07 4 118 1 42 5288 8 138 6 122 0 00 5410 8 07 7 116 13 00 5526 8 07
10 126 0 1313 5652 8 07 11 119 0 013 5771 8 07 13 116 13 130 5887 8 07 14 119 2 84 6006 10 07 17 122 0 00 6128 10 07 18 112 0 1313 6240 10 136 20 119 13 00 6359 10 06 21 112 0 013 6471 10 06
6471 10
48
------------------------------------------------------------------
------------------------------------------------------------------
TABLE 5B Unalakleet River Test Net Data Coho Salmon in 5 78 Mesh 1983
Cum Cum Date Hours Catch CPUE Hours Catch CPUE
July 24 26
115 120 0 00
115 235
0 0
00
00 27 117 4 00 352 0 00 29 117 0 137 469 4 34 31 116 3 103 585 7 48
August 2 122 0 00 706 7 40 3 122 2 66 828 9 43 5 118 1 34 946 10 42 7 128 14 437 1074 24 89 9 257 14 218 1331 38 114
10 125 21 672 1456 59 162 12 13 middot- 0 00 1469 x 59 161 14 10 7 12 449 1576 71 180 16 122 2 66 1698 73 172 17 123 6 196 1821 79 174 19 118 1 34 1939 80 165 21 112 6 214 2051 86 168 23 120 3 100 217 1 89 164 24 115 2 70 2286 91 159 26 115 5 174 2401 96 160 28 119 0 00 2520 96 152 30 119 4 1 34 2639 100 152 31 117 1 34 2756 101 147
Sept 2 123 5 33 2879 106 147 4 479 15 125 3358 121 144 6 238 11 185 3596 132 147 7 237 5 84 3833 137 143 8 238 6 1 01 4071 143 141 9 242 10 1 65 4313 153 142
10 242 3 50 4555 156 137 11 242 2 33 4797 158 132 12 241 8 133 5038 166 132 14 227 14 247 5265 180 137 15 242 9 149 5507 189 137 16 210 3 57 5717 192 134 17 239 2 33 5956 194 130 18 230 2 35 6186 196 127 20 489 4 33 6675 200 120 21 24 3 50 6915 203 117 22 242 0 00 7157 203 113 23 234 1 17 7391 204 110
----shy
7391 204
Mesh size = 5 14 from 724 to 810
49
------------------------------------------------------------------
TABLE 5C Unalakleet River Test Net Data Pink Salmon in 4 Mesh 1983
Cum Cum Cum Date Hours Catch CPUE Hours Catch CPUE ------~-----------------------------------------------------------June 16 122 1 33 122 1 33
17 118 0 bull 0 0 240 1 17 20 120 2 67 360 3 33 21 118 0 00 478 3 25 23 119 2 67 597 5 34 24 119 3 102 716 8 45 27 116 19 655 832 27 130 28 120 22 733 952 49 206 30 120 40 1333 1072 89 332
July 1 115 36 1252 1187 125 421 4 122 30 983 1309 155 474 5 114 47 1649 1423 202 568 7 118 30 1016 1541 232 602 8 120 shy 24 800 1661 -$ 256 616
11 122 42 1377 1783 298 669 12 120 29 967 1903 327 687 14 116 37 1276 2019 364 721 15 118 40 1356 2137 404 756 18 121 60 1976 2258 464 822 19 119 30 740 2377 494 831 21 125 61 1952 2502 555 887 22 118 25 847 2627 580 883 25 122 16 525 2749 596 867 26 116 15 517 2865 611 853 28 122 28 918 2987 639 856 29 117 11 376 3104 650 838
August 1 120 7 233 3224 657 815 2 119 9 303 3345 666 796 4 120 3 100 3465 669 772 5 118 5 170 3583 674 752 8 114 7 245 3697 681 734
11 123 7 337 3 82 0 688 720 15 118 2 68 3938 690 701 16 113 5 177 4051 695 686 18 98 3 122 4149 698 673 19 119 1 34 4268 699 655 22 112 0 00 4380 699 638 23 115 0 00 4495 699 622 25 120 2 66 4615 701 606 26 112 1 36 4727 702 594 29 116 0 00 4843 702 580 30 11 5 0 00 4958 702 566
Sept 1 115 0 00 5079 702 553 2 112 0 00 5191 702 541
----shy5079 702
50
-----------------------------------------------------------------
------------------------------------------------------------------
TABLE 5D Unalakleet River Test Net Data Chum Salmon in 5 78 Mesh 1983
Cum Cum Cum Date Hours Catch CPUE Hours Catch CPUE
June 5 73 0 00 73 0 00 7 126 0 00 199 0 00 8 127 0 00 326 0 bull 0 0
10 11 4 3 105 440 3 27 12 113 2 71 553 5 36 14 119 1 34 672 6 36 15 116 4 138 788 10 51 17 116 3 103 904 13 56 19 118 6 203 1022 19 74 21 118 0 00 1140 19 67 22 117 10 342 1257 29 92 24 116 3 103 1373 32 93 26 119 11 370 1492 43 115 28 11 8 6 203 1610 $ 49 122 29 115 13 452 1725 62 144
July 1 119 8 269 1844 70 152 3 119 17 571 1963 87 177 5 119 13 437 2082 100 192 6 12 0 17 567 2202 117 213 8 121 7 231 2323 124 214
10 11 4 18 632 2437 142 233 12 115 12 417 2552 154 241 13 116 37 1276 2668 191 286 15 117 16 547 2785 207 297 17 11 8 31 1051 290 3 238 328 19 118 18 610 3021 256 339 20 115 29 1009 3136 285 364 22 122 17 557 3258 302 371 24 115 24 835 3373 326 387 26 120 19 633 3493 345 395 27 117 11 376 3610 356 394 29 117 14 479 3727 370 397 31 116 18 621 3843 388 404
August 2 121 9 298 3964 397 401 3 122 17 557 4086 414 405 5 11 8 8 271 4204 422 402 7 128 19 594 4332 441 407 9 257 10 156 4589 451 393
10 125 14 448 4714 464 394 12 13 1 308 4727 465 393 14 107 5 187 4834 470 389 16 122 4 131 4956 474 383 17 123 15 488 5079 489 385 19 118 8 271 5197 497 383 21 112 3 107 5309 500 378 23 120 6 200 5429 506 373 24 115 7 243 5544 513 370
51
-----------------------------------------------------------------------
TABLE 5D Unalakleet River Test Net Data Chum Salmon in 5 78 Mesh 1983 (Continued)
Cum Cum Cum Date Hours Catch CPUE Hours Catch CPUE
August 26 115 5 174 5657 518 366 28 119 1 34 577 6 519 359 30 119 4 134 5895 523 355 31 117 0 00 6012 523 3 48
Sept 2 123 3 98 613 5 526 343 4 479 2 17 6614 528 319 6 238 1 17 6852 529 309 7 237 0 00 7089 529 298 8 9
238 242
1 2
17
33 7327 7569
clt
530 532
289 281
10 242 3 50 7811 535 274 11 242 0 00 8053 535 266 12 241 2 33 8294 537 259 14 227 3 53 8521 540 253 15 242 0 00 8763 540 246 16 210 1 19 8973 541 241 17 239 2 33 9212 543 236 18 230 0 00 9442 543 230 20 489 0 00 9931 543 219 21 240 2 33 10171 545 214 22 242 0 0 10413 545 209 23 234 0 00 10647 545 205
----shy
10647 545
52
------------------------------------------------------------------------
------
TABLE 6A Unalakleet River Sonar Site Drift Sets5 1 4n Me sh 19 83 bull
Date Time Result
July 19 1405-1413 1 burbot July 23 1040-1055 1 pink caracass July 27 1520-1530 1 coho August 3 1444-1501 4 coho August 22 1930-1937 0 August 23 937-943 1 coho 1 pink carcass August 26 1117-1127 1 coho 3 churn August 31 1018-1034 3 churn
TABLE 6B Unalakleet River Sonar Site Beach Seines 1983
Date Time Distance Result
July 20 1445 120 meters 4 pink 1 churn 13 Dolly Varden 1 whitefish
July 25 1500 120 meters 6 pink 1 churn 1 Dolly Varden 4 whitefish 1 grayling
July 28 1700 120 meters 4 coho 2 pink 2 churn 1 Dolly Varden
August 1 2010 300 meters 4 pink 3 churn 8 Dolly Varden
August 4 1015 130 meters 5 coho 3 pink 3 churn 65 Dolly Varden 3 whitefish 3 grayling
August 24 1110 130 meters 18 coho 2 Dolly Varden 2 grayling
August 29 1715 120 meters 11 coho 1 pink 69 churn 1 Dolly Varden 2 grayling
Seine done at mile 12 Unalakleet River
53
--------------------------------------------------------------------------------------------------
--------------------------------------------------------------------------------------------------
TABLE 7 AGE SEX AND SIZE COMPOSITION OF NORTON SOUND KING SALMON UNALAKLEET RIVER CATCH SAMPLE SPORT CATCH AND SPAWNING SURVEYS 1983
II
COMBINED 3-2 4-2 4-3 NO LENGlH NO LENGlH NO LENGlH NO LENGlH
Male 31 646 6702 5 104 5010 8 167 5688 1 21 5900
Female 17 354 8540 o o 1 21 5450 o o
Total 48 1000 7353 5 104 5010 9 188 5661 1 21 5900
~ 11)
5-2 6-2 7-2 7-3 NO LENGlH NO LENGlH NO LENGlH NO LENGlH
Male 11 229 7382 6 125 8350 0 0 0 0
Female 2 42 7925 12 250 8742 1 21 10650 1 21 8350
Total 13 271 7465 18 375 8611 1 21 10650 1 21 8350
TABLE 8A AGE SEX AND SIZE COMPOSITION OF NORTON SOUND KING SALMON UNALAKLEET RIVER TEST NET SAMPLE 1983
-----~-------------------------------------------------------------------------------------------------------
gt
COMBINED 4-2 5-2 5-3 6-2 7-2 NO LENGIH NO LENGIH NO LENGIH NO LENGTH NO LENGTH NO LENGTr
8 14 n
Male 3 333 8107 0 1 111 5800 o 0 2 222 9260 0 0 Female 6 667 8295 0 0 1 111 7600 o o 4 444 8310 1 111 8930 Total 9 10 e 0 8232 0 o 2 222 6700 o o 6 667 8627 1 111 8930
If) If)
5 14 Male 19 1000 6298 12 632 5392 4 211 6990 0 o 3 158 8997 0 0 Female o 0 o o o o o o 0 0 0 0 Total 19 1000 6298 12 632 5392 4 211 6990 o o 3 158 8997 0 0
4 n or Smaller Male 6 667 5930 1 111 4660 2 222 6325 3 333 6090 0 o 0 o Female 3 333 8970 o o o o o o 3 333 8970 0 o Total 9 1000 6943 1 111 466 2 222 6325 3 33 3 6090 3 33 3 8970 0 0
TOTAL Hale 28 757 6413 13 351 5336 7 189 6630 3 8 1 6090 5 13 5 9102 o 0 Female 9 243 852 o o 1 27 7600 o o 7 189 8593 1 2 7 8930 Total 37 1000 6925 13 351 5336 8 216 6751 3 8 1 6090 12 324 88 e 5 1 2 7 8930
---------------------------------------------------------------------------------------------------------
---------------------------------------------------------------------------------------------------------
TABLE 8B AGE SEX AND SIZE COMPOSITION OF NORTON SOUND COHO SALMON UNALAKLEET RIVER TEST NET SAMPLE 5 14 AND 5 78 GEAR 1983
COMBINED 3-2 4-3 4-4 5-4 NO LENGIH NO LENGIH NO LENGTH NO LENGIH NO LENGTH
Male 9 900 5489 0 0 9 900 5489 0 0 Female 1 10 bull 0 552 QJ QJ 0 1 10QJ 5520 0 0 Total 10 1000 5492 0 0 10 1000 5492 0 0 725-731
bull LI)Male 15 938 5645 15 938 5645 Female 1 62 575 QJ 1 62 575 QJ Total 16 lQJ0QJ 5651 16 100QJ 5651 81-87
Male 24 545 5668 23 523 5768 1 23 3350 Female 20 455 5631 20 455 5631 0 0 Total 441QJ0QJ 5651 43 977 57 QJ 4 1 23 335 QJ 88-814
Male 7 500 5797 7 500 5797 QJ 0 Female 7 500 5596 6 429 5587 1 71 5650 Total 14 1000 5696 13 929 1 71 5650570 815-821
Male 5 455 5492 5 455 5492 Female 6 545 5552 6 545 5552 Total 11 lQJ00 5525 11 100QJ 5525 822-828
----------------- --------- ----------- ----------------------------------------- ------- -------------------
----- ----------------- - - ---- -------------------------------------------------------- --- -----------------
----------- - - --------------------------------------------- -------------------------------- - - ------------
TABLE 8B AGE SEX AND SIZE COMPOSITION OF NORTON SOUND COHO SALMON UNALAKLEET RIVER TEST NET SAMPLES 14 and 5 78 GEAR 1983 (CONTINUED)
COMBINED 3-2 4-3 4-4 5-4 NO LENGlH NO LENGlH NO LENGlH NO LENGlH NO LENGTH
------------------~------------------------------------------------------------------------------------- Male 10 455 5654 o o 10 455 5654 o o o o Female 12 545 5720 o o 12 545 5720 o o o Total 22 1000 5690 o o 22 1000 5690 o o o 829-94 Male 9 290 5723 9 290 5723 Female 22 710 5704 22 710 5704 Total 31 1000 5709 31 1000 5709 95-911
tI)Male 15 536 5887 15 536 5887 r-
Female 13 464 5855 13 464 5855 Total 28 1000 5872 28 1000 5872 912-918
Male 4 500 5935 1 125 6320 2 250 5735 1 125 5950 Female 4 500 5510 o o 4 500 5510 o o Total 8 1000 5722 1 125 6320 6 750 5585 1 125 5950 919-925
TOTALS Male Female Total
98 533 86 467
184 1000
5696 5682 5689
1 0 1
05 0
05
6320
6320
95 85
180
516 462 978
571 2 5682 5698
1 0 1
05 0
0 5
3350
3350
1 1 2
o 5 05 11
5950 5650 5800
4 OR SMALLER GEAR Male 72 758 Female 23 242 Total 95 1000
5727 557 5689
71 22 93
747 232 979
5741 5592 576
1 1 2
11 11 21
4750 5080 4915
--------------------------------------------------------------------------------------------------------
--------------------------------------------------------------------------------------------------------
--------------------------------------------------------------------------------------------------------
TABLE 8C AGE SEX AND SIZE COMPOSITION OF NORTON SOUND CHUM SAL~ION UNALAKLEET RIVER TEST NET 5 14 and 5 78 GEAR 1983
COMBINED 3-1 4-1 5-1 6-1 NO L ENGIH NO LENGIH NO L ENGIH NO L ENGIH NO L ENGIH
~1ale 0 0 0 0 0 0 0 0 0 0 Female 5 1000 5828 0 0 0 0 5 1000 5828 0 0 Total 5 1000 5828 0 0 0 0 5 1000 5828 0 0 610-612
Male 8 571 6108 0 0 2 143 5780 6 429 621 7 0 0 Female 6 429 5810 0 0 0 0 6 429 581 0 0 0 Total 14 1000 5981 0 0 2 143 5780 12 857 601 4 0 0 613-619 00
tr1
Male 8 333 6102 2 8 3 6325 6 250 6028 Female 16 667 5890 1 42 5520 15 625 5915 Total 24 1000 5961 3 125 6057 21 875 5947 620-626
Male 19 422 5911 7 156 6067 12 267 5820 Female 26 578 5843 10 222 5731 16 356 5912 Total 45 1000 5871 17 378 5869 28 622 5873 627-73
Male 17 362 6146 8 170 6081 9 191 620 4 Female 30 638 5750 17 362 5646 13 277 5885 Total 47 10QJQJ 5893 25 532 5785 22 468 6015 74-710
TABLE 8C AGE SEX AND SIZE COMPOSITION OF NORTON SOUND CHUM SALMON UNALAKLEET RIVER TEST NET 5 14 n and 5 78 n GEAR 1983 (CONTINUED)
COMBINED 3-1 4-1 5-1 6-1 NO L ENGlH NO L ENGlH NO L ENGlH ID LENGTH NO LENGTH
----------------------------------------~~-----------------------------------------------------------
Male 32 314 Female 7~ 686 Total 1~2 1~0~ 711-717
5898 5718
h775
16 43 59
157 422 578
5791 5666 5700
16 27 43
157 265 422
6005 5801 5877
Male Female Total 718-724
Male Female Total
33 384 53 616 86 H~00
19 306 43 694 62 1000
5951 5690 57 9~
6013 5760 5837
o 1 1
~
16 16
5200 5200
23 34 57
12 31 43
267 395 663
194 500 694
5833 5624 5709
5872 5682 5735
10 19 29
7 10 17
116 221 337
113 161 274
6222 5807 5950
6254 6021 6117
o 1 1
o 16 1 6
6120 6120
01 LI)
725-731
Male Female Total 81-87
11 212 41 788 52 1000
5904 5592 5658
1 3 4
19 58 77
5350 5380 5372
8 34 42
154 654 808
5799 5612 5648
2 4 6
38 77
115
6600 5582 5922
Male Female Total 88-814
7 269 19 731 26 1000
6003 5682 5768
o 1 1
~ 3 8 3 8
5400 5400
5 15 20
192 577 769
5946 5699 5761
2 3 5
77 115 192
6145 5690 5872
Male Female Total 815-821
14 467 16 533 30 1000
5948 5683 5806
1 1 2
33 3 3 67
521 0 5460 5335
12 10 22
400 333 733
5963 5697 5842
1 5 6
3 3 167 200
6500 5700 5833
Male Female Total
6 16
273 727
10~0
6022 5668 5765
middot o 1 1
o 4 5 4 5
5130 5130
5 12 17
227 545
3
5918 5646 5726
1 3 4
4 5 136 182
6540 5937 6088
822-82
------------------------------------------------------------------------------------------------------
------------------------------------------------------------------------------------------------------
------------------------------------------------------------------------------------------------------
------------------------------------------------------------------------------------------------------
------------------------------------------------------------------------------------------------------
TABLE 8C AGE SEX AND SIZE COMPOSITION OF NORTON SOUND CHUM SALl-lON UNALAKLEET RIVER TEST NET 5 14 and 5 78 GEAR 1983 (CONTINUED)
COMBINED 3-1 --- 4-1 5-1 6-1 NO LENGlH 00 LENGlH NO LENGlH NO LENGIH 00 LENGIH
Male 2 182 - 5650 2 182 5650 0 0 Female 9 818 5541 8 727 5571 1 9 1 5300II~-
Total 11 1000 5561 10 909 5587 1 9 1 5300 829-94
Male 0 0 0 0 Female 7 1000 gt5794 6 857 5735 1 143 6150 Total 7 1000 5794 6 857 5735 1 143 6150 95-911
Male 1 100 5720 0 0 1 100 5720 0 0 Female 9 900 5661 1 100 5460 7 700 5610 1 100 6220
0Total 10 1000 5667 1 100 5460 8 800 5624 1 100 6220 0
912-918
TOTALS
l-1a1e 177 326 5973 2 04 5280 103 190 5892 72 133 6108 0 0 Female 366 674 5717 8 15 5349 228 420 5654 129 238 5848 1 o 2 6120 Total 543 100 580 10 18 5335 331 61 5728 201 370 5941 1 o 2 6120
TOTAL 8 14 GEAR
~~a1e Female Total
20 870 3 13
23 1000
6537 5440 6394
9 2
11
391 87
478
6519 5550 6343
11 1
12
478 43
522
6551 5220 6440
TOTAL 4 GEAR AND VARIABLE MESH SMALLER THAN 4
l-1ale Female Total
60 583 43 417
103 1000
6146 5630 5985
32 27 59
311 262 573
6040 5503 5794
28 16 44
272 155 427
6268 5843 611 4
-------------------------------------------------------------------------------------------------------
-------------------------------------------------------------------------------------------------------
TABLE 9A AGE SEX AND SIZE COMPOSITION OF NORTON SOUND KING SALMON UNALAKLEET COMMERCIAL CATCH SAMPLE 1983 bull
I~
SEXED COMBINED 3-2 4-2 5-2 6-2 SAMPLES NO LENGlH NO LENGlH NO LENGlH NO L ENGlH NO L ENGlH
Male 1 03 64 0 8098 1 06 5170 4 25 5365 4 4 27 3 77 3 4 54 335 8651
Female 58 360 8626 o o o o 9 56 8340 49 304 8678
Tota1 1 61 100 0 8288 1 o6 5170 4 255365 53 3297837 1036408664
M
Unsexed 293 1000 8166 1 03 5050 11 38 601 8 95 324 7708 186 635 854 4 ~
Total 454 1000 8209 2 o4 511 0 15 33 5844 148 326 7754 289 637 8587
-
TABLE 9B AGE SEX AND SIZE COMPOSITION OF NORTON SOUND SOCKEYE SALMON UNALAKLEET TEST NET SAMPLE 1983 5 78 5 14 4 AND VARIABLE MESH NETS bull
COMBINED 4-2 5-2 5-3 SEX NO LENGTH NO LENGTH NO LENGTH NO LENGTH________________________________________C_____________________________________________
Male 4 667 57e8 e e 3 5ee 5887 1 167 517e
Female 2 333 5335 1 167 518e 1 167 549e e e N 0
Total 6 10ee 5584 1 167 518e 4 667 5788 1 167 517e
--------------------------------------------------------------------------------------------
--------------------------------------------------------------------------------------------
TABLE 9C AGE SEX AND SIZE COMPOSITION OF NORTON SOUND COHO SALMON UNALAKLEET COMMERCIAL CATCH SAMPLE 1983
COMBINED 3-2 4-3 5-4 NO LENGTH NO LENGTH NO LENGTH NO LENGTH
Male 83 519 5630 4 25 5450 78 488 5637 1 06 5800
Female 77 481 5676 4 25 5662 72 450 5685 1 06 5100
Total 160 100 0 565 2 8 50 5556 1 50 93 bull 8 566 0 2 13 5450
C)
0
TABLE 9D AGE SEX AND SIZE COMPOSITION OF COMMERCIAL CATCH SAMPLE 1983
NORTON SOUND CHUM SALMON UNALAKLEET
COMBINED NO L ENGlH NO
3-1
L ENGlH NO 4-1
LENGTH NO 5-1
LENGTH NO 6-1
LENGTH
Male
Female
Total
159 48
171 52
328 1
598
591
594
3
3
9
09
563
563
84
15
189
256
32
576
62
570
584
70
66
136
213
21
415
593
625
609
2
o
2
06
o
06
62
620
t
r
----------------- ----------------- -----------------
------------------------------------------------------------------------
APPENDIX TABLE 1A Unalakleet River Test Net King Salmon Catches 1981-1983 8 14 Mesh
1981 1982 1983
Date Hrs Catch CPUE Hrs Catch CPUE Hrs Catch CPUE
May 27 21 0 0 00 28 482 0 00 29 30 240 0 00 31 246 2 41
June 1 237 0 00 2
~
256 0 00 3 585 0 00 4 5 160 0 00 6 120 1 42 7 24 2 28 24 00 8 24 1 14 125 0 00 9 24 3 42 122 0 00
10 24 2 28 24 1 21 11 24 4 55 24 3 62 117 0 00 12 24 1 14 24 0 00 126 0 00 13 24 3 42 24 0 00 117 1 43 14 24 3 42 24 2 42 15 24 2 28 24 1 21 118 0 00 16 24 7 96 11 6 1 43 17 24 1 14 24 1 21 18 24 2 28 240 0 00 19 24 2 28 24 0 00 121 0 00 20 24 5 69 24 1 21 116 0 00 21 24 2 28 12 0 00 22 24 1 14 118 1 42 23 24 1 14 12 0 00 119 1 42 24 24 3 42 119 3 126 25 24 1 14 240 0 00 26 24 0 00 11 9 0 00 27 24 0 00 126 0 00 11 9 0 00 28 24 2 28 115 0 00 29 24 2 28 120 0 00 30 24 1 14 120 0 00 120 0 00
65
----------------- ----------------- -----------------------------------------------------------------------------------------
APPENDIX TABLE 1A Unalakleet River Test Net King Salmon Catches 1981-1983 8 14 Mesh (Continued)
1981 1982 1983
Date Hrs Catch CPUE Hrs Catch CPUE Hrs Catch CPUE
July 1 24 4 55 135 0 00 2 24 2 28 238 0 00 3 24 1 14 11 8 0 00 4 24 0 00 110 0 00 118 1 42 5 24 0 00 120 0 00 6 24 1 14 122 0 00 7 24 0 00 130 1 39 fS 116 0 00 8 24 1 14 140 0 00 9 24 1 14
10 24 0 00 126 0 00 11 24 0 00 120 3 125 119 0 00 12 24 0 00 118 0 00 13 24 1 14 11 6 0 00 14 24 0 00 122 0 00 119 2 84 15 24 0 00 122 0 00 16 24 0 00 17 24 0 00 122 0 00 18 24 0 00 11 2 0 bull 00 19 24 0 00 119 0 00 20 24 0 00 120 0 00 119 0 00 21 24 0 00 11 2 0 00 22 24 0 00 115 0 00 23 24 0 00 52 0 00
Mesh changed to 5 78
66
-------------------------------------------------------------------
Appendix Table lB Unalakleet River Test Net King Salmon Catches 1982-1983 5 Gear
1982 (5 78 mesh Z~fm) 1983 (5 14 mesh 25 fm) Hrs Catch CPUE Hrs Catch CPUE
June 5 73 til 0 6 7 126 1 32 8 9 127 1 31
1~ 114 0 0 11 12 113 2 71 13 14 119 2 67 15 116 1 34 16 24 1 21 17 116 2 69 18 24 5 104 19 118 0 0 20 12 4 167 21 118 1 34 22 12 2 83 117 1 34 23 12 2 83 24 116 0 0 25 119 1 42 26 119 2 67 27 121 2 84 28 118 1 34 29 122 1 41 115 2 70 30 135 2 74
July 1 119 1 34 2 120 2 83 3 119 1 34 4 135 0 0 5 119 0 0 6 120 0 0 120 0 0 7 55 0 0 8 121 0 0 9 90 0 0
10 114 0 0 11 65 0 0 12 115 0 0 13 122 1 41 116 1 34 14 90 0 0
117 til til
67
------------------------------------------------------------------------
----------------- ----------------- -------------------
APPENDIX TABLE 1C Unalakleet River Test Net Coho Salmon Catches 1981-1983 5 78 Mesh
1981 1982 1983
Date Hrs Catch CPUE Hrs Catch CPUE Hrs Catch CPUE -------------shy ---------------------------------------------------------shy
July 18 120 0 00 19 120 0 00 20 21 118 0 00 22 245 0 00 23 24 115 0 00 25 126 4 158 26 25 0 00 120 0 00 27 28 24 1 42
117 0 00
29 24 1 42 46 00 117 4 137 30 24 2 83 31 24 2 83 116 3 1 03
Aug 1 24 1 42 30 9 1500 2 24 0 00 44 3 341 122 0 00 3 24 1 42 122 2 66 4 24 0 00 132 8 304 5 24 0 00 73 6 649 118 1 34 6 24 0 00 7 24 1 42 128 14 437 8 24 0 00 126 9 357 9 24 3 125 129 0 00 257 14 218
10 24 1 42 125 21 672 11 24 0 00 122 8 328 12 24 1 42 125 17 680 13 0 00 13 24 1 42 14 24 5 63 107 12 449 15 24 17 212 123 18 732 16 24 36 450 122 5 205 122 2 66 17 24 27 337 123 6 196 18 24 21 262 120 5 208 19 24 20 250 122 1 41 118 1 34 20 24 10 125 21 24 17 212 112 6 2 14 22 24 10 125 122 6 246 23 24 13 162 118 2 84 120 3 100 24 24 2 25 115 2 70 25 24 5 62 121 3 124
68
------------------------------------------------------------------------
----------------- ----------------- ------------------
------------------------------------------------------------------------
APPENDIX TABLE 1C Unalakleet River Test Net Coho Catches 1981-1983 5 78 Mesh (Continued)
1981 1982 1983
Date Hrs Catch CPUE Hrs Catch CPUE Hrs Catch CPUE
Aug 26 27
24 24
13 5
162 62
12 0 0 115 5 174
28 24 4 5 119 0 29 24 1 12 125 11 440 30 24 Iil Iillil 113 5 221 119 4 134 31 24 3 38 117 1 34
Sept 1 2
24 24
2 1
25
12 122 115
6 2
246 87 ~ 123 5 33
3 24 2 25
4 24 1 12 479 15 125 5 24 2 83 116 8 3fil1 6 24 2 83 98 3 153 238 6 1 fill 7 24 1 42 237 5 bull 84 8 24 2 83 118 fil fil0 238 6 1 fill 9 24 2 83 242 10 165
1fil 24 3 125 285 13 228 242 3 50 11 24 1 42 235 14 298 242 2 33 12 24 1 42 256 8 156 241 8 133 13 24 2 83 256 5 98 14 24 fil filfil 213 6 141 227 14 247 15 24 Iil Iilfil 267 7 131 242 9 149 16 24 1 42 222 5 113 21fil 3 57 17 24 0 fil0 248 10 2fil2 239 2 33 18 24 fil 00 221 15 339 230 2 35 19 24 fil0 3fil2 4 67 20 24 1 42 191 fil filfil 489 4 33 21 262 fil 76 24 fil 3 50 22 276 6 1fil9 242 0 bull filfil 23 2fil2 2 50 234 1 17 24 238 1 21
Mesh size = 5 14 from July 24 to August 10
69
-----------------------------------------------------------------------
----------------- ----------------- -----------------
-----------------------------------------------------------------------
APPENDIX TABLE ID Unalakleet River Test Net Pink Salmon Catches 1981-1983 4 Mesh
1981 1982 1983
Date Hrs Catch CPUE Hrs Catch CPUE Hrs Catch CPUE
June 16 24 0 00 122 1 33 17 24 0 00 118 0 00 18 24 1 14 19 24 0 00 20 24 0 00 120 2 67 21 24 1 14 120 87 2900 118 0 00 22 24 0 00 120 40 1667 23 24 2 28 119 2 67 24 24 1 14 120 147 4900 119 3 102 25 26
24 24
~ 5
28
69 115 126 4382 t
27 24 3 41 116 19 655 28 24 2 28 125 222 7104 120 22 733 29 24 3 41 70 116 6628 30 24 2 28 120 40 1333
July 1 24 2 28 90 134 5956 115 36 1252 2 24 5 69 U~ 5 184 7010 3 24 6 82 4 24 12 165 122 30 983 5 24 4 55 95 387 16294 114 47 1649 6 24 4 55 30 75 10000 7 24 8 110 118 30 1016 8 24 19 261 22 86 15636 120 24 800 9 24 8 110 30 144 19200
10 24 11 151 11 24 15 206 122 42 1377 12 24 17 234 21 112 21333 120 29 967 13 24 10 138 35 110 12571 14 24 7 96 116 37 1276 15 24 8 110 20 52 10400 118 40 1356 16 24 10 138 15 61 16267 17 24 20 275 18 24 20 275 15 35 9333 121 60 1976 19 24 23 958 119 30 740 20 24 15 627 16 59 14750 21 24 51 21 25 16 61 15250 125 61 1952 22 24 55 2297 118 25 847 23 24 28 11 67 24 43 7167 24 24 17 708 25 24 22 917 11 43 15636 122 16 5 25 26 24 14 583 116 15 517 27 24 12 500 6 21 35000 28 24 5 208 24 100 16667 122 28 9 18 29 24 9 375 117 11 376 30 24 8 333 14 9 2571
middot 31 24 10 417 70
-----------------------------------------------------------------------
----------------- ----------------- -----------------
-----------------------------------------------------------------------
APPENDIX TABLE 1D Unalakleet River Test Net Pink Salmon Catches 1981-1983 4 Mesh (Continued)
1981 1982 1983
Date Hrs Catch CPUE Hrs Catch CPUE Hrs Catch CPUE
August 1 2
24 24
4 4
167 167
35 6 686 12 QJ 11 9
7 9
233 3 03
3 24 6 250 18 18 4000 4 24 4 167 47 34 2894 120 3 100 5 24 2 83 118 5 1 70 6 24 10 417 12 0 00 7 24 12 500 8 24 1 42 45 2 178 114 7 245 9 24 1 42
10 11 12
24 24 24
2 f 3
83
83 125
28 37
0 0
bull 00 bull QJ0
~
123 7 337
13 24 0 bull 00 16 0 bull 00 14 24 0 00 15 24 1 42 39 3 308 118 2 68 16 24 0 00 113 5 177 17 18 19
24 24 24
0 0 0
bull 00 00 00
16 55
0 0
bull 00 bull 00 98
11 9 3 1
122 34
20 24 0 00 13 0 bull 00 21 22 122 0 00 112 0 00 23 115 QJ 0QJ 24 120 0 QJQJ 25 119 QJ 00 120 2 66 26 11 2 1 36 27 126 QJ QJ0 28 29 30
116 QJ QJ0 116 115
0 QJ
QJQJ
QJQJ 31 106 1 38
Sept 1 2
122 0 0QJ 115 112
QJ QJ
QJQJ
QJ0 3 121 0 QJ0 4 5 122 QJ bull 00 6 7 126 1 32
Note 1981 mesh sizes = 8 14 from June 16 to July 17 5 78 from July 17 to August 20
71
-----------------------------------------------------------------------
----------------- ----------------- -----------------------------------------------------------------------------------------
APPENDIX TABLE IE Unalakleet River Test Net Chum Salmon Catches 1981-1983 5 78 Mesh
1981 1982 1983
Date Hrs Catch CPUE Hrs Catch CPUE Hrs Catch CPUE
June 5 73 0 00 6 7 126 0 00 8 127 0 00 9 24 0 00
10 24 10 138 114 3 105 11 24 4 55 12 24 10 138 113 2 71 13 24 2 28 14 24 0 00 119 1 34 15 16
24 24
3 5
41
69 24 8 167 $
116 4 138
17 24 3 41 116 3 103 18 24 21 289 24 9 188 19 24 18 247 118 6 203 20 24 14 193 12 12 416 21 24 7 96 118 0 00 22 24 6 82 12 8 334 117 10 3 42 23 44 41 564 12 2 84 24 24 2 28 116 3 1 03 25 24 4 55 119 3 123 26 24 5 69 119 11 370 27 24 4 55 121 23 951 28 24 9 124 - 118 6 2 03 29 24 9 124 122 11 451 115 13 4 52 30 24 4 55 135 13 481
July 1 24 14 193 119 8 2 69 2 16 16 220 1213 17 709 3 24 16 220 119 17 571 4 24 13 179 135 213 741 5 24 11 151 119 13 437 6 24 11 151 1213 4 1 67 120 17 567 7 24 9 124 55 12 1091 8 24 18 248 121 7 231 9 24 13 179 913 9 500
10 24 19 261 114 18 632 11 24 22 302 65 16 1231 12 24 14 192 115 12 417 13 24 10 138 122 8 330 116 37 1276 14 24 10 138 90 8 444 15 24 6 82 117 16 547 16 24 3 41 118 3 127 17 24 6 82 118 31 11351
72
---------------- ----- --- ---- -------------------- ------------ ------------
------------- - - --- ----------------- ---------- --------
---- ---------------------------------------------------- ---- ---- - ------
APPENDIX TABLE IE Unalakleet River Test Net Chum Salmon Catches 1981-1983 5 78 Mesh (Continued)
1981 1982 1983
Date Hrs Catch CPUE Hrs Catch CPUE Hrs Catch CPUE
middotJu1y 18 24 16 220 120 8 333 19 24 12 500 120 19 791 118 18 610 20 24 20 833 115 29 1009 21 24 16 667 11 8 8 339 22 24 4 167 245 28 571 122 17 557 23 24 7 292 24 24 12 500 115 24 835 25 24 11 458 126 23 910 26 24 20 833 25 3 500 120 19 633 27 24 21 875 117 11 376 28 24 14 583 29 30
24 24
37 22
1542 917
46 8 870 ~ 117 14 479
31 24 12 500 116 18 621 Aug 1 24 3 125 30 3 500
2 24 0 00 44 1 114 121 9 298 3 24 4 167 122 17 557 4 24 7 292 132 5 190 5 24 11 458 73 5 342 118 8 271 6 24 8 333 7 24 11 458 128 19 594 8 24 11 458 126 6 238 9 24 9 375 129 2 78 257 10 156
10 24 6 250 125 14 448 11 24 9 375 122 4 164 12 24 7 292 125 3 120 13 1 308 13 24 1 42 14 24 25 310 107 5 187 15 24 30 383 123 2 82 16 24 14 187 122 2 82 122 4 131 17 24 9 118 123 15 488 18 24 14 187 120 0 00 19 24 8 110 122 1 41 118 8 271 20 24 6 82 21 24 7 96 112 3 107 22 24 1 14 122 1 41 23 24 1 14 118 4 170 120 6 200 24 24 2 28 115 7 243 25 24 2 28 121 1 41 26 24 2 28 122 0 00 115 5 174 27 24 7 96 28 24 2 28 119 1 34 29 24 1 14 125 3 120 30 24 0 00 113 0 00 119 4 134 31 24 2 28 117 0 00
73
----------------- ----------------- ------------------
-----------------------------------------------------------------------
APPENDIX TABLE IE Unalakleet River Test Net Chum Salmon Catches 1981-1983 5 78 Mesh (Continued)
1981 1982 1983
Date Hrs Catch CPUE Hrs Catch CPUE Hrs Catch CPUE
Sept 1 24 2 28 122 0 00 2 24 0 00 115 0 00 123 3 98 3 24 0 00 4 24 0 00 479 2 17 5 24 1 42 116 0 ~ 00 6 24 1 42 98 0 00 238 1 17 7 24 2 84 237 0 00 8 24 2 84 118 3 127 ~
238 1 17 9 24 e 00 242 2 33
10 24 0 00 285 0 00 242 3 50 11 24 0 00 235 0 00 242 0 00 12 24 0 00 256 0 00 241 2 33 13 24 0 00 256 0 00 14 24 0 00 213 0 00 227 3 53 15 24 0 00 267 0 00 242 0 00 16 24 0 00 222 0 00 210 1 19 17 24 0 00 248 2 40 239 2 33 18 24 0 00 221 0 00 230 0 00 19 24 0 00 302 0 00 20 24 0 00 191 0 bull 00 489 0 00 21 262 1 19 240 2 33 22 276 1 18 242 0 00 23 202 0 00 234 0 00 24 238 0 00
Note 1981 Sizes - 8 14 from June 9 to July 17 5 78 from July 18 to September 20
1983 Sizes - 5 14 from June 5 to August 10 5 78 from August 11 to September 23
74
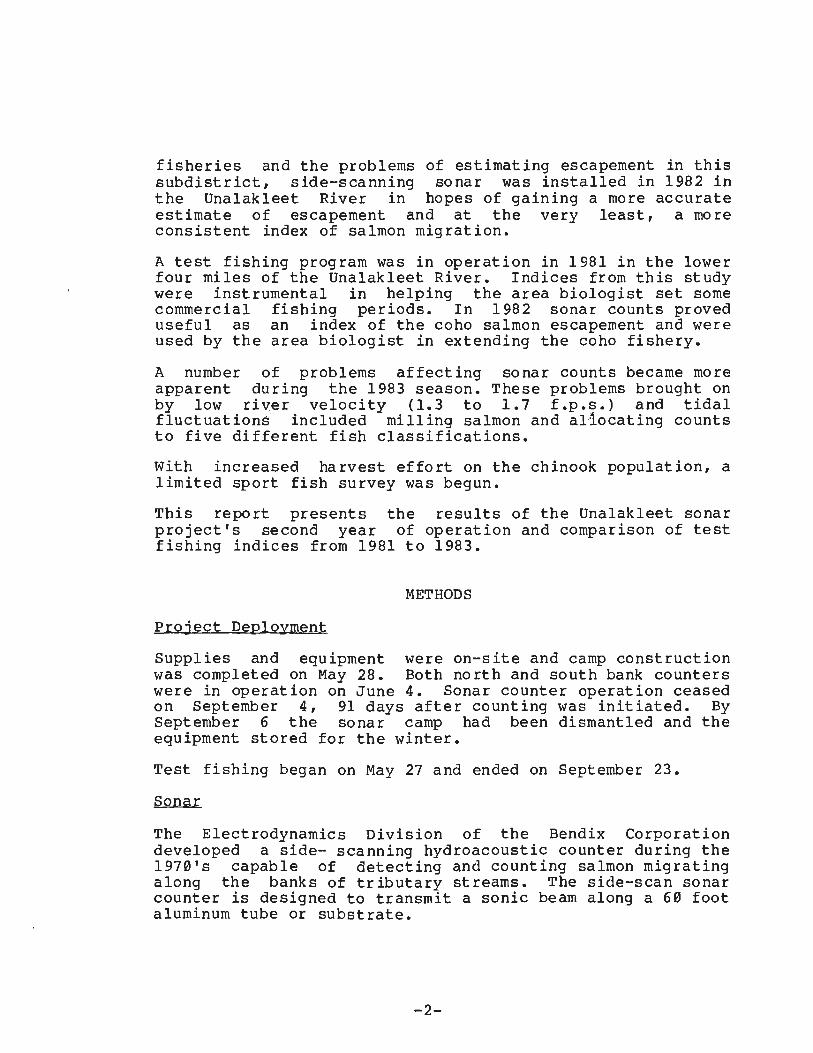
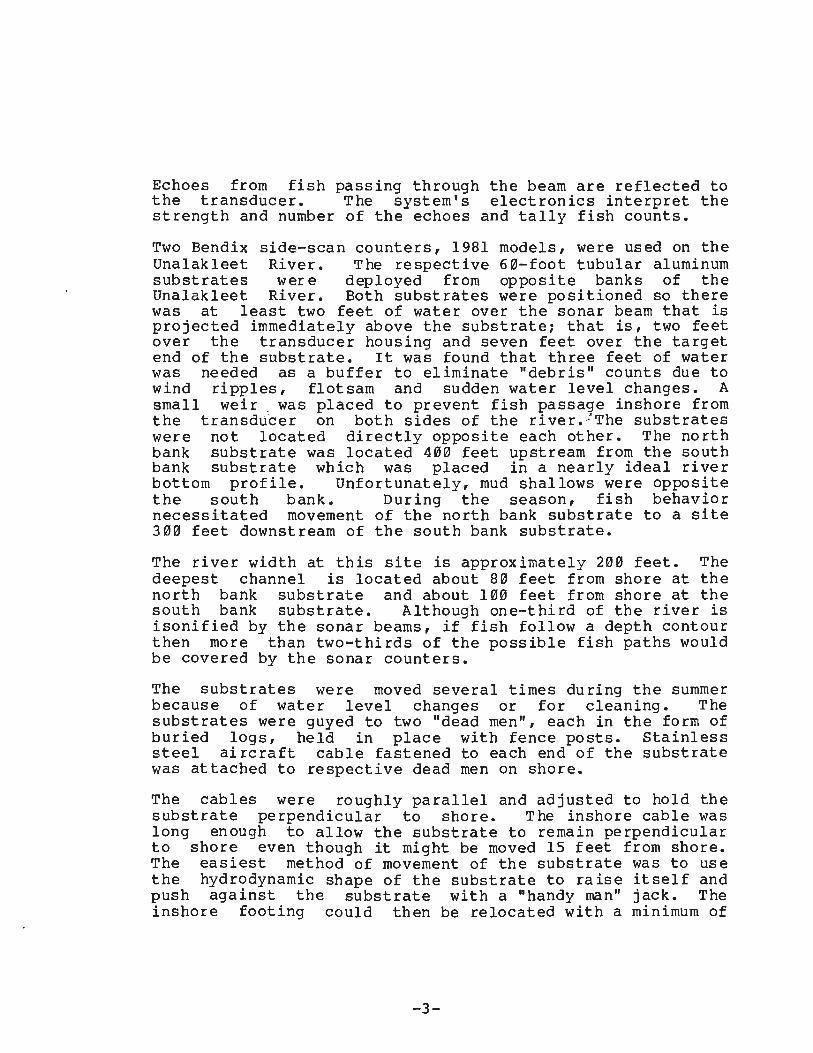
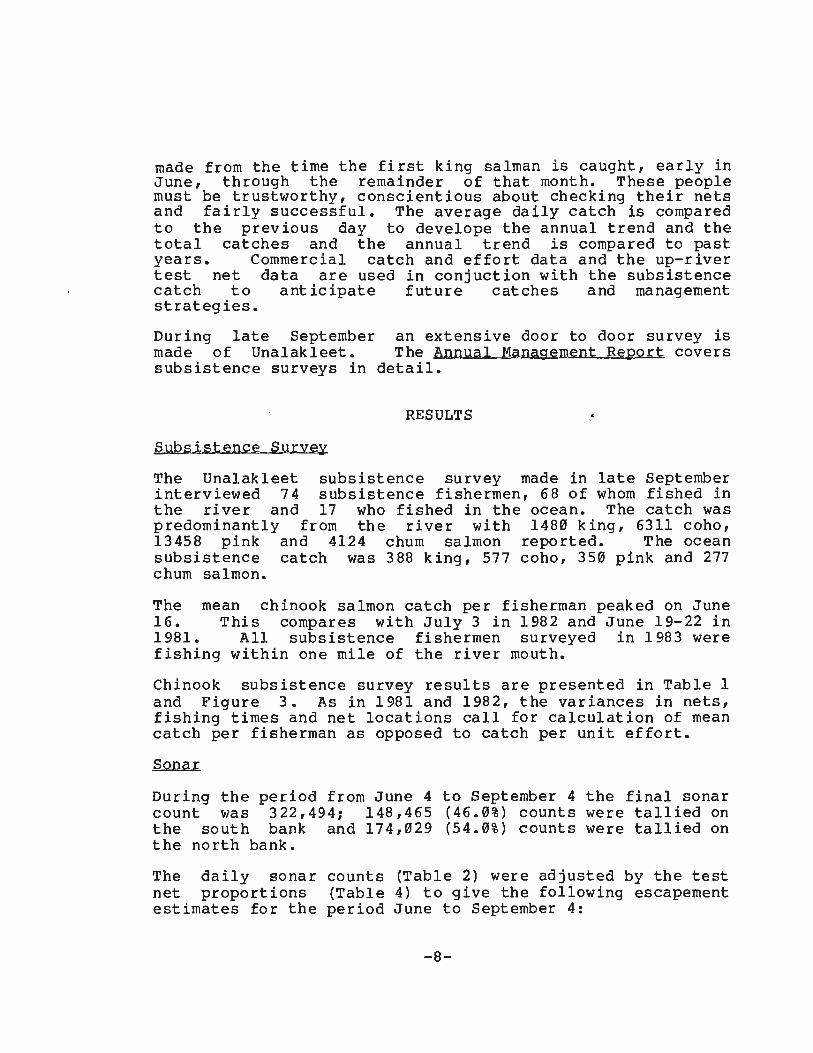
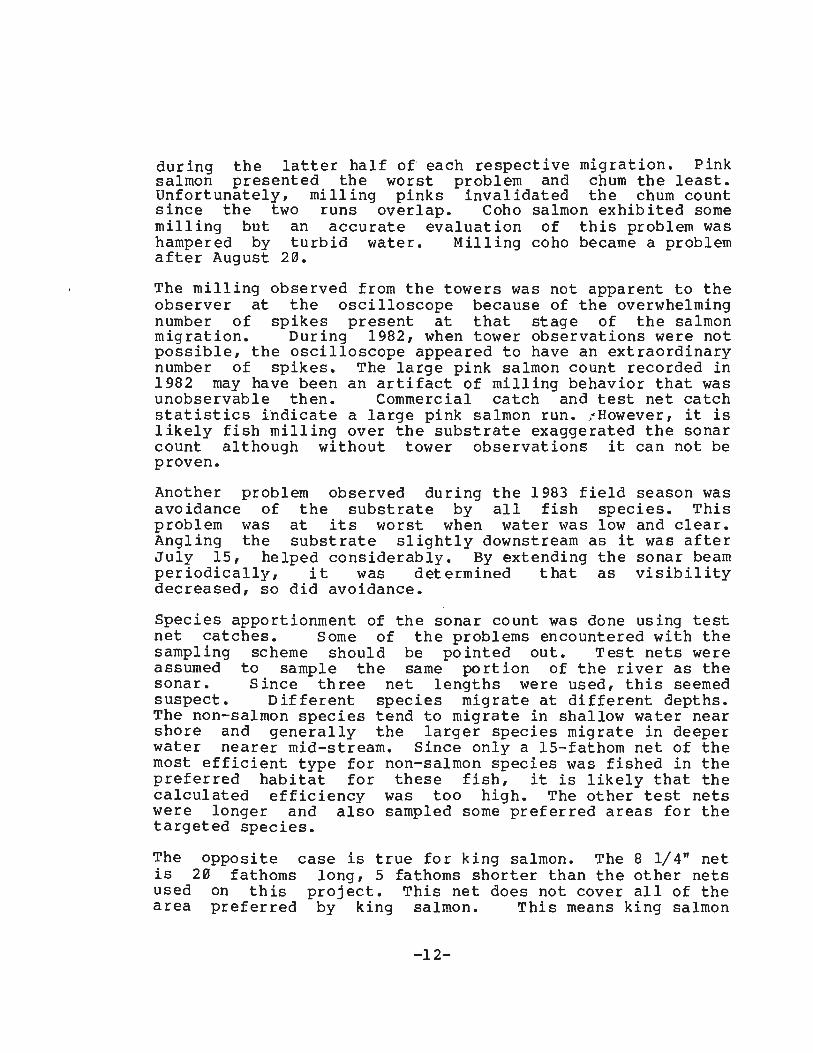
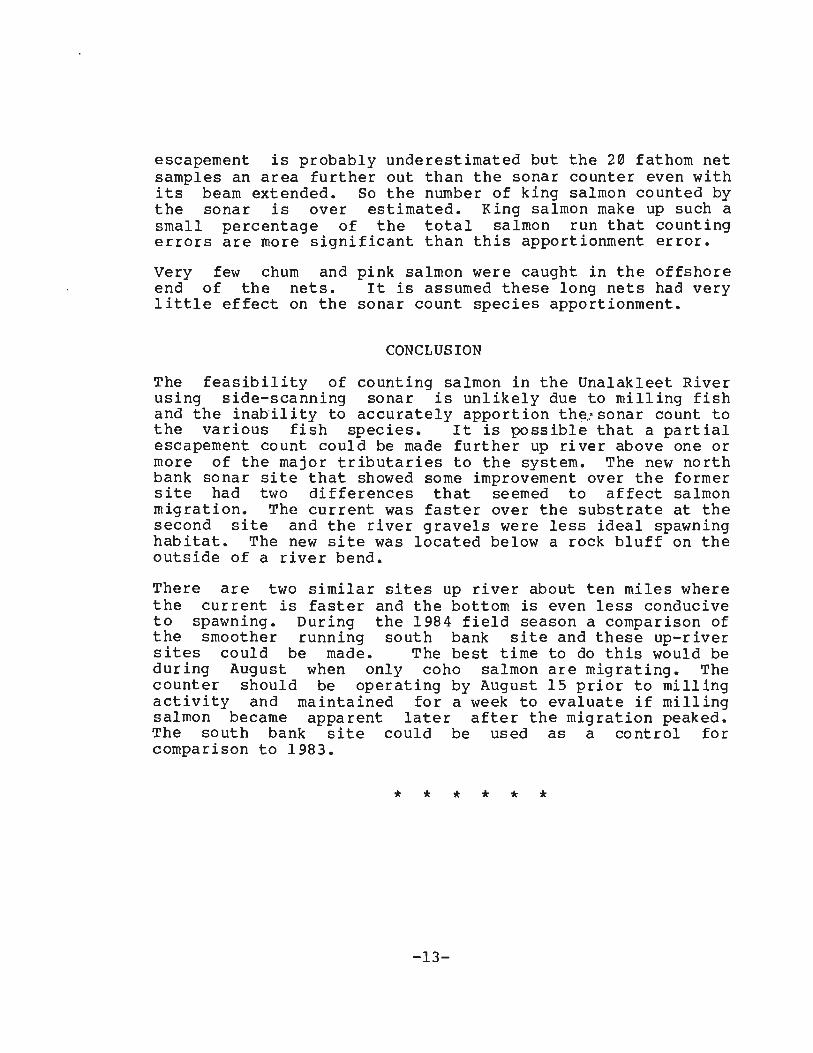
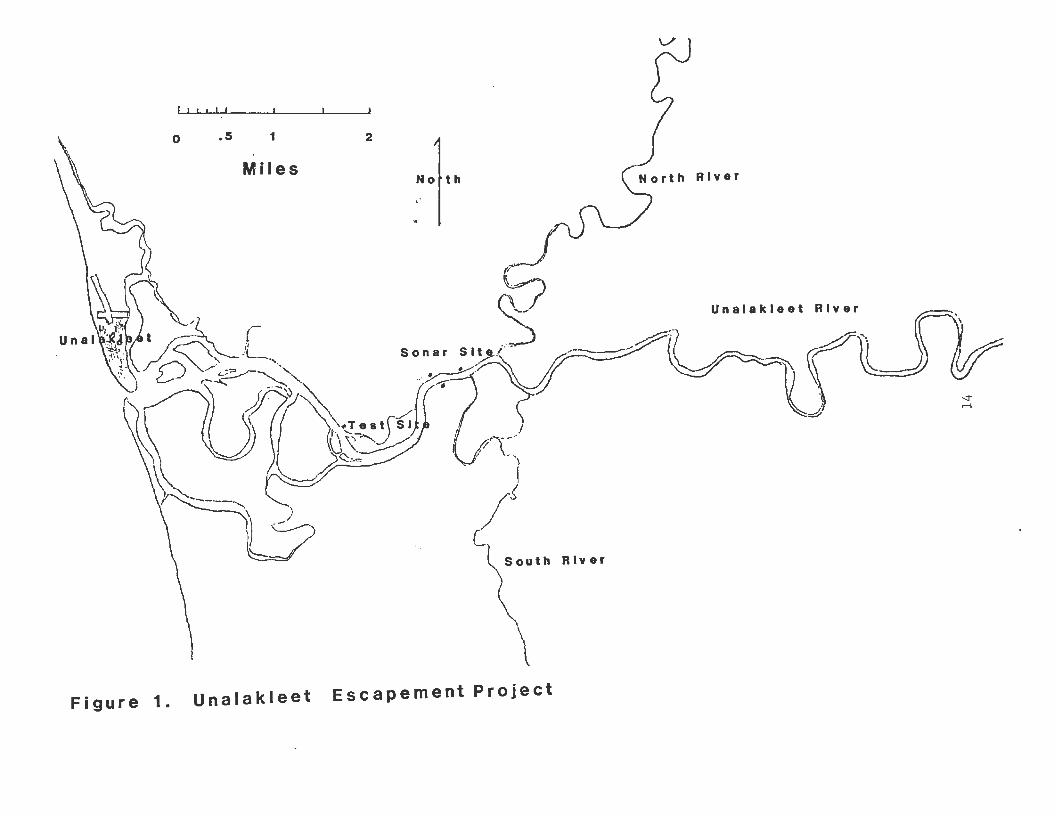
I I
5 1 2
Miles No tt h _
shy
R Iv er
Figure 1 Unalakleet Escapement Project
lt
Son sr
Fig u r e 2 S 0 0 a r Sit eSc hem a tic
ITower
Original Ninth Bank Sonar
Drift sets 5 minutes
Lf)
So t h Ban k Son a
lTower
o Work Tent
B Living Quarters
Figure 3Unalakleet Subsistence Survey 1983
Kin g- S a I m 0 n
1bull
10
9
c 8aI
-lE 11 t a til 7 ~ II 6 ~ U
5 til
0
c 4 til til
E 3 I
1 V
~ 2
1
27 1 5 10 15 20 25 30
~ June
Figure 4A Specie apportionment king salmon Un-alakleet sonar 1983
~
25
-l20
c 1 5 III () III
11
10
5
I
J
27 31 5 10 15 20 25 30 5 10 15 20 25 31
June Ju Iy
Figure 4B Specie middotapp~~tionment coho salmon Unalakleet sonar 1983
30
25
co ~
20
1 t~
C $
u 1 5 CD a
10
5
5 10 15 20 25 31 5 10 15 20 25 31 5
Ju August Sept e
Figure 4C Specie apportionment pink salmon Unalakleet sonar 1983
1 6
1 5
14
1 3
12
1 1
c II U CII
Ashy
10
9
a
7
01 ~
6
5
4
3
2
1
1 5 10 1 5
June
2 O 25 30 5 10 15 20
Ju Iy
25 31 5 10 15 20
August
25 31 5 10
Septem
Figure 40 Species apportionment chum salmon Unalakleet sonar 1983
16
1 5
1 4
13
1 2
1 1
10
9 c 8GI U
GI middot7 A
6
5
4
3
2
1
~
o N
~
1 5 10 15 20 25 30 5 10 15 20 25 3 1 5 10 15 20 25 31 5 10
June Ju Iy August Sept e
Figure 5 Specie apportionment Unalakleet sonar 1983
50
4
40
35
c J 30 0 U
~ 0 25 0 c Q)
u ~
Q) 20a
15
10
5
o L-_lt---__
King Coho Pink Chum Misc
21
----
Figure 6 Sector distribution of counts Unalakleet sonar1983
35
30
25
c 20 G)
() G) 15
0
10
5
35
30
25 c G)
() 20
G)
0 15
10
5
( s ()u t h ban k )
July 3-5
~-2 4 6 8 1 0 1 2 1 4 1 6shy
Sector
August 21-23
2 4 6 8 10 12 14 16
Sector
22
Figure 7 Hourly distribution of counts Unalakleet sonar 1983
(south bank)
14
12
10
c 8 GI U ~
6
July 3-5
~GI
I =~ Q
4
2 0
2 4 6 8 10 12 14 1 6 18 20 22 24
TIme
9
8
7
6
5 c GI U ~ 4 GI
Q
3
2
August 21-23
1
0
2 4 6 8 10 12 14
TIme
16
23
18 20 22 24
Figure 8 Unalakleet River Test Fishing Daily King CPUE in 8 14 mesh 1983
10
9 N
8 shy
7 I 0 c 6E
n
l J I I
0 0 5 c (J 4 co 0
3
2
1
I I
27 1 5 10 15 20 25 1 5 10 15 20 25 31
~ June July
Figure 9 Unalakleet River Test Fishing Cumulative King CPUE in 8 14 mesh 1983bull
~
middot10
09 U N
I 08 0 c 07E I ()
- 06 E-0 0 05 shy~ () 04 ca - ()
03E I 0 02
01
27 1 5 10 15 2Q 25 1 5 10 15 20 25 31
June July
Figure 10 Unalakleet River Test Fishing Daily Coho CPUE in 5 78 mesh 1983
1
6
5
I 0
NI II I 0 t
E 4
0 0 c 3() cu 0
2
1
1 5 10 15 20 25 1 5 10 15 20 25 1 5 10 15 20
July August Sept U
Figure 11 Unalakleet River Test Fishing Cumulative Coho CPUE in 5 78 mesh 1983
200
175
150
I 0 c 125E I ()
E
r-shy-0 I I N 0 100 c ()-as ()
75E I 0
50
25
1 5 10 15 20 25 1 5 10 15 20 25 1 5 10 15 20
July August Sel ber
20
Figure 12 Unalakleet River Test Fishing Daily Pink CPUE in 4 mesh 1983
18
I
0) N
II
16
I ishy
14 J 0 t 12shyE 0 10 0 shys 8 () as
0 6 1 I V 4
2
~ I
1 5 10 15 2Q 25 30 5 10 15 20 25 31 5 10 15 20 25 31 5
June July August Sept
--
Figure 13 Unalakleet River Test Fishing Cumulat ive Pink CPUE in 4 mesh 1983
10
9 01 N 8
J 0 J 7 E J 0 6 E- 50 ~
amp 4() ca
0 3 E J
0 2
1
1 5 10 15 20 25 30 5 10 15 20 25 31 5 10 15 20 25 31 5
June July August Sept
Figure 14 Unalakleet River Test Fishing Daily CPUE in 5 14 amp 5 78 mesh 1983
14
13shy
12
11
10
9 J 0 8
I z shy-E 7 0 0 shys ~u aI 0
4 I
31
2
1
II
0 C1)I 11
I I I II
bull y AA(net changed to 5 78
AA A 11 I
~ I~ V ~
- I
VI
1 5 10 15 20- 25 30 5 10 15 20 25 31 5 10 15 20 25 31 5 10 15 20
cJune July August
Figure 15 Unalakleet River Test Fishing Cumulative Chum CPUE in 5 14 amp 5 78 mesh 1983
It
5
--l C)
net changed to 5 78
~ 4 o
c E (J ~
3E o o c 2 u ~ -(J
E ~ (J 1
1 5 10 15 2Q 25 30 5 10 15 20 25 31 5 10 15 20 25 31 5 10 15 20
June July August s
Figure 16 Unalakleet River Test Fishing Catch Proportions 1983
60
55
---- King50
__ Coho 45
P--Q Pink
40 __ Chum
I LU 35J D I 0
30 ICQ 0 25 I
N Cl0 20
c G)
15u G)
D
10
5 A 1 I
I 4 I
I I
3 lt
~
2
I I1 - I bull I
I ~ ~ ~ t -J ~~ - _
r
1 5 10 15 20 25 30 5 10 15 20 25 31 5 10 15 20 25 31 5 10
June July August Sept
Figure 17 Unalakleet Area Temperatures 1983
18
16
14
12
til 10I
u-G) 80 CI) G) G) 6 C) G)
Q 4
2
C) C)
__ Air
0--0 River 2
0
-2
-4
---------~ ~
27 31 5 10 15 20 25 30 5 10 15 20 25 31 5 10 15 20 25 31 5 10 15 20
June July August 5e
4
Figure 18 Unalakleet River Turbidity and Depth 1983
__ Secchi Reading
-t ()
II) G)-G)
3
iE 2
1
27 31 5 10 15 20 25 30 5 10 15 20 25 31 5 10 15 20 25 31 5 10 15 20
June July August
~ 1 _ ~ r--- I shy I __ I 01 --shy
Figure 19 Unalakleet River Test Fishing Cumulative King CPUE in 8 14 mesh 1981-83
27 31 5
May
_1981
____ 1982
o 0 1983 11) C)
Changed to 5 78 mesh
I
t
~-~o-~ Q-O--Oolt)-(IQ-----l
--1
_10 15 20 25 30 5 10 15 20 25 31
June July
I I I
~
0 ~
r E ~
CJ shyE 0 0 I
shyr u-cu CJ
E ~
CJ
4
35
30
25
20
15
10
05
Figure 20 Unalakleet River Test Fishing Cumulative Chum CPUE in 5 78 mesh 1981-83
5
4 lI 0
z
E lI 0 3 E-0 0 2 r CJ-cu 0
E lI 1 0
__1981 ~~
~ ___1982
a 01983 5 148 mesh from 65-810
_----shy-- 0 - -- C1) A - _ - ~
~ I
I
II I I I I I
I I
1
~ -
-
1 5 10 15 20 25 30 5 10 15 20 25 31 5 10 15 20 25 31 5 10 15 20
June July August s
Figure 21 Unalakleet River Test Fishing Cumulative Pink CPUE in 4 mesh- 1981-83
8
70
60
50
40 0
r 30E
0 20E-0 0 10 s= u 8 tV 0 6E 0 4
2
__1981 ____ 1982
_1983
shy--- -- shy--- shy J - -
I
I
C1- J
I
-----l---l ~--~r---------------r--
1 5 10 15 20 25 30 5 10 15 20 25 31 5 10 15 20 25 31 5 10
June July August Sept
Figure 22 Unalakleet River Test Fishing Cumulative Coho CPUE in 5 78 mesh 1981-83
_1981
~ __ 1982
~1983
25
00I _ __ _ _ C)~ I __ _ I
I V o 20 rt I I
E I AshyI o E 15-o o z u 10 tU o E I o 5
I
1 5 10 15 20 25 31 5 10 15 20 25 31 5 10 15 20
July August 5
----------------------------------------------------------------
Table 1 Unalakleet River Subsistence King Salmon Index 1983
Number of Number of Date Fishermen Chinook Average
08 02 18 05 05 00 02 58 92 62 72 72 42 28 52 60 62 20 47 50 35 25 15
June 8 9
10 11 12 13 14 15 16 17 18 19 20 21 22 23 24 25 26 27 28 29 30
Totals
4 4 4 4 4 4 4 4 4 4 4 4 4 4 4 4 4 3 3 3 4 4 4
4
3 1 7 2 2 o 1
23 37 25 29 29 17 11 21 24 25
6 14 15 14 H~
6
322
~
39
---------------------- ---------- --------------------------------------
----------------------------------------------------------------------
TABLE 2 Unalakleet River Final Sonar Counts 1983
Daily Proportion Cumu1 Prop Date South North Total of Total Cumulative of Total
64 7 23 30 1313131 313 013131 65 44 187 231 00137 261 01308 66 12 162 174 01305 435 01313 67 8 283 291 1313139 726 01322 68 0000 726 13022 69 3 221 224 013137 950 13029 610 26 245 271 131308 1221 13037 611 56 254 310 131310 1531 131347 612 44 736 780 013 24 2311 13071 613 64 1188 1252 01339 3563 01113 614 59 1752 1811 0056 5374 0166 615 97 844 941 01329 6315 0195 616 165 729 894 0028 7209 0223 617 151 i 604 1755 0054 8964 middot 0277 618 i ll 1524 1635 0051 10599 13328 619 175 2000 2175 0067 12774 13395 620 171 21320 2191 0068 14965 0463 621 220 1613 1833 0057 16798 0520 622 199 2065 2264 0070 19062 0590 623 362 21334 2396 0074 21458 13664 624 876 3403 4279 13133 25737 0797 625 1244 2023 3267- 0101 29004 0898 626 738 1601 2339 0073 31343 0971 627 573 3265 3838 0119 35181 1090 628 547 1868 2415 0075 37596 1165 629 528 4028 4556 0141 42152 1306 630 430 430 0013 42582 1319 71 240 240 01307 42822 1326 72 201 975 1176 0036 43998 1362 73 309 8842 9151 0284 53149 1646 74 475 6385 6860 0213 60009 1859 75 565 3342 3907 0121 63916 1980 76 1377 2094 3471 0108 67387 2088 77 1416 3173 4589 0142 71976 2230 78 1472 1420 2892 0090 74868 2320 79 2071 1452 3523 01113 78391 2430 710 3318 2434 5752 0178 84143 2608 711 2673 2866 5539 13172 89682 2780 712 1665 1747 3412 13106 93094 2886 713 21317 1951 3968 13123 97062 3009 714 2991 2664 5655 0175 102717 3184 715 2646 2548 5194 13161 107911 3345 716 2488 2886 5374 0167 113285 3512 717 1585 4063 5648 0175 118933 3687 718 3559 9326 12885 0400 131818 4087 719 2948 2398 5346 13166 137164 4253 720 1640 3330 4970 0154 142134 4407 721 2416 6420 8836 0274 150970 4681 722 3298 3298 0102 154268 4783 723 5007 5007 0155 159275 4938
40
--------------------------------------------------------------------
--------------------------------------------------------------------
-----------------------------
TABLE 2 Unalakleet River Final Sonar Counts 1983 (Continued)
Daily Proportion Cum Prop Date South North Total of Total Cumu1at i ve of Total
724 4005 7804 11809 0366 171084 5304 725 2453 3392 5845 0181 176929 5485 726 2166 12094 14260 0442 191189 5927 727 1914 4472 6386 0198 197575 6125 728 1603 3463 5066 0157 202641 6282 729 1251 1914 3165 0098 205806 6380 730 1710 2495 4205 en30 210011 6510 731 2542 1887 4429 0137 214440 6647 81 4479 2271 6750 0209 221190 6856 82 1103 1806 2909 0091 224099 6947 83 1719 942 2661 0083 226760 bull 7030 84 1519 2557 4076 0126 230836 7156 85 1259 1113 2372 0074 233208 7230 86 940 2189 3129 0097 236337 7327 87 1467 4354 5821 0180 242158 7507 88 2318 1584 3902 0121 246060 7628 89 2098 1505 3603 0112 249663 7740 810 2629 1517 4146 bull 0129 253809 7869 811 3753 1091 4844 0150 258653 8019 812 1489 523 2012 0062 260665 8081 813 744 353 1097 0034 261762 8386 814 981 981 bull 0030 262743 8145 815 2324 2324 0072 265067 8217 816 2638 2638 0082 267705 8299 817 2073 731 2804 0087 270509 8115 818 2244 675 2919 0091 273428 8477 819 3240 696 3936 0122 277364 8599 820 2363 503 2866 0089 280230 8688 821 6789 1111 7900 0245 288130 8933 822 6489 563 7052 0219 295182 9152 823 5077 298 5375 0167 300557 9319 824 2616 298 2914 0090 303471 9409 825 3933 412 4345 0135 307816 9544 826 1393 554 1947 0060 309763 9604 827 1203 463 1666 0052 311429 9656 828 1197 542 1739 0054 313168 9710 829 1244 221 1465 0045 314633 9755 830 1011 199 1210 0038 315843 9793 831 718 214 932 0029 316775 9822 91 1324 318 1642 0052 318417 9874 92 1362 307 1669 0052 320086 9926 93 1146 314 1460 0045 321546 9971 94 652 296 948 bull 0029 322494 10000
148465 174029 322494 10000
41
----------------------------------------------------------------------
-------------------------------------------------------------------- --
------
TABLE 3A Unalakleet River Species Apportionment by Test Period King Salmon 1983
3-Day App Proportion of Cumulative Cumulative Dates Count Season Total Count Proportion
64-68 76 0272 76 0272
69-612N 28 0100 104 0372
612N-615 461 1652 565 2024
616-619N 419 1502 984 3526
619N-622 170 0609 1154 4135
623-626N 722 2588 1876 6723
626N-629 264 0946 2140 7669
630-73N 103 0639 2243 8038
73N-76 188 0674 2431 8712
77-710N 0 0000 2431 8712
710N-713 0 0000 2431 8712
714-717N 267 0957 2698 9969
717N-720 0 0000 2698 9669
721-724N 92 0331 2790 1 0000
724N-727 0 0000 2790 10000
728-731N 0 0000 2790 1 0000
731N-83 0 0000 2790 1 0000
2790 10000
42
Dates
714-717N
717N-720
721-724N
724N-727
728-731N
731N-83
84-87N
87N-810
811-814N
814N-817
818-821N
821N-824
825-828N
828N-831
91-94
TABLE 3B Unalakleet River Species Apportionment by Test Period Coho Salmon
3-Day Count
583
338
436
550
2650
1174
793
1435
5074
1280
435
2265
171H3
1983
Proportion of Season Total
0000
0000
0000
0343
0199
0256
0323
1558
0690
0466
0843
2983
0752
0256
1331
Cumulative Count
583
921
1357
1907
4557
5731
6524
7959
13033
14313
14748
17013
Cumulative Proportion
0000
0000
0000
0343
0542
0798
1121
2679
3369
3835
4678
7661
8413
8669
10000
43
------------------------------------------------------------------
------------------------------------------------------------------
----- ------
TABLE 3C Unalakleet River Species Apportionment by Test Period Pink Salmon 1983
3-Day P roport ion of Cumulative Cumulative Dates Count Season Total Count Proportion
64-68 0 0000
69-612N 0 0000
6l2N-615 0 0000
616-6l9N 97 0012
6l9N-622 332 0036
623-626N 1245 0136
626N-629 6624 0721
630-73N 3699 0403
73N-76 10762 1171
77-7l0N 7704 0838
710N-7l3 8529 0928
714-717N 9771 1063
717N-720 13845 1507
721-724N 11361 1236
724N-727 6544 0712
728-731N 3545 0386
731N-83 1628 0177
84-87N 1224 0133
87N-810 1777 0193
811-814N 802 0087
814N-817 561 0061
818-821N 533 0058
821N-824 8313 13091
825-828N 468 0051
828N-831 0 0000
91-94 0 0000
91881 10000
0 0000
0 0000
0 0000
97 0012
429 0048
1674 0184
8298 0905
11997 1308
22759 2479
30463 3317
38992 4245
48763 5308
62608 6815
73969 8051
80513 8763
84058 9149
85686 9326
86910 9459
88687 9652
89489 9739
90050 9800
90583 9858
91413 9949
91881 10000
91881 10000
91881 1 0000 44
------------------------------------------------------------------
------------ ------------------------------------------------------
----- ------
TABLE 3D Unalakleet River Species Apportionment by Test Period Chum Salmon 1983
3-Day Proportion of Cumulative Cumulative Dates Count Season Total Count Proportion
64-68 0 0000
69-612N 100 0017
612N-615 268 0046
616-619N 838 0144
619N-622 1180 0202
623-626N 2744 0471
626N-629 1569 0270
630-73N 796 0137
73N-76 2972 0510
77-710N 2068 0355
710N-713 2622 0450
714-717N 4133 0710
717N-720 5596 0960
721-724N 4978 0854
724N-727 8974 1540
728-731N 2241 0385
731N-83 2079 ~0357
84-87N 3009 0516
87N-810 2432 0417
811-814N 937 0161
814N-817 454 0078
818-821N 2584 0443
821N-824 2739 0470
825-828N 1783 0306
828N-831 765 0131
91-94 412 0070
58273 10000 45
0 0000
100 0017
368 0063
1206 0207
2386 0409
5130 0880
6699 1150
7495 1287 f
10467 1797
12535 2152
15157 2602
19290 3312
24886 4272
29864 5216
38838 6666
41079 7051
43158 7408
46167 7924
48559 8341
49536 8502
49990 8580
52574 9023
55313 9493
57096 9799
57861 9930
58273 1 0000
-------------------------------------------------------------
------------------------- ------------------------------------
TABLE 4 Unalakleet River Test Net Proportions by Sample Perio-d 1983 ( Selective CPUE)
Dates Chinook Coho Pink Chum Misc
64-68 105 00 00 895
69-612N 24 00 83 893
612N-615 1C~ 5 00 61 834
616-619N 78 18 156 748
619N-622 23 45 160 772
623-626N 65 112 247 576
626N-629 22 553 131 294
630-73N 16 576 124 284
73N-76 10 572 158 260
77-710N 00 555 149 296
710N-713 00 540 166 294
714-717N 14 00 513 217 256
717N-720 00 00 532 215 253
721-724N 04 00 493 216 287
724N-727 00 18 202 277 503
728-731N 00 23 242 153 582
731N-83 00 30 112 143 715
84-87N 44 98 241 617
87N-810 182 122 167 529
811-814N 139 95 111 655
814N-B17 96 68 55 7B1
B18-B21N 105 39 1B9 667
821N-824 263 43 142 552
825-B28N 145 53 202 600
828N-831 97 00 171 732
91-94 396 00 72 532
46
--------
--------
TABLE 4 Una1ak1et River Test Net Proportions 1983 ( Selective CPUE) (Continued)
Comparative Apportionment
Species Apportionment
Chinook 2790 Coho 17013 Pink 91881 Churn 58273
------shySubtotal 169957
Misc Species 152537 ------shy
Total 322494
Substrate Comparison -------------------shy
Bank Counts -----shy
South 148465 North 174029
------shy
Total 322494
Percent of Total Counts
09 53
285 181
5408
472
1000
Percent
460 540
1000
47
-------------------------------------------------------------------
TABLE 5A Unalakleet River Test Net Data King Salmon in 8 14 Mesh 1983
Cum Cum Cum Date Hours Catch CPUE Hours Catch CPUE
May 27 28
21 5 482
13 13
1313
1313 21 5 697
13 13
1313
1313 30 240 0 013 937 0 00 31 246 2 41 1183 2 08
June 1 237 0 00 1420 2 07 2 3
256 585
13 13
013 bull 13 13
1676 2 261
2 2
6bull 13 4
5 6 8
160 120 middot 125
13 1
13 42 130
2 421 2541 2666
~ 2 3 3
bull 13 4 136 136
9 122 0 130 2788 3 05 11 117 00 2905 3 05 12 126 13 00 3031 3 05 13 117 1 43 3148 4 06 15 118 0 013 3266 4 136 16 116 1 43 3382 5 138 18 240 13 130 3622 5 07 19 121 0 00 3743 5 07 20 116 0 00 3859 5 136 22 118 1 42 3977 6 138 23 119 1 42 4196 7 08 25 240 0 013 4336 7 138 26 119 13 1313 4455 7 138 27 119 13 1313 4574 7 138 29 1213 13 130 4694 7 137 313 1213 13 00 4814 7 07
July 2 238 0 1313 51352 7 07 3 118 13 013 51713 7 07 4 118 1 42 5288 8 138 6 122 0 00 5410 8 07 7 116 13 00 5526 8 07
10 126 0 1313 5652 8 07 11 119 0 013 5771 8 07 13 116 13 130 5887 8 07 14 119 2 84 6006 10 07 17 122 0 00 6128 10 07 18 112 0 1313 6240 10 136 20 119 13 00 6359 10 06 21 112 0 013 6471 10 06
6471 10
48
------------------------------------------------------------------
------------------------------------------------------------------
TABLE 5B Unalakleet River Test Net Data Coho Salmon in 5 78 Mesh 1983
Cum Cum Date Hours Catch CPUE Hours Catch CPUE
July 24 26
115 120 0 00
115 235
0 0
00
00 27 117 4 00 352 0 00 29 117 0 137 469 4 34 31 116 3 103 585 7 48
August 2 122 0 00 706 7 40 3 122 2 66 828 9 43 5 118 1 34 946 10 42 7 128 14 437 1074 24 89 9 257 14 218 1331 38 114
10 125 21 672 1456 59 162 12 13 middot- 0 00 1469 x 59 161 14 10 7 12 449 1576 71 180 16 122 2 66 1698 73 172 17 123 6 196 1821 79 174 19 118 1 34 1939 80 165 21 112 6 214 2051 86 168 23 120 3 100 217 1 89 164 24 115 2 70 2286 91 159 26 115 5 174 2401 96 160 28 119 0 00 2520 96 152 30 119 4 1 34 2639 100 152 31 117 1 34 2756 101 147
Sept 2 123 5 33 2879 106 147 4 479 15 125 3358 121 144 6 238 11 185 3596 132 147 7 237 5 84 3833 137 143 8 238 6 1 01 4071 143 141 9 242 10 1 65 4313 153 142
10 242 3 50 4555 156 137 11 242 2 33 4797 158 132 12 241 8 133 5038 166 132 14 227 14 247 5265 180 137 15 242 9 149 5507 189 137 16 210 3 57 5717 192 134 17 239 2 33 5956 194 130 18 230 2 35 6186 196 127 20 489 4 33 6675 200 120 21 24 3 50 6915 203 117 22 242 0 00 7157 203 113 23 234 1 17 7391 204 110
----shy
7391 204
Mesh size = 5 14 from 724 to 810
49
------------------------------------------------------------------
TABLE 5C Unalakleet River Test Net Data Pink Salmon in 4 Mesh 1983
Cum Cum Cum Date Hours Catch CPUE Hours Catch CPUE ------~-----------------------------------------------------------June 16 122 1 33 122 1 33
17 118 0 bull 0 0 240 1 17 20 120 2 67 360 3 33 21 118 0 00 478 3 25 23 119 2 67 597 5 34 24 119 3 102 716 8 45 27 116 19 655 832 27 130 28 120 22 733 952 49 206 30 120 40 1333 1072 89 332
July 1 115 36 1252 1187 125 421 4 122 30 983 1309 155 474 5 114 47 1649 1423 202 568 7 118 30 1016 1541 232 602 8 120 shy 24 800 1661 -$ 256 616
11 122 42 1377 1783 298 669 12 120 29 967 1903 327 687 14 116 37 1276 2019 364 721 15 118 40 1356 2137 404 756 18 121 60 1976 2258 464 822 19 119 30 740 2377 494 831 21 125 61 1952 2502 555 887 22 118 25 847 2627 580 883 25 122 16 525 2749 596 867 26 116 15 517 2865 611 853 28 122 28 918 2987 639 856 29 117 11 376 3104 650 838
August 1 120 7 233 3224 657 815 2 119 9 303 3345 666 796 4 120 3 100 3465 669 772 5 118 5 170 3583 674 752 8 114 7 245 3697 681 734
11 123 7 337 3 82 0 688 720 15 118 2 68 3938 690 701 16 113 5 177 4051 695 686 18 98 3 122 4149 698 673 19 119 1 34 4268 699 655 22 112 0 00 4380 699 638 23 115 0 00 4495 699 622 25 120 2 66 4615 701 606 26 112 1 36 4727 702 594 29 116 0 00 4843 702 580 30 11 5 0 00 4958 702 566
Sept 1 115 0 00 5079 702 553 2 112 0 00 5191 702 541
----shy5079 702
50
-----------------------------------------------------------------
------------------------------------------------------------------
TABLE 5D Unalakleet River Test Net Data Chum Salmon in 5 78 Mesh 1983
Cum Cum Cum Date Hours Catch CPUE Hours Catch CPUE
June 5 73 0 00 73 0 00 7 126 0 00 199 0 00 8 127 0 00 326 0 bull 0 0
10 11 4 3 105 440 3 27 12 113 2 71 553 5 36 14 119 1 34 672 6 36 15 116 4 138 788 10 51 17 116 3 103 904 13 56 19 118 6 203 1022 19 74 21 118 0 00 1140 19 67 22 117 10 342 1257 29 92 24 116 3 103 1373 32 93 26 119 11 370 1492 43 115 28 11 8 6 203 1610 $ 49 122 29 115 13 452 1725 62 144
July 1 119 8 269 1844 70 152 3 119 17 571 1963 87 177 5 119 13 437 2082 100 192 6 12 0 17 567 2202 117 213 8 121 7 231 2323 124 214
10 11 4 18 632 2437 142 233 12 115 12 417 2552 154 241 13 116 37 1276 2668 191 286 15 117 16 547 2785 207 297 17 11 8 31 1051 290 3 238 328 19 118 18 610 3021 256 339 20 115 29 1009 3136 285 364 22 122 17 557 3258 302 371 24 115 24 835 3373 326 387 26 120 19 633 3493 345 395 27 117 11 376 3610 356 394 29 117 14 479 3727 370 397 31 116 18 621 3843 388 404
August 2 121 9 298 3964 397 401 3 122 17 557 4086 414 405 5 11 8 8 271 4204 422 402 7 128 19 594 4332 441 407 9 257 10 156 4589 451 393
10 125 14 448 4714 464 394 12 13 1 308 4727 465 393 14 107 5 187 4834 470 389 16 122 4 131 4956 474 383 17 123 15 488 5079 489 385 19 118 8 271 5197 497 383 21 112 3 107 5309 500 378 23 120 6 200 5429 506 373 24 115 7 243 5544 513 370
51
-----------------------------------------------------------------------
TABLE 5D Unalakleet River Test Net Data Chum Salmon in 5 78 Mesh 1983 (Continued)
Cum Cum Cum Date Hours Catch CPUE Hours Catch CPUE
August 26 115 5 174 5657 518 366 28 119 1 34 577 6 519 359 30 119 4 134 5895 523 355 31 117 0 00 6012 523 3 48
Sept 2 123 3 98 613 5 526 343 4 479 2 17 6614 528 319 6 238 1 17 6852 529 309 7 237 0 00 7089 529 298 8 9
238 242
1 2
17
33 7327 7569
clt
530 532
289 281
10 242 3 50 7811 535 274 11 242 0 00 8053 535 266 12 241 2 33 8294 537 259 14 227 3 53 8521 540 253 15 242 0 00 8763 540 246 16 210 1 19 8973 541 241 17 239 2 33 9212 543 236 18 230 0 00 9442 543 230 20 489 0 00 9931 543 219 21 240 2 33 10171 545 214 22 242 0 0 10413 545 209 23 234 0 00 10647 545 205
----shy
10647 545
52
------------------------------------------------------------------------
------
TABLE 6A Unalakleet River Sonar Site Drift Sets5 1 4n Me sh 19 83 bull
Date Time Result
July 19 1405-1413 1 burbot July 23 1040-1055 1 pink caracass July 27 1520-1530 1 coho August 3 1444-1501 4 coho August 22 1930-1937 0 August 23 937-943 1 coho 1 pink carcass August 26 1117-1127 1 coho 3 churn August 31 1018-1034 3 churn
TABLE 6B Unalakleet River Sonar Site Beach Seines 1983
Date Time Distance Result
July 20 1445 120 meters 4 pink 1 churn 13 Dolly Varden 1 whitefish
July 25 1500 120 meters 6 pink 1 churn 1 Dolly Varden 4 whitefish 1 grayling
July 28 1700 120 meters 4 coho 2 pink 2 churn 1 Dolly Varden
August 1 2010 300 meters 4 pink 3 churn 8 Dolly Varden
August 4 1015 130 meters 5 coho 3 pink 3 churn 65 Dolly Varden 3 whitefish 3 grayling
August 24 1110 130 meters 18 coho 2 Dolly Varden 2 grayling
August 29 1715 120 meters 11 coho 1 pink 69 churn 1 Dolly Varden 2 grayling
Seine done at mile 12 Unalakleet River
53
--------------------------------------------------------------------------------------------------
--------------------------------------------------------------------------------------------------
TABLE 7 AGE SEX AND SIZE COMPOSITION OF NORTON SOUND KING SALMON UNALAKLEET RIVER CATCH SAMPLE SPORT CATCH AND SPAWNING SURVEYS 1983
II
COMBINED 3-2 4-2 4-3 NO LENGlH NO LENGlH NO LENGlH NO LENGlH
Male 31 646 6702 5 104 5010 8 167 5688 1 21 5900
Female 17 354 8540 o o 1 21 5450 o o
Total 48 1000 7353 5 104 5010 9 188 5661 1 21 5900
~ 11)
5-2 6-2 7-2 7-3 NO LENGlH NO LENGlH NO LENGlH NO LENGlH
Male 11 229 7382 6 125 8350 0 0 0 0
Female 2 42 7925 12 250 8742 1 21 10650 1 21 8350
Total 13 271 7465 18 375 8611 1 21 10650 1 21 8350
TABLE 8A AGE SEX AND SIZE COMPOSITION OF NORTON SOUND KING SALMON UNALAKLEET RIVER TEST NET SAMPLE 1983
-----~-------------------------------------------------------------------------------------------------------
gt
COMBINED 4-2 5-2 5-3 6-2 7-2 NO LENGIH NO LENGIH NO LENGIH NO LENGTH NO LENGTH NO LENGTr
8 14 n
Male 3 333 8107 0 1 111 5800 o 0 2 222 9260 0 0 Female 6 667 8295 0 0 1 111 7600 o o 4 444 8310 1 111 8930 Total 9 10 e 0 8232 0 o 2 222 6700 o o 6 667 8627 1 111 8930
If) If)
5 14 Male 19 1000 6298 12 632 5392 4 211 6990 0 o 3 158 8997 0 0 Female o 0 o o o o o o 0 0 0 0 Total 19 1000 6298 12 632 5392 4 211 6990 o o 3 158 8997 0 0
4 n or Smaller Male 6 667 5930 1 111 4660 2 222 6325 3 333 6090 0 o 0 o Female 3 333 8970 o o o o o o 3 333 8970 0 o Total 9 1000 6943 1 111 466 2 222 6325 3 33 3 6090 3 33 3 8970 0 0
TOTAL Hale 28 757 6413 13 351 5336 7 189 6630 3 8 1 6090 5 13 5 9102 o 0 Female 9 243 852 o o 1 27 7600 o o 7 189 8593 1 2 7 8930 Total 37 1000 6925 13 351 5336 8 216 6751 3 8 1 6090 12 324 88 e 5 1 2 7 8930
---------------------------------------------------------------------------------------------------------
---------------------------------------------------------------------------------------------------------
TABLE 8B AGE SEX AND SIZE COMPOSITION OF NORTON SOUND COHO SALMON UNALAKLEET RIVER TEST NET SAMPLE 5 14 AND 5 78 GEAR 1983
COMBINED 3-2 4-3 4-4 5-4 NO LENGIH NO LENGIH NO LENGTH NO LENGIH NO LENGTH
Male 9 900 5489 0 0 9 900 5489 0 0 Female 1 10 bull 0 552 QJ QJ 0 1 10QJ 5520 0 0 Total 10 1000 5492 0 0 10 1000 5492 0 0 725-731
bull LI)Male 15 938 5645 15 938 5645 Female 1 62 575 QJ 1 62 575 QJ Total 16 lQJ0QJ 5651 16 100QJ 5651 81-87
Male 24 545 5668 23 523 5768 1 23 3350 Female 20 455 5631 20 455 5631 0 0 Total 441QJ0QJ 5651 43 977 57 QJ 4 1 23 335 QJ 88-814
Male 7 500 5797 7 500 5797 QJ 0 Female 7 500 5596 6 429 5587 1 71 5650 Total 14 1000 5696 13 929 1 71 5650570 815-821
Male 5 455 5492 5 455 5492 Female 6 545 5552 6 545 5552 Total 11 lQJ00 5525 11 100QJ 5525 822-828
----------------- --------- ----------- ----------------------------------------- ------- -------------------
----- ----------------- - - ---- -------------------------------------------------------- --- -----------------
----------- - - --------------------------------------------- -------------------------------- - - ------------
TABLE 8B AGE SEX AND SIZE COMPOSITION OF NORTON SOUND COHO SALMON UNALAKLEET RIVER TEST NET SAMPLES 14 and 5 78 GEAR 1983 (CONTINUED)
COMBINED 3-2 4-3 4-4 5-4 NO LENGlH NO LENGlH NO LENGlH NO LENGlH NO LENGTH
------------------~------------------------------------------------------------------------------------- Male 10 455 5654 o o 10 455 5654 o o o o Female 12 545 5720 o o 12 545 5720 o o o Total 22 1000 5690 o o 22 1000 5690 o o o 829-94 Male 9 290 5723 9 290 5723 Female 22 710 5704 22 710 5704 Total 31 1000 5709 31 1000 5709 95-911
tI)Male 15 536 5887 15 536 5887 r-
Female 13 464 5855 13 464 5855 Total 28 1000 5872 28 1000 5872 912-918
Male 4 500 5935 1 125 6320 2 250 5735 1 125 5950 Female 4 500 5510 o o 4 500 5510 o o Total 8 1000 5722 1 125 6320 6 750 5585 1 125 5950 919-925
TOTALS Male Female Total
98 533 86 467
184 1000
5696 5682 5689
1 0 1
05 0
05
6320
6320
95 85
180
516 462 978
571 2 5682 5698
1 0 1
05 0
0 5
3350
3350
1 1 2
o 5 05 11
5950 5650 5800
4 OR SMALLER GEAR Male 72 758 Female 23 242 Total 95 1000
5727 557 5689
71 22 93
747 232 979
5741 5592 576
1 1 2
11 11 21
4750 5080 4915
--------------------------------------------------------------------------------------------------------
--------------------------------------------------------------------------------------------------------
--------------------------------------------------------------------------------------------------------
TABLE 8C AGE SEX AND SIZE COMPOSITION OF NORTON SOUND CHUM SAL~ION UNALAKLEET RIVER TEST NET 5 14 and 5 78 GEAR 1983
COMBINED 3-1 4-1 5-1 6-1 NO L ENGIH NO LENGIH NO L ENGIH NO L ENGIH NO L ENGIH
~1ale 0 0 0 0 0 0 0 0 0 0 Female 5 1000 5828 0 0 0 0 5 1000 5828 0 0 Total 5 1000 5828 0 0 0 0 5 1000 5828 0 0 610-612
Male 8 571 6108 0 0 2 143 5780 6 429 621 7 0 0 Female 6 429 5810 0 0 0 0 6 429 581 0 0 0 Total 14 1000 5981 0 0 2 143 5780 12 857 601 4 0 0 613-619 00
tr1
Male 8 333 6102 2 8 3 6325 6 250 6028 Female 16 667 5890 1 42 5520 15 625 5915 Total 24 1000 5961 3 125 6057 21 875 5947 620-626
Male 19 422 5911 7 156 6067 12 267 5820 Female 26 578 5843 10 222 5731 16 356 5912 Total 45 1000 5871 17 378 5869 28 622 5873 627-73
Male 17 362 6146 8 170 6081 9 191 620 4 Female 30 638 5750 17 362 5646 13 277 5885 Total 47 10QJQJ 5893 25 532 5785 22 468 6015 74-710
TABLE 8C AGE SEX AND SIZE COMPOSITION OF NORTON SOUND CHUM SALMON UNALAKLEET RIVER TEST NET 5 14 n and 5 78 n GEAR 1983 (CONTINUED)
COMBINED 3-1 4-1 5-1 6-1 NO L ENGlH NO L ENGlH NO L ENGlH ID LENGTH NO LENGTH
----------------------------------------~~-----------------------------------------------------------
Male 32 314 Female 7~ 686 Total 1~2 1~0~ 711-717
5898 5718
h775
16 43 59
157 422 578
5791 5666 5700
16 27 43
157 265 422
6005 5801 5877
Male Female Total 718-724
Male Female Total
33 384 53 616 86 H~00
19 306 43 694 62 1000
5951 5690 57 9~
6013 5760 5837
o 1 1
~
16 16
5200 5200
23 34 57
12 31 43
267 395 663
194 500 694
5833 5624 5709
5872 5682 5735
10 19 29
7 10 17
116 221 337
113 161 274
6222 5807 5950
6254 6021 6117
o 1 1
o 16 1 6
6120 6120
01 LI)
725-731
Male Female Total 81-87
11 212 41 788 52 1000
5904 5592 5658
1 3 4
19 58 77
5350 5380 5372
8 34 42
154 654 808
5799 5612 5648
2 4 6
38 77
115
6600 5582 5922
Male Female Total 88-814
7 269 19 731 26 1000
6003 5682 5768
o 1 1
~ 3 8 3 8
5400 5400
5 15 20
192 577 769
5946 5699 5761
2 3 5
77 115 192
6145 5690 5872
Male Female Total 815-821
14 467 16 533 30 1000
5948 5683 5806
1 1 2
33 3 3 67
521 0 5460 5335
12 10 22
400 333 733
5963 5697 5842
1 5 6
3 3 167 200
6500 5700 5833
Male Female Total
6 16
273 727
10~0
6022 5668 5765
middot o 1 1
o 4 5 4 5
5130 5130
5 12 17
227 545
3
5918 5646 5726
1 3 4
4 5 136 182
6540 5937 6088
822-82
------------------------------------------------------------------------------------------------------
------------------------------------------------------------------------------------------------------
------------------------------------------------------------------------------------------------------
------------------------------------------------------------------------------------------------------
------------------------------------------------------------------------------------------------------
TABLE 8C AGE SEX AND SIZE COMPOSITION OF NORTON SOUND CHUM SALl-lON UNALAKLEET RIVER TEST NET 5 14 and 5 78 GEAR 1983 (CONTINUED)
COMBINED 3-1 --- 4-1 5-1 6-1 NO LENGlH 00 LENGlH NO LENGlH NO LENGIH 00 LENGIH
Male 2 182 - 5650 2 182 5650 0 0 Female 9 818 5541 8 727 5571 1 9 1 5300II~-
Total 11 1000 5561 10 909 5587 1 9 1 5300 829-94
Male 0 0 0 0 Female 7 1000 gt5794 6 857 5735 1 143 6150 Total 7 1000 5794 6 857 5735 1 143 6150 95-911
Male 1 100 5720 0 0 1 100 5720 0 0 Female 9 900 5661 1 100 5460 7 700 5610 1 100 6220
0Total 10 1000 5667 1 100 5460 8 800 5624 1 100 6220 0
912-918
TOTALS
l-1a1e 177 326 5973 2 04 5280 103 190 5892 72 133 6108 0 0 Female 366 674 5717 8 15 5349 228 420 5654 129 238 5848 1 o 2 6120 Total 543 100 580 10 18 5335 331 61 5728 201 370 5941 1 o 2 6120
TOTAL 8 14 GEAR
~~a1e Female Total
20 870 3 13
23 1000
6537 5440 6394
9 2
11
391 87
478
6519 5550 6343
11 1
12
478 43
522
6551 5220 6440
TOTAL 4 GEAR AND VARIABLE MESH SMALLER THAN 4
l-1ale Female Total
60 583 43 417
103 1000
6146 5630 5985
32 27 59
311 262 573
6040 5503 5794
28 16 44
272 155 427
6268 5843 611 4
-------------------------------------------------------------------------------------------------------
-------------------------------------------------------------------------------------------------------
TABLE 9A AGE SEX AND SIZE COMPOSITION OF NORTON SOUND KING SALMON UNALAKLEET COMMERCIAL CATCH SAMPLE 1983 bull
I~
SEXED COMBINED 3-2 4-2 5-2 6-2 SAMPLES NO LENGlH NO LENGlH NO LENGlH NO L ENGlH NO L ENGlH
Male 1 03 64 0 8098 1 06 5170 4 25 5365 4 4 27 3 77 3 4 54 335 8651
Female 58 360 8626 o o o o 9 56 8340 49 304 8678
Tota1 1 61 100 0 8288 1 o6 5170 4 255365 53 3297837 1036408664
M
Unsexed 293 1000 8166 1 03 5050 11 38 601 8 95 324 7708 186 635 854 4 ~
Total 454 1000 8209 2 o4 511 0 15 33 5844 148 326 7754 289 637 8587
-
TABLE 9B AGE SEX AND SIZE COMPOSITION OF NORTON SOUND SOCKEYE SALMON UNALAKLEET TEST NET SAMPLE 1983 5 78 5 14 4 AND VARIABLE MESH NETS bull
COMBINED 4-2 5-2 5-3 SEX NO LENGTH NO LENGTH NO LENGTH NO LENGTH________________________________________C_____________________________________________
Male 4 667 57e8 e e 3 5ee 5887 1 167 517e
Female 2 333 5335 1 167 518e 1 167 549e e e N 0
Total 6 10ee 5584 1 167 518e 4 667 5788 1 167 517e
--------------------------------------------------------------------------------------------
--------------------------------------------------------------------------------------------
TABLE 9C AGE SEX AND SIZE COMPOSITION OF NORTON SOUND COHO SALMON UNALAKLEET COMMERCIAL CATCH SAMPLE 1983
COMBINED 3-2 4-3 5-4 NO LENGTH NO LENGTH NO LENGTH NO LENGTH
Male 83 519 5630 4 25 5450 78 488 5637 1 06 5800
Female 77 481 5676 4 25 5662 72 450 5685 1 06 5100
Total 160 100 0 565 2 8 50 5556 1 50 93 bull 8 566 0 2 13 5450
C)
0
TABLE 9D AGE SEX AND SIZE COMPOSITION OF COMMERCIAL CATCH SAMPLE 1983
NORTON SOUND CHUM SALMON UNALAKLEET
COMBINED NO L ENGlH NO
3-1
L ENGlH NO 4-1
LENGTH NO 5-1
LENGTH NO 6-1
LENGTH
Male
Female
Total
159 48
171 52
328 1
598
591
594
3
3
9
09
563
563
84
15
189
256
32
576
62
570
584
70
66
136
213
21
415
593
625
609
2
o
2
06
o
06
62
620
t
r
----------------- ----------------- -----------------
------------------------------------------------------------------------
APPENDIX TABLE 1A Unalakleet River Test Net King Salmon Catches 1981-1983 8 14 Mesh
1981 1982 1983
Date Hrs Catch CPUE Hrs Catch CPUE Hrs Catch CPUE
May 27 21 0 0 00 28 482 0 00 29 30 240 0 00 31 246 2 41
June 1 237 0 00 2
~
256 0 00 3 585 0 00 4 5 160 0 00 6 120 1 42 7 24 2 28 24 00 8 24 1 14 125 0 00 9 24 3 42 122 0 00
10 24 2 28 24 1 21 11 24 4 55 24 3 62 117 0 00 12 24 1 14 24 0 00 126 0 00 13 24 3 42 24 0 00 117 1 43 14 24 3 42 24 2 42 15 24 2 28 24 1 21 118 0 00 16 24 7 96 11 6 1 43 17 24 1 14 24 1 21 18 24 2 28 240 0 00 19 24 2 28 24 0 00 121 0 00 20 24 5 69 24 1 21 116 0 00 21 24 2 28 12 0 00 22 24 1 14 118 1 42 23 24 1 14 12 0 00 119 1 42 24 24 3 42 119 3 126 25 24 1 14 240 0 00 26 24 0 00 11 9 0 00 27 24 0 00 126 0 00 11 9 0 00 28 24 2 28 115 0 00 29 24 2 28 120 0 00 30 24 1 14 120 0 00 120 0 00
65
----------------- ----------------- -----------------------------------------------------------------------------------------
APPENDIX TABLE 1A Unalakleet River Test Net King Salmon Catches 1981-1983 8 14 Mesh (Continued)
1981 1982 1983
Date Hrs Catch CPUE Hrs Catch CPUE Hrs Catch CPUE
July 1 24 4 55 135 0 00 2 24 2 28 238 0 00 3 24 1 14 11 8 0 00 4 24 0 00 110 0 00 118 1 42 5 24 0 00 120 0 00 6 24 1 14 122 0 00 7 24 0 00 130 1 39 fS 116 0 00 8 24 1 14 140 0 00 9 24 1 14
10 24 0 00 126 0 00 11 24 0 00 120 3 125 119 0 00 12 24 0 00 118 0 00 13 24 1 14 11 6 0 00 14 24 0 00 122 0 00 119 2 84 15 24 0 00 122 0 00 16 24 0 00 17 24 0 00 122 0 00 18 24 0 00 11 2 0 bull 00 19 24 0 00 119 0 00 20 24 0 00 120 0 00 119 0 00 21 24 0 00 11 2 0 00 22 24 0 00 115 0 00 23 24 0 00 52 0 00
Mesh changed to 5 78
66
-------------------------------------------------------------------
Appendix Table lB Unalakleet River Test Net King Salmon Catches 1982-1983 5 Gear
1982 (5 78 mesh Z~fm) 1983 (5 14 mesh 25 fm) Hrs Catch CPUE Hrs Catch CPUE
June 5 73 til 0 6 7 126 1 32 8 9 127 1 31
1~ 114 0 0 11 12 113 2 71 13 14 119 2 67 15 116 1 34 16 24 1 21 17 116 2 69 18 24 5 104 19 118 0 0 20 12 4 167 21 118 1 34 22 12 2 83 117 1 34 23 12 2 83 24 116 0 0 25 119 1 42 26 119 2 67 27 121 2 84 28 118 1 34 29 122 1 41 115 2 70 30 135 2 74
July 1 119 1 34 2 120 2 83 3 119 1 34 4 135 0 0 5 119 0 0 6 120 0 0 120 0 0 7 55 0 0 8 121 0 0 9 90 0 0
10 114 0 0 11 65 0 0 12 115 0 0 13 122 1 41 116 1 34 14 90 0 0
117 til til
67
------------------------------------------------------------------------
----------------- ----------------- -------------------
APPENDIX TABLE 1C Unalakleet River Test Net Coho Salmon Catches 1981-1983 5 78 Mesh
1981 1982 1983
Date Hrs Catch CPUE Hrs Catch CPUE Hrs Catch CPUE -------------shy ---------------------------------------------------------shy
July 18 120 0 00 19 120 0 00 20 21 118 0 00 22 245 0 00 23 24 115 0 00 25 126 4 158 26 25 0 00 120 0 00 27 28 24 1 42
117 0 00
29 24 1 42 46 00 117 4 137 30 24 2 83 31 24 2 83 116 3 1 03
Aug 1 24 1 42 30 9 1500 2 24 0 00 44 3 341 122 0 00 3 24 1 42 122 2 66 4 24 0 00 132 8 304 5 24 0 00 73 6 649 118 1 34 6 24 0 00 7 24 1 42 128 14 437 8 24 0 00 126 9 357 9 24 3 125 129 0 00 257 14 218
10 24 1 42 125 21 672 11 24 0 00 122 8 328 12 24 1 42 125 17 680 13 0 00 13 24 1 42 14 24 5 63 107 12 449 15 24 17 212 123 18 732 16 24 36 450 122 5 205 122 2 66 17 24 27 337 123 6 196 18 24 21 262 120 5 208 19 24 20 250 122 1 41 118 1 34 20 24 10 125 21 24 17 212 112 6 2 14 22 24 10 125 122 6 246 23 24 13 162 118 2 84 120 3 100 24 24 2 25 115 2 70 25 24 5 62 121 3 124
68
------------------------------------------------------------------------
----------------- ----------------- ------------------
------------------------------------------------------------------------
APPENDIX TABLE 1C Unalakleet River Test Net Coho Catches 1981-1983 5 78 Mesh (Continued)
1981 1982 1983
Date Hrs Catch CPUE Hrs Catch CPUE Hrs Catch CPUE
Aug 26 27
24 24
13 5
162 62
12 0 0 115 5 174
28 24 4 5 119 0 29 24 1 12 125 11 440 30 24 Iil Iillil 113 5 221 119 4 134 31 24 3 38 117 1 34
Sept 1 2
24 24
2 1
25
12 122 115
6 2
246 87 ~ 123 5 33
3 24 2 25
4 24 1 12 479 15 125 5 24 2 83 116 8 3fil1 6 24 2 83 98 3 153 238 6 1 fill 7 24 1 42 237 5 bull 84 8 24 2 83 118 fil fil0 238 6 1 fill 9 24 2 83 242 10 165
1fil 24 3 125 285 13 228 242 3 50 11 24 1 42 235 14 298 242 2 33 12 24 1 42 256 8 156 241 8 133 13 24 2 83 256 5 98 14 24 fil filfil 213 6 141 227 14 247 15 24 Iil Iilfil 267 7 131 242 9 149 16 24 1 42 222 5 113 21fil 3 57 17 24 0 fil0 248 10 2fil2 239 2 33 18 24 fil 00 221 15 339 230 2 35 19 24 fil0 3fil2 4 67 20 24 1 42 191 fil filfil 489 4 33 21 262 fil 76 24 fil 3 50 22 276 6 1fil9 242 0 bull filfil 23 2fil2 2 50 234 1 17 24 238 1 21
Mesh size = 5 14 from July 24 to August 10
69
-----------------------------------------------------------------------
----------------- ----------------- -----------------
-----------------------------------------------------------------------
APPENDIX TABLE ID Unalakleet River Test Net Pink Salmon Catches 1981-1983 4 Mesh
1981 1982 1983
Date Hrs Catch CPUE Hrs Catch CPUE Hrs Catch CPUE
June 16 24 0 00 122 1 33 17 24 0 00 118 0 00 18 24 1 14 19 24 0 00 20 24 0 00 120 2 67 21 24 1 14 120 87 2900 118 0 00 22 24 0 00 120 40 1667 23 24 2 28 119 2 67 24 24 1 14 120 147 4900 119 3 102 25 26
24 24
~ 5
28
69 115 126 4382 t
27 24 3 41 116 19 655 28 24 2 28 125 222 7104 120 22 733 29 24 3 41 70 116 6628 30 24 2 28 120 40 1333
July 1 24 2 28 90 134 5956 115 36 1252 2 24 5 69 U~ 5 184 7010 3 24 6 82 4 24 12 165 122 30 983 5 24 4 55 95 387 16294 114 47 1649 6 24 4 55 30 75 10000 7 24 8 110 118 30 1016 8 24 19 261 22 86 15636 120 24 800 9 24 8 110 30 144 19200
10 24 11 151 11 24 15 206 122 42 1377 12 24 17 234 21 112 21333 120 29 967 13 24 10 138 35 110 12571 14 24 7 96 116 37 1276 15 24 8 110 20 52 10400 118 40 1356 16 24 10 138 15 61 16267 17 24 20 275 18 24 20 275 15 35 9333 121 60 1976 19 24 23 958 119 30 740 20 24 15 627 16 59 14750 21 24 51 21 25 16 61 15250 125 61 1952 22 24 55 2297 118 25 847 23 24 28 11 67 24 43 7167 24 24 17 708 25 24 22 917 11 43 15636 122 16 5 25 26 24 14 583 116 15 517 27 24 12 500 6 21 35000 28 24 5 208 24 100 16667 122 28 9 18 29 24 9 375 117 11 376 30 24 8 333 14 9 2571
middot 31 24 10 417 70
-----------------------------------------------------------------------
----------------- ----------------- -----------------
-----------------------------------------------------------------------
APPENDIX TABLE 1D Unalakleet River Test Net Pink Salmon Catches 1981-1983 4 Mesh (Continued)
1981 1982 1983
Date Hrs Catch CPUE Hrs Catch CPUE Hrs Catch CPUE
August 1 2
24 24
4 4
167 167
35 6 686 12 QJ 11 9
7 9
233 3 03
3 24 6 250 18 18 4000 4 24 4 167 47 34 2894 120 3 100 5 24 2 83 118 5 1 70 6 24 10 417 12 0 00 7 24 12 500 8 24 1 42 45 2 178 114 7 245 9 24 1 42
10 11 12
24 24 24
2 f 3
83
83 125
28 37
0 0
bull 00 bull QJ0
~
123 7 337
13 24 0 bull 00 16 0 bull 00 14 24 0 00 15 24 1 42 39 3 308 118 2 68 16 24 0 00 113 5 177 17 18 19
24 24 24
0 0 0
bull 00 00 00
16 55
0 0
bull 00 bull 00 98
11 9 3 1
122 34
20 24 0 00 13 0 bull 00 21 22 122 0 00 112 0 00 23 115 QJ 0QJ 24 120 0 QJQJ 25 119 QJ 00 120 2 66 26 11 2 1 36 27 126 QJ QJ0 28 29 30
116 QJ QJ0 116 115
0 QJ
QJQJ
QJQJ 31 106 1 38
Sept 1 2
122 0 0QJ 115 112
QJ QJ
QJQJ
QJ0 3 121 0 QJ0 4 5 122 QJ bull 00 6 7 126 1 32
Note 1981 mesh sizes = 8 14 from June 16 to July 17 5 78 from July 17 to August 20
71
-----------------------------------------------------------------------
----------------- ----------------- -----------------------------------------------------------------------------------------
APPENDIX TABLE IE Unalakleet River Test Net Chum Salmon Catches 1981-1983 5 78 Mesh
1981 1982 1983
Date Hrs Catch CPUE Hrs Catch CPUE Hrs Catch CPUE
June 5 73 0 00 6 7 126 0 00 8 127 0 00 9 24 0 00
10 24 10 138 114 3 105 11 24 4 55 12 24 10 138 113 2 71 13 24 2 28 14 24 0 00 119 1 34 15 16
24 24
3 5
41
69 24 8 167 $
116 4 138
17 24 3 41 116 3 103 18 24 21 289 24 9 188 19 24 18 247 118 6 203 20 24 14 193 12 12 416 21 24 7 96 118 0 00 22 24 6 82 12 8 334 117 10 3 42 23 44 41 564 12 2 84 24 24 2 28 116 3 1 03 25 24 4 55 119 3 123 26 24 5 69 119 11 370 27 24 4 55 121 23 951 28 24 9 124 - 118 6 2 03 29 24 9 124 122 11 451 115 13 4 52 30 24 4 55 135 13 481
July 1 24 14 193 119 8 2 69 2 16 16 220 1213 17 709 3 24 16 220 119 17 571 4 24 13 179 135 213 741 5 24 11 151 119 13 437 6 24 11 151 1213 4 1 67 120 17 567 7 24 9 124 55 12 1091 8 24 18 248 121 7 231 9 24 13 179 913 9 500
10 24 19 261 114 18 632 11 24 22 302 65 16 1231 12 24 14 192 115 12 417 13 24 10 138 122 8 330 116 37 1276 14 24 10 138 90 8 444 15 24 6 82 117 16 547 16 24 3 41 118 3 127 17 24 6 82 118 31 11351
72
---------------- ----- --- ---- -------------------- ------------ ------------
------------- - - --- ----------------- ---------- --------
---- ---------------------------------------------------- ---- ---- - ------
APPENDIX TABLE IE Unalakleet River Test Net Chum Salmon Catches 1981-1983 5 78 Mesh (Continued)
1981 1982 1983
Date Hrs Catch CPUE Hrs Catch CPUE Hrs Catch CPUE
middotJu1y 18 24 16 220 120 8 333 19 24 12 500 120 19 791 118 18 610 20 24 20 833 115 29 1009 21 24 16 667 11 8 8 339 22 24 4 167 245 28 571 122 17 557 23 24 7 292 24 24 12 500 115 24 835 25 24 11 458 126 23 910 26 24 20 833 25 3 500 120 19 633 27 24 21 875 117 11 376 28 24 14 583 29 30
24 24
37 22
1542 917
46 8 870 ~ 117 14 479
31 24 12 500 116 18 621 Aug 1 24 3 125 30 3 500
2 24 0 00 44 1 114 121 9 298 3 24 4 167 122 17 557 4 24 7 292 132 5 190 5 24 11 458 73 5 342 118 8 271 6 24 8 333 7 24 11 458 128 19 594 8 24 11 458 126 6 238 9 24 9 375 129 2 78 257 10 156
10 24 6 250 125 14 448 11 24 9 375 122 4 164 12 24 7 292 125 3 120 13 1 308 13 24 1 42 14 24 25 310 107 5 187 15 24 30 383 123 2 82 16 24 14 187 122 2 82 122 4 131 17 24 9 118 123 15 488 18 24 14 187 120 0 00 19 24 8 110 122 1 41 118 8 271 20 24 6 82 21 24 7 96 112 3 107 22 24 1 14 122 1 41 23 24 1 14 118 4 170 120 6 200 24 24 2 28 115 7 243 25 24 2 28 121 1 41 26 24 2 28 122 0 00 115 5 174 27 24 7 96 28 24 2 28 119 1 34 29 24 1 14 125 3 120 30 24 0 00 113 0 00 119 4 134 31 24 2 28 117 0 00
73
----------------- ----------------- ------------------
-----------------------------------------------------------------------
APPENDIX TABLE IE Unalakleet River Test Net Chum Salmon Catches 1981-1983 5 78 Mesh (Continued)
1981 1982 1983
Date Hrs Catch CPUE Hrs Catch CPUE Hrs Catch CPUE
Sept 1 24 2 28 122 0 00 2 24 0 00 115 0 00 123 3 98 3 24 0 00 4 24 0 00 479 2 17 5 24 1 42 116 0 ~ 00 6 24 1 42 98 0 00 238 1 17 7 24 2 84 237 0 00 8 24 2 84 118 3 127 ~
238 1 17 9 24 e 00 242 2 33
10 24 0 00 285 0 00 242 3 50 11 24 0 00 235 0 00 242 0 00 12 24 0 00 256 0 00 241 2 33 13 24 0 00 256 0 00 14 24 0 00 213 0 00 227 3 53 15 24 0 00 267 0 00 242 0 00 16 24 0 00 222 0 00 210 1 19 17 24 0 00 248 2 40 239 2 33 18 24 0 00 221 0 00 230 0 00 19 24 0 00 302 0 00 20 24 0 00 191 0 bull 00 489 0 00 21 262 1 19 240 2 33 22 276 1 18 242 0 00 23 202 0 00 234 0 00 24 238 0 00
Note 1981 Sizes - 8 14 from June 9 to July 17 5 78 from July 18 to September 20
1983 Sizes - 5 14 from June 5 to August 10 5 78 from August 11 to September 23
74
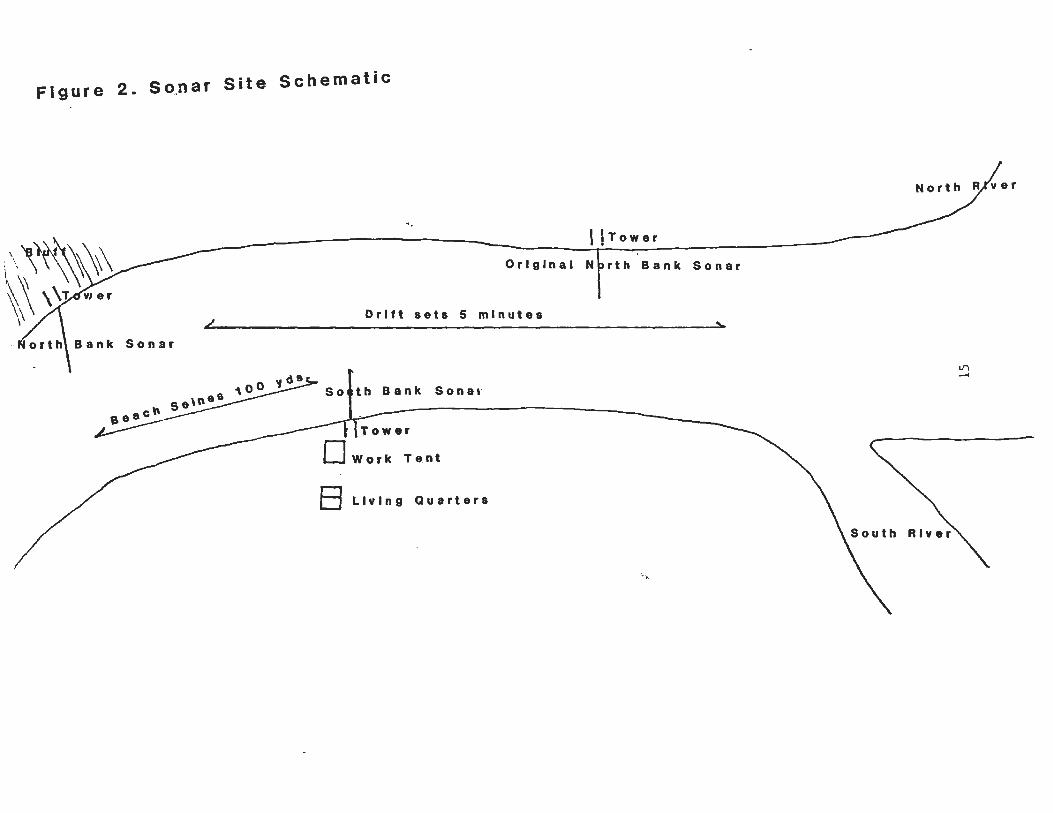
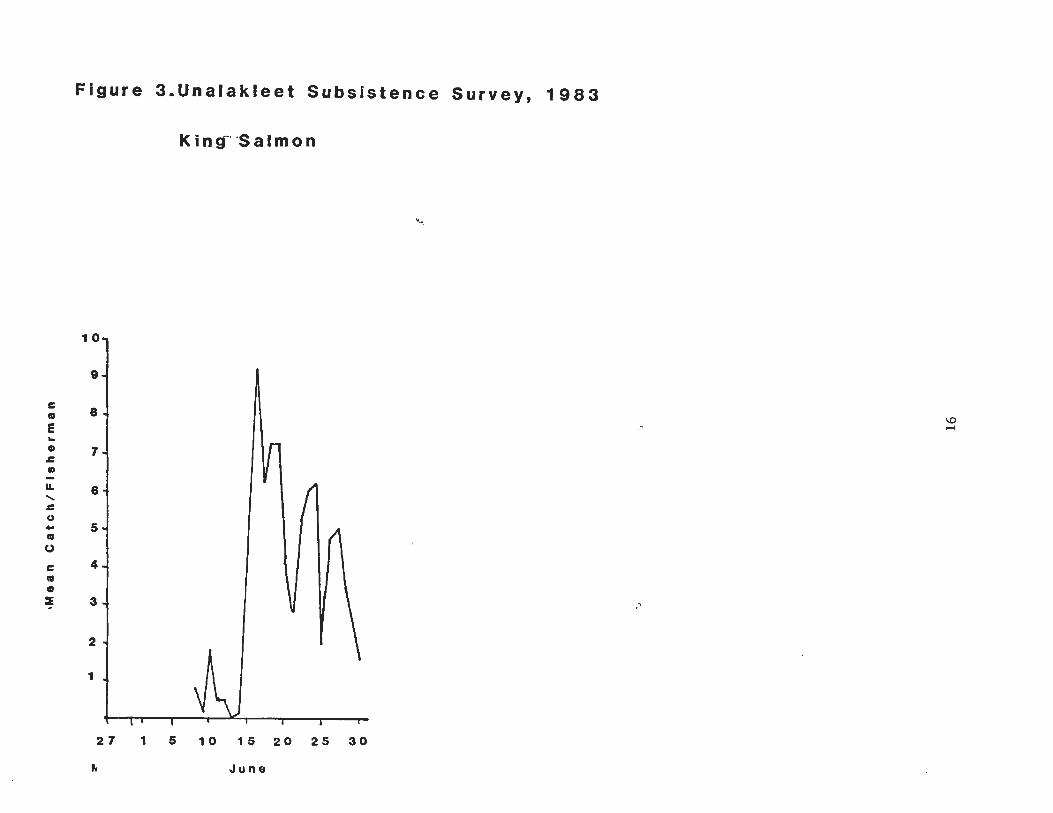
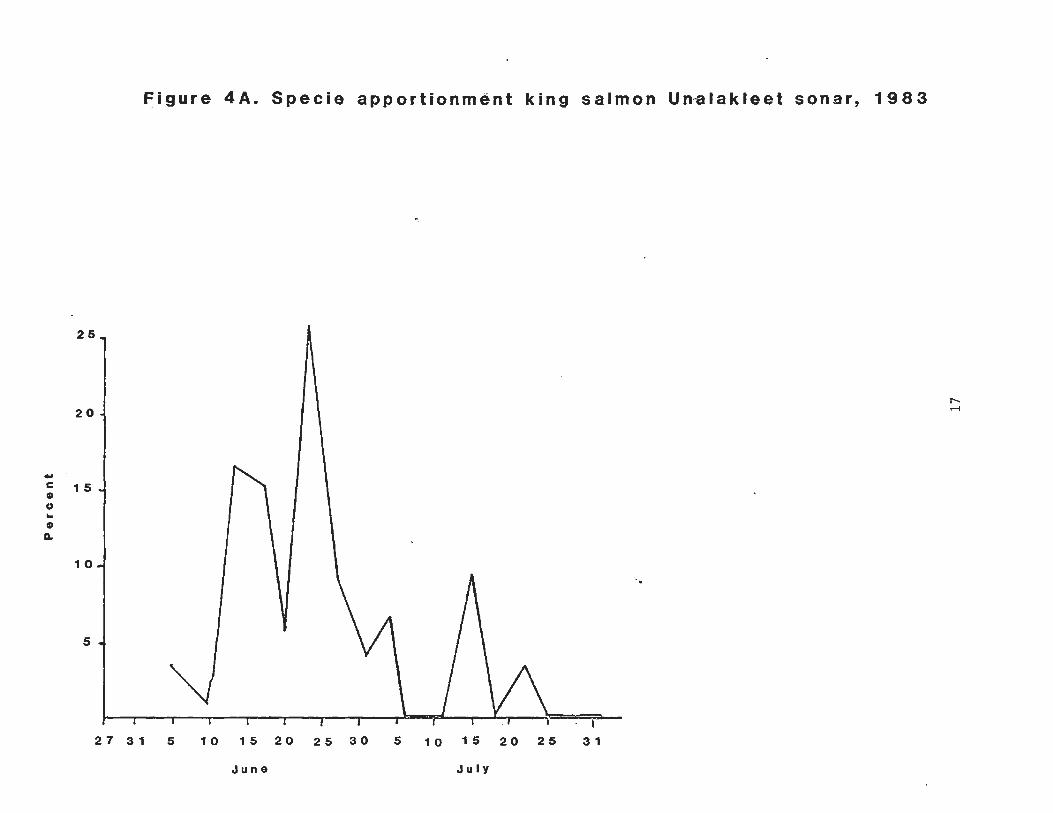
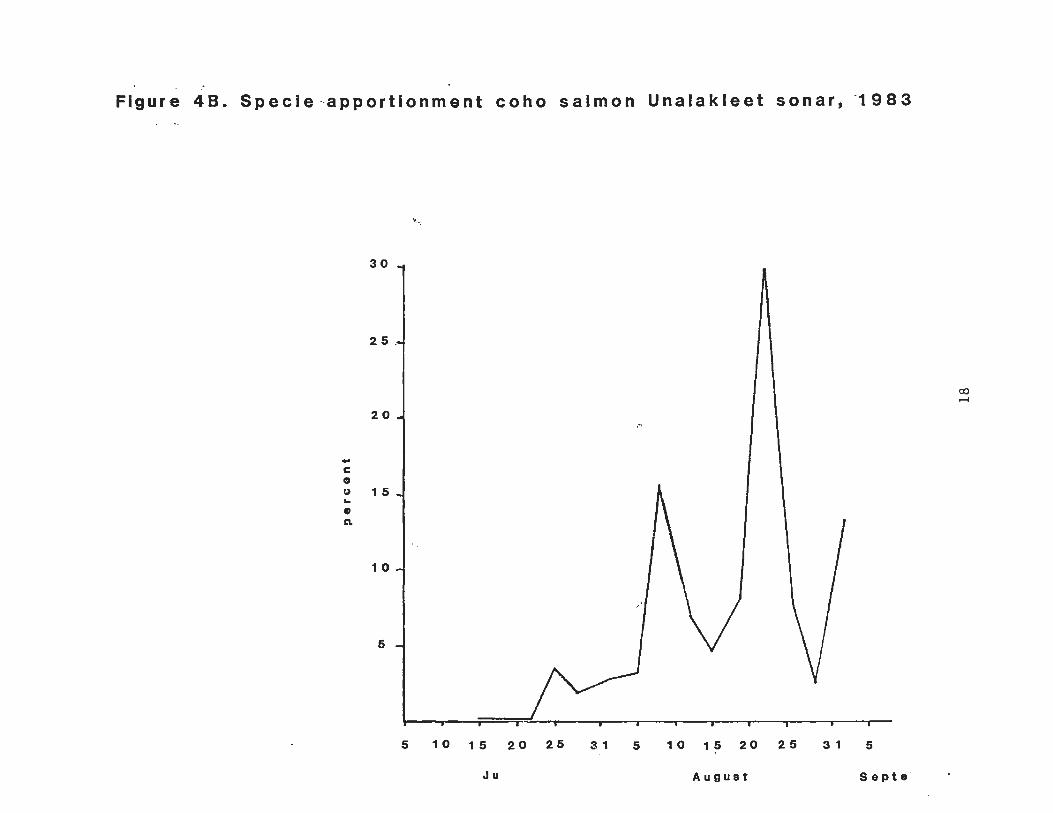
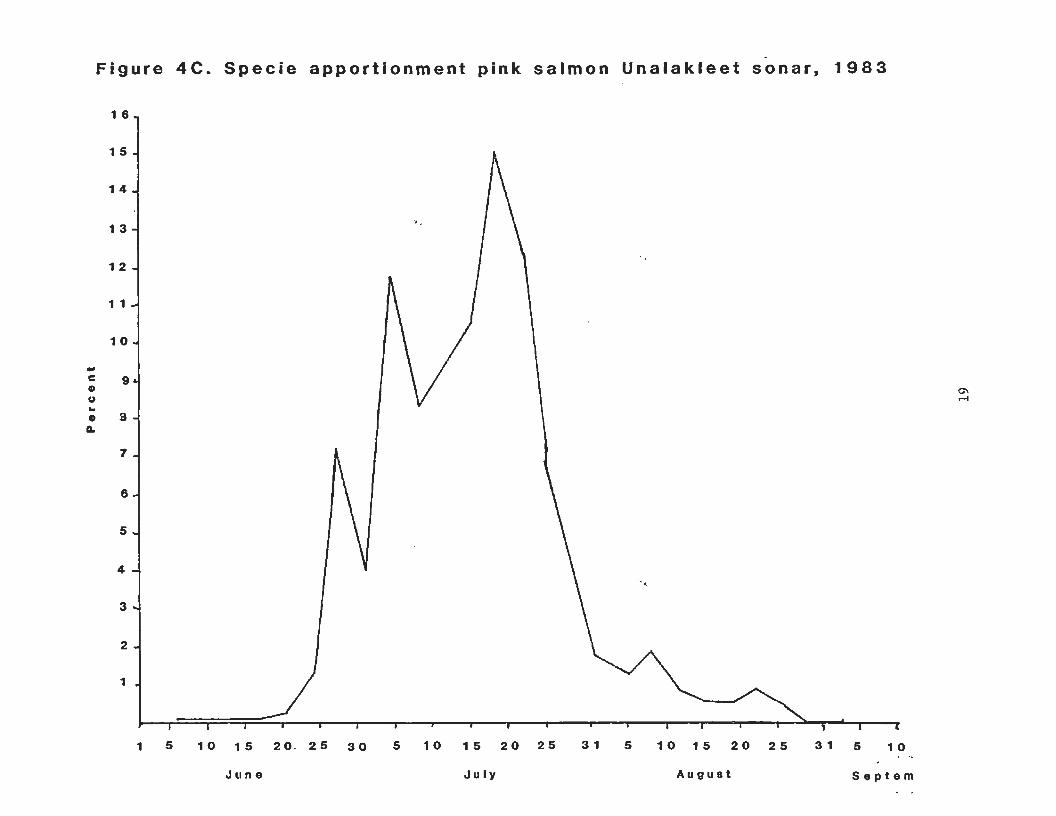
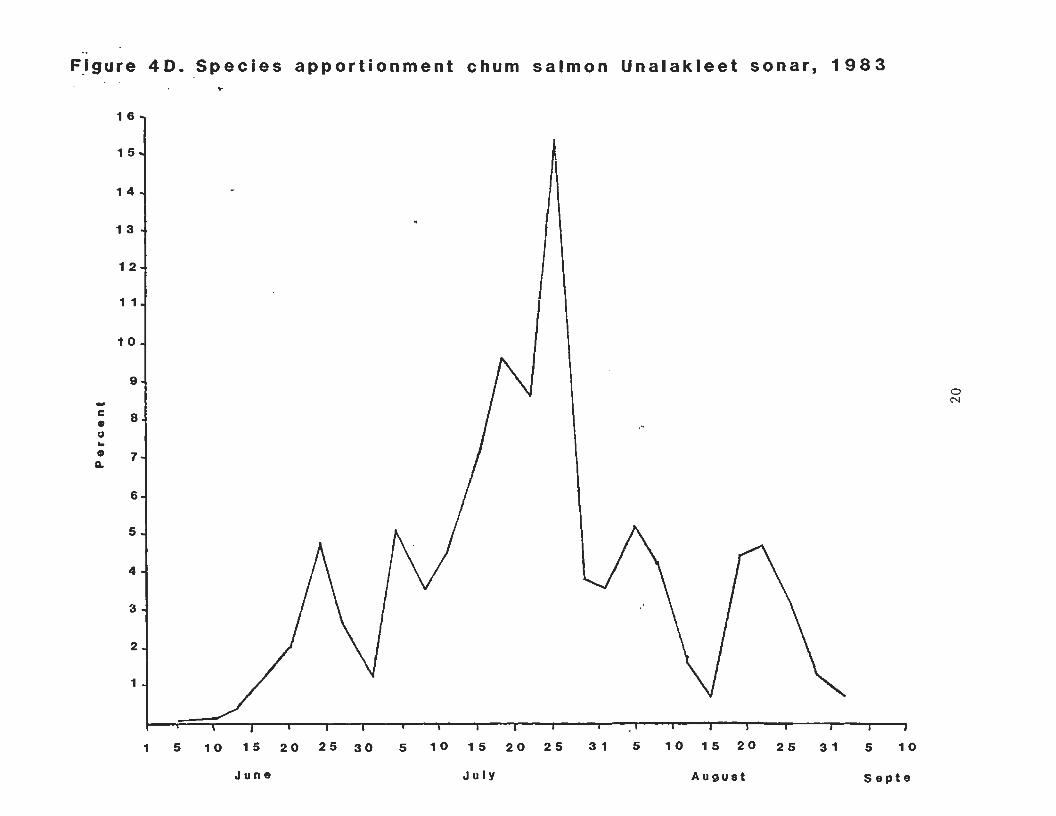
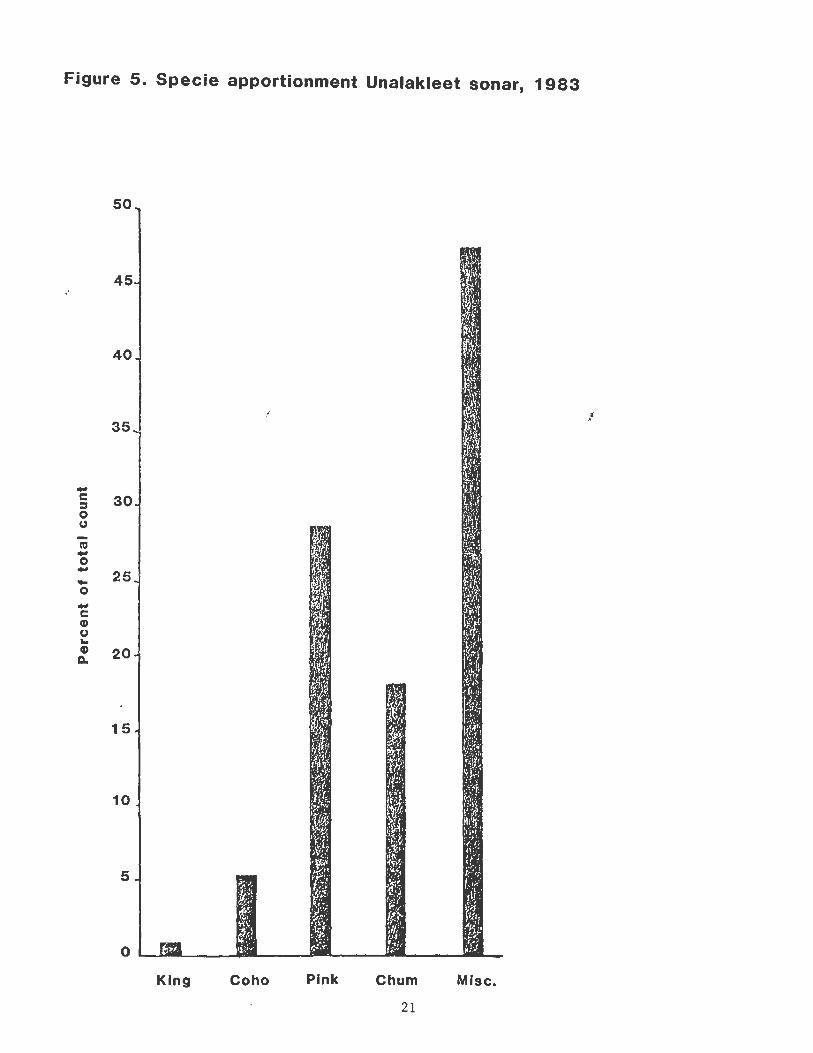
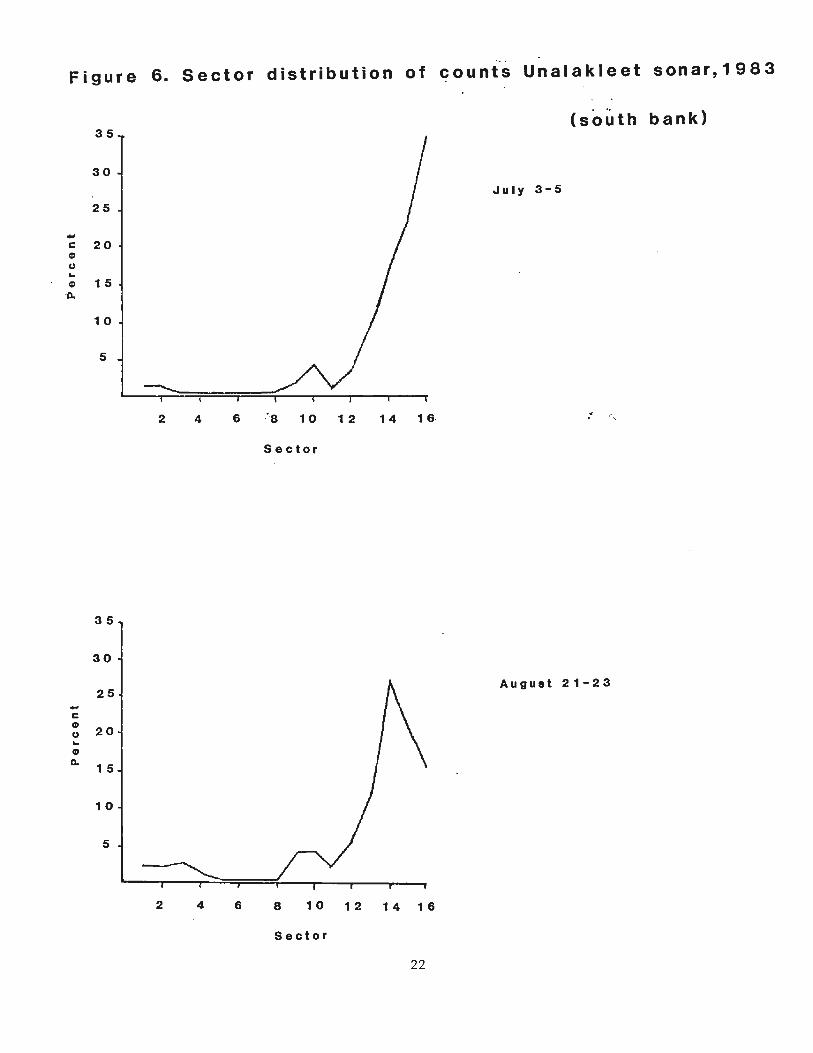
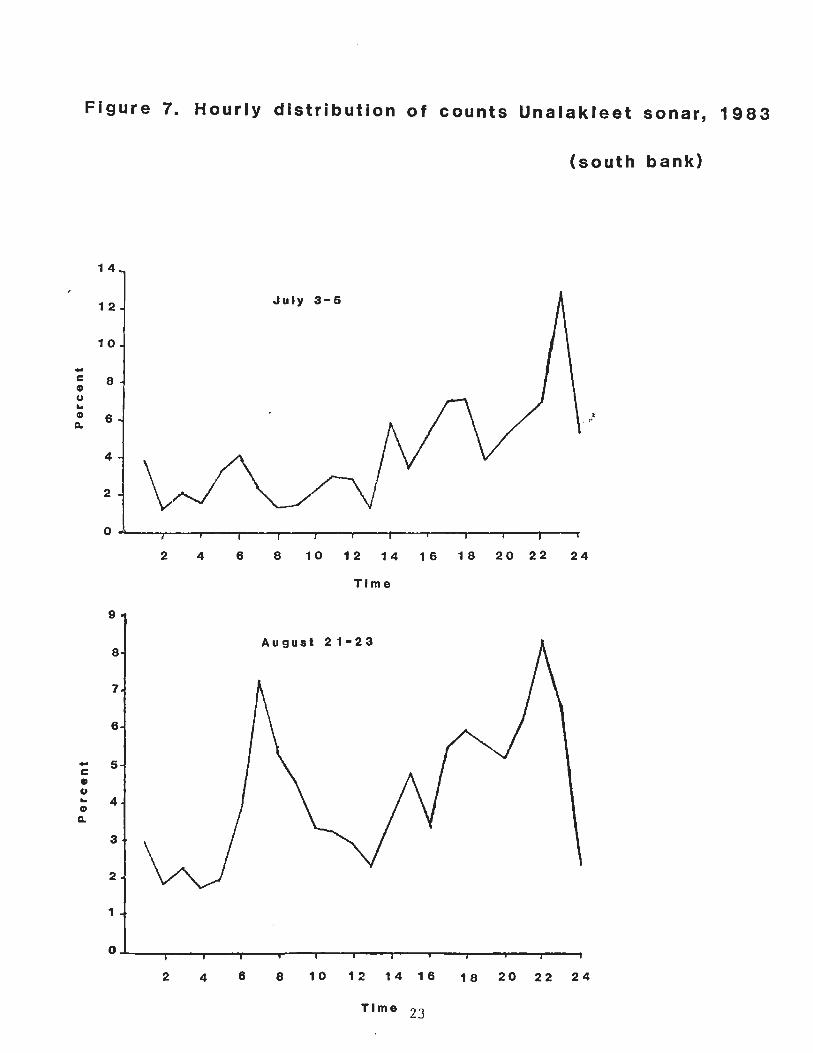
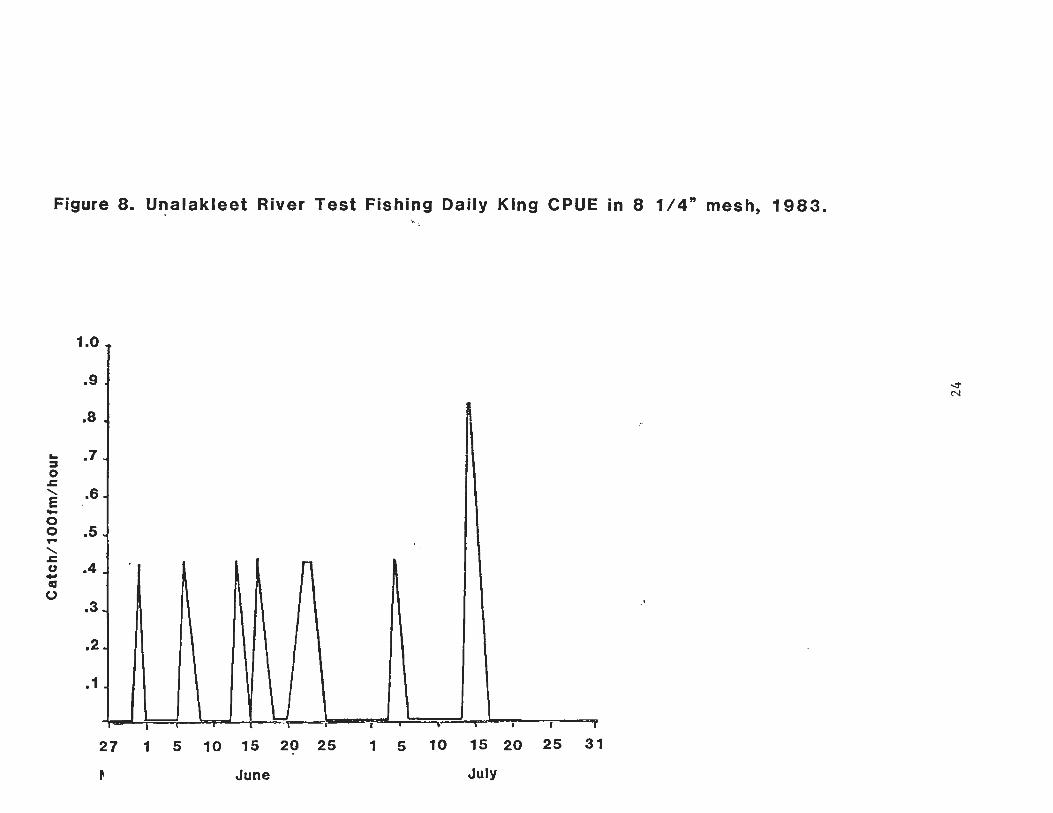
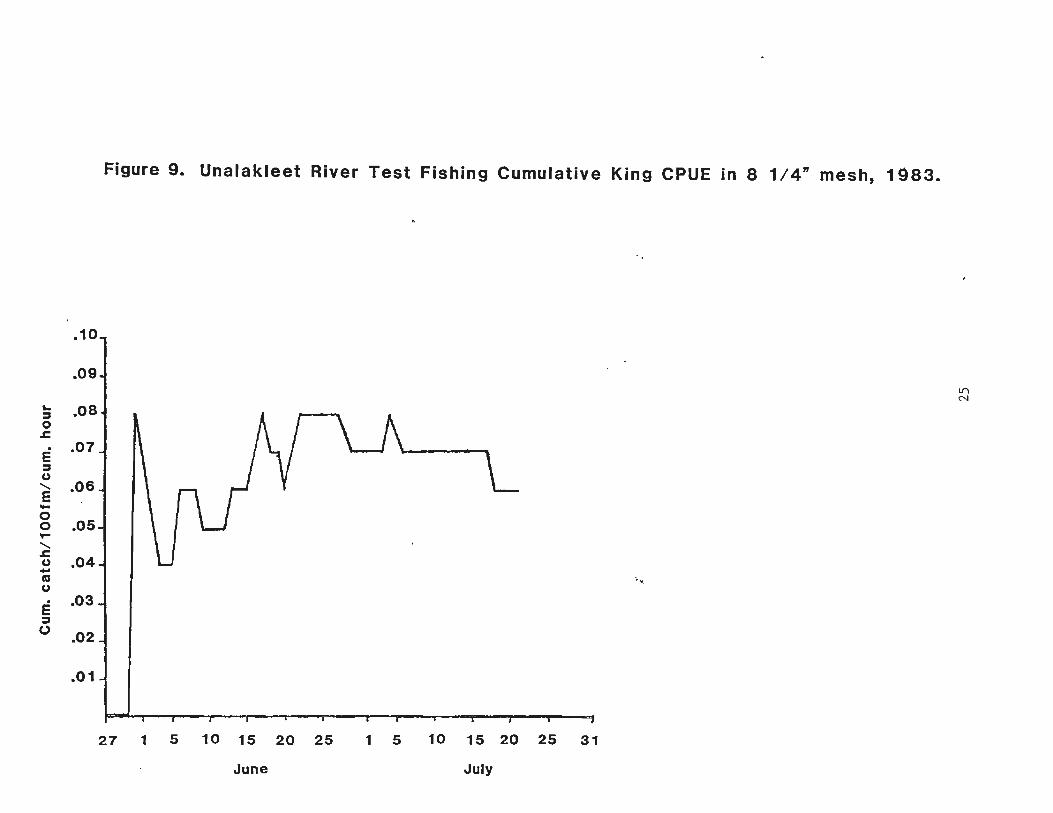