chinese overseas direct investment in the european union
TRANSCRIPT

CHINESE OVERSEAS DIRECT INVESTMENT IN THE EUROPEAN UNION
Jeremy Clegg Hinrich Voss
This project is funded by The European Union
A project implemented by Steinbeis GmbH & Co. KG für Technologietransfer

© Europe China Research and Advice Network, 2012 This publication may be reproduced for personal and educational use only. Commercial copying, hiring or lending of this publication is strictly prohibited. Europe China Research and Advice Network 10 St James’s Square London SW1Y 4LE +44 (0) 20 7314 3659 [email protected] www.euecran.eu
3
Contents Abbreviations and Acronyms .......................................................................... 7 Foreword ........................................................................................................ 8 Executive Summary ...................................................................................... 10 1 Scope of the Paper and Definitions ............................................................ 13 2 Chinese Outward FDI Globally and the Role of the EU ................................ 16 2.1 Structure of Chinese global outward FDI distribution .................................. 16 2.2 Distribution of OFDI by sector ...................................................................... 18 3 Chinese Outward FDI in the EU .................................................................. 21 3.1 Structure of intra-‐EU distribution ................................................................. 22 3.2 Sectoral distribution of investments ............................................................ 29 3.3 Impact of Chinese investments on local economies .................................... 36 4 Policies and Activities in the EU Towards Chinese Inward Investment ........ 45 4.1 The Lisbon Treaty ......................................................................................... 46 4.1.1 Pre-‐ and post-‐Lisbon stances and activities of the EU and its Member States ................................................................................................... 46 4.1.2 The Lisbon Treaty and transitional arrangements ..................................... 49 4.1.3 After Lisbon: in the steady state ................................................................ 51 4.2 Investment promotion in the Member States .............................................. 53 4.2.1 Member States’ attitudes to Chinese FDI .................................................. 56 4.2.2 Member States’ attitudes to the European Commission and the Lisbon Treaty ...................................................................................................... 59 5 Chinese Policies for Outward FDI and for FDI in the EU .............................. 61 5.1 Chinese policies for outward investment ..................................................... 61 5.2 Chinese policies for outward investment to the EU ..................................... 63 5.2.1 China’s Outbound Investment Catalogue .................................................. 63 5.2.2 China’s global economic and trade cooperation zones ............................. 67 6 Policy Recommendations ........................................................................... 70 6.1 The EU level .................................................................................................. 70 6.2 The Member State level ............................................................................... 71 7 Conclusion ................................................................................................. 72
4
References .................................................................................................... 75 Methodology ................................................................................................ 80 Annex A Industry Distribution of EU-‐27 Inward FDI Flows from China to Member States, 2005–09 .............................................................................. 82 Annex B Industry Distribution of EU-‐27 Inward FDI Stocks from China by Member States, 2003 .................................................................................... 83 Annex C Industry Distribution of EU-‐27 Inward FDI Stocks from China by Member States, 2006 .................................................................................... 84 Annex D Industry Distribution of EU-‐27 Inward FDI Stocks from China by Member States, 2009 .................................................................................... 85 Annex E Interview Guide ........................................................................... 86
Tables Table 1: Industry distribution of Chinese OFDI globally and in the EU, 2009 .... 20 Table 2: Industry distribution of EU acquisition target firms, 2000–2010 ......... 32 Table 3: Mergers and acquisitions in the EU by ownership and location of
operation, 2000–2010 ......................................................................... 33 Table 4: Indicators of Chinese firms in the EU ................................................... 39 Table 5: Indicators of US firms in the EU ............................................................ 43 Table 6: Indicators of Japanese firms in the EU ................................................. 44 Table 7: EU Member State national investment promotion agencies and their
offerings ............................................................................................... 55 Table 8: Attractiveness of EU Member States .................................................... 65 Table 9: Trade and investment hubs for Chinese firms in the EU-‐27 ................. 69
Figures Figure 1: Distribution of Chinese OFDI, 2003–09 ............................................... 17 Figure 2: Annual growth rates of Chinese OFDI, 2004–09 ................................. 18 Figure 3: Global distribution of Chinese OFDI stock by industry, 2004–09 ........ 21 Figure 4: Distribution of Chinese OFDI in the EU-‐27 by 2009 ............................. 23 Figure 5: Benefits of economic relationships: host Member States’ market size
and outward investment as an attractor of Chinese inward FDI stock, 2009 .......................................................................................... 25
Figure 6: M&As by Chinese firms in the EU-‐27, 2000–2010 ............................... 27 Figure 7: Ownership of Chinese acquisitions in the EU, 2000–2010 .................. 29

5
Figure 8: Industry sectoral distribution of Chinese acquisitions in the EU-‐27, 2000–2010 .......................................................................................... 30
Figure 9: Industry distribution by Chinese firm ownership type, 2000–2010 .... 31 Figure 10: Sector distribution in the Outbound Investment Catalogue,
in force in 2012 .................................................................................. 67
Boxes Box 1: Case studies of M&As in the EU by Chinese acquiring firms ................... 35

6

7
Abbreviations and Acronyms ASEAN Association of Southeast Asian Nations BIT Bilateral investment treaty CCP Common Commercial Policy (of the EU) CCPIT China Council for the Promotion of International Trade CIC China Investment Corporation EC European Commission EU European Union FDI Foreign direct investment FTA Free trade agreement/free trade area IIA International investment agreement IPA Investment promotion agency ISA Invest in Sweden Agency M&A Mergers and acquisitions MFN Most favoured nation MNE Multinational enterprise MOF Ministry of Finance (of the People's Republic of China) MOFCOM Ministry of Commerce (of the People's Republic of China) NBS National Bureau of Statistics (of the People's Republic of China) NDRC National Development and Reform Commission (of the People’s Republic of China) OECD Organization for Economic Cooperation and Development OFDI Outward foreign direct investment PCA Partnership and Cooperation Agreement PRC People's Republic of China REIO Regional economic integration organisation SAFE State Administration of Foreign Exchange (of the People's Republic of China) SAR Special Administrative Region SARIO Slovak Investment and Trade Development Agency SIC State Administration of Foreign Exchange (of the People's Republic of China)
Investment Company SME Small and medium-‐sized enterprise SOE State-‐owned enterprise SWF Sovereign wealth fund UKTI UK Trade and Investment (of the United Kingdom) UNCTAD United Nations Conference on Trade and Development WFIA West Holland Foreign Investment Agency WTO World Trade Organization

8
Foreword Chinese overseas direct investment has become one of the most keenly followed stories in the global economy over the last few years. Part of this is because the phenomenon is new; the People’s Republic of China has not historically deployed capital beyond its borders. The other reason is that Chinese overseas investment may be seen as an indicator of the country’s geopolitical intent and its wider international political strategy. Since 2008, headlines have appeared stating that in Africa, Latin America, and other developing areas, China is a new kind of colonial power, using its economic muscle to buy into economies and influence their internal affairs.
Professor Jeremy Clegg and Dr Hinrich Voss, both of Leeds University Business School, have an excellent background from which to shed light on the reality of Chinese investments in Europe. Firstly, they are trained economists, who have a track record in dealing with China’s operations as an overseas investor. Secondly, they have an excellent understanding of data analysis and how to critically compare statistics from both within the EU and from China. Finally, they employ a vigorous analytic framework from which they are able to make sense of the drivers of different kinds of Chinese direct investment. This understanding of the broader context of Chinese investment, both where it comes from and where it ends up going, helps to enrich their work.

CHINESE OVERSEAS DIRECT INVESTMENT IN THE EUROPEAN UNION
9
Through this paper, Clegg and Voss demonstrate that the excitable headlines that talk about vast amounts of Chinese money coming into Europe, driven by some grand centralised intent, are hard to prove from the current evidence. Instead, the impression that comes from their data and analysis is that the Chinese are very cautious both in how they invest, and where. This is as true for the state-‐owned enterprises coming over to Europe as for the non-‐state actors. For many of these investors, the EU is a formidably complex challenge that presents a great deal of fragmentation. While they see strong incentives to go to Europe seeking market access and benefits from its excellent technology and skilled labour, they also come across problems of how to navigate the different tax, union and insurance regulations across the Member States.
The underlying message of this paper is that while Chinese investment is set to grow in the years ahead, if it is to come in any great volume, Chinese investors will need assistance and guidance. Proactive policies at the national and EU-‐level are important, as is some clarification regarding the sectors where Chinese are welcomed to invest and the areas where there might be issues. The key is clarity. And this evidence-‐based research helps greatly to acquire this.
Kerry Brown, Team Leader ECRAN January 2012

10
Executive Summary International direct investments by the People’s Republic of China have increased markedly since 2000 and, by 2009, had come to exceed the total outward flows from leading EU investors such as the United Kingdom. In 2010, Chinese firms invested €52 billion (US$69 billion) overseas (MOFCOM, 2011). Notwithstanding this rising trend and the current magnitude of Chinese outward foreign direct investment (OFDI) globally, Chinese investments in the European Union (EU) are minor in terms of both China’s entire outward FDI and of inward FDI to the EU from the rest of the world. Thus the economic footprint and impact of Chinese investments in the EU is currently small. This is despite the EU being very open to FDI in general and to Chinese investments specifically and despite significant efforts by individual EU Member States to identify and attract Chinese investors. Countries that have a structured approach to Chinese investors, such as Germany, Sweden and the UK, have been successful in attracting investment. This is amplified when the host country has a large market, and has resulted in the concentration of FDI in a few leading EU Member States. This distribution raises questions about the underlying motives of Chinese investments and about the nature of the competitive advantages of Chinese investors. The scope for policy changes to increase the attractiveness of Europe to Chinese investors and for approaches to better promote the existing mutual benefits of such investments is thus the focus of this paper.

CHINESE OVERSEAS DIRECT INVESTMENT IN THE EUROPEAN UNION
11
Main points • The commercial EU-‐China FDI relationship is foremost a relationship
between individual Member States and China. There is evidence that the intensity of business relations between individual states and China stimulates Chinese investment. This suggests that FDI policy to encourage EU outward investment is a useful tool to generate inward FDI from China.
• Since 2000, Chinese investors have diversified the range of industries in the EU in which they invest. From an early focus on high technology, infrastructure and heavy industry, investment is now growing in the services sector – in healthcare, finance, media and entertainment – and coming into liberalised infrastructure sectors, such as telecommunications equipment.
• The apparent relationship between Chinese inward FDI and Member State market size fits with the view that the EU Internal Market is segmented. Large domestic markets help to spread the costs of doing business in individual Member States.
• Chinese firms’ acquisition activity follows the size of an economy and market liberalisation and also the opportunity to acquire strategic assets such as international networks of subsidiaries, technology and brands from both EU and non-‐EU resident enterprises.
• Investment promotion agencies in the Member States perform an important facilitation function, reducing the information and transaction costs to Chinese inward investors. The existence of investment promotion bodies at the sub-‐national level testifies to the importance attached to inward investment and to the willingness to commit resources to attract it.
• A focused, or ‘deep’, strategy is advocated for Member States in attracting inward investment that fits EU and host state priorities, and it possibly mirrors the Chinese central government’s practice of prioritising its firms’ outward investment through the use of, inter alia, economic cooperation and trade zones (in the EU).
• An integrated FDI policy, encompassing an international investment agreement, towards China at the EU level would help to reduce the average costs of Chinese firms doing business in the EU as a whole. An important element of this is the ‘costs of foreignness’ experienced by non-‐native (to the Member State) firms. These costs are natural, there being no discrimination against Chinese (or other foreign) investors. Such a policy
12
would also help to lower the excess costs of conducting business in those Member States that lag behind the most progressive ones.
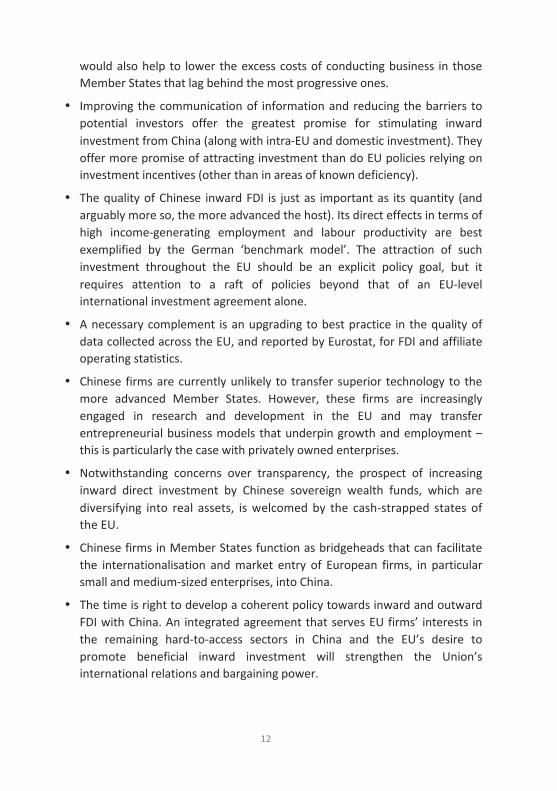
• Improving the communication of information and reducing the barriers to potential investors offer the greatest promise for stimulating inward investment from China (along with intra-‐EU and domestic investment). They offer more promise of attracting investment than do EU policies relying on investment incentives (other than in areas of known deficiency).
• The quality of Chinese inward FDI is just as important as its quantity (and arguably more so, the more advanced the host). Its direct effects in terms of high income-‐generating employment and labour productivity are best exemplified by the German ‘benchmark model’. The attraction of such investment throughout the EU should be an explicit policy goal, but it requires attention to a raft of policies beyond that of an EU-‐level international investment agreement alone.
• A necessary complement is an upgrading to best practice in the quality of data collected across the EU, and reported by Eurostat, for FDI and affiliate operating statistics.
• Chinese firms are currently unlikely to transfer superior technology to the more advanced Member States. However, these firms are increasingly engaged in research and development in the EU and may transfer entrepreneurial business models that underpin growth and employment – this is particularly the case with privately owned enterprises.
• Notwithstanding concerns over transparency, the prospect of increasing inward direct investment by Chinese sovereign wealth funds, which are diversifying into real assets, is welcomed by the cash-‐strapped states of the EU.
• Chinese firms in Member States function as bridgeheads that can facilitate the internationalisation and market entry of European firms, in particular small and medium-‐sized enterprises, into China.
• The time is right to develop a coherent policy towards inward and outward FDI with China. An integrated agreement that serves EU firms’ interests in the remaining hard-‐to-‐access sectors in China and the EU’s desire to promote beneficial inward investment will strengthen the Union’s international relations and bargaining power.

CHINESE OVERSEAS DIRECT INVESTMENT IN THE EUROPEAN UNION
13
1 Scope of the Paper and Definitions The purpose of this paper is to analyse the factors that have driven and constrained Chinese investments in the EU from 2000 to 2010 in order to develop policy recommendations to the EU and its Member States for increasing their share of Chinese foreign direct investment (FDI). The geographical focus of investment for this paper is the EU of 27 Member States (EU-‐27). The narrower boundaries of the EU of 15 Member States (EU-‐15) will be used when we refer to time periods before 2004 (i.e. the pre-‐Fifth-‐Enlargement members).
This paper focuses on foreign direct investment by mainland Chinese firms, that is, where the ultimate parent company is Chinese. This can be determined by using mergers and acquisitions (M&A) data, but not with conventional FDI statistics. Thus portfolio investments, government bond purchases and direct investments from the Hong Kong Special Administrative Region (SAR), from the Macao SAR, from Taiwan or from any offshore tax haven are not considered here. Direct investments from Japan, South Korea and the US are included only for comparative reasons, to put Chinese investments in the EU into international perspective. A Chinese foreign direct investment in the EU is taken to mean investment owned by a Chinese-‐resident enterprise in an EU-‐resident

14
enterprise, with the intention of establishing a lasting interest while exercising a significant degree of management influence. Such influence is inferred if the investor has 10 per cent or more of equity-‐based voting power (see UNCTAD 2009a, p. 38; OECD 2008, para. 117).
Chinese firms that invest overseas (including in Hong Kong, which is still regarded as autonomous from the People’s Republic of China (PRC) except in foreign policy and defence), thus owning productive assets in at least two countries, are classified as multinational enterprises (MNEs). This is regardless of their size or form of ownership. Forms of ownership addressed in this paper cover state-‐owned and privately owned firms. Chinese listed firms can also fall into either of these categories. Sovereign wealth funds (SWFs), such as the China Investment Corporation (CIC) and the State Administration of Foreign Exchange (SAFE) Investment Fund, are government-‐owned investment vehicles, not state-‐owned enterprises. They are not solely, nor even predominantly, FDI-‐focused organisations. They are therefore treated as a separate form of investor. Monetary values are presented in euros. US dollar values are converted into euros using the exchange rates published by Eurostat (2011a) (see Methodology for details).
Our analysis comprises a Chinese and a European perspective. The Chinese perspective is applied when we consider the investment pattern and motivation of Chinese state-‐owned and privately owned investors. Firms invest internationally in order to expand or to defend their overseas market (so-‐called market-‐seeking investment); to secure better access to raw materials such as oil and minerals (resource-‐seeking); to secure better access to technologies, brands, distribution channels (strategic asset-‐seeking); and/or to reduce overall production costs by utilising cheaper inputs, generally labour, or to achieve greater productivity (efficiency-‐seeking). Depending on the investment motive (and often several motives are present at a time), potential investors consider and evaluate host country characteristics comparatively. Such characteristics encompass Chinese government attitudes and the Chinese institutional framework towards investing abroad.
Indeed, one aspect that must not be overlooked in the Chinese context is the role of the government, which has been central in guiding the domestic economy to today’s economic success. The stance of central government policy has changed towards outward investment in recent years. Although cross-‐border investments were first permitted in the late 1970s, they were heavily

CHINESE OVERSEAS DIRECT INVESTMENT IN THE EUROPEAN UNION
15
restricted by the government. This slowly changed during the 1980s and 1990s as a regulatory framework was developed and state-‐owned enterprises incrementally gathered experience in operating in foreign markets. The most prominent initiative to signal that the government deemed Chinese companies sufficiently prepared was the ‘Go Global’ policy, formally decreed in 2000.
In this paper, we note in outline the relaxation of official Chinese policy, but we do not go into detail or project the future. We give priority to what lies within the policy domain of the EU to win its share (and influence the quality) of China’s outward FDI rather than the aggregate quantity of its OFDI. Equally, the challenge of access to capital by privately owned small and medium-‐sized (SME) Chinese firms within China is recognised, but our emphasis has to be on what can be done in the EU for these firms.
Therefore, to complement the Chinese perspective, a European perspective is employed in order to analyse the attractiveness of Chinese investors and to evaluate the success of EU Member States in bringing them to Europe. Market, institutional and policy conditions are assessed for the way in which they support Chinese investments (through, for example, investment promotion agencies, specialised investment and trading hubs) but also hinder them (through restrictive work permits, visa regulations and so on). After the Treaty of Lisbon in 2009, responsibility for external investment policy was shifted from the Member States to the European Union. This transfer of competence was accompanied by calls to better coordinate EU economic and migration policies, to enable the EU to speak with one voice, and more effectively, to potential inward investors. This could ameliorate Chinese investors’ currently cautious perception of the EU and stimulate greater Chinese inward FDI. Better data, and data transparency, in the EU is imperative so as to assess in greater detail the magnitude and impact of Chinese investors. Jointly the two sides help us to understand better the current status of Chinese FDI in Europe and its potential future path. Based on the analysis in this paper, suggestions are developed about how the EU can increase its attractiveness to Chinese investors.

16
2 Chinese Outward FDI Globally and the Role of the EU The importance and magnitude of Chinese direct investments to, and within, the EU cannot be assessed properly without first being contextualised. We therefore begin by presenting an analysis of Chinese direct investment globally. This is done in two parts: 1) its distribution in terms of absolute values and growth figures, from which we infer the importance of the EU to Chinese investors, and 2) the industrial distribution of Chinese investments globally.
2.1 Structure of Chinese global outward FDI distribution In 2010, Chinese firms made investments of €52 billon (US$69 billion) overseas (MOFCOM, 2011). Early investments from China were directed towards the industrialised countries Australia, Canada and the US. But this has changed since the mid-‐1990s, and today the majority of Chinese investments are directed to emerging and developing countries (see Figure 1). A major pull factor for Chinese investments globally is the level of natural resource endowment of host countries, in particular oil (Kolstad and Wiig, 2012; Duanmu, 2012).
The offshore financial centres the British Virgin Islands, the Cayman Islands and Hong Kong accounted for 75.3 per cent of China’s initial investment flows and 78.6 per cent of its FDI stocks in 2009. Those economies account for 88.7 per cent and 93.6 per cent of Chinese investments in Asia and Latin America respectively. These figures, as is true of many for China in this paper, are taken from data supplied by the National Bureau of Statistics (NBS), the Ministry of Commerce (MOFCOM) and SAFE. It is important to note that the figures refer to the initial country location in which inward investments are recorded, not to the final destination of the investments. Similar to Luxembourg, these countries are gateways for FDI because they offer professional services and institutional support unavailable in China (Sutherland, El-‐Gohari, Buckley and Voss, 2010) and can give Chinese investors the cover of another nationality. This is useful when investment from China might be controversial or for the purpose of reinvesting in China as a nominally foreign investor (Sutherland and Ning, 2011). Consequently, the value of Chinese investment in regions such as the EU has to be regarded as higher than the conservative Chinese figures suggest.

CHINESE OVERSEAS DIRECT INVESTMENT IN THE EUROPEAN UNION
17
Figure 1: Distribution of Chinese OFDI, 2003–09 (€ billion, %)
Note: Oceania is Australia, New Zealand and Micronesia. Source: NBS, MOFCOM and SAFE (2010).
The EU saw an increase in Chinese inward investment from €0.3 billion (US$0.4 billion) to €4.5 billion (US$6.3 billion) between 2003 and 2009 (NBS, MOFCOM and SAFE, 2010). This was an annual growth rate of Chinese outward FDI stock to the EU-‐27 of 57.0 per cent, much above the 39.5 per cent growth rate of the global Chinese FDI stock.
In 2006–09, the progress of Chinese investment in the EU became decoupled from the global trend. Chinese investments there were rising faster than the global average until the Anglo-‐American financial and economic crisis. Then the downward pressure on investment worldwide translated into a far steeper decline of Chinese FDI in the EU (and North America). In particular, a majority of Chinese SMEs expressed the intention to reduce their overseas investments, and a desire to seek more advantageous host economies (CCPIT, 2009). The crisis also heralded changes in the motivation for investment by Chinese firms (see Figure 2). The strategic intent of Chinese investors in the EU market shifted almost entirely away from the resource-‐rich regions, as Chinese enterprises became opportunistic acquirers of firms, and parts of firms, in response to the shrinkage of EU corporations’ equity value during the crisis. This will be

18
discussed further in section 3. However, the movements of Chinese FDI into the EU over the period average out; and the share of Chinese investment secured by the EU has returned to around 2.5 per cent (the same level prior to the crisis). Africa, as a region, has increased its share since 2003, as has Oceania; Asia’s share has recovered since a low in 2006. But share diagrams (as with Figure 1) obscure the fact that Chinese investment has been rising: each region is competing for levels of Chinese FDI, not for share.
Figure 2: Annual growth rates of Chinese OFDI, 2004–09 (%)
Source: NBS, MOFCOM and SAFE (2010).
2.2 Distribution of OFDI by sector The industry sectoral distribution of Chinese OFDI has changed over time (see Table 1 and Figure 3).1 Investments in mining and manufacturing dominated the scene with a combined share of 60.2 per cent up to 2003 when China reported, for the first time, OFDI statistics that were in line with OECD and IMF definitions (Cheung and Qian, 2009; NBS, MOFCOM and SAFE, 2010). As a result, both sectors recorded dramatic falls in share while investments in business services and finance gained ascendancy. The latter two sectors are important in 1 Detailed data for the industry distribution by Member State are provided in Annexes A, B, C and D.

CHINESE OVERSEAS DIRECT INVESTMENT IN THE EUROPEAN UNION
19
supporting the internationalisation of home-‐country enterprise: firms from those sectors either follow their major domestic clients or prepare the path on to which their domestic clients step. The increase in share of these sectors can therefore be regarded as a continuous intensification of the internationalisation process by Chinese firms. This is further confirmed by the stable share recorded by investments in the wholesale and retail sectors. Such investments tend to be market-‐developing, or -‐defending, in those cases where trade links already exist. There is a consensus in research that bilateral trade, in the form of exports and imports to and from the host country, are important determinants of the geographical pattern of Chinese OFDI (Buckley, Clegg, Cross et al., 2007; Kolstad and Wiig, 2012).
The published Chinese statistics do not enable us to see the simultaneous industry-‐by-‐country distribution of Chinese OFDI. However, previous academic work indicates that mining activities are taking place mainly in countries with large resource endowments and that these investments are normally carried out by state-‐owned enterprises (SOEs). These investments happen to be in institutionally weak and unstable countries (Buckley, Clegg, Cross et al., 2007; Kolstad and Wiig, 2012). Chinese privately owned firms frequently provide auxiliary services for the resource-‐seeking state-‐owned enterprises in such countries. Investments in manufacturing occur in large markets and in those with low factor costs (Duanmu, 2012). Access to technologies, brands, distribution channels and other strategic assets are the hallmark of Chinese investments in institutionally developed and stable economies (Kolstadt and Wiig, 2012). This pattern matches the observation by Cuervo-‐Cazurra (2007) that emerging-‐market firms tend to locate sales, marketing and R&D-‐related activities in host countries where they can exploit their home-‐country advantages and that they locate manufacturing activities in hosts when the cross-‐border transfer of end products is difficult or when host country advantages of location can be exploited. It follows from this that Chinese investments in the more advanced economies of the EU-‐15 should be characterised by smaller-‐scale, knowledge-‐exploring, high-‐value manufacturing and goods-‐trading investments. The Fifth-‐Enlargement Member States, which joined the EU in 2004 and 2007, are more likely to receive predominantly standardised manufacturing or assembly-‐related FDI.
The small share of Chinese FDI destined for the European Union raises a number of questions that we intend to address in the following sections. In particular, are Europeans making a sufficient effort to attract Chinese

20
investments or are the wrong Chinese investors being courted? Are there artificial or natural barriers to Chinese investments? Before we can answer these questions, it is important to understand better what is happening in the EU.
Table 1: Industry distribution of Chinese OFDI globally and in the EU, 2009 (%)
Global flows
Global stocks
EU-‐27 flow
EU-‐27 stock
Agriculture, forestry, husbandry, fishery 0.61 0.83 1.95 3.13
Mining 23.60 16.51 0.70 3.59
Manufacturing 3.96 5.53 7.47 15.98
Power and other utilities 0.83 0.92 -‐ -‐
Construction 0.64 1.39 -‐ -‐
Transport, warehousing and postal services 3.66 6.77 0.53 4.24
IT 0.49 0.80 0.00 0.00
Wholesale and retail 10.85 14.52 1.22 7.57
Residential and catering trade 0.13 0.10 0.96 1.08
Finance 15.45 18.72 7.12 16.86
Real estate 1.66 2.17 0.68 1.40
Leasing and business services 36.22 29.68 78.01 42.49
Scientific research, technical services and geosurvey 1.37 1.17 0.31 1.71
Water, environment and public facility management 0.01 0.43 – –
Residential service and other services 0.47 0.39 0.68 0.78
Education 0.00 0.01 – –
Public health and social welfares 0.00 0.00 – –
Culture, sport and entertainment 0.03 0.06 – –
Public management and social organization – – – –
Other 0.00 0.00 0.36 1.16
Total 100.00 100.00 100.00 100.00
Note: a dash (–) denotes that the data are not given in the 2009 Statistical Bulletin of MOFCOM. Source: NBS, MOFCOM and SAFE (2010).

CHINESE OVERSEAS DIRECT INVESTMENT IN THE EUROPEAN UNION
21
Figure 3: Global distribution of Chinese OFDI stock by industry, 2004–09 (€ billion)
Source: NBS, MOFCOM SAFE (2010)
3 Chinese Outward FDI in the EU The distribution of Chinese investment across the EU is an important indication of the ability of Chinese firms to invest and of their motivation for investment. However, there are limits to the extent to which we can determine competitiveness by using aggregate data. Chinese affiliates may simply be handling goods produced in China, in which case these firms’ competitiveness must inevitably owe more to the locational (comparative) advantage of China as a production base than to abilities specific to them. Chinese direct investments in the economically developed countries indicate a motivation to acquire technologies and brands as well as a degree of capability and competitiveness intrinsic to the firms concerned. On the other hand, investments in the Fifth-‐Enlargement countries of the EU point towards low-‐cost production strategies that target only the European market without upgrading the abilities of the investing Chinese firms.
The distribution of investments is also instructive for assessing the potential impact of Chinese FDI. For those of the Fifth-‐Enlargement countries that

22
otherwise receive little FDI, Chinese investment can offer a valuable contribution to industrialising their economy.
We now focus on the distribution of Chinese investment in the EU-‐27.
3.1 Structure of intra-‐EU distribution Chinese investment in the EU has always been concentrated in a small number of countries. France, Germany and the United Kingdom have together attracted on average 36.8 per cent of annual Chinese investment from 2003 to 2009 (MOFCOM, 2010).
We shall look at the distribution of Chinese outward investment in the European Union countries using three alternative measures, in order to build a picture of the true commitment of Chinese firms to the European market.
Figure 4, using data from Eurostat and from the NBS, MOFCOM and SAFE statistical bulletin, shows clearly that the distribution of Chinese OFDI is highly concentrated within the European Union. The top four investment locations account for 39.2 per cent of all Chinese investment there, according to Eurostat data. The ranking of the major host countries differs between the Eurostat data and the MOFCOM data, but we can see that the dominance by major host countries remains. And although there are significant conflicts between the two data sources, they do agree that the UK and Germany are major host countries to inward Chinese FDI.
The major disagreement between the two data sources concerns Denmark and France. They complete the leading four host countries, according to the Eurostat data; but Luxembourg and the Netherlands replace them in the top four, according to the MOFCOM data. This can be explained by known deficiencies in the data. Eurostat data are not reported for Luxembourg, and that immediately distorts the basis for comparison. This underlines the value of using MOFCOM data to identify where Chinese investments are directed. At the same time, Luxembourg is known to be an investment gateway into the EU, and so the recording of Chinese FDI entering Luxembourg is not necessarily that of where the investment remains. Data collected by the United Nations Conference on Trade and Development (UNCTAD) also supports this interpretation that Luxembourg is, in many cases, not the ultimate destination of investment (UNCTAD, 2011). We should also note that investment into

CHINESE OVERSEAS DIRECT INVESTMENT IN THE EUROPEAN UNION
23
Luxembourg is characteristically ‘lumpy’: it tends to be built up by the accumulation of a relatively few large-‐value investments.
Greater confidence in the data is yielded by a comparison of the two sources, as the absolute difference in the valuations for individual countries (for which both data sources are reported) is not excessive; and there is no evidence of significant systematic under-‐ or overvaluation. Generally, the Eurostat data estimate Chinese FDI in the EU to be a little higher than do the Chinese data (in 2009, €5.7 billion [in dollar terms, US$8 billion] as compared with €4.5 billion [US$6.3 billion]). Such differences in valuation are not unusual. It is deficiencies in reporting at Member State-‐level that are the most problematic; in particular, the absence of Eurostat data for Luxembourg distorts the picture. For certain states, we see that FDI positions may be negative, or might diminish rapidly. Although this might seem to suggest that FDI is zero, it actually signifies that affiliates are in credit with parent enterprises, and it may have much to do with financial repositioning internal to MNEs after the financial and economic crisis.
Figure 4: Distribution of Chinese OFDI in the EU-‐27 by 2009 (€ million)
Note: Blue denotes Eurostat data and red denotes NBS, MOFCOM and SAFE data. Source: Eurostat (2011b) and NBS, MOFCOM and SAFE (2010).

24
A combined analysis of both data sources suggests a clustering in the distribution of investments. First, there are the top two hosts, the UK and Germany, then the ‘super-‐cluster’ of Denmark, France and the Netherlands. After these countries, China invests in Austria, Italy, Poland and the like. A large number of Member States have received very little Chinese investment or record negative FDI positions, according to Eurostat. The remarkable concentration shown in Figure 4 suggests that the large-‐market countries of the Union received Chinese investment precisely because of the size of their domestic market. It suggests too that Chinese investors do not at present perceive the EU as a single integrated market. If this were the case, there would probably be a more even distribution in Chinese investment across the EU. Of course, the availability of acquisition targets is also skewed towards the large advanced markets of the Union. Moreover, a skewed distribution might reflect concentrated manufacturing facilities serving the entire European market, as is evident for investments from South Korea (in central and east European states) and Japan (in Germany and the UK). Besides the attraction of economic size, the concentration of Chinese investments in these states is arguably the outcome of sound bilateral international economic relations and the effective promotion of inward investment. We would need data on firms’ strategies so as to unequivocally determine the explanation.
In order to convey an impression of the influence of the mutual economic relationship, we consider here EU Member States’ FDI into China. Their investments are generally underpinned by high-‐level governmental support and by a range of investment promotion agencies for large and small European firms (see EU SME Centre, www.eusmecentre.org.cn), jointly indicating a deep interest in mutual economic relations. A Member State’s large economic footprint in China can thus stimulate trust in the intentions of the investor’s home economy.
We analyse Member States’ FDI into China against European market size at the individual state level. The size of the bubbles in Figure 5 represents the scale of Chinese FDI into each Member State. This reveals evidence of a strong link between the intensity of the two-‐way investment relationship between a Member State and China and the propensity of Chinese firms to invest in the EU. In the case of Germany, there is evidence that German firms acquired by Chinese firms have enjoyed a long relationship with their acquirer. In many other cases too, acquisition is the culmination of a significant business relationship (Knoerich, 2010). This means that we should expect a degree of

CHINESE OVERSEAS DIRECT INVESTMENT IN THE EUROPEAN UNION
25
symmetry between investment by a Member State in China and the reciprocation of Chinese investment in that state.
The intensity of business relations (covering bilateral trade and Member State FDI in China) appears to be a positive factor in accounting for the distribution of Chinese investment in the EU. Clearly other factors come into play. For example, the importance of Denmark as an investment host and the pre-‐eminence of the UK suggest that factors at the host Member State level have much influence on Chinese investors. Nevertheless, we have to conclude that the EU-‐China FDI relationship is primarily a bilateral phenomenon at the Member State level rather than a relationship between the European Union, as an integrated market, and China. This is likely to become more pronounced in the future. A preponderance of Chinese SMEs, surveyed for their attitudes towards investing in the EU, indicate a strong preference for the four economies with which strong investment ties already exist -‐ France, Germany, Italy and the UK (CCPIT, 2010).
Figure 5: Benefits of economic relationships: host Member States’ market size and outward investment as an attractor of Chinese inward FDI stock, 2009 (€ billion)
Source: Authors’ calculations based on Eurostat (2011b).

26
The third data source that we employ to build a picture of Chinese direct investment in the EU is M&A data. In practice, most of the transactions are acquisitions: they represent the takeover of a firm located in the EU (but not necessarily owned by European owners or operating in Europe) rather than the merger of two separate legal entities. In advanced markets such as the EU, we would expect a higher number of M&As in the inflow of FDI. The bulk of M&A activity by Chinese investors is, again, located in those most developed, large and favoured economies for investment, which have relatively liberalised markets (see Figure 6). This reflects the availability of suitable investment targets and the expertise, in the form of business services, to conduct merger and acquisition transactions. As most M&As are straight acquisitions, we can interpret the Chinese predilection for investment in the leading EU host states to indicate that they acquire firms for their technology, international brands, international networks of subsidiaries and international distribution channels. At present, Indian firms acquire more European firms than the Chinese do (Ernst & Young, 2011; Sun et al., 2010), but the rate and spread of Chinese acquisitions is on a rising trend.
Companies in the United Kingdom, Germany, France, Italy and the Netherlands are the main subjects of Chinese takeovers. Acquisition activity is found predominately in the same countries in which the aggregate FDI data indicate the greatest inflow of Chinese investment. We cannot expect the FDI data, which are reported on an OECD FDI definition basis, to agree with the M&A data, as these are recorded on a transaction basis. However, these transaction data do support our overall finding that the international EU-‐China relationship is primarily a result of the decision by Chinese investors to invest in the Member State concerned.

CHINESE OVERSEAS DIRECT INVESTMENT IN THE EUROPEAN UNION
27
Figure 6: M&As by Chinese firms in the EU-‐27, 2000–2010
Note: EU Member States not listed above did not record deals in 2000–2010. Source: Thomson Reuters (2011).
An advantage of acquisition data is that, unlike the aggregate FDI position data collected by Eurostat and by NBS, MOFCOM and SAFE, they allow us to gain insight into the nature of the Chinese investor’s form of ownership. This is a controversial matter. The advances by Huawei, the telecommunications equipment manufacturer, to acquire Marconi (UK) stumbled over its suggested close links with the Chinese government and armed forces. China National Offshore Oil Corporation (CNOOC) (oil) and Lenovo (IT) encountered similar problems in the US. The underlying host-‐country concern is about the perceived influence that the Chinese government may exert on the operations and activities in the host country through the Chinese investor.
There are four ownership categories of Chinese investor (see Figure 7). The ‘Investor’ category refers either to a consortium of several investors or to equity investors who do not fall into the other categories. Government investors are those who form part of the Chinese state, such as SOEs. Public investors are corporations with shares that are publicly traded. But this does not mean that a significant proportion of their equity cannot lie in Chinese government hands, either directly or indirectly. Therefore, it is not possible to
28
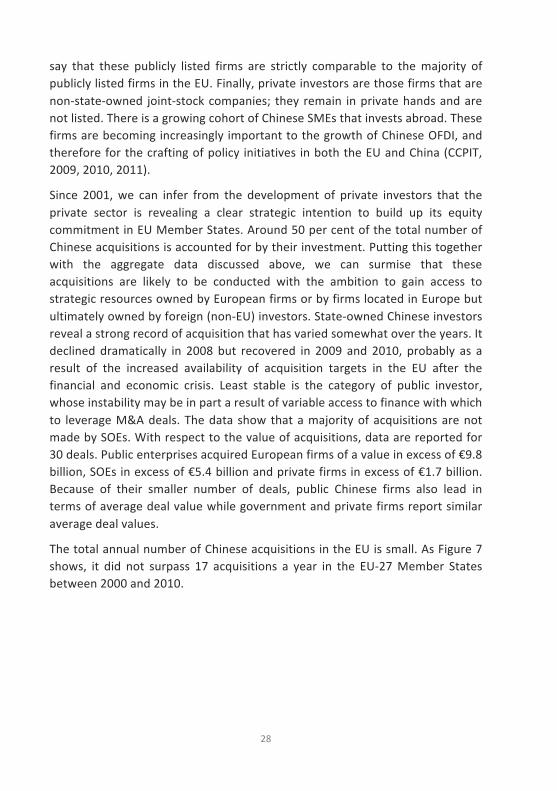
say that these publicly listed firms are strictly comparable to the majority of publicly listed firms in the EU. Finally, private investors are those firms that are non-‐state-‐owned joint-‐stock companies; they remain in private hands and are not listed. There is a growing cohort of Chinese SMEs that invests abroad. These firms are becoming increasingly important to the growth of Chinese OFDI, and therefore for the crafting of policy initiatives in both the EU and China (CCPIT, 2009, 2010, 2011).
Since 2001, we can infer from the development of private investors that the private sector is revealing a clear strategic intention to build up its equity commitment in EU Member States. Around 50 per cent of the total number of Chinese acquisitions is accounted for by their investment. Putting this together with the aggregate data discussed above, we can surmise that these acquisitions are likely to be conducted with the ambition to gain access to strategic resources owned by European firms or by firms located in Europe but ultimately owned by foreign (non-‐EU) investors. State-‐owned Chinese investors reveal a strong record of acquisition that has varied somewhat over the years. It declined dramatically in 2008 but recovered in 2009 and 2010, probably as a result of the increased availability of acquisition targets in the EU after the financial and economic crisis. Least stable is the category of public investor, whose instability may be in part a result of variable access to finance with which to leverage M&A deals. The data show that a majority of acquisitions are not made by SOEs. With respect to the value of acquisitions, data are reported for 30 deals. Public enterprises acquired European firms of a value in excess of €9.8 billion, SOEs in excess of €5.4 billion and private firms in excess of €1.7 billion. Because of their smaller number of deals, public Chinese firms also lead in terms of average deal value while government and private firms report similar average deal values.
The total annual number of Chinese acquisitions in the EU is small. As Figure 7 shows, it did not surpass 17 acquisitions a year in the EU-‐27 Member States between 2000 and 2010.

CHINESE OVERSEAS DIRECT INVESTMENT IN THE EUROPEAN UNION
29
Figure 7: Ownership of Chinese acquisitions in the EU, 2000–2010 (number of completed deals)
Source: Thomson Reuters (2011).
3.2 Sectoral distribution of investments The data originating from China’s MOFCOM do not detail the industry distribution of Chinese investments in the European Union. We therefore rely here on Eurostat data for the general investment pattern and on Thomson Reuters data for information on acquisition-‐related patterns.
Figure 8 shows that although there is much year-‐on-‐year variation, European firms in the ‘industrials’ and ‘materials’ sectors have been the main targets for acquisition in the first decade of the twenty-‐first century. The ‘consumer staples’ industry sector is a constant feature in the acquisition pattern, but ‘high technology’ firms have only recently become targets.
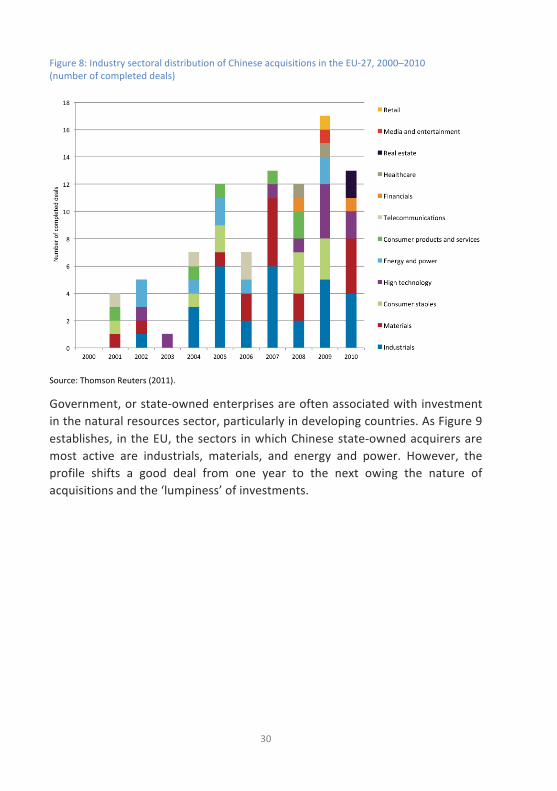
30
Figure 8: Industry sectoral distribution of Chinese acquisitions in the EU-‐27, 2000–2010 (number of completed deals)
Source: Thomson Reuters (2011).
Government, or state-‐owned enterprises are often associated with investment in the natural resources sector, particularly in developing countries. As Figure 9 establishes, in the EU, the sectors in which Chinese state-‐owned acquirers are most active are industrials, materials, and energy and power. However, the profile shifts a good deal from one year to the next owing the nature of acquisitions and the ‘lumpiness’ of investments.

CHINESE OVERSEAS DIRECT INVESTMENT IN THE EUROPEAN UNION
31
Figure 9: Industry distribution by Chinese firm ownership type, 2000–2010 (number of completed deals)
Source: Thomson Reuters (2011).
Foreign acquirers’ business motives and Member States’ locational advantages together explain the industry patterns we observe in Table 2. The United Kingdom has a wide range of targeted industries, including a good representation in the service sector. Germany is more focused on industrial and physical goods. This would seem to match with the strategic targeting by Chinese firms of enterprises with intangible assets, such as technology, capabilities and brands.
There is a further dimension to Chinese acquisition. The evidence which shows Chinese acquirers to be buying the operations of firms in the EU, but in the telecommunications and infrastructure sectors, also suggests that they are doing so to acquire the networks of operations of firms that have become multinationalised in Europe, particularly since the mid-‐1980s. Since the year 2000, the range of industries in which Chinese firms have acquired EU firms has broadened appreciably, both at the Member State level and at the European level. From an early focus on high technology, infrastructure and heavy industry, Chinese firms have now moved into the services sector, including healthcare, finance, media and entertainment, and into liberalised infrastructure sectors such as telecommunications equipment. This points to the growing strength of Chinese firms outside the manufacturing sector.

32
Table 2: Industry distribution of EU acquisition target firms, 2000–2010 (number of completed deals)
2000–2003 2004–07 2008–10
Austria Industrials 1
Belgium Consumer products and services
1
Bulgaria Financials 1
Denmark
Industrials
1
Energy and power High technology
1 1
Finland
Healthcare High technology
1 1
France Materials Industrials High technology
1 1 1
Materials Industrials Consumer staples Telecommunications
1 1 1 1
Industrials Consumer staples High technology
2 2 1
Germany Materials High technology
1 1
Industrials Materials Energy and power Consumer products and services
7 2 1 1
Industrials Consumer products and services
2 1
Hungary Materials Real estate
3 2
Ireland High technology 1
Italy Consumer staples 1 Consumer staples Industrials
1 2
Materials Industrials High technology Consumer staples
1 2 2 1
Luxembourg Financials 1
The Netherlands
Telecommunications Consumer products and services
1 1
Telecommunications Consumer staples Industrials
2 1 1
Healthcare High technology Materials Industrials
1 1 1 1
Portugal Consumer staples 1
Spain Energy and power 2 Materials 1 Industrials 1
Sweden Industrials 2
United Kingdom
Industrials Materials Energy and power High technology Consumer products and services
5 4 3 1 1
Media and entertainment Consumer products and services Materials Consumer staples Retail Consumer staples Energy and power
1 1 1 1 1 1 1
Note: No M&As in other EU countries have been recorded. Source: Thomson Reuters (2011).

CHINESE OVERSEAS DIRECT INVESTMENT IN THE EUROPEAN UNION
33
Finally, in order to more precisely identify the motive for Chinese acquisitions in the EU, we now look at the breakdown of ownership of the Chinese acquiring firm and the main location of operations of the target firm. Table 3 presents the distribution of the location of the target enterprise and of the ownership of the target.
Table 3: Mergers and acquisitions in the EU by ownership and location of operation, 2000–2010
Number of completed M&A deals, 2000–2010 20
00
2001
2002
2003
2004
2005
2006
2007
2008
2009
2010
2000
–201
0
EU-‐located target (consisting of an EU-‐parented firm) acquired by a Chinese firm
0 4 3 1 7 11 5 13 8 15 16 83
EU-‐located target (owned by a non-‐EU parent) acquired by a Chinese firm 0 1 0 0 0 1 2 0 4 1 1 10
Non EU-‐located target (owned by an EU parent) acquired by a Chinese firm 3 6 5 9 7 6 9 5 8 8 12 78
Note: Of the 10 EU firms belonging to a non-‐EU parent that were acquired by a Chinese firm, four already belonged to a Chinese parent company. Source: Thomson Reuters (2011).
There has been an upward trend in the number of EU-‐located and -‐parented companies acquired by Chinese firms between 2000 and 2010, with annual acquisitions averaging in the mid-‐teens and amounting to a cumulative total of 83 by 2010. This testifies to those firms’ growing appetite and capacity to acquire European enterprises with a view to competing head-‐to-‐head with established firms in the Union if, as yet, on a modest scale.
Although classified as business transactions, acquisitions may appear from the host country’s perspective to be simply the swapping of existing third-‐country ownership for Chinese ownership. There were 10 cases in this category between 2000 and 2010, including four that involved the replacement of one Chinese parent enterprise by another.
To complete the picture of Chinese acquisitions in relation to the EU, of the 78 non-‐EU target firms belonging to EU parents that were acquired by Chinese companies, 49 were located in China and eight in Hong Kong. This shows how the strategy of many Chinese acquirers is very much focused on the home, or regional, economy. Given official and public concern about the Chinese acquisition of European-‐owned assets, and the fear of job losses, it is important

34
to bear in mind that a number of these takeovers pertain to operations outside the EU.
Indeed, acquisitions in the EU may well be motivated by factors extraneous to the EU economy. The important general point is that Chinese firms are acquiring international networks of affiliates and that by acquiring these international networks of affiliates of EU multinationals, they may rapidly become highly multinational and diversified. The implication is that the European economy inevitably becomes subject to international linkages of more extensive complexity. As a consequence, the need for EU policies that encourage internationally-‐linked multinational groups (whether EU or Chinese owned) to retain and grow their productive activity within the Union, is becoming ever more pressing.
How far any of these changes in ownership through Chinese acquisition will impact on the Member States’ economies and the EU economy, and what kind of impact that might be, are not fathomable from these data. However, current understanding would suggest that the performance of Chinese-‐owned affiliates, following a decline immediately after the change in ownership, and after a lag, should likely improve in most cases. Detailed research, probably involving both case study and econometric research methods, would be necessary in order to understand the outcomes of Chinese acquisitions in depth.
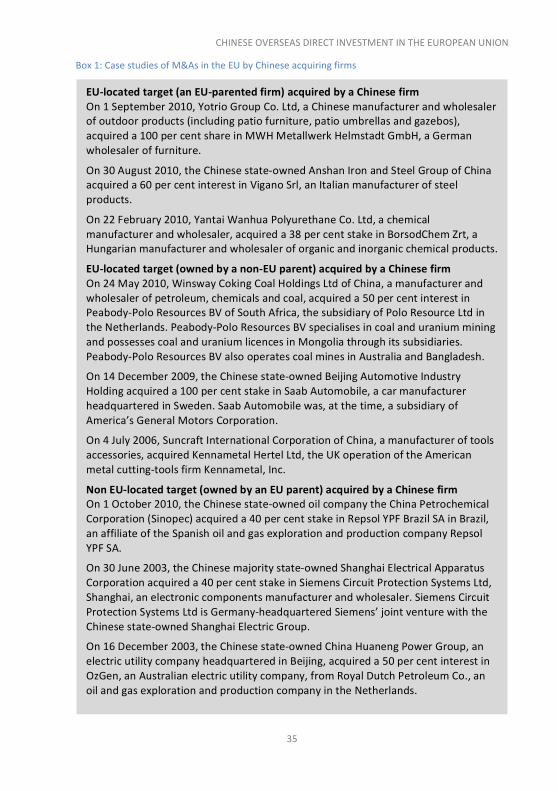
To bring this range of acquisition categories to life, Box 1 presents some examples.
CHINESE OVERSEAS DIRECT INVESTMENT IN THE EUROPEAN UNION
35
Box 1: Case studies of M&As in the EU by Chinese acquiring firms
EU-‐located target (an EU-‐parented firm) acquired by a Chinese firm On 1 September 2010, Yotrio Group Co. Ltd, a Chinese manufacturer and wholesaler of outdoor products (including patio furniture, patio umbrellas and gazebos), acquired a 100 per cent share in MWH Metallwerk Helmstadt GmbH, a German wholesaler of furniture.
On 30 August 2010, the Chinese state-‐owned Anshan Iron and Steel Group of China acquired a 60 per cent interest in Vigano Srl, an Italian manufacturer of steel products.
On 22 February 2010, Yantai Wanhua Polyurethane Co. Ltd, a chemical manufacturer and wholesaler, acquired a 38 per cent stake in BorsodChem Zrt, a Hungarian manufacturer and wholesaler of organic and inorganic chemical products.
EU-‐located target (owned by a non-‐EU parent) acquired by a Chinese firm On 24 May 2010, Winsway Coking Coal Holdings Ltd of China, a manufacturer and wholesaler of petroleum, chemicals and coal, acquired a 50 per cent interest in Peabody-‐Polo Resources BV of South Africa, the subsidiary of Polo Resource Ltd in the Netherlands. Peabody-‐Polo Resources BV specialises in coal and uranium mining and possesses coal and uranium licences in Mongolia through its subsidiaries. Peabody-‐Polo Resources BV also operates coal mines in Australia and Bangladesh.
On 14 December 2009, the Chinese state-‐owned Beijing Automotive Industry Holding acquired a 100 per cent stake in Saab Automobile, a car manufacturer headquartered in Sweden. Saab Automobile was, at the time, a subsidiary of America’s General Motors Corporation.
On 4 July 2006, Suncraft International Corporation of China, a manufacturer of tools accessories, acquired Kennametal Hertel Ltd, the UK operation of the American metal cutting-‐tools firm Kennametal, Inc.
Non EU-‐located target (owned by an EU parent) acquired by a Chinese firm On 1 October 2010, the Chinese state-‐owned oil company the China Petrochemical Corporation (Sinopec) acquired a 40 per cent stake in Repsol YPF Brazil SA in Brazil, an affiliate of the Spanish oil and gas exploration and production company Repsol YPF SA.
On 30 June 2003, the Chinese majority state-‐owned Shanghai Electrical Apparatus Corporation acquired a 40 per cent stake in Siemens Circuit Protection Systems Ltd, Shanghai, an electronic components manufacturer and wholesaler. Siemens Circuit Protection Systems Ltd is Germany-‐headquartered Siemens’ joint venture with the Chinese state-‐owned Shanghai Electric Group.
On 16 December 2003, the Chinese state-‐owned China Huaneng Power Group, an electric utility company headquartered in Beijing, acquired a 50 per cent interest in OzGen, an Australian electric utility company, from Royal Dutch Petroleum Co., an oil and gas exploration and production company in the Netherlands.

36
3.3 Impact of Chinese investments on local economies The large difference between Member States in the characteristics of their enterprises suggests that Chinese investors see them as quite distinct and segmented in economic terms. The leading host states to Chinese FDI appear to be those in which the nature of affiliates’ activity is most likely to benefit the local economy. In states where total Chinese FDI is small, the focus of affiliates’ activity is not on local production but, so it would seem, on the distribution of outputs from elsewhere, most likely imported from China.
When we talk of impact, we are focusing on not only the amount of FDI but also its quality. Is FDI good for the host economy concerned? It is fair to say that to date there is a dearth of studies, peer-‐reviewed academic research or otherwise, on the impact of Chinese outward FDI on host economies. The majority of studies have simply confined themselves to seeking to explain the determinants of Chinese OFDI, tracking the magnitudes and, in some cases, the patterns of outward investment. Equally, there is a similar lack of research on the impact on host countries of FDI from emerging economies. The bulk of studies concern the impacts of FDI by advanced economy multinationals, mainly on developing economies such as China. This paper is the first study to look at this issue for the EU-‐27.
The academic literature on the effects of FDI on host economies distinguishes between direct and indirect effects. Direct effects are essentially a result of the actions of the foreign-‐owned affiliate itself. Direct effects of FDI include the generation of employment and taxes and widening the knowledge base through research and development (R&D) activities. Indirect benefits might include linkages to local business, the follow-‐on attraction of further businesses and improved productivity among competitors caused by a higher level of competition. On the other hand, intensified price or technology competition to local firms, and the poaching of human capital by foreign investors, can lead to a crowding out of local businesses. For any of these effects to take hold, the inward investment has to be of significant size (Dunning and Lundan, 2008). In considering direct effects, a good rule of thumb for advanced economy hosts is to give priority to the total product, or value added, by the foreign enterprise. This captures the income generated directly; and, as academic studies emphasise, the size of any indirect effects is primarily driven by this direct measure: the scale of income generated locally. Direct employment may be used as an alternative.

CHINESE OVERSEAS DIRECT INVESTMENT IN THE EUROPEAN UNION
37
An extensive body of empirical research exists on the benefits (and costs) of indirect, or spillover, effects from FDI on domestically owned firms in host economies. The bulk of studies are concerned with the impacts of inward FDI on the indigenously owned sector in developing economies. Typically, as far as benefits are concerned, such research focuses on investigating the ‘multiplier effects’ of inward investment on economic growth and development. For example, many studies exist on Western and European FDI in China (e.g., Buckley, Clegg and Wang, 2007; Li, Liu and Parker 2001). When we look at inward investment in the developed economies, this ‘multiplier effect’ is less relevant. Our focus shifts instead to the direct effects of FDI, the rest of the economy already being developed. Where inward FDI is a takeover of an existing business, it may rescue existing linkages within the host economy that would otherwise have been lost. On the other hand, if the takeover leads to the removal of commercial opportunities from firms in the host economy, then that would be a negative indirect effect of FDI.
With aggregate data alone, it is impossible to evaluate the complexity and full range of indirect effects. Either case study research at the firm level or econometric research at the micro-‐level would be required. But we can say that if the quantity of FDI in the Member State is limited, then the impact of FDI is also likely to be limited, as the level of activity is probably a very small proportion of total economic activity in the host industrial market segment concerned (although it might be felt to be more important the smaller the geographical area being considered). Therefore, it is only possible to make an inference about the possibility of a notable impact on the local economy for those countries where a substantial amount of Chinese inward FDI has been recorded.
Data from Eurostat reveal that for EU Member States as a whole, Chinese investments account for a minute share of inward FDI. Of investments that originate from outside the EU-‐27, the share of Chinese investment in total EU-‐27 inward FDI has so far not risen above 0.03 per cent. This statistic holds for most individual Member States as well. Ancillary information confirms the significance of this very modest figure. They show that the activities of Chinese firms in the EU are of small scale in aggregate.
To gauge impact, it is preferable to have operating data. Foreign direct investment data capture primarily the financial dimension of foreign affiliates, not their productive activities. For those Member States for which Eurostat
38
reports foreign affiliate statistics, the number of Chinese firms and their employment is minor. Nevertheless, some modest insights can be gleaned from the available data on the average characteristics of Chinese enterprises in the EU when viewed alongside measures of the total presence of Chinese enterprises in each Member State.
To preface our discussion, it should be noted that the differences between host Member States for each of the indicators available are an outcome of the industry distribution within each state and of the distribution of motives for investment by industry. It will be true that the nature of industry concentration by country is correlated with the advantages of each country concerned. (For present purposes, those advantages include not only comparative cost advantage but also advantages from created assets embodied in firms in each host). The average figures for each state will reflect industry composition, and industry composition itself captures quite faithfully the attributes of the host country.
In order to gauge the impact of FDI in Member States, we turn to data collected for Chinese foreign affiliates in the EU. Table 4 gives an idea of the profile of these affiliates. The size of the figures in the 10 data columns for each country, when compared, gives an insight into the nature of Chinese-‐owned company activity in a Member State. Some data are not available for Member States, and must be excluded from this analysis. Nor are data available for the same latest year, which must inevitably distort our comparisons. The two Member States affected by negative FDI positions, Belgium and Ireland, do not report operating data.

CHINESE OVERSEAS DIRECT INVESTMENT IN THE EUROPEAN UNION
39
Table 4: Indicators of Chinese firms in the EU (latest available year) Host coun
try
Latest year
2009
OFD
I stock (€
mn)
No. of firms (unit)
Value
-‐add
ed at factor
cost (€
000)
No. of p
ersons
employ
ed (u
nit)
Gross value
-‐add
ed per
person
employ
ed (€
000)
Turnov
er per person
employ
ed (€
000)
Turnov
er/ value-‐ad
ded
(ratio)
Gross ope
rating
surplus
per pe
rson
employ
ed
(€)
Gross in
vestmen
t in
tang
ible goo
ds (€
000)
Person
nel costs per
person
employ
ed (€
)
Austria 2008 136 14 4.7 93 50.5 540.2 11 1.1 0.4 49.5
Belgium 2008 -‐543 c c c c c c -‐ -‐ c
Bulgaria 2008 7 51 0.9 210 4.3 50.9 12 c 0.3 c
Cyprus 2007 6 -‐ -‐ -‐ -‐ -‐ -‐ -‐ -‐ -‐
Czech Rep. 2004 52 11 0.5 -‐ -‐ -‐ -‐ -‐ -‐ -‐
Denmark 2007 403 7 23.4 300 78 3189.2 41 13.0 0.6 64.7
Estonia 2008 11 0 0 0 -‐ -‐ -‐ 0.0 0 0.0
Finland 2008 -‐5 6 7 45 156.1 2406.6 15 66.7 0.1 88.9
France 2008 375 59 835.4 8968 93.2 339.3 4 48.1 17.6 45.0
Germany 2008 641 110 594.3 4156 143 625.7 4 92.7 54.1 50.3
Greece 2008 6 -‐ -‐ -‐ -‐ -‐ -‐ -‐ -‐ -‐
Hungary 2008 9 249 13.7 1631 8.4 122.4 15 -‐0.2 1 8.6
Ireland 2008 -‐111 -‐ -‐ -‐ -‐ -‐ -‐ -‐ -‐ -‐
Italy 2007 61 27 30.4 311 97.8 443.3 5 54.7 5.6 43.1
Latvia 2008 0 1 c 3 c c c c c c
Lithuania 2008 2 31 1.9 280 6.8 18.2 3 1.1 0.1 5.7
Luxembourg 2008 -‐ -‐ -‐ -‐ -‐ -‐ -‐ -‐ -‐ -‐
Malta 2008 3 -‐ -‐ -‐ -‐ -‐ -‐ -‐ -‐ -‐
Netherlands 2007 64 10 27.1 407 66.6 561 8 9.1 -‐ 57.5
Poland 2007 131 7 7 910 7.7 215.28 28 -‐1.6 38.6 9.5
Portugal 2004 -‐ 0 0 0 c c c 0.0 0 0.0
Romania 2008 34 134 35.9 2251 16 102.4 6 9.3 17.5 6.7
Slovakia 2007 22 c c c 0 0 0 c c c
Slovenia 2007 0 20 0.8 74 11.1 27.14 2 4.1 0.1 8.1
Spain 2008 -‐ 11 52 766 67.9 495.3 7 25.7 2.1 42.2
Sweden 2008 110 24 40.9 553 73.9 229.1 3 28.6 5.6 45.4
UK 2006 692 25 262.9 697 377.2 7334.3 19 274.5 -‐ 102.7 Note: a dash (-‐) denotes that data are not available; ‘c’ denotes that data are confidential. Source: Eurostat (2011c).

40
A high inward FDI stock indicates that a Member State is in receipt of a sizeable amount of FDI, and therefore the impact indicated by the operating data should be given greater weight. The operating data are not universe data, and therefore we cannot assume that what we see in these tables can be generalised to the population in each Member State. However, taking these foreign affiliates as representative, we are able to make a number of reasonable inferences. Apparent labour productivity, measured by gross value-‐added per employee, if high, would suggest that the affiliates concerned are highly capitalised and that a significant amount of productive activity is located in the Member State concerned. Further evidence of significant local income generated would be a low ratio of turnover to value-‐added. Personnel costs per employee are a measure of average labour costs, and the number of persons employed is an indication of the average scale of establishments.
Germany, France and the UK record the highest total production values by Chinese affiliates, and so the operations indicators can be given most credence as evidence of impact for those states. In order from the highest, the UK, Finland, Germany, Italy and France record the highest labour productivity values by Chinese affiliates, again supporting the inference of impact for those states. In Germany and France, the ratio of turnover to value-‐added is one of the lowest, which is consistent with the localisation of substantial productive activity. The UK profile is similar to that of Germany, but turnover to value-‐added is several times higher and, although comparable, the labour productivity measure is the highest recorded, suggesting a likely industry bias.
In the cases of these countries, the data suggest that inward FDI is contributing positively to local income generation. Denmark is an example of a Member State where turnover per person employed is high. But as turnover to value-‐added is relatively high, it can be inferred that most of Chinese affiliates’ sales in Denmark come from production elsewhere. Most probably, this is evidence of local assembly or extensive sales affiliate activity in Denmark marketing imports from China. This would suggest that in Denmark, Chinese FDI is market-‐seeking (to support exports) and that the local impact of such activity on employment would be expected to be simply incidental. For other Member States, it is hazardous to infer any impact because the figures produced by Eurostat are based on very small total sizes of FDI activity in each country and on a very limited number of enterprises. Consequently the data are easily biased by just a few investments. Even so, assembly or sales affiliate activity appears, prima facie, to be dominant in a number of other countries of the EU,

CHINESE OVERSEAS DIRECT INVESTMENT IN THE EUROPEAN UNION
41
including Hungary, Poland, Finland and Bulgaria, from turnover to value-‐added ratios. This may represent exports to the rest of the EU and indicate employment and revenue benefits to those states.
Case study research at the firm level of Chinese investments in Germany yields insight into how Chinese FDI in Germany comes to be so productive and potentially beneficial in its impact. Comparing Chinese greenfield investments (in which a new enterprise and its assets are created de novo) and so-‐called brownfield investments (in which the assets of an existing enterprise are acquired), Klossek, Linke and Nippa (2012) and Knoerich (2010) find that Chinese acquirers intend to develop a long-‐term mutually successful relationship in the local economy. In order to achieve this, they carefully prepare and assess European acquisition targets and have well-‐formulated post-‐acquisition strategies in place. These strategies aim to maintain key corporate assets and employee confidence. In addition, the acquirer and target firm each benefit from expanded and strengthened product portfolios and geographical coverage: the Chinese firms can sell high-‐end products while the German firm acquires low-‐end products, and jointly they can develop new mid-‐range products.
These mutual benefits are particularly advantageous in a global economy in which economic prosperity and growth have shifted towards the emerging economies. The German firm gains access to large and quickly developing markets while the Chinese firm gains access to a large and stable market (Knoerich, 2010). These benefits show that there is the potential for a long-‐term contribution by Chinese investments in Europe and that, with a sound business plan, the European base is unlikely to be reduced. It is also noteworthy that research to date suggests that brownfield investments are more thoroughly prepared and executed than greenfield investments (Klossek et al., 2012). Thus, although the initial set-‐up benefits from greenfield investments are greater, it is suggested that their long-‐run returns are likely to be poorer than brownfield investments.
We now turn to Tables 5 and 6, which present statistics equivalent to Table 4 for the US and Japanese affiliated companies in the EU. As our interest in these tables is the strategy and behaviour of the affiliates, we are not so much concerned with the total scale of FDI as with the profile in each of the Member States. Table 5 shows that there is far less deviation between host states in the ratio of turnover to value-‐added for US affiliates in the Union. The ratios are

42
roughly equivalent to that of Chinese investment in Germany, which we take as a benchmark in terms of the quality of FDI. For US affiliates, the dispersion in labour productivity is substantially lower than for Chinese affiliates, but this will be due to the small numbers of Chinese firms. Personnel costs per employee are little different overall for Chinese, US and Japanese affiliates (see tables 4, 5 and 6). Only the dispersion is slightly higher for Chinese FDI, which, given its small size and recent establishment, represents remarkably little deviation. In the UK, it appears that Chinese affiliates have experienced higher costs per employee compared with their US and Japanese counterparts. But all in all, there is less variation between the profiles for Chinese, US and Japanese investment in the EU than might have been expected. This points to Chinese investors in the EU pursuing strategies congruent with those of leading third-‐country investors. Accordingly, similar impact benefits should result from Chinese FDI across a wide spread of industries in the long run.
The implications of this analysis are that, if there were to be more Chinese FDI potentially available of the ‘benchmark’ quality that appears to be locating in Germany (comparable with the high quality FDI of other major investors, such as the US and Japan), then an EU-‐wide policy to attract high value-‐added and larger-‐scale Chinese investment should be the goal.

CHINESE OVERSEAS DIRECT INVESTMENT IN THE EUROPEAN UNION
43
Table 5: Indicators of US firms in the EU (latest available year) Latest year
2009
OFD
I Stock (€
m)
No. of firms (unit)
Value
-‐add
ed at factor cost
(€00
0)
No. of p
ersons employ
ed (u
nit)
Gross value
add
ed per person
employ
ed (€
000)
Turnov
er per person em
ploy
ed
(€00
0)
Turnov
er/ value ad
ded (ratio)
Gross ope
rating
surplus per
person
employ
ed (€
)
Gross in
vestmen
t in tan
gible
good
s (€00
0)
Person
nel costs per person
employ
ed (€
)
Austria 2008 11,594 457 4,252.0 42,157 100.9 415.8 4.1 38.2 980.5 62.6
Belgium 2008 -‐ -‐ -‐ -‐ -‐ -‐ -‐ -‐ -‐ -‐
Bulgaria 2008 1,568 488 565.5 23,821 23.7 73.2 3.1 14.9 566.3 8.8
Cyprus 2007 170 12 59.9 637 94.0 334.8 3.6 43.0 2.0 51.0
Czech Rep. 2007 2,391 1,088 4,028.5 120,584 -‐ -‐ -‐ -‐ 642.4 16.9
Denmark 2008 8,750 405 4,735.6 36,199 130.8 344.2 2.6 65.1 505.5 65.7
Estonia 2008 141 42 136.8 6,225 22.0 84.2 3.8 6.1 20.3 15.9
Finland 2008 618 430 2,645.4 30,523 86.7 364.7 4.2 31.4 343.9 55.2
France 2008 77,162 3,219 50,982.1 450,836 113.1 447.6 4.0 42.3 0.3 70.8
Germany 2008 76,376 3,470 56,993.4 626,677 90.9 445.9 4.9 36.0 7,102.7 55.0
Greece 2008 1,731 -‐ -‐ -‐ -‐ -‐ -‐ -‐ -‐ -‐
Hungary 2008 2,788 1,973 4,428.2 90,515 48.9 263.5 5.4 27.4 539.5 21.5
Ireland 2008 4,331 -‐ -‐ -‐ -‐ -‐ -‐ -‐ -‐ -‐
Italy 2007 20,056 2,269 20,595.1 271,363 75.9 385.3 5.1 26.0 3,752.9 49.9
Latvia 2008 303 239 148.6 5,763 25.8 140.6 5.4 13.2 33.2 12.6
Lithuania 2008 258 126 184.8 5,597 33.0 129.5 3.9 16.4 22.7 16.7
Luxembourg 2008 7,272 -‐ -‐ -‐ -‐ -‐ -‐ -‐ -‐ -‐
Malta 2008 146 -‐ -‐ -‐ -‐ -‐ -‐ -‐ -‐ -‐
Netherlands 2007 83,828 1,125 17,737.2 154,426 114.9 816.4 7.1 62.4 1,916.7 52.5
Poland 2008 8,418 329 4,101.0 98,187 41.8 162.5 3.9 23.1 709.4 18.6
Portugal 2008 -‐ 331 1,484.5 26,121 56.8 287.7 5.1 24.9 238.0 31.9
Romania 2008 1,052 435 1,105.1 58,733 18.8 96.8 5.1 8.3 464.1 10.5
Slovakia 2007 720 74 1,094.9 27,366 0.0 0.0 0.0 23.7 199.5 16.3
Slovenia 2007 69 69 242.8 -‐ -‐ -‐ -‐ -‐ 27.7 -‐
Spain 2008 42,064 785 11,562.9 164,421 70.3 318.3 4.5 24.6 1,635.3 45.7
Sweden 2008 15,911 1,173 7,844.6 113,060 69.4 312.5 4.5 14.4 1,013.8 54.9
UK 2008 178,684 5,187 105,525.9 1,058,326 99.7 260.1 2.6 49.6 12,867.0 50.1 Notes: a dash (-‐) denotes that data are not available. Source: Eurostat (2011c).

44
Table 6: Indicators of Japanese firms in the EU (latest available year) Latest year
2009
OFD
I stock (€
m)
No. of firms (unit)
Value
-‐add
ed at factor cost
(€00
0)
No. of p
ersons employ
ed
(unit)
Gross value
-‐add
ed per person
employ
ed (€
000)
Turnov
er per person
employ
ed (€
000)
Turnov
er/ value ad
ded (ratio)
Gross ope
rating
surplus per
person
employ
ed (€
)
Gross in
vestmen
t in tan
gible
good
s (€00
0)
Person
nel costs per person
employ
ed (€
)
Austria 2008 2,473 65 701.1 5,725 122.5 1,048.6 8.6 56.0 92.5 66.5
Belgium 2008 20,737 -‐ -‐ -‐ -‐ -‐ -‐ -‐ -‐ -‐
Bulgaria 2006 93 9 26.2 210 124.8 974.63 7.8 117.6 -‐ 7.1
Cyprus 2007 1 -‐ -‐ -‐ -‐ -‐ -‐ -‐ -‐ -‐
Czech Rep. 2007 1,142 164 905.7 30,885 -‐ -‐ -‐ 15.3 503.9 14.1
Denmark 2007 137 41 284.2 3,289 86.4 4,124.0 47.7 23.7 26.9 62.7
Estonia 2007 5 4 3.2 193 16.4 841.8 51.3 -‐1.6 0.4 18.1
Finland 2008 160 83 672.6 7,352 91.5 1,131.0 12.4 37.2 65.3 54.3
France 2008 8,942 390 3,582.5 51,557 69.5 573.3 8.2 14.4 101.8 55.1
Germany 2008 16,268 706 8,284.2 74,564 111.1 906.0 8.2 53.3 649.2 57.8
Greece 2008 17 -‐ -‐ -‐ -‐ -‐ -‐ -‐ -‐ -‐
Hungary 2008 824 174 877.4 24,184 36.3 256.2 7.1 19.8 216.1 16.5
Ireland 2008 2,095 -‐ -‐ -‐ -‐ -‐ -‐ -‐ -‐ -‐
Italy 2007 3,180 330 1,511.9 23,517 64.3 672.5 10.5 13.8 291.7 50.5
Latvia 2008 0 5 0.7 91 7.4 434.2 58.7 -‐15.4 2.0 22.0
Lithuania 2008 1 9 13.7 1,113 12.3 88.2 7.2 -‐1.9 2.2 14.2
Luxembourg 2008 341 -‐ -‐ -‐ -‐ -‐ -‐ -‐ -‐ -‐
Malta 2008 0 -‐ -‐ -‐ -‐ -‐ -‐ -‐ -‐ -‐
Netherlands 2007 10,673 260 2,274.5 23,247 97.8 757.7 7.7 47.6 308.3 50.2
Poland 2008 1,159 66 713.7 20,678 34.5 197.5 5.7 20.0 441.8 14.6
Portugal 2008 -‐ 33 180.6 4,254 42.4 265.7 6.3 19.2 15.6 23.2
Romania 2008 95 27 245.9 18,321 13.4 95.3 7.1 5.5 76.2 7.9
Slovakia 2007 75 13 84.0 7,616 0.0 0.0 0.0 2.9 11.9 8.1
Slovenia 2007 29 5 53.1 242 219.3 1,369.5 6.2 184.3 4.5 35.1
Spain 2008 1,825 173 1,614.8 22,407 72.1 583.9 8.1 21.5 180.9 50.6
Sweden 2008 1,271 103 593.8 8,548 69.5 472.5 6.8 12.5 72.7 56.9
UK 2007 23,929 774 15,413.4 103,737 148.6 591.8 4.0 89.2 1,618.6 59.4 Notes: a dash (-‐) denotes that data are not available. Source: Eurostat (2011c).
CHINESE OVERSEAS DIRECT INVESTMENT IN THE EUROPEAN UNION
45
4 Policies and Activities in the EU Towards Chinese Inward Investment Unlike external trade, foreign direct investment relations with third countries was not a Community competence in the Treaty of the European Community (The Treaty of Rome) signed in Rome on 25 March 1957.2 This can perhaps be explained by its lesser economic importance compared with today and also by the then poor understanding of both policymakers and economists of FDI’s role in regional integration. The role of trade in regional integration was very well understood, but in the mid-‐ to late 1950s there was no theory of FDI (as opposed to models of financial capital flows) on which to base policy recommendations. We now know much more about FDI and the underlying theory of the MNE on which to base our analysis, although the quality and quantity of data continues to fall well short of what we would wish.
The transition to a common customs tariff in the sphere of trade was not achieved overnight. With respect to FDI, the transition to a coherent policy stance will be especially complicated. This is because firms straddle the national boundaries of Member States and operate in multiple markets, spanning all Four Freedoms of the founding Treaty.3 This makes a joined-‐up approach to FDI much harder to achieve: any policy that impinges on one of those freedoms impinges on FDI in some way.
Although the 2009 Treaty of Lisbon theoretically moves the EU closer to offering an integrated approach to FDI, both inward and outward, the challenge now shifts to implementing the Lisbon advances. This needs to be done in the spirit of taking a ‘foreign investor-‐centred view of investing in the EU’; that is, to join up with internal policies of EU Member States, such as national labour regulations, particularly with respect to visas, that are beyond the realm of, but nevertheless undermine, the EU’s common commercial policy (CCP), and to reduce bureaucracy at all levels. Taking a joined-‐up, or foreign investor-‐centred, approach is where those individual Member States that have made the greatest advances in policy have really scored. One might speculate that the greatest source of apprehension for such Member States after the Treaty of Lisbon will be that they might lose such achievements in the move towards conformity within a single EU policy.
2 Internal EU FDI liberalisation has always been a core Community competence. 3 The free movement of goods, capital, people and services.

46
Investors from outside the EU generally enjoy the same access as EU firms: the Treaty of Rome’s freedom of movement of capital, which includes the right of establishment, has benefited third countries no less than Member States. Episodes of discrimination are very rare and, when they do occur, are instigated by individual Member States. When it comes to European law regarding cartels, antitrust, mergers and takeovers, and state aid, the EU does not apply any different standards to inward FDI from third countries. The general (but quite distinct) issue with emerging market FDI in the EU is that of governance and home country political involvement. This is a bigger concern for some countries than others – mainly those where a large amount of OFDI is state-‐owned or state influenced.
In this brief review of FDI policy, it is not possible to do justice to the legal complexities of the tissue of arrangements that have been, and still are, in place, that is, the inconsistencies and conflicts, actual and potential, that attach to investment (variously defined or undefined) in the context of the EU and its Member States.4 Here we are concerned only with inward FDI, in particular from China, and with the factors that might promote or limit it and the benefits that the EU gains from it.
With this in mind, we address the following questions: 1) What is the current situation of, and what are the problems associated with, EU policy provisions? 2) Who needs to be catered to, and why? 3) What is ideal, and why?
4.1 The Lisbon Treaty
4.1.1 Pre-‐ and post-‐Lisbon stances and activities of the EU and its Member States
If we are to understand the scope for policymaking after Lisbon with respect to inward FDI from China, it is helpful to have a grasp of some history. The policy framework towards inward FDI before Lisbon was a patchwork – all the more so because it was actually a side-‐product of the outward FDI policy of the EU and its individual Member States, driven primarily by the interests of its leading outward investing countries. As the EU collectively and a number of EU-‐15 states in particular have long been net outward investors, the preoccupation has been with ensuring market access and protection for European MNEs in
4 The reader is advised to consult Karl (2004).

CHINESE OVERSEAS DIRECT INVESTMENT IN THE EUROPEAN UNION
47
foreign markets.5 This has resulted in a policy coverage of sorts for inward investment to the EU, but a coverage that is far from comprehensive and coherent or even necessary. This is especially so in view of the open and non-‐discriminatory policy regime of the EU towards inward FDI from third countries and the well-‐found and stable institutions and policy environment ensured by the EU’s cumulated legislation that applies to all Member States, the Acquis Communautaire.
Before Lisbon, competence for external FDI policy resided with individual Member States. In order for the EU to negotiate and conclude EU-‐level international investment agreements (IIAs) with third countries, each Member State had to grant express permission on each occasion, so becoming jointly contracting parties to the IIA. The resulting IIAs covered market access and liberalisation in the host country – those aspects of investment policy that precede the establishment of FDI. The EU treaty approach is to grant both national treatment and most favoured nation (MFN) treatment, but with the caveat of a regional economic integration organisation exception clause. This reserves the right to limit liberalisation benefits of the integration agreement from automatic extension to third-‐country investors, usually in certain tightly circumscribed circumstances.6 Conversely, individual Member States’ policies focused on the protection of FDI post-‐establishment, for which the leading instrument has been the bilateral investment treaty (BIT) between two states.
Market access and investment protection (to bolster weak institutions and to protect against policy risks of expropriation and discrimination against foreign investors) is a priority for EU outward FDI, but it is apparent that both are largely redundant for inward FDI to the EU. The reciprocal nature of EU and Member States’ treaty obligations with third countries means that ‘by default’ there is policy towards inward FDI. However, the EU’s practice of non-‐discrimination towards inward FDI renders much of this policy redundant. Not surprisingly, BITs are only very rarely concluded between developed countries. There is little need: they are primarily an instrument to substitute for the shortcomings of domestic institutions and policies towards investors in developing economies. So even though China has negotiated its ‘second generation’ of BITs with some EU Member States – the German-‐Chinese BIT of 5 The shortcomings of EU policy provisions for outward investment have been set out elsewhere (e.g. European Commission 2006; 2010b). 6 For a comprehensive discussion of the regional economic integration organisation (REIO) exception in MFN treatment clauses as applied to FDI, see UNCTAD (2004).

48
December 2003, for instance, provides inter alia for national treatment and investor-‐state dispute settlement, which was not the case in the ‘first-‐generation’ BIT – these treaties have little value for investors in the EU.
The inadequacies of the pre-‐Lisbon arrangements are severely put to the test in a world where there is rising investment by emerging economies. Such investment can raise challenging questions about the quality of impact, technological contribution and the maintenance of the EU industrial base, to name just a few examples in the commercial domain alone. As a general rule, these questions are not posed so starkly by advanced-‐economy investors.
The current situation and problems associated with EU policy provision towards inward FDI can be summarised as follows:
1 Most Member States have BITs with China, but some do not – for example, the Republic of Ireland does not – resulting in a seemingly incongruous medley of bilateral arrangements in the EU.
2 Investment agreements between Member States and third countries offer redundant market access and protection to inward FDI, largely as a result of the EU approach of treating investors from non-‐regional economic integration organisation (REIO) Member States no less favourably than investors from REIO Member States.
3 The bargaining power of the EU in the external commercial sphere has been diminished because of the absence of coordination between trade and investment relations with third countries, that is, because of an inability to ‘speak with one voice’ over trade and FDI.
4 The policies in place have not been designed to stimulate inward investment to the EU, and certainly have not been tailored to the specific and distinctive needs of foreign investors from emerging markets.
5 This lack of joined-‐up policy towards inward investors is an impediment to the potential rising cohort of high-‐growth small and medium-‐sized Chinese firms.
We can see that from the point of view of the Internal Market, the patchwork of treaties faced by Chinese foreign investors in the EU might appear symptomatic of a fragmented EU economy. In practice, it makes very little difference, as once a Chinese investor is established in an EU Member State, it is treated as an EU company. The greater problem is to identify what the EU has to offer in terms of market access (let alone investment protection) to third-‐country investors such as enterprises from China. Although the EU has a REIO

CHINESE OVERSEAS DIRECT INVESTMENT IN THE EUROPEAN UNION
49
exception, third-‐country investors in effect enjoy ‘free rider’ access to the Internal Market. To address this question effectively, we have to take a foreign investor-‐centred view of the EU.
The deficiencies in current policymaking point to some potential answers to the question of what would be ideal, and why. Above all, the single Internal Market is likely to be one of the most attractive aspects of the EU to Chinese investors. Identifying and reducing the barriers that new entrants to the EU face will better enable these firms to benefit from the single market. Differing policies between Member States that impinge on starting and running a business come high on the list, but also recognition of the learning needs of firms that are relatively new to international business would make the EU a far more attractive location. As noted later in this paper, the inherent differences in the ease of doing business (specifically in starting and running a small and medium-‐sized enterprise, into which category many de novo Chinese investors fall) can be turned into targets for policy to stimulate FDI into each Member State. Recognition of the principle of subsidiarity is helpful here. There is a fundamental benefit from retaining the strong motivation and achievements of Member States and their investment promotion agencies (IPAs) in encouraging inward FDI. But there is an even greater payback from harnessing this motivation – to resolve the variety of obstacles faced in different states that impinge on investors wishing to establish locally and that may well wish to do business on a pan-‐EU basis in the Internal Market. This ideal of barrier reduction emerges from our analysis of the current shortcomings of the EU and its policy provision, but it also is a theme that emerges from our survey data in section 4.2.
4.1.2 The Lisbon Treaty and transitional arrangements Although the Lisbon Treaty assigns competence for FDI policy to the EU, the current policy framework towards FDI is clearly a legacy. In the wake of the Lisbon Treaty, a clear route map towards a coherent foreign investment regime is required in order to stem policy uncertainty. Such uncertainty might be detrimental to the interests of Member States and their firms: for example, what happens when existing BITS naturally expire?
Transitional arrangements are provided for in the form of a proposed regulation produced by the Commission (European Commission, 2010a; 2010c). After Lisbon, the European Union is assigned the ultimate power to authorise the signing of agreements covering international investment between

50
individual Member States (see Article 11 of this proposal concerning Member States’ authorisation to sign and conclude an agreement) (European Commission, 2010a). But there still exists a wide margin for interpretation. The proposed regulation sacrifices the rate of progress to a common EU-‐wide process and policy in the interests of reducing policy uncertainty for Member States and third countries. It does this by automatically authorising the pre-‐existing agreements of Member States, with provision for a review process. The proposed regulation would introduce mechanisms that allow Member States to maintain and to conclude BITs as ‘exceptional transitional measures’ while development of the international investment policy of the European Union is still under way. This approach is most sensible, and enables potential inconsistencies with a common policy to be eliminated. It also ensures the weeding out of any incompatibilities in the various pre-‐accession BITS and agreements that Member States may have concluded with third countries, for example, with respect to the absence of a REIO clause.
What remains true under the proposed regulation is that the driving force for any agreement covering investment between the EU and China is still mainly on the EU side, although is now at the EU rather than the Member State level. It is primarily a concern over EU firms’ investment in China rather than Chinese investment in the EU. But, there is a growing realisation that the EU must make provision for inward FDI from China. The European Union is also open to sectoral agreements with China. Again, however, the sectors of focus would largely be determined by European firms’ concerns with investment in the Chinese market rather than with Chinese firms’ interest in the EU (in view of the above discussion on the EU practice of non-‐discrimination towards inward FDI).
In the recent consultations (aimed at EU firms) regarding a possible stand-‐alone investment agreement with China, there were 24 questions in the questionnaire that asked about EU investment in China but only three enquiring about the impact of Chinese investment coming to Europe. And of those three, one concerned human rights and another enquired about the potential environmental impact (European Commission, 2011). Poor attention to the issues facing Chinese investors, and to the potential linkages and benefits for EU industry, risks a short-‐term perspective in which the investors themselves are largely overlooked.

CHINESE OVERSEAS DIRECT INVESTMENT IN THE EUROPEAN UNION
51
On the positive side, Regulation 11 does highlight the importance, both in the EU and in partner third countries, of job creation, resource optimisation, technology, skills transfer, competition stimulation and the boosting of trade. It also recognises the resilience in the performance of outward investment by emerging economies after the financial and economic crisis and therefore the potential importance of those economies’ firms as investors in the EU. European Union policymaking institutions have also acknowledged the potential contribution to the EU economy of investment backed by the governments of emerging economies through sovereign wealth funds (SWFs), in which respect China is prominent. In its response to the Regulation, the European Parliament welcomed China’s SWFs and state-‐owned enterprises for their contribution to the creation of jobs in the EU but noted the lack of transparency in China’s financial markets and the desirability of introducing a code of conduct to ensure transparency in China’s investment operations in the EU (Official Journal of the European Union, 2010; European Parliament, 2011). It is issues such as these that are likely to be the main policy sticking points for the future development of a strategy to stimulate Chinese FDI in the EU.
4.1.3 After Lisbon: in the steady state In the consultation document of 2 May 2011 (European Commission, 2011), three policy options for the EU-‐China investment relationship were set out. The first option was a comprehensive investment agreement to cover FDI both before and after its establishment. The second was a stand-‐alone investment protection agreement, which would not cover access before establishment. The third was a ‘do-‐nothing’ option: not to negotiate a new investment agreement but to continue with the current regime of Member States’ bilateral negotiations and the EU’s commitments under the WTO General Agreement for Trade in Services (which comprehend FDI), and negotiations on a comprehensive Partnership and Cooperation Agreement (PCA). PCA discussions, which started in January 2007, would upgrade and expand the framework for bilateral trade and investment relations, which dates from the 1985 EC-‐China Trade and Economic Cooperation Agreement. If concluded, a PCA would be a great achievement. But, because of its far wider scope than commercial relations alone, negotiations are commensurately more arduous, and progress accordingly slow. Any benefit for FDI relations would therefore be more distant.

52
As Karl (2004) points out, the EU and its Member States have jointly concluded IIAs with third countries that include innovative features such as the facilitation of administrative procedures for FDI, access to capital markets,7 the provision of information about investment opportunities and the pursuit of deregulation. Innovations such as these offer the most scope after Lisbon for the EU to stimulate inward FDI from China. Each of these provisions would appeal either to all Chinese investors or to one group in particular. For instance, information on access to capital markets in the EU might stimulate especially those Chinese SME investors with a strong business model and adequate corporate governance but with inadequate access to capital at home (CCPIT, 2011). EU-‐wide investment promotion of this nature would both protect FDI in the 27 Member States simultaneously and level the playing field for investment in the EU.
Before and after Lisbon, investment incentives exercised by Member States for inward FDI are possible but subject to a strict control regime. And even when originating at the EU policy level, they are intended only for the alleviation of deficiencies, not for encouraging inward FDI to the EU in competition with third-‐country hosts. To be sanctioned, financial subsidies, tax grants, employment and infrastructure subsidies and R&D support all have to be deemed compatible with a common market. Investment conditions will, of course, continue to diverge among Member States in respect of key areas for FDI such as taxation, labour policies and social policies. The competence of Member States in these policy areas (and also the various sector-‐specific restrictions maintained by some Member States) will continue to coexist with EU competence for FDI, and we should not expect this to change anytime soon. However, a comprehensive investment agreement that attends specifically to the concerns of Chinese investors – concerns that, to date, have been quite poorly catered for – would seem to offer the best prospects for attracting not only more FDI but also investment of superior quality in terms of net positive impact.
It is not just the codified provisions of the Lisbon Treaty that empower the EU and its Member States to stimulate inward investment from China. As we shall see from the results of our survey of Member States’ IPAs, the operational processes of attraction, which lie largely outside the legislation, or rather ‘under 7 The emphasis in an EU-‐China IIA would be on access to capital for EU investors in China. Conversely, Chinese firms in the EU would not face any impediments – clearly an existing attraction of the EU for Chinese investors requiring access to capital.
CHINESE OVERSEAS DIRECT INVESTMENT IN THE EUROPEAN UNION
53
the radar’, of formal EU policy, are of prime importance. Mirroring the sphere of external trade, the emphasis on ‘live performance’ in investment promotion activities – currently at the Member State, sub-‐national, and even regional or city level – is likely to increase as Member States adapt to the prospect of exercising EU competence for FDI. Allowing, but also encouraging, a judicious balance of subsidiarity versus centralisation will be an important test for new international investment agreements, not least with China.
4.2 Investment promotion in the Member States Investment promotion in the EU is not a matter of discrimination in favour of inward foreign investors, of whatever nationality. It is a matter of effective communication and strategically reducing the excessive costs of doing business that naturally afflict a group of investors because of their foreignness, small size or newness to international business. Not to address these costs would be a disincentive to (especially de novo) inward investors and would potentially deny the benefits of inward FDI to Member States.
Projects such as the World Bank’s Doing Business and Investing Across Borders initiative provide prima facie evidence that the costs of doing business and of investing vary significantly in the EU (World Bank, 2004-‐2011; World Bank 2011). It is quite reasonable to suppose that these barriers and costs also impact differentially by home (investing) country, according to firms’ capabilities. World Bank research identifies the ‘ease of doing business’, particularly as it affects small and medium-‐sized enterprises wishing to start up and run businesses. Enterprises new to the EU would face these costs of entry. The World Bank’s indicators measure the burden of selected factors that impede enterprise, with the spotlight on business regulations that are in the policy domain, and rank each country along 10 dimensions. The World Bank intends that the publication of these findings, and derivative league tables, should put pressure on economies to reform and thus to improve their governance, structures and institutions and thereby become more competitive and raise their performance. There is a wide dispersion in performance, according to these rankings, in the EU; and, in many of the more advanced economies, regulatory burdens on business are heavier than in the less-‐advanced Fifth-‐Enlargement states (Dunning and Clegg, 2011). Some Fifth-‐Enlargement countries, for example Estonia and Lithuania, have rankings

54
equivalent or superior to those of certain EU-‐15 Member States, notably France, Greece and Italy.
There are 27 Member States in the European Union but there are a greater number of IPAs: we have counted 38 such organisations. Table 7 lists a selection of the leading organisations and some essential information about them, where available. These bodies are financed and organised by the respective states’ national, regional and city-‐level governments to encourage inward investment on a non-‐discriminatory basis (in the absence of specific policy to the contrary) from third countries and other Member States alike. This proliferation of promotional bodies attests both the importance assigned to inward investment and the pressure for states to create sub-‐national investment promotion agencies. Although somewhat atypical, Belgium has three such bodies. Italy also has three agencies, but not split entirely along geographical lines. Spain has a mixture of location-‐specific and specialist promotional organisations, although we have information on just one. Similarly, the United Kingdom’s national promotional body, UK Trade and Investment (UKTI), is supplemented by Liverpool, London and Manchester’s and other sub-‐national inward investment bodies. This development epitomises the resources now being devoted to attracting investment into regions and cities regardless of the provision for investment promotion at the Member State level.
The role of all these bodies is to convey the benefits of investment in their particular location. The overarching aim is to reduce the costs of information and of the necessary transactions for establishing an investment. A number of IPAs have translated their websites into Chinese in an attempt to appeal to potential Chinese enquirers. As noted earlier, the IPAs’ role is not to offer favourable and positive discriminatory packages to foreign investors. All they can legally offer is what many call a ‘one-‐stop shop’ that reduces the costs of doing business for inward investors, that is, for those who are unfamiliar with the particular investment environment and location. In many ways, they perform a function similar to that intended by IIAs but at a more fine-‐grained level.

CHINESE OVERSEAS DIRECT INVESTMENT IN THE EUROPEAN UNION
55
Table 7: EU Member State national investment promotion agencies and their offerings Pre-‐investmen
t de
cision
Post-‐in
vestmen
t de
cision
Post-‐in
vestmen
t
Agency na
me
Chinese web
page
Office in China
Benchm
arking
service
Even
ts/ trad
e mission
s
Fact-‐finding
visits
Coun
try an
d bu
sine
ss
oppo
rtun
ity
nformation
Gov
ernm
ent an
d research link
age
Existing
business
supp
ort
Profession
al services
(finan
ce, tax, legal)
Partne
rs and
sup
pliers
netw
orking
and
joint
venture assistan
ce
Setup location
assistan
t
Aftercare and
expa
triate sup
port
Invest In Austria Yes 1 -‐ Yes -‐ Yes -‐ -‐ Yes Yes Yes Yes
Brussels invest and export No 1 Yes Yes -‐ Yes Yes -‐ Yes Yes Yes Yes
Flanders Investment and Trade
Yes 2 -‐ -‐ -‐ Yes -‐ Yes Yes Yes Yes Yes
Wallonia Foreign Trade and Investment Agency
Yes 4 -‐ -‐ -‐ -‐ -‐ Yes Yes Yes Yes
Invest Bulgaria Agency No No -‐ -‐ -‐ Yes -‐ Yes Yes Yes -‐ -‐
Cyprus Investment Promotion Agency
No No -‐ -‐ -‐ -‐ -‐ -‐ -‐ -‐ -‐ -‐
CzechInvest No 1 -‐ -‐ -‐ Yes -‐ Yes Yes Yes Yes
Invest in Denmark Yes 1 Yes Yes Yes Yes Yes Yes Yes
Estonian Investment and Trade Agency
No 1 -‐ -‐ Yes Yes -‐ -‐ Yes Yes Yes -‐
Invest in Finland Yes 1 -‐ -‐ -‐ Yes -‐ -‐ Yes Yes Yes Yes
Invest in France Yes 3 -‐ -‐ -‐ -‐ -‐ Yes Yes Yes -‐ Yes
Germany Trade and Invest Yes 1 -‐ -‐ Yes Yes -‐ Yes Yes Yes Yes Yes
Invest in Greece Agency Yes No -‐ -‐ -‐ Yes -‐ -‐ Yes -‐ -‐ Yes
ITD Hungary Investment and Trade Development Agency
No 3 -‐ -‐ -‐ -‐ -‐ -‐ -‐ -‐ -‐ -‐
Industrial Development Agency of Ireland
Yes 2 -‐ -‐ -‐ Yes -‐ Yes Yes Yes Yes -‐
Invitalia No No -‐ -‐ Yes Yes -‐ Yes Yes -‐ -‐ Yes
Investment and Development Agency of Latvia
Yes No -‐ -‐ -‐ Yes -‐ -‐ Yes Yes Yes -‐
Invest in Lithuania No No -‐ -‐ Yes Yes -‐ Yes Yes Yes Yes Yes
Invest in Luxembourg Yes 1 -‐ -‐ -‐ -‐ -‐ -‐ -‐ -‐ -‐ -‐
Malta Enterprise Corporation No No -‐ -‐ -‐ -‐ -‐ Yes Yes -‐ -‐ -‐
WestHolland Foreign Investment Agency
Yes 1 -‐ -‐ Yes -‐ -‐ -‐ Yes Yes Yes Yes

56
Netherlands Foreign Investment Agency
Yes 4 -‐ -‐ Yes Yes -‐ -‐ Yes Yes Yes Yes
Polish Information and Foreign Investment Agency
No No -‐ -‐ -‐ Yes -‐ Yes Yes Yes Yes -‐
Agência para o Investimento e Comércio Externo de Portugal
No 3 -‐ -‐ -‐ Yes -‐ -‐ Yes Yes Yes -‐
Romanian Agency for Foreign Investment
No No -‐ -‐ Yes -‐ -‐ -‐ -‐ Yes Yes -‐
Slovak Investment and Trade Development Agency
No No -‐ -‐ -‐ -‐ -‐ -‐ Yes Yes Yes -‐
Public Agency of the Republic of Slovenia for Entrepreneurship and Foreign Investments
No No -‐ -‐ Yes Yes -‐ -‐ Yes Yes -‐ -‐
Invest in Spain No 4 -‐ -‐ Yes Yes -‐ Yes Yes Yes Yes Yes
Invest in Sweden Agency Yes 1 -‐ -‐ -‐ Yes -‐ -‐ Yes Yes Yes Yes
UK Trade and Investment Yes 5 -‐ -‐ -‐ -‐ -‐ -‐ -‐ -‐ -‐ -‐
Note: a dash (-‐) denotes that data are not available Source: Authors’ research.
In the following two sub-‐sections, we analyse the responses to our questions on Chinese investments, posed in nine interviews within our telephone/e-‐mail survey of IPAs in the EU Member States. We also approached the commercial counsellors or delegated commercial section officials of Chinese embassies in a number of EU Member State capitals. The request for interviews with the IPAs met with a healthy response, but this cannot be said of the Chinese embassies. We take this as an indication that Chinese embassy commercial sections perhaps conceive their role differently from western embassy commercial sections: they do not see their role as investment promotion, nor are they aware of the connection between EU policy and their mission to the Member State concerned. The feedback that we did obtain from those embassies that declined to give reasons points to this conclusion.
We interviewed IPAs of Austria, Belgium (Wallonia), Bulgaria (written answers), Denmark, Greece, Ireland, Lithuania, Sweden and the UK. There were no responses from Chinese embassies other than initial comments from those in Slovenia and Estonia indicating that the EU dimension was beyond their competence.
4.2.1 Member States’ attitudes to Chinese FDI Every country has had some Chinese direct investment. Most IPAs want the number of Chinese investments to increase, but one expressed reservations. This may be caused by confusion between direct investments and government-‐

CHINESE OVERSEAS DIRECT INVESTMENT IN THE EUROPEAN UNION
57
to-‐government financial support. Indeed, all IPAs foresaw an increase in Chinese investment as inevitable. There is significant scope for Chinese investment because the investment figures are relatively low. The IPA respondents report that Chinese investors are still cautious about the European market, as they do not understand it completely and do not have the skills to deal with it properly.
The current number of Chinese investments (a headcount, in contrast to the FDI position), as reported by the IPAs in our interview data, is provided by UKTI, which reports 400 active Chinese firms. Denmark identifies 120–150 Chinese investors and Sweden records annually 20–25 Chinese investors. Across the Member States there was a steep increase in Chinese investments in the two years since 2009: inflows to Bulgaria nearly tripled; Denmark had one or two investors in 2006, nine in 2010 and probably 12-‐4 in 2011. The UK reports 59 investments, creating 1,500 jobs, in 2010. Again the data, gathered directly from the IPAs, does not match with Eurostat data.
Two developing trends can be seen, and the first concerns the type of investor. Sweden reports that small entrepreneurial firms and private businesses started the first wave, followed later on by state enterprises and large SOEs. The third wave consists of large private firms. The second trend relates to market penetration strategy. UKTI observes that Chinese firms generally follow a pattern of incremental increase in market commitment, in common with many other foreign investors.
The main motives for investment cited are access to markets (in the host country and/or EU), access to technology (via outright purchase or through R&D and local collaboration), access to highly skilled cheap labour and, as one respondent put it, ‘anything that helps them up the value chain’.
Chinese investors are seen to bring both direct (labour, taxes etc.) and indirect benefits. IPAs see inward FDI as providing indirect opportunities for local firms in the host state by encouraging better understanding of Chinese businesses and the way they work. This, in turn, should help local businesses to get easier access to the Chinese market. Indeed, the Chinese investor could act as a broker for the host-‐country firm. The direct benefits are often employment-‐related but also include the transfer of technology and the expatriation of very skilled Chinese workers to the foreign affiliate. However, doubt remains over the managerial capacity of Chinese businesses and therefore the extent to which the claimed potential benefits can be achieved.

58
Member States’ IPAs follow either a ‘deep’ or a ‘broad’ strategy or both to attract Chinese investors. States following a ‘broad’ strategy are represented in China through their embassy and consular staff (trade representatives etc.) and profile their country through government-‐to-‐government links. No specific Chinese firms, industries or provinces are targeted. States following a ‘deep’ strategy have at least one IPA office in China (commonly Shanghai, with additional ones usually in Shenzhen and Beijing) supported by dedicated investment promotion staff at the embassy and consulates. They identify particular firms in particular industries or provinces and speak directly to them. There is an element of ‘broad’ strategy observable here too, as they regularly attend trade fairs and offer seminars to Chinese investors. Attracting Chinese investors is, in some countries, directly supported by the head of state, which gives the relevant government organisation greater prominence.
The smaller European states tend to have only one IPA. The larger ones may have government-‐related sub-‐national organisations as well. In addition, private and profit-‐orientated businesses offer services to foreign investors. The work of IPAs seems to pay dividends: some Member States report that they have been involved in 75–90 per cent of all Chinese investments, which is a very clear indication of IPAs’ importance. The IPAs reporting this involvement are those that have a ‘deep’ strategy. IPAs with a ‘broad’ strategy highlight the good general business environment and the importance of fast investment, planning and permission procedures in their states.
Given that the establishment and running of an extensive IPA network requires significant resources, it comes as no surprise that France, Germany and the UK are the EU countries with the largest investments in these activities. However, a somewhat different picture emerges in terms of success. Although those three countries remain at the top in terms of absolute numbers of Chinese investors, smaller EU Member States do relatively well when relative resource investment and country size are also considered. Of the east European countries, Hungary is noted by other IPAs as a significant investor in attracting Chinese investors to good effect.
A further increase in Chinese investment could be achieved by raising the profile of the host country through direct promotional activities and more indirect high-‐level government-‐to-‐government interactions. Moreover, some IPAs feel that it is sensible for resource-‐constrained Member States to focus on a particular industry or province in order to optimise impact. In addition to

CHINESE OVERSEAS DIRECT INVESTMENT IN THE EUROPEAN UNION
59
these state-‐level measures, there is a view that the European Commission should ensure and improve market access and an EU-‐wide open competitive market by removing any still-‐existing protectionist trade and investment measures (regardless of the nationality of investor).
There are no specific investment incentives for Chinese firms. They are treated as any other investor, indeed often just like any other local firm. Thus there are no barriers to Chinese investments among the EU Member States, despite different perceptions by some Chinese observers.
Chinese investors readily identify their lack of knowledge and understanding to IPAs and ask for help about regulations and cultural aspects as much as about exploiting market opportunities. The main barriers that Chinese investors face are a lack of understanding of the regulatory environment and of the way of doing business in a different culture (‘psychic distance’). The regulatory environment includes diverse aspects, some of which are harmonised between Member States and some that are not. This environment encompasses product quality and safety standards and requirements, employment and labour laws (working time, allowances, and employee rights), visa and immigration policies and the role and involvement of the host government in conducting business. ‘Psychic’ distance relates here mainly to cultural differences, the language abilities of Chinese employees (and probably also the staff at HQ) and different managerial and marketing practices.
The IPAs address these challenges by working closely with potential Chinese investors, trying to educate them and helping them to understand the host state’s economy better. Long-‐term and intensive collaboration with Chinese investors is seen mainly at IPAs employing a ‘deep’ strategy.
4.2.2 Member States’ attitudes to the European Commission and the Lisbon Treaty
Respondents had the least to say in the part of the survey about their attitudes to the European Commission and the Lisbon Treaty. The Chinese embassies in the Member States saw the questions on the EU dimension as an irrelevance and a justification for not participating. For the IPAs, the European Commission has no particular role in attracting Chinese investors besides ensuring a free market. This is seen to be Member States’ territory, but one IPA respondent pointed out that the multitude of different bureaucracies in Member States was a disincentive to inward investment to the EU as a whole. In general, there was

60
agreement ‘in principle’ that the Commission can help in improving the general profile of the EU for Chinese investments.
IPAs do not see the Lisbon Treaty to have any impact on their operations. However, one IPA acknowledged that the dynamics of international negotiations are very likely to change as competence and the exercise of powers moves to the EU level. Thus it is envisaged that IPAs will have to work more closely with EU institutions, such as the European Parliament. Another IPA stated that in view of the move to the highest institutional level, the Treaty could have implications for future market access and the general support that the EU-‐China relationship receives.

CHINESE OVERSEAS DIRECT INVESTMENT IN THE EUROPEAN UNION
61
5 Chinese Policies for Outward FDI and for FDI in the EU The Chinese government today generally supports cross-‐border investments by Chinese firms and, in some instances, actively supports them. Since the mid-‐1980s, it has issued policy regulations designed to structure and coordinate cross-‐border direct investments. In order to decentralise, streamline and improve investment approval, it has enabled the responsible institutions of government to enhance their competence to assess, monitor and evaluate such investments. The Go Global policy has accelerated this decentralisation process and encouraged a more ‘hands-‐off’ approach to outward FDI. Notwithstanding this evolution in the Chinese outward investment policy regime, national government organisations and their provincial equivalents are still much involved in the setting of policy and the approval of investments. At the national level, these bodies are the State Council, the National Development and Reform Commission (NDRC), MOFCOM and SAFE. Other ministries and organisations may be involved depending on the investment and the industry concerned.
The increasing ‘hands-‐off’ approach, indicating the development of an industrialised-‐country approach to outward investment, is illustrated by actions undertaken by the relevant government bodies. SAFE lifted restrictions on the amount of foreign exchange available annually to domestic investors’ outbound investments and announced in 2009 that Chinese firms can seek financing from multiple sources. MOFCOM simplified and shortened the approval procedures in 2009, and the NDRC reiterated in 2011 its desire to decentralise the outward investment approval decision process (Buckley et al., 2012; Luo, Xue and Han, 2009; Voss, Buckley and Cross, 2009).
5.1 Chinese policies for outward investment The Go Global policy has led to the establishment of new organisations and regulations specifically to encourage outward investment. Supportive measures include workshops and conferences on outward FDI, for example the annual conferences of the Zhejiang Investment & Trade Symposium (www.zjits.com) or the China Council for the Promotion of International Trade (www.goglobal.org.cn) and, under certain conditions, the provision of finance in the form of equity and debt financing. Conditions for support are fulfilled if outward investment promotes domestic development by securing natural resources, stimulates Chinese exports or focuses on R&D. Some measures of
62
support are industry-‐specific. The NDRC stated in 2005 that its objective is to promote the establishment of conditional production bases and marketing networks in sectors such as light industry, textiles, home appliances and other manufacturing and to actively encourage key service sector industries (that is, trade, distribution, banking, insurance, and telecommunications) to ‘go out’. Recently, financial services have received special attention from MOFCOM, which intends to promote the globalisation of China’s commercial banking. MOFCOM supports firms that invest in world-‐renowned brands, advanced technology, marketing networks and research institutions. The Ministry of Finance (MOF) and MOFCOM issued financing guidelines in 2010 to clarify when direct subsidies to outward investment are available. These subsidies would be for the upfront costs of professional services, investigation costs, fees for project feasibility, study reports and the preparation of safety assessments and also transportation fees for the import of resources and fees for the registration of foreign patents.
In 2011, MOFCOM announced that, inter alia, banks should increase Go Global credit support for enterprises in certain sectors, such as mineral resource companies; that the Export-‐Import Bank should improve its offers; that local governments should guide funding better; and that the granting of support for equity investment and bond financing should be accelerated. Other instruments of support also came under the spotlight for improvement, such as the provision of credit insurance and the strengthening of cooperation between international organisations and foreign insurance institutions. Controversy exists over the extent to which these government measures constitute unfair competition.
The Chinese government owns the sovereign wealth fund CIC (established in 2007); and through SAFE, it owns the Hong Kong-‐based subsidiary SAFE Investment Company (SIC, established in 1997), which invests much like a SWF. The objective of both funds is to secure good returns on investments. The CIC is heavily involved in domestic Chinese investments but was also employed to acquire 9.9 per cent of the American private equity firm Blackstone Group in 2007, along with other American financial institutions that have interests in natural resource-‐related investments abroad (Sekine, 2011; Thomas and Chen, 2011). The SIC has holdings of portfolio investments (without management control) in the European oil companies BP and Total (Thomas and Chen, 2011); and since 2005, it has increased its cross-‐border direct investments from €0.52 billion (US$0.65 billion) to €2.35 billion (US$3.11 billion) in 2010 (SWF Institute,
CHINESE OVERSEAS DIRECT INVESTMENT IN THE EUROPEAN UNION
63
2011). Given their current focus on portfolio and other types of investment, these funds are not considered in depth in this paper. However, we should note that as they seek to diversify their growing portfolios of wealth holdings, they are inexorably led towards the ownership of real assets, as opposed to paper (financial) assets, and towards direct investment as their holdings pass the 10 per cent threshold for FDI. Indeed, many EU states are keen to secure SWF capital for large infrastructure projects.
Finally, the Chinese government is supporting the global establishment of 50 ‘economic cooperation and trade zones’. These zones are open to any investor but tend to be, as in the African case, used predominantly by Chinese firms (Bräutigam, 2011). With the China-‐Africa Development Fund and the China-‐ASEAN Cooperation Fund, the Chinese government has established bodies to increase Chinese business activities in specific regions. No such fund exists for investments in the EU.
5.2 Chinese policies for outward investment to the EU China’s policies towards Chinese direct investments in the EU will be analysed through an assessment of China’s Outbound Investment Catalogue, China’s Global Economic and Trade Cooperation Zones in relation to the observable investment pattern in the EU.
5.2.1 China’s Outbound Investment Catalogue The Chinese government departments MOFCOM and the Ministry of Foreign Affairs published the first Outbound Foreign Investment Catalogue (OFIC) in 2004. Mirroring the structure of the Foreign Investment Catalogue (for inward FDI), the OFIC indicates in which sectors and countries Chinese firms should invest. The country coverage of the catalogue was expanded in the 2005 and 2007 updates to include 128 countries. No further updates or amendments have been released since then.
For the EU-‐27, the catalogue generally emphasises investments in industrial sectors, followed by services. Encouragement to invest in natural resources, such as forestry, fishing or mining, is focused on the Czech Republic, Finland, Poland and Spain, where the relevant resources can be found in abundance.
Of the leading European economies, only Germany and the United Kingdom are identified as attractive host countries (see Table 8). The respective comparative

64
advantages of these states explain their attraction for Chinese firms. The UK scores well in services (trade, distribution, R&D, warehousing, logistics and transportation, finance and legal services) and Germany in manufacturing (television sets, communications equipment, computers and other electronic equipment, electrical machinery and equipment, pharmaceuticals and chemicals and chemical products).
Romania, Poland, the Czech Republic, Hungary and Portugal are the other most attractive European countries. All these Fifth-‐Enlargement states are identified as being of greater importance for Chinese firms that seek to manufacture in the EU than the EU-‐15 countries. They are identified as locations for the manufacturing of textiles, leather goods and luggage (with the exception of Portugal), television sets, communications equipment, computers and other electronic equipment (Poland, Portugal, Romania) as well as electrical machinery and equipment (Czech Republic, Hungary, Poland). These are all industries in which China has export strength but in which it has faced increasing pressure in recent years from importing nations to reduce its balance of trade surplus. Although generated by Chinese firms’ export competitiveness, this trade imbalance is nevertheless politically contentious. It is voiced against the Chinese government, and reflected in the 55 anti-‐dumping measures and one anti-‐subsidy measure in force in the EU against Chinese imports as of 30 June 2011. 8
The highlighting of these sectors for FDI can therefore be explained as encouraging trade-‐substituting and import barrier-‐avoiding investment in low-‐cost EU countries in order to defend existing market share. The Czech Republic (forestry) and Poland (mining) also feature as hosts for activities focused on natural resources. The split in official encouragement along the lines of comparative advantage – whether it arises for natural reasons (resource endowments) or man-‐made reasons (firms’ created assets) – supports the view that Chinese firms invest for strategic asset-‐seeking purposes in the advanced European economies. And it also suggests market-‐seeking and efficiency-‐seeking motives. Of course, we have to infer the motives of Chinese firms by dissection of the Chinese government’s policy intentions, not by analysis of firm-‐level data. However, it does shed some light on possible causes of the patterns in the operating data in section 3.3 that we employed to investigate possible impact on the European host economies.
8 http://trade.ec.europa.eu/doclib/docs/2009/september/tradoc_144591.pdf

CHINESE OVERSEAS DIRECT INVESTMENT IN THE EUROPEAN UNION
65
There is a lack of sector guidance (encouragement) for the Member States Italy, Latvia, Luxembourg and Malta. The reasons for this apparent oversight are not immediately clear, but they could be inadequacy of domestic market size (Latvia and Malta), clear comparative advantage in line with Chinese economic priorities or barriers to doing business. Yet Italy has thriving manufacturing, textile and leather industries. The Chinese government has encouraged investments in those industries in other states, such as the Czech Republic, France, Lithuania, Poland and Spain, which offer either large domestic markets or low labour cost production (by EU standards) and from which goods can be exported to the rest of the EU. This points to official guidance away from high-‐labour-‐cost locations when Chinese import-‐substituting FDI is undertaken in order to defend export market shares and when the motive is to secure increased market share, or strategic assets, in larger markets.
Table 8: Attractiveness of EU Member States
Number of attractive sectors identified per Member State
Total Natural resources Industry Services
Germany 8 0 4 4
Romania 8 0 5 3
Poland 7 1 4 2
Czech Republic 6 1 4 1
Hungary 6 0 4 2
Portugal 6 0 4 2
United Kingdom 6 0 2 4
Austria 5 0 3 2
Denmark 5 0 3 2
Estonia 5 0 3 2
France 5 0 3 2
Sweden 5 0 3 2
Bulgaria 4 0 3 1
Belgium 4 0 1 3
Greece 4 0 2 2
Ireland 4 0 2 2
Netherlands 4 0 2 2
Spain 4 1 2 1
Cyprus 3 0 2 1
Finland 3 1 1 1

66
Slovenia 3 0 2 1
Slovakia 2 0 2 0
Lithuania 1 0 1 0
Italy 0 0 0 0
Latvia 0 0 0 0
Luxembourg 0 0 0 0
Malta 0 0 0 0 Note: The table lists the number of sectors mentioned per country out of 35 possible sectors. Source: MOFCOM and Ministry of Foreign Affairs (2004–07).
The catalogue highlights manufacturing sectors in which China has a comparative advantage at home coupled with significant exports to the EU (see Figure 10). Investments in those areas can therefore be regarded as advantage-‐exploiting strategies. Industries and functional activities in which Chinese firms are disadvantaged vis-‐à-‐vis competitors in the EU are regarded as priority areas for investment. Such exploration and learning activities are common among Chinese investors globally and follow in the footsteps of strategies pursued by firms such as Haier and Huawei, leading to increasing overseas activities for a new cohort of firms. By contrast, Chinese outward investors have lagged behind in activities such as R&D and financial and legal services, although improvements in those activities are now afoot in order to support the internationalisation of Chinese investors in other industries.
Neither the sectoral nor the country emphasis of the Outward Foreign Investment Catalogue square well with the observed investment pattern. As analysed in Chapter 4 of this paper, Germany and the UK receive the largest share of Chinese investment, and the peripheral countries receive considerably less than their industry structures would suggest is appropriate. The prominence of international trade-‐related FDI is evident in the data, as in the catalogue. Sectors that have not been picked up by investors include textiles, leather and luggage manufacturing and tourism. The apparent mismatch between the government-‐devised catalogue and firms’ investment decisions indicates a certain independence of mind regarding commercial investment decisions, at least by some Chinese outward investors.
The financial and economic crisis should leave its mark on the country and sector focus of Chinese OFDI. The economic situations of Portugal, Ireland, Greece and Spain pose severe risks for international investors, especially those with little international experience. In different macro-‐economic circumstances, however, Chinese firms have shown their skill in identifying promising business

CHINESE OVERSEAS DIRECT INVESTMENT IN THE EUROPEAN UNION
67
opportunities, as when acquiring ailing German Mittelstand (medium-‐sized) firms.
Figure 10: Sector distribution in the Outbound Investment Catalogue, in force in 2012
Note: Electronic equipment manufacturing includes: TV, communications equipment, computers and other electronic equipment manufacturing. Other services and extractive services each comprise three sectors, other manufacturing comprises nine sectors. Source: MOFCOM and Ministry of Foreign Affairs (2004-‐2007).
5.2.2 China’s global economic and trade cooperation zones A further instrument of the Chinese government for supporting the internationalisation of domestic firms in priority locations and activities is the progressive establishment of a worldwide network of economic and trade cooperation zones (see Table 9). The aim is to open 50 such zones. Within the EU, zones (or hubs) have been established that cater particularly for Chinese businesses. These hubs have been established by a multitude of organisations, including the Chinese government, Chinese SOEs and Chinese entrepreneurs, and by European businesses. Hubs opened and operated with official Chinese involvement clearly qualify for the Chinese government-‐supported scheme aiming at 50 zones. Other hubs would appear to be a private sector response to Chinese firms’ needs for support in cases where official endorsement is not available.
68
The primary purpose of these hubs is the promotion of bilateral trade, but they may also be designed to encourage investments by Chinese firms in the region and to connect Chinese firms with local business so as to roll out the benefits of economic growth in China. The ‘China Gateway’ hub – under development in the former textile city of Wigan, west of Manchester in the north of England – is one hub that explicitly aims to attract investors, in this case from the Chinese textile industry, to manufacturing locally. Chinamex, the Chinese partner in this project, operates three other hubs, near Schiphol Airport, Amsterdam, in the Netherlands.
Although exposed to European firms operating in China for more than 20 years, Chinese firms find it qualitatively harder to operate outside their native environment. As we noted in section 4.2, studies such as the World Bank’s Doing Business and Investing Across Borders initiative provides prima facie evidence that the costs of doing business will be higher for firms that are entering an unfamiliar economic environment (World Bank, 2004–2011, and World Bank, 2010). This is why a majority of these hubs focus on trade facilitation, not FDI, which is particularly suitable for smaller firms. Small firms generally start their international activities through exporting. When demand in the market country proves to be sufficiently large and stable, direct investment may follow. Initially, this will occur through a modest commitment and low-‐risk activities. Undoubtedly, these hubs offer an important channel through which Chinese firms can gain experience and understanding of European markets within a supportive environment. Their effect is clearly positive for Chinese FDI in the EU.
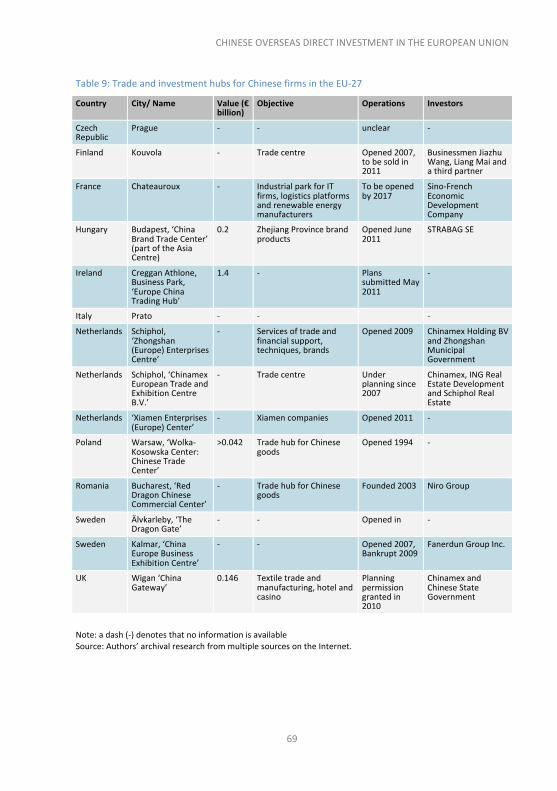
CHINESE OVERSEAS DIRECT INVESTMENT IN THE EUROPEAN UNION
69
Table 9: Trade and investment hubs for Chinese firms in the EU-‐27
Country City/ Name Value (€ billion)
Objective Operations Investors
Czech Republic
Prague -‐ -‐ unclear -‐
Finland Kouvola -‐ Trade centre Opened 2007, to be sold in 2011
Businessmen Jiazhu Wang, Liang Mai and a third partner
France Chateauroux -‐ Industrial park for IT firms, logistics platforms and renewable energy manufacturers
To be opened by 2017
Sino-‐French Economic Development Company
Hungary Budapest, ‘China Brand Trade Center’ (part of the Asia Centre)
0.2 Zhejiang Province brand products
Opened June 2011
STRABAG SE
Ireland Creggan Athlone, Business Park, ‘Europe China Trading Hub’
1.4 -‐ Plans submitted May 2011
-‐
Italy Prato -‐ -‐ -‐
Netherlands Schiphol, ‘Zhongshan (Europe) Enterprises Centre’
-‐ Services of trade and financial support, techniques, brands
Opened 2009 Chinamex Holding BV and Zhongshan Municipal Government
Netherlands Schiphol, ‘Chinamex European Trade and Exhibition Centre B.V.’
-‐ Trade centre Under planning since 2007
Chinamex, ING Real Estate Development and Schiphol Real Estate
Netherlands ‘Xiamen Enterprises (Europe) Center’
-‐ Xiamen companies Opened 2011 -‐
Poland Warsaw, ‘Wolka-‐Kosowska Center: Chinese Trade Center’
>0.042 Trade hub for Chinese goods
Opened 1994 -‐
Romania Bucharest, ‘Red Dragon Chinese Commercial Center’
-‐ Trade hub for Chinese goods
Founded 2003 Niro Group
Sweden Älvkarleby, ‘The Dragon Gate’
-‐ -‐ Opened in -‐
Sweden Kalmar, ‘China Europe Business Exhibition Centre’
-‐ -‐ Opened 2007, Bankrupt 2009
Fanerdun Group Inc.
UK Wigan ‘China Gateway’
0.146 Textile trade and manufacturing, hotel and casino
Planning permission granted in 2010
Chinamex and Chinese State Government
Note: a dash (-‐) denotes that no information is available Source: Authors’ archival research from multiple sources on the Internet.
70
6 Policy Recommendations In this section, we set out policy recommendations to support the attraction of high-‐quality inward FDI to the EU, by Chinese investors, summarised as bullet points. This is followed by a conclusion setting out the key findings.
Bilateral investment treaties have been effective in substituting for the deficiencies of third-‐country institutions and policies, thereby enabling individual Member State firms to make sound long-‐term foreign investment decisions. But if BITs had been required to encourage inward FDI in the EU in the same way, that would have reflected poorly upon the quality of Member States’ institutions and policies, and even upon the implementation of the Acquis Communautaire. The EU’s “patchwork” inward FDI legacy regime, and the survey responses reported in this paper, strongly suggest that inward investment into the EU as a whole, and into the Member States individually, would benefit from greater Union-‐wide consistency in policy and the business environment. A lack of harmony in policy and institutions between Member States’ markets must reduce the attractiveness of the EU as a whole as a location for production, and as a market for Chinese investors.
6.1 The EU level • No discrimination at all, particularly that of an indirect or insidious kind, against potential inward investors should be a goal. This should apply to all sectors; and clear, transparent and common guidelines across the EU on investment promotion should be developed, with an emphasis on raising the standard to that of the current best practice in the Union.
• The potential for harmonisation in areas not directly related to FDI but which impact upon inward FDI should be considered. Current consideration by the French and German governments to equalise certain business-‐related taxes is noteworthy in this respect.
• Visa and work permit regulations should be simplified rather than made more complex for bona fide commercial investors, to ensure open competition and to support the ability of potential and current foreign investors to do business.
• An offer should be put to the PRC for improving and facilitating the investment process in the EU. This should be used as a support for
CHINESE OVERSEAS DIRECT INVESTMENT IN THE EUROPEAN UNION
71
negotiation towards an IIA. This would serve the achievement of greatly improved market access in China, in those sectors where China’s WTO obligations have not matched up to EU firms’ commercial aspirations with respect to selling into, and sourcing from, Chinese markets.
• An outward investment policy that recognises the positive and dynamic linkages between EU investment in China and Chinese FDI in the EU is required. Evidence that EU investment in China will promote greater Chinese FDI in the EU should be capitalised upon, particularly as the EU has a strong investment profile in the PRC.
• There should be investment in creating a framework for the comprehensive, objective monitoring and evaluation of the quality and impact of inward investment. As the EU now has competence for FDI, it must also take responsibility for the quality of data. It is recommended that the Commission should assist Member States’ national statistical offices in upgrading to the highest standard in the EU (and ideally following procedures and standards as set out in UNCTAD, 2009a, b and c).
6.2 The Member State level • The reduction of the costs of doing business in Member States should be made a priority in attracting Chinese investors and be congruent with the Internal Market and the Common Market freedoms. This will not only increase the attractiveness of individual states to foreign investors but also stimulate domestic investment and thereby competitiveness and growth.
• Member States’ ministries in charge of inward investment, and their IPAs, should consider adopting a ‘deep’ investment promotion strategy, which the evidence suggests is more successful than a ‘broad’ strategy alone. The cases of best practice across EU Member States highlight countries that have a ‘deep’ promotion strategy focused on industry sector, firm type and/or province in China, combined with the necessary physical infrastructure for promotion in China and at home.
• Active participation in and support of China’s economic cooperation and trade zones programme should be considered and evaluated, including the possibility of developing a similar concept with the European Commission, which goes beyond China’s programme of 50 zones, to

72
promote EU priorities. Above all, zones should have an additional impact on Chinese FDI and avoid cannibalisation in the EU and within its Member States.
7 Conclusion Chinese direct investment outflows today are equal to or greater than those of large industrialised economies and are set to rise still further. The Chinese economy, and its FDI, has shown resilience in the financial and economic crisis that the advanced economies can only envy. It is therefore particularly regrettable that the European Union as a whole is only a minor recipient of Chinese direct investment abroad. This would be more worrying had the EU striven hard to secure Chinese FDI. But it has not presented a unified face to China, and has to date not been in a position to conclude an investment agreement. With the Treaty of Lisbon and the passing of ultimate competence for FDI policy to the EU level, now is the perfect time to look at doing just this. The interests of European firms (particularly in a range of services) that would like to invest in China but are unable to (on account of limits to China’s WTO obligations to liberalise) would be well served by such an agreement. And at the same time a new EU-‐level investment-‐friendly environment would be created for Chinese investors.
The current, post-‐Lisbon, FDI regime is still largely the product of individual Member States’ bilateral investment treaties with third countries on market access and on investment protection. As with China, the focus has been on EU investment in these third countries, rather than on Chinese investment into the EU. We can surmise that the transitional arrangements preserve most of the benefits of the status quo of IIAs in general, but do not address the question of how best to promote the right kind of Chinese inward FDI to the EU. The analysis of data shows that the EU cannot afford to take a back seat in the global competition to attract and provide for investment from, and to, all parts of the world. The work of the Member States in encouraging inward FDI is largely the preserve of their individual investment promotion authorities and sub-‐national, even city-‐level, bodies. It is to these agencies that we must turn in order to understand how to create the face that is presented to potential Chinese investors by the EU after Lisbon. Some Member States have fared better than others as hosts to Chinese FDI, and this appears to be a result of their commitment to the promotion of trade and investment, and the

CHINESE OVERSEAS DIRECT INVESTMENT IN THE EUROPEAN UNION
73
strenuous efforts of their IPAs. This dynamic should be supported, and effective IPAs should be incentivised to develop their work.
Besides encouraging inward Chinese FDI in quantity, the EU and Member States must design policy to encourage investment high in quality. The range of benefits to EU hosts flow from the competitive effect of inward FDI, directly and indirectly raising, or preserving, income and employment. Private sector investors bring entrepreneurship, and sovereign wealth funds offer the potential for large-‐scale investment, for example in infrastructure. Unlike Japanese FDI in the EU or US FDI before it, Chinese FDI is not so likely to transfer management skills and new technology. If anything, Chinese firms may be seeking to learn, at least in some respects. And this may be the key to making the EU truly distinctive, and attractive, as a host. Inward investment promotion is best when it recognises the specific needs of investors. Inward investors could be mentored on their business models and on encouraging larger-‐scale Chinese investments, and those with greater R&D intensity naturally offer greater linkage and spillover potential for the EU and local economies. Investment promotion agencies throughout the Member States should be encouraged to attract exactly this kind of investment, to bring about a better and targeted fit with local economies. Helping to arrange mentoring, linkages and joint ventures for Chinese firms would embed them in the local economy and potentially lead to opportunities in China for EU firms.
To date, the impact of Chinese FDI at the EU level has been minor. But in certain sectors, e.g. telecommunications equipment, there are already signs of a positive competitive effect. And although the operating profile of Chinese FDI is quantitatively small, at its best it clearly indicates productive activity with substantial income and employment generation for the host country. In some states, the profile suggests that affiliates primarily handle imports from China and distribute them EU-‐wide. We need to know more about these profiles, to help develop a coherent policy to encourage FDI in sectors that will benefit the EU and as a counterpart to China’s Outbound Foreign Investment Catalogue. Further dynamic benefits to the EU are possible. We need to find out more about how opportunities for European businesses, especially small and medium-‐sized firms, to enter new markets can be stimulated by Chinese investment in the EU.
Commentators in China have perceived a hostile stance in the EU towards Chinese investments. This perception might be informed by the media’s

74
penchant for alarmist reports of an influx of Chinese investors buying up Europe. In fact, the vast majority of cross-‐border investments are based on mergers and acquisitions, and the number of European acquisitions by Chinese firms is actually very small. This point underlines that any policymaking (and reporting) on FDI across the EU needs to be better informed and to be supported by appropriate data, which is the responsibility of Eurostat. EU-‐level action and Member State cooperation, underpinned by the EU’s new FDI competence, will be necessary for the Union to have as clear a picture of inward FDI as China does of inward FDI from the EU. Anything less places the EU at a distinct disadvantage.
Chinese firms have only recently started to internationalise. There is still a long way to go until they have the same status in the EU that firms from the US, Japan and South Korea enjoy. But it is no unrealistic prediction to say that with a concerted European policy and a positive attitude towards Chinese inward investment, Chinese (consumer) brands will become household names in the EU. And Chinese investment will provide a much-‐needed competitive stimulus to EU growth and entrepreneurial and technological dynamism in the Internal Market.

CHINESE OVERSEAS DIRECT INVESTMENT IN THE EUROPEAN UNION
75
References Bräutigam, D. (2011), ‘Chinese aid to Africa: what, where, why, and how much?’ in J. Golley and L. Song (eds) China Update 2011, Canberra: Australian National University.
Buckley, P.J., Clegg, L.J., Cross, A.R., Liu, X., Voss, H. and Zheng, P. (2007), ‘The determinants of Chinese outward foreign direct investment’, Journal of International Business Studies, 38(4): 499–518.
Buckley P.J., Clegg, L.J. and Wang, C. (2007), ‘The impact of foreign ownership, local ownership and industry characteristics on spillover benefits from foreign direct investment in China’, International Business Review, 16(2): 142–58.
Buckley, P.J., Voss, H., Cross, A.R. and Clegg, L.J. (2012), ‘The emergence of Chinese firms as multinationals: the influence of the home institutional environment’, in R. Pearce (ed.), China and the Multinationals: International Business and the Entry of China into the Global Economy, Cheltenham: Edward Elgar.
Cheung, Y.-‐W. and Qian, X. (2009), ‘Empirics of China’s Outward Direct Investment’, Pacific Economic Review, 14(3): 312–41.
China Council for the Promotion of International Trade (2009), 2009 Survey on Current Conditions and Intention of Outbound Investment by Chinese Enterprises, Beijing: CCPIT.
China Council for the Promotion of International Trade (2010), 2010 Survey on Current Conditions and Intention of Outbound Investment by Chinese Enterprises, Beijing: CCPIT.
China Council for the Promotion of International Trade (2011), 2011 Survey on Current Conditions and Intention of Outbound Investment by Chinese Enterprises, Beijing: CCPIT.
Cuervo-‐Cazurra, A. (2007), ‘Sequence of value-‐added activities in the multinationalization of developing country firms’, Journal of International Management, 13, 258–77.
Duanmu, J.-‐L. (2012), ‘Firm heterogeneity and location choice of Chinese Multinational Enterprise (MNEs)’, Journal of World Business, 47(1): 64-‐72.

76
Dunning, J.H. and Clegg, L.J. (2011), ‘An enlarged EU, institutional challenges and European competitiveness’, in Miroslav N. Jovanović (ed.) International Handbook on the Economics of Integration, vol. III: Factor Mobility, Agriculture, Environment and Quantitative Studies, Cheltenham: Edward Elgar Publishing, pp. 33–55.
Dunning, J.H. and Lundan, S.M. (2008), Multinational Enterprises and the Global Economy, Cheltenham: Edward Elgar Publishing.
Ernst & Young (2011), Destination UK: Sustaining Success in the New Economy -‐ Ernst & Young’s 2011 UK Attractiveness Survey, London: Ernst & Young.
European Commission (2006), Upgrading the EU Investment Policy, Note for the Attention of the 133 Committee, European Commission, Issues paper. European Commission Directorate-‐General for Trade, Brussels, 30 May.
European Commission (2010a), Establishing Transitional Arrangements for Bilateral Investment Agreements between Member States and Third Countries, Regulation of the European Parliament and of the Council. European Commission, Brussels, 7 July, COM (2010)344 final.
European Commission (2010b), Towards a Comprehensive European International Investment Policy, Communication from the Commission to the Council, the European Parliament, the European Economic and Social Committee and the Committee of the Regions Brussels, 7 July, COM (2010)343 final.
European Commission (2010c), Q&A: Commission Launches Comprehensive European International Investment Policy, Memorandum, Directorate-‐General for Trade, Brussels, 7 July, http://trade.ec.europa.eu/doclib/press/index.cfm?id=590.
European Commission (2011), Public Consultation on the Future Investment Relationship Between the EU and China, Directorate-‐General for Trade, Brussels, 2 May.
European Parliament (2011), Report on the Future European International Investment Policy, Committee on International Trade, European Parliament, Brussels and Strasbourg, 22 March, PE454.567v03-‐00.
Eurostat (2011a), Euro/ECU exchange rates – Annual data [ert_bil_eur_a], European Commission, Luxembourg, 30 August.

CHINESE OVERSEAS DIRECT INVESTMENT IN THE EUROPEAN UNION
77
Eurostat (2011b), EU Direct Investment Flows, Breakdown by Partner Country and Economic Activity [bop_fdi_flows], European Commission, Luxembourg, 6 April.
Eurostat (2011c), Foreign Control of Enterprises – Breakdown by Controlling Countries – Reference Years 2003-‐2007 [fats_g1b_03], European Commission, Luxembourg, 8 July 2011.
Karl, J. (2004), ‘The competence for foreign direct investment: new powers for the European Union?’ Journal of World Investment and Trade, 5(3): 413–44.
Klossek, A., Linke, B.M. and Nippa, M. (2012), ‘Chinese enterprises in Germany: establishment modes and strategies to mitigate the liability of foreignness’, Journal of World Business, 47(1): 35-‐44.
Knoerich, J. (2010), ‘Gaining from the global ambitions of emerging economy enterprises: an analysis of the decision to sell a German firm to a Chinese acquirer’, Journal of International Management, 16, 177–91.
Kolstad, I. and Wiig, A. (2012), ‘What determines Chinese outward FDI?’, Journal of World Business, 47(1): 26-‐34.
Li, X., Liu, X. and Parker, D. (2001), ‘Foreign direct investment and productivity spillovers in the Chinese manufacturing sector’, Economic Systems, 25(4): 305–21.
Luo, Y., Xue, Q. and Han, B. (2009), ‘How emerging market governments promote outward FDI: experience from China’, Journal of World Business, 45(1): 68–79.
Ministry of Commerce (MOFCOM) and Ministry of Foreign Affairs (MFA) (2004–2007), Outward Investment Catalogue, Beijing: MOFCOM and MFA.
NBS, MOFCOM, and SAFE (2010), 2009 Statistical Bulletin of China’s Outward Foreign Direct Investment [data of the National Bureau of Statistics of China (NBS), Chinese Ministry of Commerce of China (MOFCOM) and State Administration of Foreign Exchange (SAFE)], September. MOFCOM website: http://hzs.mofcom.gov.cn/accessory/201009/1284339524515.pdf.
NBS, MOFCOM, and SAFE (2011), 2010 Statistical Bulletin of China’s Outward Foreign Direct Investment, English version [data of the National Bureau of Statistics of China (NBS), Chinese Ministry of Commerce of China (MOFCOM)

78
and State Administration of Foreign Exchange (SAFE)], September. MOFCOM website. http://hzs.mofcom.gov.cn/accessory/201109/1316069658609.pdf.
Official Journal of the European Union (2010), European Parliament Resolution of 5 February 2009 on Trade and Economic Relations with China, European Parliament (2008/2171(INI)) (2010/C 67 E/16) 18.3.210.
Organization for Economic Cooperation and Development (OECD) (2008), OECD Benchmark Definition of Foreign Direct Investment, 4th edn, Paris: OECD.
Ramasamy, B., Yeung, M. and Laforet, S. (2012), ‘China’s outward foreign direct investment: location choice and firm ownership’, Journal of World Business, 47(1): 17-‐25.
Sekine, E. (2011), ‘The governance of China Investment Corporation on its way to becoming a sophisticated institutional investor’, Nomura Journal of Capital Markets, 2(3), http://www.nicmr.com/nicmr/english/report/backno/2011win.html.
Sun, S.L., Peng, M.W., Ren, B. and Yan, D. (2012), ‘A comparative ownership advantage framework for cross-‐border M&As: the rise of Chinese and Indian MNEs’, Journal of World Business, 47(1): 4-‐16.
Sutherland, D., El-‐Gohari, A., Buckley, P.J. and Voss, H. (2010), ‘The role of Caribbean tax havens and offshore financial centres in Chinese outward foreign direct investment’, 2nd Copenhagen Conference on ‘Emerging Multinationals’: Outward Investment from Emerging and Developing Economies, Copenhagen Business School, Copenhagen, 25–26 November 2010, gdex.dk/ofdi10/Dylan%20Sutherland%20%20-‐%20et%20al.pdf.
Sutherland, D. and Ning, L. (2011), ‘Exploring “Onward-‐Journey” ODI strategies in China’s private sector businesses’, Journal of Chinese Economic and Business Studies, 9(1): 43–65.
SWF Institute (2011), SAFE Investment Company, http://www.swfinstitute.org/swfs/safe-‐investment-‐company/.
Thomas, S. and Chen, J. (2011), ‘China’s Sovereign Wealth Funds: origins, development, and future roles’, Journal of Contemporary China, 20(70): 467–78.
Thomson Reuters (2011), OneBanker, http://banker.thomsonib.com/.

CHINESE OVERSEAS DIRECT INVESTMENT IN THE EUROPEAN UNION
79
United Nations Conference on Trade and Development (UNCTAD) (2004), The REIO Exception in MFN Treatment Clauses, UNCTAD Series on International Investment Policies for Development, New York and Geneva: United Nations.
United Nations Conference on Trade and Development (UNCTAD) (2009a), UNCTAD Training Manual on Statistics for FDI and the Operations of TNCs: Volume I, FDI Flows and Stocks, New York and Geneva: United Nations.
United Nations Conference on Trade and Development (UNCTAD) (2009b), UNCTAD Training Manual on Statistics for FDI and the Operations of TNCs: Volume II, Statistics on the Operations of Transnational Corporations, New York and Geneva: United Nations.
United Nations Conference on Trade and Development (UNCTAD) (2009c). UNCTAD Training Manual on Statistics for FDI and the Operations of TNCs: Volume III, Collecting and Reporting FDI/TNC Statistics: Institutional Issues, New York and Geneva: United Nations.
United Nations Conference on Trade and Development (UNCTAD) (2011), UNCTADstat (UNCTAD online database), New York and Geneva: United Nations. UNCTADstat. http://unctadstat.unctad.org/.
Voss, H., Buckley, P.J. and Cross, A.R. (2009), ‘An assessment of the effects of institutional change on Chinese outward direct investment activity’, In I. Alon, J. Chang, M. Fetscherin, C. Lattemann and J.R. McIntyre (eds.), China Rules: Globalization and Political Transformation, London: Palgrave Macmillan, pp. 135–65.
World Bank (2004–2011), Doing Business, Washington, DC: World Bank and International Finance Corporation, and Oxford: Oxford University Press (to 2005) and Basingstoke: Palgrave Macmillan (from 2006).
World Bank (2010), Investing Across Borders, Washington, DC: World Bank.

80
Methodology We drew on multiple data sources and analytical methods in order to gain a holistic and deep understanding of Chinese direct investments in the European Union.
Secondary numerical data sources
In order to gain insight into the distribution and impact of Chinese cross-‐border direct investments, we collected data from publicly and non-‐publicly available data sources. The public sources are Eurostat and the Chinese Ministry of Commerce. From Eurostat we collected data on the distribution of Chinese direct investments across the Member States and data on the operations of Chinese affiliates in Europe. The Chinese Ministry of Commerce annually publishes the influential but quite aggregate Statistical Bulletin on Chinese Outward Direct Investment. This aggregate data, although not necessarily entirely reliable or comprehensive, was used to cross-‐check the Eurostat data. Our chosen non-‐publicly available data source is OneBanker from Thomson. From OneBanker we collected information on cross-‐border mergers and acquisitions.
All monetary values were converted from the currency of reporting into euros based on the annual average foreign exchange rate as published by Eurostat.
Secondary written data sources
The policy dimension in Europe and China on Chinese cross-‐border investments in the EU has been addressed through an analysis of published secondary data sources. This includes European and Chinese laws and regulations and comments and interpretations thereupon, academic articles and trade and business press material on the overseas expansion of Chinese firms.
Primary data sources (interviews/questionnaire)
Primary data was collected by means of telephone interviews and a questionnaire administered during interviews. All respondents were invited to participate in this survey via e-‐mail and follow-‐up e-‐mails.
The interview guide was developed based on the insights gained from an analysis of the secondary data and in accordance with the objectives of this paper. It is reproduced in Annex E. The questionnaire was the template for the interview questions, and was sent out when the respondent was unavailable for a telephone interview but could reply by e-‐mail.

CHINESE OVERSEAS DIRECT INVESTMENT IN THE EUROPEAN UNION
81
The respondents targeted were national and sub-‐national investment promotion agencies (IPAs) and the economic and commercial offices of Chinese embassies. We approached 40 IPAs and 27 Chinese embassies. We identified the IPAs through a web search using search terms such as ‘IPA [country]’ and ‘investment promotion agencies [country]’. Personnel in the economic and commercial offices were identified through the Chinese webpages of the Chinese embassies in every Member State. We received nine usable responses (nine from IPAs but none from Chinese embassies, despite following up with those few that initially replied).

82
Annex A Industry Distribution of EU-‐27 Inward FDI Flows from China to Member States, 2005–09 (annual average, € mn)
Agriculture and
fishing
Mining an
d qu
arrying
Man
ufacturing
Electricity, gas
and water
Construction
Total services
Not allo
cated
Sum
Total veh
icles a
nd other
transport e
quipmen
t
Total m
etal and
mechanical produ
cts
Other m
anufacturin
g
Who
lesale trade
Financial intermed
iatio
n
Other se
rvices
EU-‐27 0.00 -‐1.75 36.50 42.00 32.75 -‐38.25 5.00 -‐3.50 641.00 124 499 18.50 -‐19.75 657.50 EU-‐12 -‐0.75 0.00 73.75 46.25 11.50 16.00 3.75 -‐0.75 47.25 72.00 -‐26.50 1.75 12.50 135.75 EU-‐15 0.75 -‐1.75 -‐37.25 -‐4.25 21.25 -‐54.25 1.25 -‐2.75 593.75 52 525 16.75 -‐32.25 521.75 Austria -‐ -‐ -‐ -‐ -‐ -‐ -‐ -‐ -‐ -‐ -‐ -‐ -‐ -‐
Belgium 0.00 0.00 657.00 0.00 -‐ -‐ 0.00 0.00 -‐378.00 0 -‐ -‐ 1.00 280.00 Bulgaria 0.00 0.00 0.20 0.00 0.00 0.20 0.00 0.00 0.80 0 0 0.80 -‐0.25 0.75 Czech Rep. 0.00 0.00 1.40 -‐1.33 0.25 2.48 0.00 0.00 5.80 8 0 -‐1.70 0.00 7.20 Denmark 0.00 -‐1.40 4.20 0.00 0.40 3.80 0.50 -‐0.50 12.00 5 2 4.60 0.00 14.80 Germany 0.00 0.00 55.20 14.80 12.00 28.40 0.00 1.50 32.60 11 27 -‐5.80 29.40 118.70 Estonia 0.00 0.00 0.20 0.00 0.00 0.20 0.00 0.00 0.20 0 0 0.45 -‐ 0.40 Ireland 0.00 0.00 -‐120.25 0.00 0.00 -‐120.25 0.00 0.00 -‐111.67 0 7 -‐118.17 0.00 -‐231.92 Greece 0.00 0.00 0.00 0.00 0.00 0.00 0.00 0.00 0.00 -‐ 0 -‐ -‐0.25 -‐0.25 Spain -‐ -‐ -‐ -‐ -‐ -‐ -‐ -‐ -‐ -‐ -‐ -‐ -‐ -‐
France 0.00 0.00 25.80 1.40 7.40 17.00 0.00 0.00 56.00 2 9 45.00 -‐1.60 80.20 Italy 0.00 0.20 8.80 0.60 0.25 7.95 0.40 0.60 25.60 1 7 18.05 0.75 36.35 Cyprus 0.00 0.00 0.00 0.00 0.00 0.00 0.00 0.00 1.00 1 0 0.00 0.00 1.00 Latvia 0.00 0.00 0.00 0.00 0.00 0.00 0.00 0.00 0.00 0 0 0.00 0.00 0.00 Lithuania 0.00 0.00 0.00 0.00 0.00 0.00 0.00 0.00 0.00 0 0 0.00 0.00 0.00 Luxembourg 0.00 -‐ -‐ -‐ -‐ -‐ -‐ -‐ 2,053.00 -‐ 533 -‐ -‐4.33 2,048.67 Hungary 0.00 0.00 -‐21.20 -‐5.60 0.00 -‐15.60 0.00 0.00 2.80 -‐1 1 2.15 1.00 -‐17.40 Malta 0.00 0.00 0.00 0.00 0.00 0.00 0.00 0.00 2.00 0 0 2.00 0.00 2.00 Netherlands 0.00 0.00 -‐3.00 0.00 0.00 -‐3.00 2.25 0.00 1.25 6 0 -‐5.33 0.00 0.50 Poland -‐ -‐ -‐ -‐ -‐ -‐ -‐ -‐ -‐ -‐ -‐ -‐ -‐ -‐
Portugal -‐ -‐ -‐ -‐ -‐ -‐ -‐ -‐ -‐ -‐ -‐ -‐ -‐ -‐
Romania 0.20 0.00 2.80 0.00 0.00 2.80 0.00 0.00 2.40 2 0 0.40 0.00 5.40 Slovenia -‐ 0.00 0.00 0.00 -‐ -‐ 0.00 0.00 0.00 -‐ 0 -‐ 0.00 0.00 Slovakia 0.00 0.00 1.75 0.25 0.00 1.50 0.00 0.00 0.00 0 0 0.00 0.00 1.75 Finland 0.00 -‐ -‐9.60 0.00 0.60 -‐10.20 0.00 0.00 0.00 1 0 -‐0.67 0.00 -‐9.60 Sweden 0.00 0.00 0.00 0.00 0.00 0.00 0.00 0.00 0.00 0 0 0.00 -‐20.00 -‐20.00 UK 0.00 0.00 1.00 -‐ 0.00 -‐ 0.00 -‐ 13.75 8 0 6.08 0.00 14.75 Note: a dash (-‐) denotes data are not available Source: Eurostat (2011b).

CHINESE OVERSEAS DIRECT INVESTMENT IN THE EUROPEAN UNION
83
Annex B Industry Distribution of EU-‐27 Inward FDI Stocks from China by Member States, 2003 (€ mn)
Agriculture and
fishing
Mining an
d qu
arrying
Man
ufacturing
Electricity, gas and
water
Construction
Total services
Not allo
cated
Total
Metal and
mechanical
prod
ucts
Vehicles and
other
transport e
quipmen
t
Other m
anufacturin
g
Who
lesale trade
Financial
interm
ediatio
n
Other se
rvices
EU-‐27 -‐ -‐ -‐ -‐ -‐ -‐ -‐ -‐ -‐ -‐ -‐ -‐ -‐ -‐ EU-‐25 -‐ -‐ -‐ -‐ -‐ -‐ -‐ -‐ -‐ -‐ -‐ -‐ -‐ 493 EU-‐15 -‐ -‐ -‐ -‐ -‐ -‐ -‐ -‐ -‐ -‐ -‐ -‐ -‐ 446 Austria -‐ -‐ -‐ -‐ -‐ -‐ -‐ -‐ -‐ -‐ -‐ -‐ -‐ 0 Belgium -‐ -‐ -‐ -‐ -‐ -‐ -‐ -‐ -‐ -‐ -‐ -‐ -‐ -‐ Bulgaria -‐ -‐ -‐ -‐ -‐ -‐ -‐ -‐ -‐ -‐ -‐ -‐ -‐ 1 Czech Rep. 0 0 0 0 0 0 0 0 0 0 0 0 0 0 Denmark -‐ -‐ -‐ -‐ -‐ -‐ -‐ -‐ -‐ -‐ -‐ -‐ -‐ -‐1 Germany -‐ -‐ -‐ -‐ -‐ -‐ -‐ -‐ -‐ 58 -‐ -‐58 -‐ 156 Estonia 0 0 -‐ 0 0 -‐ 0 0 0 0 0 0 -‐ 0 Ireland 0 0 -‐116 0 0 -‐116 0 0 -‐ 0 -‐ -‐ -‐ -‐140 Greece -‐ -‐ -‐ -‐ -‐ -‐ -‐ -‐ -‐ -‐ -‐ -‐ -‐ 1 Spain -‐ -‐ -‐ -‐ -‐ -‐ -‐ -‐ -‐ -‐ -‐ -‐ -‐ France -‐ -‐ 18 1 4 13 3 -‐ 141 28 69 44 -‐ 161 Italy -‐ -‐ -‐ -‐ -‐ -‐ -‐ -‐ -‐ -‐ -‐ -‐ -‐ 34 Cyprus -‐ -‐ -‐ -‐ -‐ -‐ -‐ -‐ -‐ -‐ -‐ -‐ -‐ 1 Latvia 0 0 0 0 0 0 0 0 0 0 0 0 0 0 Lithuania -‐ -‐ -‐ -‐ -‐ -‐ -‐ -‐ -‐ -‐ -‐ -‐ -‐ 3 Luxembourg 0 0 0 0 0 0 0 0 -‐ 0 -‐ -‐ 0 -‐ Hungary -‐ -‐ -‐ -‐ -‐ -‐ -‐ -‐ -‐ -‐ -‐ -‐ -‐ 12 Malta -‐ -‐ -‐ -‐ -‐ -‐ -‐ -‐ -‐ -‐ -‐ -‐ -‐ -‐ Netherlands -‐ 0 14 -‐ 0 14 0 0 40 -‐ 10 30 -‐ 56 Poland -‐ -‐ -‐ -‐ -‐ -‐ -‐ -‐ -‐ -‐ -‐ -‐ -‐ 23 Portugal c c c c c c c c c c c c c 13 Romania -‐ -‐ -‐ -‐ -‐ -‐ -‐ -‐ -‐ -‐ -‐ -‐ -‐ 199 Slovenia 0 0 0 0 0 0 0 0 0 0 0 0 -‐ 0 Slovakia 0 0 0 0 0 0 0 0 0 0 0 0 0 0 Finland 0 c -‐7 0 c -‐7 0 0 13 -‐ 0 13 -‐ 6 Sweden c c c c c c c c c c c c c -‐36 UK 0 0 3 0 0 3 0 0 142 11 -‐ 131 0 145 Note: a dash (-‐) denotes data are not available; (c) denotes that data are confidential. Source: Eurostat (2011b).

84
Annex C Industry Distribution of EU-‐27 Inward FDI Stocks from China by Member States, 2006 (€ mn)
Agriculture and
fishing
Mining an
d qu
arrying
Man
ufacturing
Electricity, gas and
water
Construction
Total services
Not allo
cated
Total
Metal and
mechanical
prod
ucts
Vehicles and
othe
r transpo
rt
equipm
ent
Other m
anufacturin
g
Who
lesale trade
Financial
interm
ediatio
n
Other se
rvices
EU-‐27 1 6 419 39 19 361 1 13 3,114 293 2,451 370 9 3,576 EU-‐25 1 6 369 39 18 312 1 13 3,108 289 2,451 368 9 3,519 EU-‐15 0 6 310 32 9 269 1 13 3,047 286 2,417 344 9 3,397 Austria -‐ -‐ -‐ -‐ -‐ -‐ -‐ -‐ -‐ -‐ -‐ -‐ -‐ -‐ Belgium -‐ -‐ -‐ -‐ -‐ -‐ -‐ -‐ -‐ -‐ -‐ -‐ -‐ -‐ Bulgaria 0 0 1 0 0 1 0 0 3 0 0 3 0 4 Czech Rep. 0 0 25 -‐4 -‐ 29 0 0 0 -‐ -‐ -‐ 0 25 Denmark -‐ 9 59 8 1 50 c 5 236 79 11 146 -‐ 310 Germany 0 0 8 5 -‐ 3 0 0 321 98 111 112 0 328 Estonia 0 c -‐3 0 0 -‐3 0 -‐ 1 -‐ 0 1 -‐ -‐2 Ireland 0 0 168 0 0 168 0 0 -‐3 -‐ -‐ -‐ 0 166 Greece 0 0 3 0 0 3 0 0 0 0 0 0 -‐ 3 Spain -‐ c c c c c c c c c c c -‐ c France 0 -‐ 37 6 5 26 -‐ 0 127 10 74 43 0 165 Italy 0 0 17 13 0 4 0 0 39 1 31 7 1 57 Cyprus 0 0 0 0 0 0 0 0 2 1 0 1 0 2 Latvia 0 0 0 0 0 0 0 0 0 0 0 0 0 0 Lithuania 0 0 0 0 0 0 0 0 2 0 0 2 0 3 Luxembourg 0 0 0 0 0 0 0 0 -‐ 0 -‐ -‐ -‐ -‐ Hungary 0 0 3 0 0 3 0 0 15 -‐3 15 3 0 18 Malta 0 c 1 0 0 1 0 0 -‐ 0 0 -‐ -‐ 3 Netherlands -‐ -‐ -‐ -‐ -‐ -‐ -‐ -‐ -‐ -‐ -‐ -‐ -‐ 35 Poland -‐ -‐ -‐ -‐ -‐ -‐ -‐ -‐ -‐ -‐ -‐ -‐ -‐ 73 Portugal c c c c c c c c c c c c c c Romania 1 0 50 0 1 49 0 0 3 3 0 0 0 54 Slovenia 0 0 0 0 0 0 0 0 0 0 0 0 0 0 Slovakia 0 0 0 0 0 0 0 0 0 0 0 0 0 0 Finland 0 c -‐7 1 -‐ -‐8 0 0 15 -‐ 0 15 -‐ 5 Sweden 0 c 1 0 0 1 0 0 c c c c -‐ 37 UK 0 0 -‐ 0 -‐ -‐ 0 -‐ 141 49 -‐ 92 -‐1 147 Note: a dash (-‐) denotes data are not available; (c) denotes that data are confidential. Source: Eurostat (2011b).

CHINESE OVERSEAS DIRECT INVESTMENT IN THE EUROPEAN UNION
85
Annex D Industry Distribution of EU-‐27 Inward FDI Stocks from China by Member States, 2009 (€ mn)
Agriculture and
fishing
Mining an
d qu
arrying
Man
ufacturing
Electricity, gas and
water
Construction
Total services
Not allo
cated
Total
Metal and
hanical
prod
ucts
Vehicles and
other
transport e
quipmen
t
Other m
anufacturin
g
Who
lesale trade
Financial intermed
iatio
n
Other se
rvices
EU-‐27 -‐ -‐ -‐ -‐ -‐ -‐ -‐ -‐ -‐ -‐ -‐ -‐ -‐ 5,727 EU-‐25 -‐ -‐ -‐ -‐ -‐ -‐ -‐ -‐ -‐ -‐ -‐ -‐ -‐ 5,686 EU-‐15 -‐ -‐ -‐ -‐ -‐ -‐ -‐ -‐ -‐ -‐ -‐ -‐ -‐ 5,225 Austria -‐ -‐ -‐ -‐ -‐ -‐ -‐ -‐ -‐ -‐ -‐ -‐ -‐ 136 Belgium -‐ -‐ -‐ -‐ -‐ -‐ -‐ -‐ -‐ -‐ -‐ -‐ -‐ -‐543 Bulgaria -‐ -‐ -‐ -‐ -‐ -‐ -‐ -‐ -‐ -‐ -‐ -‐ -‐ 7 Czech Rep. -‐ -‐ -‐ -‐ -‐ -‐ -‐ -‐ -‐ -‐ -‐ -‐ -‐ 52 Denmark -‐ 6 108 11 1 96 6 c 282 72 8 202 -‐ 403 Germany -‐ -‐ -‐ -‐ -‐ -‐ -‐ -‐ -‐ -‐ -‐ -‐ -‐ 641 Estonia -‐ -‐ -‐ -‐ -‐ -‐ -‐ -‐ -‐ -‐ -‐ -‐ -‐ 11 Ireland 0 0 -‐70 0 0 -‐70 0 0 -‐41 -‐ -‐10 -‐31 0 -‐111 Greece -‐ -‐ -‐ -‐ -‐ -‐ -‐ -‐ -‐ -‐ -‐ -‐ -‐ 6 Spain -‐ -‐ -‐ -‐ -‐ -‐ -‐ -‐ -‐ -‐ -‐ -‐ -‐ -‐ France 0 0 135 26 7 102 0 0 226 24 107 95 14 375 Italy -‐ -‐ -‐ -‐ -‐ -‐ -‐ -‐ -‐ -‐ -‐ -‐ -‐ 61 Cyprus 0 0 0 0 0 0 0 0 6 4 1 1 0 6 Latvia 0 0 0 0 0 0 0 0 0 0 0 0 0 0 Lithuania 0 0 0 0 0 0 0 0 2 0 0 2 0 2 Luxembourg -‐ -‐ -‐ -‐ -‐ -‐ -‐ -‐ -‐ -‐ -‐ -‐ -‐ -‐ Hungary -‐ -‐ -‐ -‐ -‐ -‐ -‐ -‐ -‐ -‐ -‐ -‐ -‐ 9 Malta 0 c c c c c 0 0 -‐ 0 0 -‐ -‐ 3 Netherlands 0 0 13 1 0 12 0 0 51 0 1 50 0 64 Poland -‐ -‐ -‐ -‐ -‐ -‐ -‐ -‐ -‐ -‐ -‐ -‐ -‐ 131 Portugal c c c c c c c c c c c c c c Romania 1 0 37 0 1 36 0 0 -‐4 13 0 -‐17 0 34 Slovenia 0 0 0 0 0 0 0 0 0 0 0 0 0 0 Slovakia -‐ -‐ -‐ -‐ -‐ -‐ -‐ -‐ -‐ -‐ -‐ -‐ -‐ 22 Finland 0 -‐ -‐12 2 -‐ -‐14 c c 7 -‐ 0 7 0 -‐5 Sweden -‐ -‐ -‐ -‐ -‐ -‐ -‐ -‐ -‐ -‐ -‐ -‐ -‐ 110 UK -‐ -‐ -‐ -‐ -‐ -‐ -‐ -‐ -‐ -‐ -‐ -‐ -‐ 692 Note: a dash (-‐) denotes data are not available; ‘c’ denotes that data are confidential. Source: Eurostat (2011b).

86
Annex E Interview Guide Interview questions
Q1 Do you have any Chinese investments in [your country]? How many investors and how much investment? Is there a publicly available data source on this?
Q2 What are the motives for investment?
Q3 Would you like to see more Chinese investments? Yes -‐ What kind of benefits does Chinese investment bring, and who gets these benefits?
Q4 How does your organisation help to attract Chinese investment?
Q5 What other organisations are there in [your country] trying to promote Chinese investment in the EU? Yes -‐ Do these other organisations do anything different to attract Chinese investment compared with what they do to attract non-‐EU investors? What are they doing?
Q6 Of the current Chinese investors in [your country], what proportion has invested because of promotional deals?
Q7 Which European country makes the most effort to attract Chinese investments in your opinion? What is it doing?
Q8 Which European country does best in attracting Chinese investments in your opinion? [If different from the answer to Q6] Why is it not the same country as in your previous answer?
Q9 What is the single greatest challenge that Chinese investors face before coming to Europe?
Q10 What are you doing to help Chinese investors overcome this challenge? What is the information that is mainly requested by Chinese firms?
Q11 Are there any barriers specific to Chinese investors in your country or across the EU? Do the Europeans share this perception?
Q12 Is there anything [your country] could or should do to attract more Chinese investment?
Q13 What is the role of the European Union (i.e. Commission etc.) in attracting Chinese investments?

CHINESE OVERSEAS DIRECT INVESTMENT IN THE EUROPEAN UNION
87
Q14 Is there anything the European Union (i.e. Commission etc.) could or should do to attract more Chinese investment?
Q15 Has the Lisbon Treaty had any consequences for your organisation? Do you expect any consequences of this Treaty in the future? In which areas have there already been, and in which would you expect, such consequences?
Q16 What are the future prospects of Chinese investments in Europe?
Q17 Is there any information on Chinese investments in [your country] published by your organisation that you can email me?
Q18 Is there anything else that you think is important relating to Chinese direct investments in the European Union and which we should have raised with you? If yes, please tell us what it is.

The contents of this publication are the sole responsibility of the author(s) and can in no way be taken to reflect the views of ECRAN or the European Union.
Consortium partners: