chinese economy: confucianism to neoconfucianism
TRANSCRIPT

Chinese Economy: Confucianism to Neoconfucianism
Das Swajan (100763)
Valeriu Arnaut (100740)
MSc. in International Business
Poznan University of Economics

Leadership Presentation: Contents
Ghost Town
Economic Sectors
GDP Comparison
GDP Determinants
Current Account Balance
Trade Balance
Imports and Exports
Population and Human Capital
Becoming a Leader

Chinese Ghost Town
65 Millions Vacant ApartmentsSource: businessinsider.com

Chinese GDP Composition by Sector
10%
46%
44%
Agriculture
Industry
Service
Source: CIA World Factbook - February 21, 2013

Chinese GDP V/s Major Economies (1)
China: GDP in Billion USD
2010 2011 2012 2013 2014 2015 2016 2017
Nominal 5,930 7,298 8,250 9,039 9,926 10,928 12,021 13,212
PPP 10,128 11,300 12,383 13,581 14,948 16,492 18,234 20,198
0
5,000
10,000
15,000
20,000
25,000
GD
P in
Bil
lio
n U
SD
Source: International Monetary Fund, World Economic Outlook Database, October 2012

Chinese GDP V/s Major Economies (2)
China: GDP Per Capita in USD
2010 2011 2012 2013 2014 2015 2016 2017
Nominal 4,423 5,417 6,094 6,644 7,262 7,957 8,710 9,528
PPP 7,553 8,387 9,146 9,983 10,936 12,008 13,213 14,566
0
2,000
4,000
6,000
8,000
10,000
12,000
14,000
16,000
GD
P P
er
Cap
ita in
US
D
Source: International Monetary Fund, World Economic Outlook Database, October 2012

Chinese GDP V/s Major Economies (3)China: GDP Growth Rate and Forecast

GDP Determinants
Y = C + I + E + G
Where: # Y = GDP
# C = Consumer Spending
# I = Investment made by industry
# E = Excess of Exports over Imports
# G = Government Spending
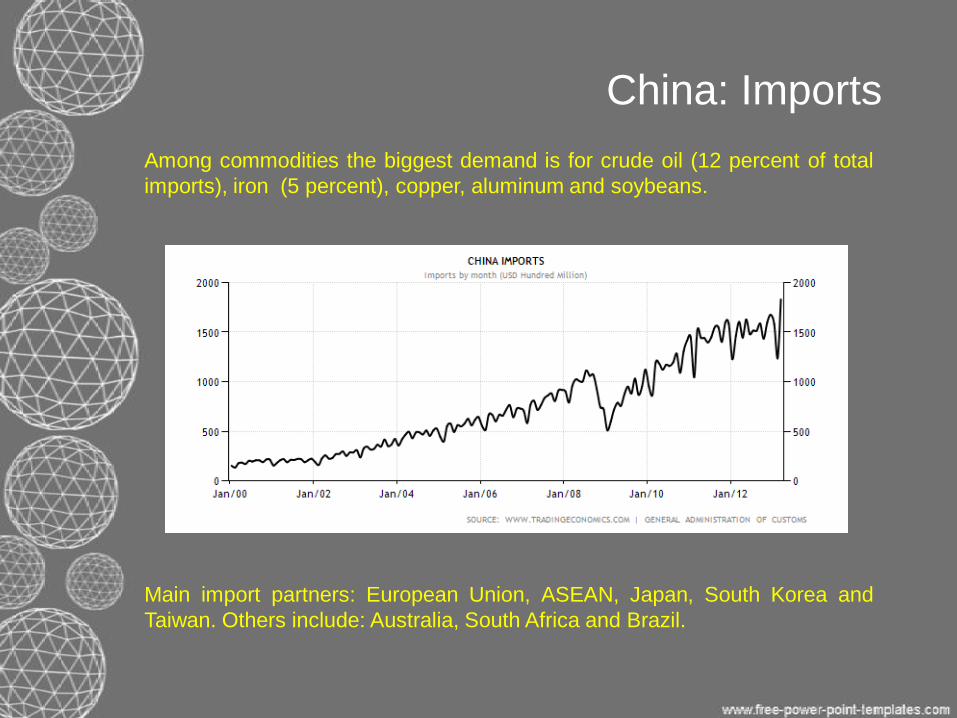
China: Imports
Among commodities the biggest demand is for crude oil (12 percent of total
imports), iron (5 percent), copper, aluminum and soybeans.
Main import partners: European Union, ASEAN, Japan, South Korea and
Taiwan. Others include: Australia, South Africa and Brazil.

China: Exports
Exports of goods and services constitute 30% of GDP. China major exports are:
electromechanical products (57 percent of total exports) and labor-intensive products
like clothing, textiles, footwear, furniture, plastic products, bags and toys (20 percent). In
recent years, the exports of high tech products have been also growing and in 2012
accounted for 29 percent of total exports.
Main export partners are the United States (17 percent), European Union (16
percent), ASEAN (10 percent), Japan (7 percent) and South Korea.

China: Current Account Balance
Current Account is the sum of the balance of trade (exports minus imports of
goods and services), net factor income (such as interest and dividends) and
net transfer payments (such as foreign aid).

China: Trade Balance
The balance of trade is the difference between the monetary value of
exports and imports in an economy over a certain period of time. A positive
balance of trade is known as a trade surplus and occurs when value of
exports is higher than that of imports; a negative balance of trade is known
as a trade deficit or a trade gap.

Population and Human Capital (1)
China: Population and Unemployment Rate

Population and Human Capital (2)
China: Number of Employed and Unemployed Persons
NB: Labour Force Mentioned in Thousands

Population and Human Capital (3)
China: Average Wage Comparison
Exchange Rate:1.00 USD=6.18470 CNYSource: XE.COM on 16.04.2013

Becoming a Leader :
Change in Economic Policies at 1970’s
China: World’s Largest Exporter, 2010Source: CIA

Our greatest glory is not in never falling, but in
getting up every time we do.
- Confucius