china - peoples republic of cotton and products annual ... gain publications/cotton...grain...
TRANSCRIPT

THIS REPORT CONTAINS ASSESSMENTS OF COMMODITY AND TRADE ISSUES MADE BY
USDA STAFF AND NOT NECESSARILY STATEMENTS OF OFFICIAL U.S. GOVERNMENT
POLICY
Required Report - public distribution
Date: 5/1/2010
GAIN Report Number: CH10019
China - Peoples Republic of
Cotton and Products Annual
Annual Report
Approved By:
Michael Woolsey
Prepared By:
Chanda Beckman and Wu Xinping
Report Highlights: China's cotton imports in MY10/11 are forecast at 3.2 million metric tons (MMT), up 28 percent over the estimated 2.5
MMT the previous year. Forecast higher imports are mainly driven by expected consumption growth in response to
domestic GDP growth and the recovery of the global economy. China's cotton use in MY10/11 is forecast at 10.9 MMT, up
seven percent from the previous year. The slightly increased forecast MY10/11 domestic production of 7.4 MMT and
reduced carry-over stocks will widen the supply and demand gap in MY10/11. Low farm returns for cotton compared to
other products will continue to limit production growth, with total MY10/11 output forecast to rise three percent, but still
down eight percent from MY08/09 levels.

Executive Summary
China’s MY10/11 cotton imports are forecast at 3.2 MMT, up 28 percent over the estimated 2.5 MMT for MY09/10. The
high import forecast is based on weak gains in domestic production in conjunction with an anticipated increase of cotton
use in response to the expected recovery of global demand for textile products from 2010. Additionally, the impact of the
economic crisis on China’s domestic demand for textile products in MY09/10 remains limited based on China’s 8.7
percent GDP growth in 2009 and likely 10 percent in 2010. The lower volume of 1.5 MMT cotton imports in MY08/09
was mainly due to a sizable reduction in cotton use coupled with government regulation of imports through the tariff rate
quota (TRQ) system and periodic release of the state cotton reserve. China’s textile and garment exports in 2010 are
expected to increase dramatically as a result of stronger domestic demand following the recovery of the global
economy. Cotton imports are regulated by the existing TRQ system and a sliding tariff rate scheme. In 2009, the
Government of China (GOC) implemented the “Registration System for Overseas Cotton Suppliers” and “Quality and
Credit Assessment.” (See details in GAIN CH8075 and GAIN CH9004). USDA conducted in-depth consultations with
the GOC and will continue to work to ensure trade continues smoothly. To date, there have been no reports of trade
interruptions related to the registration regime. Given the vast production capacity of China’s textile industry, domestic
cotton consumption is expected to rise along with growth in the world economy. FAS/Beijing forecasts China’s cotton
consumption for MY10/11 at 10.9 MMT, up seven percent from an estimated 10.2 MMT for MY09/10.
China’s domestic cotton production in MY10/11 is forecast at 7.4 MMT based on a moderate recovery of planted area to
5.7 MHa, compared to the estimated 5.55 MHa in the previous year. Despite government efforts to boost cotton
production, growth in the domestic planted area for cotton has been limited by government support policies to increase
grain production and ensure food security, and the relative per-unit returns from cotton versus other competing crops. The
cotton seed subsidy continued to cover all cotton area in MY10/11 and is expected to remain in place in the foreseeable
future. Technology advancements in recent years have boosted cotton yields to nearly 1,300 Kg/Ha. Yields are expected
to remain generally stable over the next two years.
Lack of reliable data on domestic cotton production, consumption, and stocks continues to confuse the industry, causing
uncertainty and impacting global cotton trade.
Production
China’s MY10/11 cotton production is forecast at 7.4
MMT, up from last year’s revised estimate of 7.2
MMT. This increase is based on a moderate
expansion in planted area from 5.9 to 5.7 MHa with
yields remaining similar to the previous year. China’s
cotton planted area slid in MY09/10 mainly due to
low returns when compared with other crops. Post
had originally estimated MY09/10 production at 7.4
MMT (GAIN CH9035). However, China’s National
Statistics Bureau’s (NSB) “2009 National Economy

and Development Communiqué” quoted MY09/10
cotton production at 6.4 MMT, based on a planted
area of 4.95 MHa. An early report by China’s
Ministry of Agriculture (MOA) estimated MY09/10
production ranging from 6.4 to 6.7 MMT. Based on
recent market developments and trade analysis,
FAS/Beijing adjusted the MY09/10 domestic
production to 7.2 MMT, still significantly higher than
the NSB reported 6.4 MMT, but more in line with
industry insiders’ expectations and accounting for
historical under-reporting of official statistics. As
stated in previous reports, under-estimated planted
area in Xinjiang Province appears to be the main
factor contributing to the differences in production
figures. Most Chinese industry insiders believe
MY08/09 Xinjiang cotton production was actually
500,000 MT higher than the three MMT released by
NSB. According to China’s industry sources (and
mainly based on Xinjiang Railway Records), by the
end of March, 1.7 MMT of MY09/10 cotton had been
shipped out of Xinjiang, with an estimated 1.4 MMT
remaining. Combined information and analysis
supports MY09/10 Xinjiang cotton production far
exceeding three MMT, if an estimated 400,000 MT
consumed locally is included. Therefore, the NSB
estimate of 2.5 MMT in MY09/10 is clearly under-
estimated. Although most other provinces reported a
decrease in production, Xinjiang accounts for the
largest share of total cotton production, so
FAS/Beijing estimates total domestic production of
7.2 MMT in MY09/10. (See Table 12 for planted area
and production by province). The marketing of the
MY09/10 crop was reportedly faster than the previous
year and the farm-gate price continued to rise mainly
due to recovery of demand, coupled with a decrease in
production and limited imports. In general, farmer
returns from cotton in MY09/10 increased compared
to the previous year, and the GOC policies continue to
favor maintaining stable cotton planted
area. However, planting intention surveys conducted
by various industry agencies agree that MY10/11

planted area is not likely to increase by much. After
considering all available sources, FAS/Beijing favors
information supporting moderate growth in cotton
production to 7.4 MMT based on a three-percent
increase of planted area in MY10/11.
Planted Area
MY10/11 domestic cotton planted area is forecast at 5.7
MHa, up three percent from the previous year’s
estimated 5.55 MHa, mainly in response to increased
returns from cotton in MY09/10. Although the
MY10/11 cotton planting intention forecasts vary among
major Chinese industry agencies, most believe a stable
to moderate area recovery is likely, and farmers might
plant more cotton in response to the current bullish
cotton price due to the widely expected tight supply.
China Cotton Research Institute Survey
In February 2010, China Cotton Research Institute (CRI)
forecasted planting intentions for MY10/11 would
decline by five percent from the previous year. The CRI
survey also indicated that 48 percent of the interviewed
farms would reduce cotton area in the three major
cotton-producing regions. Specifically, the planting
intention is expected to slide by nine and seven percent,
respectively in the Northwest and the Yellow River
regions, but increase seven percent in the Yangtze River
region. CRI believes that despite the seed cotton price
surge (up 34 percent compared to the previous year), the
per-unit profit farmers received from cotton in MY09/10
did not increase significantly from the MY07/08 level
(see the following table). CRI’s survey showed that the
MY09/10 profit from cotton averaged $1,200 per
hectare, significantly higher than the mere $5 per hectare
in the previous year, but a slight recovery from the
$1,087 per hectare in MY07/08. This is particularly true
in the Yellow River region where farmers have more
options and the government’s grain subsidy drove the
comparative advantage of grain crops even higher
compared to cotton. Although a good profit margin
typically results in expanded planted area the following
year (as we saw in MY08/09), CRI believes the decline

in planting intention for MY10/11 is mainly attributed to
the “unpredictable cotton market/price” for farmers, and
fewer returns when directly compared with the profit
margin for grain production. In addition, the intensive
labor input and fewer mechanized farms means cotton
planting is one of the “hardest” rural jobs. Moreover,
the GOC’s combined subsidies for grain production,
estimated at $198 per hectare, are far above the $33 per
hectare for cotton. In Xinjiang, the local government’s
diversification plan for agriculture resulted in more fruit
trees and cash crops including tomatoes, peppers and
grapes, and forage/grain for animal husbandry.
CRI Cotton Planting Profits from 2007-2009 ($1= RMB6.8)
Year Output Value Total Cost Profit
RMB/Ha %Change RMB/Ha %Change RMB/Ha %Change
2007 22,477 +12 15,076 -3 7,401 +12
2008 17,263 -23 17,235 +14 28 -100
2009 23,757 +37 15,579 -10 8,178 +543
National Cotton Market Monitoring Network Survey
Another survey conducted in March by the National
Cotton Market Monitoring Network (NCMMN) showed
the cotton planting intention in MY10/11 stood at 5.2
MHa, only one percent higher than the previous
year. More specifically, the planting intention in the
Yangtze River region and the Northwest region
increased by six and two percent, respectively, while
intentions in the Yellow River region fell by more than
four percent. In the Yellow River region, total planting
intention was 2.1 MHa (31 million Mu) with Henan and
Hebei Provinces down nine and eight percent,
respectively. In the Yangtze River region, total planting
intention is estimated at 1.4 MHa (21.7 million Mu), up
more than six percent on average, with the highest
growth in Hunan, Jiangsu and Hubei Provinces. The
high seed cotton price in MY09/10 (up 47 percent over
the previous year) boosted planting intention in the
Yangtze River and the Northwest regions. The
relatively high yields in Hunan (up 17 percent) and
Hubei (up 13 percent) Provinces and increased returns
boosted confidence in cotton planting in these two

provinces. The planting intention for the Northwest
region grew slightly more than two percent. It is worth
noting that in Xinjiang the Production Construction
Corporation (PCC) planting intention slid by more than
eight percent mainly due to the “PCC Restructuring Plan
of Crop Mix” and deterioration of irrigation as a result
of reduced rainfall. The reduced planting intention in
the Yellow River region, however, is mainly attributable
to low yields, coupled with a lower comparative profit
received by farmers in MY09/10. NCMMN survey
results reflected higher profits gained from competing
crops (corn and wheat), and cited that in Hengshui City,
Hebei Province, the profit from grain crops was $2,867
per hectare, higher than the $2,140 per hectare for cotton
in MY09/10.
An earlier NCMMN survey in November 2009,
however, indicated MY10/11 cotton planting intention
would increase by three percent from the previous
year. Some information collected in the survey did not
support a strong recovery of cotton planting intention
though the situation varies in the three cotton-producing
regions. For instance, the per-unit net returns from
cotton were $1,380 per hectare (RMB625 per Mu)
compared to the $1,425 -3,735 per hectare (RMB650 -
1700 per Mu) from vegetables in North Jiangsu Province
(source: farmer surveys in Dafeng County); The net
income from grain (corn and wheat) is $3,555 per

hectare (RMB1,620 per Mu) relative to the $2,220 per
hectare (RMB1,010 per Mu) from cotton in Hebei
Province (source: farmer surveys in Cunzhou City). The
surveyed farmers also complained that the returns from
cotton are unpredictable as cotton is affected by both
domestic and international markets.
China Cotton Association Survey
In mid-March 2010, the China Cotton Association
(CCA) released the results of a MY10/11 cotton planting
intention survey conducted in early March. It showed an
unchanged planting intention from the previous year
based on results from 2,057 fixed cotton farmers in 13
cotton-producing provinces. The general planting
intention remained unchanged from the previous year,
with intention down eight percent in the Yellow River
region, up nine percent in the Yangtze River region, and
stable in the Northwest region (but up three percent in
Xinjiang). In the Yellow River region, prolonged rainy
weather resulted in low cotton yield and poor quality in
MY09/10, which reduced profits. While in the Yangtze
River region, favorable weather conditions in MY09/10
resulted in recovery of cotton yield and profit.
In the largest producing province, Xinjiang, the local government
pushed farmers to diversify crops to minimize price risk. The
Xinjiang Agriculture Bureau plans to maintain grain and cotton
areas similar to those in MY09/10, with 1.9 MHa (28.5 million
Mu) of grain crops and 1.33 MHa (20 million Mu) of cotton,
respectively. The provincial bureau also forecast cotton
production will be similar to the 2.5 MMT in MY09/10.
In the National Agriculture Conference held at the end
of 2009, MOA instructed all relevant provincial agencies
to promote recovery of cotton planting area to reach
5,667,000 Ha (85 million Mu) in MY10/11, up 13
percent from the previous year. Currently, MY10/11
cotton planting is in process. However, lower
temperatures and snow in Xinjiang delayed cotton
sowing by about ten days, while low temperatures and
excessive moisture in the Yangtze River region delayed
cotton seed sprouting. Some farmers have yet to make

final planting decisions. Given the current state of play,
FAS/Beijing favors a moderate recovery of cotton area
in MY10/11, up three percent over the previous year.
Yield
China’s cotton yield for MY10/11 is forecast to be
1,298Kg per hectare, almost unchanged from MY09/10,
and similar to the three-year average of 1,294Kg per
hectare from MY06/07 to MY08/09 (NSB data). Steady
yields are mainly attributable to technical advancements in
the Xinjiang production region and in the dissemination of
biotechnology (Bt) cotton varieties in the Yangtze and
Yellow River regions.
The Bt cotton share of China’s cotton planted area is
expected to remain stable or increase in MY10/11,
mainly supported by a nationwide cotton seed
subsidy. Some experts believe that Bt variety coverage
reached 100 percent in Henan, Hebei, Shandong, and
Anhui Provinces. Additionally, MOA plans to increase
the “3-line Cross-bred Bt Cotton Varieties” developed
by Chinese scientists. These varieties are reported to
increase yield by 25 percent compared to the
conventional varieties.
In Xinjiang, Bt varieties are reportedly not planted due
to fewer outbreaks of diseases/pests. The development
of conventional varieties with specific traits such as
dwarf plant size and early maturity are expected to
continue boosting yields. Expanded application of
advanced techniques including high density sowing,
plastic sheet covering, and drip irrigation technology
that will contribute to additional yield gains. These
advancements are particularly significant for Xinjiang
PCC farms. Industry sources reported that drip irrigated
in the planted cotton area accounted for 80 percent of the
PCC planted area in 2008.
For MY 10/11, in general the sowing of cotton is
expected to be delayed by one week to ten days in
Northern Xinjiang due to low temperatures and
remaining snow on the ground and low temperatures

coupled with excessive moisture in the Yangtze River
region. The sowing in the Yellow River region seems to
be moving along at a normal pace and soil moisture is
favorable for cotton planting.
Consumption
China’s cotton consumption in MY10/11 is forecast at
10.9 MMT, up seven percent from an estimated 10.2
MMT for MY09/10. This forecast growth is mainly due
to expected recovery of world demand, together with
strong domestic demand for textile and apparel
products. China’s cotton consumption dropped to 9.5
MMT in MY08/09 from the record 11.2 MMT in
MY07/08 as a result of the slowdown of global
economy.
China’s Textile Producing Capacity Remains Strong
After considering a number of varying industry statistics,
FAS/Beijing estimates China’s textile and apparel
exports were valued $171 billion in 2009, down 10
percent from the previous year. Exports have rebounded
since January, with the total export value in the first
quarter of 2010 at $39.2 billion, an increase of 15
percent over the same period in 2009. Meanwhile, the
continued high cotton price in the domestic market also
reflects strong demand for cotton. According to NSB,
China’s GDP growth rebounded to 9.1 percent in the
third quarter and reached 10.7 percent in the fourth
quarter of 2009. The strong recovery of exports,
together with expected improved domestic demand
(based on an anticipated 10 percent GDP growth in
2010), will continue to foster a recovery in cotton
consumption in the remaining months of
2010. Additionally, China’s vast textile producing
capacity will continue to facilitate cotton consumption
when world demand for textile and apparel products
recovers. Over the long term, cotton consumption is
expected to increase, mainly boosted by China’s
domestic textile/apparel consumption.

Source: CNCotton.com
Despite lower textile sales in 2009, investment in
China’s textile sector remained strong. According to
industry sources, fixed asset investment in the textile
industry stood at $45.6 billion in 2009, up 14 percent
from the previous year. The total investment of $40
billion (RMB 272.4 billion) in 2008 was seven percent
higher than the previous year. This growth rate,
however, is significantly lower than the 26 and 27
percent increases, respectively, in 2007 and
2006. Industry insiders believe the priority for many
textile enterprises in 2009 was to survive in a stagnant
market by utilizing existing capacity. The share of new
investment for the central region continued to grow,
while the eastern and western regions declined. This
indicates that the industry continues to move processing
to the labor abundant central provinces, and will
continue this trend in 2010 in search of lower labor costs
and a favorable environmental and financial climate for
investment. Industry sources estimate by the end of
2009 the total spindle count reached 110 million. The
average profit margin for the cotton textile sector stood
at four percent for the first eleven months of 2009, up
from the 3.5 percent in the previous year. It is also
estimated that more than 94 percent of profits were
generated by about 4,200 enterprises (accounting for 36
percent of total 11,700 cotton textile enterprises). This

indicated that the industry profit margins remained very
thin for most enterprises in 2009.
In 2010, the textile industry will remain one of China’s
“pillar industries.” According to China’s 11th
Five Year
(2006-2010) Plan for Development of the Textile
Industry, total fiber production is forecast to reach 36
MMT by 2010, with an annual growth rate of six
percent. Moreover, per capita fiber consumption is
expected to rise from 16.8 to 18 kg, an annual growth
rate of seven percent. Employees involved in this sector
are expected to reach 23 million, up from the current 20
million.
Domestic Consumption to Increase
Sales of textiles and apparel are increasingly driven by
domestic consumption resulting from higher disposable
incomes and population growth. The China Textile
Industry Association (CTIA) estimates the domestic
share of the sector’s total sales output accounted for 80
percent in 2009, up from 77 percent in 2008. According
to NSB, the per capita expenditure on clothing by urban
residents remained 5.5 times that of rural residents in
2008. Nevertheless, as rural incomes rise, better
clothing will be high on the list of new purchases for
China’s 800-plus million rural residents. Net growth of
the urban population stood at 12 million in 2008 as
urbanization expanded. The GOC is expected to release
its 2010 census data in November 2010, but the trend
towards urbanization is expected to continue into the
future.
China’s textile and apparel product export growth is
expected to remain strong in the remaining months of
2010. CTIA emphasized it hopes to maintain the
domestic market share at 80 percent in 2010, though
exports are likely to grow in response to the demand
recovery by major developed economies. However, the
increase of labor costs and wide expectation of RMB
appreciation cast shadows on the rejuvenation of the
cotton textile industry and the expansion of cotton use in
MY10/11.

Yarn production is forecast at 25 MMT in 2010, up five
percent over 2009 (See chart 3: Source: 2003-2009 by
NSB and 2009 by CTIA estimate). CTIA estimated that
yarn production reached 23.9 MMT in 2009, up 11
percent over the NSB production data for the previous
year. Yarn production for the first quarter of 2010
exceeded 5.6 MMT, up 20 percent over the previous
year. Out of the total, cotton yarn production reached
4.4 MMT, up 19 percent over the previous year;
synthetic fiber yarn production increased by 30 percent
to reach 777,000 MT. It is likely this growing trend will
continue in the remaining months of 2010 and beyond.
Misreporting of Yarn Categories and Volume – A Continuing Problem
Converting yarn production into cotton use remains a
challenge due to the lack of reliable data. According to
CTIA, total yarn production for 2009 was reported at
23.9 MMT, which FAS/Beijing believes is
exaggerated. Out of the total yarn production, a total of
18.7 MMT was reported as pure cotton yarn, 2.3 MMT
blended yarn, and 3 MMT synthetic yarn. These figures
are obviously contradictory when compared to China’s
average cotton use, which has ranged from 10 - 11
MMT annually in recent years. CTIA also
acknowledged this contradiction and believes
misreporting of yarn category and volume by mills
(estimated number of cotton textile enterprises exceeds
11,700 in 2009) are the causes.
Adding to the uncertainty, mills constantly change the
cotton ratio in yarn production depending on market

conditions and price ratios between cotton and synthetic
fibers, making accurate reporting difficult. For example,
a single percentage change in the cotton share can
drastically alter cotton consumption by about 200,000
MT. Post believes that a number of factors led to the
current dilemma, including over-reporting of total yarn
and pure cotton yarn production, the under-reporting of
synthetic fiber ratio and cotton consumption, or a
combination of all three. Based on CTIA data, total
chemical fiber production in 2009 was 27.3 MMT, up
more than 14 percent over the previous
year. Recognizing the negative impact unreliable data
has on the development of the sector, CTIA initiated and
NDRC approved an overhaul of China’s yarn production
reporting system. Hopefully this program will result in
more accurate yarn data thus more reliable cotton use
estimate in the near future.
Along with price ratio changes between cotton and
synthetic fibers and dependant on the ratios the market
demands at the time of production, mills can be expected
to readjust cotton shares in yarn production more often
in 2010. Historically, the price of cotton fiber is
approximately 20 percent higher than that of synthetic
fibers. Industry experts expect that the share of
synthetic fibers in yarn production may increase in 2010
due to anticipated tight global cotton supplies and
resulting higher prices.
Trade
MY10/11 imports are forecast to surge to 3.2 MMT, up
28 percent from the estimated 2.5 MMT in
MY09/10. This increased forecast is based on stagnant
domestic production, coupled with an increase in
consumption. As mentioned above, MY10/11 cotton
consumption is forecast at 10.9 MMT, up seven percent
from the 10.2 MMT in MY09/10. (See chart 4: Source -
Production: MY06/07 from NSB; MY07/08 to MY10/11
by Post. Imports: World Trade Atlas; MY09/10 and
MY10/11 by Post). China’s cotton exports average
about 10,000 MT annually, an insignificant amount
compared to the total cotton use figure. Cotton yarn and

thread trade remains stable, with the annual import
volume exceeding exports by 350,000 MT in recent
years.
U.S. Competes with India for Share of China’s Market
Despite the drop in cotton imports in MY08/09, the
United States continued to be the largest exporter to
China, followed by India and Uzbekistan accounting for
60, 10, and 10 percent of the total,
respectively. However, India’s share in the first eight
months of MY09/10 increased significantly to 40
percent while the United States dropped to 27
percent. According to World Trade Atlas data, the price
of Indian cotton averaged $0.2/kg lower than U.S. cotton
during the first eight months of MY09/10. In addition to
the Indian government’s decision to levy a three-percent
duty on cotton exports beginning in mid-April, the
government also suspended cotton exports beginning
April 19, 2010, with no stated end-date. This will most
certainly reduce India’s cotton exports to China for the
remaining months of MY09/10. Industry sources report
that as of April 15, Indian cotton contracted for export
stood at 1.45 MMT with more than 400,000 MT yet to
be delivered. India’s cotton production is likely to
continue growing in the coming years, along with
technical advancements and dissemination of Bt
cotton. Relatively lower prices and convenient
transportation/delivery also contribute to India’s
competitiveness in China’s market. Indian traders are

actively engaged in promoting cotton in
China. Although cotton originating from the United
States remains the best choice for Chinese end-users
based on quality and reliability of supply, it is expected
to continue facing fiercer competition from Indian
cotton in the next few years because of India’s large
planted area and yield growth.
Consignment Trade to Recover
Consignment trade is likely to recover in
MY10/11. Most Chinese enterprises, in particular the
medium and small-scale mills will continue to take a
“hand to mouth” purchasing approach in
MY10/11. Consignment trade has advantages such as
short delivery time, flexibility, and convenient quality
verification. Industry insiders expect more domestic
buyers will choose consignment trade as a way to
alleviate financial difficulties.
Stocks
Stocks continue to be difficult to estimate. China still
has not established an official cotton market information
system although several relevant agencies are trying to
develop supply and demand balance sheets. The lack of
transparent and reliable data (production, consumption,
and stocks) has been even more pronounced in recent
years due to rapid expansion and diversified scales of
production. The already numerous players continue to
diversify ownership in the industry chain, including the
millions of cotton farmers, gins, merchants and
mills. All these entities contribute to making the
collection of reliable production statistics in China an
extremely difficult task.
Based on the 2nd
Ag Census, NSB adjusted domestic
cotton production upward for 2006 and 2007. The major
justification was under-reported planted area and under-
estimated lint ratios by province. However, production
data before 2006 is yet to be re-calculated. Some
industry leaders believe total cumulative under-reported
production from 2002 to 2005 could reach 2.7
MMT. More time may be needed to justify these new

indexes (area and lint ratios). However, FAS/Beijing
and most industry insiders believe NSB cotton
production data for 2007 through 2009 continues to be
under-estimated. As mentioned above, converting yarn
production into cotton use figures remains difficult a
challenge. The combination of “unknown production
and consumption,” together with the GOC’s “unknown”
state cotton reserves make estimating true stock levels
almost impossible. It is worth mentioning that
“consignment trade” remains dynamic because of its
advantages of flexibility and quick delivery, making low
industry inventory possible. Based on an industry
source, total cotton under “consignment trade” in
China’s bonded warehouses is estimated at 270,000
MT.
The forecast ending stocks for MY10/11 are 3.6 MMT
with the stock-to-use ratio at 33 percent. The forecast
recovery of “consignment trade” may justify a relatively
low stock-to-use ratio in MY10/11.
Marketing
Marketing of MY09/10 Crop
The marketing of MY09/10 crop has been expedited
because of increasingly tight supplies since harvest. The
tight supply is in response to a combination of several
factors but mainly reduced imports and decreased
production in the Yangtze River and the Yellow River
regions. The shortage of railcars in Xinjiang continues
to act as a bottleneck for getting Xinjiang cotton to
market. Although the GOC released a total of 2.62
MMT of state reserves in three batches between May
and November 2009, mills/traders rushed to purchase
cotton to avoid a shortage. The GOC did not purchase
any MY09/10 crop for reserve, but this policy will
continue to be a support mechanism to safeguard farmer
incomes when cotton prices and profitability falls.
Transporting Cotton out of Xinjiang Province
Transporting cotton out of Xinjiang remained difficult in
MY09/10. The GOC currently provides subsidies for
the shipping of Xinjiang cotton to mills in coastal and

southern cities. Industry insiders said the number of
railcars needed for shipping goods out of Xinjiang far
exceeds that for shipping into Xinjiang, and this
situation is unlikely to change in the near future. Heavy
snow in parts of Xinjiang made railcar supply even
tighter for cotton transportation. In mid-April 2010,
China’s State Council gave special instructions to add
railcars for cotton shipments. An industry source
estimated that 300,000 MT of cotton would be shipped
out by the end of April 2010, totaling 2 MMT shipped
out of Xinjiang from the harvest of MY09/10 crop.
Other Marketing Related Issues
The GOC already approved a few international traders to
engage in China’s domestic cotton trade. These traders,
however, are taking a cautious approach to entering the
domestic cotton market because of its size and
complexity. There has been limited interest from
international traders in the marketing of domestic
cotton.
U.S. cotton exporters interested in exporting cotton to
China in need of marketing assistance may contact
USDA/FAS’s Agricultural Trade Offices (ATO) in
Beijing, Chengdu, Guangzhou, Shanghai and
Shenyang. They can be contacted via email at,
[email protected], [email protected],
[email protected], [email protected],
and [email protected], respectively. Cotton
Council International (CCI) is also actively involved in
promoting U.S. cotton in China and throughout
Asia. CCI serves China regionally from its Hong Kong
Office. CCI can be reached via email at cci-
[email protected]. Both CCI and the ATO’s
organize events designed to bring U.S. cotton exporters
in close contact with Chinese buyers.
The China International Cotton Conference, a biannual
event sponsored by CCA, MOA, and FAO, attracts a
worldwide audience from the cotton/textile
industry. The next conference will be held in
2011. CCA, in collaboration with China National

Cotton Exchange also holds an annual event, the China
Cotton Industry Development Forum focusing on
analysis and outlook of the market situation.
Policy
Registration System for Overseas Cotton Suppliers
In 2008, China’s General Administration for Quality
Supervision, Inspection and Quarantine (AQSIQ)
published Announcement No. 87, a new registration
system for overseas cotton suppliers and in November
published a related circular on “Quality Credit
Assessment Measures” (GAIN CH8075 and
CH9035). Since the publishing of the Announcement,
USDA expressed serious concerns to AQSIQ through
consultations and official letters regarding the potential
trade impact and, requested AQSIQ delay the
implementation of the system for six months to allow for
technical consultations. However, AQSIQ moved ahead
as planned, enforcing the registration system, though
added that the “Quality Credit Assessment” would be
“in a trial implementation stage.” As of this report,
AQSIQ has approved 218 registered overseas cotton
suppliers in eight tranches. (http://www.china-
cotton.org/article/2010/03/02/zt42.php).
USDA continues to engage AQSIQ to address
outstanding industry concerns related to the registration
system. In mid-April, AQSIQ sent a team to the
Agricultural Marketing Service’s central cotton lab in
Memphis, Tennessee to learn about the USDA cotton
classification system. The visit enhanced mutual
understanding and laid a solid foundation for both sides
to carry out additional cooperation on cotton import
inspections. As of this report, there have been no reports
of trade disruptions as a result of the registration and
“Quality Credit Assessment Measures.”
Seed Subsidy Continues to Cover Total Planted Area in 2010
In 2007, the GOC began to partly subsidize cotton
production through a multi-year “seed subsidy” program
(GAIN CH7033). The seed subsidies were expanded to
cover all of China’s cotton planted area in 2009. The

subsidy continues to be allocated to large seed
producers/traders for selected “high quality varieties”
through an open bidding process. The rate remained
unchanged at approximately $32 per hectare (RMB 15
per Mu; GAIN CH9035). In mid January 2010, China’s
Ministry of Finance and MOA issued an announcement
on “Administrative Measures on Subsidies to Cotton
Planting Seeds.” The announcement specified that the
2010 subsidy program will remain unchanged from
2009. While the amount of the seed subsidy is not
officially published, total appropriations in 2010 are
expected to exceed $160 million if based on the NSB’s
4.95 MHa planted area for MY09/10. According to the
relevant provincial agricultural authorities, it appears
funds have been distributed as scheduled.
The seed subsidy policy is aimed at stabilizing planted
area. It is also expected that cotton quality will be more
uniform because of selected “high quality varieties”
(seeds eligible to be subsidized) are likely to increase in
area coverage. Given the increasing cotton supply gap
and the importance placed on maintaining a stable
planting area, this policy is likely to remain in place in
the foreseeable future.
Transportation of Xinjiang Cotton Continues to be Subsidized
The long distance from Xinjiang to the end-users in east
and south China increases transportation costs for
Xinjiang cotton. The GOC began to provide a
transportation subsidy of $59 (RMB 400)/MT for the
shipment of cotton out of Xinjiang, effective MY08/09
through MY09/10 (the end date is tentative). The
subsidy facilitated the shipment of Xinjiang cotton to
coastal provinces. Most industry insiders believe this
subsidy is likely to remain in place in the coming years
to ensure the shipment of cotton in a timely manner.
Cotton Classification Reform
China’s cotton classification reform continued in
MY09/10 and the new classification system will be fully
enforced in MY10/11. According to China Fiber
Inspection Bureau (CFIB)

(http://www.ccqsc.gov.cn/cotton/report?act=x&rls=0&ty
pe=6&infoType=1&ID=61), a total of 1,450 gins
participated in cotton HVI classification, up from the
1,216 in the previous year. As of April 27, 2010, total
cotton baled and classed on the new classification
system reached 2.5 MMT, which is lower than 2.8 MMT
in the previous year when total cotton production was
one MMT higher. According to China’s cotton
classification plan, the new system is scheduled to be
fully in force by September 2010. However, some
industry insiders expect CFIB may face challenges
because some mills are reluctant to purchase the
necessary equipment to enable them to accept the larger
bales. As a result, these mills are likely to continue to
purchase “small bales” of cotton from gins without
“official classification.” They will likely use the excuse
that manual handling is more convenient, particularly
when supply becomes tight. This situation is a
drawback, because the new classing system is expected
to help facilitate domestic cotton production estimates
and upgrade the quality level of China’s ginning sector.
Cotton imports are regulated by TRQ regime
The TRQ regime will remain in place in the foreseeable
future as the GOC maintains that the TRQ regime is
necessary to regulate the market and protect the interests
of both farmers and the domestic textile
industry. China’s current willingness to expand the
TRQ beyond its WTO commitments should continue
into the near future because domestic production cannot
meet the demand of the textile industry. As usual, China
distributed 894,000 MT of cotton TRQ for 2010 (subject
to one percent import tariff) at the end of
2009. Simultaneously, in response to requests by the
textile industry and to curb rising cotton prices, the GOC
distributed an additional 1 MMT of TRQ subject to a
variable tariff rate. The total TRQ reached traders/mills
in January 2010. The GOC did not add additional TRQ
volume (subject to variable tariff) in 2009 because of
sufficient domestic supplies and weak demand for
textiles and apparel by overseas markets. However, in
July 2009, NDRC approved distribution of 400,000 MT

cotton import quota specifically for “Processing
Trade.” This approval was targeted to help some large
export-oriented mills maintain operations. A large
textile company was said to receive most of the 400,000
MT import quota. Because the quota is designated for
“processing trade” it is exempted from any duties,
however, the finished products must be
exported. Distribution and allocation of the TRQ
remains non-transparent.
2.6 MMT of State Cotton Reserve Released in 2009
The GOC maintains an unknown volume of state cotton
reserves used to regulate the domestic cotton
market. The state cotton reserve management policy is
expected to continue in the foreseeable future. State
purchases of domestic cotton for the reserve are also
considered a means to enhance the ongoing
classification reform by paying out a premium for the
large bale cotton. In an effort to support the domestic
cotton price/farmer’s income and facilitate the marketing
of domestic cotton, the GOC purchased 2.72 MMT of
MY08/09 domestic crop, accounting for almost one third
of the total production (GAIN CH9035). Total
purchased volume reached 2.87 MMT if the 150,000
MT of Xinjiang cotton purchased in August 2008 is
added. However, in mid 2009, cotton supply became
tight in the domestic market and prices began to climb as
a result of limited imports (mainly due to shortage of
import TRQ) and a widely expected smaller domestic
production in MY09/10. The GOC thus released a total
of 2.6 MMT of state reserve starting from late May
through November 2009 to meet industry demands. The
GOC believes the state reserve policy, together with
cotton import TRQ regime; maintain “the domestic
cotton supply/demand balance.” The GOC did not
purchase new crop of MY09/10 for state reserve mainly
because of a reduced domestic production at price
considered to be above the floor level.
Targeted Loans

In MY09/10, the Agriculture Development Bank of
China (ADBC) continued to provide targeted loans with
favorable terms for the purchase of cotton. ADBC
earmarked $5.5 billion for this program, compared to the
record $7.7 billion in the previous year. The reduced
loan may reflect a smaller production and improved
financial conditions for gins/traders in
MY09/10. ADBC will continue to financially assist
domestic cotton marketing in MY10/11.
Textile Industry Remains One of the Pillar Industries
In the beginning of 2009, the GOC approved a stimulus
plan to revitalize China's textile industry. The Plan was
made in response to the slowdown in exports since late
2008 as a result of weak demand by overseas
markets. The Plan includes measures to encourage
exports, foster domestic brands and provide financial
support for textile enterprises. According to the Plan,
the GOC will expedite the phase-out of obsolete
producing facilities, eliminating energy-inefficient and
polluting equipment, and encourage textile and garment
manufacturers to relocate operations to central and
western areas from southeastern parts of China. New
production bases for high quality cotton yarn, fabric, and
textile products will be built in Xinjiang Province. The
GOC will also take a proactive attitude to boost
domestic textile/apparel consumption through
innovation of new products and exploiting domestic
rural markets.
According to industry sources, continued restructuring
and upgrading of the sector remains the priority in
2010. Despite the weaker demand for textile products,
China’s textile industry maintained profitability in
2009. Though the sector faces tight profit margins
resulting from increasing labor and raw material (cotton)
costs and likely appreciation of China’s currency
eroding the sector’s profit, China’s industry leaders also
expressed confidence on a steady growth of the industry
in 2010.
Tables

Production, Supply and Demand (PSD) Table 1. PSD (in 1,000 Bales and 1,000 Ha)
Cotton China
2008 2009 2010
2008/2009 2009/2010 2010/2011
Market Year
Begin: Aug
2008
Market Year
Begin: Aug
2009
Market Year
Begin: Aug
2010
USDA
Official
Data
New
Post
USDA
Official
Data
New
Post
USDA
Offici
al
Data
New
Post
Dat
a
Dat
a
Dat
a
Area Planted 0 5,95
0
0 5,55
0
5,70
0
Area Harvested 6,00
0
5,95
0
5,15
0
5,55
0
5,70
0
Beginning Stocks 20,5
04
20,5
04
22,3
66
20,5
16
18,1
56
Production 36,7
00
36,7
00
31,5
00
33,0
70
33,9
88
Imports 6,99
6
6,99
6
9,50
0
11,4
80
14,7
00
MY Imports from U.S. 0 4,17
0
0 4,20
0
8,70
0
Total Supply 64,2
00
64,2
00
63,3
66
65,0
66
66,8
44
Exports 84 84 75 60 70
Use 44,0
00
43,6
00
47,5
00
46,8
50
50,0
60
Loss -
2,25
0
-
2,50
0
Total Dom. Cons. 41,7
50
43,6
00
45,0
00
46,8
50
50,0
60
Ending Stocks 22,3
66
20,5
16
18,2
91
18,1
56
16,7
14
Total Distribution 64,2
00
64,2
00
63,3
66
65,0
66
66,8
44
Stock to Use % 51 47 38 39 33
Yield 1,33
2.
1,34
3.
1,33
2.
1,29
7.
1,29
8.
Table 2. PSD (in 1,000 Metric Tons and 1,000 Ha)
Cotton China
2008 2009 2010
2008/2009 2009/2010 2010/2011

Market Year
Begin: Aug
2008
Market Year
Begin: Aug
2009
Market Year
Begin: Aug
2010
USDA
Official
Data
Ne
w
Post
USDA
Official
Data
Ne
w
Post
USDA
Offici
al
Data
Ne
w
Post
Dat
a
Dat
a
Dat
a
Area Planted 0 0 5,95
0
0 0 5,55
0
0 0 5,70
0
Area Harvested 6,00
0
0 5,95
0
5,15
0
0 5,55
0
0 0 5,70
0
Beginning Stocks 4,46
4
0 4,46
4
4,87
0
0 4,46
7
0 0 3,95
3
Production 7,99
0
0 7,99
0
6,85
8
0 7,20
0
0 0 7,40
0
Imports 1,52
3
0 1,52
3
2,06
8
0 2,50
0
0 0 3,20
0
MY Imports from U.S. 0 0 908 0 0 910 0 0 1,90
0
Total Supply 13,9
78
0 13,9
78
13,7
96
0 14,1
66
0 0 14,5
53
Exports 18 0 18 16 0 13 0 0 15
Use 9,58
0
0 9,50
0
10,3
42
0 10,2
00
0 0 10,9
00
Loss -490 0 0 -544 0 0 0 0 0
Total Dom. Cons. 9,09
0
0 9,49
3
9,79
8
0 10,2
00
0 0 10,9
00
Ending Stocks 4,87
0
0 4,46
7
3,98
2
0 3,95
3
0 0 3,63
9
Total Distribution 13,9
78
0 13,9
78
13,7
96
0 14,1
66
0 0 14,5
53
Stock to Use % 51 0 47 38 0 39 0 0 33
Yield 1,33
2.
0
.
1,34
3.
1,33
2.
0
.
1,29
7.
0
.
0
.
1,29
8.
Trade Tables
Table 3. China’s Monthly Cotton Imports
Unit: Metric Tons
Month 2005 2006 2007 2008 2009 2010
January 113,076 301,372 123,092 157,712 77,993 301,359
February 70,599 321,280 125,235 158,168 93,083 221,046
March 101,487 495,049 259,846 213,221 98,763 323,800
April 169,815 490,704 215,093 263,417 145,560
May 160,891 463,809 201,205 240,159 151,524

June 206,024 380,674 252,460 211,043 168,619
July 294,416 290,358 228,945 212,580 131,440
August 373,295 285,958 258,667 186,875 109,711
September 313,304 134,364 234,451 129,057 102,162
October 198,167 84,985 137,031 96,155 118,604
November 224,991 154,592 101,846 76,141 112,866
December 347,517 240,338 322,575 168,433 216,776
TOTAL 2,573,582 3,643,482 2,460,445 2,112,961 1,527,101
Marketing
Year
Aug/05-
Jul/06
Aug/06-
Jul/07
Aug/07-
Jul/08
Aug/08-
Jul/09
Aug/09-
Jul/10
TOTAL 4,200,521 2,306,112 2,510,869 1,523,643
Unit: 480-lb Bales
Month 2005 2006 2007 2008 2009 2010
January 519,358 1,384,200 565,359 724,373 358,222 1,384,141
February 324,263 1,475,641 575,205 726,468 427,529 1,015,262
March 466,128 2,273,762 1,193,474 979,323 453,619 1,487,200
April 779,959 2,253,801 987,920 1,209,874 668,557
May 738,972 2,130,276 924,135 1,103,049 695,952
June 946,269 1,748,434 1,159,550 969,321 774,466
July 1,352,252 1,333,612 1,051,545 976,378 603,702
August 1,714,546 1,313,403 1,188,058 858,318 503,901
September 1,439,007 617,133 1,076,833 592,759 469,232
October 910,179 390,338 629,382 441,641 544,749
November 1,033,385 710,040 467,777 349,715 518,392
December 1,596,146 1,103,872 1,481,585 773,613 995,653
TOTAL 11,820,464 16,734,513 11,300,825 9,704,831 7,013,974
Marketing
Year
Aug/05-
Jul/06
Aug/06-
Jul/07
Aug/07-
Jul/08
Aug/08-
Jul/09
Aug/09-
Jul/10
TOTAL 19,292,992 10,591,973 11,300,825 6,998,092
Source: World Trade Atlas
Table 4. China’s Quarterly Cotton Imports by Country of Origin
Unit: Metric Tons
Marketing Year: 2007/2008
Country Jul-Sep
/07
Oct-Dec
/07
Jan-
Mar/08
Apr-
Jun/08
TOTAL
United States 475,248 188,013 134,116 272,987 1,070,364
India 55,392 216,650 295,524 244,968 812,533
Uzbekistan 33,332 21,088 17,555 90,794 162,768
Australia 42,356 30,649 6,192 19,930 99,127
Burkina Faso 33,501 15,523 14,555 13,899 77,478
Benin 20,701 6,928 4,374 27,148 59,151
Mali 10,568 6,793 13,226 13,865 44,452
Mexico 4,477 12,760 14,016 10,458 41,711
Cameroon 11,651 13,173 7,491 5,524 37,840
Egypt 2,381 3,429 3,454 2,077 11,342

Brazil 4,646 16,813 6,288 1,290 29,037
Cote d'lvoire 4,442 1,144 2,863 4,093 12,543
Other 23,370 28,486 9,448 7,585 68,890
TOTAL 722,063 561,451 529,102 714,619 2,527,235
Marketing Year: 2008/2009
Country Jul-Sep
/08
Oct-Dec
/08
Jan-
Mar/09
Apr-
Jun/09
TOTAL
United States 342,427 238,339 160,056 255,213 996,035
India 29,849 37,151 27,261 51,330 145,591
Uzbekistan 58,427 1,794 50,763 50,648 161,631
Australia 29,701 21,049 5,509 27,945 84,204
Brazil 2,579 14,149 13,051 17,276 47,055
Benin 15,976 664 400 16,651 33,691
Burkina Faso 8,595 464 594 18,120 27,774
Cameroon 9,106 800 1,275 7,690 18,870
Mali 5,862 118 760 5,172 11,912
Mexico 6,547 8,743 3,755 6,265 25,310
Other 19,444 17,459 6,415 9,393 52,711
TOTAL 528,512 340,729 269,839 465,703 1,604,783
Marketing Year: 2009/2010
Country Jul-Sep
/09
Oct-Dec
/09
Jan-
Mar/10
Apr-
Jun/10
TOTAL
India 53,627 183,167 236,794
United States 130,250 86,299 216,548
Burkina Faso 27,320 39,029 66,349
Australia 37,479 31,568 69,048
Brazil 5,329 17,308 22,637
Pakistan 1,437 12,290 13,727
Benin 22,038 12,250 34,288
Uzbekistan 27,844 11,109 38,953
Cameroon 10,125 10,913 21,038
Mali 4,395 6,697 11,092
Cote d'lvoire 7,243 4,397 11,641
Other 16,225 33,219 49,444
TOTAL 343,313 448,246 791,559
Source: World Trade Atlas
Table 5. China’s Monthly Cotton Exports
Unit: Metric Tons
Month 2006 2007 2008 2009 2010
January 1,450 2,404 221 581 86
February 581 362 393 606 0
March 0 2,149 811 2,969
April 488 2,634 962 193
May 944 932 854 887

June 2,198 2,656 655 348
July 665 1,038 866 1,401
August 1,179 880 2,043 830
September 1,229 835 3,503 114
October 1,589 2,709 2,451 97
November 1,142 2,887 1,916 8
December 1,572 1,608 1,687 215
TOTAL 13,039 21,094 16,361 8,249
Marketing
Year
Aug/06-
Jul/07
Aug/07-
Jul/08
Aug/08-
Jul/09
Aug/09-
Jul/10
TOTAL 18,887 13,681 18,584
Unit: 480-lb Bales
Month 2006 2007 2008 2009 2010
January 6,662 11,044 1,014 2,670 393
February 2,668 1,663 1,805 2,785 0
March 0 9,871 3,726 13,635
April 2,241 12,100 4,421 888
May 4,337 4,278 3,921 4,073
June 10,097 12,197 3,007 1,597
July 3,056 4,767 3,979 6,437
August 5,417 4,040 9,381 3,812
September 5,647 3,837 16,088 522
October 7,300 12,444 11,256 446
November 5,245 13,260 8,800 35
December 7,220 7,385 7,747 988
TOTAL 59,890 96,886 75,145 37,887
Marketing
Year
Aug/06-
Jul/07
Aug/07-
Jul/08
Aug/08-
Jul/09
Aug/09-
Jul/10
TOTAL 86,750 62,839 85,356
Source: world Trade Atlas
Table 6. China’s Quarterly Cotton Exports by Destination
Marketing Year: 2007/2008
Country Jul-Sep /07 Oct-Dec /07 Jan-Mar /08 Apr-Jun /08 TOTAL
India 88 660 514 487 1,749
Thailand 506 0 201 492 1,199
Taiwan 305 2,485 120 0 2,909
Vietnam 205 1,788 61 0 2,054
Japan 515 1,977 294 339 3,125
Other 1,134 294 236 1,153 2,816
TOTAL 2,753 7,204 1,425 2,471 13,853
Marketing Year: 2008/2009
Country Jul-Sep /08 Oct-Dec /08 Jan-Mar /09 Apr-Jun /09 TOTAL

Japan 30 44 125 57 257
India 1,885 1,224 416 98 3,622
Malaysia 0 171 0 0 171
Pakistan 2,032 687 0 0 2,720
Bangladesh 0 1,458 0 196 1,654
Korea, North 1,300 172 3,080 0 4,552
Hong Kong 283 343 0 0 626
Other 881 1,954 535 1,077 4,448
TOTAL 6,412 6,053 4,156 1,428 18,049
Marketing Year: 2009/2010
Country Jul-Sep /09 Oct-Dec /09 Jan-Mar /10 Apr-Jun /10 TOTAL
Belgium 0 203 203
Japan 437 67 504
India 284 49 333
Other 1,624 2 1,625
TOTAL 2,345 320 2,665
Source: World Trade Atlas
Table 7. China’s Monthly Cotton Yarn and Thread Imports
Unit: Metric Tons
Month 2006 2007 2008 2009 2010
January 62,896 75,289 59,448 38,702 102,478
February 61,535 46,631 42,289 61,569 58,667
March 88,313 88,089 73,161 78,186
April 81,974 86,136 73,963 81,291
May 75,690 83,350 69,424 78,993
June 72,098 80,296 63,709 84,389
July 69,185 74,507 70,838 88,031
August 83,238 79,033 57,922 81,865
September 75,944 64,743 59,406 88,651
October 67,583 55,459 58,069 77,214
November 68,989 56,936 46,705 90,793
December 75,147 60,448 50,603 105,186
TOTAL 882,592 850,919 725,539 954,871
Marketing Year Aug/06-
Jul/07
Aug/07-
Jul/08
Aug/08-
Jul/09
Aug/09-
Jul/10
TOTAL 905,198 850,919 783,866
Source: World Trade Atlas
Table 8. China’s Monthly Cotton Yarn and Thread Exports
Unit: Metric Tons
Month 2006 2007 2008 2009 2010
January 26,322 39,434 37,114 25,208 39,795
February 33,121 27,261 28,436 26,468 24,800
March 53,124 43,847 55,410 39,808
April 48,898 48,235 54,685 45,606
May 46,251 49,864 50,120 42,557
June 44,601 47,980 46,381 47,772
July 44,321 47,382 45,580 43,592
August 50,092 50,663 39,480 37,850
September 45,748 45,760 36,414 41,776
October 43,383 39,810 33,036 36,413
November 42,682 39,890 28,855 44,509
December 41,114 38,956 26,744 45,598
TOTAL 519,657 519,081 482,255 477,157
Marketing
Year
Aug/06-
Jul/07
Aug/07-
Jul/08
Aug/08-
Jul/09
Aug/09-
Jul/10
TOTAL 527,021 519,081 435,540
Source: World Trade Atlas
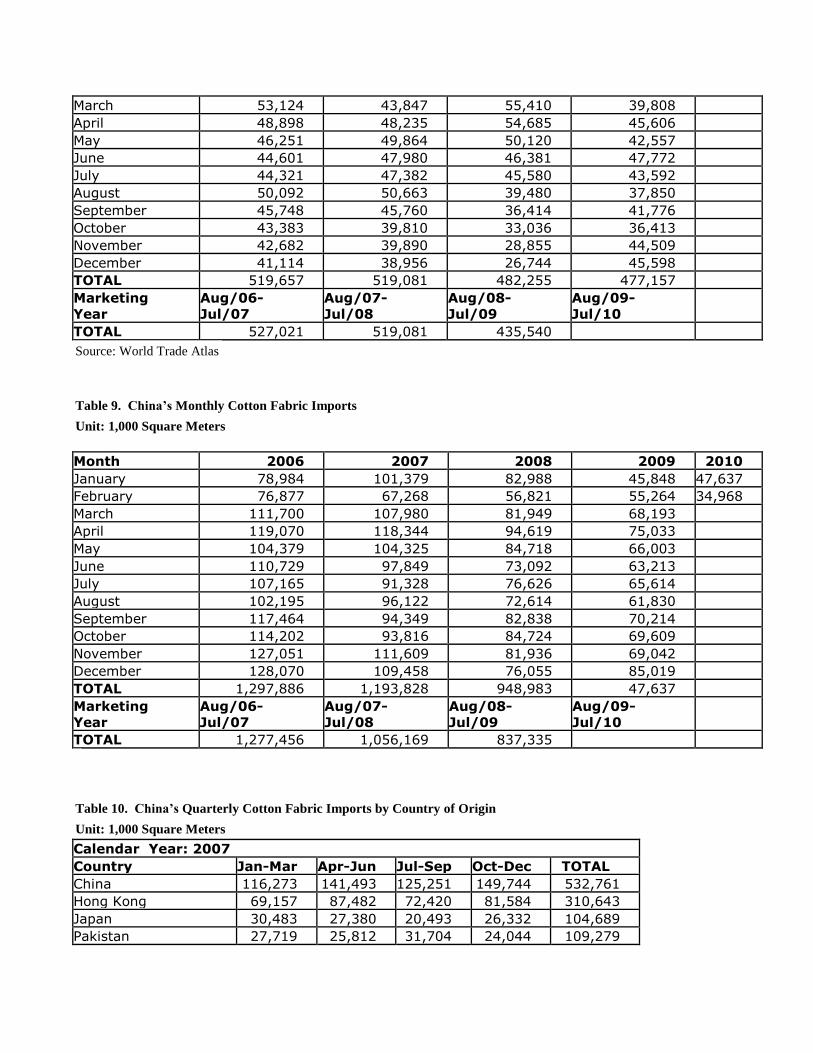
Table 9. China’s Monthly Cotton Fabric Imports
Unit: 1,000 Square Meters
Month 2006 2007 2008 2009 2010
January 78,984 101,379 82,988 45,848 47,637
February 76,877 67,268 56,821 55,264 34,968
March 111,700 107,980 81,949 68,193
April 119,070 118,344 94,619 75,033
May 104,379 104,325 84,718 66,003
June 110,729 97,849 73,092 63,213
July 107,165 91,328 76,626 65,614
August 102,195 96,122 72,614 61,830
September 117,464 94,349 82,838 70,214
October 114,202 93,816 84,724 69,609
November 127,051 111,609 81,936 69,042
December 128,070 109,458 76,055 85,019
TOTAL 1,297,886 1,193,828 948,983 47,637
Marketing
Year
Aug/06-
Jul/07
Aug/07-
Jul/08
Aug/08-
Jul/09
Aug/09-
Jul/10
TOTAL 1,277,456 1,056,169 837,335
Table 10. China’s Quarterly Cotton Fabric Imports by Country of Origin
Unit: 1,000 Square Meters
Calendar Year: 2007
Country Jan-Mar Apr-Jun Jul-Sep Oct-Dec TOTAL
China 116,273 141,493 125,251 149,744 532,761
Hong Kong 69,157 87,482 72,420 81,584 310,643
Japan 30,483 27,380 20,493 26,332 104,689
Pakistan 27,719 25,812 31,704 24,044 109,279

Taiwan 12,647 17,013 12,670 13,897 56,227
Korea, South 9,143 9,268 8,153 7,302 33,866
Italy 1,708 2,823 2,688 2,862 10,080
Indonesia 2,687 1,621 1,955 2,108 8,370
Other 6,810 7,626 6,466 7,010 27,913
TOTAL 276,627 320,519 281,800 314,883 1,193,828
Calendar Year: 2008
Country Jan-Mar Apr-Jun Jul-Sep Oct-Dec TOTAL
China 98,024 119,604 114,453 116,304 448,385
Hong Kong 54,873 67,806 50,684 49,740 223,103
Japan 25,673 21,957 17,694 24,262 89,585
Pakistan 18,294 12,446 20,941 23,361 75,042
Taiwan 10,034 12,168 10,846 11,234 44,284
Korea, South 6,418 6,208 6,900 7,832 27,358
India 1,523 1,990 2,332 2,619 8,465
Italy 1,926 2,697 2,603 1,887 9,113
Other 4,993 7,553 5,626 5,477 23,648
TOTAL 221,759 252,429 232,078 242,716 948,983
Calendar Year: 2009
Country Jan-Mar Apr-Jun Jul-Sep Oct-Dec TOTAL
China 69,343 91,661 85,966 108,259 355,229
Hong Kong 31,612 42,538 38,805 39,386 152,341
Pakistan 29,171 35,124 38,410 31,859 134,564
Japan 20,300 13,975 13,131 16,720 64,126
Taiwan 6,285 7,730 6,671 7,581 28,267
Korea, South 4,325 4,921 5,472 6,345 21,064
India 3,646 1,754 2,399 4,049 11,849
Thailand 415 614 1,490 2,496 5,015
Turkey 769 1,019 1,187 1,686 4,661
Italy 1,030 1,762 1,059 1,522 5,373
Indonesia 1,013 983 828 1,224 4,049
Other 1,394 2,166 2,240 2,543 8,343
TOTAL 169,305 204,249 197,658 223,670 794,882
Source: World Trade Atlas
Table 11. China’s Monthly Cotton Fabric Exports
Unit: 1,000 Square Meters
Month 2005 2006 2007 2008 2009 2010
January 367,102 436,041 425,476 507,658 405,793 548,804
February 284,965 273,382 411,280 370,832 232,178 407,887
March 437,819 468,117 392,312 489,945 472,667
April 417,040 448,958 496,096 533,580 468,673
May 385,868 434,668 439,481 472,541 438,233
June 414,540 444,517 424,101 487,795 437,932
July 398,196 428,935 439,774 486,933 455,192
August 419,847 485,664 474,342 514,674 468,003

September 437,275 485,395 507,569 523,854 563,082
October 424,741 471,032 490,385 506,479 510,625
November 441,006 513,640 546,508 447,964 578,917
December 447,263 522,728 513,499 419,117 669,986
TOTAL 4,875,663 5,413,079 5,560,822 5,761,372 5,701,281
Marketing
Year
Aug/05-
Jul/06
Aug/06-
Jul/07
Aug/07-
Jul/08
Aug/08-
Jul/09
Aug/09-
Jul/10
TOTAL 5,104,752 5,506,981 5,560,822 5,322,756
Source: World Trade Atlas
Other Tables
Table 12. Cotton Planted Area and Production by Province
Planted Area (1,000 hectares)
Year 2006** 2007 2008 2009*** 2010
Post - Total* 5,900 6,126 5,950 5,550 5,700
NSB - Total 5,816 5,926 5,754 4,950
Xinjiang 1,900 1,783 1,718 NA
Shandong 930 900 888 NA
Henan 801 700 606 537
Hebei 623 680 690 620
Anhui 375 376 390 344
Jiangsu 355 327 300 252
Hubei 382 514 543 460
Hunan 136 172 183 160
Gansu 77 79 73
Jiangxi 88 82 67
Production (1,000 MT)
Year 2006** 2007 2008 2009 2010
Post - Total* 7,600 8,030 7,990 7,200 7,400
NSB - Total 6,746 7,624 7,492 6,400
Xinjiang 2,189 3,013 3,026 2,520
Shandong 1,023 1,001 1,041 921
Henan 830 750 651 520
Hebei 628 725 737 605
Anhui 408 374 363 351
Jiangsu 381 348 326 256
Hubei 449 557 513 480
Hunan 248 244 247 242
Gansu 128 129 123
Jiangxi 95 128 112
* Data estimate or forecast by Post; ** the 2006 total area and production is the NSB adjusted
data based on 2nd Ag Census but the data by province not adjusted; ***data by province based
on 2009 Provincial Statistics Report
NSB-Average
Yield(Kg/Ha) 1,160 1,287 1,302 1,293
Source: NSB

Table 13. Cotton Tariffs as of January 1, 2010
Description HS Code M.F.N.(%) Gen(%) VAT ED Unit
Cotton, not carded or combed 5201-
0000
T3 T3
13 13 Kg
Cotton waste, yarn waste 5202-1000 10 30 17 13 Kg
Cotton waste, garnetted stock 5202-9100 10 30 17 13 Kg
Cotton waste, other 5202-9900 10 30 17 13 Kg
Cotton, carded or combed 5203-
0000
T3 T3
17 13 Kg
Cotton sewing thread, containing 5204-
1100
5 40
17 16 Kg
85% or more by weight of cotton
Other 5204-1900 5 40 17 16 Kg
Put up for retail sale 5204-2000 5 50 17 16 Kg
Cotton yarn (other than sewing 5205-1100 5 40 17 16 Kg
thread), containing 85% or more to
by weight of cotton, not for retail
sale
5205-
4800
Cotton yarn (other than sewing
thread) containing less than 85%
by weight of cotton, not put for
retail sale
5206-1100
to 5206-
4500
5 40
17 16 Kg
Cotton yarn (other than sewing 5207-1000 6 50 17 16 Kg
thread), containing 85% or more 5207-9000 6 50 17 16 Kg
by weight of cotton,for retail sale
Woven fabrics of cotton, 5208-1100 10 70 17 16 M/Kg
Source: PRC Customs Import & Export Tariff, 2010
Table 13. Cotton Tariffs as of January 1, 2010 (continued)
Description HS Code M.F.N.(%) Gen(%) VAT ED Unit
containing 85% or more by weight of
cotton, weighing not more than 200
g/square meter
to
5208-
5990*
*Except:
" 5208-
2300
12 70
17 16 M/Kg
Woven fabrics of cotton, containing
85% or more by
5209-
1100
10 70
17 16 M/Kg
weight of cotton, weighing more 5209-
1200
10 70
17 16 M/Kg
than 200 g/square meter 5209-
1900
10 70
17 16 M/Kg
5209-
2100
12 70
17 16 M/Kg
" 5209- 12 70 17 16 M/Kg

2200
5209-
2900
12 70
17 16 M/Kg
5209-
3100
10 70
17 16 M/Kg
5209-
3200
10 70
17 16 M/Kg
5209-
3900
10 70
17 16 M/Kg
5209-
4100
10 70
17 16 M/Kg
" 5209-
4200
10 70
17 16 M/Kg
5209-
4300
10 70
17 16 M/Kg
5209-
4900
10 70
17 16 M/Kg
5209-
5100
10 70
17 16 M/Kg
5209-
5200
10 70
17 16 M/Kg
5209-
5900
10 70
17 16 M/Kg
Note: VAT--Value Added Tax; ED--Export Drawback Rate; T3--Subject to Quato Control, in-Quato
Duty Rate is 1%, Out-quato subject to sliding rate.
Source: PRC Customs Import & Export Tariff, 2010
Table 14. Tariff Rate Quota
Description HS Code Initial Quota and
Tariff Rate
Final Quota and
Tariff Rate
Implementation of Final
Quota
Cotton 780,750 MT 894,000 MT 2004
5201 -
0000
1% 1%
5203 -
0000
1% 1%
Other terms and conditions:
1) STE share = 33% (See Note)
2) Staging of TRQ for cotton:
Year TRQ quantity:
2002 - 818,500 MT
2003 - 856,250 MT
2004 - 894,000 MT
2005 - 894,000 MT (China added 1.4 MMT TRQ in 2005)
2006 - 894,000 MT (China added 2.7 MMT TRQ in 2006, subject to variable import duty)
2007 - 894,000 MT (China added 2.6 MMT TRQ in 2007, subject to variable import duty)
2008 - 894,000 MT (China added 2.6 MMT TRQ in 2008, subject to variable import duty)
2009 - 894,000 MT (China did not add TRQ due to weak demands for cotton)

2010 - 894,000 MT(and as of this report added 1 MMT of TRQ subject to variable import duty;
China’s WTO commitment does NOT mandate a TRQ for CY05 to CY09, but China maintained an
identical quantity of TRQ as CY04. In addition to those volumes, based on market demand, China
adds TRQs yearly. The added TRQs are subject to a variable import duty)