chile tsunami event impacts in hawke’s bay february 2010
TRANSCRIPT

Chile Tsunami Event Impacts in Hawke’s
Bay February 2010
April 2010 AM 10/07
HBRC Plan 4195


Asset Management Group Technical Report
ISSN 1174 3085
Asset Management Section
Chile Tsunami Event Impacts in Hawke’s Bay February 2010
Prepared by: Lisa Pearse, Emergency Management Coordinator
Reviewed by: Gary Clode, Manager Engineering & Craig Goodier & Neil Daykin, Design Engineers, Hawke’s Bay Regional Council
Approved: Mike Adye, Group Manager – Asset Management
April 2010 AM 10/07
HBRC Plan Number 4195
© Copyright: Hawke’s Bay Regional Council


i April 2010
Table of Contents Background .................................................................................................................. 3
Executive Summary ...................................................................................................... 3
Abbreviations ................................................................................................................ 4
Pre-Event ...................................................................................................................... 4
Response ..................................................................................................................... 4
Tsunami Observations .................................................................................................. 7
Social and Economic Effects ......................................................................................... 8
Number of Casualties ............................................................................................ 8
Rescues and/or Evacuations ................................................................................. 8
Number of houses ................................................................................................. 8
Other Buildings ...................................................................................................... 8
Forestry & Conservation Assets ............................................................................. 8
Number of farms .................................................................................................... 8
Number of businesses ........................................................................................... 8
Infrastructure – Bridges and Culverts ..................................................................... 8
Infrastructure – Roads ........................................................................................... 8
Infrastructure – River, Lake & Coastal Protection Works ........................................ 9
Other Infrastructure ................................................................................................ 9
Event Data .................................................................................................................. 10
Earthquake .............................................................................................................. 10
Waves & Surges ..................................................................................................... 11
Annexes...................................................................................................................... 15
A: Other Reports Produced .............................................................................. 15
B: Scientific Studies ......................................................................................... 15
C: Log of Events .............................................................................................. 15
D: Newspaper Articles ..................................................................................... 15

ii April 2010
Table of figures Figure 1: Copy of Regional Warning sent out 2:30am Sunday, 28 February 2010 from the Hawke's Bay Regional Council ............................................................................... 5
Figure 2: Outline of estimated tsunami travel times ....................................................... 6
Figure 3: Changes in water levels graphically shown in the Inner Harbour at Napier on a floating pontoon. ........................................................................................................ 7
Figure 4 Strong currents from the tsunami move under the Westshore Bridge, Napier. 9
Figure 5: Chile Earthquake Details from USGS Website http://www.usgs.gov/ ........... 10
Figure 6: Tsunami Energy Flux by Isaac Fine (IOS) Chilean tsunami Feb 27 2010 ..... 11
Figure 7: Recordings of New Zealand Tsunami Gauge Network on 1 March 2010 showing the changes in relative sea level for the 36 hours previous. ......................... 11
Figure 8: Port of Napier Wave Buoy Recordings ......................................................... 12
Figure 9: Comparison of Actual and Modelled Water Level at Outfall Recorder by Ir. Craig Goodier, Senior Design Engineer, HBRC .......................................................... 12
Figure 10: Comparison of Actual and Modelled Water Level at Inner Harbour by Ir. Craig Goodier, Senior Design Engineer, HBRC .......................................................... 13
Figure 11: Disturbed currents and discolouration of water at entrance to Inner Harbour at 1345 on 28th February 2010 taken by Acting Harbour Master John Paston ............ 13
Figure 12: A rare sight - Clifton Reefs exposed on 28 February 2010, Hastings ......... 14
Figure 13: Slow moving wavelets at entrance to Napier Inner Harbour morning of 28 February 2010 ............................................................................................................ 14

3 April 2010
Background
Tsunami from a distant source is ranked in the Hawke’s Bay Civil Defence Emergency Management Plan as Priority 3, as while it presents a real risk, impacts are limited to particular communities and the frequencies of these events equates to about one event every 900 years (J Goff, June 2008). Given the infrequency of these events, it makes them all the more interesting when they do occur hence the decision to collect the relevant information relating to this event.
Executive Summary
A tsunami originated off the coast of Chile, following an 8.8 magnitude earthquake at a depth of 55km, which occurred at 19:34 on Saturday 27th February. The Pacific Tsunami Warning Centre (PTWC) issued an ‘Expanding Tsunami Regional Warning – Initial’ on Saturday 27 February 2010 at 19:47.
Based on initial scientific advice from GNS Science that the earthquake was unlikely to have caused a tsunami that would pose a threat to New Zealand, the Ministry of Civil Defence and Emergency Management (MCDEM) issued a "National Advisory: Tsunami - No Threat to New Zealand" at 20:38 hrs, 27 February 2010. Following further assessment by the GNS-convened Tsunami Experts' Panel, and observations of wave activity from close to the earthquake, at 23:18 hrs on 27 February 2010 MCDEM issued a national warning stating that waves of up to 1 metre high were likely for the eastern and later the entire New Zealand coast. A subsequent warning message issued by MCDEM at 1:06 hrs 28 February 2010 noted that some land threat also existed (i.e. wave heights between 1 and 3 metres) for the Chatham Islands and Banks Peninsula. It also stated that based on historical events it was expected that the greatest wave heights would occur between 6 and 12 hours after the initial arrivals.
The Emergency Operating Centres at Central Hawke’s Bay, Hastings and Wairoa District Councils and Napier City Council, as well as the Hawke’s Bay CDEM Group Centre were all operatational during this event.
By 03:00 all vessels at the Port of Napier had been asked to depart and by 06:30 all ships were clear of the port, proceeding to water depth of > 30 metres and the port closed until tsunami risks eased to workable level.
All Councils notified affected coastal communities and where appropriate instigated access restrictions to beaches and boat launching ramps which were monitored by NZ Police and/or CDEM staff. Police and the Fire Service went door-knocking in the coastal communities of Te Awanga, Haumoana, Clifton and Whirinaki warning residents it would be a good idea to leave and Hastings District asked Te Awanga residents with homes right on the beach to self-evacuate just before 09:00. The coastal settlements of Ocean Beach and Waimarama were also evacuated. The remainder of the response activities were involved in information collection and dissemination.
At 09:37 on Sunday 28 February a regional warning confirmed the first wave had arrived at Napier at a height of 0.2metres, followed by a surge of waves around the Ahuriri Harbour. The tsunami was observed in Hawke's Bay with vertical changes in water levels around the coast and in harbours of around 1 metre.
By mid afternoon on Sunday, CDEM had downgraded the tsunami warning to an alert, while still advising that sea levels could change quickly for up to 24 hours from the initial surge.
The tsunami warning was cancelled for all countries except Japan and Russia in PTWC Bulletin 18 of 00:12 UTC on 28 February 2010, and the Ministry of Civil Defence & Emergency Management issued a cancellation of the National Tsunami Potential Threat at 08:35 on 1 March 2010.

4 April 2010
Abbreviations
Abbreviation Meaning
CDEM Civil Defence Emergency Management
HBRC Hawke’s Bay Regional Council
NZDT New Zealand Daylight Time
PTWC Pacific Tsunami Warning Centre
Pre-Event
Normal tides were expected, high tide at Napier was expected at 05:32 NZDT 1.8 metres and low tide at 1151 NZDT 0.1 metres.and there were no weather warnings in place.
Response
On Sunday 28 February 2010 at 00:02hrs the Duty Manager for the Hawke’s Bay Civil Defence Emergency Management Group received a National Warning from the Ministry of Civil Defence Emergency Management advising of a ‘Tsunami Threat to New Zealand’.
The Pacific Tsunami Warning Centre (PTWC) had issued a Tsunami Information Bulletin for New Zealand in response to the earthquake below:
Origin time: 06:34 Z
NZ time: 1934 Hrs NZDT
Co-ordinates: 36.1 South 72.6 West Depth: 55 km
Location: Near Coast of Central Chile
Magnitude: 8.8
The Ministry advised a tsunami had been generated and the first wave may arrive in New Zealand in the areas around Chatham Island (Waitangi, Western Side) at approximately 07:05 NZDT 28/02/2010. The travel and arrival times that had been calculated for the rest of New Zealand, included the following prediction for Napier: Location Place Travel Time Arrival Time -39.5000 176.9000 Napier 12:49 8:23 (NZDT)
The Duty Manager for the Hawke’s Bay Civil Defence Emergency Management Group sent out a regional warning at 00:16. At 00:03 the Emergency Management Coordinator rang the Duty Manager, Harbour Master, HBRC Incident Controller and opened the HBRC Emergency Operations Centre by 01:00 on Sunday, 28 February. A 2nd National Warning “Tsunami Threat to New Zealand. Update Tsunami Confirmed” was received at 01:11 and a Regional Warning was forwarded on at 01:19. It noted that some land threat also existed (i.e. wave heights between 1 and 3 metres) for the Chatham Islands and Banks Peninsula. It also stated that based on historical events it was expected that the greatest wave heights would occur between 6 and 12 hours after the initial arrivals.

5 April 2010
The Hawke’s Bay Regional Council Incident Controller, Gary Clode and staff accessed threat information using their Tsunami Standard Operating Procedures and calculated possible run-up heights for Hawke’s Bay. A 3rd National Warning was received at 02:13 and Regional Warning sent out at 02:15, followed by a further Regional Warning at 02:30 with specific advice for Hawke’s Bay (Figure 1). At 03:00 all vessels at the Port of Napier had been asked to depart. The first wave was estimated to arrive at Napier at approximately 08:23 NZDT (at Gisborne approximately 07:59 NZDT). High Tide at Napier was at 05:32 NZDT 1.8 metres and Low Tide at 11:51 NZDT 0.1 metres. The Hawke’s Bay Regional Council staff estimated the wave height would be 1 metre water level at that time. There were a number of agencies involved in the response including Central Hawke’s Bay District Council, Hastings District Council, and Hawke’s Bay Regional Council, Napier City Council and Wairoa District Council, New Zealand Police, Eastern Fire Region and Port of Napier Limited.
Figure 1: Copy of Regional Warning sent out 2:30am Sunday, 28 February 2010 from the Hawke's Bay Regional Council
The Emergency Operating Centres at Central Hawke’s Bay, Hastings and Wairoa District Councils and Napier City Council, as well as the HB CDEM Group Centre were all operated during this event.
The first media release from the Hawke’s Bay CDEM Group was issued at 03:15 and Andrew Newman took up the first shift as Group Controller at 04:00 and participated in a National Conference Call at 04:30. This was followed by a meeting of the Hawke’s Bay Emergency Services Coordinating Committee.
At 06:00 Regional Council staff closed boat ramps and warned recreational boaties not to go to sea. They remained posted at ramps throughout most of the day. By 06:30 all ships were clear of the port, proceeding to water depth of > 30m and port remained closed until tsunami

6 April 2010
risks eased to workable level. HarbourMaster commenced notifying Napier Inner Harbour berth holders and commercial fishing companies of tsunami risk to their vessels. At 09:30 the Port was evacuated of all personnel apart from four key staff including the Harbour Master. This included stevedores and reefer care personnel.
All Councils notified affected coastal communities and where appropriate instigated access restrictions to beaches and boat launching ramps which were monitored by NZ Police and/or CDEM staff. Police and the Fire Service went door-knocking in the coastal communities of Te Awanga, Haumoana, Clifton and Whirinaki warning residents it would be a good idea to leave. Hastings District asked Te Awanga residents with homes right on the beach (21) to self-evacuate just before 09:00. The coastal settlements of Ocean Beach and Waimarama were also evacuated. The remainder of the response activities were involved in information collection and dissemination.
The Pacific Tsunami Warning Centre issued a map showing the estimated tsunami travel times (Figure 2).
Figure 2: Outline of estimated tsunami travel times
At 08:01 National Warning No. 9 was received from the Ministry confirming the following: “As at 0735 NZDT 28 February 2010 wave activity was confirmed on the coastal tsunami gauge at the Chatham Islands. At this stage, the change in sea level measured is approximately 0.2 metres. It is important to note that this is the first arrival and larger waves may follow over a period of several hours. The situation continues to be closely monitored.” Based on the actual arrival time in the Chatham Islands, the Ministry updated indicative arrival times estimating wave arrival at Napier at 0853 NZDT 28 February 2010. At 09:37 a regional warning confirmed the first wave had arrived at Napier at a height of 0.2metres and by 12:59 Regional Warning No. 14 confirmed significant surges were still occurring at the Port of Napier with up to 0.7 metre variance within one hour. The recordings taken at the Port of Napier Wave Buoy are shown in Figure 7.

7 April 2010
At 12:00 Hastings District gave advice that the more than 200 people who self-evacuated to Haumoana School may return home but need to refrain from seaside activities and keep away from the lower reaches of the rivers. Other Council also advised people who had self evacuated from their coastal homes they could return home but should stay away from the beach for the rest of the day. Boaties were advised of the need to take extra care launching or coming back in as strong currents and tidal effects would continue for up to 12 hours. By late afternoon local CDEM staff stepped down their tsunami watch but continued to monitor the situation. CDEM Officials continued to repeat earlier warnings for Hawke's Bay people to stay away from beaches and estuaries for the rest of the day. On Monday, 1 March 2010 at 01:30 the port was reopened by the Harbourmaster and normal shipping movements resumed and by 08:35 the National Advisory of Tsunami Potential Threat was cancelled. A declaration of local emergency was not made for this event. None of the Hawke’s Bay Territorial Local Authorities made emergency expenditure claims to the Ministry of Civil Defence & Emergency Management, as no expenditure in either category “A” or “B” was incurred.
Hawke’s Bay Regional Council did not make a claim, as no expenditure in either category “A” or “B” was incurred.
Tsunami Observations
The tsunami was seen in Hawke's Bay with changes in water levels around the coast and in harbours of around 1 metre. Wave surges were seen around Ahuriri Harbour as were abnormal water level and wave patterns along the coast. A member of the Napier Sailing Club, Jeff Lynex took pictures showing the changes in water level (Figure 3). The 1st picture taken at 14:41 hours compares with the 2nd taken at 15:04 (23 minutes later). The 3rd picture taken at 15:22 shows a subsequent drop 18 minutes later which he measured at 1.42 metres. Mr Lynex prepared an observation report which is included in Annex A of this report.
Figure 3: Changes in water levels graphically shown in the Inner Harbour at Napier on a
floating pontoon.
In Waimarama, a man Leon Mickelson was fishing for paua when he was swamped by a metre-high surge of water, followed by two more waves. He had no idea a tsunami alert had been issued. He was quoted by the media (Annex D) as follows:
14:41 15:04 15:22

8 April 2010
"This wall of water just hit me. I was getting tumbled across all the rocks, it was unbelievable. The force was just unstoppable. There was no way you could fight it, you just had to roll with it." He reported the water then sucked him 20 metres out into the ocean, bouncing over rocks. "It was like being in a washing machine. It just completely and utterly caught us out." Mr Mickelson, 30, managed to swim ashore, and suffered cuts and bruises.
Social and Economic Effects
Number of Casualties
There were no casualties, injuries, or deaths as a result of this tsunami event.
Rescues and/or Evacuations
People from twenty one houses at Te Awanga were asked to self-evacuate as a precautionary measure and many coastal residents in Te Awanga, Haumoana, Clifton and Whirinaki, Ocean Beach and Waimarama also self-evacuated. The media reported about 300 people in total were moved out of coastal settlements around Haumoana, in Hawke's Bay, for a few hours.
Number of houses
No houses were destroyed or damaged as a result of this tsunami event.
The Earthquake Commission (EQC) received less than 10 claims nationally for this event, but none from the Hawke’s Bay.
No information on the cost to insurers was obtained.
Other Buildings
No reports of other buildings destroyed or damaged as a result of this tsunami event.
Forestry & Conservation Assets
No forestry areas or conservation areas were significantly affected or impacted as a result of this tsunami event.
Number of farms
No farms were significantly affected or impacted as a result of this tsunami event.
Number of businesses
The business most affected by this tsunami event was the Port of Napier Limited. While operations were delayed, it was still affective. Nevertheless the estimated total cost of losses to their business is between $80,000 - $100,000. Losses were incurred as a cruise vessel was not able to enter the port and another vessel that chose to not re-enter the port and reduced its visit by 3 days. This loss includes labour that was ordered and stood down when vessels were unable to work but which still had to be paid. Also the extra costs of pilotage (pilot, tugs/crew and launch/crew) with taking the vessels out and then bringing them back into the Port once the all-clear was given by the Harbour Master.
No other significant impacts on business were reported.
Infrastructure – Bridges and Culverts
There was no reported damage to bridges or culverts. There were reports of strong currents under the Westshore Bridge in Napier (Figure 4).
Infrastructure – Roads
No state highways or roads were closed.

9 April 2010
Infrastructure – River, Lake & Coastal Protection Works
There was no damage caused to river or coastal protection works.
Figure 4 Strong currents from the tsunami move under the Westshore Bridge, Napier.
Other Infrastructure
No damage or problems were reported to any telecommunications infrastructure, water supplies, power generation assets, electricity supply or gas reticulation networks.
No damage or problems were reported to any airports, ports, other significant fixed assets such as marinas, marine farms, wharves and jetties.

10 April 2010
Event Data
Earthquake
The 8.8 earthquake was the fifth largest recorded world-wide since seismograph recordings began (Figure 5). It struck at 03:34 local time at the epicenter, rupturing a section of the plate boundary 500km long and 100km deep beneath the offshore and coastal regions of central Chile. Strong shaking lasted for more than 90 seconds affecting approximately 80% of Chile’s population and damaging at least 200,000 households. The fault rupture also warped the ocean floor and produced local tsunami waves that were devastating at various points along the coast in Chile as well as sending tsunami across the Pacific.
Figure 5: Chile Earthquake Details from USGS Website http://www.usgs.gov/

11 April 2010
Waves & Surges
A tsunami warning was first declared for Chile and Peru, and a tsunami watch for Ecuador, Colombia, Antarctica, Panama and Costa Rica. The warning was later extended to a Pacific Ocean-wide warning, covering all coastal areas on the Pacific Ocean except the west coast of the United States, British Columbia, and Alaska.
Figure 6: Tsunami Energy Flux by Isaac Fine (IOS) Chilean tsunami Feb 27 2010
The national tsunami warning advised the Tsunami Experts Panel estimated there was a marine threat (i.e. threat to beach and small boats corresponding to wave heights less than 1 metre) for the entire east coasts of the North and South Island of New Zealand.
Recordings on the New Zealand Tsunami Gauge Network showed fluctuations around 1 metre (Figure 7), while the Port of Napier Wave Buoy showed surges up to 1.2 metres (Figure 8).
Figure 7: Recordings of New Zealand Tsunami Gauge Network on 1 March 2010 showing the
changes in relative sea level for the 36 hours previous.

12 April 2010
Figure 8: Port of Napier Wave Buoy Recordings
The tsunami also caused a series of surges in the inner habour at Napier. The surges started at about 09:00 on Sunday 28 February (about 14 hours after the earthquake) and carried on for several days. Peak surges were just over 1 m (peak to trough, approximately 0.5m above water level at time), with a cycle time of about a 40 minutes. HBRC had recently developed a 2D model of the Napier Inner Harbour and Main Outfall Channel and results from the 2D model run indicate excellent correlation with observations. A comparison of the water level at the outfall channel recorder is shown in Figure 9.
Figure 9: Comparison of Actual and Modelled Water Level at Outfall Recorder by HBRC
Several visual observations in the inner harbour near the Napier Sailing Club were also compared to model results, as shown in Figure 10.

13 April 2010
Figure 10: Comparison of Actual and Modelled Water Level at Inner Harbour by HBRC
Figure 11: Disturbed currents and discolouration of water at entrance to Inner Harbour at 1345
on 28th February 2010 taken by Acting Harbour Master John Paston
14 April 2010
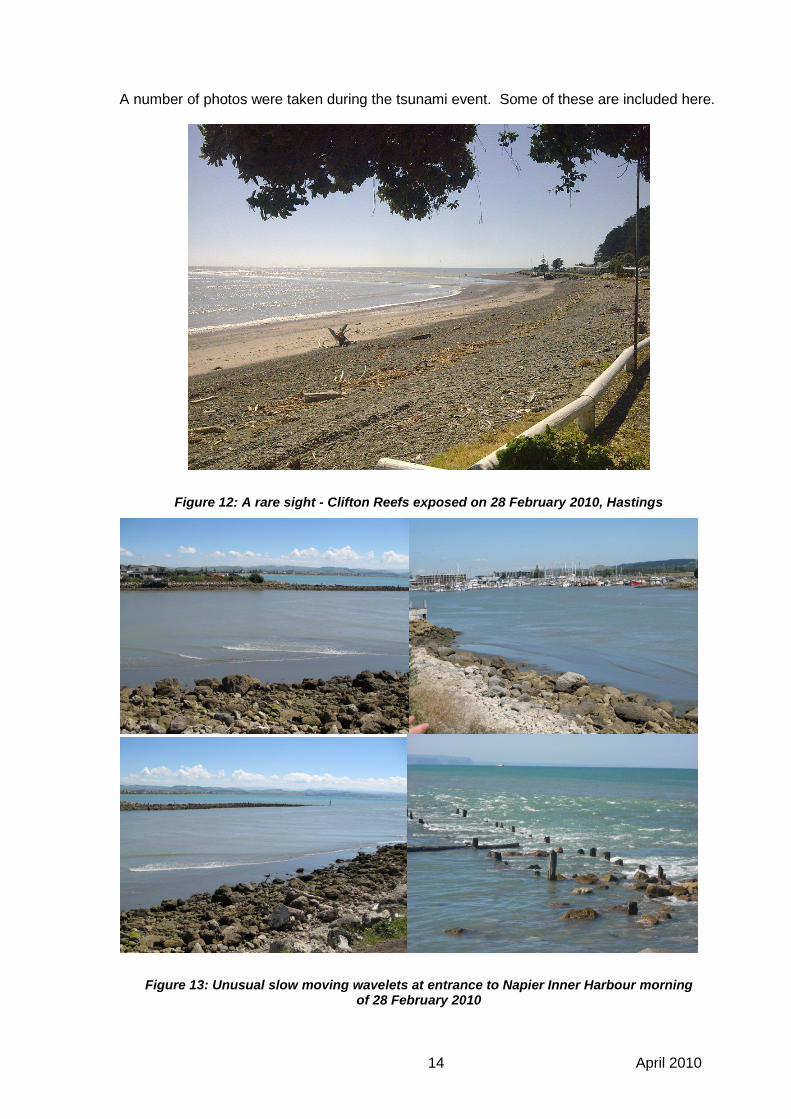
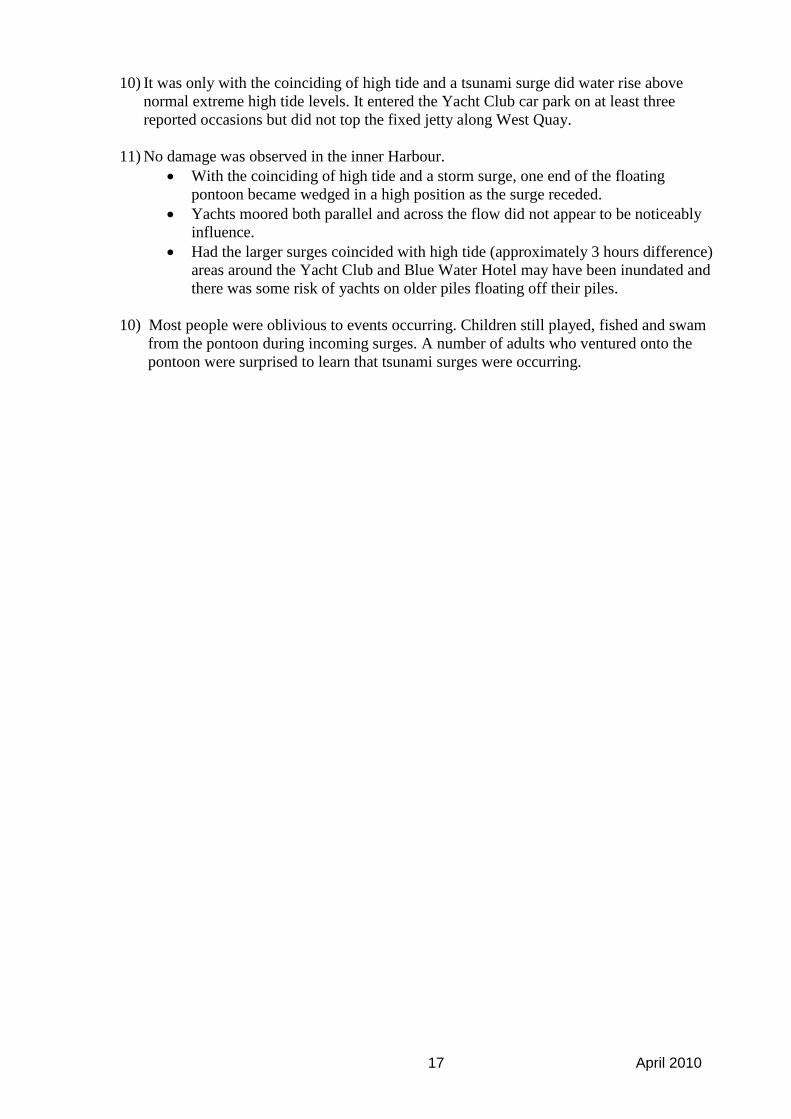
A number of photos were taken during the tsunami event. Some of these are included here.
Figure 12: A rare sight - Clifton Reefs exposed on 28 February 2010, Hastings
Figure 13: Unusual slow moving wavelets at entrance to Napier Inner Harbour morning of 28 February 2010

15 April 2010
Annexes
A: Other Reports Produced
The following reports were produced following this tsunami event:
‘Tsunami Surges at Port Ahuriri’ an observation report prepared by Jeff Lynex
B: Scientific Studies
No scientific studies have been completed or commissioned at the writing of this report.
C: Log of Events
Attached is a log of events provided by the Harbour Master.
D: Newspaper Articles
A copy of a Dominion Newspaper article dated 1 March 2010.

16 April 2010
Annex A
Tsunami Surges
Port Ahuriri, 28 February 2010
Summary of Observations made by Jeff Lynex, Teacher at Karamu High
School, Hastings and member of the Napier Sailing Club.
Note:
Most observations were made from the floating pontoon where the Hawke’s Bay Wine
Country Cat berths; this is to the north of the West Quay wharf and just south of the entrance
to the Iron Pot. Google Earth gives the position as 39o 28’ 54.22”S and 176
o 53’ 40.75” E.
1) Comparison of events at the Wave Buoy and the inner Harbour suggest that arriving
surges took approximately 8 to 10 minutes to travel from the buoy to the observation
point.
2) The first smaller surges of less than 0.5 metres recorded by the Wave Buoy were
noticeable only as very small wavelets (a result of meeting of outflow and incoming
surge??) and the flow was non-turbulent.
3) The larger surges of 0.6+ metres tended to be swirling; wavelets were not observed in
these instances.
4) The surges tended to be crescent shape – slowing rising with the incoming surge but then
dropping before the last of the surge passed. There was no evidence of rise or steepening
of the surge in shallows (e.g. outside the Game Fishing Club or the opposite side of the
channel).
5) The maximum variation - as measured by tape against the wetted area of a pile - was 1.42
metres and another was measured at 1.00 metres. Comparative photo studies suggest this
occurred for a number of waves. This suggests some amplication of the wave as recorded
at the wave buoy; this may be due to an incoming surge arriving before the lagoon had
drained completely, or the shape of the outer coastline/bay.
6) Larger surges took approximately 20 to 23 minutes to rise from the maximum outflow
(low point) to the crest (high point).
7) Surges were flowing at an estimated 4 to 5 knots (based on sailing experience). As surges
generally took up to 30 minutes to pass completely, this suggests a wavelength of 2 to 2.5
n/miles or 3.5 to 4 kilometres.
8) Sediment scouring from the upper harbour was obvious in outflow following the first
small wave and arrival of the second. The wave buoy suggested a fall of approximately
0.8 metres due to tsunami action and tidal fall.
9) The volume of water coming in with each surge was sufficient to clear the (490m as
measured from Google Earth) channel of silted water with clean water.
17 April 2010
10) It was only with the coinciding of high tide and a tsunami surge did water rise above
normal extreme high tide levels. It entered the Yacht Club car park on at least three
reported occasions but did not top the fixed jetty along West Quay.
11) No damage was observed in the inner Harbour.
With the coinciding of high tide and a storm surge, one end of the floating
pontoon became wedged in a high position as the surge receded.
Yachts moored both parallel and across the flow did not appear to be noticeably
influence.
Had the larger surges coincided with high tide (approximately 3 hours difference)
areas around the Yacht Club and Blue Water Hotel may have been inundated and
there was some risk of yachts on older piles floating off their piles.
10) Most people were oblivious to events occurring. Children still played, fished and swam
from the pontoon during incoming surges. A number of adults who ventured onto the
pontoon were surprised to learn that tsunami surges were occurring.

18 April 2010
Annex A
Tsunami Photo Details by Jeff Lynex
Port Ahuriri, 28 February 2010 In coming surges appeared to approximately 10 to 12 minutes after recording at wave buoy.
Photo
No. Time Tide Comment Flow
01 09.22 Falling Pleasure craft heading out – wavelets/ripples possible sign of first wave??
In?
02 09.31 First sign of possible increase in out-flow under bridge Out
03 09.34 First noticeable sign of out-flow (and incoming surge?) at channel entrance
04 09.35 Outflow (and incoming surge?) at channel entrance noticeable
05 09.38 As above
06 09.42 Outflow from under bridge very apparent
07 09.46 First evidence in basin of sediment scouring from upper harbour
08 09.48 Sediment scouring continues towards channel entrance
09 10.24 Outflow and probably incoming surge very noticeable (Wind on moving water?)
Out
10 10.30 First noticeable surge; slow moving wavelets with non-turbulent flow
In
11 10.43 First surge is noticeable as a series of very small waves In
12 10.51 Outflow noticeable Out
13 11.16 Drying of beach opposite noticeable
14 11.17 Draining from upper lagoon noticeable – beyond bridge Pandora Pond exposing
Out
15 11.20 New surge as series of small waves – not a swirling surge as later In
16 11.20 Water on beach opposite up In
17 11.44 Half metre drop in upper harbour (Site opposite side of Harbour to other photos)
Out
18 11.46 Flow noticeable despite incoming tide (Site opposite side of Harbour)
Out
19 11.59 Low Beach opposite dry (Back to main observation site) Out
20 11.59 Outgoing flow? Wavelets
21 12.00 Beach outside Game Fishing Club exposed Out
22 12.07 Tide
Rising Incoming wave now noticeable a swirling inflow In
23 12.07 Video of swirling at entrance to Iron Pot In
24 12.26 Discolored outflow Out
25 12.34 Meeting of the waters (in and out?)
26 12.34 Meeting of the waters (in and out?)
27 12.37 Beach opposite exposed to rocks – beyond low tide level
28 12.39 Beach alongside Game Fishing club exposed
29 12.41 Beach opposite exposed to rocks – beyond low tide level Out

19 April 2010
30 13.28 Low point
31 13.30 Beach and boat opposite just about minimum Out
32 13.34 Rising Surge very noticeable as a swirling inflow of water (note kids) In
33 13.43 As above
34 13.43 As above In
35 13.45 Beach and boat opposite just after maximum - beach just beginning to expose
Out
36 13.58 Low Point Out
37 14.18 High Point In
38 14.38 Inner Harbour Low
39 14.41 Low Point Out
40 15.04 High Point In
41 15.22 Low Point - Difference between high and low measured at 1.42metres
Out
42 15.23 Low Point
43 15.46 Following surge maximum
44 1806 High Pontoon jammed as a result of surge and high tide coinciding
45 1829 Diners semi oblivious to events
46 1839 Possible max (wetted area) on fixed wharf with high tide and surge
47 1839 Drop despite surge still incoming
48 1858 Evidence of flooding in Yacht Club car park (x3) with high tide and surge
49 1859 Wetted area of old piles showing tide and surge brought float approx 0.5m
50 1906 Falling New piles suggest considerable leeway
Map Predicted surge height
Map Travel times

20 April 2010
Port Ahuriri, 28 February 2010 Annex A
01 09:22 02 09:31
03 09:34 04 09:35
05 09:38 06 09:42
07 09:46 First discolouration noticed 08 09:48 Scoured sediment from upper harbour

21 April 2010
Port Ahuriri, 28 February 2010 Annex A
09 10:24 Outflow noticeable 10 10:30 1st
surge noticeable as small wavelets
11 10:43 First surge as series of small waves 12 10:51 Outflow
13 11:16 Drying of beach opposite 14 11:17 Outflow from lagoon
15 11:20 16

22 April 2010
Port Ahuriri, 28 February 2010 Annex A
17 11:44 0.5 metre drop 18 11:46 Outflow under bridge
19 Water low on beach 20 11:59
21 12:00 22 12:07
24 12:26 25 12:34

23 April 2010
Port Ahuriri, 28 February 2010 Annex A
26 12:34 27 12:37
28 12:39 29
30 13:28 Low 31 13:28 Low

24 April 2010
Port Ahuriri, 28 February 2010 Annex A
32 13:34 Incoming surge 33 13:34 (compare 30)
34 13:43 35 13:45
36 13:58 Out 37 14:18 In (Compare 36 (change in 20 mins)

25 April 2010
Port Ahuriri, 28 February 2010 Annex A
38 14:38 39 14:41 Out compare 37 (23 mins) Measured
1.00m
40 15:04 41 15:22 Out 1.42 metre drop in 18 mins
42 15:23 Out 43 15:46 In compare 42 (23mins later)

26 April 2010
Port Ahuriri, 28 February 2010 Annex A
44 18:06 Pontoon jammed after high tide & surge 45 18:29 Diners seem oblivious to event
46 18:39 47 18:39
48 18:58 Flooding in Yacht Club Car Park 49 18:59
50 19:06

27 April 2010
Annex C Copy of email from Regional Harbour Master

28 April 2010
Annex D
Diver swept away by wall
of water By BRITTON BROUN, TOM HUNT and TIM
DONOGHUE - The Dominion Post
Last updated 05:00 01/03/2010
EVA BRADLEY
COSTLY CATCH: Leon Mickelson suffered cuts and bruises when he was swept over rocks
as he gathered paua at Waimarama.
A day after hundreds fled their seaside homes to escape a tsunami, people have been warned
to stay away from the water, with massive earthquake aftershocks possible in Chile and the
seas continuing to surge.
The death toll in Chile is also expected to rise, with at least 300 reported dead last night after
Saturday's 8.8-magnitude earthquake, the seventh-largest on record.
The earthquake devastated Concepcion, Chile's second-largest city, and generated a tsunami
that swept across the Pacific before hitting New Zealand yesterday morning.
It caused tidal surges of close to 1.5 metres in Napier and more than a metre on the
Canterbury coast.
Leon Mickelson was fishing for paua at Red Rock Beach in Hawke's Bay when he was
swamped by a metre-high surge of water, followed by two more waves. He had no idea a
tsunami alert had been issued.
"This wall of water just hit me. I was getting tumbled across all the rocks, it was
unbelievable. The force was just unstoppable. There was no way you could fight it, you just
had to roll with it."
The water then sucked him 20 metres out into the ocean, bouncing over rocks. "It was like
being in a washing machine. It just completely and utterly caught us out."
Mr Mickelson, 30, managed to swim ashore, and suffered cuts and bruises.
Lower Hutt teacher Joe Nawalaniec was left clinging to rocks near Cape Turnagain in
southern Hawke's Bay when the surge hit.
"The water went milky and turbulent like it was boiling," he said.
"It's just a massive big surge of water that starts going up and up and up. You expect it to be
a tidal wave but it's not a wave at all."
The 45-year-old paua fisherman was aware of the tsunami alerts but thought the wave had
passed by.
Diane Ross, from Waikanae Beach Holiday Park in Gisborne, helped evacuate hundreds of
people from the beachfront property at 6.45am to a marae on higher ground.
She was stunned by what had happened to Gisborne Harbour while the Turanganui River –
which connects the harbour to the open sea – was virtually drained.
"I was blown away by how low the tide was and 15 minutes later it was all back again. The
river dropped 1.5 metres in 10 minutes. It was really scary."

29 April 2010
She said the tsunami threat was taken seriously, with the normally crowded beach empty
yesterday.
At least 50 other Gisborne locals, and some families up the coast, were moved from their
homes until the afternoon.
About 300 people were moved out of coastal settlements around Haumoana, in Hawke's Bay,
for a few hours. Passenger ships and navy frigates in Auckland harbour left their moorings
for deeper water.
Interislander ferries had to go through the Northern Passage after Tory Channel was closed.
Ferry trips were delayed and trains operating on the coast stopped at the time the first surges
hit.
Though the waves ranged from 30cm in Wellington to a metre in Gisborne Harbour and
around Akaroa, near Christchurch, they were much more dramatic in the Chatham Islands,
where swells of up to three metres were recorded.
Chatham Hotel owner Valentine Croon woke his 40 guests at 5am. "We thought nothing was
going to happen, then [Petre] Bay emptied right out at about 8.30am. Everyone took it pretty
seriously."
Civil Defence Minister John Carter said the tsunami warning system worked well, five
months after it was heavily criticised in the wake of the Samoan tsunami.
Though the tsunami warning was called off yesterday afternoon, Civil Defence warned
people to keep away from the water, with more waves possible today.