measurements and impacts of the chilean tsunami of may ...the tsunami caused by this earthquake was...
TRANSCRIPT

Measurements and Impacts of
the Chilean Tsunami of May 1960
in New South Wales, Australia
VERSION 1.0
DATE April 2009
CLASSIFICATION NON-SENSITIVE
NON-SENSITIVE
NSW STATE EMERGENCY SERVICE 2009 NON-SENSITIVE Page 2 of 42
Document Details
Statement of Confidentiality This document is classified as Non-Sensitive .
Title Measurements and Impacts of the Chilean Tsunami of May 1960 in
New South Wales, Australia
Author B.Beccari
Document Owner Manager Planning
Approving Authority Director, Emergency Risk Management
Date Approved 22/06/09
Version Final
Part of File Number 08/0576
Electronic Location SES Online
Report Reference NSW State Emergency Service (2009) Measurements and Impacts of the Chilean
Tsunami of May 1960 in New South Wales, Australia. Report by NSW SES, State
Headquarters.

NON-SENSITIVE
NSW STATE EMERGENCY SERVICE 2009 NON-SENSITIVE Page 3 of 42
Abstract An extensive search was undertaken to examine the history of the tsunami of the 23rd and 24th of May
1960 which impacted the New South Wales (NSW) Coast. A much more detailed account of the
tsunami has been presented than was previously available.
The observed characteristics of the tsunami varied widely based on location although in all instances
the tsunami’s greatest effects did not occur until many hours after it first arrived. Wave amplitudes of
up to 0.85m were recorded and potentially reached much higher, up to 4.3m in isolated locations.
Damage was limited primarily to vessel moorings, although the oyster industry did suffer some losses.
There were two unconfirmed reports of minor injury and some reports of people having to flee
beaches and tidal rock shelves indicating that the tsunami did create a risk to life along the coast of
NSW. Implications of this research on modern risk assessment for the state are examined.
Acknowledgements This work would not have been possible without the input of personal accounts from individuals and
the collective research efforts of museums and historical societies in coastal NSW. Specifically the
author would like to thank Andrew Gissing, Steve Opper, and Jean Tyacke (NSW SES), James Goff
(UNSW) Bruce Hamon (CSIRO rtd.), Anne Felton (ANU), Peter Davidson (MHL), Maree Whittaker-
Jones (RAN), Alan Clark (South Coast Register), Jody White (Eden Killer Whale Museum), Josephine
Clark (NSW Maritime), Kathy Brown (NSW DPI), David Hanslow (NSW DECC), Kimberly
O’Sullivan Steward (Waverley Library), John Morcombe (Manly Daily), George Cresswell (CSIRO),
Tony Dawson, Wendy Simes, Vicki-Anne Williamson, Billie Crawford and Lyn Workman.

NON-SENSITIVE
NSW STATE EMERGENCY SERVICE 2009 NON-SENSITIVE Page 4 of 42
Table of Contents
1 INTRODUCTION AND BACKGROUND ..................................................................................................................... 5
2 THE TSUNAMI RISK IN NEW SOUTH WALES ........................................................................................................... 5
3 HISTORICAL EVIDENCE OF TSUNAMI IN NEW SOUTH WALES ................................................................................ 6
4 THE CHILEAN TSUNAMI OF 23RD MAY 1960 ......................................................................................................... 7
5 METHODOLOGY .................................................................................................................................................... 8
6 RESULTS ............................................................................................................................................................... 10
7 DISCUSSION ......................................................................................................................................................... 11
PERIOD .............................................................................................................................................................................. 12
WAVE AMPLITUDE ............................................................................................................................................................... 13
PENETRATION OF THE TSUNAMI ALONG COASTAL HARBOURS AND RIVERS. ...................................................................................... 16
LAND INUNDATION .............................................................................................................................................................. 17
BOATING ............................................................................................................................................................................ 18
AQUACULTURE .................................................................................................................................................................... 19
8 CONCLUSION ....................................................................................................................................................... 21
9 REFERENCES ......................................................................................................................................................... 22
APPENDIX A: DESCRIPTION OF THE EFFECTS OF THE MAY 1960 TSUNAMI IN NEW SOUTH WALES .............................. 27
NEWCASTLE/HUNTER RIVER .................................................................................................................................................. 29
BROKEN BAY/HAWKESBURY RIVER.......................................................................................................................................... 30
MANLY .............................................................................................................................................................................. 30
MIDDLE HARBOUR ............................................................................................................................................................... 30
THE SPIT/CLONTARF ............................................................................................................................................................ 31
SYDNEY HARBOUR ............................................................................................................................................................... 32
GEORGES RIVER................................................................................................................................................................... 32
CRONULLA/PORT HACKING ................................................................................................................................................... 32
BATEMANS BAY-CLYDE RIVER ................................................................................................................................................ 33
APPENDIX B: OBSERVATION SITES OF THE MAY 1960 TSUNAMI IN NSW ..................................................................... 36

NON-SENSITIVE
NSW STATE EMERGENCY SERVICE 2009 NON-SENSITIVE Page 5 of 42
1 INTRODUCTION AND BACKGROUND
The Indian Ocean Tsunami of 2004 has prompted a worldwide, and particularly in Australia, surge
of interest and research into the tsunami hazard. Most recent Australian research has focussed on
cataloguing previous tsunami (Allport and Blong 1995; Dominey-Howes 2007), hazard definition
and risk assessment (Rynn and Davidson 1999; Nielsen et al. 2006), development of warning
systems (Allen and Greenslade 2008) and the emergency management of tsunami (Bird and
Dominey-Howes 2006; Gissing et. al. 2008; Opper and Gissing 2005). Aside from research
examining paleo-tsunami (Dominey-Howes et al. 2006; Glikson 2006; Bryant and Nott 2001; Young
et al. 1997) little published work details the effects of tsunami on the Australian coastline in modern
times. Whilst the number and magnitude of tsunami events affecting the eastern seaboard of
Australia has been small, a study of one such event could assist tsunami researchers and emergency
managers in model calibration, risk assessment and community education. Research into the 1960
tsunami in Hilo, Hawaii, identified numerous issues crucial to successful tsunami risk mitigation and
demonstrated the usefulness of personal accounts in tsunami research (Johnston 2003; Dudley et al.
in review). This research aims to present a case study of one such historical event.
This research was limited to the tsunami impact. Aspects relating to warning and the emergency
management response were not researched though some aspects of the community response will be
discussed.
2 THE TSUNAMI RISK IN NEW SOUTH WALES
All estuarine and other low lying coastal areas may be at risk of a tsunami. Local, regional and
distant tsunami may impact NSW.
Due to the remoteness from tectonic plate boundaries local tsunami would most likely be generated
by submarine landslides. Bathymetric surveys have found numerous slope failures along the margin
of the continental shelf and areas with potential for future slope failure, some of which are adjacent
to major coastal population centres. (Glenn et al. 2008).
Regional tsunami that could have a destructive impact on NSW may be generated on a number of
subduction zones in the South West Pacific. These are the New Hebrides Trench, the Tonga-
Kermadec Trench north of New Zealand, and the Puysegur Trench south of New Zealand

NON-SENSITIVE
NSW STATE EMERGENCY SERVICE 2009 NON-SENSITIVE Page 6 of 42
(Working Group on Tsunami to the Prime Minister’s Science, Engineering and Innovation Council
2005).
NSW is also exposed to numerous distant tsunami sources including South and Central America,
Cascadia, the Aleutian Islands and Japan. Since European colonisation it is the Peru-Chile Trench
that has generated the majority of the largest tsunami measured along the NSW coast.
New South Wales is a coastally oriented state with a large portion of the population using coastal
areas for residence, employment or recreation. As an indication of the vulnerability to coastal
hazards, including tsunami, within 1km of the coast and below about 10m above mean sea level,
there are:
• A population of 328,800 (5.2% of the State’s population). This population grows significantly
during the summer holidays with many holidaymakers visiting the coastal fringe including up to
220,000 beachgoers during peak holiday periods.
• 160,700 dwellings.
• 225 caravan parks and camping grounds.
• 308 educational and child care facilities.
• 9 hospitals.
• 56 aged care facilities.
(New South Wales State Emergency Service 2005; Surf Life Saving NSW 2008)
The location of these elements combined with a low perceived risk of tsunami (Bird and Dominey-
Howes 2006) leads to a very high vulnerability of coastal communities to this hazard.
3 HISTORICAL EVIDENCE OF TSUNAMI IN NEW SOUTH WALES
Historical records and research into paleotsunami have identified 44 individual tsunami events that
have been recorded in NSW between 105,000 years BP and June 2006 (Dominey-Howes 2007). The
majority of tsunami that have occurred since European colonisation of NSW have been barely
noticeable, recorded only on tide gauges. Four notable events have impacted NSW in this time
period. The Chilean Earthquake Tsunami of 14th of August 1868 was recorded in Newcastle and
Sydney where a number of boats broke from their moorings. In 1877 a tsunami with its source in
North Chile caused some tidal fluctuations and minor disturbances in Sydney and Newcastle
NON-SENSITIVE
NSW STATE EMERGENCY SERVICE 2009 NON-SENSITIVE Page 7 of 42
harbours. The tsunami caused by the eruption of Krakatau on the 27th of August 1883 was also
observed in Sydney and Newcastle though no damage was reported. (Allport and Blong 1995).
The Tsunami of May 1960 was chosen for this research to assist emergency planners to better
understand the potential effects of tsunami upon the NSW coastline. The 1960 tsunami is also the
only tsunami within living memory of NSW residents which had significant impacts, making it the
most suitable event to investigate because of the potential for acquiring additional data from
personal observations.
4 THE CHILEAN TSUNAMI OF 23RD MAY 1960
The tsunami was caused by a 9.5Mw earthquake which occurred at 1911 UTC on the 22nd May
(0511 on the 23rd of May AEST) off the coast of southern Chile. This was the largest earthquake
that has been instrumentally recorded and was preceded by 4 earthquakes of magnitude 7Mw or
greater and followed by many aftershocks. Over 1000km of fault line was ruptured by this series of
earthquakes. These earthquakes occurred along the Peru-Chile Trench an active subduction zone
with significant historical seismicity. Extensive damage was caused in southern Chile with estimates
of casualties due to the earthquake and tsunami ranging from 470 to 5700 people. The Chilean
government estimated that over 2,000,000 people were left homeless, 58,622 homes were
completely destroyed and that at least US$500 million of damage was caused (1960 values), areas of
shoreline were permanently altered by subsidence and the Puvehue volcano erupted 47 hours after
the main shock (NOAA/NGDC 2006).
The tsunami caused by this earthquake was noted on shorelines throughout the Pacific basin.
Damage was particularly severe in the Hawaiian Islands where, despite the operation of an official
warning system, there were 61 deaths and US$23 million in damage (1960 values). The worst hit
area was Hilo, which had been previously devastated by the 1946 Alaskan tsunami. It was struck by
a 35 foot (10.7m) bore (NOAA/NGDC 2006; Johnston 2003; Dudley and Lee, 1998; Cox and
Mink 1963). Japan was struck by waves up to 6m high which caused 199 deaths and US$50 million
in damage (NOAA/NGDC 2006).The tsunami was also noted in the Samoa and Cook Islands and
in French Polynesia, where wave run-ups of up to 3.4m were reported on Tahiti (Keys 1963;
Vitousek 1963).
In New Zealand wave run-ups of up to 4.5m occurred and there was damage to many boats and
harbour facilities, some land inundation and losses of livestock (de Lange and Healy 1986).

NON-SENSITIVE
NSW STATE EMERGENCY SERVICE 2009 NON-SENSITIVE Page 8 of 42
In addition to the impacts in New South Wales the tsunami was also noted in other Australian
locations including Cairns, Townsville, Mackay, Urangan, Brisbane and Coolangatta in Queensland,
Wilsons Promontory in Victoria, Hobart in Tasmania, Port Macdonnell in South Australia and
Freemantle in Western Australia. (Allport and Blong 1995) The location of the earthquake,
observed run-ups and the study area are shown in Figure 1.
5 METHODOLOGY
An extensive search was conducted for material and oral histories which contained mention of the
tsunami. A search of newspapers in coastal New South Wales held by the NSW State Library was
conducted for the issues including and immediately following the 24th of May 1960. Material from
the NSW State Archives was also searched. Historical societies, museums and local studies libraries
in coastal areas were contacted. The State Emergency Service also issued a media release seeking
accounts of the tsunami from the public. Articles were published in 5 newspapers, in Manly, and on
the South Coast, and there were numerous radio interviews asking for people to provide accounts
or records of the event.

NON-SENSITIVE
NSW STATE EMERGENCY SERVICE 2009 NON-SENSITIVE Page 9 of 42
Other organisations contacted include the Royal Australian Navy, Commonwealth Scientific and
Industrial Research Organisation (CSIRO) Division of Marine and Atmospheric Research, Bureau
of Meteorology National Tidal Centre, NSW Department of Primary Industries – Aquaculture,
NSW Farmers Association Oyster Committee, National Archives, Australian Hydrographic Service
and Manly Hydraulics Laboratory.
Descriptions of the tsunami and its effects were recorded, ascribed to a location and assigned an
accuracy and confidence score. The observations were analysed to extract information on the
characteristics of the tsunami and any damage that was caused. The amplitude of the tsunami was
estimated based on the types of observation given. For observations reported as a crest to trough
height or an observed rise or fall the amplitude was taken to be half of the observed value. For
observations of a wave, bore or where the tsunami height was reported as the peak to the predicted
tide stage, the amplitude was taken to be the same as the observed value.
Observations that came from visual estimation were assigned low accuracy. Observations with a
reported methodology which would allow some form of validation were assigned a medium
accuracy. Where the observation was measured using a methodology that is generally accepted as
providing accurate measurements of tsunami amplitude it was assigned high accuracy.
An observation of damage or impacts that could not be directly attributed to tsunami behaviour was
assigned very low confidence. A single isolated observation that came from a personal account was
assigned low confidence. An observation that was quoted in the media at the time was assigned
medium confidence. Where there were multiple independent observations of the same location, or
where the observation was recorded by some type of equipment it was assigned high confidence.
An attempt was also made to locate tide gauge records, in order to resolve discrepancies between
various published databases (NOAA/NGDC 2006; Dominey-Howes 2007) and obtain other
information regarding the onset, period and maximum wave amplitude of the tsunami at various
locations. It was determined that the following tide recorders were in operation in NSW at the time
(Hamon 1963):

NON-SENSITIVE
NSW STATE EMERGENCY SERVICE 2009 NON-SENSITIVE Page 10 of 42
Gauge Name Owner/Operator
Lord Howe Island Department of Civil Aviation
Richmond River Entrance, Ballina,
NSW
Public Works Department
(PWD)
Clarence River Entrance PWD
Coffs Harbour PWD
Newcastle PWD
Camp Cove, Port Jackson, Sydney Maritime Services Board
(MSB)
Fort Denison, Port Jackson,
Sydney
MSB
Port Kembla PWD
Eden CSIRO/Harbour Master
Table 1: NSW Tide Recorders
All the tide gauges were of the float type. A float sits in a stilling well and is attached to a pen stylus
which records on a drum. The rotation speed, scale and size of the float and well can vary. If the
tsunami magnitude is less than the range of the gauge and the period is greater than 5-15 minutes
then the tide recording can be considered an accurate record of the tsunami (Berkman and Symons
1964). This was the case for all the tide gauges examined. Thus they can be considered to accurately
represent the tsunami oscillations in their respective locations.
6 RESULTS
Overall the search for historical information generated 38 personal accounts of which 6 were
written and the remainder were given orally and 1 second hand account from the Royal Australian
Navy. Reports from 18 newspapers were also located. The tide sheets from the Camp Cove and
Fort Denison recorders were copied from State Archives and a reproduction of a tide recording
from CSIRO Cronulla was also located. A report containing an analysis and reproduction of the tide
recordings from Norfolk Island, Lord Howe Island, Ballina, Iluka, Coffs Harbour, Newcastle, Fort
Denison, Camp Cove and Eden was also sourced. (Berkman and Symons 1964) A summary of the
events at each location based on these records appears in Appendix A.

NON-SENSITIVE
NSW STATE EMERGENCY SERVICE 2009 NON-SENSITIVE Page 11 of 42
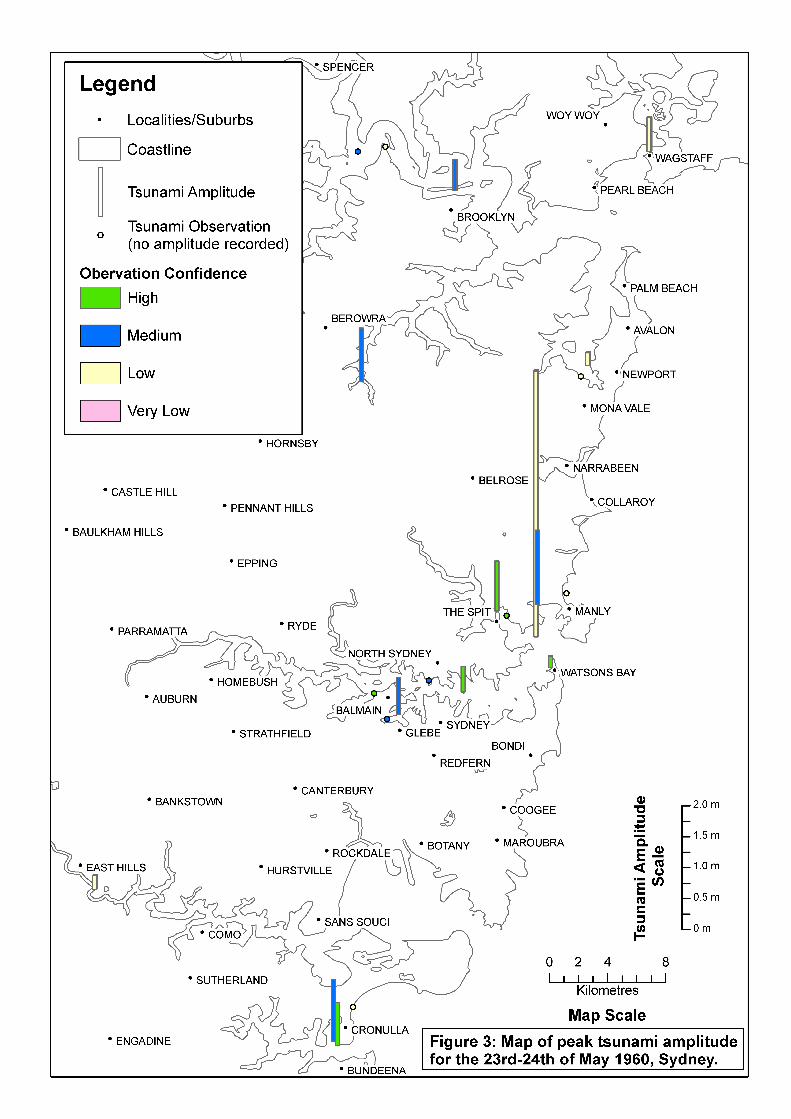
These observations and reports were assigned to 70 individual sites and were analysed to determine
the tsunami amplitude, period, time of observation, peak speed of the current, number of waves
observed, type of observation, type of damage (if any), the dollar figure (2007 values) assigned to
any damage and the sources of the information. This is included in Appendix B. The locations of
observations, observed amplitude and observation confidence are shown in figures 2 and 3.
7 DISCUSSION
Data Collection
In most cases the reports for each location were either from a single personal account, given nearly
50 years after the event, or a newspaper report. Both of these are prone to inaccuracies,
overestimation and omission of important details. Although efforts were made at the time to collect
recordings from tide gauges (Berkman and Symons 1964) there were no systematic approaches to
collect other information on the tsunami. This has limited the coverage and accuracy of this
research. In addition, original records from only two of the ten tide recorders in operation at the
time could be sourced. The records from the others have likely not been appropriately archived.
Future post-tsunami data collection efforts need to concentrate on collecting, archiving and
preserving records of physical measurements of the tsunami as well as systematically gathering and
validating observations of tsunami behaviour and reports of damage even when the tsunami impact
has not been severe.
Tsunami Behaviour
The tsunami occurred on a weekday morning when it was low to half tide. Most observations were
from harbours, bays, rivers and other partially enclosed waterways with only 4 being from open
coastline or offshore. Whilst numerical modelling demonstrates that tsunami amplitudes are
magnified in partially enclosed waters (Baldock 2008), it is also likely that people were concentrated
around these areas therefore leading to a bias towards these types of observations. A breakdown of
the types of tsunami behaviour observed at the locations follows:

NON-SENSITIVE
NSW STATE EMERGENCY SERVICE 2009 NON-SENSITIVE Page 12 of 42
Type of Observation Number of Locations
behaviour observed
Water Level Change 52
Damage 25
Strong Currents 14
Wave/Bore 9
Roaring Water 4
Land Inundation 2
Table 2: Observed Tsunami Phenomena
The most common type of observation was an unexpected change in the water level at the location.
The event earned the description in the common press of the day “tidal wave” as is it manifested
itself as an irregularity of the tides at most locations. After the observations of damage the next
most common observation was that of strong currents. Personal accounts and newspaper reports
gave estimates, based on visual observation of the water movement and its effects on boats, of the
speed of the current that ranged from 6-30 knots (3-15m/s), depending on location. The largest
reported current, 30 knots (15m/s) came from Iron Cove near Balmain and The Spit in Middle
Harbour, Sydney. (Sydney Morning Herald 25/05/1960, Beashel 2008) There were some of reports
of boats being able to make little headway against these currents despite operating at full power.
Period Personal accounts and newspaper reports gave estimates of period, based on the observed interval
between two wave peaks or between the peak and subsequent trough. Depending upon location,
the period of the waves ranged from 8 to 120 minutes. All but 6 observations recorded periods
between 15 and 30 minutes. Given that most observations of the period were made many hours
after the tsunami arrived, they are more likely to represent that of the local basin or harbour rather
than the true period of the tsunami. Where an initial period of the tsunami could be determined
from tide records it is given below:

NON-SENSITIVE
NSW STATE EMERGENCY SERVICE 2009 NON-SENSITIVE Page 13 of 42
Tide Recorder
Location
Initial Wave
Period
Norfolk Island 60
Lord Howe Island 22
Eden 32
Newcastle 30
Iluka 12
Ballina 38
Table 3: Initial Tsunami Period (Berkman and Symons 1964)
Interference waves and reflections can complicate the determination of the true period of a tsunami
wave. Therefore, because of the distance from the tsunami source the observation point, it is
difficult to determine the true tsunami period (Berkman and Symons 1964).
Wave Amplitude In 61 of the 70 locations a change in water level, wave or bore was reported. In 44 locations some
indication as to the magnitude of the wave height or water level change was given. The amplitude of
the tsunami (mean water level to peak height) was determined from these observations. The
observations ranged from 0.08-4.3m with the largest amplitude of 0.85m recorded by a tide gauge at
Eden. (Berkman and Symons 1964) The largest observed amplitude was from a sailing instructor
who reported riding over a 4.3m wave offshore of Balmoral Beach in Sydney Harbour. (Fitzgerald
2008) There is lower confidence in the higher observations as they came from unverified personal
accounts. The range of observed amplitudes is shown below.
Observed
Amplitude
Number of
observations
0-0.3m 14
0.31-0.6m 13
0.61-0.9m 9
0.91-1.2m 5
1.21-1.5m 1
1.5m+ 2
Table 4: Tsunami Amplitude

NON-SENSITIVE
NSW STATE EMERGENCY SERVICE 2009 NON-SENSITIVE Page 14 of 42
NON-SENSITIVE
NSW STATE EMERGENCY SERVICE 2009 NON-SENSITIVE Page 15 of 42

NON-SENSITIVE
NSW STATE EMERGENCY SERVICE 2009 NON-SENSITIVE Page 16 of 42
It should be noted that the maximum amplitude, in particular for those records observed by tide
recorders, did not occur until many hours after the tsunami was first detected. The table below
details, for tide gauges, the time after the tsunami was first detected that the oscillations of
maximum amplitude occurred.
Tide Recorder
Location
Time between first
observation and Maximum
Amplitude (hours:minutes)
Norfolk Island 5:18
Lord Howe Island 8:38
Eden 5:35
Newcastle 10:35
Coffs Harbour 6:15
Iluka 6:27
Ballina 14:10
Table 5: Delay till Maximum Amplitude (Berkman and Symons 1964)
Similar time delays were observed on tidal records at many locations throughout the Pacific
(Berkman and Symons 1964). In most cases along the NSW coast the largest amplitudes and
damage occurred between 0600 and 1200 on the 24th whereas the tidal records indicate that the
tsunami first arrived at approximately 2200 on the 23rd. This reinforces the knowledge that the first
wave of a tsunami is not necessarily the largest.
Penetration of the Tsunami along coastal harbours and rivers. A number of observations along waterways were from areas more than 10km inland from the coast.
These observations were on the Lower Hawkesbury, Port Jackson, the Georges River and the Clyde
River. The furthest upstream observations were at:
River/Bay Upstream Location Distance upstream
from coast
Lower Hawkesbury Bobbin Head 21km
Lower Hawkesbury Berowra Mouth 22km
Port Jackson Iron Cove 13km
Georges River Pleasure Point 28km (21km from river
mouth)
Clyde River Nelligen 14km
Table 6: Penetration of tsunami along rivers and harbours

NON-SENSITIVE
NSW STATE EMERGENCY SERVICE 2009 NON-SENSITIVE Page 17 of 42
The tsunami did not necessarily dissipate in amplitude as it propagated up these systems. At Bobbin
Head, where some moorings were broken, the tsunami amplitude was larger than that observed at
other locations on the Hawkesbury River and Broken Bay. At Iron Cove strong currents and
damage were reported.
It is likely that the effects penetrated even further inland as tsunami can create standing waves in
rivers with the point of maximum amplitude being midway between the river mouth and the most
upstream point of tsunami penetration (Abe 1986).
Land Inundation Inundation of land areas was only reported at Batemans Bay. Water was observed to come over the
seawall behind the house of the postmaster. This had previously been observed when there was a
high tide and rough seas. Water also washed over a road on the southern side of the bay. The road
has since been raised. The tsunami also washed along a street on the northern side of the bay which
is very low set and had previously been affected by coastal erosion. As the height of the tsunami at
Batemans Bay was similar to that reported in other locations, particularly on the South Coast, this
indicates that there are parts of the town that are more vulnerable to coastal inundation hazards
than other parts of the coast which experienced similar tsunami amplitudes but no reports of land
inundation.
Damage
Most of the damage caused by the tsunami was due to the strong currents created in rivers, bays and
channels, not by tsunami run-up. This demonstrates that a tsunami does not need to exceed the
high water mark to cause damage and disruption to marine infrastructure. The breakdown of
damage is as follows:

NON-SENSITIVE
NSW STATE EMERGENCY SERVICE 2009 NON-SENSITIVE Page 18 of 42
Damage Number
of
Locations
Moorings 7
Fishing Equipment 4
Oysters 3
Boat Sunk 2
Boat Grounded 2
Cargo 2
Injury to person 2
Scouring 3
Construction
Equipment
2
Wharves 2
Swimming Pool 2
Vehicle 1
Maritime
Infrastructure
1
Breakwater 1
Table 7: Damage Caused by Tsunami
It is difficult to ascribe an actual dollar figure to the damage caused by the tsunami. In only three
instances was the cost associated with the damage reported. The largest reported cost was thousands
of pounds associated with Oyster losses at Batemans Bay. Accounting for inflation, in 2008 dollars,
this is larger than $25,000. In comparison the other two figures, for a capsized fishing boat and
public swimming pool, summed to $21,600. Given these figures it is possible to estimate a
minimum reported cost of $50,000 in 2008 dollars for damage caused by the tsunami. However, as
most reports of damage did not give a dollar value, and because to the limitations of the survey
methodology, it is likely that the actual figure is much higher particularly if oyster losses at other
locations were counted. In addition, due to the individual price change in certain goods, these dollar
values are not reflective of modern losses that could be experienced were a tsunami to cause
damage of a similar type and extent.
Boating The most common report of damage was of broken moorings. Both fishing and recreational boats
were reported to have broken their moorings. The largest number of broken moorings in one

NON-SENSITIVE
NSW STATE EMERGENCY SERVICE 2009 NON-SENSITIVE Page 19 of 42
location was approximately 30 at The Spit in Middle Harbour, Sydney. In addition there were two
reports of vessels sinking. One 24ft fishing boat was sunk in Throsby Inlet, Newcastle and a punt
loaded with timber was sunk near Glebe in Sydney Harbour. There were two reports of vessels
being grounded and numerous reports of some level of disruption to marine activities. It was
remarked in some newspaper reports that had the largest tsunami oscillations occurred at high tide
there would have been more significant damage to boating. It is difficult to assess the current
vulnerability of the boating sector to tsunami but it is likely to be high, particularly for recreational
boating. As an indication there are 217,074 registered recreational watercraft and 9485 commercial
vessels operating in NSW and there are 20,368 commercial and private moorings in NSW. (NSW
Maritime 2008) Further work is required in this area to determine the exposure and vulnerability of
this sector to the tsunami hazard.
Aquaculture Damage was reported to have occurred to oyster leases in the Hawkesbury River and the Clyde
River at Batemans Bay. The largest reported damage cost was to the oyster industry at Batemans
Bay.
Oyster farmers, in addition to the rest of the NSW aquaculture industry of which oysters make up
70% (NSW Farmers Association 2007), are one of the most vulnerable maritime industries because
of their inability to relocate assets in response to a tsunami warning. Damage can occur from the
action of waves and currents, as was reported in the Hawkesbury, or from silt stirred up by the
tsunami, as reported in Batemans Bay.
The Clyde River Oyster farming industry, where most of the damage was reported in 1960, today
accounts for 11% of the state’s oyster production, or about $3.9 million. The total oyster industry in
New South Wales is worth more than $37 million each year (Wiseman 2007). Further research is
required to determine the actual exposure of this industry to the tsunami hazard.
Injuries
Whilst there was no official record of any death or injury due to the tsunami there were a number of
anecdotal reports of injuries and “near misses” directly attributable to the tsunami.
One report of injury came from Clontarf, near The Spit in Middle Harbour, Sydney, where a young
girl fell over the edge of the beach as it was being scoured away. She was rescued by two young
bystanders (The Northern Star 25/05/1960).
Another report of injury came from a young boy who was with friends on North Cronulla Beach.
They noted the wave coming ashore and he was helping his friends scramble up the seawall when
he was slammed into it by the force of the wave. (Perry 2008)

NON-SENSITIVE
NSW STATE EMERGENCY SERVICE 2009 NON-SENSITIVE Page 20 of 42
The two “near miss” reports were both from fishermen. Two rock fishermen at Malua Bay, near
Batemans Bay, had seawater rapidly rise to around waist level but managed to escape when the
water subsequently receded (Mackey, 2007). At Woody Head, near Iluka, a group of seven
fishermen who were loading their catch onto a truck had to run up the beach to escape the tsunami
wave (The Northern Star 25/05/1960).
Community Behaviour
At most locations the response of the community was not well recorded. Reports focussed primarily
on observations and damage. In most cases, people did not report receiving any warning, thus the
community behaviour is likely to be based solely on the natural signs of the tsunami that they
experienced. There were no reports of people fleeing the coastline en masse although there were a
few isolated instances of small numbers of people fleeing when the hazard was immediate and
apparent, as at Woody Head, North Cronulla Beach, and Malua Bay. There were a few other
isolated instances of people recognising that there was a threat and deciding to leave the area around
the water or advise others to do so. In most instances where there was damage to moorings or some
other disruption to boats, newspapers reported that local residents and workers took action to
protect property and recover drifting boats rather than fleeing. For example at the Spit, owners and
employees of the marinas rushed to the water to secure boats and retrieve those that had broken
their moorings. The actions that people took in this event cannot be generalised to modern times as
the level of public knowledge and awareness of tsunami is likely to be greatly different due to recent
events and public education campaigns.
The tsunami did lead to a rudimentary tsunami warning system being established for Australia, with
warnings received by the Department of the Navy from the Honolulu Magnetic Observatory before
being transmitted by the Bureau of Meteorology to Civil Defence, and ports and harbour
authorities. A second large earthquake in Chile led to a warning being issued on the 26th of May
1960. The NSW Civil Defence Organisation was placed on alert and there were some small
evacuations noted in the Newcastle area (Newcastle Morning Herald 27/5/1960; NSW Civil
Defence Organisation 1961).

NON-SENSITIVE
NSW STATE EMERGENCY SERVICE 2009 NON-SENSITIVE Page 21 of 42
8 CONCLUSION
This study has demonstrated that a distantly generated tsunami can impact New South Wales,
damaging property and creating a risk to life. The importance of maintaining a good historical
record has been highlighted as few official records could be obtained. The lack of a systematic post-
event data collection for the tsunami event creates difficulty in speculating how a similar tsunami
may impact NSW today. With regards to the emergency management of tsunami, two key features
of this event should be noted. The waves of maximum amplitude occurred many hours after the
tsunami first arrived. Should this reoccur in future events some people may return to evacuated
areas and waterways after the initial arrival of the tsunami only to be caught out by the largest waves
many hours later. Emergency managers need to stress this aspect of tsunami in public education
programs and evacuation messages and ensure arrangements are in place to shelter people for the
10 or more hours it may take for the largest wave amplitudes to arrive. The tsunami penetrated
significant distances inland up coastal rivers to areas that some in the community may consider safe.
It is important that low lying areas along coastal waterways are included in emergency planning, and
specifically targeted with public education and warning messages to ensure that people in these areas
are aware of the tsunami hazard. With today’s increased coastal vulnerability, appropriate emergency
risk management should be applied to further investigate and manage the tsunami hazard in New
South Wales.
Further work is required to analyse the threat to aquaculture and recreational boating. This research
also highlights the need for extensive post-event data collection after any future tsunami which has
impacted New South Wales.

NON-SENSITIVE
NSW STATE EMERGENCY SERVICE 2009 NON-SENSITIVE Page 22 of 42
9 REFERENCES
1. Abe K (1986) Tsunami propagation in rivers of the Japanese Islands. Continental Shelf Research 5(6):665-677
2. Allan P, 2008, Personal Account, 26/5/2008
3. Allen SCR, Greenslade DJM (2008) Developing tsunami warnings from numerical model output. Natural Hazards 46:35–52
4. Allport JK, Blong RJ (1995) The Australian Tsunami Database (Four Volumes). Natural Hazards Research Centre, Macquarie University, Sydney
5. Anonymous, 2008, Personal Account, May 2008
6. Baldock T (2008) Modelling of the potential nearshore modification of tsunami waves within typical coastal settings along the NSW coast. Coastal Engineering Research Centre, University of Queensland, Brisbane
7. Beashel K, 2008, Personal Account, 29/5/2008
8. Bega District Times (27/05/1960) Bega, p1
9. Bellinger Courier Sun (27/05/1960) Bellingen
10. Berkman SC, Symons JM (1964) Tsunami of May 22, 1960 as recorded at tide stations. United States Coast and Geodetic Survey, Washington, D.C.
11. Berryman J, 2008, Personal Account, May 2008
12. Bird D, Dominey-Howes D (2006) Tsunami risk mitigation and the issue of public awareness, The Australian Journal of Emergency Management 21(4)
13. Bryant E, Nott J (2001) Geological indicators of large tsunami in Australia. Natural Hazards 24:231–249.
14. Camp Cove Tide Charts, 23-27th May 1960, Maritime Services Board, Sydney
15. Clark E, 2008, Personal Account, May 2008
16. Coles E, 2008, Personal Account, May 2008
17. Coffs Harbour Advocate (25/05/1960), Coffs Harbour
18. Cox DC, Mink JF (1963) The tsunami of 23 May 1960 in the Hawaiian Islands. Bulletin of the Seismological Society of America (December 1963) 53(6):1191-1209
19. Davidson, 2008, Personal Account, May 2008
20. Davies R, 2008, Personal Account, May 2008

NON-SENSITIVE
NSW STATE EMERGENCY SERVICE 2009 NON-SENSITIVE Page 23 of 42
21. de Lange WP, Healy TR (1986) New Zealand tsunamis 1840-1982. New Zealand Journal of Geology and Geophysics, 29, 115-134.
22. Dominey-Howes D (2007) Geological and historical records of tsunami in Australia, Marine Geology 239:99-123
23. Dominey-Howes D, Humphreys G, Hesse P (2006) Tsunami and palaeotsunami depositional signatures and their potential value in understanding the Late-Holocene tsunami record. The Holocene 16(8):1095–1107.
24. Dudley, W., Goff, J., Chagué-Goff, C. and Johnston, J. (in review) Capturing the next generation of cultural memories - video interviewing of tsunami survivors. Natural Hazards and Earth Systems Sciences.
25. Dudley W, Lee M 1998. Tsunami!. University of Hawaii Press, Honolulu. 362 pp.
26. Eden Magnet Voice (26/05/1960), Eden, p1
27. Egan M, 2008, Personal Account, May 2008
28. Elliot R, 2008, Personal Account, May 2008
29. Feenie D, 2008, Personal Account, September 2008
30. Felton A, 2008, Secondary Account, 5/12/2007
31. Ferguson B, 2008, Personal Account, 28/5/2008
32. Fitzgerald M, 2008, Personal Account, May 2008
33. Fort Denison Tide Charts, 23-29th May 1960, Maritime Services Board, Sydney
34. Gissing A, Webb R, Hanslow D (2008) Emergency management of tsunami in New South Wales and the response to the Solomon Islands tsunami April 2nd 2007. The Australian Journal of Emergency Management 23(3)
35. Glenn K, Post A, Keene J et al. (2008) Post Cruise Report: NSW Continental Slope Survey, Geoscience Australia, Canberra
36. Glikson AY (2006) Asteroid impact-ejecta units overlain by iron-rich sediments in 3.5–2.4 Ga terrains, Pilbara and Kaapvaal cratons: accidental or cause-effect relationships? Earth Planetary Science Letters 246:149–160.
37. Grafton Daily Examiner (25/05/1960), Grafton
38. Gray J, 2008, Personal Account, May 2008
39. Hamon BV, (1960) Tidal Wave’s Effects at Cronulla, Fisheries Newsletter (July 1960), Department of Primary Industries, Canberra
40. Hamon BV (1963) Australian Tide Recorders, CSIRO Division of Fisheries and Oceanography Technical Paper No. 15, CSIRO, Melbourne

NON-SENSITIVE
NSW STATE EMERGENCY SERVICE 2009 NON-SENSITIVE Page 24 of 42
41. Illawarra Mercury (25/05/1960), Wollongong
42. Johnston JB (2003) Personal accounts from survivors of the Hilo tsunamis of 1946 and 1960: Toward a disaster communication model. M.A. dissertation, University of Hawai'i, Honolulu
43. Keys JG (1963) The tsunami of 22 May 1960, in the Samoa and Cook Islands, Bulletin of the Seismological Society of America, 53(6):1211-1227
44. Ladmore N, 2008, Personal Account, May 2008
45. Little J, 2008, Personal Account, May 2008
46. Mackey T, 2007, Personal Account, December 2007
47. Macleay Argus (26/05/1960), Kempsey
48. Martin K, 2008, Personal Account, May 2008
49. Moruya Examiner (27/05/1960), Moruya
50. Newcastle Morning Herald (26-27/05/1960), Newcastle
51. Newcastle Morning Herald (25/05/1960), Newcastle p1,5
52. Nielsen O, Sexton J, Gray D et al. (2006) Modelling Answers Tsunami Questions. AusGeo News, 83:12, Available via http://www.ga.gov.au/image_cache/GA8717.pdf. Accessed on 17 December 2008
53. NOAA/NGDC, 2006, Tsunami Event Database. Available via: http://www.ngdc.noaa.gov/seg/hazard/tsevsrch_idb.shtml. Accessed 12 July 2008
54. Northern Champion (27/05/1960), Taree
55. NSW Civil Defence Organisation (1961) Tidal Wave Alerts, Civil Defence Bulletin 3(4)
56. NSW Farmers Association (2007) Oysters: Production and Consumption Today, Available via http://www.nswfarmers.org.au/__data/assets/pdf_file/0011/9866/3a_ Oyster_Production__and__Consumption_today_FS_0207.pdf. Accessed on 2 October 2008
57. NSW Maritime (2008) NSW Maritime Annual Report 2008, Available at http://www.waterways.nsw.gov.au/publications/annual_report_0708.html. Accessed 10 December 2008
58. NSW State Emergency Service (2005) Tsunami Emergency Management State Plan, Wollongong. Available at http://www.ses.nsw.gov.au/topics/2271.html. Accessed on 3 July 2008
59. O’Hare F, 2008, Personal Account, 21/05/2008
60. Opper S, Gissing A (2005) Anticipating Waves of Destruction: Preparing the New South Wales Tsunami Emergency Management State Plan, Presented at Emergency Management Conference, Sydney

NON-SENSITIVE
NSW STATE EMERGENCY SERVICE 2009 NON-SENSITIVE Page 25 of 42
61. Perry D, 2008, Personal Account, May 2008
62. Port Macquarie News (26/05/1960), Port Macquarie, p3
63. Radford D, 2008, Personal Account, 2/10/2008
64. Radford R. 2008, Personal Account, May 2008
65. Ritchie B, 2008, Personal Account, May 2008
66. Rynn J, Davidson J (1999) Contemporary assessment of tsunami risk and implications for early warnings for Australia and its island territories. Science Tsunami Hazard 17(2):107-125
67. Sheppard J, 2008, Personal Account, May 2008
68. Smythe J, 2008, Personal Account, 7/05/2008
69. South Coast Register (26/05/1960), Nowra
70. Surf Life Saving NSW (2008), Private Communication.
71. Sydney Morning Herald (25/05/1960), Sydney
72. Taubman K, 2008, Personal Account, May 2008
73. The Daily Mirror (24/05/1960), Sydney, p1-2
74. The Newcastle Sun (24/05/1960), Newcastle, p1
75. The Newcastle Sun (25/05/1960), Newcastle, p1
76. The Northern Star (25/05/1960), Lismore, p1,4
77. The Northern Star (26/05/1960), Lismore
78. The Sun (24/05/1960), Sydney, p1-2,4
79. Vitousek MJ (1963) The tsunami of 22 May 1960 in French Polynesia. Bulletin of the Seismological Society of America, 53(6):1229-1236
80. Whittaker-Jones M, Secondary Account, Royal Australian Navy, April 2008
81. Williams C, 2008, Personal Account, May 2008
82. Wilson J, 2008, Personal Account, May 2008
83. Wiseman S (2007) Aquaculture production report 2006–2007, NSW Department of Primary Industries Aquaculture Unit, Port Stephens Fisheries Centre, Available at http://www.dpi.nsw.gov.au. Accessed on 10 December 2008
84. Working Group on Tsunamis to the Prime Minister’s Science, Engineering and innovation Council (2005) Tsunamis: does anybody have to die? Prime Minister’s Science, Engineering and Innovation Council Canberra.

NON-SENSITIVE
NSW STATE EMERGENCY SERVICE 2009 NON-SENSITIVE Page 26 of 42
85. Young R, Bryant E, Price D et al. (1997) Chronology of Holocene tsunamis on the southeastern coast of Australia. Transactions of the Japanese Geomorphological Union 18(1): 1–19.
NON-SENSITIVE
NSW STATE EMERGENCY SERVICE 2009 NON-SENSITIVE Page 27 of 42
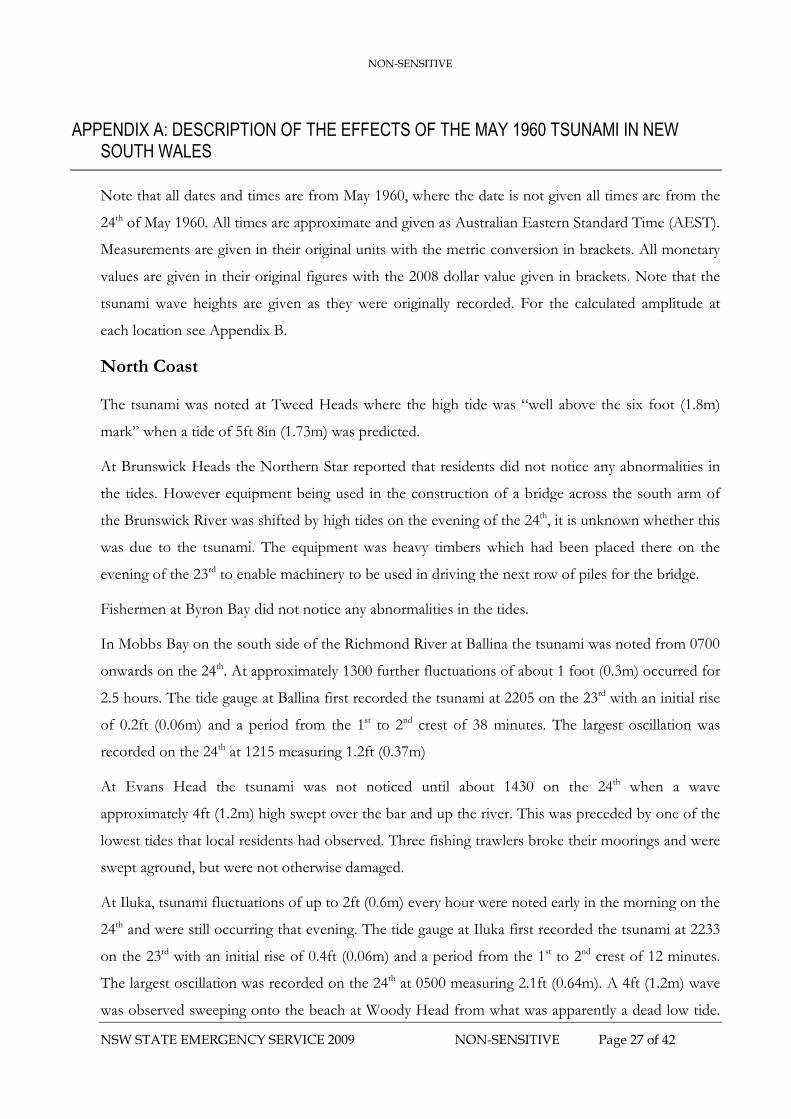
APPENDIX A: DESCRIPTION OF THE EFFECTS OF THE MAY 1960 TSUNAMI IN NEW
SOUTH WALES
Note that all dates and times are from May 1960, where the date is not given all times are from the
24th of May 1960. All times are approximate and given as Australian Eastern Standard Time (AEST).
Measurements are given in their original units with the metric conversion in brackets. All monetary
values are given in their original figures with the 2008 dollar value given in brackets. Note that the
tsunami wave heights are given as they were originally recorded. For the calculated amplitude at
each location see Appendix B.
North Coast
The tsunami was noted at Tweed Heads where the high tide was “well above the six foot (1.8m)
mark” when a tide of 5ft 8in (1.73m) was predicted.
At Brunswick Heads the Northern Star reported that residents did not notice any abnormalities in
the tides. However equipment being used in the construction of a bridge across the south arm of
the Brunswick River was shifted by high tides on the evening of the 24th, it is unknown whether this
was due to the tsunami. The equipment was heavy timbers which had been placed there on the
evening of the 23rd to enable machinery to be used in driving the next row of piles for the bridge.
Fishermen at Byron Bay did not notice any abnormalities in the tides.
In Mobbs Bay on the south side of the Richmond River at Ballina the tsunami was noted from 0700
onwards on the 24th. At approximately 1300 further fluctuations of about 1 foot (0.3m) occurred for
2.5 hours. The tide gauge at Ballina first recorded the tsunami at 2205 on the 23rd with an initial rise
of 0.2ft (0.06m) and a period from the 1st to 2nd crest of 38 minutes. The largest oscillation was
recorded on the 24th at 1215 measuring 1.2ft (0.37m)
At Evans Head the tsunami was not noticed until about 1430 on the 24th when a wave
approximately 4ft (1.2m) high swept over the bar and up the river. This was preceded by one of the
lowest tides that local residents had observed. Three fishing trawlers broke their moorings and were
swept aground, but were not otherwise damaged.
At Iluka, tsunami fluctuations of up to 2ft (0.6m) every hour were noted early in the morning on the
24th and were still occurring that evening. The tide gauge at Iluka first recorded the tsunami at 2233
on the 23rd with an initial rise of 0.4ft (0.06m) and a period from the 1st to 2nd crest of 12 minutes.
The largest oscillation was recorded on the 24th at 0500 measuring 2.1ft (0.64m). A 4ft (1.2m) wave
was observed sweeping onto the beach at Woody Head from what was apparently a dead low tide.

NON-SENSITIVE
NSW STATE EMERGENCY SERVICE 2009 NON-SENSITIVE Page 28 of 42
It rose suddenly, covered the width of the shore, and bounced off a sand ledge at the back of the
beach. This was repeated again. Seven fishermen at this location had to “run for their lives”. The
truck and trailer which they were loading was half buried in the sand and damage occurred to the
nets that they were hauling in.
Mid North Coast
According to newspaper reports the tsunami was first noted at 2300 on the 23rd on the tide recorder
At Coffs Harbour. The strongest oscillations lasted until 1100 on the 24th with the maximum level
reached being in excess of 6ft (1.8m) at 0730 when the predicted height was 4ft 1in (1.2m). The
tsunami continued to be recorded until at least 1600. According to the tide gauge the largest
oscillation occurred at 0415 measuring 3.3ft (1.0m).
The tsunami was noted by fishermen at Nambucca Heads, Scotts Head, and Stuart Point. They
observed minor irregularities in the tides.
At South West Rocks Creek fishermen at the Jerseyville Fishermen’s Cooperative first noted the
tsunami at 0830 on the 24th. The tide was falling at the time when it began to rise rapidly, driving
fishing boats up to 100 yards (90m) upstream. The water rose approximately 1ft (0.3m) in half an
hour and then flowed out rapidly. One fisherman noted a rise of at least 18in (0.46m) that swept his
catch off the creek bank.
The Tsunami was noted by fishermen at Hat Head. One, who was fishing in very shallow water,
experienced the water rise rapidly to waist level.
At Port Macquarie the tsunami was first noted sometime between 0300 and 0330 on the 24th when
the water level in the harbour rose by up to 5ft (1.5m) in less than two minutes. The waters receded
quickly to a lower level than prior to the tsunami impact, but not as quickly as it rose. The
movement of the water was accompanied by a roar which many of the local residents noted. The
oscillations of the water were still noticeable 5 hours later. Some damage was noted including one
fishing jetty that was destroyed and several others that were damaged. The ‘swimming baths’, a
fenced off section of the river and valued at £300 ($7200) were completely destroyed. Fishermen
reported no damage to boats, although a number broke or dragged their moorings or were
grounded as the water receded.
The tsunami was noted at Laurieton where it reached the normal high tide mark when the tide
should have been at half-ebb.

NON-SENSITIVE
NSW STATE EMERGENCY SERVICE 2009 NON-SENSITIVE Page 29 of 42
At Old Bar, on the entrance to the Manning River, the tsunami was observed on the 24th at 1230
when a group of fishermen observed the water rapidly receding. The water then suddenly changed
direction and rose swiftly back up the river bank for about 20 feet (6m).
Hunter
According to the Newcastle Morning Herald, local fishermen and the Lighthouse keeper at Nelson
Bay reported no noticeable effects of the tsunami at Port Stephens. However, one oyster farmer in
Swan Bay did notice the tsunami. The water level rose at low tide approximately 6in (0.15m) to
cover previously bare oyster racks. It remained at this level for half an hour and then receded.
Newcastle/Hunter River
Depending upon the information source there was some disagreement as to the maximum height of
the tsunami and the time that disturbances were first noticed. One newspaper noted that the
tsunami was first noticed at 0730 on the 24th while another noted that disturbances on the tide
gauge had been noted since the 22nd. The State Dockyard reported a rise of 2ft 6in (0.76m) as the
maximum, the Maritime Services Board reported that the maximum change in tide was from 3ft to
5ft (0.9m - 1.5m) at approximately 0500. The owner of the Carrington Slipways reported that the
water level rose 6ft in the 20 minutes that the tsunami flowed in and out of the Throsby Inlet. The
maximum oscillation recorded on the Newcastle tide gauge was 3.6ft (1.10m) at 0835 on the 24th.
The tsunami was first recorded on this gauge at 2200 on the 23rd with a rise of 0.5ft (0.15m) and an
initial period of 30 minutes. Tidal irregularities, as recorded by the tide gauge, lasted for up to five
days.
In Throsby Inlet, at approximately 0900, the tsunami tore more than a dozen small craft from their
moorings and capsized and sank a 24 foot fishing vessel which was estimated to be worth £600
($14400). Ferry services to Stockton were disrupted as the strong current swept the boat off course.
Further up the Hunter River at Hexham a collier ran aground at about 1930 on the 24th. The tide
was observed to be running very quickly at the time and changed and ran out right before the collier
was grounded. Local officials attributed the grounding to the effects of the tsunami.
In the Swansea Channel, the inlet of Lake Macquarie, some swell in the water was observed and a
roaring sound was heard.
No noticeable disturbance in the sea behaviour was reported from Norah Head.

NON-SENSITIVE
NSW STATE EMERGENCY SERVICE 2009 NON-SENSITIVE Page 30 of 42
Sydney
Broken Bay/Hawkesbury River
The tsunami was noted at many locations on Broken Bay and the Lower Hawkesbury River. The
effects and observations varied significantly from one location to another.
At Wagstaff on the Brisbane Waters, the tsunami was first observed at 0400. The peak to trough
amplitude was observed to be 3-4 feet (0.9-1.2m) and the period was 15 minutes. The period
became longer, and height smaller, as the day progressed but was still noticeable at 1500 in the
afternoon. Broken moorings were also reported here.
In the Pittwater, the tsunami was observed at Bayview and Newport. The period at Bayview was
reported to be 2 hours and it was observed all day. At Newport, the peak to trough amplitude was
observed at some time between 1000 and 1300 to be 12-18 inches (0.3-0.5m).
At Bobbin head, approximately 22km from the mouth of the Hawkesbury River, the tsunami was
first observed at 0925. A peak to trough amplitude of 5ft 8in (1.73m) was noted and some boats
broke their moorings. At Berowra Mouth, approximately 21km from the entrance to Broken Bay,
the tsunami was observed at 0100 where a fisherman’s boat was grounded and refloated by the
tsunami.
The tide was observed to rapidly reverse itself about 2 to 3 times near Milson Island, where it didn’t
reach any higher than the king tide. No damage was reported to oyster leases around Milson Island,
but there was damage to racks near Brooklyn which were undermined by the tsunami. At Brooklyn,
the peak to trough amplitude was observed at 1000 to be 3 feet (0.9m) and the period 15 minutes.
Manly
A wave train was observed to come ashore on Manly Beach. Though not the largest the observer
had seen they were unusual.
Middle Harbour
At Forty Baskets Beach, across Port Jackson from Manly, the tsunami caused the water level to
change from that of a very high tide to a very low tide. The period was observed to be
approximately 10 minutes and the peak to trough amplitude was about 8ft (2.4m).
Off Balmoral Beach, a sailing instructor in a small boat recalled riding over a very large wave that
was 2 feet (0.6m) above the mast of his craft for a total height of 14 feet (4.3m). This occurred at
some time between 0800 and 0900 on the 24th. Whilst this account is doubtful, given the magnitude
of the wave and the lack of any verification, it is possible that this could have been a highly localised
NON-SENSITIVE
NSW STATE EMERGENCY SERVICE 2009 NON-SENSITIVE Page 31 of 42
effect. Later in the day another man recalled surfing 2m waves in a similar location, though it is
unsure whether these were due to the tsunami.
The Spit/Clontarf
The Spit, a very narrow section of Middle Harbour, was one of the most affected areas in Sydney.
The effects at The Spit were reported in most of the newspapers of the day and fifteen personal
accounts were also received, some of which were very detailed.
All observations were from personal accounts. Estimates of the height the water level reached
varied. One observer said the water level reached 3 feet (0.9m) above the high tide mark. Most
observers estimated the peak to trough amplitude was 4 feet (1.2m). The tsunami was first noted at
0430 and the most significant effects occurred until 1000. Waves 0.5-1m high were also observed
coming up the channel. It was the strong currents however, that caused the majority of damage.
They were estimated by one observer to be up to 30 knots (15m/s). Most of the newspapers
reported a “giant whirlpool” sweeping boats in unpredictable directions. Many deep water moorings
were dragged, some into the centre of the channel where they became a hazard for other boats.
Approximately thirty boats and two or three large barges broke their moorings. One barge was
carried underneath The Spit Bridge ripping off the jib crane on the barge. Damage to other boats
which hit the bridge as they were carried through, was also reported. Owners and employees of the
marinas around the Spit, as well as Water Police, the Maritime Services Board and volunteers all
assisted in the recovery of the craft that had broken their moorings.
One of the most significant observations around The Spit was the amount of scouring that occurred
in the area. A large section of Clontarf beach was scoured away by 0900. Estimates of the amount
of land eroded varied. The newspapers of the day reported 100 yards by 60 yards (90m by 55m) and
50 feet by 3 feet (15m by 0.9m) whilst one personal account gave an estimate of 1 to 1.5m of sand
along a stretch of beach 100-150m long and another said that up to 30m of land was scoured away.
Some of this sand was deposited in the Clontarf pool and observers noted a discolouration in the
water due to the suspended sand. The scouring exposed a high tension electricity cable and high
pressure gas pipeline which had been buried underneath the channel. Some observers recalled a
small sand spit that came out of Clontarf Beach and reached 20-40m across the channel. This was
scoured away by the tsunami. Whilst the rest of the beach has subsequently returned to its pre-
tsunami state this point never reformed. In addition to Clontarf Beach there was scouring observed
in the bottom and other side of the channel. A diver who examined the power cable on the base of
the channel estimated that sand and silt had been scoured away underneath The Spit Bridge to a
depth of 10ft (3m).

NON-SENSITIVE
NSW STATE EMERGENCY SERVICE 2009 NON-SENSITIVE Page 32 of 42
There was a report of a young girl who was standing on the beach at Clontarf and fell over the
crumbling edge before being rescued by two bystanders.
Sydney Harbour
Reports from Sydney Harbour were concentrated around Balmain and Glebe. Here damage was due
to the strong currents caused by the tsunami.
In Iron Cove, approximately 13km from Sydney Heads, 800 logs at a Sawmill broke away from their
moorings at about 0630. They were secured to three ton moorings by two, three inch storm cables.
One observer estimated the current to be 30 knots (15m/s). Tugs called in to retrieve the logs had
trouble negotiating the strong currents. One, under full power, was swept 200 yards (180m) by the
tsunami.
At Glebe, the operator of the Glebe Island Bridge estimated that the peak to trough amplitude of
the tsunami was about 4 feet (1.2m) at about 0500. Boats were swept rapidly through the bridge by
the swift currents caused by the tsunami. The current here was estimated to be between 8 and 12
knots (4-6 m/s). A punt loaded with 50,000 superfeet (118m3) of Oregon timber was sunk when the
rapid change in the water level caused it to be caught underneath a wharf.
At McMahon’s Point the strong currents were visible from land at 0830 on the 23rd.
Georges River
The tsunami was observed as a series of small waves at Picnic Point, on the Georges River, some
28km from the mouth of Botany Bay. The waves were approximately 0.15-0.3m high and moved at
approximately 10-20 knots (5-10m/s) along the river.
Cronulla/Port Hacking
One of the few reports of injury came from North Cronulla Beach where a boy was knocked into
the seawall (which has since been demolished) by the wave as he attempted to climb it to escape.
Although he reported being nearly knocked unconscious he did not attend hospital. He heard a
hissing sound and observed a receding of the water before two large waves struck the beach,
followed by a set of smaller waves. The sea reached approximately the same level as a king tide.
The tide recorder at Cronulla, operated by the CSIRO Division of Fisheries and Oceanography,
first recorded the tsunami at 2215 on the 23rd with a maximum peak to trough amplitude of 4ft 6in
(1.37m) noted at 0430 on the 24th. The wave period was approximately 30 minutes, and the tide
gauge recorded ongoing fluctuations until the 28th of May.
In Port Hacking, the tsunami affected the Bundeena Ferry in Gunnamatta Bay. The ferry captain
noted strong currents of up to 8 knots (4.6m/s) and six reversals of the tides in the bay starting at

NON-SENSITIVE
NSW STATE EMERGENCY SERVICE 2009 NON-SENSITIVE Page 33 of 42
0630 on the 24th and continuing until approximately 0900. The period of the tsunami was noted to
be approximately 20 minutes and some damage was observed to private wharves and a maritime
beacon, which were undermined by scouring and collapsed. Another report mentioned a 1m high
wave in Port Hacking.
Illawarra
The tsunami was noted at Port Kembla, but no damage or disruption was recorded. The oscillations
however, continued to be noted until at least 2000 on the 24th. Offshore a migrant liner, on its way
from Europe to Sydney Harbour, struck two ‘strange’ waves late at night on the 23rd. The captain
said that the tsunami was likely the cause.
The Windang Fisheries Inspector noticed no abnormalities in the tides at Windang or Kiama
though said that there could have been minor variations.
The tsunami was reported at a number of locations on the Shoalhaven River and its tributaries. The
water level receded below the 0m point on the tide datum by 0.5-1m at Greenwell Point and rose to
the level of the king tide at nearby Shaw’s Creek. On Broughton Creek, near Berry, the fluctuation
was recorded at between 18 inches and 2 feet (0.4-0.6m) with a period of 15 minutes.
In Jervis Bay, damage was reported to the breakwater at HMAS Creswell. There was no newspaper
coverage of this at the time and the damage could not be directly attributed to the tsunami and so
this report is doubtful.
The tsunami was noted in Ulladulla at 0730 where the swiftly rising water assisted in launching a
trawler out of its cradle.
South Coast
Batemans Bay-Clyde River
Batemans Bay was one of the most significantly impacted locations in New South Wales. It
experienced one of the largest unconfirmed wave heights, the largest amount of reported damage
and the only reports of land inundation.
Unusual currents were noted by long line fishermen approximately 4 miles (6km) offshore of
Durras. They lost the fishing gear they had deployed. Estimates of the height of the tsunami
fluctuations at the town of Batemans Bay ranged from 5ft to 5ft 6in (1.5-1.7m). The onset of tidal
variation was noted between 0630 and 0700 on the 24th, although there was an unconfirmed report
that at 0100 or 0200 a 1-2 foot (0.3-0.6m) bore went up the river. The oscillations continued to be
observed for about 6-12 hours. Estimates of the period of the wave ranged from 20 to 30 minutes.
NON-SENSITIVE
NSW STATE EMERGENCY SERVICE 2009 NON-SENSITIVE Page 34 of 42
There was a report of some coastal erosion on the northern side of the bay at the Caravan Park.
This location was noted to have previously been impacted in severe storms. The tsunami was noted
to have washed up to 50 yards (45m) or more along the road at this location. On the southern side
of the bay the wave was also observed to break over the seawall behind the house of the postmaster
at the time. This also occurred during severe weather when there was a particularly high tide. Also
on the southern side of the bay water washed over Beach Road in the vicinity of Pacific Street. The
road has since been raised.
Thousands of pounds (at least $25,000) of oysters were lost due to the tsunami impact in leases at
Batemans Bay. An oyster lease consisting of approximately 70 trays located in Pelican Inlet on the
southern side of the Clyde River had most of the oysters killed due to silt stirred up by the tsunami.
Boats were also torn from their moorings, two launches were swept into mangroves and at least
another two boats were unable to put to sea due to the conditions in the bay.
At Malua Bay, on the southern side of Batemans Bay, an unconfirmed account reported a trough to
peak wave height of 13-18ft (4.0-5.5m) at approximately 9am. The observer noted a wave period of
20 minutes. Such a large wave height was not noted elsewhere in the bay so this is either a highly
localised effect or an exaggeration. The draw down of the water was the first noted effect, exposing
100 yards (90m) of sea-bed. Draw downs of this magnitude were noted elsewhere in the bay where
it was reported that it would have almost been possible to walk to Snapper Island, 500m offshore.
At Nelligen, approximately 14km upstream of Batemans Bay, the tsunami washed the ferry ashore
and refloated it as the water level rose and fell. The cycle of the rise and fall of the water occurred 4-
5 times and reached the top of the river bank.
Far South Coast
On Candalagan Creek, which runs between Mossy Point and Broulee an approximate 3ft (0.9m)
fluctuation in the water level was noted.
The tsunami was noted at Moruya and Narooma but there were no reports of damage.
According to an unconfirmed account from an oyster farmer on Merimbula Lake the tsunami did
affect that location. The tide was falling at the time and flowing out through the mouth of the
estuary when a small wave entered, filled up the lake and then flowed out again.
At 0720 on the 24th in Eden, the pilot noted an unusual current of about 6 knots (3m/s) and that
the water surface looked like rapids. The current reversed and was flowing out rapidly 20 minutes
later. A rise of 5ft (1.5m) was reported by the foreman of the Public Works Department crew
working on the pier. He reported that the water rose and fell in 15 minutes and did so four times

NON-SENSITIVE
NSW STATE EMERGENCY SERVICE 2009 NON-SENSITIVE Page 35 of 42
during the morning. A fisherman observed the oscillations in the water level to be approximately 6ft
(1.8m) from peak to trough and the period 20-30 minutes. According to the newspaper report, the
low tide at noon was one of the lowest on record. Two more similar oscillations were reported in
the afternoon and the local newspaper reported that a rise and fall of 5ft (1.5m) occurred again
during the afternoon. Irregularities were still noted on the 25th. The tide gauge at Eden first
recorded the tsunami at 2210 on the 23rd with an initial rise of 1.7ft (0.52m) and a period from the
1st to 2nd crest of 32 minutes. The largest oscillation was recorded on the 24th at 0345 measuring
5.6ft (1.71m). No significant damage was reported in the local press although the scaffolding that
had been erected around the pier was destroyed, and the Public Works Department crew had to
abandon the site. Fishermen also noted that fish were scarce in the wake of the tsunami and that
their catch was much smaller than normal.

NON-SENSITIVE
NSW STATE EMERGENCY SERVICE 2009 Page 36 of 42 NON-SENSITIVE
APPENDIX B: OBSERVATION SITES OF THE MAY 1960 TSUNAMI IN NEW SOUTH WALES
Location Latitude Longitude Observed
Heights
Calculated
Amplitude (m) Current T1 T2 T3 P N Type Accuracy Confidence Damage
Losses
(2008
AUD)
Source
Norfolk Island
Tide Gauge 29.058(1) 167.953(1) 0.7fta 0.11 23rd 1900 0018 40 Tr High High Berkman, Symons(1964)
Lord Howe
Island Tide
Gauge
31.523(1) 159.058(1) 2.2 fta 0.34 23rd 2045 0523 16 Tr High High Berkman, Symons(1964)
Tweed Heads 28.2(1) 153.55(5) 4in+e 0.1 Wl Low Medium The Northern Star
(25/05/1960)
Brunswick
Heads 28.5393(3) 153.553(1) D Low Very Low Eq
The Northern Star
(25/05/1960)
Ballina Tide
Gauge 28.873(1) 153.563(1) 1.2 fta 0.18 23rd 2205 1215 60 Tr High High Berkman, Symons(1964)
Richmond River,
Ballina 28.88(1) 153.55(2) 1ftb 0.15 0700 1530 Wl Low Medium
The Northern Star
(25/05/1960), Grafton
Daily Examiner
(25/05/1960)
Evans Head
River 29.120(5) 153.42(1) 4ftd 1.2 1430 1430 B Low Medium M
The Northern Star (25-
26/05/1960), Grafton
Daily Examiner
(25/05/1960)
Woody Head,
Iluka 29.36(5) 153.36(2) 4ftd 1.2 am am 2 Wv Low Medium V, FE
The Northern Star
(25/05/1960), Grafton
Daily Examiner
(25/05/1960)
Macleay Argus
(26/05/1960),
Bellinger Courier Sun
(27/05/1960)

NON-SENSITIVE
NSW STATE EMERGENCY SERVICE 2009 Page 37 of 42 NON-SENSITIVE
Location Latitude Longitude Observed
Heights
Calculated
Amplitude (m) Current T1 T2 T3 P N Type Accuracy Confidence Damage
Losses
(2008
AUD)
Source
Iluka 29.41(2) 153.35(2) 2fta 0.3 early am dusk Wl Low Medium
Macleay Argus
(26/05/1960)
Grafton Daily Examiner
(25/05/1960)
Iluka Tide
Gauge 29.41(2) 153.35(2) 2.1fta 0.32 23rd 2233 0500 44 Tr High High Berkman, Symons(1964)
Coffs Harbour 30.305(5) 153.144(4) 1ft 11in+ e 0.6 23rd 2300 0730 1600 Wl Low Medium Coffs Harbour Advocate
(25/05/1960)
Coffs Harbour
Tide Gauge 30.3047(2) 153.1428(3) 3.3fta 0.5 23rd 2200 0415 16 Tr High High Berkman, Symons(1964)
Nambucca
Heads 30.65(2) 153.00(2) Wl Low Medium
Macleay Argus
(26/05/1960)
Scotts Head 30.76(1) 153.00(1) Wl Low Medium Macleay Argus
(26/05/1960)
Stuarts Point 30.82(2) 152.995(5) Wl Low Medium Macleay Argus
(26/05/1960)
South West
Rocks Creek 30.886(3) 153.03(1) 18in+b 0.23 Wl, C Low Medium
Macleay Argus
(26/05/1960)
Macleay River,
South West
Rocks
30.91(3) 153.02(1) 1ftb 0.15 0830 0830 60 Wl, C Low Medium FE Macleay Argus
(26/05/1960)
Hat Head 31.06(3) 153.05(1) 1ftb 0.15 Wl Low Medium FE Macleay Argus
(26/05/1960)
Port Macquarie 31.425(5) 152.90(2) 5ftb 0.8 0330 0330 0830 Wl, Rw Low Medium M, P, Wh 7200
Macleay Argus
(26/05/1960),
Grafton Daily Examiner
(25/05/1960), Port
Macquarie News
(26/05/1960)
Laurieton 31.65(1) 152.81(1) HT-MSLe 0.5 Wl Low Medium The Sun (24/05/1960)
Manning River,
Old Bar 31.95(1) 152.59(2) 1230 1230 Wl Low Medium FE
Northern Champion
(27/05/1960)
Swan Bay, Port
Stephens 32.70(4) 151.97(2) 6inb 0.08 30 Wl Low Low Davies (2008)

NON-SENSITIVE
NSW STATE EMERGENCY SERVICE 2009 Page 38 of 42 NON-SENSITIVE
Location Latitude Longitude Observed
Heights
Calculated
Amplitude (m) Current T1 T2 T3 P N Type Accuracy Confidence Damage
Losses
(2008
AUD)
Source
Newcastle Tide
Gauge 32.923(1) 151.789(1) 3.6fta 0.55 23rd 2200 0835 40 Tr High High Berkman, Symons(1964)
Throsby Inlet,
Newcastle 32.921(1) 151.764(1) 6fta 0.9 0730 0900 20 Wl, C Low Medium M, Bs 14400
The Newcastle Sun
(24/05/1960)
Newcastle
Harbour,
Newcastle
32.9236(4) 151.789(1) 2ftb 0.3 22nd 0500 26th Wl Low Low Newcastle Morning
Herald, (25-27/05/1960)
State Dockyard,
Newcastle 32.922(3) 151.775(2) 2ft 6inb 0.38 Wl Low Medium
Newcastle Morning
Herald (25/05/1960)
Hexham, Hunter
River 32.835(5) 151.71(2) C Low Medium Bg
The Newcastle Sun
(25/05/1960)
Swansea
Channel, Lake
Macquarie
33.08(1) 151.645(5) Rw Low Medium
The Northern Star
(25/05/1960), Newcastle
Morning Herald
(25/05/1960)
Wagstaffe,
Brisbane Waters 33.520(5) 151.340(5) 3-4fta 0.5-0.6 0400 1500 15 Wl Low Low M Radford R (2008)
Bobbin Head,
Hawkesbury
River
33.662(2) 151.162(2) 5ft 8ina Kc 0.86 0925 Wl Low Medium M Williams (2008),
The Sun (24/05/1960)
Berowra Creek
Mouth,
Hawkesbury
River
33.52(1) 151.16(1) 0100 Wl Low Medium The Sun (24/05/1960)
Milson Island,
Hawkesbury
River
33.517(4) 151.177(3) K 20 2-3 Wl, C Low Low Davidson (2008)
Brooklyn,
Hawkesbury
River
31.544(3) 151.22(2) 3fta 0.5 1000 15 Wl Low Medium O
Davidson (2008), The
Sun (24/05/1960)
Bayview,
Pittwater 33.659(1) 151.298(1) Kc 120 Wl Low Low Williams (2008)
Newport,
Pittwater 33.652(2) 151.302(1) 12-18ina 0.2
1000-
1300 Wl Low Low Anonymous (2008)
Manly Beach 33.793(7) 151.289(1) Wv Low Low Smythe (2008)

NON-SENSITIVE
NSW STATE EMERGENCY SERVICE 2009 Page 39 of 42 NON-SENSITIVE
Location Latitude Longitude Observed
Heights
Calculated
Amplitude (m) Current T1 T2 T3 P N Type Accuracy Confidence Damage
Losses
(2008
AUD)
Source
Forty Baskets
Beach, Manly 33.800(5) 151.271(4) 8fta 1.2 10 Wl Low Medium The Sun(24/05/1960)
Camp Cove Tide
Gauge 33.8388(1) 151.2791(1) 1.2fta 0.18 25th 0133 54 Tr High High
Camp Cove Tide Charts
(1960)
Berkman, Symons(1964)
Middle Harbour,
Sydney Harbour 33.82(1) 151.27(2) 14ftd 4.3 Wv Low Low Fitzgerald (2008)
The Spit 33.804(3) 151.246(3) 4fta,
0.5-1md 0.6-1.0 10-25kts 0430
0630-
0900 15
Wl, D, C,
Rw Low High M, S, Eq
Radford D (2008), Allan
(2008), Martin (2008),
Taubman (2008),
Beashel (2008), Little
(2008), Ferguson (2008),
Ritchie (2008), ,
Newcastle Morning
Herald, (25/05/1960),
The Newcastle
Sun(24/05/1960)
Sydney Morning Herald
(25/05/1960), Daily
Mirror (24/05/1960),
The Sun (24/05/1960),
The Northern Star
(25/05/1960)
Clontarf Beach 33.807(3) 151.252(2) 0630-
0900 D, C Low High S, P, I As above.
McMahons
Point, Sydney
Harbour
33.847(3) 151.204(2) 0830 C Low Medium The Sun (24/05/1960)
Glebe 33.871(1) 151.178(2) D Low Medium Bs, Ca
The Sun (24/05/1960),
Newcastle Morning
Herald (25/05/1960)
Glebe Island
Bridge 33.868(1) 151.185(1) 4fta 0.6 8-12kts 0500 C, Wl Low Medium
Daily Mirror
(24/05/1960)

NON-SENSITIVE
NSW STATE EMERGENCY SERVICE 2009 Page 40 of 42 NON-SENSITIVE
Location Latitude Longitude Observed
Heights
Calculated
Amplitude (m) Current T1 T2 T3 P N Type Accuracy Confidence Damage
Losses
(2008
AUD)
Source
Balmain, Iron
Cove 33.855(1) 151.170(2) 30kts C, D Low High M, Ca
The Sun (24/05/1960),
Daily Mirror
(24/05/1960),
Sydney Morning Herald
(25/05/1960)
Fort Denison
Tide Gauge 33.854(1) 151.225(1) 2.7fta 0.41 0800 46 Tr High High
Fort Denison Tide
Charts (1960),
Berkman Symons (1964)
Picnic Point,
Georges River 33.976(1) 150.997(2) 15-30cmd 0.15-0.3 Wv Low Low O’Hare (2008)
North Cronulla
Beach 34.049(3) 151.157(2) Kc 2+ Wv, Rw Low Low I Perry (2008)
CSIRO Cronulla
Laboratories 34.0728(2) 151.1474(1) 4ft 6ina 0.69 23rd 2215 0430 28th 30 Tr High High Hamon (1960)
Gunnamatta
Bay, Port
Hacking
34.07(1) 151.145(5) 1md 1 8kts 0630 0900 6 Wl, B, C Low Medium Wh, S, Mi
The Newcastle Sun
(24/05/1960), The Sun
(24/05/1960)
Port Kembla 34.46(1) 150.90(1) 2000 Wl Low Medium Illawarra Mercury
(25/05/1960)
Offshore, Port
Kembla 34.5(2) 151.2(2) 23rd pm Wv Low Medium
Daily Mirror
(24/05/1960)
Broughton
Creek, Berry 34.78(2) 150.70(1) 18in-2fta 0.2-0.3 15 Wl Low Medium
Illawarra Mercury
(25/05/1960), South
Coast Register
(26/05/1960)
Greenwell Point,
Shoalhaven
River
34.91(1) 150.735(5) -0.5-1mc 1.0-1.3 Wl Low Low Wilson (2008)
Shaw's Creek,
Shoalhaven
River
34.902(1) 150.727(3) Kc 1.0-1.3 Wl Low Low
Gray (2008)
HMAS Creswell,
Jervis Bay 35.121(1) 150.707(2) D Low Very Low Mi
Berryman (2008)
Whittaker-Jones (2008)

NON-SENSITIVE
NSW STATE EMERGENCY SERVICE 2009 Page 41 of 42 NON-SENSITIVE
Location Latitude Longitude Observed
Heights
Calculated
Amplitude (m) Current T1 T2 T3 P N Type Accuracy Confidence Damage
Losses
(2008
AUD)
Source
Ulladulla
Harbour 35.3577(5) 150.4760(5) 0730 Wl Low Medium
The Daily Mirror
(24/05/1960), Eden
Magnet Voice
(26/05/1960)
Offshore,
Durras 35.67(5) 150.37(5) 24th C Low Low FE Sheppard (2008)
Batemans Bay 35.710(9) 150.18(1) 5ft 6ina 0.84 0700 30 Wl, C, Li Low Medium M, O >25,000
Sheppard (2008),
Ladmore (2008), Feenie
(2008) The Sun
(24/05/1960), Bega
District Times
(27/05/1960),
Moruya Examiner
(27/05/1960)
Riverside
Caravan Park,
Batemans Bay
35.703(1) 150.184(1) 24th Li, D Low Medium S Moruya Examiner
(27/05/1960)
Pelican Inlet,
Clyde River 35.702(5) 150.158(5) 1-2ftd 0.3-0.6 0100 0630 1830 20 Wl, B Low Low O Elliot (2008)
Malua Bay,
Batemans Bay 35.797(5) 150.234(3) 13-18fta 2.0-2.7 0900 20 Wl Low Low Mackey (2007)
Nelligen, Clyde
River 35.648(5) 150.143(2) 4 or 5 Wl Low Low Bg
Coles (2008)
Moruya Examiner
(27/05/1960)
Mossy Point 35.840(3) 150.177(3) 3fta 0.5 Wl Low Low Clark (2008)
Moruya River 35.91(1) 150.09(5) Wl Low Medium Moruya Examiner
(27/05/1960)
Merimbula Lake 36.89(1) 149.92(1) Wl Low Low Felton (2008)
Cannery Wharf,
Eden 37.069(1) 149.902(1) 6fta 0.9 20-30 Wl Low Low Egan (2008)
Twofold Bay,
Eden 37.08(2) 149.90(3) 6kts 0720 25th C Low Medium
Eden Magnet Voice
(26/05/1960)
Snug Cove
Wharf, Eden 37.072(1) 149.908(2) 5fta 0.8 15 6 Wl Low Medium Eq
Eden Magnet Voice
(26/05/1960)

NON-SENSITIVE
NSW STATE EMERGENCY SERVICE 2009 Page 42 of 42 NON-SENSITIVE
Location Latitude Longitude Observed
Heights
Calculated
Amplitude (m) Current T1 T2 T3 P N Type Accuracy Confidence Damage
Losses
(2008
AUD)
Source
Eden Tide
Gauge 37.0703(1) 149.9020(1) 5.6fta 0.85 23rd 2210 0345 80 Tr High High Berkman, Symons(1964)
Abbreviations and Annotations for Appendix B
All coordinates given are in the WGS84 Datum as degrees south and degrees east.
Headings
T1 Time tsunami first observed
T2 Time of maximum tsunami amplitude/effects
T3 Time tsunami last observed
P Period at time of maximum tsunami amplitude/effects
N Number of wave trains observed
Annotations for Observed Heights
a Observed peak to trough height.
b Observed height of a rise in water level.
c Observed maximum height reached.
d Observed height of a wave or bore.
e Observed height of the peak to the predicted tide stage.
K King Tide
HT-MSL High Tide to Mean Sea Level
Abbreviations for Type of Observation
Tr Tide Recorder
Wl Water Level Change
D Damage
C Strong Currents
Wv Wave
Li Land Inundation
B Bore
Rw Roaring Water
Abbreviations for Damage Type
Eq Equipment
M Moorings
V Vehicle
FE Fishing Equipment
Bg Boat Grounded
S Scouring
O Oysters
Mi Maritime Infrastructure
Wh Wharves
Bs Boat Sunk
Ca Cargo
I Injury
P Pool