children's early learning and care hubs in north bay's central area
TRANSCRIPT

A Summary Presentation of the report:
Children’s Early Learning and Care Hubs in North Bay’s Central Area
Jan. 26, 2009

Today’s Presentation
Purpose
Methodology
Best Start
Level of Geography
Hub Locations
Hub Service & Program Implications
Recommendations
EDI and “School Readiness to Learn”

Purpose
This report is intended to supplement the Hub Development Plan.
It presents a quantitative analysis of the neighborhoods that children ages 0-6 yrs. are living in, in North Bay’s central area.
The report is framed within Ontario’s early learning and care strategy, Best Start.
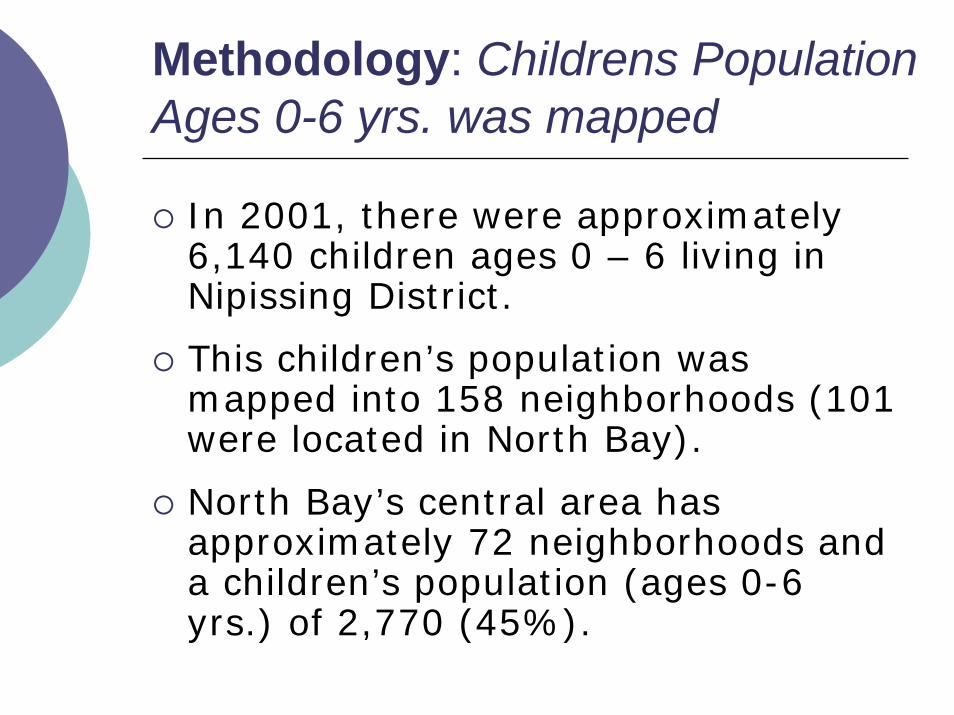
Methodology: Childrens Population Ages 0-6 yrs. was mapped
In 2001, there were approximately 6,140 children ages 0 – 6 living in Nipissing District.
This children’s population was mapped into 158 neighborhoods (101 were located in North Bay).
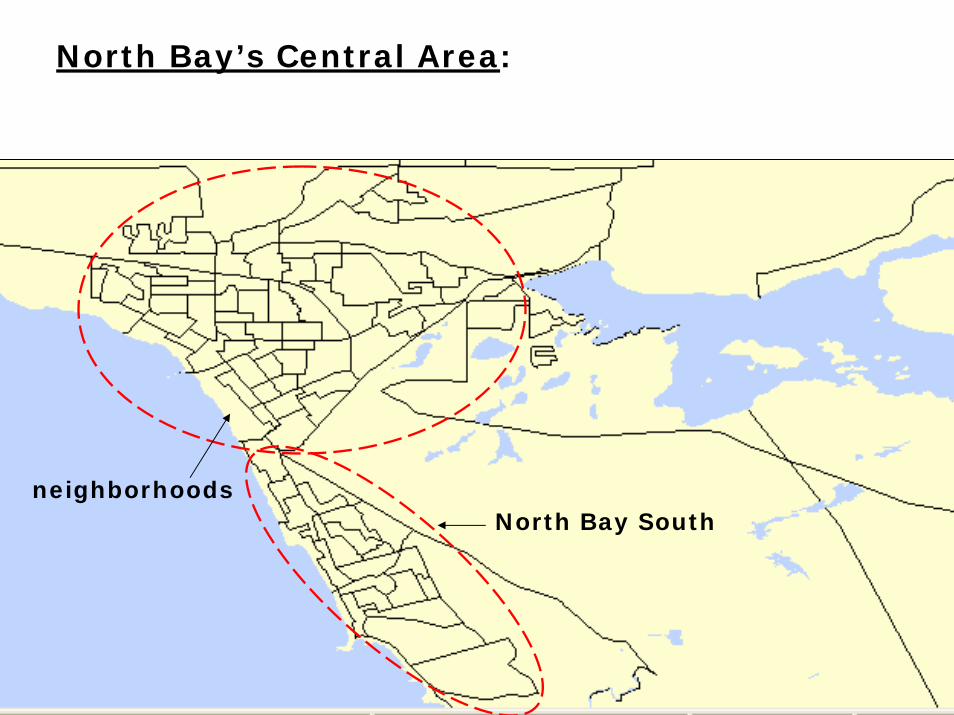
North Bay’s central area has approximately 72 neighborhoods and a children’s population (ages 0-6 yrs.) of 2,770 (45%).
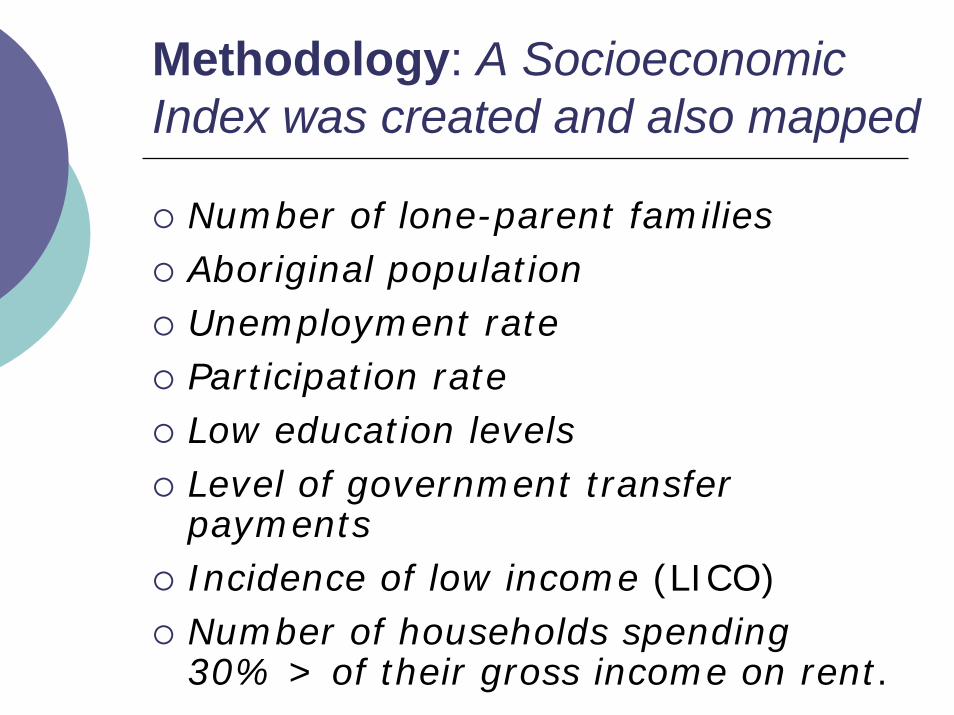
Methodology: A Socioeconomic Index was created and also mapped
Number of lone-parent familiesAboriginal populationUnemployment rateParticipation rateLow education levelsLevel of government transfer paymentsIncidence of low income (LICO)Number of households spending 30% > of their gross income on rent.

Methodology: EDI results were analyzed by area
EDI is a population-based measure of the “school readiness to learn” of SK children.
Valuable planning tool for communities as it indicates how children are doing, and how effective the community programs and services are.
The Nipissing EDI results from four school boards were combined and rolled-up into ten (10) postal code areas, based on where the SK children live.
Best Start GoalBest Start is the provincial plan for improving early learning and childcare in Ontario.
One of the main goals of Best Start is for “children in Ontario to be ready and eager to learn and excel by the time they start grade 1”.
Central to this goal is the expansion of quality and affordable childcare along with a continuum of services, offered in a convenient and easily accessible location for parents.

Best Start, Key StrategiesCreating new early learning and care hubs that will provide integrated services and supports for families with young children.
Ideally, these hubs will offer an integrated,seamless point of access to services and supports, centrally located in communities.
Creating an integrated early learning and care program that combines preschool, Junior Kindergarten (JK) and SK with high quality childcare during non-school hours.
North Bay
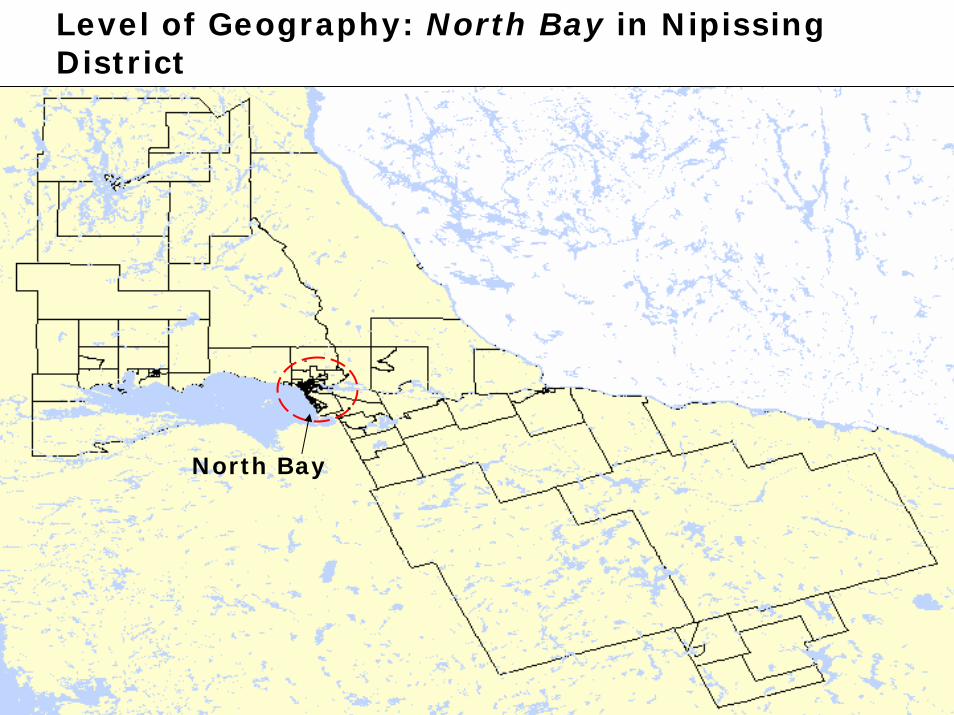
Level of Geography: North Bay in Nipissing District
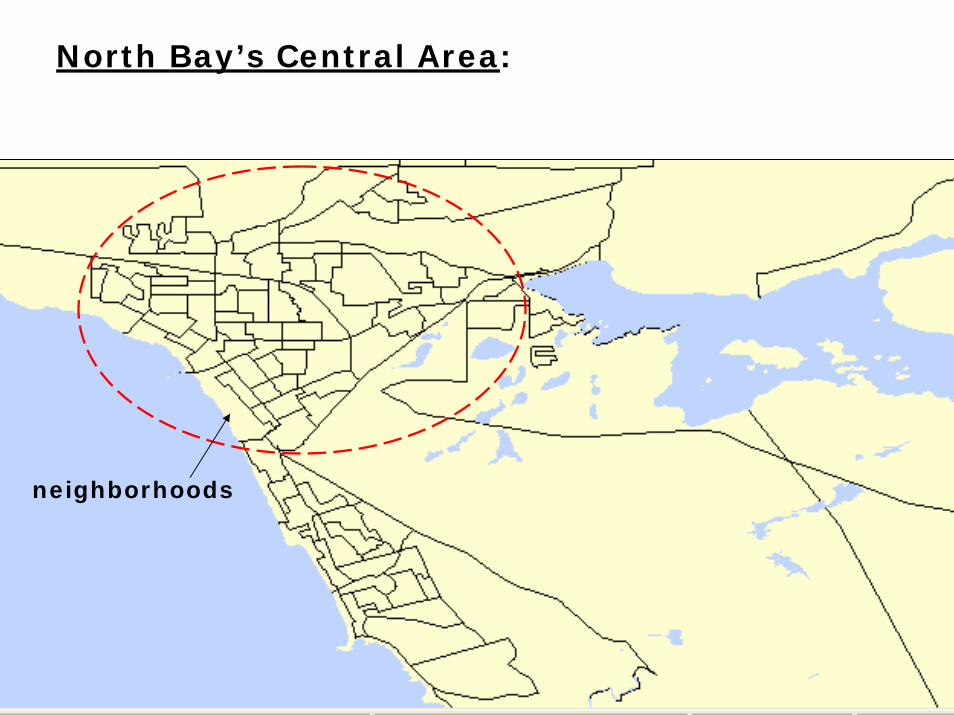
neighborhoods
North Bay’s Central Area:
neighborhoods
North Bay’s Central Area:
North Bay South
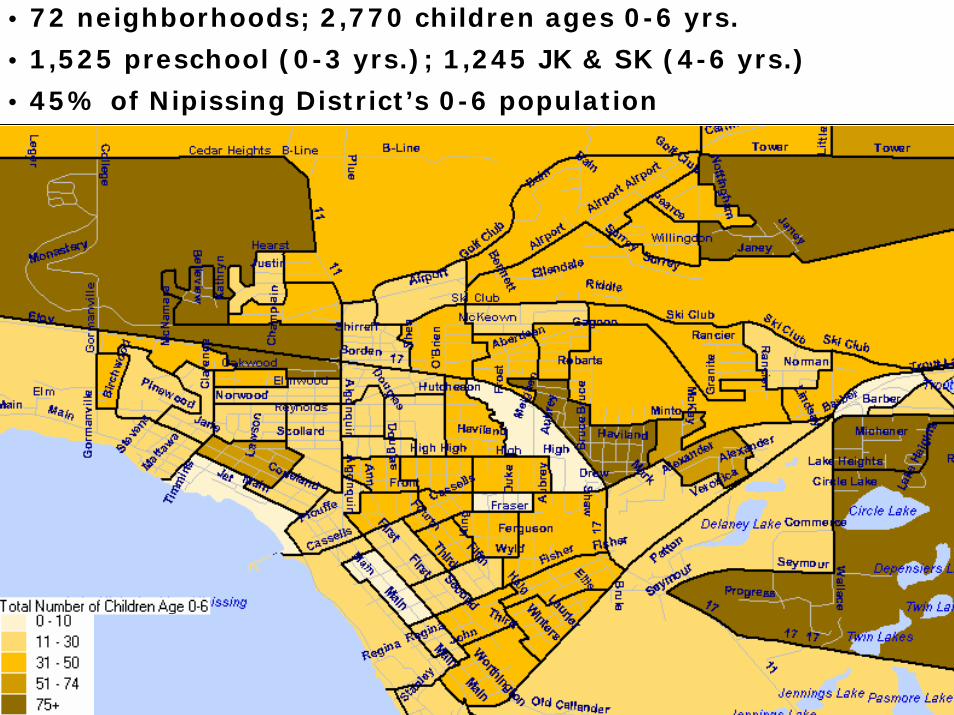
• 72 neighborhoods; 2,770 children ages 0-6 yrs.
• 1,525 preschool (0-3 yrs.); 1,245 JK & SK (4-6 yrs.)
• 45% of Nipissing District’s 0-6 population
Ontario Early Years Centre
John XXIII & EW Norman Cluster
Proposed new Hubs
St. Vincent
One Kids Place
Graniteville
Airport HillHwy. 11 North
West End
Ferris
Downtown
ScollardPinewood
St. JohnsBirchaven
Riddle CT
Thibeault
Morland
Eastview
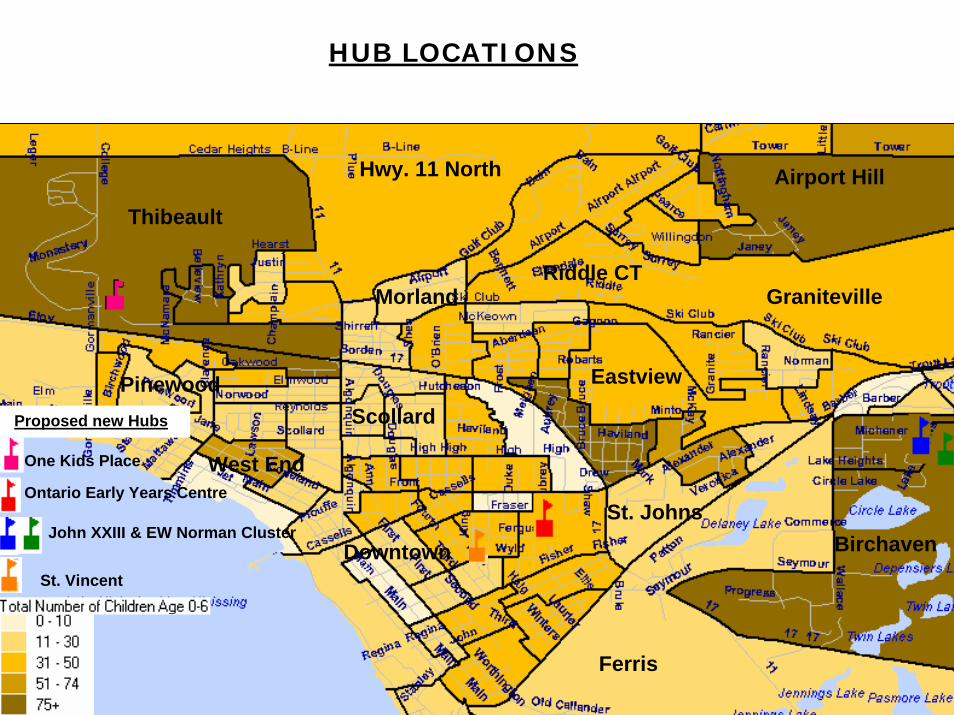
HUB LOCATIONS

Ontario Early Years Centre
John XXIII & EW Norman Cluster
Proposed new Hubs
St. Vincent
One Kids Place
Graniteville
Airport HillHwy. 11 North
West End
Ferris
Downtown
ScollardPinewood
St. JohnsBirchaven
Riddle CT
Thibeault
Morland
Eastview
New Hub Locations as a Strategy for Achieving the Best Start Goal: 1) Accessibility 2) Integrated programs that combine preschool, JK, SK with quality childcare during non-school hours.
Ontario Early Years Centre
John XXIII & EW Norman Cluster
Proposed new Hubs
St. Vincent
One Kids Place
Graniteville
Airport HillHwy. 11 North
West End
Ferris
Downtown
ScollardPinewood
St. JohnsBirchaven
Riddle CT
Thibeault
Morland
Eastview
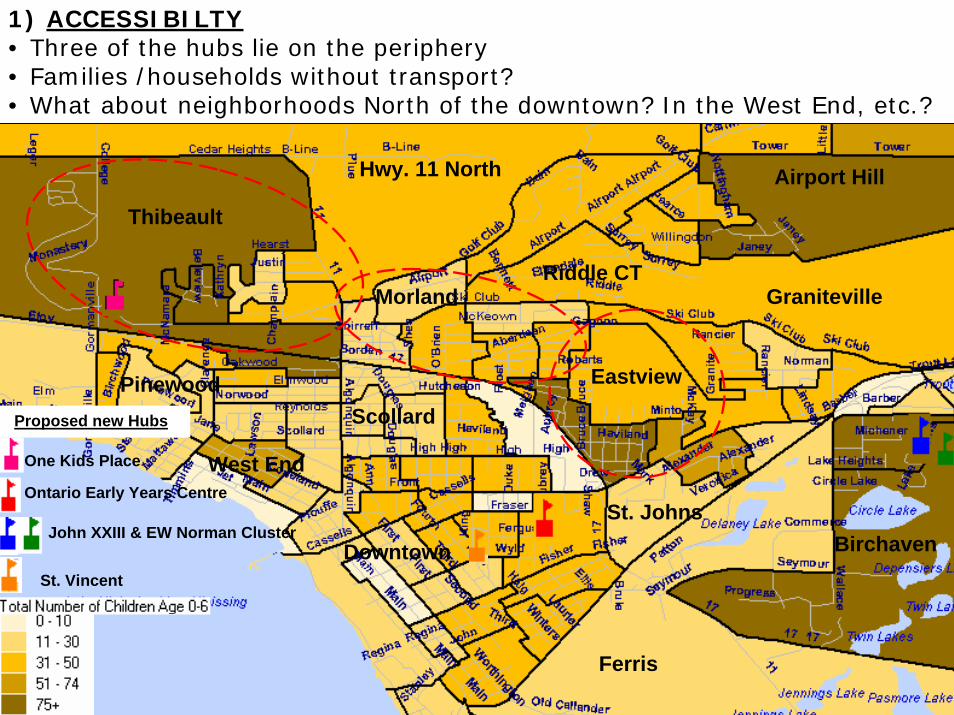
1) ACCESSIBILTY• Three of the hubs lie on the periphery• Families /households without transport?• What about neighborhoods North of the downtown? In the West End, etc.?

Ontario Early Years Centre
John XXIII & EW Norman Cluster
Proposed new Hubs
St. Vincent
One Kids Place
Graniteville
Airport HillHwy. 11 North
West End
Ferris
Downtown
ScollardPinewood
St. JohnsBirchaven
Riddle CT
Thibeault
Morland
Eastview
2) Integrated Programs and Childcare During Non-school hrs.• OKP, specialty hub; OEYC, integrated programs but what about childcare?• John XXIII & EW Norman Cluster integrated but not central.• St Vincent, integrated with central location – Francophone hub.
Key Finding:
Based on the data, and the above factors of accessibility and program & childcare integration, it is evident that more hubs will be required in the North Bay central area in order to effectively service the children’s population and implement key Best Start strategies.
Ontario Early Years Centre
John XXIII & EW Norman Cluster
St. Vincent
One Kids Place
School Boards
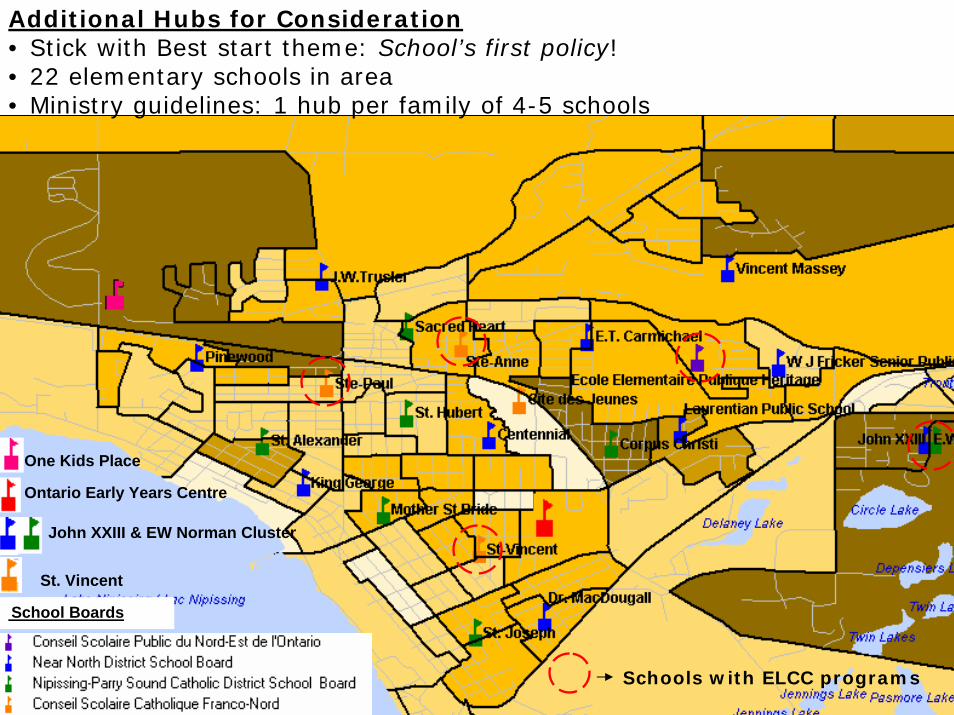
Additional Hubs for Consideration• Stick with Best start theme: School’s first policy!• 22 elementary schools in area• Ministry guidelines: 1 hub per family of 4-5 schools
Schools with ELCC programs

Recommendations1) Investigate the possibility of opening
hubs that would service the Thibeault, Morland and Eastview neighborhoods as well as those neighborhoods to the North (Graniteville, Airport Hill and Riddle Ct.).
2) Investigate the possibility of opening another hub that would complement the St. Vincent hub in the Downtown area –this additional hub would service the neighborhoods in the Scollard, Pinewood and West End areas.

Recommendations3) If there are resource restraints,
Review and evaluate all the proposed hubs and their locations within North Bays central area with respect to the spatial data presented (specifically neighborhood children population density in association with school locations) and the effectiveness in implementing the Best Start strategies.

Hub Services and ProgramsMany factors involved in choosing service /program mix – two primary ones:1) Existing ELCC services & programs2) Needs of children and their families
School Boards
Childcare Centres
Proposed Hubs
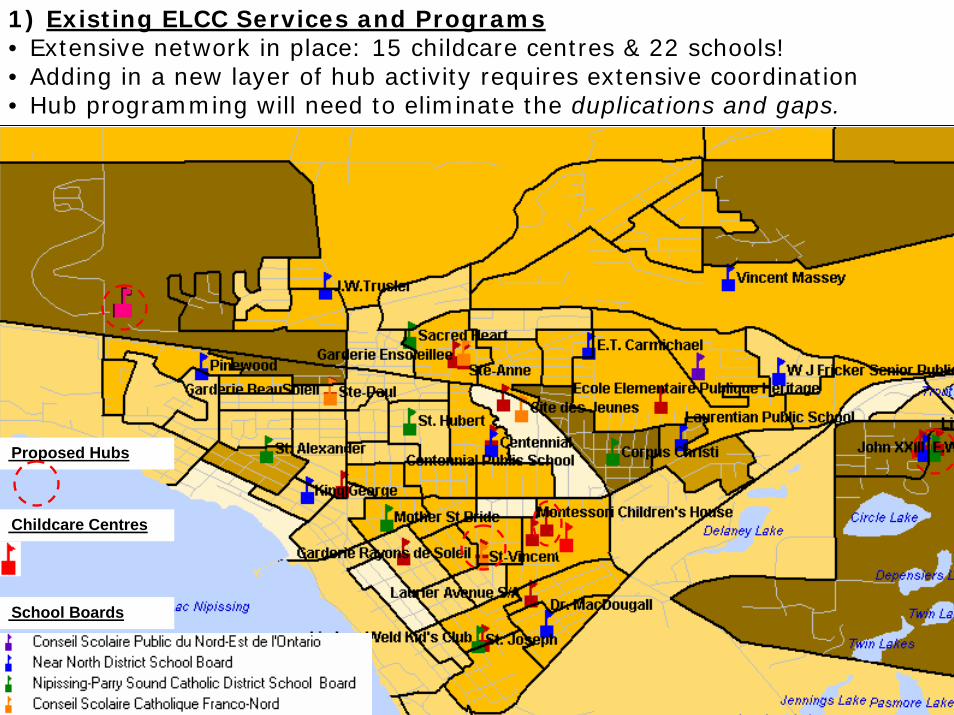
1) Existing ELCC Services and Programs• Extensive network in place: 15 childcare centres & 22 schools!• Adding in a new layer of hub activity requires extensive coordination • Hub programming will need to eliminate the duplications and gaps.

Recommendation4) That the Community Services
Inventory maintained by the Nipissing Ontario Early Years Centre, be mapped and analyzed in association with the other GIS information and data.
2) The Needs of Children and their Families: SES• Strong association between SES and children’s developmental outcomes• Performance in school is strongly related to SES • Neighborhood & family SES can impact Best Start goal

MiddleHigh
Low
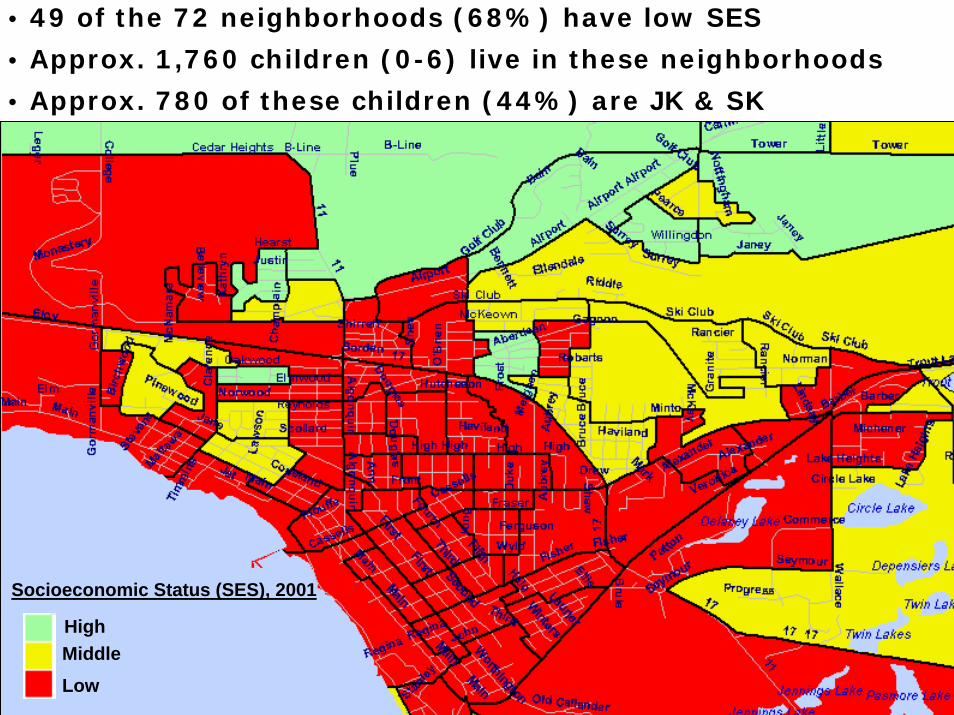
Socioeconomic Status (SES), 2001
2) The Needs of Children and their Families: SES• Strong association between SES and children’s developmental outcomes• Performance in school is strongly related to SES • Neighborhood & family SES can impact Best Start goal

MiddleHigh
Low
Socioeconomic Status (SES), 2001
2) The Needs of Children and their Families: SES• Negative effects of low SES can be mitigated through effective parenting and caregiving and /or quality ELCC programs that are accessible.• New hubs provide the opportunity to minimize negative SES effects!
MiddleHigh
Low
Socioeconomic Status (SES), 2001
• 49 of the 72 neighborhoods (68%) have low SES
• Approx. 1,760 children (0-6) live in these neighborhoods
• Approx. 780 of these children (44%) are JK & SK
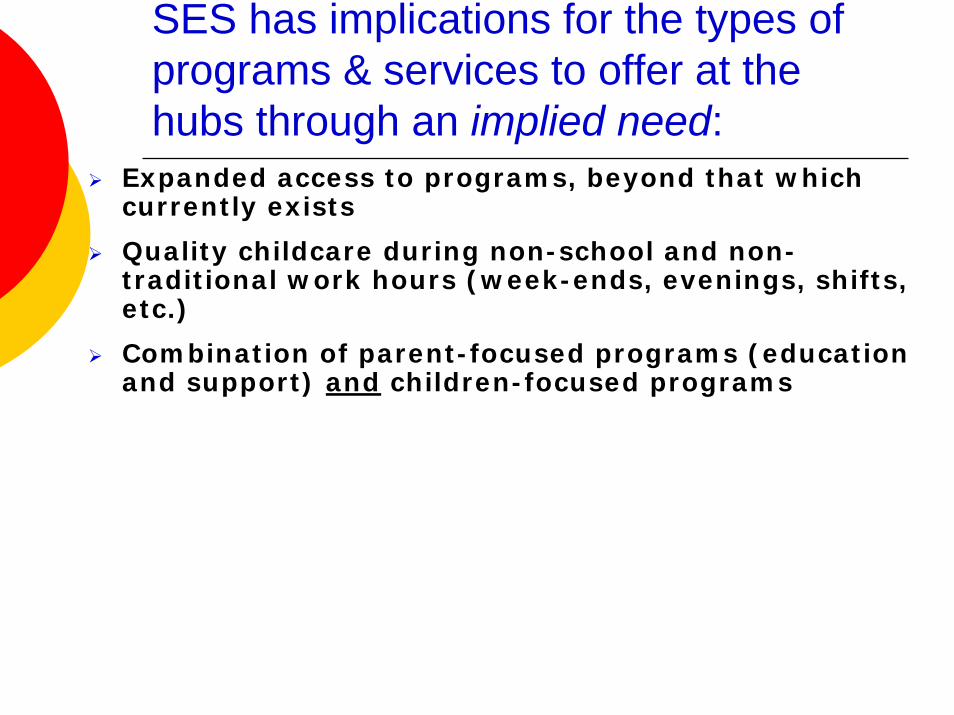
SES has implications for the types of programs & services to offer at the hubs through an implied need:
Expanded access to programs, beyond that which currently exists
Quality childcare during non-school and non-traditional work hours (week-ends, evenings, shifts, etc.)
Combination of parent-focused programs (education and support) and children-focused programs
Recreation programs and physical activity (see also, EDI results)
Preschool programs (including literacy skills & speech)
Programs covering nutrition and diet
Programs promoting social and emotional development (see also, EDI results)

Expanded access to hub programs & services…universal or targeted?

Expanded access to hub programs & services…universal or targeted?BOTH!
The socioeconomic gradient shows that there are children in all SES environmentswho are not doing well relative to other children in similar SES environments.
But vulnerable children from families and neighborhoods with low SES stand to benefit the most from quality, accessible, early learning and childcare programs.
Hubs will need to offer services and programs to all children and their families in all neighborhoods, but also performspecific outreach (targeting) to families in need, in the low SES neighborhoods.

Outreach & Targeting (aka marketing!)We have seen that expanded outreach will be necessary if the hubs are to be successful.
Previous research in Nipissing District has indicated a communications gap between the ELCC industry and families /households.
If this gap persists – or the current level of ELCC awareness & promotion remains the same - it is highly likely that the hubs will not be fully utilized.
More mass marketing needed in District.
Public information sessions, town-hall meetings, etc. at the neighborhood level.
EDI “School Readiness to Learn” for SK Children in North Bay
Another main consideration for the design of hub services and programs is the local EDI results.
As a key indicator of the “school readiness to learn” EDI is a valuable indicator for determining, to what extent, the Best Start goal of having “children ready to learn” is being achieved.
Thus EDI can play an integral role in Best Start planning and evaluation.
When used in association with other indicators such as SES, the scope of analysis is expanded to enhance community planning.

EDI Results for Nipissing District• Results from the 2005 /2006 school year• Approx. 860 SK children participated in the EDI • These SK children live in the following municipalities /areas:
Mattawa
Nipissing, Unorganized North
BonfieldEast Ferris
West NipissingNorth Bay

EDI Results for North Bay• The EDI results are not at the same level of neighborhood geography• Results for North Bay’s Central Area were rolled up into three (3), larger, postal areas:

EDI Results for North Bay• P1B area covers most of North Bay Central Area• P1C area covers mostly Airport Hill• P1A area covers mostly Birchaven and North Bay South
EDI “School Readiness to Learn” for SK Children in North Bay
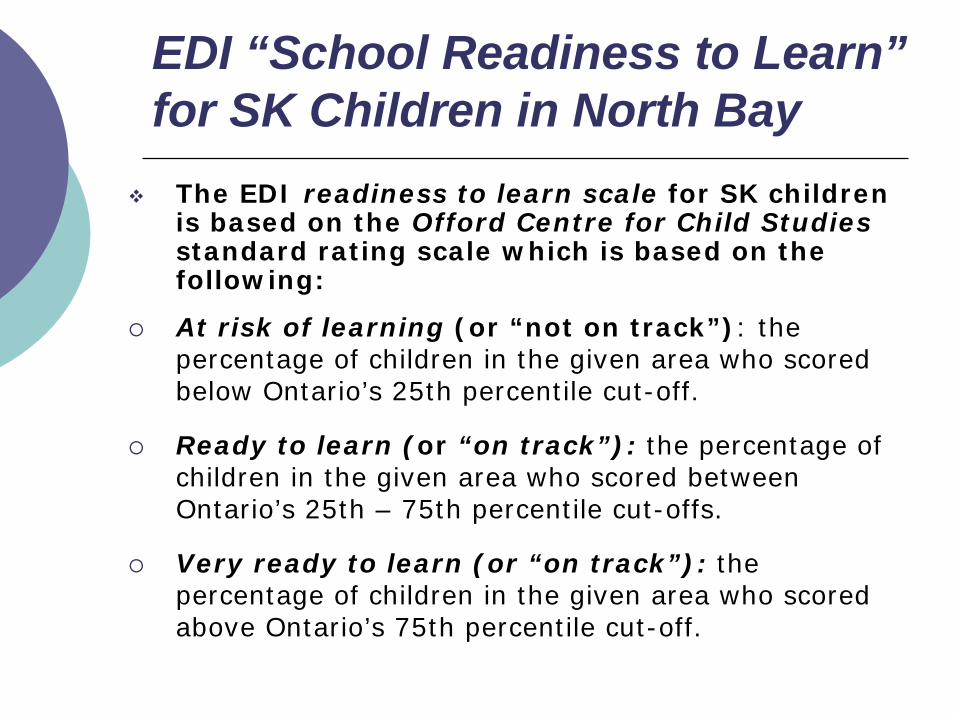
The EDI readiness to learn scale for SK children is based on the Offord Centre for Child Studiesstandard rating scale which is based on the following:
At risk of learning (or “not on track”): the percentage of children in the given area who scored below Ontario’s 25th percentile cut-off.
Ready to learn (or “on track”): the percentage of children in the given area who scored between Ontario’s 25th – 75th percentile cut-offs.
Very ready to learn (or “on track”): the percentage of children in the given area who scored above Ontario’s 75th percentile cut-off.

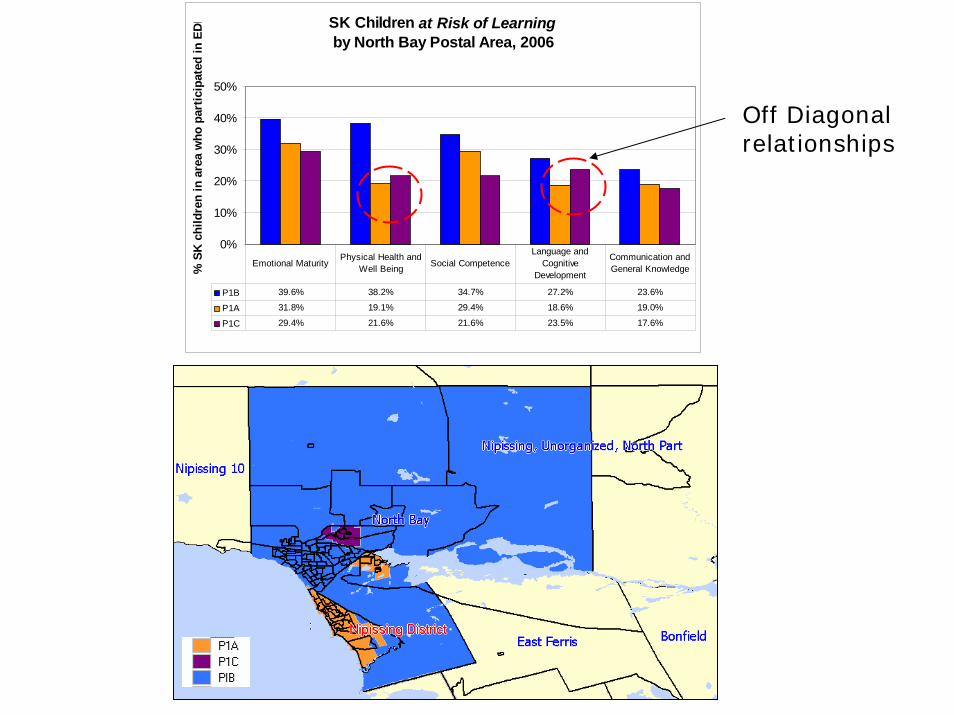
The neighborhoods in the P1B area have the highest percentage of children at risk of learning. Proportionately, most of these neighborhoods have a low SES.
The neighborhoods in the P1A area (part of Birchaven and North Bay South) have the next highest percentage of children at risk of learning. Proportionately, most of these neighborhoods have a low - middle SES.
The neighborhoods in the P1C area (Airport Hill) have the lowestpercentage of children at risk of learning and these neighborhoods have a middle – high SES.
Key Finding

SK Children at Risk of Learning by North Bay Postal Area, 2006
0%
10%
20%
30%
40%
50%
% S
K c
hild
ren
in a
rea
who
par
ticip
ated
in E
DI
P1B 39.6% 38.2% 34.7% 27.2% 23.6%
P1A 31.8% 19.1% 29.4% 18.6% 19.0%
P1C 29.4% 21.6% 21.6% 23.5% 17.6%
Emotional MaturityPhysical Health and
Well Being Social CompetenceLanguage and
Cognitive Development
Communication and General Knowledge
Off Diagonal relationships

Service & Program Implications for Hubs
Services and programs can be designed aroundthose sub- domain activities, for which there are relatively large numbers of children at risk of learning.
For example, improving outcomes in the developmental area of emotional maturity will require programs that emphasize helping behaviour while reducing anxiety, aggression and hyperactivity.
Similarly, physical health & well beingprograms should address the issue of school preparedness while emphasizing physical independence and gross & fine motor skills.

0%
10%
20%
30%
40%
50%
60%
70%
% S
K s
tude
nts
in a
rea
who
pa
rtic
ipat
ed in
ED
I
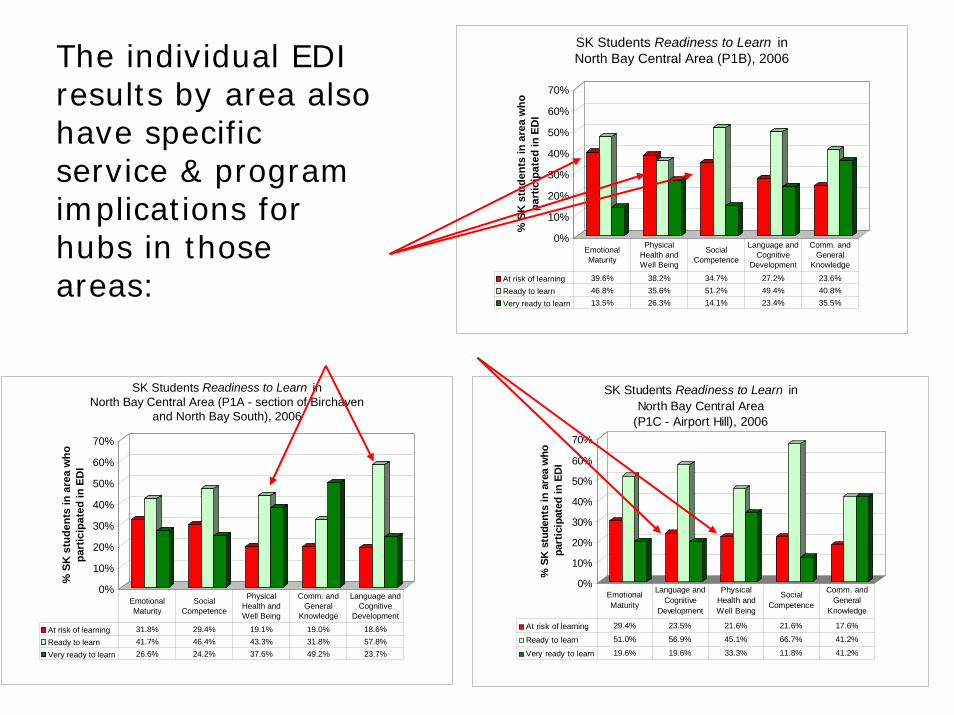
SK Students Readiness to Learn in North Bay Central Area (P1B), 2006
At risk of learning 39.6% 38.2% 34.7% 27.2% 23.6%Ready to learn 46.8% 35.6% 51.2% 49.4% 40.8%Very ready to learn 13.5% 26.3% 14.1% 23.4% 35.5%
Emotional Maturity
Physical Health and Well Being
Social Competence
Language and Cognitive
Development
Comm. and General
Knowledge
The individual EDI results by area also have specific service & program implications for hubs in those areas:

0%
10%
20%
30%
40%
50%
60%
70%
% S
K s
tude
nts
in a
rea
who
pa
rtic
ipat
ed in
ED
I
SK Students Readiness to Learn in North Bay Central Area (P1B), 2006
At risk of learning 39.6% 38.2% 34.7% 27.2% 23.6%Ready to learn 46.8% 35.6% 51.2% 49.4% 40.8%Very ready to learn 13.5% 26.3% 14.1% 23.4% 35.5%
Emotional Maturity
Physical Health and Well Being
Social Competence
Language and Cognitive
Development
Comm. and General
Knowledge
0%
10%
20%
30%
40%
50%
60%
70%
% S
K s
tude
nts
in a
rea
who
pa
rtic
ipat
ed in
ED
I
SK Students Readiness to Learn in North Bay Central Area (P1A - section of Birchaven
and North Bay South), 2006
At risk of learning 31.8% 29.4% 19.1% 19.0% 18.6%Ready to learn 41.7% 46.4% 43.3% 31.8% 57.8%Very ready to learn 26.6% 24.2% 37.6% 49.2% 23.7%
Emotional Maturity
Social Competence
Physical Health and Well Being
Comm. and General
Knowledge
Language and Cognitive
Development
The individual EDI results by area also have specific service & program implications for hubs in those areas:
0%
10%
20%
30%
40%
50%
60%
70%
% S
K s
tude
nts
in a
rea
who
pa
rtic
ipat
ed in
ED
I
SK Students Readiness to Learn in North Bay Central Area
(P1C - Airport Hill), 2006
At risk of learning 29.4% 23.5% 21.6% 21.6% 17.6%
Ready to learn 51.0% 56.9% 45.1% 66.7% 41.2%
Very ready to learn 19.6% 19.6% 33.3% 11.8% 41.2%
Emotional Maturity
Language and Cognitive
Development
Physical Health and Well Being
Social Competence
Comm. and General
Knowledge
0%
10%
20%
30%
40%
50%
60%
70%
% S
K s
tude
nts
in a
rea
who
pa
rtic
ipat
ed in
ED
I
SK Students Readiness to Learn in North Bay Central Area (P1B), 2006
At risk of learning 39.6% 38.2% 34.7% 27.2% 23.6%Ready to learn 46.8% 35.6% 51.2% 49.4% 40.8%Very ready to learn 13.5% 26.3% 14.1% 23.4% 35.5%
Emotional Maturity
Physical Health and Well Being
Social Competence
Language and Cognitive
Development
Comm. and General
Knowledge
0%
10%
20%
30%
40%
50%
60%
70%
% S
K s
tude
nts
in a
rea
who
pa
rtic
ipat
ed in
ED
I
SK Students Readiness to Learn in North Bay Central Area (P1A - section of Birchaven
and North Bay South), 2006
At risk of learning 31.8% 29.4% 19.1% 19.0% 18.6%Ready to learn 41.7% 46.4% 43.3% 31.8% 57.8%Very ready to learn 26.6% 24.2% 37.6% 49.2% 23.7%
Emotional Maturity
Social Competence
Physical Health and Well Being
Comm. and General
Knowledge
Language and Cognitive
Development
The individual EDI results by area also have specific service & program implications for hubs in those areas:
Thank You!