child passenger safety needs and … report documentation page 1. ... michigan state police crash...
TRANSCRIPT

UMTRI-2016-19 SEPTEMBER 2016
CHILD PASSENGER SAFETY NEEDS AND
RESOURCES IN MICHIGAN
MICHELLE L. MACY, SHANNON BRINES, KATHLEEN D. KLINICH, MIRIAM A. MANARY, ACHAM GEBREMARIAM,
AMY J. TEDDY, C. RAYMOND BINGHAM

1
Technical Report Documentation Page 1. Report No.
UMTRI-2016-xx 2. Government Accession No.
3. Recipient's Catalog No.
4. Title and Subtitle
Child Passenger Safety Resources in Michigan 5. Report Date
September 30, 2016
6. Performing Organization Code
7. Author(s)
Macy, Michelle L., Brines, Shannon, Klinich, Kathleen D., Manary, Miriam A., Gebremariam, Acham, Teddy, Amy J., Bingham, C. Raymond
8. Performing Organization Report No.
9. Performing Organization Name and Address
The Child Health Evaluation and Research (CHEAR) Center, University of Michigan Department of Pediatrics and The University of Michigan Transportation Research Institute; Ann Arbor MI 48109
10. Work Unit No. (TRAIS)
11. Contract or Grant No.
12. Sponsoring Agency Name and Address
Michigan Office of Highway Safety Planning 13. Type of Report and Period Covered Final, xx to June 2016
14. Sponsoring Agency Code
15. Supplementary Notes
With acknowledgement to Halimat Olaniyan and Michael Bota for their contributions to data collection and data cleaning
and to Farideh Falmani for her assistance with the Michigan Crash Database.
16. Abstract
This study was performed to characterize child passenger safety resources in Michigan and to analyze the impact of Michigan’s child passenger safety technicians (CPSTs), who are certified to instruct caregivers on how to correctly use child restraints. The objective was to provide OHSP with the information to guide equitable distribution of child passenger safety resources throughout Michigan. Analyses used existing data from the 2010 U.S. Census, the American Community Survey 2009-2013, Michigan State Police crash reports from 2010 through 2014, Michigan Office of Highway Safety Planning (OHSP) lists of certified CPSTs and their locations from 2012 to 2015, OHSP records of child restraint system distribution, and child passenger safety checklist form data from Safe Kids Michigan. Counties were considered areas at risk (with greatest need for child passenger safety resources) based on a composite risk score that included population characteristics including minority race, Hispanic/non-English speaking, poverty, and low educational attainment and crash-related injuries or suboptimal child passenger restraint behaviors associated with a crash adjusted for the child population ≤9 years. Needs and resources were assessed for the 83 counties and 15 OHSP Traffic Safety Regions in Michigan. A survey of CPSTs in Michigan was conducted to gather data on the workforce characteristics. Results show that counties with the highest risk scores are concentrated in the southern Lower Peninsula of Michigan and the counties with the largest number of CPSTs are in the Lower Peninsula. The total number of CPSTs in Michigan has been stable around 950, with 140 to 260 new CPSTs in a given year. Only Keweenaw, Alcona, and Montmorency counties had no CPSTs who reported living or working there. The majority of CPSTs self-identified as white race. Spanish was the most common non-English language spoken by CPSTs. The largest proportions of CPSTs worked in law enforcement, social work/health education, and healthcare. Of the CPSTs considered “high-activity”, most were both paid and volunteered for seat checks and many reported an affiliation with a Safe Kids Coalition. Car seat inspection (or fitting) stations and events were offered primarily in counties throughout the southern Lower Peninsula, with the largest number in metro Detroit and Kent counties. The number of children ≤9 years per CPST per county was lowest in Gogebic (166) and highest in Jackson (4618). Forty counties had 1,000 or more children per CPST and were distributed throughout the state. Data from 32,411 Safe Kids Michigan seat checks revealed that nearly half resulted in a change in restraint type, installation method, or location in the vehicle. Half of seat checks included the distribution of a child restraint system. The most services per child ≤9 years were provided in the following OHSP regions: Thumb Area, West Michigan, South Central, Traverse Bay Area, Huron Valley, and Upper Peninsula Regions. The fewest services per child ≤9 years were provided in the Northern Lower, Southwest, Oakland, and Macomb/St. Clair Regions. In conclusion, the child passenger safety needs are not evenly distributed throughout the state. There is wide variation in the current distribution of child passenger safety resources. Many counties with the most resources have a greater unmet need than lower-resourced counties due to the large total number of children and children considered at risk living within them. 17. Key Word
Child passenger safety technicians 18. Distribution Statement
19. Security Classif. (of this report) 20. Security Classif. (of this page) 21. No. of Pages
22. Price
Form DOT F 1700.7 (8-72) Reproduction of completed page authorized.

2
Table of Contents
List of Figures ................................................................................................................................................ 4
List of Tables ................................................................................................................................................. 5
Executive Summary ....................................................................................................................................... 6
Chapter 1. Background and Objectives ........................................................................................................ 7
Chapter 2. Overview of Data Sources and Methods .................................................................................... 8
Chapter 3. Defining the At Risk Population ................................................................................................ 11
Methods .................................................................................................................................................. 11
Results ..................................................................................................................................................... 13
Factor Variables .................................................................................................................................. 13
Risk Score Assessment ........................................................................................................................ 16
Chapter 4. Number and Location of Michigan Child Passenger Safety Technicians .................................. 21
Methods .................................................................................................................................................. 21
Results ..................................................................................................................................................... 21
CPST Counts and Locations from 2012 to 2015 .................................................................................. 21
CPSTs by Location in 2014 ................................................................................................................... 26
Chapter 5. Characteristics of Michigan Child Passenger Safety Technicians .............................................. 31
METHODS ................................................................................................................................................ 31
Results ..................................................................................................................................................... 32
Demographic Characteristics .............................................................................................................. 34
Education and Occupation .................................................................................................................. 35
Certification ......................................................................................................................................... 37
Roles .................................................................................................................................................... 40
Seat Check Motivation ........................................................................................................................ 41
Types of child restraint systems checked ........................................................................................... 41
Activity Level ....................................................................................................................................... 42
Chapter 6. Events and Inspection Stations ................................................................................................. 48
Methods .................................................................................................................................................. 48
Results ..................................................................................................................................................... 48
Seat Check Coordination ..................................................................................................................... 48
Car Seat Check Locations in Michigan in 2014 .................................................................................... 50
Child Passenger Safety Services in Trauma Facilities .......................................................................... 52
Chapter 7. Impact of Seat Checks and Restraint Systems Distributed to Families .................................... 53

3
Methods .................................................................................................................................................. 53
Results ..................................................................................................................................................... 54
Safe Kids Seat Checks, 2010-2014 ....................................................................................................... 54
Restraint Type and Installation Method ............................................................................................. 55
Child Restraint System Problems Identified ....................................................................................... 56
Changes Resulting from Seat Checks .................................................................................................. 57
Safe Kids Seat Checks by Participant’s County of Residence .............................................................. 58
OHSP-Provided Seats .......................................................................................................................... 60
Chapter 8. Match of Needs and Resources ................................................................................................ 64
Methods .................................................................................................................................................. 64
Results ..................................................................................................................................................... 65
Children per CPST ................................................................................................................................ 65
Child Passenger Safety Services per Child ........................................................................................... 70
Estimated Travel Distances to Seat Check Locations .......................................................................... 71
CPST Capacity and Service Areas ........................................................................................................ 73
Chapter 9. Discussion, Limitations, Conclusions, Recommendations........................................................ 75
Discussion................................................................................................................................................ 75
Population at Risk for Suboptimal Child Passenger Safety Behaviors ................................................ 75
Child Passenger Safety Resources ....................................................................................................... 76
Impact of Car Seat Checks ................................................................................................................... 78
Limitations .............................................................................................................................................. 78
Recommendations .................................................................................................................................. 79
Number of Child Passenger Safety Technicians to meet need ........................................................... 79
Tracking of Seat Check Services .......................................................................................................... 82
Conclusions ............................................................................................................................................. 83
References .................................................................................................................................................. 84
Appendix A: Example Child Passenger Safety Checklist ............................................................................. 86
Appendix B: CPS Technician Survey ............................................................................................................ 87
Appendix C: Full Page Presentation of Maps Included in Report ............................................................. 104

4
List of Figures
Map of Michigan Counties ........................................................................................................ 8 Figure 1.
Michigan Regional Traffic Safety Network ................................................................................ 9 Figure 2.
Counties covered by Safe Kids Michigan Coalitions .................................................................. 9 Figure 3.
Distribution of child population ≤9 years by county ............................................................... 13 Figure 4.
Distribution of minority and non-English speaking populations by county ............................ 14 Figure 5.
Distribution of poverty and low educational attainment by county ...................................... 14 Figure 6.
Distribution of crashes with a child injured or at risk for injury by county ............................ 15 Figure 7.
Distribution of composite risk scores by county; Score 1 and Score 5 ................................... 19 Figure 8.
Relative risk by county; Score 5 .............................................................................................. 19 Figure 9.
Relative risk by census tract; Score 5 .................................................................................. 20 Figure 10.
CPSTs by county with OHSP Regions and Safe Kids Michigan Coalitions ............................ 28 Figure 11.
Distribution of CPSTs by county .......................................................................................... 29 Figure 12.
Counties covered by Safe Kids Michigan Coalitions ............................................................ 29 Figure 13.
CPSTs with additional skills by county in 2014 ................................................................... 30 Figure 14.
Distribution of CPST survey respondents............................................................................ 33 Figure 15.
CPST-reported age group .................................................................................................... 34 Figure 16.
CPST-reported race/ethnicity ............................................................................................. 34 Figure 17.
CPST-reported languages other than English ..................................................................... 35 Figure 18.
CPST-reported occupation .................................................................................................. 35 Figure 19.
CPST-reported highest education level ............................................................................... 36 Figure 20.
CPST-reported area of study or professional training ........................................................ 36 Figure 21.
CPST-reported reasons to obtain and maintain certification ............................................. 37 Figure 22.
CPST-reported number of years since initial certification .................................................. 37 Figure 23.
Years as CPST by occupation ............................................................................................... 38 Figure 24.
Compensation model by years since initial certification .................................................... 38 Figure 25.
Percent of work-time spent on car seat checks .................................................................. 39 Figure 26.
CPST-reported sources of continuing education units ....................................................... 39 Figure 27.
Courses CPSTs have taken or are interested in taking ........................................................ 40 Figure 28.
CPST roles in addition to seat checks .................................................................................. 40 Figure 29.
Factors affecting participation in car seat check ................................................................ 41 Figure 30.
CPST-reported types of child restraint systems checked .................................................... 41 Figure 31.
CPST-reported seat check hours in a typical month ........................................................... 42 Figure 32.
Distribution of CPSTs by activity level ................................................................................. 43 Figure 33.
CPST activity level by compensation ................................................................................... 43 Figure 34.
CPST activity level by work with a Safe Kids Coalition ........................................................ 44 Figure 35.
CPST activity level by occupation ........................................................................................ 44 Figure 36.
Activity level by years since initial certification .................................................................. 45 Figure 37.
CPST coordinated events and inspection stations .............................................................. 49 Figure 38.
CPST-reported source of caregivers for events and inspection stations ............................ 49 Figure 39.
Locations of car seat check inspection stations and events in 2014 .................................. 50 Figure 40.
Frequency of car seat check occurrences by county in 2014 ............................................. 51 Figure 41.
Number of Safe Kids Michigan seat checks, crashes, and CPSTs by year ........................... 54 Figure 42.

5
Total number of car seats checked for Safe Kids Michigan per county .............................. 58 Figure 43.
Safe Kids Michigan seat checks resulting in change ........................................................... 59 Figure 44.
Safe Kids Michigan seat checks where a seat was provided............................................... 59 Figure 45.
Total seat checks 2010-2014 relative to number of CPSTs in 2015 .................................... 60 Figure 46.
OHSP seats distributed per county ..................................................................................... 63 Figure 47.
Children ≤9 years per CPST per county ............................................................................... 69 Figure 48.
Estimated family travel distances to seat check locations by county ................................. 71 Figure 49.
Location-Allocation analysis “Spider Maps” ....................................................................... 74 Figure 50.
CPST service territories based on current CPST location .................................................... 74 Figure 51.
List of Tables
Key socio-demographic factors ............................................................................................... 11 Table 1.
Variables and weighting schemes to calculate composite Risk Scores .................................. 12 Table 2.
Crashes in Michigan over 5 years ............................................................................................ 15 Table 3.
Comparison of Risk Scores by county ..................................................................................... 16 Table 4.
Counts of Michigan CPSTs by year .......................................................................................... 22 Table 5.
Change in CPST and CPST-I* counts by county ....................................................................... 22 Table 6.
Presence of CPSTs and CPSTs with additional skills by county, 2012-2015 ............................ 24 Table 7.
Number of CPSTs per region relative to Safe Kids Coalition coverage ................................... 27 Table 8.
CPST activity level categories .................................................................................................. 32 Table 9.
Response rate by region ......................................................................................................... 33 Table 10.
Distribution of Responses by CPSTs activity level ................................................................... 42 Table 11.
Estimated number of car seats checked across CPST activity level ........................................ 43 Table 12.
Survey response rate by county and by activity level ............................................................. 45 Table 13.
Child passenger safety services in Michigan Trauma Facilities ............................................... 52 Table 14.
Safe Kids Michigan seat check checklist; characteristics – on arrival ..................................... 55 Table 15.
Safe Kids Michigan seat check checklist; characteristics – on departure ............................... 56 Table 16.
Problems identified in Safe Kids Michigan seat checks .......................................................... 56 Table 17.
Overall impact of Safe Kids Michigan seat checks .................................................................. 57 Table 18.
Changes in restraint type as a result of Safe Kids Michigan seat checks ................................ 57 Table 19.
High-activity CPSTs, Safe Kids services, and OHSP seats by county ........................................ 61 Table 20.
Children, CPSTs, and children per CPST per OHSP Region ...................................................... 65 Table 21.
Children ≤4 years and 5 to 9 years old per CPST by county .................................................... 65 Table 22.
Child passenger safety services per child population ≤4 years by region............................... 70 Table 23.
Estimated family travel distance to seat check locations by county ...................................... 72 Table 24.
Location-Allocation derived CPST travel distance to service points ....................................... 73 Table 25.
CPSTs needed to meet proposed number of seat checks ...................................................... 80 Table 26.

6
Executive Summary
In 2014, over 16,000 children in Michigan aged 9 and under were involved in police-reported motor vehicle crashes (MVCs), resulting in nine fatalities, 825 non-fatal injuries, and 1,864 possible injuries. The risk to children of serious or fatal injury in a crash has declined dramatically as more children use appropriate restraint systems and child passenger safety laws have been strengthened. Although the passage of the upgraded law in Michigan in 2008 was a positive step, work to improve child passenger safety is still needed as MVCs remain a leading cause of death among Michigan children.
This study characterized child passenger safety needs and resources in Michigan. We analyzed the impact of Michigan’s child passenger safety technicians (CPSTs). Our objective was to provide the Michigan Office of Highway Safety Planning (OHSP) with information to guide equitable distribution of child passenger safety resources throughout Michigan.
Analyses used existing data sources including the 2010 U.S. Census, the American Community Survey 2009-2013, Michigan State Police crash reports from 2010 through 2014, OHSP lists of certified CPSTs and their locations from 2012 to 2015, OHSP records of child restraint system distribution, and child passenger safety checklist form data from Safe Kids Michigan. Need for child passenger safety resources was assessed with composite risk scores weighted for population characteristics such as minority race, Hispanic/non-English speaking, poverty, and low educational attainment and the size of the child population ≤9 years. Numbers, characteristics, and activity of CPSTs were obtained from OHSP lists and an online survey. Child Passenger Checklist forms obtained from Safe Kids Michigan and OHSP child restraint system distribution lists were utilized to assess the impact of CPSTs. Results show that counties with the highest risk are concentrated in the southern Lower Peninsula of Michigan and the counties with the largest number of CPSTs are also in the Lower Peninsula. The total number of CPSTs in Michigan has been stable around 950, with 140 to 260 new CPSTs in a given year. Only Keweenaw, Alcona, and Montmorency counties had no CPSTs who reported living or working there. In the survey of CPSTs, the response rate was proportional to the distribution of CPSTs by county, suggesting the results provide a good representation of the population of CPSTs. The majority of CPSTs self-identified as white race. Spanish was the most common non-English language spoken by CPSTs. The largest proportions of CPSTs worked in law enforcement, social work/health education, and healthcare. Most CPSTs check only one or two types of child restraint systems. The majority completed five seat checks per month or fewer and on average spent 1 to 5 hours checking seats per month. Of the CPSTs considered “high-activity”, most were both paid and volunteered for seat checks and many reported an affiliation with a Safe Kids Coalition. Convenience (i.e., time of day or distance to the event) was the factor with the greatest effect on seat check participation. Most CPSTs believe their clients hear about seat checks by word of mouth, from a website or social media, and from signs posted about the event.
Car seat inspection (or fitting) stations and events were offered primarily in counties throughout the southern Lower Peninsula, with the largest number in metro Detroit and Kent counties. Safe Kids Coalition inspection stations and events resulted in 32,411 seat checks in a four-year timespan. Nearly half of these seat checks resulted in a change in restraint type, installation method, or seat location in the vehicle. Half of seat checks resulted in the provision of a child restraint system. The number of children nine and younger per CPST per county was lowest in Gogebic (166) and highest in Jackson (4618). Forty counties had 1,000 or more children per CPST and were distributed throughout the state. The most services per child were provided in the following OHSP regions: Thumb Area, West Michigan, South Central, Traverse Bay Area, Huron Valley, and Upper Peninsula Regions. The fewest services per child were provided in the Northern Lower, Southwest, Oakland, and Macomb/St. Clair Regions.

7
Chapter 1. Background and Objectives
In 2014, over 16,000 children in the state of Michigan aged 9 and under were involved in police-
reported motor vehicle crashes (MVCs). Of these, nine were killed, 825 suffered non-fatal injuries and
1,864 sustained possible injuries.1 The risk of serious or fatal injury in a crash has declined dramatically
over the past 40 years, as more children use appropriate restraint systems and child passenger safety
laws are strengthened.2 The Michigan child passenger safety law was last upgraded in 2008, requiring
children to use appropriate restraint systems up to age 8.3 Although the passage of the upgraded law
was accompanied by educational efforts to ensure that caregivers select and use appropriate child
passenger restraint systems, work to improve child passenger safety is still needed. Motor vehicle
crashes remain a leading cause of death among children in Michigan and nationally.4-6 In 2014, Michigan
children 4 to 10 years old had the lowest use of restraints compared with children of other ages involved
in police reported crashes.4 In addition, it is estimated that 50-75% of child restraint systems are used or
installed incorrectly.7-10 Suboptimal child passenger safety behaviors have been associated with poverty,
low educational attainment, and minority race/ethnicity.11-13
Child Passenger Safety Technicians (CPSTs) play a key role in helping children travel more safely. In the
late 1990’s, the National Highway Traffic Safety Administration (NHTSA) developed the CPST training
program. The program consists of a 3 to 4-day initial training course that teaches participants about the
safe transportation of children in motor vehicles through classroom and hands-on activities. Graduates
of the program are authorized to educate caregivers to correctly select, install and use child restraint
systems. CPSTs maintain their certification on a two-year cycle by earning continuing education units
(CEUs) and participating in car seat checks. CPSTs are encouraged to work in teams and with an
experienced senior checker, rather than as individuals to assure that caregivers receive quality
education and to better address challenging or unique situations that can arise during the course of a
car seat check.
The training program is now managed by the National Child Passenger Safety Board14 and certification is
administered by Safe Kids Worldwide.15 Safe Kids Worldwide serves as a resource for coalitions
throughout the United States to promote child safety in a number of realms, including the safety of child
passengers. Safe Kids Michigan is a program within the Injury and Violence Prevention Section of the
Michigan Department of Health and Human Services. Safe Kids Michigan leads 13 in-state coalitions to
create an environment where children are free from accidental injury.16 The Michigan State Police Office
of Highway Safety Planning (OHSP) has received funding from NHTSA to train new CPSTs, provide CEU
opportunities to enable CPSTs to maintain their certification, and provide child restraint systems to
families in need through car seat checks.
Car seat checks are held throughout the state and can be sponsored by a wide range of organizations
including local Safe Kids coalitions, law enforcement agencies, healthcare facilities, county health
departments, churches, and retailers. Some car seat checks recur regularly at fixed inspection (or fitting)
stations that take appointments or drop-in customers, while some are intermittent or one-time events.
The CPST workforce in Michigan is more than 900 strong and includes paid employees and volunteers.
However, the distribution and availability of CPSTs and car seat checks across Michigan is unknown. Of
particular concern is the potential for the children with the greatest anticipated need for child passenger
safety resources to have limited access to car seat checks and CPST services.

8
The purpose of the current study was to characterize child passenger safety resources in Michigan in
terms of quantity, location, and service delivery in relation to the child population that is anticipated to
be in greatest need for these resources. In other words, the children at risk for suboptimal child
passenger safety behaviors need the resources most. We also sought to analyze the impact of
Michigan’s CPSTs based on the number of children serviced, changes as the result of a car seat check,
and the distribution of child restraint systems. Our objective was to provide OHSP with the information
necessary to guide equitable distribution of child passenger safety resources throughout Michigan.
Chapter 2. Overview of Data Sources and Methods
To achieve our objective, we relied on existing data sources and data collected from CPSTs and Trauma
Facilities17 throughout Michigan. There are 83 counties (Figure 1) and 2767 census tracts in Michigan.
Michigan counties are grouped into 15 OHSP Traffic Safety Regions (Figure 2).18 There are 13 Safe Kids
Michigan Coalitions that cover 30 counties (Figure 3).16 We present results at the county level, census
tract level, and in relation to the Traffic Safety Regions and Safe Kids Coalitions. We include a full-page
view of each map contained in this report in Appendix C.
Map of Michigan Counties Figure 1.

9
Michigan Regional Traffic Safety Network Figure 2.
Counties covered by Safe Kids Michigan Coalitions Figure 3.

10
We defined the population “at risk” for preventable injury due to increased likelihood of suboptimal
child passenger safety behaviors using data from the 2010 U.S. Census,19 the American Community
Survey 2009-2013,20 and the Michigan Crash database 2010 through 2014. The American Community
Survey data represent 5-year rolling averages for population characteristics. We utilized principal
component analysis for data reduction and key factors were identified. To develop composite risk
scores, we tested six different schemes for factor weighting based on literature associating demographic
characteristics to suboptimal child passenger safety behaviors and the known association between
suboptimal child passenger safety behaviors and risk of injury in crashes. Four of the weighting schemes
were adjusted for the county population; one was adjusted for the population of children ≤9 years.
Information related to child passenger safety resources in Michigan from 2010 through 2014 was
gathered from OHSP lists of certified CPSTs in Michigan, reports of child restraint systems distributed
through OHSP, and Child Passenger Safety Checklist forms collected by Safe Kids Michigan (Appendix A).
OHSP provided the study team with annual reports listing certified CPSTs in Michigan for the month of
July in 2012, 2013, and 2015 and the month of September in 2014. Reports contained the following
information: unique Safe Kids ID for each CPST, home or work address as reported by the CPST, CPST
instructor status, Spanish language skills, and training to work with children with special needs.
OHSP also provided the research team with data related to child restraint systems distributed through
their community car seat distribution program from 2012 through 2014 in the Lower Peninsula. These
data included: 1) reporting forms (a CPST-generated single page report of the child restraint systems
distributed to families and their Agency/Organization); 2) half sheets (a tally of child restraint systems
for which OHSP received documentation of distribution); and 3) child passenger safety checklist forms
(submitted by CPSTs to document their distribution of OHSP-purchased child restraint systems). The
number of OHSP seats distributed throughout the Lower Peninsula by county was determined from the
reporting forms. OHSP handles child restraint systems distributed in the Upper Peninsula differently. All
child restraint systems purchased through a grant from OHSP are distributed through the Kids Always
Ride Safe (KARS) project director. We obtained summary files, containing the number of OHSP-funded
child restraint systems distributed in the Upper Peninsula from 2010 through 2014 and the agency of
distribution, directly from the project director.
Safe Kids Child Passenger Safety Checklist forms, submitted by CPSTs affiliated with local coalitions to
Safe Kids Michigan, were transferred to Safe Kids Worldwide through their standard processes. Safe Kids
Worldwide extracted data from the forms using optical recognition software. The research team
received an Excel file containing the data and links to electronic copies of the paper forms from Safe Kids
Michigan. We assessed the impact of the Safe Kids seat checks by determining if the CPST documented a
change in seat type, a change in installation method, or a problem, such as a recalled seat.
The CPST workforce and provision of services were characterized using surveys, interviews, and reviews
of hospital websites. We conducted an online survey of CPSTs certified in Michigan as of September 29,
2015 (Appendix B). We conducted interviews regarding the location and frequency of car seat checks
offered in 2014 with a subset of CPSTs who self-identified as or were known to be coordinators of car
seat check services. Given the known association between trauma programs and injury prevention
programs, we also determined if Michigan hospitals designated as trauma facilities provide services such
as car seat checks or car seat distribution programs by reviewing their websites and contacting their
hospital operator.

11
We attributed Census and American Community Survey data to census tracts and counties based on
Federal Information Processing Standard (FIPS) Codes. Agency/Organization locations were determined
through searches on Google Maps (Google, Inc., Mountain View, CA). We geocoded the addresses of
participants from the Child Passenger Safety Checklist forms, locations of the CPSTs in Michigan, and
locations of child passenger safety services using Google Maps Geocoding API (Google Inc., Mountain
View, CA) and mapped the geocoded addresses using ArcGIS Desktop 10.3.1 (ESRI, Inc., Redlands, CA).
Chapter 3. Defining the At Risk Population
METHODS
We defined the population with greatest anticipated need for child passenger safety resources using
data from the 2010 U.S. Census, the American Community Survey 2009-2013, and the Michigan Crash
database 2010 through 2014. Data are collected for the U.S. Census every 10 years, most recently in
2010. Census data of interest for this assessment included the total population by age, the racial and
ethnic composition of the population, total households, households with children under 18, households
with children under 5, female headed households, unoccupied housing units, and rental housing units.
The U.S. Census categorizes age in 5-year age-groups. We included two age groups in this study, birth to
4 years and 5 to 9 years, as these are the children most likely to benefit from use of a child restraint
system and contact with a CPST. The American Community Survey data represent 5-year rolling averages
for population characteristics. From the American Community Survey, we examined the following
variables: median household income, annual household income (below $25,000 and between $25,000
and $50,000), families with children under 18 living below poverty, families with children younger than 5
living below poverty, households with no vehicle, unemployment, educational attainment (high school
education or less), population 5 years and older that speaks Spanish in the home, and population 5 years
and older that speaks a language other than English or Spanish in the home.
We utilized principal component analysis to explore the socio-demographic data and we identified five
factors: 1) target population; 2) minority race; 3) Hispanic/non-English speaking; 4) poverty; and 5) low
educational attainment (Table 1). We discussed variables that contributed to each factor and made
adjustments to factors through an iterative process that sought to minimize collinearity.
Key socio-demographic factors Table 1.
Factors Variables
Target population Population ≤9 years old
Minority race Black/African American Native American Asian/Pacific Islander
Hispanic/non-English speaking Hispanic speaks a language other than English “Other” non-white race
Poverty % Female headed household % Rental housing % Low income threshold(s) <25K, 25 to <50K % Household with no vehicle % Unemployment
Low educational attainment High school education or less

12
We also created a factor to represent higher risk of injury in a crash based on data contained in the
Michigan Crash Database from 2010 through 2014. Crash data were analyzed to determine the number
and location, at the county level, of crashes that involved children ≤9 years old who were injured or
killed or were considered at risk for injury because they were improperly restrained or sitting in a front
seat. Both non-incapacitating and incapacitating injuries were included in these counts. We considered
children improperly restrained if they had any of the following codes indicated in the crash report: 1) no
belts used; 2) child restraint not used, unavailable, or improper use; 3) lap belt only; 4) shoulder belt
only. We determined counts of crashes per year within the Michigan Crash database and then
aggregated crash counts over the 5-years due to small sample sizes of children killed or severely injured
in individual years. Crash data were adjusted for the average annual vehicle miles traveled (AVMT) per
county based on 2010 to 2013 reports from the Michigan Department of Transportation. We focused
our analyses on the county level because county is the level of aggregation for AVMT data.
We evaluated the Annual Direct Observation Survey of Safety Belt Use 2011, 2012, and 2014 for
inclusion as a measure of the proportion of unrestrained drivers per county, because there is a strong
association between unrestrained drivers and unrestrained child passengers.13 Ultimately, we
determined that this information would not be useful in our analyses as data were only available for 32
or 33 of the 83 counties in Michigan depending on the year.21
We created index scores for each factor based on the distribution of the measure across counties. We
then used the index scores to develop composite risk scores as measures of the population “at risk” for
preventable injury. We tested six different weighting schemes (Table 2) for the factors based on
literature associating demographic characteristics to child passenger safety behaviors and the risk of
injury associated with suboptimal child passenger safety behaviors. Risk Scores 1 through 4 were
adjusted for the total county population. Score 5 was scaled to range from 0 to 100 and adjusted for the
child population ≤ 9 years without including the target population as a factor in the score calculation.
Variables and weighting schemes to calculate composite Risk Scores Table 2.
Factor Variables Risk Score
0* 1 2 3 4 5**
U.S. Census/American Community Survey data Variable Weights
Target population Population 9 and under 0.25 0.25 0.30 0.30 0.30 0
Minority race All non-white except ‘other’ non-white 0.15 0.15 0.20 0.15 0.10 0.20
Hispanic/non-English speaking
Hispanic, non-English speaking, and other non-White
0.15 0.15 0.20 0.15 0.10 0.20
Poverty % Female headed household % Rental housing % Low income thresholds <25K, 25-49K % Household with no vehicle % Unemployment
0.10 0.10 0.15 0.15 0.10 0.15
Low education High school education or less 0.10 0.10 0.15 0.10 0.10 0.15
Crash data
CRASH Crash involving a child 9 and younger who was injured, killed, improperly restrained, or sitting in the front seat
0.25 0.25 0 0.15 0.30 0.30
*Score 0 not population adjusted; **Score 5 excludes the “target population” factor, adjusted for child population

13
We appraised the changes in county-level Risk Scores across the six weighting schemes. For this report,
we focus on and present maps for two Risk Scores, Score 1 and Score 5. We selected Score 1 because it
includes the crash factor and places greater weight on race/ethnicity than on poverty and low
educational attainment, adjusting for the total county population. Research suggests a persistent
association between suboptimal restraint use and non-white race/non-Hispanic ethnicity after adjusting
for socioeconomic status12 and the potential for the provision of child restraint systems to overcome
some of the barriers to child restraint system use in low-income populations.22 We selected Score 5 in
order to examine the effect of removing the target population factor from the score and applying the
Score to each county and census tract adjusting for the population of children ≤9 years in those areas.
Score 5 is similar to Score 1 in the distribution of weights for the other factors.
We generated maps in ArcGIS to illustrate the distribution of variables contributing to each factor, the
distribution of Scores 1 and 5 across counties, relative risk (county score divided by state mean score)
using Score 5, and distribution of Score 5 across census tracts. Map labels include numeric values of
counts, proportions, index scores and the composite Risk Scores. We used natural breaks or quintiles to
set the color-shading schemes for each map. We mapped and analyzed these data at the county level
because some data were available only at the county level, e.g., AVMT and because counties define the
regions within which child passenger safety services were organized.
RESULTS
Factor Variables
According to the 2010 U.S. Census there were more than 1.2 million children 9 years and younger living
in Michigan. Figure 4 shows the distribution of children ≤9 years old by county. While southeast
Michigan has the counties with the largest child populations, the western Lower Peninsula contains a
number of counties where relatively high proportions of their populations are young children.
Distribution of child population ≤9 years by county Figure 4.
Proportion of county population
that was ≤9 years
per 2010 U.S. Census
Total child population ≤9 years
by county
per 2010 U.S. Census

14
Figure 5 presents the proportion of each county population from a minority racial background (left),
Hispanic ethnicity (center), or non-English speaking (right). The counties with higher proportions of
population that was non-white race primarily contain large urban areas (e.g., Wayne, Genesee, Saginaw,
Kalamazoo, and Kent) or are located in the eastern Upper Peninsula. The counties with higher
proportions of population that was Hispanic show a similar pattern but also are located in agricultural
areas along the western Lower Peninsula. Counties with higher proportions of their population that
were non-English speaking are more concentrated in the southern half of the Lower Peninsula.
Distribution of minority and non-English speaking populations by county Figure 5.
Figure 6 illustrates the distribution of populations with greater poverty based on a scaled poverty factor
and the proportions of the county adult population with low educational attainment. Counties with
higher scaled poverty scores were distributed throughout the state. However, low educational
attainment was most prevalent in the Thumb region and across the northern Lower Peninsula.
Distribution of poverty and low educational attainment by county Figure 6.
Proportion of county adult population with low educational attainment
per 2010 U.S. Census
Distribution of poverty by county
based on a scaled poverty factor
Proportion of county population that was non-white
per 2010 U.S. Census
Proportion of county population that was Hispanic
per 2010 U.S. Census
Proportion of county population that was non-English speaking
per 2010 U.S. Census

15
In the 2010 to 2014 Michigan Crash Database, 45,506 crash records included a passenger ≤9 years old (10% of 459,489 total crash records). There was an increase from 2010 to 2014 in the total number of crashes involving child passengers ≤9 years old who were killed, injured, improperly restrained or sitting in the front seat (Table 3).
Crashes in Michigan over 5 years Table 3.
Year 2010 2011 2012 2013 2014
Crashes involving a child ≤9 years old who was killed, injured, improperly restrained or in the front
1,569 1,615 1,739 1,794 2,161
Total crashes† 282,075 284,049 273,891 289,061 298,699
Total fatal crashes† 937 889 936 951 876
Fatal crashes involving children birth to 10 years† 19 13 22 15 11 †Data obtained from the Summary of Traffic Crashes on Michigan Roadways in Calendar Year 2014
23
Of the 45,506 crashes with children ≤9 years old, 8,879 (19.5%) included child passengers who were
killed, injured, or considered at risk for injury based on our study criteria. In the 5 years, there were 60
fatal injuries, 643 incapacitating injuries, and 2,350 non-incapacitating injuries. In 6,229 crashes, a child
was seated where no belts were available. In 3,026 crashes, a child was improperly restrained [i.e., used
only a shoulder belt (183), used only a lap belt (1,315), used no belts (706), or a child restraint was not
used, unavailable or was used improperly (999)]. Children ≤9 years old were in the driver seat in 291
crashes, in the front middle seat in 307, and in the front passenger seat in 1,016 crashes. Crashes
involving children injured or at risk for injury were normalized per 100,000 average (calculated from
2010-2013 data) AVMT per county and were mapped at the county level (Figure 7). When mapped, the
density of crashes aligned with population centers and along major highways.
Distribution of crashes with a child injured or at risk for injury by county Figure 7.
Crashes involving children ≤9 years who were killed/injured, improperly restrained, or sitting in front
per 100,000 average Annual Vehicle Miles Traveled by county, 2010-2014

16
Risk Score Assessment
Table 4 compares the composite Risk Scores at the county level across the six factor weighting schemes.
Higher scores represent a greater potential risk for preventable injury in motor vehicle collisions due to
increased likelihood of suboptimal child passenger safety behaviors. Using the weighting scheme for
Score 5, the state-wide mean risk score at the county level was 32.73 (Standard Deviation (SD) 17.6) and
the state-wide mean risk score at the census tract level was 37.15 (SD 19.52). Table 4 is sorted from
highest to lowest Risk Score, using the weighting scheme for Score 5. Score 5 was scaled to range from 0
(lowest risk) to 100 (highest risk). The cells in Table 4 are highlighted red for the highest scores, yellow
for mid-range scores, and green for the lowest scores. The greatest change in the ranking of counties
according to their composite Risk Scores was with the adjustment for total county population (Score 0 to
Score 1) and with the adjustment for the population of children ≤9 years (Score 1 to Score 5).
Comparison of Risk Scores by county Table 4.
County Score 0 Score 1 Score 2 Score 3 Score 4 Score 5
Wayne 85.17 73.05 83.68 78.23 70.81 100
Muskegon 30.53 69.91 59.2 67.84 75.67 90.5
Branch 18.08 57.53 53.76 57.57 62.67 63.97
St. Joseph 14.61 60.71 63.31 63.25 64.44 63.39
Lake 13.11 42.63 41.42 42.85 45.05 62.87
Saginaw 13.51 52.73 61.38 57.24 52.75 60.83
Ingham 18.71 52.01 56.33 54.79 50.85 59.93
Isabella 13.97 43.21 41.91 44.21 45.56 53.67
Kent 29.66 58.53 66.39 63.03 59.16 52.86
Oceana 6.91 54.48 63.74 58.46 54.81 52.14
Genesee 18.79 50.89 60.65 57.08 52.38 51.47
Berrien 11 49.38 57.42 53.87 49.96 50.84
Clare 12.39 43.16 42.87 45.1 47.56 50.47
Chippewa 7.07 42.38 48.7 45.77 42.08 49.34
Montcalm 14.7 48.15 46.46 49.5 53.32 48.24
Van Buren 8.42 51.99 60.64 56.06 52.63 48.21
Calhoun 10.26 49.87 58.01 55.05 51.54 48.09
Oscoda 6.82 38.16 43.18 41.42 40.92 43.12
Kalamazoo 15.24 46.51 50.6 50.26 48.04 42.35
Cass 10.07 43.88 46.57 46.02 46.94 41.09
Newaygo 8.71 46.13 51.27 49.48 49.57 40.85
Mackinac 0.45 33.03 45.15 37.96 31.24 40.81
Baraga 0.27 35.16 47.69 40.08 33.59 40.15
Luce 4.98 34.02 39.7 36.28 34.07 39.91
Macomb 29.55 43.35 51.79 47.36 43.55 38.43

17
County Score 0 Score 1 Score 2 Score 3 Score 4 Score 5
Tuscola 10.09 40.3 42.16 42.35 44.52 36.82
Schoolcraft 1.34 32.65 43.4 37.51 33.34 36.28
Washtenaw 13.9 41.46 49.85 45.5 38.86 35.48
Lenawee 9.1 41.19 46.16 44.2 43.25 35.23
Eaton 11.64 41.56 42.91 43.42 43.73 35.21
Sanilac 5.61 40.3 47.99 44.7 43.74 34.77
Hillsdale 8.23 41.42 45.56 44.88 45.71 34.2
Manistee 7.29 33.22 35.93 35.51 35.14 34.02
Oakland 41.47 42.66 49.82 45.94 41.43 33.57
Jackson 9.73 40.58 46.52 44.91 43.1 33.52
Gratiot 3.88 37.09 45.96 41.73 38.44 32.52
Osceola 5.31 41.77 49.13 46.85 46.02 32.23
Emmet 13.64 38.28 32.95 37.97 42.86 31.8
Mecosta 6.19 34.69 39.73 38.55 37.14 31.66
Huron 6.51 32.84 36.93 35.01 35.76 31.41
Cheboygan 5.22 32.3 37.77 35.87 34.77 31.33
Alger 2.57 27.36 34.56 30.31 27.29 30.6
Ionia 7.49 42.52 48.06 46.45 46.02 30.59
Mason 6.63 36.54 40.74 39.89 39.19 30.36
Ogemaw 3.67 31.1 38.31 35.52 33.68 29.31
Houghton 6.36 36.96 41.68 40.54 39.63 29.03
Roscommon 4.05 24.2 29.46 27.26 25.54 28.78
Bay 7.25 37.23 43.65 41.46 39.85 28.41
Wexford 5.68 41.49 48.18 47.02 46.17 28.11
Ontonagon 3.75 21.97 26.45 23.79 22.5 27.92
St. Clair 8.94 37.56 43.58 41.75 40.6 27.91
Iosco 3.3 25.18 31.51 28.6 26.44 26.8
Gladwin 3.2 30.09 37.55 34.02 32.22 26.59
Gogebic 3.82 26.18 31.33 29.42 27.08 26.5
Ottawa 11.63 44.94 53.66 49.36 46.21 25.69
Alpena 6.65 31.88 34.76 34.91 35.25 25.52
Kalkaska 3.66 35.45 42.9 40.33 39.34 24.62
Montmorency 1.54 22.87 30.46 26.92 24.06 23.72
Lapeer 7.19 35.17 39.8 38.08 38.07 23.56
Arenac 1.5 27.58 36.22 32.02 29.62 22.55
Allegan 5.54 42 51.58 47.01 44.55 22.36

18
County Score 0 Score 1 Score 2 Score 3 Score 4 Score 5
Delta 5.28 31.56 36.14 35.04 34.69 21.77
Alcona 3.85 16.67 19.4 17.54 17.23 21.12
Menominee 1.64 28.56 37.15 33.29 30.72 20.05
Barry 8.11 36.44 38.6 38.75 41.08 19.92
Monroe 7.43 34.6 40.73 38.43 37.58 19.46
Missaukee 0.8 34.41 45.04 40.39 37.6 19.42
Iron 0.72 21.98 30.02 25.81 22.81 18.8
Charlevoix 5.65 31 34.11 34.03 34.18 18.3
Presque Isle 1.65 21.77 28.43 24.87 22.96 18.16
Marquette 5.51 26.95 30.55 29.79 29 17.28
Shiawassee 3.58 32.67 40.7 37.88 35.96 16.79
Otsego 3.61 32.47 38.73 36.94 36.24 16.74
Dickinson 2.34 26.78 33.55 30.77 29.37 14.72
Crawford 0.47 24.12 32.62 28.97 26.15 14.38
Benzie 2.24 28.6 35.24 32.56 31.06 12.89
Midland 4.83 30.49 35.61 34.22 33.22 9.15
Antrim 0.87 25.01 32.75 29.49 27.17 8.93
Clinton 4.24 32.63 38.72 36.34 35.15 8.67
Grand Traverse 3.61 27.47 33.39 31.73 30.05 5.22
Livingston 9.57 29.18 29.45 30.71 33.27 1.86
Keweenaw 0 18.31 24.4 21.82 20.35 0.25
Leelanau 0.44 18.01 23.53 20.63 17.96 0
Figure 8 shows the distribution of the composite risk scores by county based on Score 1 (left) and Score 5 (right). The counties with the 5 highest composite Risk Scores based on Score 1 were located in South Central region (Branch, St. Joseph), West Michigan region (Kent), Lakeshore region (Muskegon), and Wayne County. The counties with the 5 lowest composite Risk Scores based on Score 1 were located in the Traverse Bay Area region (Leelanau), Northern Lower region (Alcona, Presque Isle) and Upper Peninsula (Keweenaw, Ontonagon). When using Score 5, which adjusts for the population of children ≤9 years in the county, we observe changes in the county rankings for the 5 highest and 5 lowest risk scores. Lake County moved into the 5 highest risk scores and Kent County ranked 9th. Grand Traverse, Livingston, and Clinton Counties replaced Alcona, Presque Isle, and Ontonagon Counties for the 5 lowest risk scores.
Figure 9 shows relative risk scores for each county. Relative risk scores ranged from a high of 3.06 for Wayne County to a low of 0 for Leelanau County. Muskegon and Wayne Counties were more than 2.5 SD above the average risk score for the state. Lake, Saginaw, Ingham, St. Joseph and Branch Counties were 1.5-2.5 SD above the average risk score for the state. Keweenaw, Leelanau, Grand Traverse, and Livingston Counties were more than 1.5 SD below the average risk score for the state.

19
Distribution of composite risk scores by county; Score 1 and Score 5 Figure 8.
Relative risk by county; Score 5 Figure 9.
Distribution of composite risk scores by county
based on Score 1 weighting scheme
Distribution of composite risk scores by county
based on Score 5 weighting scheme
Relative risk by county based on Score 5 weighting scheme
Relative Risk = County risk score divided by the mean risk score for Michigan

20
Figure 10 shows relative risk scores applied to census tracts and demonstrates that county-level
aggregation obscures smaller areas of higher or lower risk for suboptimal child passenger safety.
Relative risk by census tract; Score 5 Figure 10.
Relative Risk by Census Tract based on Score 5 weighting scheme
with insets for Southwest and Southeast Michigan and outlines for OHSP Regions
Southwest Michigan Southeast Michigan

21
Chapter 4. Number and Location of Michigan Child Passenger Safety Technicians
METHODS
We received lists from OHSP of the certified CPSTs in Michigan in the months of July 2012, July 2013,
September 2014 and July 2015. Lists included the CPST’s Safe Kids ID, their home or work address as
reported by the CPST, and indicators of additional specialization including CPST Instructor (CPST-I)
status, instructor candidate, technician proxy, Spanish language skills, and training to work with children
with special needs.
CPST Instructors are experienced technicians who have sufficient training to teach the CPST Certification
Course. Those interested in becoming a CPST-I complete an application process and submit a $75 fee.
Once approved as an instructor candidate, the CPST spends a period of time (less than one year)
receiving mentorship and undergoing evaluation to determine if the candidate is prepared to take on
the instructor role. Technician proxy is a role that was created by Safe Kids Worldwide to bridge the gap
in parts of the country where there are few certified instructors. Technician proxies must be certified
CPSTs for at least 6 months before they can submit an application with a small fee and two testimonials
attesting to their ability to provide suitable feedback and pass/fail seat checks appropriately. Once
approved, technician proxies can review and approve seat checks for recertification.
CPST lists from all years were included in our assessment of the counties in which new CPSTs were
certified during the study period and for results examining changes in the number of CPST per county
over time. CPSTs were considered newly certified if their Safe Kids ID was not present in the 2012
dataset. The CPST list from 2014 was selected for presentation of the summary results due to the ability
to relate the 2014 information to other datasets obtained for this study from that year.
CPST addresses (business or home) contained in these files were geocoded using Google Maps
Geocoding API (Google Inc., Mountain View, CA) and mapped the at the county level using ArcGIS
Desktop 10.3.1 (ESRI, Inc., Redlands, CA). The vast majority (90%) of addresses were geocoded on the
first attempt. The study team completed hand correction of addresses that mapped to a locality, natural
feature, or sub-premise. Results are organized by county within Traffic Safety Network Regions. We also
indicate counties that are covered by a Safe Kids Michigan Coalition.
RESULTS
CPST Counts and Locations from 2012 to 2015
The OHSP files contained information for more than 900 CPSTs in each year (Table 5). The total number
of CPSTs has increased from 2012 to 2015 by 32 while the number of CPSTs with specialization remained
stable. Table 5 also provides annual counts of CPSTs with new certifications, instructor status, instructor
candidates and technician proxies, special needs training, and Spanish language skills per year.
Overall, 85% of CPSTs provided a business address in the OHSP lists. There were 43 technicians with a
geocoded business or home address for whom there was a change in the county location of their
address during the study period. Twenty-four address differences were for the same agency; 13 of
these represented different Michigan State Police posts. Six CPST had a different address with a
different agency, 4 changed between listing business or another address, and 3 listed different non-
business addresses. We were unable to determine the type of change for 6 addresses. Most of the

22
CPSTs with different addresses in different years provided addresses that mapped to adjacent counties
(28 of 43, 65%).
Counts of Michigan CPSTs by year Table 5.
2012 2013 2014 2015
Total CPSTs 941 960 980 973
New Certifications* n/a 261 228 141
CPST Instructors 49 49 49 46
Instructor Candidates 0 2 1 2
CPSTs with Other Specialization
Technician Proxy 4 8 15 14
Training to work with children with special needs 62 67 56 66
Spanish language skills 16 21 15 13 *As determined by the addition of a unique Safe Kids ID not present in prior years
The counts of CPSTs and CPST-Is per county per year and the change in total number of CPSTs within
counties between 2012 and 2015 are presented in Table 6. No CPSTs provided a business or home
address that was located in Alcona, Keweenaw, or Montmorency counties from 2012 to 2015. At least
one technician proxy was located in Kent, Wayne, and Oakland counties in all 4 years; in Muskegon,
Montcalm, Hillsdale, and Washtenaw counties in 3 years; in Newaygo, Ottawa, and Calhoun counties in
2 years; and in Grand Traverse and Lenawee in 1 year. Comparing total number of CPSTs in 2015 to 2012
by county, we found 45 counties had a decrease in total number of CPSTs, 30 counties had an increase,
and 5 counties had no change. The four counties with the greatest losses of CPSTs were Gladwin (-11),
Berrien (-8), Branch (-8), and Marquette (-8). The five counties with the greatest gains were Oakland
(+40), Kent (+15), Macomb (+14), Calhoun (+8), and Allegan (+8). The 5 counties with no change in
number of CPSTs between 2012 and 2015 were Antrim, Cass, Manistee, Mecosta, and Otsego.
Change in CPST and CPST-I* counts by county Table 6.
County 2012 2013 2014 2015
Change 2012 to 2015
CPSTs CPST-I CPST CPST-I CPST CPST-I CPST CPST-I CPST&CPST-I
1. Upper Peninsula
Alger 4 0 3 0 4 0 1 0 -3
Baraga 2 0 1 0 5 0 5 0 +3
Chippewa 1 1 2 0 2 0 4 0 +2
Delta 4 0 3 0 3 0 5 0 +1
Dickinson 2 0 1 0 2 0 3 0 +1
Gogebic 5 0 5 0 8 0 9 0 +4
Houghton 5 1 4 1 9 1 10 1 +5
Iron 3 0 2 0 1 0 1 0 -2
Keweenaw 0 0 0 0 0 0 0 0 0
Luce 4 0 2 0 1 0 1 0 -3
Mackinac 2 0 3 0 3 0 4 0 +2
Marquette 26 2 23 2 19 1 18 2 -8
Menominee 4 0 2 0 1 0 2 0 -2
Ontonagon 2 0 2 0 2 0 3 0 +1
Schoolcraft 5 0 3 0 2 1 2 1 -2

23
2 Traverse Bay Area
2012 2013 2014 2015 Change
County CPSTs CPST-I CPST CPST-I CPST CPST-I CPST CPST-I CPST & CPST-I
Antrim 3 0 5 0 5 0 3 0 0
Benzie** 4 1 4 0 3 0 3 0 -1
Grand Traverse** 20 1 18 1 14 1 15 1 -5
Kalkaska 1 0 2 0 1 0 0 0 -1
Leelanau** 2 0 2 0 2 0 1 0 -1
Manistee 3 0 1 0 1 0 3 0 0
Missaukee 1 0 0 0 2 0 2 0 +1
Wexford 5 0 7 0 5 0 3 0 -2
3. Northern Lower
Alcona 0 0 0 0 0 0 0 0 0
Alpena 5 1 4 1 5 1 4 1 -2
Charlevoix 2 0 2 0 2 0 3 0 +1
Cheboygan 1 0 1 0 2 0 2 0 +1
Crawford 2 0 1 0 1 0 1 0 -1
Emmet 10 1 7 0 5 0 5 0 -4
Montmorency 0 0 0 0 0 0 0 0 0
Oscoda 3 0 1 0 1 0 0 0 -3
Otsego 3 1 3 1 3 1 4 0 0
Presque Isle 3 0 1 0 1 0 1 0 -2
Roscommon 5 0 5 0 3 0 3 0 -2
4. Lakeshore
Mason** 1 0 4 0 4 0 5 1 +5
Muskegon** 16 0 19 0 16 0 11 0 -5
Newaygo 14 0 11 0 9 0 9 0 -5
Oceana** 9 1 10 1 9 1 9 0 -1
5. Chippewa Valley
Clare** 2 0 2 0 1 0 1 0 -1
Isabella** 8 0 4 1 5 1 6 1 -1
Lake** 0 0 0 0 1 0 1 0 +1
Mecosta 9 0 3 0 9 0 9 0 0
Montcalm 9 0 13 0 13 0 11 0 +2
Osceola 2 0 1 0 7 0 6 0 +4
6. Saginaw Valley
Arenac 1 0 2 0 3 0 2 0 -1
Bay 11 0 8 0 13 0 13 0 +2
Genesee** 29 1 42 1 23 1 18 1 -11
Gladwin** 1 0 1 0 1 0 0 0 -1
Gratiot** 5 0 4 0 4 0 4 0 -1
Iosco 3 0 1 0 1 0 1 0 -2
Lapeer** 4 0 5 0 5 0 3 0 -1
Midland** 6 0 7 0 7 0 9 0 +3
Ogemaw 0 0 2 0 5 0 4 0 +4
Saginaw** 15 0 8 0 14 0 18 0 +3
Shiawassee 3 0 6 0 5 0 2 0 -1
7. Thumb Area
Huron 3 0 1 0 1 0 1 0 -2
Sanilac** 4 2 2 2 1 2 1 2 -3
Tuscola** 14 1 12 1 10 1 8 1 -6
8. West Michigan
Allegan 6 1 9 0 14 0 14 1 +8
Kent** 79 4 106 4 106 4 94 4 +15
Ottawa 24 1 27 1 25 1 29 1 +5

24
9. Southwest
2012 2013 2014 2015 Change
County CPSTs CPST-I CPST CPST-I CPST CPST-I CPST CPST-I CPST & CPST-I
Berrien 15 1 10 1 10 1 7 1 -8
Cass 10 0 9 0 7 0 10 0 0
Van Buren 11 1 13 1 12 1 7 1 -4
10. South Central Barry 5 0 7 0 10 0 10 0 +5
Branch** 13 0 13 0 5 0 5 0 -8
Calhoun 11 0 14 0 17 0 19 0 +8
Ionia 4 0 2 0 3 0 3 0 -1
Kalamazoo** 42 3 41 4 40 4 47 2 +4
St. Joseph** 9 0 10 0 6 1 6 1 -2
11. Capital Area
Clinton** 7 0 4 0 4 0 6 0 -1
Eaton** 7 0 3 0 3 0 5 0 -2
Hillsdale** 7 0 6 0 4 0 4 0 -3
Ingham** 29 3 23 3 25 2 25 2 -5
Jackson 4 0 4 0 3 0 5 0 +1
Lenawee 8 0 5 0 5 0 5 0 -3
12. Huron Valley
Livingston** 15 2 16 2 13 2 16 2 -1
Monroe 12 0 12 0 8 0 7 0 -5
Washtenaw** 40 6 45 8 49 7 43 7 -4
13. Wayne County
Wayne** 80 5 83 6 92 4 86 4 +5
14. Oakland County
Oakland** 94 3 109 3 125 6 131 6 +40
15. Macomb/St. Clair Counties
Macomb** 45 6 46 6 55 4 61 4 +14
St. Clair 4 0 4 0 4 0 5 0 +1
*CPST-I counts include CPST instructors and instructor candidates. **Safe Kids covered county.
Table 7 shows, by county, the availability of any CPST and any CPST who reported instructor status or
additional skills at any point from 2012 to 2015. CPSTs trained to work with children with special needs
were present in 27 counties and Spanish speaking CPSTs were present in 15 counties during at least one
year in the study period.
Presence of CPSTs and CPSTs with additional skills by county, 2012-2015 Table 7.
County Any CPSTs Any CPST-I Special Needs
Spanish Speaking
2012-2015 2012-2015 2012-2015 2012-2015
1. Upper Peninsula
Alger YES NO NO NO
Baraga YES NO NO NO
Chippewa YES YES NO NO
Delta YES NO NO NO
Dickinson YES NO NO NO
Gogebic YES NO NO NO
Houghton YES YES YES NO
Iron YES NO NO NO
Keweenaw NO NO NO NO
Luce YES NO NO NO

25
Any CPSTs Any CPST-I Special Needs Spanish Speaking
Mackinac YES NO NO NO
Marquette YES YES YES NO
Menominee YES NO NO NO
Ontonagon YES NO NO NO
Schoolcraft YES YES YES NO
2. Traverse Bay Area
Antrim YES NO NO NO
Benzie** YES YES NO NO
Grand Traverse** YES YES YES NO
Kalkaska YES NO NO NO
Leelanau** YES NO NO NO
Manistee YES NO NO NO
Missaukee YES NO NO NO
Wexford YES NO NO NO
3. Northern Lower
Alcona NO NO NO NO
Alpena YES NO NO NO
Charlevoix YES NO NO NO
Cheboygan YES NO NO NO
Crawford YES NO NO NO
Emmet YES YES YES NO
Montmorency NO NO NO NO
Oscoda YES NO NO NO
Otsego YES YES YES NO
Presque Isle YES NO NO NO
Roscommon YES NO NO NO
4. Lakeshore
Mason** YES YES NO NO
Muskegon** YES NO YES YES
Newaygo YES NO NO YES
Oceana** YES YES NO YES
5. Chippewa Valley
Clare** YES NO NO YES
Isabella** YES YES NO NO
Lake** YES NO NO NO
Mecosta YES NO NO NO
Montcalm YES NO NO NO
Osceola YES NO NO NO
6. Saginaw Valley
Arenac YES NO NO NO
Bay YES NO NO YES
Genesee** YES YES YES NO
Gladwin** YES NO NO NO
Gratiot** YES NO NO NO
Iosco YES NO NO NO
Lapeer** YES NO NO NO
Midland** YES NO YES NO
Ogemaw YES NO NO NO
Saginaw** YES NO NO NO
Shiawassee YES NO NO NO
7. Thumb Area
Huron YES NO NO NO
Sanilac** YES YES YES NO
Tuscola** YES YES YES NO

26
8. West Michigan
Any CPSTs Any CPST-I Special Needs Spanish Speaking
Allegan YES YES YES YES
Kent** YES YES YES YES
Ottawa YES YES YES YES
9. Southwest
Berrien YES YES NO YES
Cass YES NO NO NO
Van Buren YES YES NO NO
10. South Central Barry YES NO NO NO
Branch** YES NO YES NO
Calhoun YES NO YES YES
Ionia YES NO NO NO
Kalamazoo** YES YES YES YES
St. Joseph** YES YES NO NO
11. Capital Area
Clinton** YES NO YES NO
Eaton** YES NO NO NO
Hillsdale** YES NO NO NO
Ingham** YES YES YES NO
Jackson YES NO YES NO
Lenawee YES NO YES NO
12. Huron Valley
Livingston** YES YES YES NO
Monroe YES NO YES NO
Washtenaw** YES YES YES YES
13. Wayne County
Wayne** YES YES YES YES
14. Oakland County
Oakland** YES YES YES YES
15. Macomb/St. Clair Counties
Macomb** YES YES YES YES
St. Clair YES NO NO NO
**Safe Kids covered county.
CPSTs by Location in 2014
Table 8 summarizes the number of CPSTs per OHSP region, the number of CPSTs per county within each
region, and the counties covered and not covered by Safe Kids Michigan Coalitions in 2014. There were
30 counties (36%) covered by Safe Kids Coalitions and 70% of CPSTs work in these counties. Among
counties not covered by a Safe Kids coalition, 23 counties had 5 or more CPSTs, 27 counties had less
than 5 CPSTs, and 3 counties had no CPSTs in 2014. Figure 11 maps the number of CPSTs by county
within OHSP Traffic Safety Region and Safe Kids Michigan Coalition boundaries. Figure 12 shows the
distribution of CPSTs throughout Michigan with the map of counties covered by a Safe Kids Michigan
Coalition shown for reference (Figure 13). The distribution of CPST-Is closely aligned with the
distribution of CPSTs who were trained to work with children with special needs (Figure 14). Most of the
15 CPSTs who speak Spanish were located in the western half of the Lower Peninsula (Figure 14).

27
Number of CPSTs per region relative to Safe Kids Coalition coverage Table 8.
OHSP Traffic Safety Region
Safe Kids Coalition
Counties Covered by Safe Kids
Counties not covered by a Safe Kids Coalition
Counties with 5 or more CPSTs
Counties with less than 5 CPSTs
Counties with 0 CPSTs
(CPSTs in Region in 2014) Coalition Name (CPSTs in Safe Kid Coalition-covered counties, % of CPSTs in Region)
County name (Number of CPSTs in 2014)
County name (Number of CPSTs in 2014)
County name (Number of CPSTs in 2014)
County name
Statewide (979*) (687, 70%) 30 counties 23 counties 27 counties 3 counties
1 Upper Peninsula (65) No Safe Kids Coalition
None Gogebic (8) Houghton (10) Baraga (5) Marquette (20)
Alger (4) Chippewa (2) Delta (3) Dickinson (2) Iron (1) Luce (1) Mackinac (3) Menominee (1) Ontonagon (2) Schoolcraft (3)
Keweenaw
2 Traverse Bay Area (34) North Shore (22, 59%)
Grand Traverse (15) Leelanau (2) Benzie (3)
Antrim (5) Wexford (5)
Kalkaska (1) Manistee (1) Missaukee (2)
3 Northern Lower (25) No Safe Kids Coalition
None Emmet (5) Alpena (6)
Charlevoix (2) Cheboygan (2) Crawford (1) Oscoda (1) Otsego (4) Presque Isle (1) Roscommon (3)
Alcona Montmorency
4 Lakeshore (39) West Michigan (30, 77%)
Muskegon (16) Oceana (10) Mason (4)
Newaygo (9)
5 Chippewa Valley (37) West Michigan (1, 3%)
Lake (1) Osceola (7) Montcalm (13) Mecosta (9)
MidMichigan (7, 23%)
Clare (1) Isabella (6)
6 Saginaw Valley (82) MidMichigan (12, 15%)
Midland (7) Gladwin (1) Gratiot (4)
Ogemaw (5) Bay (13)
Arenac (3) Iosco (1) Shiawassee (5)
Greater Flint (24, 29%)
Genesee (24)
Greater Thumb Area & Saginaw (16, 23%)
Lapeer (5) Saginaw (14)
7 Thumb Area (15) Greater Thumb Area & Saginaw (14, 93%)
Sanilac (3) Tuscola (11)
Huron (1)
8 West Michigan (150) Greater Grand Rapids (110, 73%)
Kent (110) Ottawa (26) Allegan (14)
9 Southwest (31) No Safe Kids Coalition
None Berrien (11) Van Buren (13) Cass (7)

28
OHSP Region Safe Kids covered Counties Counties not covered by a Safe Kids Coalition
Counties with 5 or more CPSTs
Counties with less than 5 CPSTs
Counties with 0 CPSTs
(CPSTs in Region in 2014) Coalition Name (CPSTs in Safe Kid Coalition-covered counties, % of CPSTs in Region)
County name (Number of CPSTs in 2014)
County name (Number of CPSTs in 2014)
County name (Number of CPSTs in 2014)
County name
10 South Central (86) Kalamazoo (44, 51%)
Kalamazoo (44)
Branch-Hillsdale-St. Joseph (12, 14%)
Branch (5) St. Joseph (7)
Barry (10) Calhoun (17)
Ionia (3)
11 Capital Area (46) Branch-Hillsdale-St. Joseph (4, 9%)
Hillsdale (4) Lenawee (5) Jackson (3)
Capital Area (34, 74%)
Clinton (4) Eaton (3) Ingham (27)
12 Huron Valley (79) Huron Valley (71, 90%)
Livingston (15) Washtenaw (56)
Monroe (8)
13 Wayne (96) Metro Detroit (96, 100%)
Wayne (96)
14 Oakland (131) Oakland Co. (131, 100%)
Oakland (131)
15 Macomb/St. Clair (63) Macomb (59, 92%)
Macomb (59) St. Clair (4)
*one CPST could not be assigned to a county due to incomplete address information.
CPSTs by county with OHSP Regions and Safe Kids Michigan Coalitions Figure 11.
CPSTs per county in 2014 Safe Kids Michigan Coalitions outlined
CPSTs per county in 2014 OHSP Regions outlined

29
Distribution of CPSTs by county Figure 12.
Counties covered by Safe Kids Michigan Coalitions Figure 13.
CPSTs per County in 2014

30
CPSTs with additional skills by county in 2014 Figure 14.
CPST Instructors by county in 2014
CPSTs who speak Spanish by county in 2014
CPSTs trained to work with children with special needs
by county in 2014

31
Chapter 5. Characteristics of Michigan Child Passenger Safety Technicians
METHODS
To characterize the CPST workforce in Michigan, the team of 5 investigators, including two CPSTs and
one CPST-I, designed the 42-item anonymous survey using both fixed-choice and free response options
and a follow-on identifiable survey to obtain contact information. Questions for the anonymous survey
were developed to gather information about the type and amount of child passenger safety work the
CPST conducts, the counties where their services are delivered, factors that influenced their decision to
become a CPST, maintain certification, and engage in car seat checks, prior exposure to and interest in
specialized courses for CPSTs, and demographic characteristics. The University of Michigan Medical
School Institutional Review Board designated the survey exempt status.
CPSTs were asked to indicate the roles they had taken on related to their child passenger safety work.
Options included CPST-I and Technician Proxy (described above in Chapter 4) as well as Senior Checker
and Event Coordinator. Senior Checker is role with the Safe Kids Buckle Up program. A Senior Checker is
an individual who makes the final inspection of an installation of a child restraint system before the
family leaves the inspection and is responsible for assuring that the necessary paperwork (for the Safe
Kids Buckle Up program) is correctly completed. Senior Checkers always work with another CPST on site.
The category of Event Coordinator is not officially defined, but was intended to capture information
about CPSTs who take on a role of scheduling seat check events and inspection stations for their agency.
The brief follow-on survey asked if the CPST was interested in being entered into a drawing to have their
CPST recertification fees covered by OHSP, as an incentive for participation, and coordinators were
asked if they were willing to be contacted regarding details about the timing and locations of car seat
checks they have coordinated. Appendix B contains a copy of the two surveys.
The surveys were entered in the Qualtrics survey platform (Qualtrics LLC, Provo, UT) and pilot tested
with 12 CPSTs from Michigan and other states. Questions and response options were refined based on
feedback from the pilot testing. A survey link was distributed via email on October 5, 2015 to the OHSP-
provided email list of certified CPSTs in Michigan as of September 29, 2015. Reminder emails were sent
7 and 10 days after the initial email request for participation. The survey link was open for 2 weeks.
Survey data were extracted from Qualtrics into Excel (Microsoft Corp, Redmond, WA). After compiling
survey results, data were reviewed for consistency. The study team determined that, in response to
Question 3.6 “estimate the percent of each type of car seat you typically check”, some respondents
indicated the number of child passenger restraints checked and not the percentage. Therefore, we
calculated percentages, totaling 100%, based on the counts entered by the CPST. The study team
categorized the responses to for free-text response questions related to education and job title and
harmonized the categories where possible. When coding the languages spoken, we assumed that all
respondents spoke English even if they did not indicate it among the languages they reported speaking.
CPSTs were asked to indicate the ZIP Codes of their work and home. CPSTs were also asked to indicate
all of the counties where they had conducted seat checks in the past year. ZIP Codes for work and home
were geocoded using ArcGIS Desktop 10.3.1 (ESRI, Inc., Redlands, CA) to determine the location of the
CPSTs by county. For the analyses of CPST location, we used work ZIP Code when available. If no work
ZIP Code was provided we used home ZIP Code. CPSTs who did not provide any ZIP Code were not

32
included in results related to county location. We calculated response rates by region and by county
based on the denominator of CPSTs in the OHSP-provided list of certified CPSTs from July 2015.
We created a new composite variable describing the overall activity level of a CPST based on how often
they performed seat checks and how many child restraint systems they reported checking during a
typical month when they checked seats. We categorized CPST activity levels as low (<5 seats checked
per year), medium (5-24 seats checked per year), or high (> 25 seats checked per year) based on the
frequency and number seats as indicated in Table 9.
CPST activity level categories Table 9.
How many seats checked in typical month you did checks?
How often? 1-2 3-5 6-10 11-20 21-30 >30
< 2 per year Low Low Medium Medium High High
2 per year Low Medium Medium High High High
Quarterly Medium Medium High High High High
Monthly Medium High High High High High
Weekly Medium High High High High High
Daily Medium High High High High High
Analysis of the survey data included univariate analysis to calculate response frequencies. Additional
analysis was performed to identify characteristics of CPSTs associated with different levels of seat check
activity. We estimated the number of seats checked per CPST per year by multiplying the frequency that
a CPST reported completing seat checks and the number of seats checked in a typical month when the
CPST was completing seat checks.
RESULTS
Of the 1,008 email addresses contained in the OHSP list of CPSTs, 35 were returned as undeliverable and
11 returned out of office messages indicating the CPST would not be returning during the 2-week period
that the survey was open. The remaining 962 were considered potential respondents. Among the
potential respondents, 496 (52%) began the survey. Of the CPSTs who began the survey, 427 (86%)
answered the last question. CPST-Is had a higher response rate (84%) than CPSTs in general.
There were 439 CPSTs who provided a work and/or home ZIP Code; 20 provided a work ZIP Code only,
42 provided home ZIP Code only, and 377 provided both. Of the CPSTs who provided ZIP Codes, 90%
provided a work ZIP Code. The geocoded ZIP Codes returned work and home counties that were the
same for 238 of the 377 CPSTs who provided data for both locations. Of the 139 CPSTs who reported a
different work and home ZIP Code, 129 (93%) mapped to adjacent counties. When considering all
counties (work, home, and locations of seat checks) within a CPSTs response, 151 CPST indicated living,
working, and checking seats all in one county and 166 reported two counties, 64 reported three
counties, 22 reported four counties, 35 reported 5 to 13 counties. There were 57 CPSTs who did not
provide any location information for the survey.

33
There was variation in the response rate by region (Table 10) with the highest response rate in the
Traverse Bay Area (81%) and the lowest response rate in Wayne County (28%). The distribution of
survey respondents by county is shown in Figure 15.
Response rate by region Table 10.
OHSP Region Total CPSTs in 2015 Responding CPSTs Response Rate
Statewide 971* 496** 51%
1 Upper Peninsula 72 31 43%
2 Traverse Bay Area 31 25 81%
3 Northern Lower 24 12 50%
4 Lakeshore 35 16 46%
5 Chippewa Valley 35 16 46%
6 Saginaw Valley 75 38 51%
7 Thumb Area 13 5 38%
8 West Michigan 143 61 43%
9 Southwest 26 12 46%
10 South Central 93 45 48%
11 Capital Area 52 20 38%
12 Huron Valley 75 40 53%
13 Wayne 90 25 28%
14 Oakland 137 65 47%
15 Macomb/St. Clair 70 21 30% *Two CPSTs could not be located to a county in OHSP records, **64 survey respondents did not provide a home or work ZIP Code
Distribution of CPST survey respondents Figure 15.
Distribution of CPST Survey Respondents in 2015

34
Demographic Characteristics
Seventy-one percent of respondents self-identified as female. The most common age group was 35 to
44 years old (Figure 16). More than 90% of CPSTs self-reported they were non-Hispanic white
race/ethnicity (Figure 17).
CPST-reported age group Figure 16.
CPST-reported race/ethnicity Figure 17.
The number of CPSTs reporting comfort speaking a language or language(s) other than English to
complete a car seat check is shown in Figure 18. The most common language other than English was
Spanish. However, even as the most common language spoken other than English, less than 3% of
respondents reported speaking Spanish.
18-24 years
4%
25-34 years 25%
35-44 years 39%
45-54 years 19%
55-64 years 10%
65+ years 3%
376
17
7
3
3
8
0 50 100 150 200 250 300 350 400
White
Black/African American
Asian
Hispanic/Latino
Native Amer, Alas, Haw, Pac Is
Multi
Number of CPSTs

35
CPST-reported languages other than English Figure 18.
Education and Occupation
Data regarding the distribution of respondents by their occupation, education level, and educational
background are found in Figure 19 through Figure 21. The most common occupations were law
enforcement, healthcare professional, social worker/health educator, and engineer (Figure 19).
CPST-reported occupation Figure 19.
0 2 4 6 8 10 12
ASL
Bengali
Burmese
Finnish
French
German
Hindi
Korean
Phillipino
Polish
Serbian
Spanish
Number of CPSTs
Business, insurance retail 2%
Child Care 1%
CPST/I 3%
Communications 1%
Social worker, health educator,
clergy 17%
Education 3%
Fire/Rescue/EMS 9%
Physician, nurse, OT, PT, Child Life
17%
Healthcare Support 2%
Law Enforcement 21%
Administrative 3%
Other 1%
Retired 3%
SAH Parent 3%
Student 1%
Engineering 12%

36
In general, respondents had received education after high school, most frequently earning a bachelor’s
degree, followed by a master’s degree (Figure 20). Areas of study or professional training were diverse
(Figure 21). The most common areas of study are law enforcement or criminal justice, child or family,
and engineering.
CPST-reported highest education level Figure 20.
CPST-reported area of study or professional training Figure 21.
High school graduate or GED
2%
Some college 12%
Trade/technical/vocational training
4%
Associate degree 17%
Bachelor's degree 41%
Master's degree 21%
Doctorate degree (Ph.D)
1%
Professional degree (MD, JD)
2%
Business 8%
Child/Family 13% Communications
2% Education
3%
Engineering 11%
Fire/EMS 9%
Healthcare 3%
Law Enf/Crim Just 20%
Legal 1%
Liberal Arts 2%
Nursing 7%
OT/PT 3%
Other 2%
Psychology 3%
Public health 4%
Science 1%
Social work 7%

37
Certification
Figure 22 lists the reasons why respondents became CPSTs (light blue bars), as well as why they
maintained their certification (dark blue bars) among those who had completed a recertification cycle.
The responses were similar except that almost twice as many people who maintained their certification
reported that being a natural fit/enhancement to their job was a key reason for being a CPST compared
to those who indicated this as a reason they first became a CPST.
CPST-reported reasons to obtain and maintain certification Figure 22.
Categorical length of time respondents had been certified CPSTs is shown in Figure 23. Less than half
had certified more than five years prior to survey. Ninety-three CPSTs indicated that they were still in
their first certification cycle. Fifty CPSTs indicated that their certification had lapsed at least once and
they had retaken their training. Figure 24 demonstrates the distribution of years as a CPST by
occupation. The occupations with the highest mean duration as a CPST were Fire-EMS, Retired, and
Healthcare. The occupations with the lowest mean duration as a CPST were Parent, Student, and Other.
CPST-reported number of years since initial certification Figure 23.
0% 10% 20% 30% 40% 50% 60% 70%
Job requirement
Natural fit/enhancement
Gap in community
Personal reasons
Pay/detail eligibility
Knew someone in crash
Become a CPST Maintain CPST
<1 year 15%
2-3 years 24%
4-5 years 17%
6-10 years 25%
>10 years 19%

38
Years as CPST by occupation Figure 24.
Twenty-two percent of respondents indicated their work as a CPST was paid, 42% volunteer, and 36%
serve as a CPST in both paid and volunteer capacities. Among CPSTs who only volunteer, 60% said it was
helpful for their job. The distribution of CPST compensation model (i.e., paid, volunteer, both) by years
since initial certification is shown in Figure 25. Among new technicians, over half were paid. For those
working 10 or more years in the field, the largest proportion served as both paid and volunteer CPSTs.
Compensation model by years since initial certification Figure 25.
0
10
20
30
40
50
60
70
80
0-1 years(120)
2-3 years(80)
4-5 years(58)
6-7 years(35)
8-9 years(45)
10-11 years(26)
12-13 years(17)
14-15 years(24)
16+ years(15)
Nu
mb
er o
f C
PST
s
paid
volunteer
both

39
Among CPSTs who reported this work was part of their job, roughly half reported being a CPST was
helpful but did not make up a measurable amount of their job activities (Figure 26). For about one-
fourth, being a CPST made up less than 25% of their job activities and for less than one-tenth being a
CPST made up more than half of their job activities. A small percentage of CPSTs responding to the
survey (2%) reported that they work as independent CPST contractors.
Percent of work-time spent on car seat checks Figure 26.
Most of the CPSTs earned their Continuing Education Units (CEUS) at local events, online, or through a
course (Figure 27). Few earned CEUs by attending national conferences such as Lifesavers or Kidz in
Motion (KIM). Figure 28 shows that many CPSTs have taken courses to obtain additional training
regarding to special occupant populations (dark blue bars), and many more are interested in pursuing
such training (light blue bars).
CPST-reported sources of continuing education units Figure 27.
51%
26%
7% 7%
2%
7%
0%
10%
20%
30%
40%
50%
60%
Helpful <25% 25-50% >50% Independent Other
0 20 40 60 80 100 120 140 160 180
KIM
Lifesavers
Subscriptions
Online
Course
Safekids conference
Regional, state, or local event
Number of CPSTs

40
Courses CPSTs have taken or are interested in taking Figure 28. Roles
Respondents were queried as to the roles they undertake related to their work as a CPST. The
distribution of their responses is shown in Figure 29. Just over 10% of respondents indicated they were
CPST Instructors. The Senior Checker (Sr), Technician Proxy (TP), and Event Coordinator (EC) roles were
selected by 11%, 3% and 6% of respondents respectively.
CPST roles in addition to seat checks Figure 29.
A little more than half of respondents (55%) indicated they work with a Safe Kids Michigan Coalition,
29% indicated they did not, and 16% said they did not know. When asked whether they distribute free
seats provided by OHSP, 54% said they did, 33% said they did not, and 13% were not sure.
77
92
39
4
148
167
148
11
0 20 40 60 80 100 120 140 160 180
CPS on School Buses
CPS for Special Needs Children
CPS in Ambulances
Other
Number of CPSTs
Interested Took
446
33 15 18
53 20
0 13
0
50
100
150
200
250
300
350
400
450
500
Total Sr TP EC
Nu
mb
er o
f C
PST
s
CPST CPSTI

41
Seat Check Motivation
Figure 30 shows the degree to which specific factors influence a CPST’s participation in seat checks. The
two factors that CPSTs identified as having the greatest effect on their participation were time and
distance to an event. Free food or giveaways were least often selected by CPSTs as having an effect on
their participation in seat checks. The factors did not vary with activity level (results not shown).
Factors affecting participation in car seat check Figure 30.
Types of child restraint systems checked
Figure 31 shows the proportion and distribution of the types of seats CPSTs check, per their estimation.
More than 90% of CPSTs reported that they checked seats of more than one type. Of the 69 CPSTs who
reported checking only one type of restraint system, 24 (35%) indicated checking only rear-facing only
(RFO) restraints, 33 (48%) indicated checking only rear-facing convertible (RFC) restraints, and 12 (17%)
indicated checking only forward-facing with 5-point harness (FFH) restraints. Over 70% of CPSTs
responding to the survey reported they never check seat belts (SB), and 40% never check boosters.
CPST-reported types of child restraint systems checked Figure 31.
0% 20% 40% 60% 80% 100%
Employer decides which
Employer decides time
Time or day of event
Distance
Appointments vs. drop-ins
Free food
Payments or giveaways
Indoors or outcoors
Perceived need
Not applicable None A little Some Quite a bit Very much
0%
20%
40%
60%
80%
100%
RFO RFC FFH Booster SB
None <10% 10-19% 20-39%
40-59% 60-79% 80-90% >90%

42
Activity Level
CPSTs varied in terms of the number of hours spent each month doing seat checks (Figure 32). CPSTs
also differed in terms of the frequency with which they check seats and the number of seats they check
in a typical month that they were checking seats (Table 11).
CPST-reported seat check hours in a typical month Figure 32.
We used CPST report of the number of seats checked in a typical month and the frequency with which
they reported checking seats in the prior year to create activity levels. Study-determined activity levels
are shown with shading in Table 11 [low activity (lightest blue), medium activity (mid-range blue), and
high activity (darkest blue)].
Distribution of Responses by CPSTs activity level Table 11.
How many car seats did you check in typical month that you did checks?
How often? 1-2 3-5 6-10 11-20 21-30 >30 No
Response
< 2 per year 52 14 6 2 0 1 4
2 per year 53 17 7 2 0 0 1
Quarterly 60 29 21 5 2 3 0
Monthly 26 54 25 13 4 0 1
Weekly 6 17 16 8 6 10 0
Daily 0 0 2 1 1 1 0
Figure 33 shows the distribution of the three levels of activity. About 40% of respondents were
considered high-activity CPSTs (more than 24 seat checks per year), one-third medium-activity CPSTs (5
to 24 seat checks per year), and one-quarter low-activity CPSTs (<5 seat checks per year).
< 1 hr/mo 9%
1-5 hrs/mo 34%
6-10 hrs/mo
21%
11-20 hrs/mo
18%
21-30 hrs/mo
8%
31-50 hrs/mo
8%
>50 hrs/mo 2%

43
Distribution of CPSTs by activity level Figure 33.
Multiplying the number of seats checked in a typical month by the frequency of seat checks, we
estimated the total number of seats checked per CPST per year to be 2 to 420. The estimated annual
number of seats checked per CPST for each activity level is shown in Table 12.
Estimated number of car seats checked across CPST activity level Table 12.
Activity Level Number of
CPSTs Estimated Number of Car Seats
Checked in Year Estimated Annual
Seat Checks per CPST
Overall 464 23,271 50
Low 119 292 2
Medium 153 1,726 11
High 192 21,253 111
Figure 34 shows that approximately half of high-activity CPSTs were both paid and volunteered, while
about half of low- and medium-activity CPSTs only volunteered. Figure 35 shows that a similar number
of low-activity CPSTs do and do not work with a Safe Kids Michigan Coalition, while a greater proportion
of high- and medium-activity CPSTs do work with a Safe Kids Michigan Coalition.
CPST activity level by compensation Figure 34.
<5 seat checks/yr
26%
5-24 seat checks/yr
33%
>24 seat checks/yr
41%
0
20
40
60
80
100
low (122) med (153) high (192)
Nu
mb
er
of
CP
STs
Tech Activity Level
paid (99)
volunteer (198)
both (170)

44
CPST activity level by work with a Safe Kids Coalition Figure 35.
The distribution of CPST activity level by occupation is shown in Figure 36. High-activity CPSTs most
often reported working in law enforcement and social services, while medium-activity CPSTs most often
reported working in law enforcement and health care. Low-activity CPSTs reported most often working
in transportation and healthcare.
CPST activity level by occupation Figure 36.
0
20
40
60
80
100
120
Yes (235) No (121) Don't Know (70)
Nu
mb
er
of
CP
STs
Work with Safe Kids Coalition
low
med
high
0
5
10
15
20
25
30
35
40
45
Nu
mb
er o
f C
PST
s
low
med
high

45
Figure 37 shows the distribution of CPST activity level by length of time as a CPST. Among new CPSTs, in
their first certification cycle, activity level was evenly divided. For longer duration CPSTs, high activity
CPSTs made up about half in each group, with low activity CPSTs usually the lowest proportion. There
was no relationship between density of CPSTs in a county and CPST activity level.
Activity level by years since initial certification Figure 37. Survey response rates varied by county and in relation to CPST activity level (Table 13).
Survey response rate by county and by activity level Table 13.
CPSTs in 2015
CPST-Is in 2015
Survey Respondents
Response Rate†
High Activity
Medium Activity
Low Activity
% Responses from High
Activity CPST
Statewide 923 48 432 45% 174 151 107 40%
1 Upper Peninsula
Alger 1 0 0 0 n/a n/a n/a n/a
Baraga 5 0 2 40% 2 0 0 100%
Chippewa 4 0 1 25% 0 0 1 0
Delta 5 0 2 40% 1 0 1 50%
Dickinson 3 0 2 67% 1 1 0 50%
Gogebic 9 0 1 11% 1 0 0 100%
Houghton 10 1 5 50% 3 0 2 60%
Iron 1 0 2 100%+ 2 0 0 100%
Keweenaw 0 0 1 100%+ 0 1 0 0
Luce 1 0 0 0 n/a n/a n/a n/a
Mackinac 4 0 3 75% 0 2 1 0
Marquette 18 2 7 39% 2 3 2 28%
Menominee 2 0 2 100% 0 1 1 0
Ontonagon 3 0 1 33% 0 1 0 0
Schoolcraft 2 1 2 100% 1 1 0 50%
42
16 18
5 8 7
2 5
1
39
28
15 12
19
9 6 7 6
39 36
24
18 18
10 9 12
8
0
5
10
15
20
25
30
35
40
45
0-1 years(120)
2-3 years(80)
4-5 years(57)
6-7 years(35)
8-9 years(45)
10-11 years(26)
12-13 years(17)
14-15 years(24)
16+ years(15)
Nu
mb
er o
f C
PST
s
Low Medium High

46
2. Traverse Bay Area
CPSTs in 2015
CPST-Is in 2015
Survey Respondents
Response Rate†
High Activity
Medium Activity
Low Activity
% Responses from High
Activity CPST
Antrim 3 0 0 0 n/a n/a n/a n/a
Benzie** 3 0 5 100%+ 1 3 1 29%
Grand Traverse** 15 1 4 27% 3 1 0 75%
Kalkaska 0 0 2 100%+ 0 2 0 0
Leelanau** 1 0 12 100%+ 7 1 4 58%
Manistee 3 0 0 0 n/a n/a n/a n/a
Missaukee 2 0 1 50% 0 0 1 0
Wexford 3 0 1 33% 1 0 0 100%
3. Northern Lower
Alcona 0 0 0 n/a n/a n/a n/a n/a
Alpena 4 1 4 100% 1 2 1 25%
Charlevoix 3 0 0 0 n/a n/a n/a n/a
Cheboygan 2 0 0 0 n/a n/a n/a n/a
Crawford 1 0 0 0 n/a n/a n/a n/a
Emmet 5 0 3 60% 1 2 0 33%
Montmorency 0 0 0 n/a n/a n/a n/a n/a
Oscoda 0 0 0 n/a n/a n/a n/a n/a
Otsego 4 0 2 50% 0 0 2 0
Presque Isle 1 0 1 100% 0 1 0 0
Roscommon 3 0 2 67% 0 2 0 0
3. Lakeshore
Mason** 5 1 2 40% 2 0 0 100%
Muskegon** 11 0 6 55% 5 1 0 83%
Newaygo 9 0 4 44% 1 3 0 25%
Oceana** 9 0 4 44% 1 3 0 25%
5. Chippewa Valley
Clare** 1 0 1 100% 1 0 0 100%
Isabella** 6 1 5 83% 5 0 0 100%
Lake** 1 0 2 100%+ 0 1 1 0
Mecosta 9 0 3 33% 0 2 1 0
Montcalm 11 0 5 45% 2 2 1 40%
Osceola 6 0 0 0 n/a n/a n/a n/a
6. Saginaw Valley
Arenac 2 0 1 50% 1 0 0 100%
Bay 13 0 8 61% 3 1 4 37%
Genesee** 18 1 13 72% 4 6 3 31%
Gladwin** 0 0 0 n/a n/a n/a n/a n/a
Gratiot** 4 0 2 50% 2 0 0 100%
Iosco 1 0 2 100%+ 2 0 0 100%
Lapeer** 3 0 1 33% 0 0 1 0
Midland** 9 0 3 33% 2 1 0 67%
Ogemaw 4 0 1 25% 1 0 0 100%
Saginaw** 18 0 7 38% 1 3 3 14%
Shiawassee 2 0 0 0 n/a n/a n/a n/a
7. Thumb Area
Huron 1 0 0 0 n/a n/a n/a n/a
Sanilac** 1 2 3 100%+ 2 1 0 67%
Tuscola** 8 1 2 25% 0 1 1 0
8. West Michigan
Allegan 14 1 11 78% 1 6 4 9%
Kent** 94 4 43 46% 19 16 8 44%
Ottawa 29 1 7 24% 7 0 0 100%

47
9. Southwest
CPSTs in 2015
CPST-Is in 2015
Survey Respondents
Response Rate†
High Activity
Medium Activity
Low Activity
% Responses from High
Activity CPST
Berrien 7 1 5 72% 2 3 0 40%
Cass 10 0 4 10% 1 3 0 25%
Van Buren 7 1 3 43% 0 1 2 0
10. South Central
Barry 10 0 4 40% 1 3 0 25%
Branch** 5 0 3 60% 2 0 1 67%
Calhoun 19 0 11 58% 6 3 2 54%
Ionia 3 0 4 100%+ 2 2 0 50%
Kalamazoo** 47 2 17 36% 3 6 8 18%
St. Joseph** 6 1 6 100% 2 3 1 33%
11. Capital Area
Clinton** 6 0 2 33% 0 1 1 0
Eaton** 5 0 4 80% 1 2 1 25%
Hillsdale** 4 0 1 25% 1 0 0 100%
Ingham** 25 2 9 36% 4 2 3 44%
Jackson 5 0 1 20% 0 1 0 0
Lenawee 5 0 3 60% 2 0 1 67%
12. Huron Valley
Livingston** 16 2 9 56% 3 3 3 33%
Monroe 7 0 3 43% 1 2 0 33%
Washtenaw** 43 7 28 65% 13 11 4 46%
13. Wayne County
Wayne** 86 4 25 29% 11 9 5 44%
14. Oakland County
Oakland** 131 6 65 50% 20 20 25 31%
15. Macomb and St. Clair Counties
Macomb** 61 4 18 29% 7 5 6 38%
St. Clair 5 0 3 60% 3 0 0 100%
†Response rate could be higher than 100%, presumably due to some CPSTs providing a different address in the survey than was provided when they reported information to the lists of current CPSTs provided to the study team by OHSP. **Safe Kids Michigan Coalition covered county.

48
Chapter 6. Events and Inspection Stations
METHODS
Results regarding the organization, location, and frequency of car seat checks gathered in the CPST
survey are included in this chapter. At the conclusion of the main anonymous survey, CPSTs were
directed to a second survey where they were asked to provide contact information if they were a
coordinator who was willing to be interviewed by our research team, for the purposes of gathering
information about the specific location(s) of past car seat events/stations.
Of the 476 respondents to the main survey, 428 started the second survey focused on obtaining
identifying information and 420 completed it. Among respondents to the second survey, 83 (20%)
indicated they were willing to be contacted regarding specific car seat events/stations and 81 provided
their contact information. The resulting list of 81 CPSTs was reviewed by the research team and it was
determined that three Safe Kids Coalition coordinators were missing and therefore added to the contact
list. A member of the research team (AT) contacted each of the 84 CPSTs via email in December 2015.
The email communication included a request to provide detailed information about the location, date,
and type of car seat checks conducted by their agency or coalition in 2014. CPSTs were offered the
option to respond via email, fax, or phone interview.
We received information from CPSTs in the form of annual reports, flyers, and via telephone interviews. Telephone interviews were structured to obtain information about the name and address of the agency or coalition, type of car seat checks (one-time event, scheduled inspection (or fitting) station, or mobile service provided to families at a convenient location), service coordination (drop-in or appointment), date(s), frequency of service for recurrent car seat checks, and the type of location. Type of location was categorized into: 1) Healthcare facility/hospital; 2) Fire Department or Police Department; 3) Community/public health; 4) Car seat retailer; 5) Insurance agency; 6) Faith-based organization; 7) Childcare center/school; 8) Car dealership; 9) Mall; 10) Park; 11) Other. Addresses for car seat check locations were geocoded using ArcGIS Desktop 10.3.1 (ESRI, Inc., Redlands, CA) and overlapping addresses were combined to provide one unique address for each seat check location. Among the seat check locations where a frequency was provided, we summed the number of occasions that seat checks occurred and mapped the frequencies by county. In addition to the 84 coordinators contacted, the research team identified the 36 hospitals that are Michigan Designated Trauma Centers.17 For each hospital on the list, the hospital website was reviewed to determine if the hospital provides car seat services to the community. A research assistant (HO) then contacted each hospital, via their main number on the website, to inquire about car seat services as though she were a mother looking for information for her own use of car seat services. Agreement between hospital website and phone contact was assessed with the kappa statistic.
RESULTS
Seat Check Coordination
In response to the anonymous survey, 150 CPSTs indicated that they coordinated a seat check event or
inspection (or fitting) station in the past 12 months. The distribution of their responses, by number of
events or inspection stations, is shown in Figure 38. About one-third of respondents only coordinated

49
inspection stations but not events, while about one-third only coordinated events but not inspection
stations. Less than one-quarter of CPSTs who organized checks said they ever asked participants to
evaluate their car seat check experience. It is worth noting that while 150 CPSTs selected “yes” when
asked if they ever coordinated events, only 31 CPSTs indicated they were an “Event Coordinator” when
asked about roles. We suspect that some CPSTs did not select Event Coordinator for their role,
considering it an official title like Senior Checker. Five CPSTs indicated they were Event Coordinators but
they did not organize any events or inspection stations in the prior year.
CPST coordinated events and inspection stations Figure 38.
We asked how the CPSTs thought caregivers learned about the seat check services they provided.
Results are shown in Figure 39. CPSTs presumed families at seat check events more often learned about
them from signs, websites/social media, and news media, while CPSTs presumed families at inspection
stations more often learned about them from law enforcement, social service agencies, or healthcare
professionals.
CPST-reported source of caregivers for events and inspection stations Figure 39.
51 50
27
13 8
39
31
11 14
54
0
10
20
30
40
50
60
None 1-2 3-5 6-10 >10
# Events # Fitting Stations
0 50 100 150 200 250 300
Signs
Website/social media
News media
Referral during class
Referred by doctor or nurse
Referred by social service agency or health…
Referred by law enforcement or court
Word of mouth
I'm not sure
Fitting Stations Events
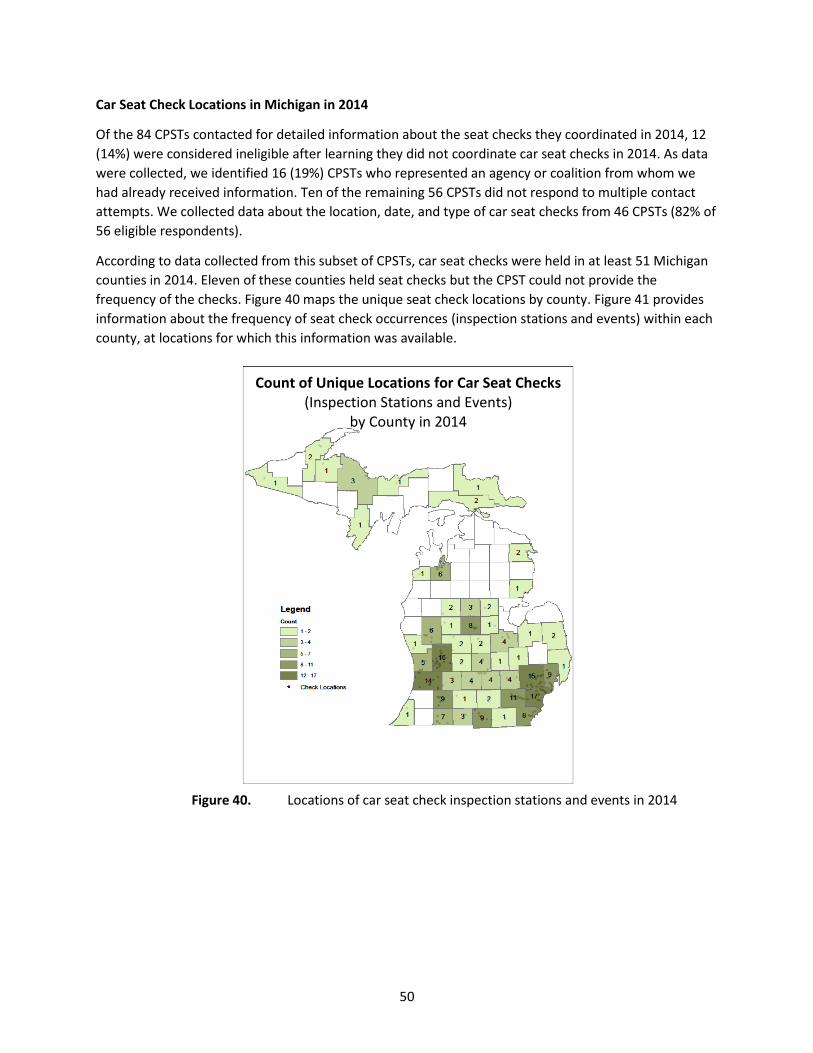
50
Car Seat Check Locations in Michigan in 2014
Of the 84 CPSTs contacted for detailed information about the seat checks they coordinated in 2014, 12
(14%) were considered ineligible after learning they did not coordinate car seat checks in 2014. As data
were collected, we identified 16 (19%) CPSTs who represented an agency or coalition from whom we
had already received information. Ten of the remaining 56 CPSTs did not respond to multiple contact
attempts. We collected data about the location, date, and type of car seat checks from 46 CPSTs (82% of
56 eligible respondents).
According to data collected from this subset of CPSTs, car seat checks were held in at least 51 Michigan
counties in 2014. Eleven of these counties held seat checks but the CPST could not provide the
frequency of the checks. Figure 40 maps the unique seat check locations by county. Figure 41 provides
information about the frequency of seat check occurrences (inspection stations and events) within each
county, at locations for which this information was available.
Locations of car seat check inspection stations and events in 2014 Figure 40.
Count of Unique Locations for Car Seat Checks (Inspection Stations and Events)
by County in 2014

51
Count of Car Seat Check Occurrences (where frequency of checks was known)
by County in 2014
Frequency of car seat check occurrences by county in 2014 Figure 41.

52
Child Passenger Safety Services in Trauma Facilities
Based on review of hospital websites, it appeared that 16 of 37 trauma facilities offered car seat checks or provided information for a community program for child passenger safety. We were able to reach an operator or nurse at 32 of the 37 hospitals to inquire about car seat services. Based on telephone calls, 14 hospitals offered car seat checks as indicated in Table 14. There was 81% agreement between website and telephone information (kappa 0.63).
Child passenger safety services in Michigan Trauma Facilities Table 14.
Hospital Location
Trauma Center Designation
24
Child Passenger Safety Services
Adult Pediatric by website by phone
Beaumont Botsford Hospital Farmington Hills Level II No Not reached
Beaumont Hospital: Grosse Pointe Grosse Point Level III Yes Yes
Beaumont Hospital: Royal Oak Royal Oak Level I Level II Yes Yes
Beaumont Hospital: Wayne Wayne Level III No No
Beaumont Oakwood: Dearborn Dearborn Level II No Not reached
Beaumont Oakwood: Southshore Trenton Level II No Not reached
Borgess Medical Center Kalamazoo Level II No No
Bronson Methodist Hospital Kalamazoo Level I Yes Yes
Children’s Hospital of Michigan Detroit Level I Yes Yes
Covenant Hospital Saginaw Level II Level II No Not reached
Detroit Receiving Hospital Detroit Level I Yes No
Genesys Regional Medical Center Grand Blanc Level II No No
Helen DeVos Children’s Hospital Grand Rapids Level I Yes Yes
Henry Ford Hospital Detroit Level I No No
Henry Ford Macomb Hospital Clinton Twp Level II No No
Henry Ford Wyandotte Hospital Wyandotte Level III No No
Hurley Medical Center Flint Level I Level II Yes Yes
McLaren Flint Flint Level III No No
McLaren Lapeer Region Lapeer Level II No No
McLaren Macomb Hospital Mt. Clemens Level II No No
McLaren Oakland Pontiac Level II No No
Mercy Health Muskegon – Hackley Muskegon Level II Yes Yes
Mercy Health Saint Mary’s Grand Rapids Level II No No
MidMichigan Medical Center Midland Level II Yes No
Munson Medical Center Traverse City Level II Yes Yes
Providence Hospital Southfield Level II No No
Sinai-Grace Hospital Detroit Level II No Not reached
Sparrow Hospital Lansing Level I Yes Yes
Spectrum Health Butterworth Grand Rapids Level I Yes Yes
St. John Hospital & Medical Center Detroit Level II Level II No No
St. Joseph Mercy Hospital Ann Arbor Level II No Yes
St. Joseph Mercy Oakland Pontiac Level II No Yes
St. Mary’s of Michigan Saginaw Level II Yes No
UMHS/C.S. Mott Children’s Hospital Ann Arbor Level I Level I Yes Yes
UP Health System – Marquette Marquette Level II Yes No
UP Health System - Portage Hancock Level III Yes Yes

53
Chapter 7. Impact of Seat Checks and Restraint Systems Distributed to Families
METHODS
We received files from Safe Kids Michigan1 containing data extracted from two versions of the Child
Passenger Safety Checklist Forms (8,184 forms from 2010 and early 2011; 16,987 forms from 2011 and
later). In total, we received data for 25,171 forms (each form represented one row of data). These forms
contain information about individual seats checked at either inspection stations or events. Each form has
information for up to two seat checks for the same vehicle (one entered on the front and one on the
back of the form). We created a dataset that contained two rows of data per form (one row of data per
side) resulting in 50,342 rows of data. To exclude data that was extracted from a blank second page
efficiently, we excluded cases that had “NULL” or “MISSING” values for 60 or more of the 93 variables on
the page. This resulted in a dataset containing 32,838 rows of data. We then excluded 427 rows of data
that contained duplicate information, leaving 32,411 Safe Kids Michigan seat checks for analysis.
Participant address information, as hand entered onto forms from Safe Kids Michigan and scanned into
Excel, was geocoded using Google Maps Geocoding API (Google Inc., Mountain View, CA). This allowed
for the mapping of the geocoded participant home addresses using ArcGIS Desktop 10.3.1 (ESRI, Inc.,
Redlands, CA) to determine the locations of families who utilized Safe Kids Michigan car seat checks
between January 2010 and June 2015. On the first pass, 4,986 (20%) addresses from the original data
file (representing 25,171 forms) could not be geocoded. These addresses were hand-reviewed and
corrected by the research assistants (HO, MB). Typographical errors and errors in the scanner reading of
handwritten information were common causes for addresses not being geocoded on the first pass.
Data used in analyses of the impact of car seat checks include restraint type on arrival and departure,
installation method on arrival and departure, location of restraint on arrival and departure, restraint
history, prior crash, labels missing, expired seat, recalled seat, installation direction, whether a seat was
provided to the family, and whether the check was an event or station. Data were reconciled between
the two different versions of the form (2010/2011 and 2011+) as coding of some variables had changed.
We considered a seat change to have occurred if a child had a different restraint type between arrival
and departure and a problem or error to have been identified if the CPST indicated that seat was
involved in a prior crash, had missing labels, was expired, recalled, or the history of the seat was
unknown. We also examined change in direction and change in seat installation method between
arrival and departure. We calculated counts and percentages for variables by year to describe the
impact of seat checks on program participants. We also determined how many seats were provided by
a coalition and the proportion of seats that were checked at a station or event.
Weight and height data were not considered valid for analyses, as CPSTs did not use consistent units of
measure (e.g., pounds, kilograms). In addition, these handwritten responses were not accurately or
reliably scanned. Similar concerns prevented the use of scanned data related to coalition and technician.
We examined the relationship between the total number of Safe Kids Michigan Coalition seat checks
(2010-2014) by participant address and the number of certified CPSTs in Michigan in July 2015
1 When interpreting the data presented in this chapter, it should be noted that during the study period there were
no Safe Kids Coalitions in the Upper Peninsula of Michigan.

54
graphically and using the Pearson Correlation test. July 2015 was selected to represent the number of
CPSTs in Michigan each year for this analysis.
OHSP provided data related to seats distributed to sites in the Lower Peninsula through their office from as early as April 2011 to as recently as November 2014. Data provided by OHSP included:
1) reporting forms (a CPST-generated report summarizing the types of child restraint systems provided to families through the OHSP community car seat distribution program); 2) half sheets (an OHSP-generated tally of OHSP-funded child restraint systems with documentation of distribution submitted by CPSTs to OHSP); and 3) child passenger safety checklist forms (submitted by CPSTs to document their distribution of OHSP-funded child restraint systems to families).
The reporting forms were used to determine the number of OHSP seats distributed throughout the
Lower Peninsula and the location for each agency was determined through searches on Google Maps
(Google, Inc., Mountain View, CA). Data for seats purchased through a grant from OHSP to the Upper
Peninsula from 2010 through 2014 were obtained from the project director of Kids Always Ride Safe
(KARS). Summary files provided to the research team contained the number of seats and the date of
distribution to agencies in the Upper Peninsula. The location of each agency was determined through
searches on Google Maps (Google, Inc., Mountain View, CA).
RESULTS
Data from 32,411 seat checks conducted by the Safe Kids Coalitions in Michigan’s Lower Peninsula were
available for analysis. Data from 2010 to 2014 represented full years of data; only 13 seat checks were
from 2015. Roughly one-third of forms (35%) included two seats checked in a single vehicle.
Safe Kids Seat Checks, 2010-2014
The total number of seats checked per year through Safe Kids Michigan Coalitions is shown in Figure 42,
ranging from a low of 5,569 in 2014 to a high of 7,396 in 2012. The majority of seats were checked at an
inspection station (light blue bars) as opposed to an event (dark blue bars). The total number of seats
checked at an event was lower in 2013 and 2014 compared with prior years. Inspection station or event
was not indicated on 680 (2%) forms. There was an increase in the number of crashes involving a child
≤9 who was killed, injured, improperly restrained or in the front from 2010 to 2014 (black line, diamond
marker) and the number of CPSTs remained stable (blue line, square marker).
Number of Safe Kids Michigan seat checks, crashes, and CPSTs by year Figure 42.
0
1000
2000
3000
4000
5000
2010 2011 2012 2013 2014
Co
un
ts
Year Checks at Events Checks at Stations Children <=9 in Crashes CPSTs

55
Restraint Type and Installation Method
Table 15 shows child restraint system types and the methods of installation in use on arrival to a car seat
check and Table 16 shows child passenger restraint types and the methods of installation in use on
departure from a car seat check. The most common restraint types on arrival were rear-facing car seats
(47%) followed by forward-facing car seats (22%). On departure, the proportion of rear-facing and
forward-facing car seats increased to 57% and 25% respectively. Roughly 70% of child restraint systems
had a method of installation indicated on arrival and more than 95% had a method of installation
indicated on departure. Seat belt only and lower anchor only installation methods were most common
on arrival and departure.
Safe Kids Michigan seat check checklist; characteristics – on arrival Table 15.
2010 N (%)
2011 N (%)
2012 N (%)
2013 N (%)
2014 N (%)
2015* N (%)
Overall N (%)
Restraint in use 6609 6338 7396 6486 5569 13 32411
Rear-facing 2799 (42.35)
2969 (46.85)
3341 (45.17)
3190 (49.18)
2902 (52.11)
10 (76.92)
15211 (46.93)
Forward-facing 1585 (23.98)
1367 (21.57)
1639 (22.16)
1367 (21.08)
1108 (19.90)
1 (7.69)
7067 (21.80)
Booster 857 (12.97)
718 (11.33)
783 (10.59)
687 (10.59)
580 (10.41)
0 (0.00)
3625 (11.18)
Seat belt 483 (7.31)
370 (5.84)
381 (5.15)
281 (4.33)
240 (4.31)
0 (0.00)
1755 (5.41)
No restraint 885 (13.39)
914 (14.42)
1252 (16.93)
961 (14.82)
739 (13.27)
2 (15.38)
4753 (14.66)
Installation method 4781 (72.34)
4418 (69.71)
5045 (68.21)
4625 (71.31)
3969 (71.27)
5 (38.46)
22843 (70.48)
Seat belt only 3416 (71.45)
2838 (64.24)
3234 (64.10)
2799 (60.52)
2235 (56.31)
2 (40.00)
14524 (63.58)
Lower anchors (LA) only 839 (17.55)
977 (22.11)
1076 (21.33)
1110 (24.00)
1036 (26.10)
2 (40.00)
5040 (22.06)
Seat belt + tether 93 (1.95)
99 (2.24)
131 (2.60)
125 (2.70)
136 (3.43)
1 (20.00)
585 (2.56)
LA + tether 209 (4.37)
243 (5.50)
288 (5.71)
302 (6.53)
301 (7.58)
0 (0.00)
1343 (5.88)
Seat belt + LA 163 (3.41)
175 (3.96)
216 (4.28)
197 (4.26)
174 (4.38)
0 (0.00)
925 (4.05)
Tether only 23 (0.48)
44 (1.00)
48 (0.95)
40 (0.86)
49 (1.23)
0 (0.00)
204 (0.89)
All 3 in use 38 (0.79)
42 (0.95)
52 (1.03)
52 (1.12)
38 (0.96)
0 (0.00)
222 (0.97)
*partial year of data from 2015

56
Safe Kids Michigan seat check checklist; characteristics – on departure Table 16.
2010 N (%)
2011 N (%)
2012 N (%)
2013 N (%)
2014 N (%)
2015* N (%)
Overall N (%)
Restraint in use 6609 6338 7396 6486 5569 13 32411
Rear-facing 3340 (50.54)
3644 (57.49)
4091 (55.31)
3872 (59.70)
3417 (61.35)
11 (84.62)
18375 (56.70)
Forward-facing 1648 (24.94)
1425 (22.48)
1882 (25.45)
1516 (23.37)
1260 (22.63)
1 (7.69)
7732 (23.86)
Booster 1375 (20.80)
1031 (16.27)
1122 (15.17)
889 (13.71)
740 (13.29)
0 (0.00)
5157 (15.91)
Seat belt 166 (2.51)
157 (2.48)
169 (2.29)
149 (2.30)
101 (1.81)
0 (0.00)
742 (2.29)
No restraint 80 (1.21)
81 (1.28)
132 (1.78)
60 (0.93)
51 (0.92)
1 (7.69)
405 (1.25)
Installation method 6397 (96.79)
6100 (96.24)
7097 (95.96)
6316 (97.33)
5403 (97.02)
12 (92.31)
31325 (96.65)
Seat belt only 4492 (70.22)
3767 (61.75)
4237 (59.70)
3526 (55.83)
2929 (54.21)
11 (91.67)
18962 (60.53)
Lower anchors (LA) only 1149 (17.96)
1416 (23.21)
1579 (22.25)
1598 (25.30)
1480 (27.39)
0 (0.00)
7222 (23.06)
Seat belt + tether 247 (3.86)
305 (5.00)
503 (7.09)
542 (8.58)
489 (9.05)
0 (0.00)
2086 (6.66)
LA + tether 413 (6.46)
541 (8.87)
676 (9.53)
571 (9.04)
410 (7.59)
1 (8.33)
2612 (8.34)
Seat belt + LA 30 (0.47)
23 (0.38)
26 (0.37)
23 (0.36)
30 (0.56)
0 (0.00)
132 (0.42)
Tether only 21 (0.33)
31 (0.51)
65 (0.92)
45 (0.71)
55 (1.02)
0 (0.00)
217 (0.69)
All 3 in use 45 (0.70)
17 (0.28)
11 (0.15)
11 (0.17)
10 (0.19)
0 (0.00)
94 (0.30)
*partial year of data from 2015
Child Restraint System Problems Identified
The CPST-identified problems discovered during car seat checks are shown in Table 16. History unknown
and incorrect direction were most common. Expired seats and those missing labels were identified in
less than 10% of seat checks. About twice as many seats were involved in a crash than were recalled.
Problems identified in Safe Kids Michigan seat checks Table 17. Problems Identified 2010
N (%) 2011 N (%)
2012 N (%)
2013 N (%)
2014 N (%)
2015* N (%)
Overall N (%)
History unknown 2302 (34.83)
2030 (32.03)
2558 (34.59)
1919 (29.59)
1591 (28.57)
3 (23.08)
10403 (32.10)
Expired 609 (9.21)
538 (8.49)
721 (9.75)
578 (8.91)
468 (8.40)
1 (7.69)
2915 (8.99)
Labels missing 621 (9.40)
527 (8.31)
643 (8.69)
500 (7.71)
435 (7.81)
0 (0.00)
2726 (8.41)
Involved in a crash 147 (2.22)
241 (3.80)
547 (7.40)
281 (4.33)
221 (3.97)
0 (0.00)
1437 (4.43)
Recalled 179 (2.71)
158 (2.49)
146 (1.97)
87 (1.34)
332 (5.96)
1 (7.69)
903 (2.79)
Direction incorrect 2034 (30.78)
2041 (32.20)
2474 (33.45)
2124 (32.75)
1809 (32.48)
4 (30.77)
10486 (32.35)

57
Changes Resulting from Seat Checks
Comparing information recorded on arrival to on departure, 43% of forms indicated a change in
restraint type, 50% a change in installation method and 36% a change in the seating location for the
child (Table 18). Coalitions provided a seat to families for about half of the checks. Seats were often
provided to families who had a seat on arrival.
Overall impact of Safe Kids Michigan seat checks Table 18. 2010
N (%) 2011 N (%)
2012 N (%)
2013 N (%)
2014 N (%)
2015* N (%)
Overall N (%)
Change on Departure
Seat type 2893 (43.77)
2697 (42.55)
3387 (45.80)
2723 (41.98)
2233 (40.10)
2 (15.38)
13935 (42.99)
Installation method 2844 (43.03)
3072 (48.47)
3852 (52.08)
3363 (51.85)
2906 (52.18)
10 (76.92) 16047 (49.51)
Location in vehicle 2214 (33.50)
2266 (35.75)
2811 (38.01)
2438 (37.59)
2106 (37.82)
5 (38.46)
11840 (36.53)
Coalition provided seat 3284 (49.69)
2833 (44.70)
3521 (47.61)
2949 (45.47)
2376 (42.66)
2 (15.38)
14965 (46.17)
Seat provided to a family with a seat on arrival
2320 (70.65)
1970 (69.54)
2457 (69.78)
2133 (72.33)
1762 (74.16)
2 (100.00)
10644 (71.13)
*Partial year of data from 2015
Table 19 compares the type of restraint in use on arrival to the type of restraint in use on departure for the sample. No change is shown in the cells without shading (along the diagonal). Changes in seat type were least common when a rear-facing car seat was the restraint in use on arrival and most common when a seat belt or no restraint were in use on arrival. In Table 19, a change to a more protective seat is highlighted in green, a change to the next level restraint (likely because the child outgrew the restraint in which they arrived at the seat check) is highlighted in yellow, and a change to no restraint in orange. We hypothesize that seat checks that resulted in “no restraint”on depature were coding errors as a guiding principle of car seat checks is to have children leave more safely restrained than when they arrived.
Changes in restraint type as a result of Safe Kids Michigan seat checks Table 19.
On Departure
On ARRIVAL
Rear-facing (18378)
Forward-facing (7733)
Booster (5157)
Seat belt (742)
No restraint (405)
Rear-facing (15214)
14394 (94.61) 621 (4.08) 52 (0.34) 22 (0.14) 125 (0.82)
Forward-facing (7068)
855 (12.10) 5477 (77.49) 640 (9.05) 24 (0.34) 72 (1.02)
Booster (3625)
93 (2.57) 713 (19.67) 2719 (75.01) 60 (1.66) 40 (1.10)
Seat belt (1755)
71 (4.05) 283 (16.13) 875 (49.86) 497 (28.32) 29 (1.65)
No restraint (4753)
2965 (62.38) 639 (13.44) 871 (18.33) 139 (2.92) 139 (2.92)

58
Safe Kids Seat Checks by Participant’s County of Residence
Figure 43 shows the total number of Safe Kids Michigan seat checks completed between 2010 and 2014
mapped to the county in which the participant resides. The number of seats checked through Safe Kids
Michigan is an underrepresentation of the total number of seats checked in the state due to situations
where a seat is checked by a CPST working outside of an affiliation with a Safe Kids Michigan Coalition. It
is also important to recall that Safe Kids Michigan Coalitions cover 60 of the 83 counties in Michigan,
with no coverage in the Upper Peninsula. Families living outside of a Safe Kids Coalition covered county
may travel to across county lines to obtain services from a CPST affiliated with a Safe Kids Michigan
Coalition. The county with the highest number of residents having seats checked was Kent (8,026 seat
checks). There were between 2,300 and 3,000 seats checked for families from Genesee, Wayne,
Washtenaw, and Macomb Counties. Families from the Upper Peninsula infrequently had seat checks in
the Safe Kids Michigan dataset, which was expected given the lack of Safe Kids Coalitions in the Upper
Peninsula.
Total number of car seats checked for Safe Kids Michigan per county Figure 43.
Number of child restraint systems checked through Safe Kids Michigan 2010-2014
mapped to the county of the participant’s home address

59
Figure 44 presents the count and proportion of Safe Kids Michigan seat checks that resulted in a change
by county of residence of the participants. Figure 45 presents the count and proportion of Safe Kids
Michigan coalition provision of a seat by county of resident of the participants.
Safe Kids Michigan seat checks resulting in change Figure 44.
Safe Kids Michigan seat checks where a seat was provided Figure 45.
Number of Safe Kids Michigan seat checks that resulted in a change
by county
Proportion of Safe Kids Michigan seat checks that resulted in a change
by county
Number of Safe Kids Michigan seat checks where a seat was provided
by county
Proportion of Safe Kids Michigan seat checks where a seat was provided
by county
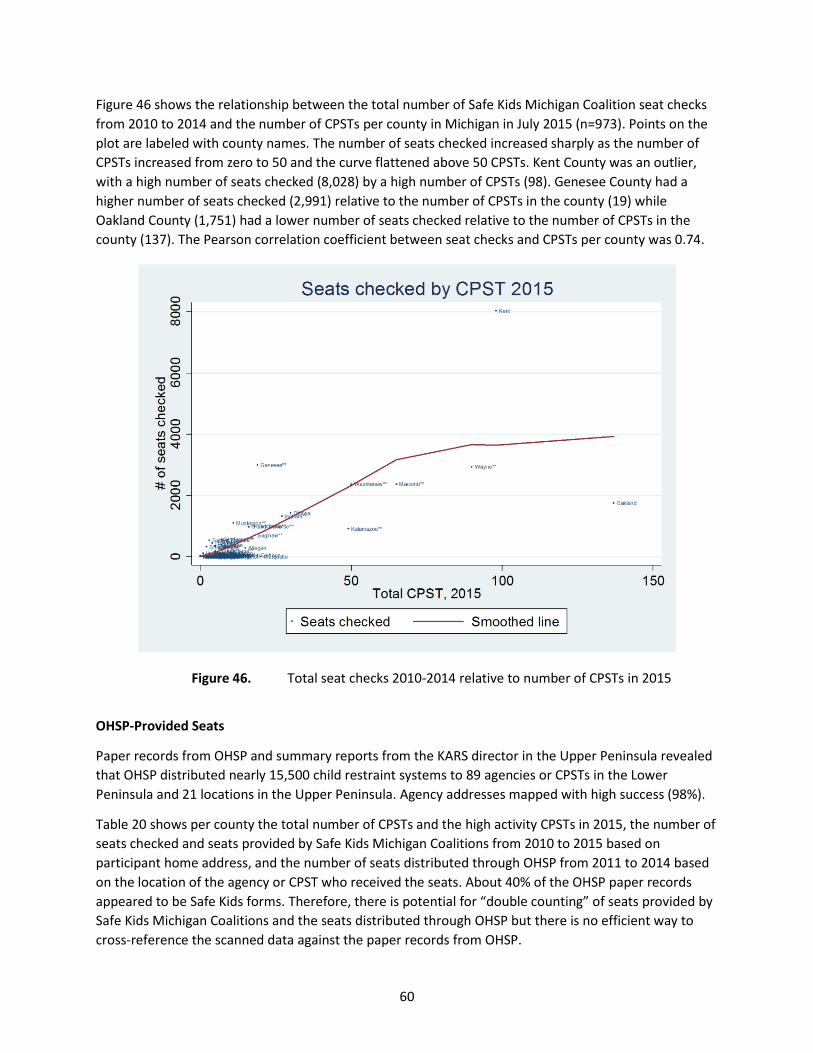
60
Figure 46 shows the relationship between the total number of Safe Kids Michigan Coalition seat checks
from 2010 to 2014 and the number of CPSTs per county in Michigan in July 2015 (n=973). Points on the
plot are labeled with county names. The number of seats checked increased sharply as the number of
CPSTs increased from zero to 50 and the curve flattened above 50 CPSTs. Kent County was an outlier,
with a high number of seats checked (8,028) by a high number of CPSTs (98). Genesee County had a
higher number of seats checked (2,991) relative to the number of CPSTs in the county (19) while
Oakland County (1,751) had a lower number of seats checked relative to the number of CPSTs in the
county (137). The Pearson correlation coefficient between seat checks and CPSTs per county was 0.74.
Total seat checks 2010-2014 relative to number of CPSTs in 2015 Figure 46.
OHSP-Provided Seats
Paper records from OHSP and summary reports from the KARS director in the Upper Peninsula revealed
that OHSP distributed nearly 15,500 child restraint systems to 89 agencies or CPSTs in the Lower
Peninsula and 21 locations in the Upper Peninsula. Agency addresses mapped with high success (98%).
Table 20 shows per county the total number of CPSTs and the high activity CPSTs in 2015, the number of
seats checked and seats provided by Safe Kids Michigan Coalitions from 2010 to 2015 based on
participant home address, and the number of seats distributed through OHSP from 2011 to 2014 based
on the location of the agency or CPST who received the seats. About 40% of the OHSP paper records
appeared to be Safe Kids forms. Therefore, there is potential for “double counting” of seats provided by
Safe Kids Michigan Coalitions and the seats distributed through OHSP but there is no efficient way to
cross-reference the scanned data against the paper records from OHSP.

61
High-activity CPSTs, Safe Kids services, and OHSP seats by county Table 20.
County
2015 CPSTs Safe Kids Michigan OHSP Count from OHSP List (Count of High Activity CPSTs per 2015 Survey)
Seats Checked
2010-2015
Seats Provided
2010-2015
Seats Distributed 2011-2014
Statewide 971 (174) 33,998 15,756 15,447
1 Upper Peninsula
Alger 1 (0) - - -
Baraga 5 (2) - - 60
Chippewa 4 (0) 1 0 97
Delta 5 (1) - - 40
Dickinson 3 (1) - - 55
Gogebic 9 (1) - - 343
Houghton 11 (3) 2 1 565
Iron 1 (0) - - 43
Keweenaw 0 (0) 3 1 -
Luce 1 (0) - - -
Mackinac 4 (0) 1 0 96
Marquette 20 (2) 2 0 1317
Menominee 2 (0) 2 2 20
Ontonagon 3 (0) 3 2 60
Schoolcraft 3 (1) 1 0 91
2 Traverse Bay Area
Antrim 3 (0) 23 1 90
Benzie** 3 (1) 108 34 24
Grand Traverse** 16 (3) 977 175 132
Kalkaska 0 (0) 29 4 -
Leelanau** 1 (7) 98 18 11
Manistee 3 (0) 10 2 -
Missaukee 2 (0) 3 0 18
Wexford 3 (1) 29 6 347
3 Northern Lower
Alcona 0 (0) 2 2 -
Alpena 5 (1) - - 30
Charlevoix 3 (0) 4 1 20
Cheboygan 2 (0) - - -
Crawford 1 (0) 2 1 -
Emmet 5 (1) 6 1 17
Montmorency 0 (0) 2 0 -
Oscoda 0 (0) 7 1 57
Otsego 4 (0) 28 11 55
Presque Isle 1 (0) 2 1 -
Roscommon 3 (0) - - 25
4 Lakeshore
Mason** 6 (2) 92 37 88
Muskegon** 11 (5) 1097 838 841
Newaygo 9 (1) 55 32 112
Oceana** 9 (1) 183 117 10
5 Chippewa Valley
Clare** 1 (1) 1 0 -
Isabella** 7 (5) 39 21 197
Lake** 1 (0) 37 23 110
Mecosta 9 (0) 5 2 184
Montcalm 11 (2) 67 41 17
Osceola 6 (0) 1 1 270

62
6 Saginaw Valley
High Activity CPSTs Seats
Checked 2010-2015
Seats Provided
2010-2015
Seats Distributed 2011-2014
Arenac 2 (1) 2 2 69
Bay 13 (3) 43 12 18
Genesee** 19 (4) 2991 2072 945
Gladwin** 0 (0) 11 2 208
Gratiot** 4 (2) 21 5 252
Iosco 1 (2) 5 2 67
Lapeer** 3 (3) 95 44 87
Midland** 9 (2) 34 10 32
Ogemaw 4 (1) 6 2 81
Saginaw** 18 (1) 695 537 -
Shiawassee 2 (0) 320 137 -
7 Thumb Area
Huron 1 (0) 110 60 -
Sanilac** 3 (2) 536 353 504
Tuscola** 9 (0) 545 287 -
8 West Michigan
Allegan 15 (1) 284 123 20
Kent** 98 (19) 8028 3783 326
Ottawa 30 (7) 1422 689 247
9 Southwest
Berrien 8 (2) 14 5 56
Cass 10 (1) 45 23 150
Van Buren 8 (0) 105 31 158
10 South Central
Barry 10 (1) 113 49 -
Branch** 5 (2) 189 117 81
Calhoun 19 (6) 38 24 801
Ionia 3 (2) 99 41 93
Kalamazoo** 49 (3) 911 377 87
St. Joseph** 7 (2) 567 372 117
11 Capital Area
Clinton** 6 (0) 470 179 -
Eaton** 5 (1) 337 57 125
Hillsdale** 4 (1) 448 290 1449
Ingham** 27 (4) 1318 278 136
Jackson 5 (0) 42 19 1367
Lenawee 5 (2) 353 204 44
12 Huron Valley
Livingston** 18 (3) 994 468 6
Monroe 7 (1) 380 178 114
Washtenaw** 50 (13) 2366 803 1235
13 Wayne
Wayne** 90 (11) 2937 1926 500
14 Oakland
Oakland** 137 (20) 1751 357 490
15 Macomb/St. Clair
Macomb** 65 (7) 2365 435 68
St. Clair 5 (3) 86 27 72
**Safe Kids Michigan Coalition covered county

63
The county-level number and distribution of OHSP-provided seats are presented in Figure 47.
OHSP seats distributed per county Figure 47.
Child restraint systems distributed by OHSP 2011-2014
by county of agency or CPST that received seats
Child restraint systems distributed by OHSP 2011-2014
Safe Kids Michigan Coalitions Outlined
Child restraint systems distributed by OHSP 2011-2014
OHSP Regions Outlined

64
Chapter 8. Match of Needs and Resources
METHODS
We took several approaches to examine the match of child passenger safety needs and resources.
First, we assessed the number of children ≤4 years, children 5 to 9 years, and CPSTs per OSHP Region
and per county in 2014. We then calculated the number of children per CPST, again at the regional and
county levels. We mapped the number of children (≤9 years) per CPSTs per county. We determined the
ratio of the number of children to the number of CPSTs was easier to interpret than a CPST to child ratio
as the result is a whole number. The other advantage of this approach is that the results can be tied
back to our estimates of the number of seats checked by CPSTs in the low, medium, and high-activity
levels presented in Chapter 5. We utilized the county population estimates from the U.S. Census Bureau
and published by the Kids Count data center25 to obtain estimates of the child population in the ≤4-year-
old and 5- to 9-year-old age groups in 2014.
Second, we examined child passenger safety services, including Safe Kids Michigan seat checks, coalition
provided seats, and seats distributed through OHSP in relation to the child population ≤4 years old by
region. We focused on the ≤4 year old child population for this analysis recognizing most seat checks are
conducted with caregivers of young children.26 We calculated the number of Safe Kids Michigan seat
checks and the number of seats provided by Safe Kids Michigan Coalitions and distributed through OHSP
per child ≤4 years per OHSP Region.
Third, we estimated the distances families would have to travel to reach the nearest car seat check
location (inspection station or event). We used the home address provided by participants on the Safe
Kids Michigan seat check forms. The seat check inspection station and event locations, as shown in
Chapter 6, were obtained from CPSTs through interviews and were not exclusively Safe Kids Michigan
Coalition seat check locations. All Michigan roads were loaded as networks that allow families access to
the car seat check points. Estimated travel distances were calculated using ArcGIS Desktop 10.3.1 (ESRI,
Inc., Redlands, CA). The median estimated travel distance in miles was calculated for each county.
Fourth, we executed Network Analyst Location-Allocation functions in ArcGIS Desktop 10.3.1 (ESRI, Inc.,
Redlands, CA) to test the capacity of the current system. The Michigan roads network allowed the 979
CPSTs in 2014 to travel from their work address (or home if no work address was provided) to the
centroids of the 2767 census tracts in the state. We performed calculations where the census tracts
were weighted by the population of the children 9 years old and also weighted by Risk (based on Score
5) multiplied by the population of the children 9 years old. There are 41 census tracts that contained
no children. For these calculations, CPSTs were allowed to travel as far as 300 miles to provide service at
a census tract centroid. We assessed the travel distances for CPSTs to service no more than 150, 420,
and 1,500 risk-weighted children. The 150 scenario was chosen as a crude baseline approximation for a
CPST dedicated to providing service to 50 child restraint systems per year. We determined the number
of census tracts that would be serviced in each scenario. We created “Spider Maps” that graphically
represent the “as the crow flies” distance between a CPST and census tract centroid where their services
were assumed to be provided for the purposes of these analyses. The “as the crow flies” distance is
presented in the maps only for visual simplicity while the location-allocation analyses utilized the actual
65
distance between the CPST and census tract centroid as calculated along the road network. The results
are one set of solutions but do not represent all possible solutions.
Fifth, we generated and mapped Thiessen polygons to define theoretical service territories for the
current CPST workforce. Each polygon contains the address of only one CPST. The polygons bound the
area around each CPST’s address so that any location inside the polygon is closer to the CPST’s address
within than it is to any of the other CPST’s addresses.
RESULTS
Children per CPST
The number of CPSTs, children, and children per CPST are shown by region in Table 21. The two regions
with the lowest number of children per CPST were the Upper Peninsula and Lakeshore, while the two
regions with the highest number of children per CPST were Capital Area and Wayne.
Children, CPSTs, and children per CPST per OHSP Region Table 21. OHSP Region
Children ≤4 years in 2014
Children 5 to 9 years
in 2014
CPSTs per in 2014
Children ≤4 years per CPST
Children 5 to 9 years
per CPST
Statewide 570,929 720,566 979 583 736
1 Upper Peninsula 14,477 15,798 65 223 243
2 Traverse Bay Area 12,255 13,691 34 360 403
3 Northern Lower 9,464 10,729 25 379 429
4 Lakeshore 16,497 17,836 39 423 457
5 Chippewa Valley 12,300 13,377 37 332 362
6 Saginaw Valley 59,817 64,425 82 729 786
7 Thumb Area 6,427 7,262 15 428 484
8 West Michigan 68,457 71,372 150 456 476
9 Southwest 17,006 17,456 31 549 563
10 South Central 37,047 39,855 86 431 463
11 Capital Area 42,978 45,279 46 934 984
12 Huron Valley 36,036 39,333 79 456 498
13 Wayne 115,331 230,480 96 1,201 2,401
14 Oakland 68,027 73,209 131 519 559
15 Macomb/St. Clair 54,810 60,464 63 870 960
The ratios of children per CPST in 2014 per county are presented in Table 22 for the ≤4-year-old age group, the 5- to 9-year-old age group, and the overall population of children ≤9 years. Counties are listed in rank order from fewest children ≤9 years old per CPST to most children ≤9 years old per CPST, the names of the top 20% and bottom 20% of counties are highlighted in green and red respectively.
Children ≤4 years and 5 to 9 years old per CPST by county Table 22.
OHSP Traffic Safety Region
County
Children per CPST ≤4 year olds
Children per CPST 5 to 9 year olds
Children per CPST ≤9 year olds
Statewide N/A 583 736 1,319
1 Upper Peninsula Gogebic 77 89 166
1 Upper Peninsula Baraga 78 92 170
1 Upper Peninsula Alger 81 99 180
1 Upper Peninsula Ontonagon 76 107 183

66
1 Upper Peninsula Schoolcraft 122 132 254
1 Upper Peninsula Mackinac 140 164 304
1 Upper Peninsula Marquette 166 175 341
OHSP Traffic Safety Region
County
Children per CPST 0 to 4 year olds
Children per CPST 5 to 9 year olds
Children per CPST 0 to 9 year olds
4 Lakeshore Oceana 163 180 343
5 Chippewa Valley Osceola 188 209 397
1 Upper Peninsula Houghton 193 212 405
6 Saginaw Valley Ogemaw 196 208 405
2 Traverse Bay Area Benzie 184 227 411
2 Traverse Bay Area Antrim 199 240 439
3 Northern Lower Roscommon 224 251 475
5 Chippewa Valley Mecosta 232 247 479
7 Thumb Area Tuscola 246 282 528
1 Upper Peninsula Luce 268 289 557
3 Northern Lower Alpena 265 306 571
2 Traverse Bay Area Grand Traverse 305 324 629
4 Lakeshore Newaygo 306 338 644
12 Huron Valley Washtenaw 329 339 668
3 Northern Lower Otsego 324 347 672
3 Northern Lower Emmet 321 358 678
5 Chippewa Valley Montcalm 323 358 681
10 South Central Barry 316 367 683
10 South Central Kalamazoo 342 357 699
6 Saginaw Valley Arenac 312 389 701
6 Saginaw Valley Bay 343 386 730
9 Southwest Cass 355 381 736
10 South Central Calhoun 327 396 768
8 West Michigan Kent 394 395 789
4 Lakeshore Mason 379 417 796
9 Southwest Van Buren 398 407 805
3 Northern Lower Oscoda 378 441 819
4 Lakeshore Muskegon 408 436 843
2 Traverse Bay Area Missaukee 460 462 921
2 Traverse Bay Area Leelanau 411 512 923
5 Chippewa Valley Lake 395 556 951
5 Chippewa Valley Isabella 470 500 970
1 Upper Peninsula Iron 478 515 993
2 Traverse Bay Area Kalkaska 481 524 1005
3 Northern Lower Presque Isle 470 540 1010
14 Oakland Oakland 493 531 1023
2 Traverse Bay Area Wexford 507 568 1075
6 Saginaw Valley Gratiot 539 575 1114
10 South Central Branch 538 581 1119
3 Northern Lower Cheboygan 509 617 1126
8 West Michigan Allegan 525 609 1134
10 South Central St. Joseph 565 614 1179
12 Huron Valley Livingston 544 655 1199
3 Northern Lower Crawford 564 679 1243
1 Upper Peninsula Delta 624 666 1290
6 Saginaw Valley Midland 618 703 1321
1 Upper Peninsula Dickinson 644 693 1336
11 Capital Area Ingham 702 688 1390

67
8 West Michigan Ottawa 673 739 1412
11 Capital Area Clinton 697 816 1514
7 Thumb Area Sanilac 739 833 1572
OHSP Traffic Safety Region
County
Children per CPST 0 to 4 year olds
Children per CPST 5 to 9 year olds
Children per CPST 0 to 9 year olds
11 Capital Area Hillsdale 840 918 1758
15 Macomb/St. Clair Macomb 863 943 1806
6 Saginaw Valley Lapeer 844 1012 1856
9 Southwest Berrien 939 952 1891
6 Saginaw Valley Shiawassee 892 1010 1902
1 Upper Peninsula Chippewa 926 995 1921
2 Traverse Bay Area Manistee 916 1130 2046
6 Saginaw Valley Saginaw 1025 1046 2070
12 Huron Valley Monroe 1004 1112 2116
6 Saginaw Valley Genesee 1034 1093 2128
6 Saginaw Valley Iosco 1156 1108 2264
11 Capital Area Lenawee 1102 1181 2283
1 Upper Peninsula Menominee 1125 1226 2351
11 Capital Area Eaton 1165 1244 2409
6 Saginaw Valley Gladwin 1201 1254 2455
13 Wayne Wayne 1309 1311 2619
10 South Central Ionia 1218 1407 2626
3 Northern Lower Charlevoix 1258 1402 2660
7 Thumb Area Huron 1502 1665 3167
15 Macomb/St. Clair St. Clair 2050 2385 4434
11 Capital Area Jackson 2197 2421 4618
1 Upper Peninsula Keweenaw Children 84 : CPSTs 0 Children 106 : CPSTS 0 Children 190 : CPSTs 0
3 Northern Lower Alcona Children 319 : CSPTs 0 Children 351 : CPSTs 0 Children 670 : CPSTs 0
3 Northern Lower Montmorency Children 338 : CPSTs 0 Children 370 : CPSTs 0 Children 708 : CPSTs 0
5 Chippewa Valley Clare Children 1665 : CPSTs 0 Children 1697 : CPSTs 0 Children 3662 : CPSTs 0

68

69
Children ≤9 years per CPST per county Figure 48.
Number of children ≤9 years per CPST per county in 2014
Children ≤9 years per CPST per county in 2014
Safe Kids Michigan Coalitions Outlined
Children ≤9 years per CPST per county in 2014
OHSP Regions Outlined

70
Child Passenger Safety Services per Child
Table 23 summarizes the child passenger safety services per child by region. The Thumb Area, West
Michigan, South Central, Traverse Bay Area, and Huron Valley Regions had the highest number of Safe
Kids checks per child ≤4 years (each greater than 0.09). The Northern Lower and Southwest Regions
were lowest (less than 0.01 per child ≤4 years). The Thumb Area and Upper Peninsula Regions had the
highest number of seats provided per child (0.19) and Oakland and Macomb/St. Clair the lowest (0.01).
Again, we note the potential for “double counting” of seats provided by Safe Kids Michigan Coalitions
and the seats distributed through OHSP due to the lack of an efficient way to cross-reference the
scanned data against the paper records from OHSP.
Child passenger safety services per child population ≤4 years by region Table 23.OHSP Region Children
≤4 years in 2014
Safe Kids Checks
2010-2015
Safe Kids Checks
per child ≤4
Safe Kids Provided Seats
2010-2015
OHSP Seats Distributed 2010-2015
Total Seats (Safe Kids +OHSP)
Total Seats per child ≤4
Statewide 570,929 33,998 0.06 15,765 15,447 31,203 0.05 1 Upper Peninsula* 14,477 15 0.001 6 2,787 2,793 0.19
2 Traverse Bay Area 12,255 1,277 0.10 240 622 862 0.07
3 Northern Lower 9,464 53 0.005 18 204 222 0.02
4 Lakeshore 16,497 1,427 0.09 1,024 1,051 2,075 0.06
5 Chippewa Valley 12,300 150 0.01 88 778 866 0.07
6 Saginaw Valley 59,817 4,223 0.07 2,825 1,759 4,584 0.08
7 Thumb Area 6,427 1,191 0.18 700 504 1,204 0.19
8 West Michigan 68,457 9,734 0.14 4,595 593 5,188 0.07
9 Southwest 17,006 164 0.009 59 364 423 0.02
10 South Central 37,047 1,917 0.11 980 1,179 2,159 0.06
11 Capital Area 42,978 2,968 0.07 1,027 3,121 4,148 0.10
12 Huron Valley 36,036 3,740 0.10 1,449 1,355 2,804 0.08
13 Wayne 115,331 2,937 0.02 1,926 500 2,426 0.02
14 Oakland 68,027 1,751 0.02 357 490 847 0.01
15 Macomb/St. Clair 54,810 2,451 0.04 462 140 602 0.01
*There were no Safe Kids Michigan Coalitions in the Upper Peninsula during the study period.

71
Estimated Travel Distances to Seat Check Locations
The estimated median road travel distances from participant home addresses to the nearest car seat
check locations, within counties with at least one Safe Kids Michigan car seat check participant, are
shown in Figure 49 and Table 24. Counties with no values did not have record of a resident who
attended a Safe Kids Michigan Coalition seat check during the study period. Median estimated travel
distances were less than 1.5 miles in Isabella, St. Joseph, Eaton, and Washtenaw Counties and more than
40 miles in Mason, Charlevoix, Crawford, Mackinac, and Otsego Counties.
Estimated family travel distances to seat check locations by county Figure 49.
Estimated median travel distance in miles from participant home to nearest car seat check location
by county based on 2014 seat check locations

72
Estimated family travel distance to seat check locations by county Table 24.
County Median Distance from Participant Home Addresses to nearest Seat
Check Locations in Miles
Statewide
2.26 1. Upper Peninsula Chippewa 14.63
Houghton 5.64
Keweenaw 39.13
Mackinac 45.23
Marquette 18.69
Menominee 32.66
Ontonagon 28.98
Schoolcraft 33.51
2. Traverse Bay Area Antrim 15.57
Benzie 9.29
Grand Traverse 3.27
Kalkaska 21.34
Leelanau 6.77
Manistee 20.01
Missaukee 29.30
Wexford 20.57
3. Northern Lower Alcona 22.47
Charlevoix 42.09
Crawford 43.87
Emmet 33.82
Montmorency 33.60
Oscoda 32.10
Otsego 47.49
Presque Isle 17.94
4. Lakeshore Mason 41.24
Muskegon 3.00
Newaygo 3.97
Oceana 24.40
5. Chippewa Valley Clare 3.53
Isabella 0.93
Lake 15.02
Mecosta 10.39
Montcalm 6.03
Osceola 11.69
6. Saginaw Valley Arenac 23.81
Bay 9.36
Genesee 3.76
Gladwin 9.07
Gratiot 10.83
Iosco 16.29
Lapeer 15.18
Midland 6.81
Ogemaw 24.28
Saginaw 1.68
Shiawassee 2.51
7. Thumb Area Huron 27.43
Sanilac 11.17
Tuscola 7.49

73
8. West Michigan Allegan 3.07
Kent 1.61
Ottawa 3.58
9. Southwest Berrien 17.51
Cass 10.04
Van Buren 10.66
10. South Central Barry 8.22
Branch 2.82
Calhoun 4.78
Ionia 6.04
Kalamazoo 1.65
St. Joseph 1.26
11. Capital Area Clinton 4.11
Eaton 1.41
Hillsdale 2.53
Ingham 2.73
Jackson 9.90
Lenawee 3.49
12. Huron Valley Livingston 4.84
Monroe 1.60
Washtenaw 1.44
13. Wayne County Wayne 2.54
14. Oakland County Oakland 2.23
15. Macomb/St. Clair Counties
Macomb 2.66
St. Clair 9.05
CPST Capacity and Service Areas
Based on the location of CPSTs in 2014, the system did not have the capacity to meet the needs of all
Michigan children 9 years as the allocation scenarios borrow capacity from technicians that are greater
distances away. Despite the limits to the CPST capacity in the system, our analyses found that the 2014
CPST technician locations align better with the locations of our risk-weighted child census tract’s
demand than they do with the locations of the pure child population census tract’s demand (Table 25).
In other words, the CPSTs were located in areas where they could meet the needs of the children
estimated to be at greatest risk for suboptimal child passenger safety behaviors.
Location-Allocation derived CPST travel distance to service points Table 25.
Risk-adjusted population of
children 9 serviced by 979 CPSTs
CPST travel distance to service points (census tract centroid)
Census tracts served
Census tracts not served**
Median (mi) Mean (mi)
150 14.4 33.1 1515 1252
420 11.1 23.1 2598 169
1500 2.6 4.3 2720 47
1500 (not risk adjusted) 5.5 12 2712 55 **including 41 tracts with no children 9 years
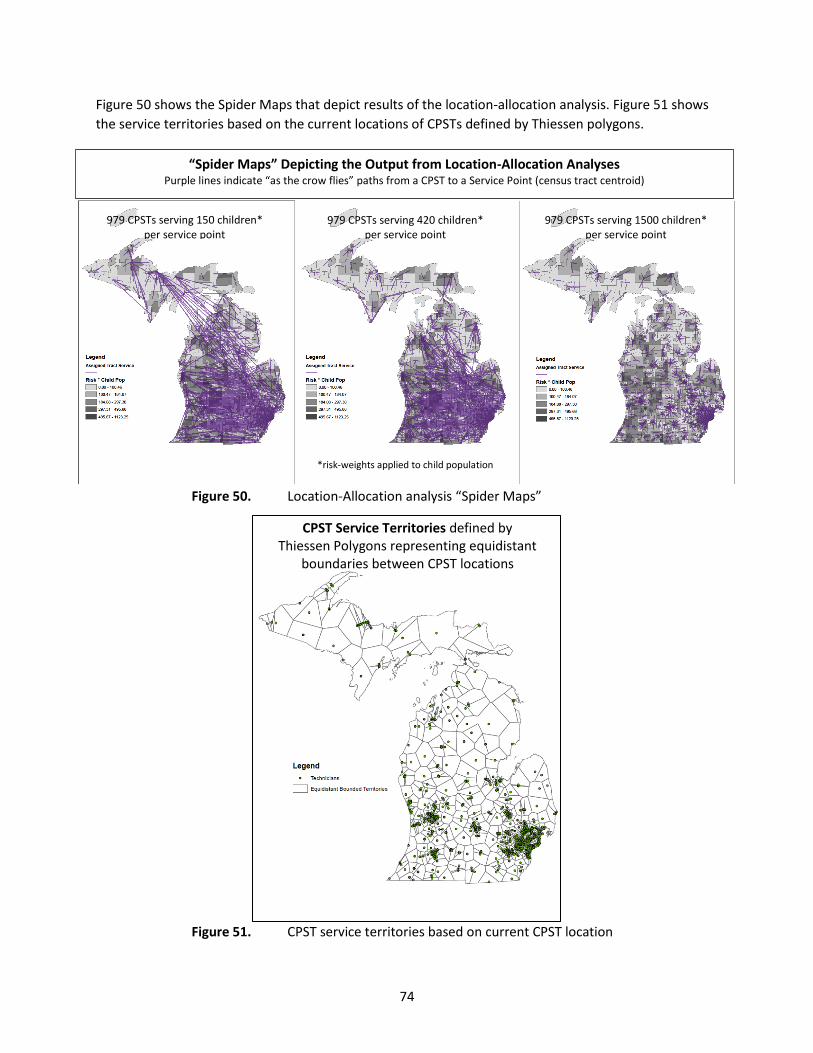
74
Figure 50 shows the Spider Maps that depict results of the location-allocation analysis. Figure 51 shows
the service territories based on the current locations of CPSTs defined by Thiessen polygons.
Location-Allocation analysis “Spider Maps” Figure 50.
CPST service territories based on current CPST location Figure 51.
“Spider Maps” Depicting the Output from Location-Allocation Analyses Purple lines indicate “as the crow flies” paths from a CPST to a Service Point (census tract centroid)
979 CPSTs serving 150 children* per service point
979 CPSTs serving 420 children* per service point
979 CPSTs serving 1500 children* per service point
*risk-weights applied to child population
CPST Service Territories defined by Thiessen Polygons representing equidistant
boundaries between CPST locations

75
Chapter 9. Discussion, Limitations, Conclusions, Recommendations
DISCUSSION
This study characterized child passenger safety resources in Michigan in terms of quantity, location, and
service delivery from 2010 through 2014 and in relation to the child population at greatest need for
these resources. This study is the first to our knowledge to assess child passenger safety resource needs
based on socio-demographic characteristics at a population level using data available from the U.S.
Census and the American Community Survey. We also surveyed child passenger safety technicians
(CPSTs) throughout Michigan to gather new information about the workforce that is primarily
responsible for promotion of child passenger safety best practices.
Population at Risk for Suboptimal Child Passenger Safety Behaviors
We took a novel approach to identify the areas (primarily counties) where children at greatest risk for
suboptimal child passenger safety behaviors live by calculating six composite Risk Scores. The composite
Risk Scores were derived from factors made up of variables that served as area-based indicators of the
relevant child population (9 years), racial and ethnic minority and non-English speaking populations,
poverty, low educational attainment, and crash-related risk. Although the risk indicator variables used in
our analyses were selected based on research showing an association with suboptimal child passenger
restraint use, the spatial correlation among these indicators in Michigan is small. In other words, the
counties with the greatest risk and presumed need for child passenger safety resources based on the
composite scores differed from counties considered at risk based on each factor independently. The low
spatial correspondence of risk indicator variables illustrates the multidimensional nature of child
passenger safety resource needs. Clearly composite Risk Scores, such as those used in this research, are
needed to obtain a clear picture of the overall distribution of risk for suboptimal child passenger safety
behaviors at the population level.
For our analyses, we developed adjusted composite Risk Scores rather than an unweighted summed
indicator of risk because not all of the variables were expected to have equal contributions to
suboptimal child passenger safety behaviors. We present results from six Risk Score calculations based
on different weighting schemes assigned to the contributing factors. The assignment of weights to the
individual factors, were based on our current understanding of the contribution of these factors to child
passenger safety behaviors. Our analyses demonstrate that taking different approaches to the
adjustment for the relevant child population (including the child population as a factor or weighting the
composite risk score by the size of the child population) resulted in the greatest changes in rank order of
counties based on Risk Scores. Otherwise, small adjustments to the weighting approach did not alter the
Risk Scores for each county in a meaningful way. We selected Score 5 as the focus of our results as it was
deemed most representative of the concentration of the population of children 9 years in Michigan
and the distribution of socio-demographic characteristics that would be expected to place a child at
higher risk for suboptimal child passenger safety behaviors. We acknowledge that the Risk Scores
developed for this study have not been externally validated. Therefore, the inclusion of specific variables
and the allocation of the weights could be debated. For example, one could argue for the inclusion of a
measure of the current child passenger safety resources in the Risk Score. We opted against this
approach as we viewed the child passenger safety resources as modifiable and protective factors that
did not align with the framework we established for the Risk Scores.

76
Child Passenger Safety Resources
By surveying CPSTs throughout Michigan, we were able to reveal information not previously known
about this population. The responding CPSTs shared their reasons for becoming a CPST and maintaining
their certification, special skills that they possess, and their service to children and families. Our overall
response rate, around 50%, is a good response rate for a web-based survey of professionals that offered
limited incentive for participation. Although survey response rates by county were variable, ranging
from 30-81 percent, we received responses from at least one CPST in all but five counties that have
CPSTs. The numbers of respondents corresponded closely to the number of total CPSTs in each country,
thereby providing data that are reasonably characteristic of the state and the distribution of CPSTs
across counties.
We assessed the number of child passenger safety technicians (CPSTs) throughout Michigan based on
addresses reported by CPSTs to OHSP over the 4-year study period and based on ZIP Codes reported by
CPSTs who responded to our survey in 2015. Considering both data sources, all of the counties except
three (Keweenaw, Montmorency and Alcona) had at least one CPST at some point between 2012 and
2015; however, most counties did not have any specialized CPSTs who were instructors, trained to work
with children with special needs, or Spanish speaking. Most counties had small numbers of CPSTs (e.g.,
<10). The counties with the largest number of CPSTs were located in areas with the greatest number of
children, all in the southern Lower Peninsula of Michigan. The concentration of CPSTs in the Lower
Peninsula may in part be related to the presence of 13 Safe Kids Michigan Coalitions that cover only 30
counties located in the Lower Peninsula of the state.
Many CPSTs take their initial training because it is required for their employment. The most common
motivations to maintain status as a CPST include filling a gap in available community services, because it
is a natural fit, and to fulfill a job requirement. Even though CPST recertification rates are typically
between 50-60% nationally, the number of CPSTs in Michigan has been steady over the past 5 years
above 900 and the number of CPST instructors has remained around 50. From 2012-2015 the net
change in CPSTs and CPST-Is combined was 19. The OHSP Region that gained the largest number of
CPSTs and CPST-Is was Oakland followed by West Michigan. The Capital Area and Southwest Regions
had the greatest declines in CPSTs and CPST-Is followed by the Northern Lower Region.
The two factors that CPSTs reported to most influence their participation in car seat checks were the
time of day and the distance to the seat check. The latter of these two has important implications for
the activity levels and perhaps also the effective number of technicians in counties that have low
population densities and longer distances between cities and towns. In contrast, the sheer number of
CPSTs available to meet the large number of children in heavily populated areas is a bigger limitation
than distance to seat check locations. Geographic differences, including population density, must be
considered in solutions designed to address the unmet child passenger safety needs unique to urban
centers and rural areas of the state. For example, a large increase in CPSTs in an area with sparse
population may be less effective than strategic organization of the current CPSTs in that area in order to
increase the person hours available to meet the need for services.
In many counties, the estimated distance families have traveled from home to the nearest seat check
location was relatively small, 10 miles or less. With the data available, we do not know if these short
travel distances are the result of well-positioned seat check locations or indicative of a service that is
only being accessed by families who live within close proximity. Our location-allocation analyses would

77
suggest that the current CPST workforce is better positioned to meet the needs of children at greater
risk for suboptimal child passenger safety behaviors than it is to service the child population in general.
Among CPSTs responding to our survey, about 20% reported they were paid, 40% volunteered their
time, and the rest reported both being paid and volunteering their time to conduct car seat checks. The
CPSTs with the highest activity level most often had a combination of volunteer and paid efforts.
Because CPSTs vary in the frequency and amount of seat checks they conduct in a given year,
measurement of the raw number of CPSTs in an area will be insufficient for ensuring a certain number of
children will receive services. Our survey data suggest that the 41% of CPSTs classified as “high activity”
are estimated to check more than 85% of the child restraint systems in Michigan. High-activity CPSTs are
often those who encounter families as part of their occupation, particularly CPSTs in law enforcement
and social services. Providing child passenger safety training as part of the certification programs for first
responders and social workers would have a positive, and potentially significant, effect on the number
of high activity CPSTs available in Michigan. Providing pay to CPSTs to conduct seat checks at a high
activity level would require the identification of new funding streams. Recognizing that many CPSTs
provide their services as volunteers, there may be ways to bolster productivity in the volunteer network.
For example, OHSP could encourage volunteer CPSTs to align with organizations that have infrastructure
to deliver child passenger safety services to families efficiently, such as a Safe Kids Coalition or an active
county health department. Another option would be to consider providing financial support to staff Safe
Kids Coalitions for counties that are not currently covered, which might allow better coordination of
child passenger safety resources within those areas.
Another important limit on access to child passenger safety resources that was identified in our research
is the low number of bilingual CPSTs in Michigan. This limits the capacity of the current system to reach
populations with high numbers of non-English speakers. Although Spanish was the most commonly
reported language other than English spoken by CPSTs, only 3% of the survey population and less than
2% of the CPSTs on the OHSP lists report speaking Spanish. Furthermore, it was surprising that none of
the CPSTs responding to our survey indicated fluency in Arabic, Chinese, or Japanese, despite Southeast
Michigan having areas of high concentrations of families who primarily speak these languages. Active
recruitment of new bilingual CPSTs in areas that have large populations that speak languages other than
English would be one approach to ensure children in Michigan have equitable access to these services.
Clearly, CPSTs and seat check locations are not evenly distributed throughout the state, which results in
families traveling greater distances to obtain child passenger safety services in some areas. However,
the number of children 9 years old per CPST shows that CPSTs working in the Upper Peninsula have
fewer children to which they need to provide services than those living in population-dense areas such
as Wayne County. The number and locations of car seat checks are greatest where the population and
the number of technicians is the greatest. It is intuitive to think in turn that less populated areas in the
state with few or no CPSTs are also those with the highest child passenger safety needs; however, this is
not the case according to our analyses. Notably, the counties in the Upper Peninsula of Michigan have
the fewest CPSTs, yet they also have the lowest numbers of children 9 years per CPST. The overlap of
the areas with higher numbers of children per CPSTs and greater concentrations of at risk children
suggest that child passenger safety resources are most deficient in areas of the state with higher
population density, higher poverty, and higher levels of diversity. However, the number of children per
CPST is only one measure of the match between child passenger safety needs and resources.

78
Impact of Car Seat Checks
We analyzed the impact of Michigan’s CPSTs based on the number of child safety seats checked,
changes as the result of a car seat check, and the distribution of child restraint systems by Safe Kids
Michigan Coalitions and through OHSP. The total number of seat checks conducted by CPSTs affiliated
with Safe Kids Michigan peaked in 2012 and there was a sharp decline in the number of seats checks at
events in 2013 and 2014 compared with prior years. The decline in seat checks, specifically in seat check
events, conducted in affiliation with Safe Kids Michigan may be in part explained by a change in
availability of liability insurance coverage for CPSTs through Safe Kids Worldwide. It would be worth
exploring this issue further in a future survey of CPSTs. If challenges in obtaining liability insurance for
seat checks are reducing the number of CPSTs willing to provide seat checks, OHSP could evaluate the
costs and benefits of providing liability insurance coverage to CPSTs in Michigan. This may be a more
cost-effective means of increasing seat checks than other approaches.
Our results do indicate that families who receive child passenger safety services from CPSTs affiliated
with Safe Kids Michigan are likely to experience a change in restraint type, installation method or
seating location. In addition, half of the Safe Kids Michigan seat checks resulted in the provision of a
seat. These observations suggest that child passengers are likely to be safer as a result of seat checks.
However, we have no direct way to assess the impact of child passenger safety technicians on children
involved in crashes as there is no way to link crash records and seat check data at this time. There was
an increase in the number of crashes involving a child ≤ 9 who was killed, injured, improperly restrained
or in the front seat of the vehicle from 2010 to 2014. However, this timeframe coincides with a period of
improvement in the economic outlook in Michigan which could contribute to greater exposure to
passenger vehicle travel for children.
LIMITATIONS
The primary limitation to the interpretation of our results is that data were available for only some of
the seat checks that are conducted in Michigan. Therefore, our results likely underestimate the amount
of child passenger safety services currently being provided. We know that seat checks may not be
conducted in affiliation with a Safe Kids Coalition and that families do not always receive an OHSP
distributed restraint system, but we do not know the extent of our underestimations. On the other
hand, there is potential for the records from OHSP to represent the same seat checks that were present
in the Safe Kids Michigan data. This would result in an overestimation of the number of child safety seats
provided to families in the state. In addition, some of the child passenger safety services accounted for
in this study were delivered to families who utilized services for a second or third time in the study
period. Families may return for additional seat checks in other family vehicles, with other children in
their family, or at points of transition, for example from a rear-facing to forward-facing restraint. If many
families received repeat services multiple times in the study period, our results would overestimate the
reach of CPSTs in Michigan to some extent. The magnitude of overestimation is unknown.
We noted discrepancies between the data received by OHSP regarding seat distribution. Some CPSTs
submitted paper forms for seats that did not include the provision of an OHSP distributed seat with the
forms they submitted to document the provision of OHSP distributed seats to families. In addition, some
CPSTs submitted duplicate forms for seat checks conducted over different reporting periods. For
example, one report submitted in August 2014 contained seat checks from July 2014 and a second

79
report submitted in September 2014 contained seat checks form June 2014 through August 2014. There
were also discrepancies in the recorded counts of seats distributed on the reporting forms and half
sheets, and at times these counts differed from the total number of forms submitted by the CPST to
support their report. We attempted to reconcile these differences when possible but were limited in the
number of staff hours available to hand search for duplicate forms and lacked definitive proof that when
a form indicated a seat was provided it represented a seat that was distributed through OHSP.
While we have some information about the location of service providers (CPSTs), the location of seat
check inspection stations and events, and the home location of families who received services from
CPSTs affiliated with Safe Kids Michigan, the data do not provide any direct links to determine exactly
which CPSTs work in which locations or which seat check locations were utilized by any given family.
Therefore our results present estimates of travel distances that may be over or under estimations of the
true travel distances from CPSTs to service locations and travel distances from family homes to service
locations. We also note that child restraint systems distributed through OHSP are provided to CPSTs in a
limited number of agencies at specific locations, but there are no known limits on the travel of CPSTs
and families across county boundaries. Therefore, we expect that the restraints distributed through
OHSP were provided to families who lived near and far from the distribution points (i.e., addresses for
specific agencies or CPSTs) that were available for our analyses.
As with all surveys there is potential for participation bias. With our anonymous survey, we have no way
to test for differences between responders and non-responders. Given the higher response rate among
CPTS Instructors, we expect survey respondents to represent CPSTs who are more engaged in this work.
This would bias our results toward an overestimation of the number of CPSTs at higher activity levels.
However, the actual activity level of CPSTs may be higher or lower than we estimated.
The survey results for a few particular questions, specifically related to CPST roles and events versus
stations, raise concerns for confusion on the part of the respondents. Respondents seemed confused
when asked about their roles as CPST, CPST-I, Senior Checker, Technician Proxy, or Event Coordinator.
Respondents may have also had different views of inspection stations and events despite our attempt to
provide clear definitions to distinguish the two. We missed the opportunity to ask CPSTs who both work
and volunteer why they volunteer and if retired, from what career/job they had retired. These questions
could be included in future surveys.
RECOMMENDATIONS
Number of Child Passenger Safety Technicians to meet need
National organizations recommend use of different restraint system types through three child passenger safety stages before transitioning to use of an adult seat belt alone. While there is no specific national recommendation for the number of times a child should have their restraint system checked by a CPST, we propose concrete recommendations to guide decision makers in Michigan. Due to the complexities of selection, installation and use of child restraint systems, we recommend that families seek the assistance of a certified CPST at a minimum of three points in their child’s first decade of life:
1) at or before birth;
2) when transitioning from a rear-facing to a forward-facing car seat, typically around age 2;
3) when transitioning from a forward-facing car seat to a booster seat, typically around age 5.

80
We estimated the number of seat checks per county based on approximations of the number of children
at birth, at age 2, and at age 5 per year. To approximate the number of children of these ages we divided
the number of children in the two age groups available from the U.S. Census (≤4 years and 5-9 years) by
5, the total number of years in each group. We then multiplied the resultant number of children by two
for the younger age group and added the resultant number of children in the older age group to
determine the number of seat checks needed per year. We then calculated the number of CPSTs needed
to complete the 20%, 33%, 50%, and 100% of the recommended number of seat checks, assuming that a
CPST can check 50 seats per year (Table 26). Because 50 seat checks per year was the average number
of seats checked per CPST in our survey data, it is possible that CPSTs would have to work at higher
activity levels than they do currently to reach this target. It is estimated that only about 10% of families
of young children utilize car seat checks nationally. Therefore, we would hypothesize that increasing the
number of CPSTs in Michigan to meet 20% of the seat checks would allow more Michigan children to
receive services than the national norms. Several counties (name italicized in Table 26) already have the
same or greater numbers of CPSTs than our estimates for the number of CPSTs needed to cover 20% of
proposed checks. In addition, CPSTs can provide services across county boundaries.
CPSTs needed to meet proposed number of seat checks Table 26.
Proposed Number of Seat Checks
per year
Number of CPSTs in
Michigan in 2014
Estimated CPSTs to cover 20% of
proposed checks
Estimated CPSTs to cover 33% of
proposed checks
Estimated CPSTs to cover 50% of
proposed checks
Estimated CPSTs to cover 100% of proposed checks
Statewide 578,836 979 2,315 3,820 5,788 11,577
1 Upper Peninsula 8950 65 36 59 90 179
Alger 209 4 1 1 2 4
Baraga 248 5 1 2 2 5
Chippewa 1138 2 5 8 11 23
Delta 1148 3 5 8 11 23
Dickinson 792 2 3 5 8 16
Gogebic 388 8 2 3 4 8
Houghton 1196 10 5 8 12 24
Iron 294 1 1 2 3 6
Keweenaw 55 0 0 0 1 1
Luce 165 1 1 1 2 3
Mackinac 267 3 1 2 3 5
Marquette 2026 20 8 13 20 41
Menominee 695 1 3 5 7 14
Ontonagon 103 2 0 1 1 2
Schoolcraft 225 3 1 1 2 5
2 Traverse Bay Area 7640 35 31 50 76 153
Antrim 637 5 3 4 6 13
Benzie 476 4 2 3 5 10
Grand Traverse 2990 15 12 20 30 60
Kalkaska 594 1 2 4 6 12
Leelanau 534 2 2 4 5 11
Manistee 592 1 2 4 6 12
Missaukee 552 2 2 4 6 11
Wexford 1265 5 5 8 13 25

81
Proposed Number of Seat Checks
per year
Number of CPSTs in
Michigan in 2014
Estimated CPSTs to cover 20% of
proposed checks
Estimated CPSTs to cover 33% of
proposed checks
Estimated CPSTs to cover 50% of
proposed checks
Estimated CPSTs to cover 100% of proposed checks
3 Northern Lower 5931 25 24 39 59 119
Alcona 198 0 1 1 2 4
Alpena 836 6 3 6 8 17
Charlevoix 784 2 3 5 8 16
Cheboygan 654 2 3 4 7 13
Crawford 361 1 1 2 4 7
Emmet 999 5 4 7 10 20
Montmorency 209 0 1 1 2 4
Oscoda 239 1 1 2 2 5
Otsego 797 4 3 5 8 16
Presque Isle 296 1 1 2 3 6
Roscommon 559 3 2 4 6 11
4 Lakeshore 10166 38 41 67 102 203
Mason 939 4 4 6 9 19
Muskegon 6504 16 26 43 65 130
Newaygo 1710 9 7 11 17 34
Oceana 1013 9 4 7 10 20
5 Chippewa Valley 7595 37 30 50 76 152
Clare 1005 1 4 7 10 20
Isabella 2015 6 8 13 20 40
Lake 269 1 1 2 3 5
Mecosta 1278 9 5 8 13 26
Montcalm 2209 13 9 15 22 44
Osceola 819 7 3 5 8 16
6 Saginaw Valley 36812 82 147 243 368 736
Arenac 405 3 2 3 4 8
Bay 3434 13 14 23 34 69
Genesee 15178 24 61 100 152 304
Gladwin 731 1 3 5 7 15
Gratiot 1322 4 5 9 13 26
Iosco 684 1 3 5 7 14
Lapeer 2700 5 11 18 27 54
Midland 2714 7 11 18 27 54
Ogemaw 601 5 2 4 6 12
Saginaw 6809 14 27 45 68 136
Shiawassee 2234 5 9 15 22 45
7 Thumb Area 4023 15 16 27 40 80
Huron 934 1 4 6 9 19
Sanilac 1387 3 6 9 14 28
Tuscola 1703 11 7 11 17 34
8 West Michigan 41657 150 167 275 417 833
Allegan 4311 14 17 28 43 86
Kent 26507 110 106 175 265 530
Ottawa 10839 26 43 72 108 217
9 Southwest 10294 31 41 68 103 206
Berrien 5660 11 23 37 57 113
Cass 1745 7 7 12 17 35
Van Buren 2889 13 12 19 29 58

82
Proposed Number of Seat Checks
per year
Number of CPSTs in
Michigan in 2014
Estimated CPSTs to cover 20% of
proposed checks
Estimated CPSTs to cover 33% of
proposed checks
Estimated CPSTs to cover 50% of
proposed checks
Estimated CPSTs to cover 100% of proposed checks
10 South Central 22790 86 91 150 228 456
Barry 1997 10 8 13 20 40
Branch 1657 5 7 11 17 33
Calhoun 5019 17 20 33 50 100
Ionia 2306 3 9 15 23 46
Kalamazoo 9370 44 37 62 94 187
St. Joseph 2441 7 10 16 24 49
11 Capital Area 26247 46 105 173 262 525
Clinton 2653 4 11 18 27 53
Eaton 3574 3 14 24 36 71
Hillsdale 1559 4 6 10 16 31
Ingham 9625 27 38 64 96 192
Jackson 5452 3 22 36 55 109
Lenawee 3385 5 14 22 34 68
12 Huron Valley 22281 79 89 147 223 446
Livingston 5925 15 24 39 59 119
Monroe 4992 8 20 33 50 100
Washtenaw 11363 56 45 75 114 227
13 Wayne
Wayne 69126 96 277 456 691 1383
14 Oakland
Oakland 41853 131 167 276 419 837
15 Macomb/St. Clair 34017 63 136 225 340 680
Macomb 28830 59 115 190 288 577
St. Clair 5187 4 21 34 52 104
Tracking of Seat Check Services
Our research has identified some of the challenges and limitations to the current data collected from
seat check services. The collection of paper records regarding seat checks and the distribution of child
restraint systems is labor intensive; without a standardized approach it is prone to errors. Given the
costs associated with the distribution of child restraint systems, it is important to accurately document
the service being provided and to assess characteristics about the restraints that have been distributed.
An electronic data collection system could increase the standardization of information gathered and
improve the ease of analysis of those data. Many CPSTs submitted data on Safe Kids forms or on forms
that resembled Safe Kids forms. Therefore there is potential for these data to be extracted using optical
recognition software. With the loss of liability insurance coverage through Safe Kids Worldwide, CPSTs
may no longer have an incentive to utilize standardized Safe Kids forms to record their findings in a seat
check. This is an opportune time for Michigan OHSP to intervene with the development of a
standardized, electronic form for collection of data during seat checks. Collection of additional data,
including the location of the seat check, work or home location of the CPST, and socio-demographic

83
characteristics of the families utilizing services, would allow for a richer understanding of the spatial
relationships explored in this study.
CONCLUSIONS
We have developed a system to determine the location of children 9 years living in populations with
concentrations of socio-demographic characteristics that are expected to place children at higher risk
for suboptimal child passenger safety behaviors. Current child passenger safety resources in Michigan
are insufficient to provide a seat check to every child but those resources are located in areas where
they are likely to be meeting the needs of children with greater risk as we have defined it. Seat checks
resulted in change for most families who utilized services from a CPST affiliated with a Safe Kids
Michigan Coalition. Expanding the impact of Michigan’s child passenger safety resources will require
careful planning to optimize the utilization of existing resources and strategic planning to ensure the
placement of new services that will efficiently address the needs of at risk children.

84
References
1. Michigan Crash Facts Data Query Tool. 2016; https://www.michigantrafficcrashfacts.org/querytool#q1;0;2015;;. Accessed June 15, 2016.
2. Insurance Institute for Highway Safety - Child Safety Fatality Facts. 2016; http://www.iihs.org/iihs/topics/t/child-safety/fatalityfacts/child-safety. Accessed June 21, 2016.
3. Michigan Child Passenger Safety Law. 2008; http://www.michigan.gov/msp/0,1607,7-123-1593_3504_22774-113709--,00.html. Accessed June 15, 2012.
4. Michigan Traffic Crash Facts - 2014 Fact Sheets Age 0-15. 2014; http://publications.michigantrafficcrashfacts.org/2014/2014ChildrenAges0-15.pdf. Accessed June 15, 2016.
5. Centers for Disease Control and Prevention, Ten Leading Causes of Death, United States, 2013. http://www.cdc.gov/injury/wisqars/leadingcauses.html. Accessed October 19, 2015.
6. Corrigan M. Keeping Kids Alive: Child Deaths in Michigan, Michigan Child Death State Advisory Team 11th Annual Executive Report. The Michigan Departmetn of Human Services, Michigan Public Health Institute;2012.
7. Decina LE, Lococo KH. Child restraint system use and misuse in six states. Accid Anal Prev. 2005;37(3):583-590.
8. Decina LE, Lococo KH. Observed LATCH use and misuse characteristics of child restraint systems in seven states. J Safety Res. 2007;38(3):273-281.
9. Decina LE, Knoebel KY. Child safety seat misuse patterns in four states. Accid Anal Prev. 1997;29(1):125-132.
10. Bachman SL, Salzman GA, Burke RV, Arbogast H, Ruiz P, Upperman JS. Observed child restraint misuse in a large, urban community: Results from three years of inspection events. J Safety Res. 2016;56:17-22.
11. Macy ML, Freed GL. Child Passenger Safety Practices in the U.S.: Dispartities in Light of Updated Recommendations. American Journal of Preventive Medicine. 2012;43(3).
12. Macy ML, Cunningham RM, Resnicow K, Freed GL. Disparities in age-appropriate child passenger restraint use among children aged 1 to 12 years. Pediatrics. 2014;133(2):262-271.
13. Sauber-Schatz EK, West BA, Bergen G. Vital signs: restraint use and motor vehicle occupant death rates among children aged 0-12 years - United States, 2002-2011. MMWR Morb Mortal Wkly Rep. 2014;63(5):113-118.
14. National Child Passenger Safety Board. 2001; http://cpsboard.org/. Accessed June 15, 2016. 15. National Child Passenger Safety Certification - A Program of Safe Kids Worldwide. 2013;
http://cert.safekids.org/. Accessed June 15, 2016. 16. Michigan Department of Health and Human Services - Injury and Violence Prevention. 2016;
http://www.michigan.gov/mdhhs/0,5885,7-339-71548_54879---,00.html. Accessed June 15, 2016.
17. Michigan Designated Trauma Facilities. 2015; https://www.michigan.gov/documents/mdch/List_of_Designated_Trauma_Facilities.11.19.14_474565_7.pdf. Accessed February 7, 2016.
18. Michigan Traffic Safety Network - Regional Traffic Safety Network. 2016; https://www.michigan.gov/documents/msp/OHSP_regional_TSN_map_1-28-16_513063_7.pdf. Accessed June 15, 2016.
19. United States Census Bureau 2010 Census. ; http://www.census.gov/2010census/data/. Accessed 5/12/2015.
20. United States Census Bureau American Community Survey. ; http://www.census.gov/programs-surveys/acs/data.html. Accessed 5/12/2015.
85
21. Michigan State Policy Traffic Safety Research. 2016; http://www.michigan.gov/msp/0,4643,7-123-1586_3501_49814---,00.html. Accessed October 1, 2015.
22. Ehiri JE, Ejere HO, Hazen AE, Emusu D, King WD, Osberg SJ. Interventions to increase children's booster seat use: a review. Am J Prev Med. 2006;31(2):185-192.
23. A Summary of Traffic Crashes on Michigan Roadways in Calendar Year 2014. http://publications.michigantrafficcrashfacts.org/2014/MTCFVol1.pdf. Accessed September 8, 2016.
24. List of Michigan Designated Trauma Facilities. 2016; https://www.michigan.gov/documents/mdch/List_of_Designated_Trauma_Facilities.11.19.14_474565_7.pdf. Accessed February 3, 2016.
25. Kids Count Data Center - A Project of The Annie E. Casey Foundation. 2016; http://datacenter.kidscount.org/data/tables/1701-population-ages-5-9?loc=24&loct=5%20-%20detailed/5/3744-3826/false/869,36,868,867,133/any/3609. Accessed July 21, 2016.
26. Kroeker AM, Teddy AJ, Macy ML. Car seat inspection among children older than 3 years: Using data to drive practice in child passenger safety. J Trauma Acute Care Surg. 2015;79(3 Suppl 1):S48-54.

86
Appendix A: Example Child Passenger Safety Checklist

87
Appendix B: CPS Technician Survey
Michigan CPS Tech Survey – Administered Online via Qualtrics©
Q1.1 We want to know about the great child passenger safety work done across Michigan! So, we are
asking all Michigan Child Passenger Safety Technicians (CPSTs) to complete this survey.
This survey is voluntary. It should take about 10-15 minutes to finish. You can skip any questions you
prefer not to answer.
If you choose to complete the survey, the Michigan Office of Highway Safety Planning (OHSP) has
offered to pay for a total of 15 recertification fees among technicians who participate and wish to be
entered into the drawing.
NOTE: We designed this survey to be completed on a full screen (laptop, desktop, or tablet). Some
questions will be difficult to view on a smart phone. Hit the next button to begin.
This survey was developed through a project funded by the Michigan Office of Highway Safety Planning
and the U.S. Department of Transportation.
Q1.2 Which best describes your current role(s) related to child passenger safety? Pick all that apply.
Child Passenger Safety Technician (CPST) (1)
Child Passenger Safety Technician-Instructor (CPST-I) (2)
Senior Checker (3)
Tech Proxy (4)
Event Coordinator (7)
None of the above (5)
Other: (please indicate) (6) ____________________
Q1.3 In the past 12 months of your work as a CPST, were you:
Volunteering (1)
Paid (2)
Both of the above (3)
Answer If IN the past 12 months of your work as a CPST, were you: Paid Is Selected Or IN the past
12 months of your work as a CPST, were you: Both of the above Is Selected

88
Q1.4 When you are working as a paid CPST, is it:
As an independent consultant/per diem/contract status (1)
Required for my job, more than 50% of my duties (2)
Required for my job, 25-50% of my duties (3)
Required for my job, less than 25% of my duties (4)
Not required, but helpful for my job (5)
Other: (please indicate) (6) ____________________
If As an independent consultan... Is Displayed, Then Skip To End of Block
Answer If In your efforts as a Child Passenger Safety Technician (CPST), which best describes your work
Volunteer Is Selected
Q1.5 When you are volunteering as a CPST, is it:
Helpful for my paid job (1)
Not helpful for my paid job (2)
Not applicable, I am not currently employed (3)
Q2.1 Have you ever distributed free car seats from the Michigan Office of Highway Safety Planning
(OHSP)?
Yes (1)
No (2)
Not sure (3)
Q2.2 As you are answering the next few questions, please keep the following definitions in mind: Car
Seat Check Event – an event during which the primary function is to check car seats. Education
sessions/lectures without car seat checks should NOT be included. Examples: Seat Check Saturday =
1 event Annual health and safety fair with car seat checks = 1 event Inspection or Fitting Station –
specific locations where car seat checks are routinely scheduled, either by appointment or drop-
in. Please count each location/time frame once. Do not count the number of times they hold checks in a
given week or month. Examples: Station 6, every 2nd Tuesday of the month, from 3-5 pm =
1 station County Health Department, Monday-Friday, from 2-4 pm = 1 station
Q2.3 In the past 12 months, did you coordinate a car seat check event(s) or inspection/fitting station(s)?
Yes (1)
No (2)
If No Is Selected, Then Skip To End of Block

89
Q2.4 In the past 12 months, how many did you coordinate?
None in the past 12 months (1)
1-2 (2)
3-5 (3)
6-10 (4)
More than 10 (5)
Car Seat Check EVENTS (1)
Inspection or Fitting STATIONS (2)
Q2.5 Have you ever asked participants to evaluate their car seat check experience? (examples:
paper/email survey or follow-up phone call)
Yes (1)
No (2)
Q3.1 For the next set of questions, please think about the past 12 months.
Q3.2 In the past 12 months, how often did you check car seats at events and/or stations?
Daily (1)
Weekly (2)
Monthly (3)
Quarterly (4)
Twice a year (5)
Once a year or less (6)
Q3.3 In the past 12 months, about how many car seats, on average, did you personally check? NOTE: Do
not count seats you “checked” or “signed-off” as a Senior Checker.
1-2 per month (1)
3-5 per month (2)
6-10 per month (3)
11-20 per month (4)
21-30 per month (5)
More than 30 car seats per month (6)
Q3.4 In the past 12 months, about how much time, on average, did you spend checking seats? NOTE:
Include hours spent as a Senior Checker. But do not count hours planning events, doing presentations
or paperwork, or scheduling appointments.
Less than 1 hour (1)
1-5 hours (2)
6-10 hours (3)
11-20 hours (4)
21-30 hours (5)
31-50 hours (6)
More than 50 hours per month (7)

90
Q3.5 In the past 12 months, which types of car seats did you typically check? Pick all that apply.
Rear-facing only car seats (1)
Rear-facing convertible car seats (2)
Forward-facing harnessed (including convertible car seats) (3)
Booster seats (4)
Kids in vehicle seat belts (5)
Q3.6 Of the seats that you selected (in Q3.5 above), estimate the percent of each type of car seat you
typically check: Please adjust percentages so the total is 100%.
Q3.7 In the past 12 months, where have you checked car seats? Pick all that apply.
Fitting/inspection stations (1)
Car seat check events (2)
Clients' chosen locations (3)
Homes of family/friends (4)
Other: (please describe) (5) ____________________
Q3.8 Of the locations you selected, estimate the percent of time you spent at each location: Please
adjust percentages so the total is 100%.
Q3.9 In the past 12 months, WHERE have you checked car seats? Indicate if the check was at an event,
fitting station or both.
Seat check EVENTS(s) (1) Fitting STATION(s) (2)
Healthcare facility/hospital (1)
Fire/Police Department (2)
County Public Health Office (3)
Car seat retailer (example: Babies R Us) (4)
Insurance office (5)
Faith-based organization (6)
Childcare center/school (7)
Car dealership (8)
Mall (9)
Park (10)

91
Q3.10 In the past 12 months, HOW did people find out about the car seat checks? Indicate if these finds
were related to an event, fitting station or both.
Seat check EVENT(s) (1)
Fitting STATION(s) (2)
Signs posted to direct people to the event or station (1)
Website or social media (2)
News media (newspaper, radio, television) (3)
Referred during a presentation or class (4)
Referred by a doctor or nurse (5)
Referred by a social service agency or health department (6)
Referred by law enforcement, court or judge (7)
Word of mouth (8)
I'm not sure (9)
Q3.11 Please select ALL of the region(s) in which you checked car seats in the past 12 months.
1. Upper Peninsula (Alger, Baraga, Chippewa, Delta, Dickinson, Gogebic, Houghton, Iron, Keweenaw,
Luce, Mackinac, Marquette, Menominee, Ontonagon, Schoolcraft) (4)
2. Northwest (Antrim, Benzie, Charlevoix, Emmet, Grand Traverse, Kalkaska, Leelanau, Manistee,
Missaukee, Wexford) (6)
3. Northeast (Alcona, Alpena, Cheboygan, Crawford, Iosco, Montmorency, Ogemaw, Oscoda,
Otsego, Presque Isle, Roscommon) (3)
4. West (Allegan, Barry, Ionia, Kent, Lake, Mason, Mecosta, Montcalm, Muskegon, Newaygo,
Oceana, Osceola, Ottawa) (5)
5. East Central (Arenac, Bay, Clare, Gladwin, Gratiot, Isabella, Midland, Saginaw) (9)
6. East (Genesee, Huron, Lapeer, Sanilac, Shiawassee, St. Clair, Tuscola) (10)
7. South Central (Clinton, Eaton, Ingham) (1)
8. Southwest (Berrien, Branch, Cass, Calhoun, Kalamazoo, St. Joseph, Van Buren) (8)
9. Southeast (Hillsdale, Jackson, Lenawee, Livingston, Monroe, Washtenaw) (7)
10. Metro Detroit (Macomb, Oakland, Wayne) (2)

92
Answer If Please selected the region(s) in which you did a car seat check in the past 12
months. Select all that apply 1. Upper Peninsula (Alger, Baraga, Chippewa, Delta, Dickinson,
Gogebic, Houghton, Iron, Keweenaw, Luce, Mackinac, Marquette, Menominee, Ontonagon, Schoolcraft)
Is Selected
Q3.12 Please select ALL of the counties, within the Upper Peninsula Region, where you checked a car
seat in the past 12 months. NOTE: Count both events and fitting stations.
Alger (1)
Baraga (2)
Chippewa (3)
Delta (4)
Dickinson (5)
Gogebic (6)
Houghton (7)
Iron (8)
Keweenaw (9)
Luce (10)
Mackinac (11)
Marquette (16)
Menominee (12)
Ontonagon (13)
Schoolcraft (14)
Unsure (please indicate city/cities, if known) (15) ____________________
Answer If Please selected the region(s) in which you did a car seat check in the past 12
months. Select all that apply 2. Northwest (Emmet, Antrim, Kalkaska, Charlevoix, Leelanau,
Benzie, Manistee, Wexford, Missaukee, Grand Traverse) Is Selected
Q3.13 Please select ALL of the counties, within the Northwest Region, where you checked a car seat in
the past 12 months. NOTE: Count both events and fitting stations.
Antrim (2)
Benzie (6)
Charlevoix (4)
Emmet (1)
Grand Traverse (10)
Kalkaska (3)
Leelanau (5)
Manistee (7)
Missaukee (9)
Wexford (8)
Unsure (please indicate city/cities, if known) (16) ____________________

93
Answer If Please selected the region(s) in which you did a car seat check in the past 12
months. Select all that apply 3. Northeast (Cheboygan, Presque Isle, Alpena, Alcona, Iosco,
Ogemaw, Roscommon, Crawford, Otsego, Montmorency, Oscoda) Is Selected
Q3.14 Please select ALL of the counties, within the Northeast Region, where you checked a car seat in
the past 12 months. NOTE: Count both events and fitting stations.
Alcona (4)
Alpena (3)
Cheboygan (1)
Crawford (8)
Iosco (5)
Montmorency (10)
Ogemaw (6)
Oscoda (11)
Otsego (9)
Presque Isle (2)
Roscommon (7)
Unsure (please indicate city/cities, if known) (15) ____________________
Answer If Please selected the region(s) in which you did a car seat check in the past 12
months. Select all that apply 4. West (Allegan, Barry, Cass, Kalamazoo, Kent, Mecosta, Muskegon,
Newaygo, Oceana, Ottawa, St. Joseph, Van Buren) Is Selected
Q3.15 Please select ALL of the counties, within the West Region, where you checked a car seat in
the past 12 months. NOTE: Count both events and fitting stations.
Allegan (1)
Barry (2)
Ionia (4)
Kent (6)
Lake (5)
Mason (3)
Mecosta (7)
Montcalm (15)
Muskegon (8)
Newaygo (9)
Oceana (10)
Osceola (12)
Unsure (please indicate city/cities, if known) (14) ____________________

94
Answer If Please selected the region(s) in which you did a car seat check in the past 12
months. Select all that apply 5. East Central (Clare, Gladwin, Arenac, Bay, Midland, Isabella,
Saginaw, Gratiot) Is Selected
Q3.16 Please select ALL of the counties, within the East Central Region, where you checked a car seat in
the past 12 months. NOTE: Count both events and fitting stations.
Arenac (3)
Bay (4)
Clare (1)
Gladwin (2)
Gratiot (8)
Isabella (6)
Midland (5)
Saginaw (7)
Unsure (please indicate city/cities, if known) (12) ____________________
Answer If Please selected the region(s) in which you did a car seat check in the past 12
months. Select all that apply 6. East (Huron, Tuscola, Genesee, Shiawassee, Lapeer, St. Clair,
Sanilac) Is Selected
Q3.17 Please select ALL of the counties, within the East Region, where you checked a car seat in the past
12 months. NOTE: Count both events and fitting stations.
Genesee (3)
Huron (1)
Lapeer (5)
Sanilac (7)
Shiawassee (4)
St. Clair (6)
Tuscola (2)
Unsure (please indicate city/cities, if known) (9) ____________________
Answer If Please selected the region(s) in which you did a car seat check in the past 12
months. Select all that apply 7. South Central (Clinton, Eaton, Ingham) Is Selected
Q3.18 Please select ALL of the counties, within the South Central Region, where you checked a car seat
in the past 12 months. NOTE: Count both events and fitting stations.
Clinton (1)
Eaton (2)
Ingham (3)
Unsure (please indicate city/cities, if known) (4) ____________________

95
Answer If Please selected the region(s) in which you did a car seat check in the past 12
months. Select all that apply 8. Southwest (Berrien, Branch, Cass, Calhoun, Kalamazoo, St.
Joseph, Van Buren) Is Selected
Q3.19 Please select ALL of the counties, within the Southwest Region, where you checked a car seat in
the past 12 months. NOTE: Count both events and fitting stations.
Berrien (2)
Branch (1)
Cass (3)
Calhoun (4)
Kalamazoo (5)
St. Joseph (6)
Van Buren (7)
Unsure (please indicate city/cities, if known) (8) ____________________
Answer If Please selected the region(s) in which you did a car seat check in the past 12
months. Select all that apply 9. Southeast (Livingston, Washtenaw, Jackson, Hillsdale, Lenawee,
Monroe) Is Selected
Q3.20 Please select ALL of the counties, within the Southeast Region, where you checked a car seat in
the past 12 months. NOTE: Count both events and fitting stations.
Hillsdale (4)
Jackson (3)
Lenawee (5)
Livingston (1)
Monroe (6)
Washtenaw (2)
Unsure (please indicate city/cities, if known) (8) ____________________
Answer If Please selected the region(s) in which you did a car seat check in the past 12
months. Select all that apply 10. Metro Detroit (Macomb, Oakland, Wayne) Is Selected
Q3.21 Please select ALL of the counties, within the Metro Detroit Region, where you checked a car seat
in the past 12 months. NOTE: Count both events and fitting stations.
Macomb (1)
Oakland (2)
Wayne (3)
Unsure (please indicate city/cities, if known) (4) ____________________

96
Q3.22 Some factors that might affect your choice to work at a car seat check are listed below. For each
item, mark how much each factor applies to YOU.
Not at all (1)
A little (2)
Some (3)
Quite a bit (4)
Very much (5)
Not Applicable (6)
My employer decides what seat checks I can do (1)
My employer decides how much time I spend on seat checks (2)
Time or day of event (3)
Distance to a location (4)
Appointments vs. drop-ins (5)
Free food (6)
Payment or giveaways for doing the checks (7)
Indoors or outdoors (8)
Perceived need for education in a certain area or for a certain population (9)
Q4.1 For the next set of questions, we want to know more about you and your experiences working in
the field of child passenger safety.
Q4.2 People become CPSTs for many different reasons. From the choices below, please
mark each reason that relates to why you became a CPST. If there is a reason that is not on the list, you
can type in your own reason(s) when you check “other”.
Job requirement (1)
Eligibility for overtime pay or special detail (7)
Natural fit/enhancement to my job (2)
Recognized gap in resources in my community (3)
Personal reasons (e.g. keep my own children safe, learn a new skill, help my community, passion for
kids) (4)
Know someone affected by a crash (5)
Other: (please describe your reason for becoming a CPST) (6) ____________________

97
Q4.3 When did you first take the class to become a Certified Child Passenger Safety Technician (CPST)?
1997 (1)
1998 (2)
1999 (3)
2000 (4)
2001 (5)
2002 (6)
2003 (7)
2004 (8)
2005 (9)
2006 (10)
2007 (11)
2008 (12)
2009 (13)
2010 (14)
2011 (15)
2012 (16)
2013 (17)
2014 (18)
2015 (19)
Q4.4 Are you a currently certified Child Passenger Safety Technician or Instructor?
Yes (1)
No (2)
Q4.5 Did you ever have to retake training (either the whole course or the refresher course) because your
certification expired?
Yes (1)
No (2)
I have not needed to recertify yet (3)

98
Answer If Are you a currently certified Child Passenger Safety Technician or Instructor? Yes Is Selected
And Did you ever have to retake training (either the whole course or the refresher course)
because your certification expired? I have not needed to recertify yet Is Not Selected
Q4.6 Please mark why you have maintained your certification. Pick all that apply.
Job requirement (1)
Eligibility for overtime pay or special detail (7)
Natural fit/enhancement to my job (2)
Recognized gap in resources in my community (3)
Personal reasons (examples: keep my own children safe, learn a new skill, help my community,
passion for kids) (4)
I do not plan to re-certify (5)
Other: (please indicate) (6) ____________________
Answer If Are you a currently certified Child Passenger Safety Technician or Instructor? Yes Is Selected
And Did you ever have to retake training (either the whole course or the refresher course)
because your certification expired? I have not needed to recertify yet Is Selected
Q4.7 Do you plan to maintain your certification?
Yes (1)
No (2)
Not sure (3)
Answer If Do you plan to maintain your certification?<o:p></o:p> Yes Is Selected
Q4.8 Please mark why you plan to maintain your certification. Pick all that apply.
Job requirement (1)
Eligibility for overtime pay or special detail (6)
Natural fit/enhancement to my job (2)
Recognized gap in resources in my community (3)
Personal reasons (e.g. keep my own children safe, learn a new skill, help my community, passion for
kids) (4)
Other: (please indicate) (5) ____________________

99
Answer If Did you ever have to retake training (either the whole course or the refresher course)
because your certification expired? I have not needed to recertify yet Is Not Selected
Q4.9 In your most recent re-certification cycle, how did you earn Continuing Education Units
(CEU’s)? Pick all that apply.
I have not received any CEU’s in the past year (1)
KIM (Kidz in Motion) Conference (2)
Lifesavers Conference (3)
Safe Kids Worldwide Conference (8)
Regional, state or local CEU event (9)
Subscriptions and Newsletters (4)
Online (5)
CEU course in-person (6)
Other: (please indicate) (7) ____________________
Q4.10 Many CPSTs in Michigan do not recertify. Indicate the impact each reason below has on their
decision to not recertify.
Not at all (1)
A little (2) Some (3)
Quite a bit (4)
Very much (5)
Re-certification fees are too expensive. (1)
It is too hard to get seat sign offs with an instructor. (12)
It is too far to drive to get seat sign offs with an instructor. (2)
It is hard to earn CEU’s. (4)
It takes more work than expected to recertify. (5)
People lose motivation to stay certified. (6)
The process is confusing. (7)
No longer require for a job. (8)
Getting liability coverage is a problem. (10)
Change in job duties. (21)
Other reason: (please indicate) (9)

100
Q5.1 Please mark if you have taken or would like to take any of the specialized courses listed below.
Have taken (1) Would like to take (2)
CPS on School Buses (1)
Children with Special Healthcare Needs (2)
Safe Transportation of Children in Ambulances (3)
None (4)
Other (5)
Answer If There are specialized classes for CPSTs to learn extra skills. Please indicate if you have taken...
Other - Have taken Is Selected Or There are specialized classes for CPSTs to learn extra skills. Please
indicate if you have taken... Other - Would like to take Is Selected
Q5.2 Please describe the other specialized classes you have taken or would like to take to learn extra
skills.
Q6.1 Do you work with a Safe Kids Coalition?
Yes (1)
No (2)
I don't know (3)
Answer If Do you work with, or are you affiliated with, a Safe Kids Coalition? Yes Is Selected
Q6.2 Which Safe Kids Coalition(s) do you work with? Pick all that apply.
Branch-Hillsdale-St. Joseph Counties (1)
Capital Area (2)
Greater Flint (3)
Greater Grand Rapids (4)
Greater Thumb and Saginaw Area (5)
Huron Valley (6)
Kalamazoo County (7)
Macomb County (8)
Metro Detroit (9)
North Shore (10)
Oakland County (11)
West Michigan (12)
Safe Kids coalition outside of Michigan (14)
I don't know (13)

101
Q6.3 Which best describes your main job?
Fire/Rescue/EMS (1)
Law Enforcement (2)
Child Passenger Safety Technician (3)
Child Passenger Safety Technician-Instructor (15)
Healthcare Practitioner or Technician (e.g. physician, nurse, physical/occupational therapist) (4)
Community and Social Service (e.g. social worker, clergy, health educator, child protective services)
(5)
Education (e.g. teacher, teaching assistant) (6)
Transportation (e.g. traffic safety planning, research, automotive engineer, crash reconstruction) (7)
Stay at home parent/grand parent (8)
Child Care (e.g. child care worker, nanny) (9)
Communications (e.g. writer, public relations, advertising) (10)
Office/Administrative Support (e.g. receptionist, administrative assistant) (11)
Business Operations (e.g. insurance agent/claims, retail, car seat manufacturer rep) (12)
Retired (13)
Other: (please indicate) (14) ____________________
Q6.4 Please enter your HOME zip code:
Q6.5 Please enter your WORK zip code:
Q6.6 What is your age?
18-24 years (1)
25-34 years (2)
35-44 years (3)
45-54 years (4)
55-64 years (5)
older than 65 years (6)
Q6.7 What is your gender identity?
Male (1)
Female (2)
Other (3)

102
Q6.8 Which best describes your race or ethnic background? Pick all that apply.
White (1)
American Indian/Alaskan Native (2)
Black (3)
Native Hawaiian/Pacific Island (4)
Asian (5)
Hispanic/Latino (6)
Other: (please indicate) (7) ____________________
I prefer not to answer (8)
Q6.9 What languages do you know well enough to use to check a car seat? Pick all that apply.
Albanian (12)
American Sign Language (ASL) (1)
Arabic (2)
Chaldean (13)
English (3)
French (4)
German (5)
Hmong (14)
Korean (6)
Polish (7)
Spanish (8)
Tagalog (9)
Vietnamese (10)
Other: (please indicate) (11) ____________________
Q6.10 What is the highest level of school you have finished?
Some high school (1)
High school graduate or GED (2)
Some college (3)
Trade/technical/vocational training (4)
Associate degree (5)
Bachelor's degree (6)
Master's degree (7)
Professional degree (MD, JD) (8)
Doctorate degree (Ph.D) (9)
Answer If What is the highest degree or level of education that you have completed? If you are currently
enrolled in school please indicate the highest degree you have received.<o:p></o:p> Some high school,

103
no diploma Is Not Selected And What is the highest degree or level of education that you have
completed? If you are currently enrolled in school please indicate the highest degree you have
received.<o:p></o:p> High school graduate, diploma or the equivalent Is Not Selected
Q6.11 Please share your area of study. Examples include Paramedic, Early Childhood Development, and
Public Health.
Q6.12 To keep your answers to this survey private, you will be re-directed to a new survey for 3 final
questions.
Michigan CPS Tech Survey.2 – Survey to Develop Contact List for Additional Information
Q1 Thank you so much for taking the time to complete this survey. We greatly appreciate your time and
effort! We have just a few more questions before you finish.
Q2 We are gathering information about the specific location(s) of the car seat events/fitting stations
from the past 12 months. Are you a coordinator who is willing to be contacted by our research team?
Yes (1)
No (2)
Q3 The Michigan Office of Highway Safety Planning (OHSP) has offered to pay for a total of 15
recertification fees among technicians who participate in this survey. Would you like to be entered into
the drawing for a chance to have OHSP pay for your next recertification?
Yes (1)
No, thanks (2)
Q4 IF you selected YES to either of the questions above, please provide your contact information below:
Name (1)
Email (2)
Phone (3)
Q5 Your contact information cannot be linked back to your responses to the survey.
Q6 Thank you so much for taking the time to finish our survey and helping to keep kids safe on the roads
in Michigan! We look forward to connecting with you soon!

104
Appendix C: Full Page Presentation of Maps Included in Report

105

106

107
Figure 4a: Total child population ≤9 years by county
per 2010 U.S. Census

108
Figure 4b: Proportion of county population that was ≤9 years
per 2010 U.S. Census

109
Figure 5a: Proportion of county population that was non-white
per 2010 U.S. Census

110
Figure 5b: Proportion of county population that was Hispanic
per 2010 U.S. Census

111
Figure 5c: Proportion of county population that was non-English speaking
per 2010 U.S. Census

112
Figure 6a: Distribution of poverty by county
based on a scaled poverty factor

113
Figure 6b: Proportion of county adult population with low educational attainment
per 2010 U.S. Census

114
Figure 7: Crashes involving children ≤9 years who were killed or injured, improperly restrained, or sitting in front
per 100,000 average Annual Vehicle Miles Traveled per county, 2010-2014

115
Figure 8a: Distribution of composite risk scores by county
based on Score 1 weighting scheme

116
Figure 8b: Distribution of composite risk scores by county
based on Score 5 weighting scheme

117
Figure 9: Relative risk by county based on Score 5 weighting scheme

118
Figure 10: Relative risk by census tract based on Score 5 weighting scheme

119
Figure 10 Inset for Southwest Michigan Relative risk by census tract
based on Score 5 weighting scheme

120
Figure 10 Inset for Southeast Michigan Relative risk by census tract
based on Score 5 weighting scheme

121
Figure 11a: Child Passenger Safety Technicians (CPSTs) per county in 2014
within OHSP Regions

122
Figure 11b: Child Passenger Safety Technicians (CPSTs) per county in 2014
within Safe Kids Michigan Counties

123
Figure 12: Child Passenger Safety Technicians (CPSTs) per county in 2014

124
Figure 14a: CPST Instructors by county in 2014

125
Figure 14b: CPSTs trained to work with children with special needs
by county in 2014

126
Figure 14c: CPSTs who speak Spanish by county in 2014

127
Figure 15: Distribution of CPST survey respondents in 2015

128
Figure 40: Count of unique locations for car seat checks (Inspection Stations and Events)
by county in 2014

129
Figure 41: Count of car seat check occurrences (where frequency of checks was known)
by county in 2014

130
Figure 43: Number of child restraint systems checked through Safe Kids Michigan 2010-2014
mapped to the county of the participant’s home address

131
Figure 44a: Number of Safe Kids Michigan seat checks 2010-2014 that resulted in a change by county

132
Figure 44b: Proportion of Safe Kids Michigan seat checks 2010-2014 that resulted in a change by county

133
Figure 45a: Number of Safe Kids Michigan seat checks 2010-2014 where a seat was provided by county

134
Figure 45b: Proportion of Safe Kids Michigan seat checks 2010-2014 where a seat was provided by county

135
Figure 47a: Child Restraint Systems distributed by OHSP 2012-2014
by county of agency or CPST that received seats

136
Figure 47b: Child Restraint Systems distributed by OHSP 2012-2014
OHSP Regions outlined

137
Child Restraint Systems Distributed by OHSP 2012-2014
within OHSP Regions
Figure 47b: Child Restraint Systems distributed by OHSP 2012-2014
within Safe Kids Michigan Coalition outlined

138
Figure 48a: Number of children ≤9 years per CPST per county in 2014

139
Figure 48b: Number of children ≤9 years per CPST per county in 2014
OHSP Regions outlined

140
Figure 48c: Number of children ≤9 years per CPST per county in 2014
Safe Kids Michigan Coalitions outlined

141
Figure 49: Estimated median distance traveled in miles from participant home to nearest car seat check location
by county based on 2014 seat check locations

142
Figure 50a: “Spider Maps” Depicting the Output from Location-Allocation Analyses
Purple lines indicate paths from a CPST to a census tract centroid “as the crow flies”
979 CPSTs serving 150 risk-weighted children per service point

143
Figure 50b: “Spider Maps” Depicting the Output from Location-Allocation Analyses
Purple lines indicate paths from a CPST to a census tract centroid “as the crow flies”
979 CPSTs serving 420 risk-weighted children per service point

144
Figure 50c: “Spider Maps” Depicting the Output from Location-Allocation Analyses
Purple lines indicate paths from a CPST to a census tract centroid “as the crow flies”
979 CPSTs serving 1500 risk-weighted children per service point

145
Figure 51: CPST service territories
defined by Thiessen polygons representing equidistant boundaries between CPST locations