characteristics of passenger car crashes in india, and a …€¦ · · 2017-06-24abstract the...
TRANSCRIPT

Abstract The Euro NCAP frontal impact crash tests – Offset Deformable Barrier and Full Width Rigid Barrier
– are being considered for India’s upcoming NCAP program. This paper studies the characteristics of passenger car crashes in India, based on in‐depth crash data collected under the Road Accident Sampling System – India project, and conducts a preliminary assessment of the effectiveness of the Euro NCAP frontal impact tests for Indian conditions. From 839 crashes involving at least one passenger car, a sample of 255 cars involving frontal impacts were identified, and collision partner distribution, passenger compartment intrusion, injury severity and belt usage of occupants were analysed. The collision partner, delta‐V and the width of impact overlap were represented as a matrix, and the percentage of cars covered under the Euro NCAP frontal impact test conditions was determined. The Euro NCAP Offset Deformable Barrier test was found to cover 18% of the sample, while Euro NCAP Full Width Rigid Barrier test covers 2% of the sample. Results also indicate that the incidence of car‐to‐heavy vehicle collisions in India is high, while that of car‐to‐car collisions is low. A high rate of passenger compartment intrusions, coupled with poor seat‐belt usage, results in high injury severity to car occupants.
Keywords Crash tests, Euro NCAP, India, Passenger Car Crashes, Road Accident Sampling System – India
(RASSI)
I. INTRODUCTION
As per the most recently published government statistics of road traffic crashes in India [1], in the year 2015
India witnessed an increase of 2.5% in the occurrence of road traffic crashes, with a resultant increase in
fatalities of 4.6%. The statistics state that a total of 1,46,133 road accident fatalities were reported in the year
2015, and that passenger car occupant fatalities accounted for 17.2% of the total fatalities. Car occupants
constitute the second highest fatal road users, after motorised two‐wheeler riders. As per government data
available in the public domain, passenger cars account for 13.6% of the total vehicle population in India [2].
The Indian government will be making crash tests compulsory for new vehicles under the Bharat New Vehicle
Safety Assessment Program (BNVSAP). Initial information available from industry and government professionals
and publications regarding the BNVSAP program states that all passenger cars are to be tested for frontal
impacts, as specified under Euro NCAP test protocols, from October 2017. Given the present efforts being made
by the Indian government to introduce crash testing requirements for new vehicles through BNVSAP [3], it is
important that crashes involving passenger cars be studied in‐depth so that specifications can be laid down to
evaluate the crashworthiness and safety performance of these vehicles in real world scenarios.
To address the deficit of in‐depth road traffic crash data in India, a consortium of automotive original
equipment manufacturers came together in 2011 to support the development of an in‐depth road accident
database, christened the Road Accident Sampling System – India (RASSI). Accidents that happen on public roads
within a selected study area are considered for RASSI. Cases in which crashed vehicles are not drivable or the
crash resulted in at least minor injury and for which an accident scene is identifiable, through evidence such as
tyre marks, debris or any pool of vehicular or bodily fluids, are studied in‐depth. Nearly 500 variables are coded
for each crash in the RASSI online database. Ramesh et al. [4] detailed the establishment of the accident
investigation methodology. Presently under RASSI, data is collected from five data‐collection centres spread
across the country and covering the different types of roads, including expressways (high‐speed, access‐
R. Rajaraman is Technical Director, M. Patel is Data Analyst and Quality Manager, and J. Padmanaban is President and Founder of JP Research India Pvt. Ltd. (e‐mail: [email protected]; tel: +91‐422‐4500437), headquartered in Coimbatore, Tamil Nadu, India.
Characteristics of passenger car crashes in India, and a preliminary assessment of Euro NCAP frontal impact tests for passenger cars in India
Ravishankar Rajaraman, Muddassar Patel, Jeya Padmanaban
IRC-17-14 IRCOBI Conference 2017
-36-

controlled corridors), national and state highways, rural roads, and city and arterial roads.
The objective of this paper is to determine the characteristics of passenger car crashes in India, based on the
sample of passenger car crashes in the RASSI database, and to conduct a preliminary assessment of the
effectiveness of Euro NCAP frontal crash test protocol for India.
II. METHODS
The RASSI in‐depth crash database is used for analysis. A total of 1,779 crashes have been recorded in the
RASSI database for the period April 2011–March 2016. These 1779 crashes involve all types of motor vehicles,
bicyclists and pedestrians. From these 1,779 crashes, 839 crashes were selected in which a passenger car was
involved in the first event of the crash. These 839 crashes involved 917 cars, and of these 839 crashes, 78
crashes involved a car‐to‐car impact in the first event. For the purpose of this study, “Passenger car” includes all
types of cars, vans, Sport Utility Vehicles (SUVs) and Multi‐Utility Vehicles (MUVs).
Determination of passenger car crash characteristics in India
The 839 crashes were analysed to determine the following.
1. The percentage distribution of collision partners.
2. The percentage distribution of passenger car bodytype.
3. The percentage distribution of impact location on the passenger car using the third character of the
Collision Deformation Classification (CDC) [5].
The above analysis was carried out to determine the collision partners, bodytypes and impact location on the
vehicles in the sample of 839 passenger car crashes.
Determination of a sample of cars with frontal impact similar to Euro NCAP tests
From the 839 passenger car crashes, a sample of cars was selected for further analysis in order to identify passenger car frontal impacts similar to the Euro NCAP frontal crash test specifications. The following criteria were used to select the sample:
collision partner should be either truck, bus, another car or a wide fixed object;
collision partners such as motorised two‐wheelers and narrow objects, such as poles or trees, were excluded for this study;
impact location for the passenger car should be “Front”;
Direction of Force (DOF) for the event should be “12 o’clock”. The 12 o’clock DOF is shown below, which indicates the 150 angle covered on both sides. The DOF is not based on impact location but rather on impact direction.
Fig. 1. Direction of Force 12 o’clock with impact location “Front”.
This selection criteria resulted in a sample of 255 passenger cars with frontal impacts. Determination of passenger car frontal impact characteristics in India
From the sample of 255 passenger cars fulfilling the above criteria, the following analysis was carried out.
1. Percentage distribution of collision partners.
2. Percentage rate of occurrence of passenger compartment intrusion.
3. Seat‐belt usage rate and injury severity by occupant seating position in car.
4. Percentage distribution of Damage Overlap Width.
For each vehicle, Direct Damage Width is measured during the on‐field vehicle examination, and Overall
IRC-17-14 IRCOBI Conference 2017
-37-

Width is taken from vehicle specifications. The Damage Overlap Percentage is calculated as follows:
Damage Overlap Percentage = Direct Damage Width/Overall Width * 100.
Fig. 2. Direct Damage Overlap: this example illustrates the calculation of the Damage Overlap Percentage.
5. Percentage distribution of Damage Overlap Height, based on the fifth character of the CDC [5, 6].
Fig. 3. Damage Height by Collision Deformation Classification, showing the possible values of the fifth character
of CDC.
6. Cumulative frequency distribution of Delta‐V.
Values available for Delta‐V were plotted based on separate collision partners, as a cumulative frequency
distribution. Cumulative frequency is used to determine the number of observations that lie above (or
below) a particular value in a data set. The values of Delta‐V were plotted on X‐axis. The percentage of
the observations covered were plotted on Y‐axis.
Correlation of sample of frontal impact cars with Euro NCAP frontal impact tests
Delta‐V, Damage Overlap Width and collision partner are compared with Euro NCAP frontal impact test
conditions. In order to simplify the correlation with Euro NCAP frontal impact tests, the following assumptions
were made in the analyses of the sample of frontal impact cars:
• Damage Overlap Percentage from 21% to 60% is considered as 40% Overlap;
• Damage Overlap Percentage from 61% to 100% is considered as Full Width Overlap;
• front end of car is assumed to be symmetrical in structure and crashworthiness;
• the Delta‐V has been considered as equivalent to the impact speed against a barrier;
• collision partner car represents deformable barrier;
• collision partner fixed object represents rigid barrier.
III. RESULTS
Passenger car crash characteristics in India
The following are the results of the analysis of the 839 crashes involving a passenger car in the first event.
Percentage distribution of collision partners in 839 crashes
The 839 crashes in which a passenger car was involved in the first event were analysed to determine the
collision partners of passenger cars. Trucks/Buses, motorised two‐wheelers, fixed objects and cars constituted
83% of the passenger car collision partners.
IRC-17-14 IRCOBI Conference 2017
-38-

Fig. 4. Percentage distribution of passenger car collision partners in 839 passenger car crashes.
Percentage distribution of 917 cars by bodytype
The 917 cars involved in the 839 crashes were then analysed to determine their bodytypes. Hatchbacks (44%)
are the most commonly involved bodytype, followed by sedans (25%) and MUVs/SUVs (23%). Vans (8%) are the
least common bodytype.
Fig. 5. Percentage distribution of 917 passenger cars by bodytype.
Percentage distribution of 917 cars by impact location
The impact location was analysed by considering the third character of the CDC [5]. The third character denotes
the General Area of Damage (or direct impact location) for the impact, and 64% of the cars analysed had their
impact location as “F‐Front”.
Fig. 6. Percentage distribution of 917 passenger cars by General Area of Damage – third character of CDC.
Passenger car frontal impact crash characteristics in India
The following are the results of the analysis of the sample of 255 cars with frontal impacts similar to the Euro
NCAP test.
Percentage distribution of collision partners for the sample of 255 cars with frontal impacts
The collision partner was analysed for the sample of 255 cars. For more than half of the crashes (51%), the
collision partner was a heavy vehicle, i.e. truck or bus.
IRC-17-14 IRCOBI Conference 2017
-39-

Fig. 7. Percentage distribution of collision partner for the sample of 255 cars.
Percentage rate of occurrence of passenger compartment intrusion by bodytype
For 255 cars, the rate of occurrence of intrusion was analysed by bodytype. Vans had the highest rate of
occurrence of intrusion at 96%, followed by sedans at 69%, Hatchbacks at 61% and MUV/SUV at 59%. The rate
of occurrence of intrusion was found to be 66% for all 255 cars.
Fig. 8. Percentage rate of occurrence of passenger compartment intrusion by Bodytype.
Percentage rate of occurrence of passenger compartment intrusion by collision partner
When the rate of occurrence of intrusion was determined for different collision partner types, it was found that
when a car impacted a Truck/Bus, 79% of such collisions resulted in passenger compartment intrusion in the
impacting car, followed by 66% in the case of fixed object impacts, and 39% in the case of car impacts.
Fig. 9. Percentage rate of occurrence of passenger compartment intrusion by collision partners.
Seat‐belt usage rate by seating position in car
The 255 cars had a total of 738 occupants. Due to overloading of occupants, that is, the condition where the
IRC-17-14 IRCOBI Conference 2017
-40-

number of occupants in a passenger car is greater than the seating capacity of that car, 19 occupants were
found to be seated extra. Hence, the actual number of occupants with a designated seating position is 719.
Seat‐belt usage was determined for all 719 seats, which included driver seat, front passenger seat and other
row seats. All second row, third row and fourth row seats were considered as other row seats. Seat‐belt usage
was found to be very low. Only 29% of drivers and 14% of front passenger seat occupants were belted, while for
rear‐seat occupants, belt usage was found to be 0%.
TABLE I BELT USAGE RATE FOR DIFFERENT SEATING POSITIONS
Seating Position Belted Occupants Not Belted Occupants
Driver Seat (N=255) 29% 71%
Front Passenger Seat (N=184) 14% 86%
Other Passenger Seat (N=280) 0% 100%
Injury severity of car occupants
In total, there were 738 occupants in 255 cars. The injury severity for all 738 occupants was analysed and it was
found that 59% of total occupants suffered either fatal or serious injuries.
Fig. 10. Percentage distribution of 738 occupants by injury severity.
Percentage distribution of 255 cars by Damage Overlap Width
For the 255 cars with frontal impact, the Damage Overlap Percentage was determined and used to correlate
overlap with Euro NCAP test protocols. The following formula was used:
Damage Overlap Percentage = Direct Damage Width/Overall Width * 100
TABLE II DAMAGE OVERLAP FOR DIFFERENT COLLISION PARTNERS
Collision Partner < 21% 21%–60% > 60%
All Collision Partners (255) 9% 52% 39%
Collision Partner – Car (67) 6% 60% 34%
Collision Partner – Truck/Bus (130) 4% 48% 48%
Collision Partner – Objects (58) 22% 54% 24%
Analysis of the distribution of the Overlap Width for the 255 cars in the sample found that 52% of the cars in
the sample had a Damage Overlap Percentage between 21% and 60% of total width, while for 39% of the
sample that percentage was greater than 60% of total width. Damage Overlap Percentage was also analysed
based on collision partner. Where a car was the collision partner, 60% of the sample had a Damage Overlap
IRC-17-14 IRCOBI Conference 2017
-41-
Percentage between 21% and 60% of total width, while 34% of the sample had a Damage Overlap Percentage
that was more than 60% of total width.
Percentage distribution of 255 cars by Damage Overlap Height
The impact height was analysed for all 255 cars, using the fifth character of CDC [5]. The fifth character of CDC
indicates damage height in the impact.
TABLE III DAMAGE OVERLAP HEIGHT FOR DIFFERENT COLLISION PARTNERS
Vertical Impact Height All Cars
(N=255)
Collision partner‐
Truck/Bus (N=130)
Collision partner‐
Car (N=67)
Collision partner‐
Object (N=58)
A‐All 42% 72% 12% 7%
E‐Below Beltline 53% 20% 85% 91%
H‐Top of Frame to top of Vehicle 2% 5% 0% 0%
L‐Frame 1% 0% 1.5% 2%
M‐Top of frame to Beltline 2% 3% 1.5% 0%
Vertical height distribution A‐All accounts for 72% of total impacts with Truck/Bus, which is mainly due to
Underride condition and also explains the high rate of occurrence of intrusion in cases of impacts with
Truck/Bus. For car‐to‐car impact and object impact, vertical height distribution, E‐Below Beltline, is more
prominent than other overlap heights.
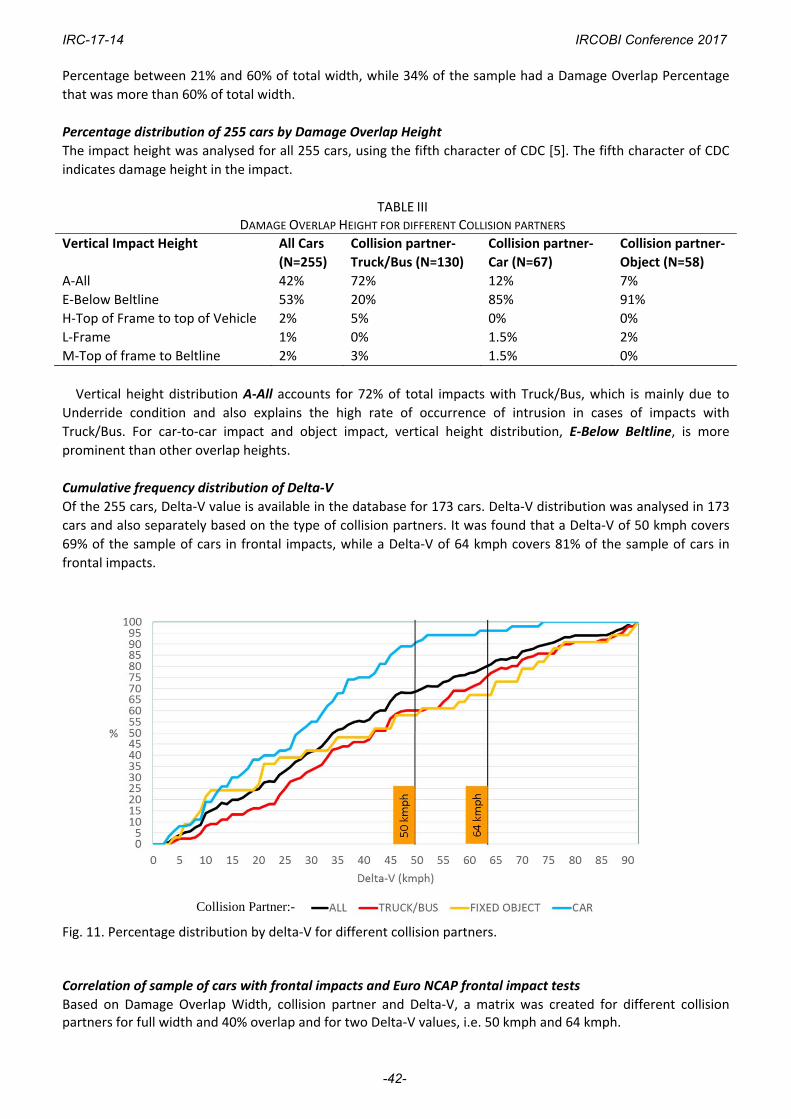
Cumulative frequency distribution of Delta‐V
Of the 255 cars, Delta‐V value is available in the database for 173 cars. Delta‐V distribution was analysed in 173
cars and also separately based on the type of collision partners. It was found that a Delta‐V of 50 kmph covers
69% of the sample of cars in frontal impacts, while a Delta‐V of 64 kmph covers 81% of the sample of cars in
frontal impacts.
Fig. 11. Percentage distribution by delta‐V for different collision partners. Correlation of sample of cars with frontal impacts and Euro NCAP frontal impact tests
Based on Damage Overlap Width, collision partner and Delta‐V, a matrix was created for different collision partners for full width and 40% overlap and for two Delta‐V values, i.e. 50 kmph and 64 kmph.
Collision Partner:-
IRC-17-14 IRCOBI Conference 2017
-42-

TABLE IV MATRIX OF DAMAGE OVERLAP WIDTH AND DELTA‐V. PERCENTAGE CALCULATED FROM SAMPLE OF 173 CARS
Correlating the Delta‐V and Overlap Width Percentage with Euro NCAP frontal tests, 18% of the sample of 173
cars represent frontal impact with Offset Deformable Barrier (ODB) at 64 kmph, while 2% represent frontal
impact with Full Width Rigid Barrier at 50 kmph.
IV. DISCUSSION
Frontal impacts constitute nearly two‐thirds of total passenger car impacts, therefore a frontal impact test is recommended for India. But while high income countries in North America and Europe have a significantly high percentage of car‐to‐car collisions, in India they constitute a smaller percentage of total collisions. The probability of a car impacting a truck/bus, a motorised two‐wheeler or a fixed object is far greater in India than the probability of a car impacting another car. More than half of total car occupants involved in a frontal impact received fatal or serious injuries. This can be attributed to the high rate of occurrence of passenger compartment intrusion (66%) and low seat‐belt usage rates (24% for driver, 14% for front passenger and 0% for rear‐seat passengers). This means that even if passenger compartment intrusions are controlled, the lack of seat‐belt usage will still result in fatal or serious occupant injuries.
From 917 passenger cars involved in the 839 crashes, 255 passenger cars (28%) could be identified with frontal impacts similar to a Euro NCAP crash test. From this sample of 255 cars, Delta‐V values were available for 173 cars. Analysis of the 173 passenger cars with frontal impacts showed that Euro NCAP frontal impact tests represent 20% of the sample. A frontal impact with ODB at 64 kmph represents 18% of the sample, while a Full Width Rigid Barrier impact at 50 kmph represents only 2% of the sample. It is also interesting to note that 90% of the car‐to‐car collisions have a Delta‐V less than 50 kmph. Whereas for car‐to‐truck/bus collisions, 75% of the sample is covered by a Delta‐V of 64 kmph. A major concern that arises out of this study is the occurrence of underride crashes of cars with trucks and
buses. Frontal impacts, full width as well as 40% offset, with trucks and buses at an impact speed of 64 kmph
are found to represent 37% of the sample of frontal impact cars. Such crashes have a tremendous influence on
passenger car intrusions and injury outcomes. At present, this impact condition is not satisfied by the current
Euro NCAP frontal impacts. In order to improve passenger car safety in India, it is essential to have tests that will
represent such underride crashes with heavy vehicles. Such tests may be used for engineering design evaluation
of the compatibility of collision partners – cars as well as trucks and buses.
One of the limitations of this study would be representativeness of the sample. Determination of
representativeness is a challenging activity in India, considering that it requires a more detailed and reliable
database of all road accidents in India to be made available. Efforts are on in this direction, but unfortunately,
there are many hurdles as the agencies collecting and providing national crash data do not code variables such
as crash configuration, single‐ or multiple‐vehicle crashes, details of vehicle body types involved, road type, etc.
in their database. While the RASSI database cannot be considered as a representative sample, it is currently the
only in‐depth crash database in India available for detailed accident analysis.
Collision Partner Overlap Width 50 kmph 64 kmph
Car Full width 16 (9%) 18 (10%)
40% Overlap 30 (17%) 31 (18%)
Fixed Object Full width 3 (2%) 5 (3%)
40% Overlap 10 (6%) 10 (6%)
Truck/Bus Full Width 21 (12%) 28 (16%)
40% Overlap 28 (16%) 36 (21%)
IRC-17-14 IRCOBI Conference 2017
-43-

V. CONCLUSIONS
Passenger cars in India experience a significant level of passenger compartment intrusion as a result of frontal impacts, and this trend must be checked. Based on the above analysis, a preliminary assessment of Euro NCAP frontal impact tests with real world passenger car crashes in India indicates that the Offset Deformable Barrier (ODB) test has a higher significance to regulate passenger compartment intrusions in car‐to‐car collisions, compared to the Full Width Rigid Barrier test. As a significant number of crashes in the sample occur due to car‐to‐truck/bus collisions that result in
underride crashes with severe passenger compartment intrusions and occupant injuries, a test must be formulated to reduce the severity of underride crashes. Finally, it is important to remember that occupant restraints, such as seat belts and airbags, will be effective
only if the occupants use them. Since the rate of usage of seat belts is very low in India, it is important to educate and enforce the usage of seat belts, particularly in the rear seats, otherwise the effectiveness of these crash tests in reducing passenger car occupant injuries will not be realised in the real world.
VI. ACKNOWLEDGEMENTS
The authors gratefully acknowledge the support of the RASSI consortium members: Robert Bosch GmbH, Nissan Motor Company, Daimler AG, Toyota, Renault SAS, Hyundai KIA Motors, Honda, Autoliv, Maruti Suzuki and JP Research, Inc.
VII. REFERENCES
[1] Transport Research Wing (Ministry of Road Transport and Highways, Government of India) Road Accidents in India – 2015. (2016) Government of India, pp.2–3.
[2] Road Transport Year Book. Internet: [http://morth.nic.in/showfile.asp?lid=2495] [accessed 30 March 2017] [3] Safety Standards for Cars. Internet: [http://pib.nic.in/newsite/PrintRelease.aspx?relid=138011] [accessed 30
March 2017]. [4] Rameshkrishnan, N., et al. (2013) The New In‐Depth, At‐Scene, Accident Investigation Database in India.
Proceedings of IRCOBI Conference, 2013, Gothenburg, Sweden. [5] Collision Deformation Classification, SAE J224, March 1990.
[6] E. J. Allen & Associates. Internet: [www.ejallen.co.uk/app/download/5783419934/CDC.pdf] [accessed 30 March 2017].
IRC-17-14 IRCOBI Conference 2017
-44-