child deaths: causes and epidemiological dimensions robert e. black, m.d., m.p.h. johns hopkins...
TRANSCRIPT

Child deaths: Causes and epidemiological dimensions
Robert E. Black, M.D., M.P.H.Johns Hopkins Bloomberg School of
Public Health

10.5 milllion annual child deaths
Where are they?
How much progress is there?
What are the causes?

UNICEF/WHO methods for estimating the child mortality envelope
Age-specific mortality rates
Under-5 and adult mortality rates
Complete vital registration
Sample registration system
DHS, MICS and other surveys Life tables
Country-level all-cause mortality envelope
by age and sex
Incomplete vital registration
Censuses
UN estimatesUN population
estimates

Child mortality trends in Egypt
Source: UNICEFSource: UNICEF
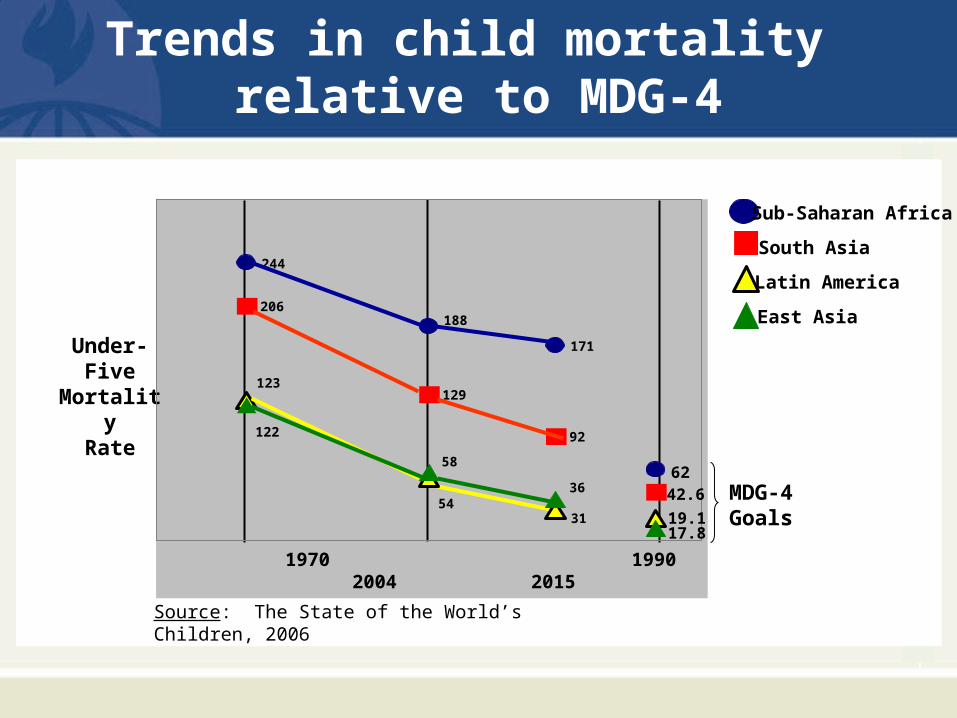
Trends in child mortality relative to MDG-4
Sub-Saharan Africa
South Asia
Latin America
East Asia
Under-Five
MortalityRate
244
188
171
62
206
129
92
42.6
122
5431
17.8
123
58
36
19.1
1970 1990 2004 2015
MDG-4Goals
Source: The State of the World’s Children, 2006

Average annual rate of reduction
UNICEF
Region
1970-1990
%
Current
1990-2004
%
Needed to Achieve MDG4
2005-2015
%
L. America/ Caribbean
4.1 4.0 1.2
E. Asia 3.7 3.4 1.5
Mid-East/ N. Africa
4.4 2.6 2.7
S. Asia 2.3 2.4 4.5
Sub Saharan Africa
1.3 0.7 9.9
Current and needed annual rate of reduction in child mortality
to achieve MDG-4
SourceSource: The State of the World’s Children, 2006: The State of the World’s Children, 2006

Where do we need to focus to achieve MDG-4?
Achievement of MDG-4 will depend on accelerating
interventions in South Asia and sub-Saharan Africa.

Trends in childhood mortality in Bangladesh
0
20
40
60
80
100
120
140
1989-93 1992-6 1995-9 2000-4
Under-5 mortalityNeonatal mortality

Relation between U5MR and percentage of deaths in neonates
SourceSource: Black et al., Lancet 2003: Black et al., Lancet 2003

Age group focus
Currently nearly 4 million neonatal deaths
Achievement of MDG-4 will depend on success with neonatal interventions

WHO methods for estimating cause-specific child mortality
Country-level all-cause mortality envelope
by age and sex
Cause-specific mortality patterns
Independent studies/reports/models,
e.g.,CHERG
WHO program estimates
UNAIDS estimates
Global and regional level age, sex and cause specific
mortality estimates
Country level age-, sex- and cause-
specific mortality estimates

Causes of under-five child mortality
Source: Bryce J. et al., Lancet, 2005

Causes of Under 5 Mortality by WHO Region
Source: Bryce J. et al., Lancet, 2005

New evidence on causes of death
Advances in building the evidence base on causes of child deaths must be incorporated into policies and programs:
• Five causes (pneumonia/sepsis, diarrhea, malaria, preterm birth, and birth asphyxia) account for 73% of all under-five deaths.
• Role of undernutrition must also be considered.

Relative Risk (RR) of death by cause due to underweight, estimated from
random effects models
0
2
4
6
8
10
12
14
-3.5 -2.5 -1.5
Average weight-for-age z-score
Diarrhea
Pneumonia
Malaria
Measles
OverallRR
Source: Caulfield L, et al., Am J Clin Nutr, 2004

Prevalence of underweight in children 0 - 4 years old, by WHO region
Source: de Onis and Blossner, Int J Epi, 2001
2 - 1111 - 2020 - 2828 - 3737 - 46
Prevalence (%)

Major causes of death in neonates and children aged 28 days to 5 years
(yearly average for 2000-03)Deaths among children
aged 28 days to five years ( 6.6 million/year)
Neonatal deaths ( 4 million/year)
Preterm
Congenital
Asphyxia
Other
Diarrhoea
Tetanus
Pneumonia/ sepsis
The % of deaths due to maternal and neonatal undernutrition is under study
Diarrhoea
Measles
HIV/AIDS
Other non-communicable
Injuries
Pneumonia
Other infectious
Malaria
52%
61%
57%
UnderStudy
UnderStudy
45%
The % of deaths from this infection that are due to the presence of undernutrition

Global distribution of disease burden attributable to 20 selected risk factors
0.0% 1.0% 2.0% 3.0% 4.0% 5.0% 6.0% 7.0% 8.0% 9.0% 10.0%
Underweight Underweight Unsafe sex
High blood pressure
Tobacco
Alcohol
Unsafe water, sanitation & hygiene
High cholesterol
Indoor smoke from solid fuels
Iron deficiency
High BMI
Zinc deficiencyZinc deficiency Low fruit and vegetable intake
Vitamin A deficiencyVitamin A deficiency Physical inactivity
Occupational injury
Lead exposure
Illicit drugs Unsafe health care injections
Lack of contraception
Childhood sexual abuse
Attributable DALY (% of global DALY - Total 1.46 billion)
High-mortality developing
Lower-mortality developing
Developed
Source: Ezzati M et al., Lancet 2002

Implications for child survival
1. Focused acceleration of child survival interventions is critical now to achieve MDG-4
• South Asia and sub-Saharan Africa
• Neonatal deaths, nearly 40% and more important as child mortality declines

2. Evidence on causes of child deaths must be incorporated into policies and programs: Five causes in particular must be addressed
- Pneumonia/sepsis, including in neonates- Diarrhea- Malaria- Preterm birth- Birth asphyxia
Implications for child survival

3. Undernutrition is an underlying cause in half of deaths from diarrhea, pneumonia, malaria and measles. Interventions to improve nutrition can have a large
effect because of reduced fatality from several major infectious causes.
The role of undernutrition in cause-specific deaths in the neonatal period needs further study.
Implications for child survival

Conclusion
Knowledge of the causes of child
deaths, especially at the country level, can lead to rational choices of interventions and delivery strategies to have the greatest impact on child mortality.