cheyney university of pennsylvania - … mission established in 1837, cheyney university of...
TRANSCRIPT

P E N N S Y L V A N I A ’ S S T A T E S Y S T E M O F H I G H E R E D U C A T I O N
CHEYNEY UNIVERSITY of PENNSYLVANIA
2016-2017 Action Plan

Action Plan Preface
Looking to the future while understanding where we are today
The System’s Strategic Plan 2020: Rising to the Challenge calls for the development of detailed annual actions plans for each university for transparency and to document progress toward system and university strategic goals. By their very nature, strategic plans look to change over a period of years; in contrast, action plans are designed to look at annual changes in the university and its context. Action plans chronicle where a university has been (previous year), where it is (current year) and where it is going (in the next two years). The format for annual action plans calls for universities to detail—in the context of university mission, vision and strategic directions—distinctive programs and accomplishments, opportunities and challenges, trends in enrollment, student success, and financial management. Looking at action plans annually is important because proposed directions in academic program development, enrollments, and finances are often shaped and re-shaped by critical changes and emerging conditions in student markets, educational interests, and regional economies. As such, they highlight the important balance between thoughtful longer-term planning and the flexibility needed to respond to changing dynamics. Aligning institutional results and reports To present a clear picture of the university, where it has been, and where it is going, it is essential that it is aligned with existing data reports, financial information, performance funding, and annual reporting on progress towards strategic goals. Over time, it is anticipated that episodic university reports be minimized and that more of them will be incorporated and summarized within the context of action plans to provide a more thorough understanding of university efforts to meet their mission and that of the State System.

Action Plan 2016-2017
Table of Contents
Preface
Strategy
University Mission, Vision, and Statement of Strategy 1
Academic Programs of Distinction 4
Other Areas of Distinction 5
Strategic Goals 6
University Strengths, Opportunities and Challenges 8
Key Performance Indicators
Strategic Enrollment Management 9
Performance Funding Indicators 10
Academic Programs 11
Financial Information 14

CHEYNEY UNIVERSITY OF PENNSYLVANIA 2016/2017 ACTION PLAN
University Mission, Vision, and Statement of Strategy
University Mission - Please provide a description of your university's purpose and primary objectives for success.
Our Mission
Established in 1837, Cheyney University of Pennsylvania cherishes its legacy as America's oldest historically black institution of higher education. Our mission is to prepare confident, competent, reflective, visionary leaders and responsible citizens. We uphold our tradition of academic excellence as we maintain our historical commitment to opportunity and access for students of diverse backgrounds. Cheyney University provides a nurturing, intellectually challenging and socially enriching environment.
Page 1

CHEYNEY UNIVERSITY OF PENNSYLVANIA
2016/2017 ACTION PLAN
University Mission, Vision, and Statement of Strategy (Continued)
University Vision - Please provide a description of your university's goals and aspirations for the years ahead.
Our Vision
Cheyney University will be recognized as a premier Historically Black College or University (HBCU) for the 21st century, whose graduates are respected members of their communities throughout the Commonwealth of Pennsylvania, nation and the world. Cheyney University graduates will be a diverse group of local, national, and international students, who will apply the knowledge and skills gained from our rigorous and challenging academic programs to the advancement of the nation and global community. We will continue to be a valuable resource contributing to the intellectual, social, economic, and cultural development of the Greater Philadelphia region, the Delaware Valley, and beyond.
Page 2
CHEYNEY UNIVERSITY OF PENNSYLVANIA
2016/2017 ACTION PLAN
University Mission, Vision, and Statement of Strategy (Continued)
Statement of Strategy - Please provide a description of the strategy for fulfilling your university's vision and mission, given your university's current strengths, challenges, and available resources.
Our Strategy Cheyney University will achieve its vision and mission through a number of strategies aligned to support the strategic goals of the institution.
Cheyney University is the oldest HBCU in the nation. As such, the University’s primary market continues to be African Americans and other underrepresented minorities. The University will continue to increase its efforts to attract students of all races, while enhancing its position as a leading producer of African American graduates. This will require innovative recruitment strategies that are in alignment with academic program offerings designed to attract high-quality students as well as enhanced processes to increase admissions-to-enrollment yield rates. A sharpened focus on retention and student progression is a necessity to increase graduation rates and employment outcomes. The University also seeks to enhance its customer services and its business operations to promote efficiency and compliance with all internal and external regulatory requirements. Although the University has realized some efficiencies, additional cost cutting and collaboration will be necessary to enable implementation of significant and substantial change at Cheyney University. In order to create transformational change, additional funds are essential. To help support these initiatives, the University will do its share in raising external funds.
Page 3
CHEYNEY UNIVERSITY OF PENNSYLVANIA
2016/2017 ACTION PLAN
Academic Programs of Distinction
Academic Programs of Distinction - Please identify your university's top 3 or 4 Program Areas of Distinction (An Academic Program of Distinction is defined as a two-digit CIP level which includes general groups of related programs such as Business and Education. You may also use related areas that cross CIP codes such as Visual and Performing Arts or Allied Health Professions. STEM as a Program of Distinction is too broad but Technology and Engineering or Engineering and Math would be a suitable Program of Distinction.) Please provide a brief rationale or narrative as to what makes these programs distinctive.
Social & Behavioral Sciences Undergraduate academic majors in Social Relations, Political Science, Psychology, and Public Administration within the construct of social and behavioral sciences is a hallmark for Cheyney University. A leading producer of Bachelors’ degrees for the University, the Social Relations Program (concentrations in Criminal Justice and Sociology), provides students with a broad liberal arts background to prepare students for graduate training in a number of different areas and forms a strong base for students to pursue careers in law, law enforcement, justice administration, and other social science related professions. The Masters in Public Administration, offered solely at the State System @ Center City, Philadelphia, provides access to an applied professional program to those who live and/or work in the greater Philadelphia region. This program aligns well with government and non-profit, which are among the largest employer sectors in Philadelphia. Business Undergraduate programs in Business Administration as well as Hotel, Restaurant, and Tourism Management (HRTM) provide opportunities for development of the student as a professional leader. The HRTM program is accredited by the Accreditation Commission for Programs in Hospitality Administration. In the 2014/2015 academic year, 20 HRTM students attended a national professional HRTM conference and were offered jobs or paid internships for the past two years. Cheyney University’s department chair Dr. Ivan Turnipseed, is the president-elect of the National Association of Minorities in Hotel, Restaurant, and Tourism Management. Both undergraduate programs are offered on the main campus as well as at the State System @ Center City, Philadelphia. Biological Sciences The undergraduate majors in Biology and Marine Biology are centerpieces in the new state-of-the-art Science Center which houses chemistry, biology, physics, and computer laboratories. The Science Center will enable Cheyney University to prepare more students in the STEM disciplines. The Marine Biology program is unique to the System and includes an option for students to study Aquaculture. Students have competed and earned research experiences at the Institute for Marine and Environmental Technology in Baltimore, MD, and at Scripps Institution of Oceanography in San Diego, CA, among others. Biology and Marine Biology majors have the opportunity to study in Wallops Island, VA (Chincoteague Bay Field Station), and the University has the opportunity to offer courses there. Education Undergraduate and graduate programs in Early Childhood Education and Early Childhood/Special Education are long-standing areas of strength in preparing teachers and educational leaders to serve in rural and urban schools. Additional graduate areas of study include Educational Leadership.
Page 4

CHEYNEY UNIVERSITY OF PENNSYLVANIA
2016/2017 ACTION PLAN
Other Areas of Distinction
Other Areas of Distinction - Please describe your university's admirable characteristics and accomplishments, including services, programs, student success and community engagement.
Keystone Honors Academy (KHA) The Keystone Honors Program at Cheyney University is a dynamic educational initiative for academically talented students providing a plethora of academic, social, and personal support services to its members. The goals of the program are consistent with the University’s mission and support the University’s strategic goals to Strengthen Academic Quality and Excellence and to Advance Student Achievement and Success. The honors program provides the necessary support to students to maximize their potential to persist and graduate from Cheyney University and does so with a holistic approach to student development. The coveted Keystone Scholarship provides tuition, room, board and fees, laptop computers, and participation in the offerings of the Academy for a limited number of students. This comprehensive approach to providing support services to our most academically talented students has shown to be particularly effective, having a direct impact on strong graduation rates and student placement in graduate programs and in professional employment. KHA participants have an 82% persistence rate and graduate at a rate that is twice that of the national average for African Americans. There are more than 500 alumni of the Keystone Honors Academy, and they are employed in the public and private sectors, spanning the fields of medicine and health, business, law, education, and public administration. Entrepreneurial Leadership Center (ELC) The ELC at Cheyney University was started in 2008 with a funded proposal submitted by the Executive Director of Economic and Workforce Development in conjunction with West Chester University. The initial award from System funds was for three years and the amount awarded to Cheyney University was $85,619. The initial scope of the ELC at Cheyney University was to provide support to small businesses located in Pennsylvania in an effort to enhance the viability of those companies. In so doing, it was the intent to contribute to the growth of these companies in support of job creation and added revenues for the state of Pennsylvania. Further, the project hoped to encourage students to become interested in entrepreneurship and to consider entrepreneurship as a career option. In 2010, new funding expanded the ELC to include a full time coordinator, student interns, and an Entrepreneurial Lectures Series. With the expanded program, the Cheyney University Business Plan Competition was launched. Additionally, Cheyney University students were supported in their participation in the State System Business Plan Competition.
Page 5
CHEYNEY UNIVERSITY OF PENNSYLVANIA
2016/2017 ACTION PLAN
Strategic Goals University Strategic Goals – Please describe the initiatives/strategies that will drive improvement towards university goals. Please include how your university goals align to the System strategic goals below. 1. Ensuring academic program excellence and relevance. 2. Enabling more students to obtain credentials that prepare them for life, career, and the responsibilities of citizenship. 3. Developing new funding strategies, diversifying resources and managing costs to preserve affordability. Initiatives and
strategies should address mitigation of financial risk. 4. Increasing accountability and transparency, focusing on results and key performance indicators.
University Goals
1. Strengthen Academic Quality and Excellence (PASSHE Goal 1. 1, 1.3, 1.4) • Create an academic master plan to ensure an academic program array that builds on program quality
and current and emerging market demands. • Review existing academic degree programs and general education program on productivity, course
offerings, faculty resources, and market need. • Eliminate under-enrolled programs through program consolidation and closure. • Identify and enter additional affiliations such as the recent agreement with LaSalle University, which
provides Cheyney University business students the opportunity to be accepted into the MBA Programs at LaSalle University.
• Identify areas of collaboration with West Chester University where program offerings can be complementary.
2. Advance Student Achievement and Success (PASSHE Goals 2.1-2.4, 3.1, 3.2) • Create a strategic enrollment master plan to build enrollment management capacity.
o Include the brand awareness of Cheyney University, a marketing plan for Cheyney University that clearly articulates its value proposition, a recruitment plan for academically qualified students, and a retention plan to ensure student success.
o Repair the University’s area of access and success, from application process to student graduation.
o Reconsider the University’s admissions policies to minimize the number of students conditionally admitted to the University, and to increase the academic preparation of students admitted into the University. Adhere to admissions policies consistently.
o Develop a process for the seamless transition for transfer students. o Create a learner-focused environment that contributes to student success. o Create an effective advisement model for students in undeclared and declared majors. o Create retention strategies such as the availability of tutoring/support in foundation and
gateway courses, and an early alert system to identify students at risk. Provide additional support to third and fourth year students.
• Expand Keystone Honors Academy enrollment as a strategy to rebrand Cheyney University around its academic quality.
• Review the scope of work, staffing and services provided by the “University College”, the University’s comprehensive retention services program.
• Prioritize fundraising for student scholarships. o Implement a tiered scholarship program for students who perform “with merit”.
Page 6
CHEYNEY UNIVERSITY OF PENNSYLVANIA
2016/2017 ACTION PLAN
Strategic Goals (Continued)
University Goals (Continued)
3. Manage and secure fiscal resources and facilities needed to enhance institutional effectiveness
(PASSHE Goals 3.3, 3.4, 4) • Identify necessary administrative and programmatic reductions.
o Refine the budget process to ensure the budget is developed in concert with planning. Evaluate low performing units/personnel, establish priorities based on strategic initiatives, and re-direct resources. This process must include the Budget and Priorities Committee and involve input from several divisions. Workforce planning has not involved input from all divisions, causing a breakdown in several key operational areas for the university. o Evaluate work-force requirements in all financial, administrative and facilities areas; increase the utilization of university facilities.
• Increase restricted grants and gifts though private giving; utilize funds efficiently and in line with university planning.
o Review the outcomes of the Advancement division; refer to the subcommittee report for several recommendations related to performance outcomes and accountability. o Develop a plan for the division to include a comprehensive fundraising plan. o Improve alumni tracking and expand cultivation efforts. o Ensure sponsored research is proactive in identifying grant opportunities that support strategic goals of the University. o Review the Title III Grant to ensure alignment with the University’s strategic direction.
• Analyze each business function to determine the most effective delivery method (outsourced, in-sourced to another System university). Examples for review are:
o Student Health Services. o Housing and Dining Hall Services. o Fiscal Management Operations. o General Administration and Logistical Services – Human Resources, Payroll, Purchasing, Police, Safety, etc. o Operations and Maintenance of Plant.
• Evaluate the athletic program for viability, stability and integrity. o Reconsider the university’s current status as a Division II program. o Ensure compliance with Division II NCAA regulations. o Conduct a cost/benefit analysis of each sport.
4. Nurture Human Capital (PASSHE Goal 1)
• Review services provided in the area of human resources and the delivery of professional development opportunities to align customer service and service delivery with the mission of the university (including a nurturing learning environment, an environment focused on student success and development, and civility). • Realign the delivery of career services and professional development to maximize the professional success of the students, faculty, and staff at Cheyney University.
5. Cultivate Public Engagement and Citizenship (PASSHE Goals 1.1, 1.3, 2.1-2.4) • Establish a clearly defined recruitment and marketing plan.
o Improve the Cheyney University image/brand and enhance the University website.
6. Deploy appropriate technology to enhance teaching and learning, improve support services and business processes. (PASSHE Goal 3)
• Continue to outsource student financial aid (Financial Aid Services – FAS), the reinstallation of PowerCampus enterprise software (Ellucian), and explore solutions external to Cheyney with the capacity for effective administrative and support services. • Explore other areas of outsourcing (or insourcing to System universities) to improve technical capabilities.
Page 7

CHEYNEY UNIVERSITY OF PENNSYLVANIA
2016/2017 ACTION PLAN
University Strengths, Opportunities, and Challenges
(Anticipated within the next 3 years)
In addition to identifying university strengths, please identify specific opportunities and challenges that the university will be addressing (currently or within the next 3 years), including financial conditions, enrollment trends, community/regional engagement, and student experiences and outcomes. Core Capabilities
Opportunities
Challenges
• Cheyney University’s historic ties to Philadelphia and the region in producing graduates for roles in education, public and social services, business, and the sciences holds potential for expanding enrollments and building academic programs at the University and Center City.
• Recent facilities investment (new science building and residence hall) along with restoration of Cheyney’s
historic quadrangle provide not only an attractive campus, but facilities to meet current and emerging academic programs and services.
• As the nation’s oldest historically black university, Cheyney University has the opportunity once again to be a
leader in defining the sustainable future for HBCUs in the 21st century. True to its historic founding, its future in providing educational opportunities to diverse populations will enable the University to continue to play an important role in American higher education.
• Ensure academic program offerings meet current and future student and employer demands.
• Enhance retention and graduation rates and grow enrollment.
• Enhance student experience.
• Improve University relations with all constituencies.
• Create fiscal and operational sustainability through collaboration with other universities.
• The University is facing a growing operational deficit caused by a decline in enrollment and the loss of state appropriated dollars. Although the University reduced its workforce and cut its discretional spending, it continues to operate with a growing financial deficit.
• Repayment of the lines of credit extended by the Board of Governors which could reach $13 million.
• Repayment of funds due to the U.S. Department of Education as a result of the financial aid reconciliation.
• Enrollment of qualified students.
Page 8

CHEYNEY UNIVERSITY OF PENNSYLVANIA 2016/2017 ACTION PLAN
Strategic Enrollment Management
Fall 2012Actual
Fall 2013Actual
Fall 2014Actual
Fall 2015Actual
Fall 2016Projected
Fall 2017Projected
Fall 2018Projected
Undergraduate Headcount Enrollment - Associate and Bachelor's Degree SeekingNew Freshmen 26.1% 29.4% 23.2% 14.7% 25.6% 38.4% 25.0%New Transfers 8.3% 5.3% 6.0% 7.1% 7.6% 5.3% 9.0%Veterans 11.7% 12.1% 14.2% 0.3% 1.8% 2.0% 4.0%Adult Learners 12.3% 10.9% 11.4% 12.5% 12.4% 12.0% 15.0%Total Undergraduate Enrollment 1,210 1,178 997 686 708 938 1,116
Graduate Headcount EnrollmentMaster's 60 33 25 24 37 35 40Research Doctorate N/A N/A N/A N/A N/A N/A N/AProfessional Doctorate N/A N/A N/A N/A N/A N/A N/ATotal Graduate Enrollment 60 33 25 24 37 35 40
Certificates and Nondegree Students14 1 N/A 1 1 2 4
Headcount Enrollment by Method of InstructionDistance Education (100% Distance Education) 3 3 0 4 0 0Traditional (On Campus) 1,122 1,068 N/A 455 704 837Off Campus 70 48 N/A 39 234 279
Fall 2012Actual
Fall 2013Actual
Fall 2014Actual
Fall 2015Actual
Fall 2016Projected
Fall 2017Projected
Fall 2018Projected
Persistence Rates of First-time Bachelor's Degree Seeking StudentsSecond Year Persistence 64.5% 54.3% 54.9% 44.1% 48.0% 50.0% 52.0%Third Year Persistence 31.4% 42.4% 28.9% 35.5% 34.5% 36.0% 38.0%Fourth Year Persistence 27.0% 24.8% 32.5% 28.1% 30.0%
Note: Persistence rates are for those students who are returning in or have graduated by the provided year
2012/13Actual
2013/14Actual
2014/15Actual
2015/16Projected
2016/17 Projected
2017/18Projected
Graduation Rates for Bachelor's Degree Seeking StudentsFour Year (or less) 6.5% 5.3% 7.9%Six Year (or less) 24.8% 26.1% 17.2%
2012/13Actual
2013/14Actual
2014/15Actual
2015/16Projected
2016/17Projected
2017/18Projected
2018/19Projected
Average Time to Degree (Bachelor's) (methodology under consideration)
Average Credits at Graduation*135.5 133.0 137.4 130.7 130 130 130
Graduates Employed in Pennsylvania (methodology under consideration)
Bachelor's Degree Graduates Continuing Their Education (methodology under consideration)
*Current values include graduates of degree programs that require greater than 120 credits and are therefore temporary. Final values including only degree programs with Board approved requirements of 120 credits will replace the temporary values in the near future.
Completers
Planned Enrollment by Student Type
Persistence Rates
Graduation Rates
Page 9

CHEYNEY UNIVERSITY OF PENNSYLVANIA
2016/2017 ACTION PLAN
Performance Funding Indicators
Of the ten (10) performance funding indicators, five (5) are required of all system universities while five (5) others are chosen by each of the universities to reflect what is most important to their mission and strategic goals. Further refinements in the System’s performance
funding program are anticipated in 2016.
Baseline2012/13
Performance Report
2013/14Performance
Report
2014/15Performance
Report
2015/16Performance
Report
2016/17Targets
Degrees ConferredNumber of Degrees Conferred 168 178 161 149 167 169Undergraduate Degrees per 100 FTE 11.5 14.6 13.0 13.2 14.5 12.3
Closing the Achievement Gaps - 6 Year Graduation RatesPell Recipient Graduation Rate 23.0% 23.2% 28.9% 25.7% 15.4% 28.2%Non-Pell Recipient Graduation Rate 27.0% 20.7% 15.4% 21.3% 23.9% N/AUnderrepresented Minority Graduation Rate 24.0% 50.0% 40.0% 33.3% 25.0% 42.8%Non-Underrepresented Minority Graduation Rate 29.0% 22.4% 25.2% 24.8% 17.6% N/A
Closing the Freshman Access GapsPell Recipient Freshmen 75.3% 86.3% 78.9% 75.5% 72.9% 38.0%
38.0% 38.0% 38.0% 38.0% 38.0% N/AUnderrepresented Minority Freshmen 0.5% 3.4% 6.4% 10.3% 10.9% 3.9%
15.5% 15.5% 15.5% 15.5% 15.7% N/A
Faculty DiversityUnderrepresented Minority Faculty 41.8% 42.6% 47.3% 41.9% 41.5% 44.4%Female Faculty 50.6% 51.9% 49.1% 51.2% 48.8% 50.0%
Baseline2012/13
Performance Report
2013/14Performance
Report
2014/15Performance
Report
2015/16Targets
2016/17Targets
Student PersistenceFrom Fall of Freshman Year to Fall of Third Year 44.6% 32.5% 31.4% 42.4% 28.9% 48.7%From Fall of Freshman Year to Fall of Fourth Year 34.9% 26.9% 24.8% 32.5% 20.0% 29.7%
STEM and Health Profession (STEM-H) Degree RecipientsPercentage of Total Degrees Awarded that are STEM-H 10.1% 14.3% 7.9% 9.9% 13.4% 13.6%
Closing the Transfer Achievement Gaps - 6 Year Graduation RatesPell Transfer Graduation Rate 26.0% 42.5% 48.7% 40.9% 46.0% N/A
30.0% 55.6% 34.5% 34.3% 37.2% N/A66.7% 50.0% 0.0% 60.0% 50.0% N/A25.0% 47.6% 42.4% 36.8% 42.4% N/A
Student DiversityUndergraduate Pell Grant Recipients 71.1% 78.5% 77.0% 75.2% 74.7% 33.7%Nonmajority Students 2.6% 4.5% 10.3% 9.4% 12.3% 8.0%
Closing the Transfer Access GapsPell Recipient Transfer 57.0% 78.5% 74.4% 76.8% 63.5% N/ALow Income PA High School Graduates (ages 18-34) 36.0% 36.0% 36.0% 36.0% 36.0% N/AUnderrepresented Minority Transfers 2.2% 5.2% 7.8% 12.5% 14.1% N/A
16.0% 16.0% 16.0% 16.0% 16.0% N/AUnderrepresented Minority PA High School Graduates (ages 18-34)
Non-Underrepresented Minority Transfer Graduation Rate
Underrepresented Minority Transfer Graduation RateNon-Pell Transfer Graduation Rate
Low Income PA High School Graduates (ages 18-24)
Common to All Universities
University Selected
Underrepresented Minority PA High School Graduates (ages 18-24)
Page 10
CHEYNEY UNIVERSITY OF PENNSYLVANIA
2016/2017 ACTION PLAN
Academic Programs
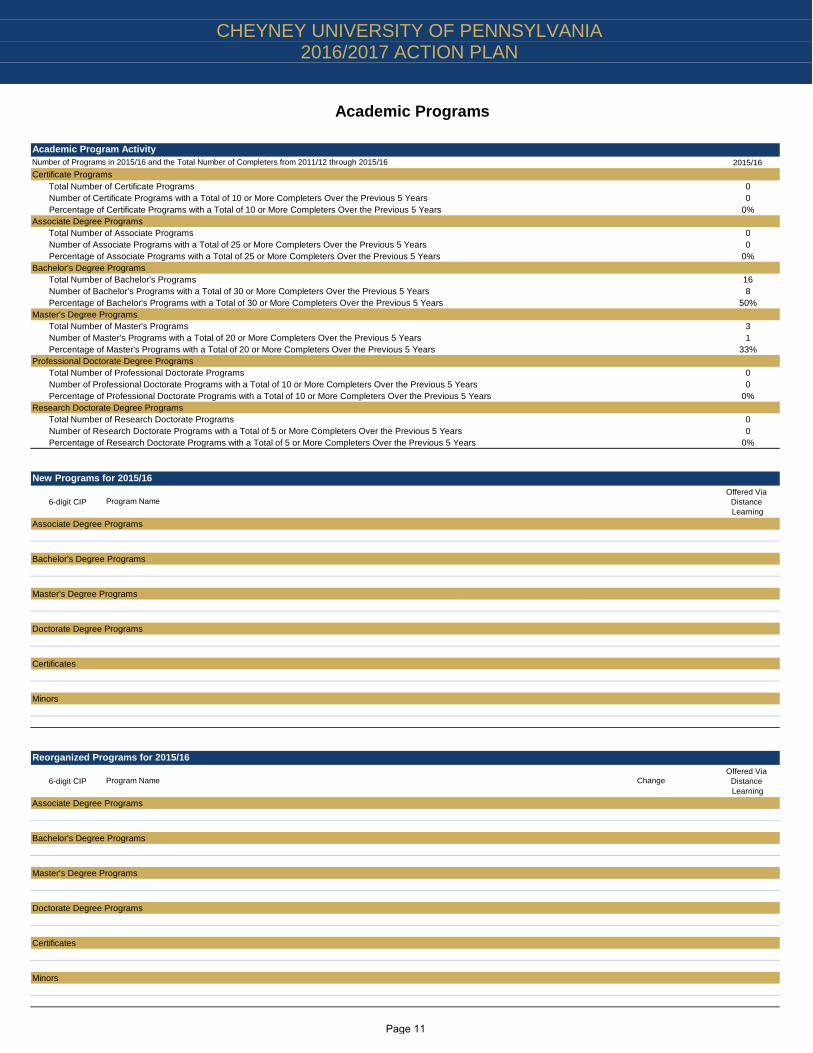
Number of Programs in 2015/16 and the Total Number of Completers from 2011/12 through 2015/16 2015/16Certificate Programs
Total Number of Certificate Programs 0Number of Certificate Programs with a Total of 10 or More Completers Over the Previous 5 Years 0Percentage of Certificate Programs with a Total of 10 or More Completers Over the Previous 5 Years 0%
Associate Degree ProgramsTotal Number of Associate Programs 0Number of Associate Programs with a Total of 25 or More Completers Over the Previous 5 Years 0Percentage of Associate Programs with a Total of 25 or More Completers Over the Previous 5 Years 0%
Bachelor's Degree ProgramsTotal Number of Bachelor's Programs 16Number of Bachelor's Programs with a Total of 30 or More Completers Over the Previous 5 Years 8Percentage of Bachelor's Programs with a Total of 30 or More Completers Over the Previous 5 Years 50%
Master's Degree ProgramsTotal Number of Master's Programs 3Number of Master's Programs with a Total of 20 or More Completers Over the Previous 5 Years 1Percentage of Master's Programs with a Total of 20 or More Completers Over the Previous 5 Years 33%
Professional Doctorate Degree ProgramsTotal Number of Professional Doctorate Programs 0Number of Professional Doctorate Programs with a Total of 10 or More Completers Over the Previous 5 Years 0Percentage of Professional Doctorate Programs with a Total of 10 or More Completers Over the Previous 5 Years 0%
Research Doctorate Degree ProgramsTotal Number of Research Doctorate Programs 0Number of Research Doctorate Programs with a Total of 5 or More Completers Over the Previous 5 Years 0Percentage of Research Doctorate Programs with a Total of 5 or More Completers Over the Previous 5 Years 0%
6-digit CIPOffered Via
Distance Learning
Associate Degree Programs
Bachelor's Degree Programs
Master's Degree Programs
Doctorate Degree Programs
Certificates
Minors
6-digit CIPOffered Via
Distance Learning
Associate Degree Programs
Bachelor's Degree Programs
Master's Degree Programs
Doctorate Degree Programs
Certificates
Minors
Change
Reorganized Programs for 2015/16
Program Name
Academic Program Activity
New Programs for 2015/16
Program Name
Page 11

CHEYNEY UNIVERSITY OF PENNSYLVANIA
2016/2017 ACTION PLAN
Academic Programs
6-digit CIPOffered Via
Distance Learning
Associate Degree Programs
Bachelor's Degree Programs
Master's Degree Programs
Doctorate Degree Programs
Certificates
Minors
6-digit CIPOffered Via
Distance Learning
Associate Degree Programs
Bachelor's Degree Programs05.0201 B.A in African American Studies11.0101 B.A in Computer and Information Sciences27.0101 B.A in Mathematics45.0601 B.A in Economics54.0101 B.A in History51.1005 B.S in Medical Technology19.0101 B.S.Ed in Home Economics Education50.0501 B.S.Ed in Theater Arts
Master's Degree Programs13.1202 M.Ed in Elementary Education26.0101 M.Ed in Biology40.0501 M.Ed in Chemistry13.0403 M.S in Adult and Continuing Education Administration13.1001 M.S in Special Education13.1201 M.S in Adult and Continuing Teacher Education30.0101 M.S in Biological & Physical Science40.0501 M.S in Chemistry
Doctorate Degree Programs
Certificates
Minors
Programs Placed in Moratorium for 2015/16
Program Name
Programs Discontinued for 2015/16
Program Name
Page 12

CHEYNEY UNIVERSITY OF PENNSYLVANIA
2016/2017 ACTION PLAN
Planned New and Emerging Academic Programs
6-digit CIP
Associate Degree Programs
Bachelor's Degree Programs
Master's Degree Programs
Doctorate Degree Programs
Certificates
Minors
6-digit CIP
Associate Degree Programs
Bachelor's Degree Programs
Master's Degree Programs
Doctorate Degree Programs
Certificates
Minors
New Programs for Possible Consideration by the Board of Governors in 2017/18
Program Name
New Programs for Possible Consideration by the Board of Governors in 2018/19
Program Name
Page 13

CHEYNEY UNIVERSITY OF PENNSYLVANIA
2016/2017 ACTION PLAN
Budget Assumptions
October 2016
% ChangeRevenues
Tuition Rate $7,238Technology Tuition Fee 448 University Mandatory Fees (University to provide anticipated percent change in rates for future years)System's State Appropriation (university's share may vary) $444,224,000
ExpendituresSalaries, required changes to base pay Event
AFSCME 2.75% GPI, Eff. 10/1/16
2.0% GPI, Eff. 7/1/17
1 step (or cash
payment for those at top of payscale), Eff. 1st pay in
Jan. 2018
2.5% GPI, Eff. 7/1/18
1 step (or cash payment for those at top of payscale), Eff. 1st pay in Jan. 2019
Faculty N/A 2.75% GPI, Eff. Fall 2016
1 step (or cash payment for those at top of
payscale), Eff. Spring 2016 (Paid after full ratification of
contract)Nonrepresented N/A
SCUPA N/A 2.75% GPI, Eff. 10/1/16 N/A 1.75% GPI,
Eff. 7/1/17
1 step (or cash
payment for those at top of
payscale), Eff. 1st pay in
Jan. 2018
2.25% GPI, Eff. 7/1/18
1 step (or cash
payment for those at top of payscale), Eff. 1st pay in
Jan. 2019
SPFPA N/A 3.50% GPI, Eff. 10/1/16 N/A
OPEIU N/A 3.50% GPI, Eff. 10/1/16 N/A 2.00% GPI,
Eff. 7/1/17
1 step (or cash
payment for those at top of
payscale), Eff. 1st pay in
Jan. 2018
2.50% GPI, Eff. 7/1/18
1 step (or cash
payment for those at top of payscale), Eff. 1st pay in
Jan. 2019
Coaches 3.00% GPI, Eff. 10/1/16
Lump Sum Cash Payout: $1,500 for permanent full-time coach and $750 for
permanent part-time coach (Paid
after full ratification of contract)
2.75% Annual Salary
Adjustment, Eff. 1/1/18
2.50% Merit Pool, Eff.
7/1/17
2.50% Annual Salary
Adjustment, Eff. 1/1/19
2.50% Merit Pool, Eff.
7/1/18
PSSU N/A 2.75% GPI, Eff. 10/1/16 N/A 2.0% GPI,
Eff. 7/1/17
1 step (or cash
payment for those at top of
payscale), Eff. 1st pay in
Jan. 2018
2.5% GPI, Eff. 7/1/18
1 step (or cash
payment for those at top of payscale), Eff. 1st pay in
Jan. 2019
PDA N/A
Retirement % of PaySERS 29.95%PSERS 14.60%ARP 9.29%
PSERS Healthcare Contribution 0.415%
HealthcareCommonwealth Plan Annual Rate
Active Employees (PEBTF - AFSCME, SCUPA, PSSU, and PDA) $11,830Retired Employees (REHP - AFSCME only) $9,412
State System PlanActive Employees, Faculty, PPO Plan $13,663Active Employees, Faculty HMO Plan $17,242Active Employees, Coaches, PPO Plan $16,402Active Employees, Coaches, HMO PlanActive Employees, Other, PPO Plan $12,310Faculty Health & Welfare $1,464Supplemental Healthcare for nonfaculty $865Retiree Healthcare (non AFSCME) $5,200
Consumer Price Index (Urban) 1.80%
Comments:(Include changes in rates and/or assumptions since November 2016)
2016/17 2017/18March 2017% Change
October 2016% Change
March 2017 % Change
2018/19% Change
same as October Assumption 0.00%
same as October Assumption 0.00% $453,108,000 0.00%
same as October Assumption 0.00% 0.00% 0.00%same as October Assumption 0.00% 0.00% 0.00%
TO BE DETERMINED
N/A
N/A N/A N/A
Events Events Events
Same as October Assumption Same as October Assumption
N/A 2.0% GPI, Eff. Fall 2017 N/A
N/A
N/A
N/A
TO BE DETERMINED N/A TO BE DETERMINED
2.75% Merit Pool, Eff. 1/7/17 N/A 4.25% Merit Pool, Eff. 1/6/18
Same as October Assumption 6.70% 8.70% 3.30%Same as October Assumption 0.00% 0.00% 0.00%
TO BE DETERMINED
% of Pay % Change % Change % ChangeSame as October Assumption 9.15% 9.15% 7.46%
Annual Rate
Same as October Assumption 3.96% 3.96% 2.75%
Same as October Assumption 0.00% 0.00% -1.20%
$13,005 $14,483 $12,595 6.00%$16,720 $18,277 $16,523
Same as October Assumption 4.97% 4.97% 6.00%
Same as October Assumption 6.00% 2.00% 6.00%Same as October Assumption 0.00% 0.00% 0.00%
$15,861 $17,386 $15,626 6.00%$16,720 $18,277 $16,523
Same as October Assumption 1.90% 2.40% 2.40%
Same as October Assumption 6.00% 2.00% 0.00%Same as October Assumption 6.00% 2.00% 6.00%
Page 14

CHEYNEY UNIVERSITY OF PENNSYLVANIA
2016/2017 ACTION PLAN
Education & General (E&G) Fund
Dollars in Millions
2014/15Actual
2015/16Actual
2016/17Approved
Revised2016/17
Projected
2017/18Request
Revised2017/18
Projected
2018/19Projected
Undergraduate In-State Tuition $4.7 $3.5 $3.5 $3.5 $4.0 $4.1 $4.7Undergraduate Out-of-State Tuition 2.9 2.3 2.3 2.3 2.5 2.5 2.9Graduate In-State Tuition 0.1 0.1 0.2 0.2 0.3 0.3 0.4Graduate Out-of-State Tuition 0.1 0.1 0.2 0.2 0.2 0.2 0.3TOTAL TUITION REVENUE $7.9 $6.0 $6.1 $6.2 $7.0 $7.2 $8.2Total Fees 2.0 1.5 1.3 1.3 1.5 1.5 1.7State Appropriations 13.0 13.1 12.9 12.9 12.9 12.7 12.7All Other Revenue 0.4 1.0 0.2 0.2 0.2 0.2 0.2Planned Use of Carryforward 0.0 0.0 0.0 0.0 0.0 0.0 0.0Total E&G Revenue/Sources $23.2 $21.6 $20.6 $20.6 $21.6 $21.6 $22.9
Total Salaries and Wages $12.8 $11.4 $10.2 $9.8 $9.4 $10.2 $10.3Total Benefits 5.7 5.2 5.1 4.5 4.8 4.8 5.0TOTAL PERSONNEL EXPENDITURES $18.4 $16.6 $15.3 $14.2 $14.2 $15.0 $15.3Financial Aid 1.2 0.8 0.8 0.8 0.8 0.8 1.0Utilities 1.1 1.0 1.0 0.9 1.0 1.0 1.1Services & Supplies 4.7 4.7 11.2 7.2 13.1 13.1 12.2Capital Expenditures and Transfers 1.8 2.8 1.7 1.4 1.8 1.8 1.7Total E&G Expenditures/Transfers $27.2 $25.8 $30.0 $24.4 $30.9 $31.7 $31.3Total E&G Fund Surplus/(Shortfall) ($4.1) ($4.2) ($9.5) ($3.8) ($9.3) ($10.1) ($8.4)
Undergraduate In-State 707.97 489.27 488.23 505.81 553.33 551.30 622.36Undergraduate Out-of-State 259.30 192.67 189.70 199.19 207.67 217.10 233.58Graduate In-State 10.00 13.13 13.25 17.70 26.67 19.29 30.00Graduate Out-of-State 4.75 8.38 8.88 11.30 12.50 12.31 14.06Total Annualized FTE Enrollment 982.02 703.45 700.06 734.00 800.17 800.00 900.00
Faculty 84.25 66.74 62.80 62.80 62.80 62.80 62.80AFSCME 57.50 33.09 31.10 21.62 21.62 21.62 21.62Nonrepresented 38.70 24.37 21.75 19.50 16.30 16.30 16.30SCUPA 11.00 5.78 10.72 10.72 10.72 10.72 10.72All Other 27.65 16.26 17.72 17.72 17.72 17.72 17.72Total E&G Fund Budgeted Annualized FTE Employees 219.10 146.24 144.09 132.36 129.16 129.16 129.16
E&G Expenditures/Transfers
Annualized FTE Enrollment
E&G Fund Budgeted Annualized FTE Employees
E&G Revenue/Sources
Page 15

CHEYNEY UNIVERSITY OF PENNSYLVANIA
2016/2017 ACTION PLAN
Strategic E&G Budget Realignment
Strategic University Specific Budget Realignment Information
Description2014/15Amount
2015/16Amount
2016/17Amount
Strategic Investments:
The university has been focusing on reducing expenditures and opeating more efficiently, rather than investing in new strategic direction.
Total $0 $0 $0
Sources of Funds for Reinvestment:
Total $0 $0 $0
This page provides information regarding the E&G budget realignment plans of each university, including objectives and how they will be achieved. It should reflect how the budget is being realigned with the university's strategic priorities--new investments vs. reduced emphasis.
Page 16

CHEYNEY UNIVERSITY OF PENNSYLVANIA
2016/2017 ACTION PLAN
Auxiliary Enterprises, Restricted, and Total Funds
Dollars in Millions 2014/15
Actual2015/16Actual
2016/17Approved
Revised2016/17
Projected
2017/18Request
Revised2017/18
Projected
2018/19Projected
Food Service Sales $2.7 $2.0 $1.9 $1.9 $2.2 $2.2 $2.5Housing Fees 3.9 2.9 2.7 2.7 3.1 3.1 3.6Privatized Housing 0.0 0.0 0.0 0.0 0.0 0.0 0.0Other Auxiliary Sales 0.0 0.0 0.0 0.0 0.0 0.0 0.0All Other Revenue 0.8 0.6 0.2 0.2 0.2 0.2 0.3Total Auxiliary Revenue/Sources $7.5 $5.5 $4.9 $4.9 $5.5 $5.5 $6.4
Total Salaries and Wages $1.6 $1.6 $1.4 $1.2 $1.1 $1.1 $1.1Total Benefits 0.9 0.9 0.9 0.7 0.8 0.8 0.8TOTAL PERSONNEL EXPENDITURES $2.5 $2.5 $2.2 $1.9 $1.9 $1.9 $2.0Financial Aid 0.2 0.2 0.3 0.2 0.3 0.3 0.1Utilities 0.8 0.6 0.6 0.7 0.6 0.6 0.7Services & Supplies 4.1 3.5 5.4 3.3 6.0 6.0 6.0Capital Expenditures and Transfers 1.2 (0.0) 0.8 0.8 0.8 0.8 0.8Total Auxiliary Expenditures/Transfers $8.9 $6.9 $9.3 $6.9 $9.6 $9.6 $9.5Total Auxiliary Fund Surplus/(Shortfall) ($1.3) ($1.4) ($4.5) ($2.0) ($4.0) ($4.0) ($3.1)
Total Auxiliary Fund Budgeted Annualized FTE Employees 3.00 30.10 28.39 28.39 22.81 22.81 22.81
Federal Grants & Contracts $6.2 $5.6 $5.6 $5.5 $5.6 $5.6 $5.6State Grants & Contracts 4.2 2.9 2.9 3.8 2.9 2.9 2.9Private Grants & Contracts 0.1 0.2 0.2 0.1 0.2 0.2 0.2Gifts 0.7 0.6 0.6 0.7 0.6 0.6 0.6All Other Restricted Revenue 0.3 0.2 0.2 0.3 0.1 0.1 0.1Total Restricted Revenue $11.4 $9.5 $9.5 $10.4 $9.4 $9.4 $9.4
Total Salaries and Wages $2.1 $2.0 $1.9 $1.5 $1.9 $1.9 $1.9Total Benefits 0.9 1.0 0.8 0.6 0.8 0.8 0.8TOTAL PERSONNEL EXPENDITURES $3.0 $3.0 $2.7 $2.1 $2.7 $2.7 $2.7Financial Aid 7.4 5.8 5.7 7.4 5.7 5.7 5.7Utilities 0.0 0.0 0.0 0.0 0.0 0.0 0.0Services & Supplies 1.2 0.8 1.0 0.7 0.9 0.9 0.9Capital Expenditures and Transfers (0.2) (1.7) 0.0 0.2 0.0 0.0 0.0Total Restricted Expenditures/Transfers $11.5 $8.0 $9.5 $10.4 $9.4 $9.4 $9.4Total Restricted Fund Surplus/(Shortfall) ($0.0) $1.5 $0.0 $0.0 $0.0 $0.0 $0.0
Total Restricted Fund Budgeted Annualized FTE Employees 30.75 28.34 22.32 22.32 20.82 20.82 20.82
Total University Revenue $42.1 $36.6 $34.9 $35.9 $36.6 $36.5 $38.7Total University Expenses $47.6 $40.7 $48.8 $41.7 $49.9 $50.6 $50.2Total University Surplus/(Shortfall) ($5.4) ($4.1) ($13.9) ($5.8) ($13.3) ($14.1) ($11.5)Total Annualized FTE Employees 252.85 204.68 194.80 183.07 172.79 172.79 172.79
Restricted Revenue
Restricted Expenditures/Transfers
Auxiliary Enterprises — Associated with auxiliary units that are self-supporting through fees, payments, and charges. Examples include housing, food services, student unions, and recreation centers.
Restricted Funds — Resources are received from federal, state, or private sources for specified purposes, typically for conducting research, public service activities, and/or providing external financial aid.
Auxiliary Revenue
Auxiliary Expenditures/Transfers
Page 17

CHEYNEY UNIVERSITY OF PENNSYLVANIA
2016/2017 ACTION PLAN
Tuition and Fees
2014/15Actual
2015/16 Actual
2016/17Actual
2017/18Request
In-State UndergraduateTuition $6,820 $7,060 $7,238 $7,238Technology Tuition Fee 422 436 448 448University Mandatory Fees 1,848 1,848 1,848 1,848
Total Cost In-State Undergraduate Off Campus or At Home $9,090 $9,344 $9,534 $9,534 Most Common Room and Board Rates 11,252 11,252 11,252 11,252Total Cost In-State Undergraduate On Campus $20,342 $20,596 $20,786 $20,786
Out-of-State Undergraduate Tuition (Most Common) $11,254 $11,650 $11,650 $11,650Technology Tuition Fee 642 664 664 664University Mandatory Fees 1,848 1,848 1,848 1,848
Total Out-of-State Undergraduate Off Campus or At Home $13,744 $14,162 $14,162 $14,162 Most Common Room and Board Rates 11,252 11,252 11,252 11,252Total Cost Out-of-State Undergraduate On Campus $24,996 $25,414 $25,414 $25,414
Price to Most Common Student Living Off Campus or At HomeIn-State Undergraduate Off Campus or At Home
Tuition per Credit (Most Common) $284 $294 $302 $302Technology Tuition Fee Per Credit 18 19 19 19University Mandatory Fees Per Credit (on average) 469
Total Cost Per Credit In-State Undergraduate Off Campus or At Home $771 $313 $321 $321
Out-of-State Undergraduate Off Campus or At HomeTuition per Credit (Most Common) $469 $485 $498 $498Technology Tuition Fee Per Credit 27 28 29 29University Mandatory Fees Per Credit (on average) 469
Total Cost Per Credit Out-of-State Undergraduate Off Campus or At Home $965 $513 $527 $527
Price to Most Common Graduate Student Living Off Campus or At HomeIn-State Graduate Student Living Off Campus
Tuition per Credit (reflect Center City rate)Minimum N/A N/A N/A N/AMaximum N/A N/A N/A N/AMost Common (reflect Center City rate) $409 $423 $435 $435Tuition Pilot (State System Center City) $409 $423 $435 $435
Technology Tuition Fee Per Credit $24 $25 $26 $26University Mandatory Fees Per Credit (on average) $78
Out-of-State Graduate Student Living Off Campus Tuition per Credit Minimum N/A N/A N/A N/A Maximum N/A N/A N/A N/A
Most Common (reflect Center City rate) $613 $635 $653 $653 Tuition Pilot (State System Center City) $613 $635 $653 $653Technology Tuition Fee Per Credit $36 $37 $38 $38University Mandatory Fees Per Credit (on average) $78
Graduate Students (per credit)
Full Time Undergraduates (academic year only; 30 credits)
Part Time Undergraduates (per credit)
Page 18
CHEYNEY UNIVERSITY OF PENNSYLVANIA
2016/2017 ACTION PLAN
University Undergraduate Fees
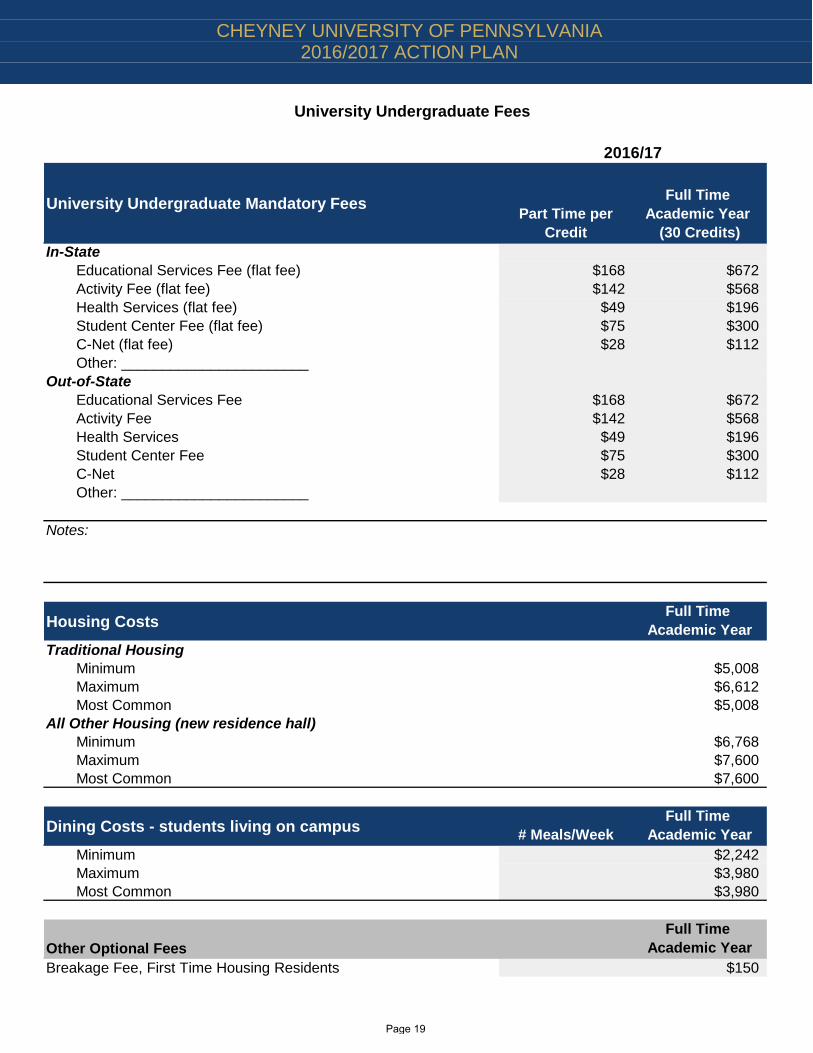
University Undergraduate Mandatory Fees Part Time per Credit
Full Time Academic Year
(30 Credits)In-State
Educational Services Fee (flat fee) $168 $672Activity Fee (flat fee) $142 $568Health Services (flat fee) $49 $196Student Center Fee (flat fee) $75 $300C-Net (flat fee) $28 $112Other: _______________________
Out-of-StateEducational Services Fee $168 $672Activity Fee $142 $568Health Services $49 $196Student Center Fee $75 $300C-Net $28 $112Other: _______________________
Housing Costs Full Time Academic Year
Traditional HousingMinimum $5,008Maximum $6,612Most Common $5,008
All Other Housing (new residence hall)Minimum $6,768Maximum $7,600Most Common $7,600
Dining Costs - students living on campus # Meals/WeekFull Time
Academic YearMinimum $2,242Maximum $3,980Most Common $3,980
Other Optional FeesFull Time
Academic YearBreakage Fee, First Time Housing Residents $150
2016/17
Notes:
Page 19

CHEYNEY UNIVERSITY OF PENNSYLVANIA
2016/2017 ACTION PLAN
Financial Aid: Gift Aid by Award Year
2012/13Actual
2013/14Actual
2014/15Actual
2015/16 Actual
2016/17Projected
Undergraduate Gift Aid (include clock hour students)Institutional Aid*
# of Students 684 656 618 236 136Average Award $1,883 $2,204 $4,107 $9,343 $8,817Total Dollars Awarded $1,288,224 $1,446,103 $2,538,381 $2,204,930 $1,199,066% of Undergraduate Students Receiving Aid 49% 51% 56% 31% 17%
Pennsylvania State Grants# of Students 521 548 458 325 304Average Award $2,791 $3,073 $2,761 $2,889 $3,083Total Dollars Awarded $1,454,238 $1,684,190 $1,264,633 $939,084 $937,232% of Undergraduate Students Receiving Aid 37% 43% 42% 42% 38%
Pell Grants# of Students 1,028 959 796 570 563Average Award $4,351 $4,410 $4,505 $4,347 $4,491Total Dollars Awarded $4,472,783 $4,229,205 $3,586,363 $2,477,770 $2,528,509% of Undergraduate Students Receiving Aid 74% 74% 73% 74% 71%
All Other Gift Aid**# of Students 565 532 462 305 262Average Award $4,226 $3,713 $3,736 $5,547 $6,026Total Dollars Awarded $2,387,751 $1,975,253 $1,725,851 $1,691,971 $1,578,705% of Undergraduate Students Receiving Aid 40% 41% 42% 40% 33%
Unduplicated Students Receiving Gift Aid# of Students 1,216 1,120 978 671 660Average Award $7,897 $8,335 $9,320 $10,900 $9,460Total Dollars Awarded $9,602,996 $9,334,751 $9,115,227 $7,313,755 $6,243,512% of Undergraduate Students Receiving Gift Aid 87% 87% 89% 87% 83%
Graduate Student AidGraduate Assistantship Stipends
# of Students 0 0 0 0 -Total Dollars Awarded $0 $0 $0 $0 $0% of Graduate Students Receiving Assistantships 0% 0% 0% 0% 0%
Graduate Tuition Waivers# of Students 0 0 0 0 0Total Dollars Awarded $0 $0 $0 $0 $0% of Graduate Students Receiving Waivers 0% 0% 0% 0% 0%
*Institutional Aid includes Board of Governors' waivers; tuition, room and board waivers; etc.
Notes: Number of students and aid awarded are for fall and spring semesters only**All Other Gift Aid includes foundation scholarships, miscellaneous PHEAA grants, grants from other states, third party scholarships, etc.
Page 20

CHEYNEY UNIVERSITY OF PENNSYLVANIA
2016/2017 ACTION PLAN
Financial Aid: Loans, Cost of Attendance, Family Income
Loans
2012/13Actual
2013/14Actual
2014/15Actual
2015/16Actual
2016/17Projected
Undergraduate Loans (all known)# of Students 1,155 1,039 871 621 572Average Loan $8,081 $8,129 $8,120 $7,525 $11,199Total Dollars Loaned $9,333,244 $8,446,284 $7,072,610 $4,673,260 $6,406,062% of Undergraduate Students Receiving Loans 83% 81% 80% 80% 72%
Graduate Loans (all known)# of Students 67 37 27 35 31Average Loan $14,171 $15,403 $14,459 $12,744 $18,342Total Dollars Loaned $949,437 $569,896 $390,388 $446,048 $568,625% of Graduate Students Receiving Loans 78% 77% 77% 85% 65%
Student Debt Summary2011/12 Actual
2012/13Actual
2013/14Actual
2014/15Actual
2015/16Projected
Bachelor's Degree RecipientsPercent of Recipients with Debt N/A N/A N/A N/AAverage Amount of Debt (of those graduating with debt) N/A N/A N/A N/A
All Students (undergraduate and graduate)Student Loan Default Rate, 3 year 28.2% 26.9% 26.8% 27.0%
Default rates are for students that defaulted on their Federal Stafford and Direct student loans in 2010-2012, 2011-2013, 2012-2014, and 2013-2015
Tuition and Mandatory Fees
Room and Board
Books and Supplies
Transportation, Personal, Other
ExpensesTotal
$9,344 $9,868 $1,500 $2,850 $23,562$9,344 $3,750 $1,500 $2,850 $17,444
$14,162 $9,868 $1,500 $2,850 $28,380$14,162 $3,750 $1,500 $2,850 $22,262
Note: Costs are based on financial aid packaging costs, not most common
Family Income Groups Headcount Average Net
Cost of Attendance
Average Net Cost Tuition
and Fees
Average Gift Aid Amount
Average Loan Amount
Below $30,000 223 $13,424 $(2,956) $12,243 $7,906$30,001 - $48,000 61 $13,285 $(2,586) $11,970 $7,446$48,001 - $75,000 47 $14,312 $(2,610) $11,930 $6,837$75,001 - $110,000 31 $12,626 $(3,595) $12,952 $9,514$110,001 and Above 10 $6,831 $(8,394) $18,239 $7,005
Comments:Commitment to Access:
Out-of-State Undergraduate On CampusOut-of-State Undergraduate Off Campus, Living at Home
Notes: Only includes students who completed a FAFSA. Family Income Groups are based on the Total Family Income (including untaxed income) as reported on student FAFSA records. Average Gift Aid includes all grants and scholarships from Federal, State, University, and other private sources administered by the Financial Aid Office. Student waivers are also included in the Gift Aid amount. Net Cost of Attendance is the actual average of the total Costs of Attendance (which will vary by income group due to the diversity of students living on- and off- campus) minus the average Gift Aid amount. Net Tuition & Mandatory Fees is the actual average of the total costs of tuition and fees (which will vary by income group due to the amount of credit hours students are enrolled) minus the average Gift Aid amount (see page University Undergraduate Fees for list of fees that are included). Average Loan Amount includes Federal (Perkins, Stafford, Ford Direct) and all private student loans known to the university. The bottom-line Average represents the average of all full-time undergraduate Pennsylvania residents. Tuition and Mandatory Fees include all reported mandatory fees and tech fee. Full-time students are considered those with 12 or more attempted credits in both Fall and Spring semesters.
FY 2015/16 Cost of Attendance(Academic Year)In-State Undergraduate On CampusIn-State Undergraduate Off Campus, Living at Home
FY 2015/16 Estimated Net Cost by Family IncomePA Resident Undergraduates Enrolled Full Time in the Fall and Spring who Filed a FAFSA
Page 21
CHEYNEY UNIVERSITY OF PENNSYLVANIA
2016/2017 ACTION PLAN
Pricing Flexibility Pilot for Reduced Tuition
Pilot/Title:
Brief Synopsis of Pilot, as Approved by Board of Governors:
Changes Made to Pilot since its Approval:
Assessment CriteriaBase Year:
Fall 2013Prior Year:
Fall 2014Prior Year:
Fall 2015Current Year:
Fall 2016Fall 2016 –Fall 2015
Fall 2016 –Base Year
Cohort Access 35.00 41.00 42.00 17.00 6.00 1.00
Percent Pell Recipients 43.2% 46.1% 53.8% 22.1% 75.00 87.00 73.00 76.00 * 12.00 (14.00)
Percent Nonmajority 97.4% 97.8% 93.6% 98.7%Other:
Cohort Enrollment 64.02 72.33 61.67 40.00 * 8.31 (10.66) 81.00 89.00 78.00 77.00 8.00 (11.00)
Annualized FTE Students 0.00 0.00
Fall Revenue Associated with Cohort$266,754 $278,515 $245,779 $191,095 * $11,761 $(32,736)
26,675 27,852 24,578 19,110 * 1,176 (3,274)Auxiliary Fee Revenue 0 0 0 0 0 0
0 0 0 0 0 0$293,429 $306,367 $270,357 $210,205 $12,937 $(36,010)
8,923 9,142 5,127 8,923 219 $297,443 $261,214 $205,078 $4,014 $(36,229)
*Estimated by Office of the Chancellor
Institutional Financial Aid (negative number)Net RevenueRevenue Increase Due to Normal Rate ChangesRevenue Associated with Pilot
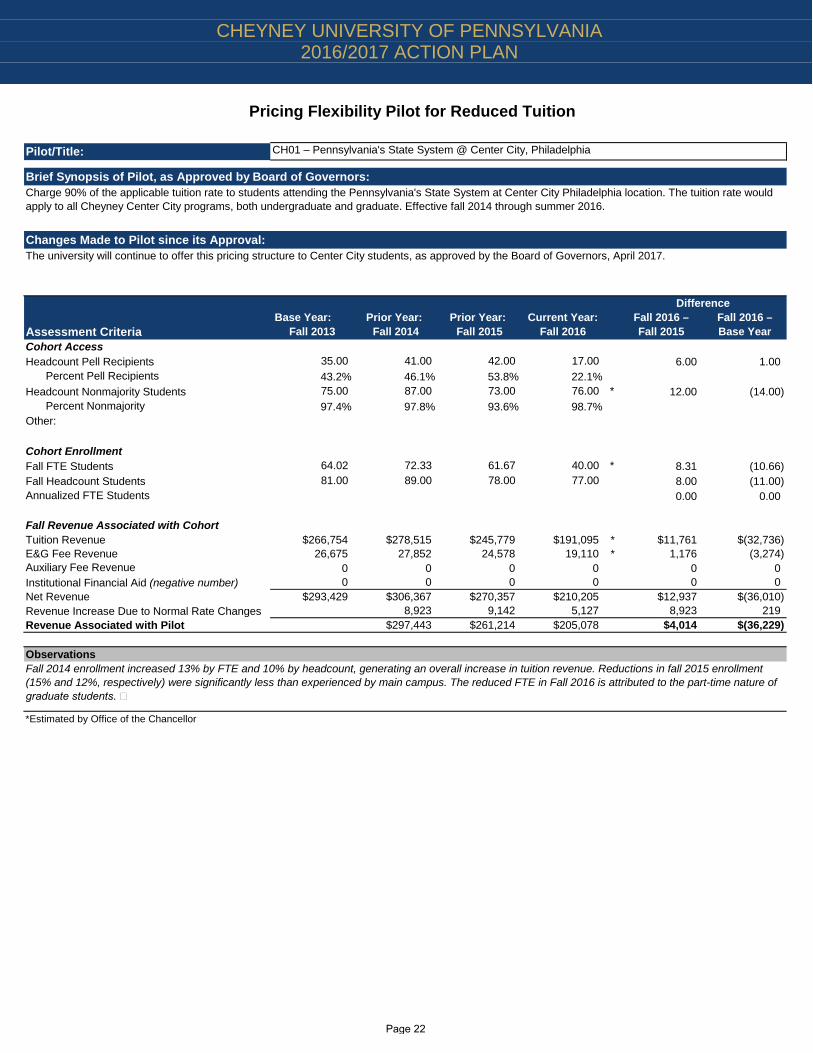
ObservationsFall 2014 enrollment increased 13% by FTE and 10% by headcount, generating an overall increase in tuition revenue. Reductions in fall 2015 enrollment (15% and 12%, respectively) were significantly less than experienced by main campus. The reduced FTE in Fall 2016 is attributed to the part-time nature of graduate students.
Charge 90% of the applicable tuition rate to students attending the Pennsylvania's State System at Center City Philadelphia location. The tuition rate would apply to all Cheyney Center City programs, both undergraduate and graduate. Effective fall 2014 through summer 2016.
The university will continue to offer this pricing structure to Center City students, as approved by the Board of Governors, April 2017.
Headcount Pell Recipients
CH01 – Pennsylvania's State System @ Center City, Philadelphia
Difference
E&G Fee Revenue
Headcount Nonmajority Students
Fall FTE Students
Tuition Revenue
Fall Headcount Students
Page 22

CHEYNEY UNIVERSITY OF PENNSYLVANIA
2016/2017 ACTION PLAN
Pricing Flexibility Pilot for Reduced Tuition
Pilot/Title:
Brief Synopsis of Pilot, as Approved by Board of Governors:
Changes Made to Pilot since its Approval:
Assessment Criteria:Base Year:
Fall 2013Prior Year:
Fall 2014Prior Year:
Fall 2015Current Year:
Fall 2016Fall 2016 –Fall 2015
Fall 2016 –Base Year
Cohort Access0.00 0.00
Percent Pell Recipients0.00 0.00
Percent NonmajorityOther:
Cohort Enrollment0.00 0.00 0.00 0.00
Annualized FTE Students 0.00 0.00
Fall Revenue Associated with Cohort$0 $0
0 0Auxiliary Fee Revenue 0 0
0 0$0 $0 $0 $0 $0
0 0$0 $0 $0 $0
CH02 – Active Military Tuition
Charge undergraduate tuition at the Military Tuition Assistance (TA) reimbursement rate (currently $250 per credit) and graduate tuition at a fixed rate of $399 per credit to the following individuals attending Cheyney University at the Pennsylvania's State System @ Center City Philadelphia location or the main campus: all active duty military (Army, Navy, Air Force, Marine Corps, Coast Guards, National Guard, and Reserves) and dependents and spouses of active duty members. Effective fall 2014 through summer 2017.
Implementation has been postponed.
Headcount Pell Recipients
Headcount Nonmajority Students
Fall FTE StudentsFall Headcount Students
Difference
Observations:
Tuition RevenueE&G Fee Revenue
Institutional Financial Aid (negative number)Net RevenueRevenue Increase due to Normal Rate ChangesRevenue Change Associated with Pilot
Page 23
