chemistry, phytotoxicity and remediation of alkaline soils · has been carried out on soil...
TRANSCRIPT

Chemistry, Phytotoxicity and Remediation of Alkaline
Soils
David Brautigan
In fulfilment of the requirements for the degree of
Doctor of Philosophy
A thesis submitted to
Soil and Land Systems
School of Earth and Environmental Sciences
The University of Adelaide
Australia
September 2010

i
Table of Contents
Table of contents……………………………………..i
Abstract……………………………………………...v
Declaration……………………………………..........viii
Acknowledgements………………………………….ix
List of tables/figures…………………………………x
Chapter 1: Introduction .......................................................................................................... 1
References .............................................................................................................................. 5 Chapter 2: Review of Literature ............................................................................................ 8
2.1 Alkalinity ......................................................................................................................... 8
2.1.1 Extent of alkaline soils. ............................................................................................. 8
2.1.2 Determinants of alkalinity......................................................................................... 9
2.1.3 Carbonate species and pH ....................................................................................... 10
2.1.4 Agriculture and alkaline soils - phytotoxicity ......................................................... 12
2.1.5 A new constraint in alkaline soils? Aluminium phytotoxicity................................ 12
2.2 Aluminium phytotoxicity ............................................................................................... 12
2.2.1 Aluminium in soils .................................................................................................. 12
2.2.2 Traditional paradigm of Al toxicity ........................................................................ 13
2.2.3 Al toxicity in high pH soils ..................................................................................... 13
2.2.4 Sources and speciation of aluminium in soils. ........................................................ 14
2.2.5 Aluminium speciation ............................................................................................. 15
2.2.5.1 Aluminium speciation and pH. ........................................................................ 15
2.2.6 Polymer species ...................................................................................................... 16
2.2.7 Entry of aluminium into the plant. .......................................................................... 17
2.2.7.1 Mechanisms of aluminium phytotoxicity. ....................................................... 17
2.2.7.2 Phytotoxicity in the apoplasm .......................................................................... 17
2.2.7.3 Phytotoxicity in the symplasm ......................................................................... 17
2.2.8 Symptoms of aluminium toxicity............................................................................ 18
2.3 Ameliorating aluminium phytotoxicity.......................................................................... 19
2.3.1 Methods of amelioration ......................................................................................... 19
2.3.2 Alkaline buffering intensity .................................................................................... 19
2.3.3 Lowering soil pH .................................................................................................... 20

ii
2.3.3.1 Chemically lowering soil pH ........................................................................... 20
2.3.3.2 Organically lowering soil pH ........................................................................... 21
2.3.3.3 Micro-organisms and soil pH........................................................................... 22
2.3.3.4 Plant roots and soil pH ..................................................................................... 22
2.3.4 Al complexion methods .......................................................................................... 23
2.4 Further research ............................................................................................................. 24
2.5 References ...................................................................................................................... 26 Chapter 3: Soil Characterisation .......................................................................................... 36
3.1 Soil selection and classification ..................................................................................... 36
3.2 Soil Characterisation ...................................................................................................... 37
3.3 References ...................................................................................................................... 39 Chapter 4: Aluminium Phytotoxicity and Speciation ........................................................ 40
4.1 Introduction .................................................................................................................... 40
4.2 Methods.......................................................................................................................... 42
4.2.1 Experiment 1: Aluminium charge and pH. ............................................................. 42
4.2.2 Experiment 2: Al speciation determined using NMR analysis ............................... 43
4.2.3 Experiment 3: Aluminium speciation determined using precipitation ................... 43
4.2.4 Experiment 4: Aluminium speciation determined using electrical conductivity. ... 44
4.2.5 Experiment 5: Aluminium entry into plants. ......................................................... 44
4.2.6 Experiment 6: Pot experiment to verify aluminium phytotoxicity at high pH. ...... 45
4.3 Results/Discussion ......................................................................................................... 47
4.3.1 Experiment 1: Aluminium charge and pH. ............................................................. 47
4.3.2 Experiment 2: Aluminium speciation determined using NMR analysis ................ 48
4.3.3 Experiment 3: Aluminium speciation determined using precipitation ................... 50
4.3.4 Experiment 4: Aluminium speciation determined using electrical conductivity .... 51
4.3.5 Experiment 5: Aluminium entry into plants. .......................................................... 52
4.3.6 Experiment 6: Pot experiment to verify aluminium phytotoxicity at high pH. ...... 53
4.4 Conclusion ..................................................................................................................... 59
4.5 References ...................................................................................................................... 61 Chapter 5: The role of carbonates in determining soil pH and alkaline buffering capacity ................................................................................................................................... 63
5.1 Introduction .................................................................................................................... 63
5.2 Methods.......................................................................................................................... 65
5.2.1 Experiment 1: Mineral composition of soils .......................................................... 65
5.2.2 Experiment 2: Carbonate composition of soils ....................................................... 65

iii
5.2.3 Experiment 3: Carbonate chemistry and soil pH .................................................... 67
5.2.4 Experiment 4: Carbonate sorption to clays ............................................................ 68
5.2.5 Experiment 5: Clay adsorbed carbonate and alkaline buffering intensity .............. 68
5.2.6 Experiment 6: Titration of six alkaline soils to determine soil alkaline buffering intensity ............................................................................................................................ 69
5.3 Results/Discussion ......................................................................................................... 69
5.3.1 Experiment 1: Mineral composition of soils. .......................................................... 69
5.3.2 Experiment 2: Carbonate composition of soils ....................................................... 71
5.3.3 Experiment 3: Carbonate content and soil pH ........................................................ 72
5.3.4 Experiment 4: Carbonate sorption to clay .............................................................. 74
5.3.5 Experiment 5: Clay adsorbed carbonate and buffering intensity. ........................... 75
5.3.6 Experiment 6: Titration of six alkaline soils to determine soil alkaline buffering intensity. ........................................................................................................................... 76
5.4 Conclusion ..................................................................................................................... 79
5.5 References ...................................................................................................................... 81
Appendix .............................................................................................................................. 83
Whole soil X-ray diffraction graphs ................................................................................ 83
Monarto ............................................................................................................................ 83
Ardrossan ......................................................................................................................... 83
Paskerville ........................................................................................................................ 84
Minlaton ........................................................................................................................... 84
Keilira 1 ........................................................................................................................... 85
Keilira 2 ........................................................................................................................... 85 Chapter 6: Amelioration of aluminium phytotoxicity in alkaline soils ............................. 86
6.1 Introduction .................................................................................................................... 86
6.2 Methods.......................................................................................................................... 88
6.2.1 Experiment 1: Use of gypsum to modify soil pH ................................................... 88
6.2.2 Experiment 2: Use of plant root exudates to modify soil pH. ................................ 89
6.2.3 Experiment 3: Plant root exudates used in conjunction with gypsum .................... 90
6.2.4 Experiment 4: Use of organic additives to modify soil pH. ................................... 91
6.2.5 Experiment 5: Use of earthworms to modify soil pH. ............................................ 92
6.2.6 Experiment 6: Complexation of aluminium to ameliorate Al phytotoxicity .......... 92
6.3 Results and Discussion .................................................................................................. 93
6.3.1 Experiment 1: Use of gypsum to modify soil pH ................................................... 93
6.3.2 Experiment 2: Use of plant root exudates to modify soil pH ................................. 94
6.3.3 Experiment 3: Plant root exudates used in conjunction with gypsum .................... 96
6.3.4 Experiment 4: Use of organic amendments to lower soil pH ................................. 98

iv
6.3.5 Experiment 5: Use of worms to modify soil pH. .................................................. 105
6.3.6 Experiment 6 Complexation of aluminium: a preliminary study. ........................ 107
6.4 Conclusion ................................................................................................................... 107
6.5 References .................................................................................................................... 111 Chapter 7: Conclusion ......................................................................................................... 115
References .......................................................................................................................... 119

v
Abstract
Highly alkaline soils are known to adversely affect agricultural crop productivity. Problems
commonly attributed to such soils include poor structure and nutrient deficiency. Research
based on solution cultures suggests that aluminium phytotoxicity may also occur at alkaline
pH, however little research has been done in actual soils under controlled conditions. This
new constraint needs to be verified and the nature of the aluminium responsible determined.
A potential method of remediating alkaline soils is to use acid to lower soil pH to a more
neutral value. This requires an understanding of the role of carbonates in causing and
maintaining high pH. Whereas the acid buffing intensity of soils has been well documented,
comparatively little work has been carried out on alkaline buffering intensity. While research
has been carried out on soil treatments that may be used to lower soil pH, a systematic
comparison of their relative effectiveness is needed.
This study has shown that aluminium is indeed phytotoxic at high pH, significantly reducing
the stem and root development of field pea test plants over and above that caused by
alkalinity alone. The effects of both alkalinity in general and aluminium in particular became
noticeable at a pH of 9.0 and debilitating at a pH of 9.2 or higher. As the quantity of
aluminium found in test plants at neutral and high pH was similar, it is likely that it is the
speciation of aluminium at high pH that is responsible for this toxicity rather than the
quantity entering the plant.
Techniques including electrophoretic mobility analysis, NMR and use of aluminium
precipitation characteristics and electrical conductivity were used to determine that anionic

vi
species of aluminium are most likely responsible for aluminium phytotoxicity at high pH. At
pH 9.2, negatively charged sodium aluminate became the dominant form of aluminium.
Analysis of carbonate speciation with varying pH identified that carbonate adsorbed to soil
clays via exchangeable Na was responsible for soil pH greater than 8.0. Between pH 8.0 and
9.0, most of the soluble carbonates were adsorbed to clays; above pH 9.0 carbonate species
dominated in solution phase.
As the effects of alkaline and aluminium toxicity diminish at a pH of less than 9.0, alkaline
soils need only be lowered to less than this value to be remediated. Titration of alkaline soils
showed that they had low buffering capacity against acid induced pH decrease until pH 8.0.
At pH less than 8.0, the predominance of calcite minerals and their faster dissolution rate
meant that buffering intensity was very high and large amounts of acid would be needed to
lower pH below this value. However at a pH of more than 8.0, the slower dissolution rate of
carbonate containing minerals provides little buffering intensity. Remediating alkaline soils
via the use of acid to lower soil pH to 8.0 was deemed achievable because of the lower
buffering capacity of soils in this pH range.
The effectiveness of gypsum, various organic amendments (glucose, molasses, animal
manure, green manure, humus) and leguminous plants were trialled as a means of lowering
soil pH. Plants were also trialled in conjunction with gypsum to determine if any additive
benefits were evident when combining remediation methods.
Glucose, molasses, green manure and all plant root exudates proved effective at lowering
soil pH to less than 9.0. The decrease in pH achieved using the additives was highly

vii
correlated with increased populations of acid-producing microbes. The effect was not long
lasting however, with pH returning to pre-application levels within 6 months.
Gypsum proved most effective at lowering soil pH and, crucially, the effect was long lasting,
with low soil pH maintained over the 6 month study period. When gypsum was used in
conjunction with plant root exudates, the decrease in soil pH was not greater than that
achieved using gypsum alone, however it was again maintained over the whole study period.
It is suggested that using plant root exudates to economically lower soil pH (the plant itself
can be a viable crop) and smaller quantities of gypsum (compared to gypsum used as a
standalone ameliorant) to maintain the lowered pH may be an optimal method of
ameliorating alkaline soils.
It is hoped that by confirming aluminium phytotoxicity in alkaline soils, determining the
critical pH where aluminium and alkaline toxicity become debilitating to crops and providing
a potential remediation method, the results and conclusions presented in this thesis will help
improve agricultural production in alkaline soils.

viii
Declaration
This work contains no material which has been accepted for the award of any other degree or
diploma in any university or other tertiary institution and, to the best of my knowledge and
belief, contains no material previously published or written by another person except where
due reference has been made in the text.
I give consent for this thesis, when deposited in the University Library, to be available for
loan and photocopying. I also give permission for the digital version of my thesis to be made
available on the web, via the University’s digital research repository, the Library catalogue,
the Australasian Digital Thesis Program (ADTP) and also through web search engines, unless
permission has been granted by the University to restrict access for a period of time.
David John Brautigan Date

ix
Acknowledgements
This project is part of the GRDC project “Chemistry and crop agronomy in alkaline cropping
soils (UA00092)”. I would like to thank them for funding much of the research presented in
this thesis.
Thank you to the University of Adelaide for the provision of my scholarship and also to the
Future Farms Industry CRC for their support (operational funding and scholarship) of this
project.
Thanks to my family for their support, both of my change to a career in science and during
the production of this thesis.
I would like to thank Professor David Chittleborough for his advice and support throughout
the life of this project. They were invaluable in making the production of this thesis an
enjoyable and relatively painless process.
Many thanks to Alla Marchuk who took a raw recruit who didn’t even know how to use a
pipette properly and turned him into a reasonably competent lab chemist.
And finally, and most importantly, my thanks go to Dr Pichu Rengasamy. Always helpful
and with vast patience for a chemistry novice, you showed by your actions that the most
important and valuable attribute that a scientist can have is the ability to think outside the
established paradigm and formulate a new idea. You will always be a role model to emulate
in my future scientific endeavours.

x
List of Tables
Table 3.1 Soil characteristics. .................................................................................................. 38 Table 4.1 Average percentage decrease in growth of SANTI variety field pea with increasing pH ............................................................................................................................................. 57 Table 4.2. Average percentage decrease in growth of SANTI field pea grown in Al treated soil compared to no Al soil. ..................................................................................................... 57 Table 4.3 Aluminium content of SARDI field peas at varying pH and soil Al content .......... 58 Table 5.1 Mineralogy of whole soils as determined by X-ray diffraction % ......................... 70 Table 5.2 Mineralogy of clay component as determined by X-ray diffraction % ................. 70 Table 5.3 Soil carbonate content and mineralogy .................................................................... 71 Table 5.4 Effect of filtering/leaching on soil suspension pH. .................................................. 73 Table 6.1 Effect of organic amendments on soil microbial population and corresponding change in soil pH. .................................................................................................................. 104
List of Figures
Figure 1.1 Extent of the world’s alkaline soils. ......................................................................... 1 Figure 2.1 Extent of Australia’s alkaline soils. .......................................................................... 8 Figure 2.2 Relationship between carbonate/bicarbonate and proton/hydroxide concentrations..................................................................................................................................................... 9 Figure 2.3 Relative proportions of carbonate species with changing pH. ............................... 11 Figure 2.4 Increase in carbonate and bicarbonate with increasing pH. ................................... 11 Figure 2.5 Relative activity of Al species with changing pH. ................................................. 16 Figure 2.6 Typical binding sites for aluminium ions. .............................................................. 23

xi
Figure 3.1 Locations within South Australia soils used in this thesis were selected from. ..... 36 Figure 4.1 The relationship between soil pH sampled between 30-40cm and grain yield of Tamaroi (wheat). ...................................................................................................................... 40 Figure 4.2 Zeta potential of 0.1 molar sodium aluminate solution at varying pH. .................. 48 Figure 4.3 Chemical shift associated with tetrahedrally coordinated negatively charged Al species ...................................................................................................................................... 49 Figure 4.4 Chemical shift associated with octahedrally coordinated positively charged Al species. ..................................................................................................................................... 49 Figure 4.5. Percentage of Al in solution and zeta potential at varying pH. ............................. 50 Figure 4.6. Electrical conductivity of Al solution at varying pH. ........................................... 51 Figure 4.7 Summary of speciation of aluminium with varying pH. ........................................ 52 Figure 4.8/4.9/4.10 Effect of pH and Al on growth of SANTI variety field pea. .................... 56 Figure 4.11/4.12 Effect of pH and Al concentration on SARDI variety field pea. ................. 58 Figure 5.1 Mechanism for the sorption of carbonate to clay particles. .................................... 74 Figure 5.2 Relationship between pH and sorption of carbonate to a bentonite clay. .............. 75 Figure 5.3: Comparison of buffering intensity of carbonate and carbonate/bentonite solutions.................................................................................................................................................. 76 Figure 5.4 pH change for 6 alkaline soils when titrated with H+ ............................................. 77 Figure 6.1 Effect of varying concentrations of gypsum on soil pH after 12 weeks. ............... 94 Figure 6.2 and 6.3 Effect of varying plant types on soil pH after 12 weeks for Monarto and Minlaton soils........................................................................................................................... 97 Figure 6.4 Effect of plant roots (A) and plant roots + gypsum (B) on soil pH over time........ 97 Figure 6.5 Effect of varying concentrations of gypsum used in conjunction with plant roots on soil pH after 12 weeks......................................................................................................... 98 Figure 6.6 – 6.9 Effect of organic amendments on soil pH over time. .................................. 103

xii
Figure 6.10. Effect of manure and red worms on soil pH over time. .................................... 106 Figures 6.11 and 6:12 Photos showing distribution of organic matter through the soil by worms. .................................................................................................................................... 106 Figure 6.13 Decrease in average soil pH achieved via application of various ameliorants. .. 107

1
Chapter 1: Introduction
Alkaline soils make up one third of the world’s soils (Guerinot 2007) (Figure 1.1), much of
which is used for agricultural production. Nearly a quarter of Australia’s soils are alkaline,
(Northcote & Skene 1972), mostly located in the country’s southern regions.
Problems commonly associated with alkaline soils include poor soil structure, low water
infiltration capacity and nutrient deficiency (e.g. iron, phosphorus, manganese, boron).
Figure 1.1 Extent of the world’s alkaline soils (blue areas).
Alkaline soils are often further categorised as mildly alkaline (pH 7 - 8) and highly alkaline
(pH > 8.0)
NOTE: This figure is included on page 1 of the print copy of the thesis held in the University of Adelaide Library.

2
There is evidence to suggest aluminium (Al) may be phytotoxic in highly alkaline soils. Ma
et al (2003) found that at a pH greater than 9.0, Al was toxic to wheat plants grown in
solution cultures. Other studies have supported this finding (Kinraide 1991, Piha et al. 1995).
Aluminium is found in all soils (Rout et al. 2001) and makes up around 7% of the solid
matter in a typical soil (Lindsay 1979) so, if phytotoxic in alkaline soils, may seriously affect
agricultural production in Southern Australia and other alkaline regions of the world.
In acid soils, Al is known to be toxic to plants at concentrations as small as 2-3 ppm
(Balsberg Pahlsson 1990) and is a major factor affecting plant development for many
agricultural crops (Delhaize & Ryan 1995, Kochian 1995). Critically little research has been
done on Al phytotoxicity in alkaline soils as opposed to solution cultures. The phytotoxicity
of Al in alkaline soils then needs to be verified.
As there is no evidence that Al is phytotoxic at neutral pH, it is evident that it is the
speciation of Al at high pH that causes phytotoxicity. If the extent of Al phytotoxicity in
alkaline soils is to be assessed, the precise pH at which the phytotoxicity becomes debilitating
needs to be determined. An analysis of the charge and characteristics of aluminium in the
neutral to alkaline pH range will enable a causal link between aluminium speciation and Al
phytotoxicity to be established.
Given aluminium is indeed phytotoxic beyond a given level of alkalinity a potential method
of alleviating this and other toxicities associated with alkalinity is to lower soil pH to a level
where the Al species responsible no longer dominate. This requires an understanding of the
chemistry of alkaline soils, particularly the role carbonates play in causing and maintaining

3
high pH. The contribution of carbonate and bicarbonate to soil alkalinity and its sorption-to-
clay characteristics must be assessed so that the soils buffering capacity (the ability of soils to
resist change in pH) can be determined and explained.
Buffering intensity refers to the number of moles of proton charge that are complexed by a
soil when the soil’s pH decreases by one unit. While this had been studied in acidic soils,
little work has been carried out in the alkaline pH range. The alkaline buffering intensity of
alkaline agricultural soils from Southern Australia will be investigated so that the feasibility
of lowering soil pH as a means of ameliorating alkaline soils may be determined. Lowering
soil pH will also remove other agricultural productivity constraints such as alkaline toxicity
and nutrient deficiency.
Having established the alkaline buffering intensity of high pH soils, the most effective
method of lowering soil pH to below the critical pH level where Al and alkaline phytotoxicity
occurs must be determined. While a number of methods have been trialled, including
chemical and organic amendments (e.g. Tang & Yu 1999, Odell 2000, Walker et al. 2004)
and plant root exudates (Yan et al. 1996, Gahoonia 1993, Xu et al. 2002), the comparative
efficiency between the methods needs to be assessed.
Finally, an alternative means of remediating Al phytotoxicity may be to complex Al in
alkaline soils to a form that is no longer toxic and /or no longer available to crops. Therefore
the ease of complexing aluminium and any subsequent decrease in its availability to plants
will be assessed.

4
In summary then, this thesis seeks to:
� Verify Al phytotoxicity exists in alkaline soils as opposed to solution culture.
� Determine the pH where this phytotoxicity becomes critical.
� Gain an understanding of the nature and species of Al responsible for this
phytotoxicity.
Study the carbonate chemistry of typical agricultural alkaline soils in Southern Australia
and by doing so:
� Determine the alkaline buffering intensity of such soils, thereby determining the
feasibility of lowering soil pH as a means of ameliorating such soils.
� Compare the effectiveness of various methods of ameliorating alkaline soils.
It is hoped that the answers provided in this thesis will contribute to improved agricultural
productivity in the alkaline cropping regions of the world.

5
References
Balsberg Pahlsson, A. M. (1990) Influence of aluminium on biomass, nutrients, soluble
carbohydrates, and phenols in beech (Fagus sylvatica). Physiologia Plantarum, 78(1),
79-84.
Delhaize, E. & P. R. Ryan (1995) Aluminium toxicity and tolerance in plants. Plant
Physiology, 107, 315-321.
Gahoonia, T. S. (1993) Influence of root-induced pH on the solubility of soil aluminium in
the rhizosphere. Plant and Soil, 149, 289-281.
Guerinot, M. L. (2007) It's elementary: enhancing Fe3+ reduction improves rice yield.
Proceedings of the National Academy of Sciences, 104(18), 7311-7312.
Kinraide, T. B. (1991) Identity of the rhizotoxic aluminium species. Plant and Soil, 134, 167-
178.
Kochian, L. V. (1995) Cellular mechanisms of aluminium toxicity and resistance in plants.
Annual Review of Plant Physiology and Plant Molecular Biology, 46, 237-260.
Lindsay, W. L. (1979) Chemical equilibria in soils. Wiley-Interscience, New York.
Ma, G., P. Rengasamy & A. J. Rathgen (2003) Phytotoxicity of aluminium to wheat plants in
high-pH solutions. Australian Journal of Experimental Agriculture, 43, 497-501.

6
Northcote, K. H. & J. K. M. Skene (1972) Australian soils with saline and sodic properties.
CSIRO Soil Publication, 27.
Odell, S. P. (2000) Microbial reclamation of alkaline sodic soils. Department of Soil and
Water. University of Adelaide, Adelaide.
Piha, M. I., H. W. Vallack, B. M. Reeler & N. Michael (1995) A low input approach to
vegetation establishment on mine and coal ash wastes in semi-arid regions. I. tin mine
tailings in Zimbabwe. The Journal of Applied Ecology., 32(2), 372-381.
Rout, G. R., S. Samantaray & P. Das (2001) Aluminium toxicity in plants: a review.
Agronomie, 21, 3-21.
SAGE C.F.S.A.T.G.E. (2009) Atlas of the biosphere-pH [on line] University of Wisconson
http://www.sage.wisc.edu/atlas/maps/soilph/atl_soilph.jpg [accessed 05/11/2009].
Tang, C. & Q. Yu (1999) Impact of chemical composition of legume residues and initial soil
pH on pH change of a soil after residue incorporation. Plant and Soil, 215, 29-38.
Walker, D. J., M. Clemente & P. Bernal (2004) Contrasting effects of manure and compost
on soil pH, heavy metal availability and growth of Chenopodium album L. in a soil
contaminated by pyritic mine waste. Chemosphere, 57, 215-224.

7
Xu, R. K., D. R. Coventry, A. Farhoodi & J. E. Schultz (2002) Soil acidification as
influenced by crop rotations, stubble management, and application of nitrogenous
fertiliser, Tarlee, South Australia. Australian Journal of Soil Research., 40, 483-496.
Yan, F., S. Schubert & K. Mengal (1996) Soil pH increase due to biological decarboxylation
of organic anions. Soil Biology and Biochemistry, 28 17-24.

8
Chapter 2: Review of Literature
2.1 Alkalinity
2.1.1 Extent of alkaline soils.
Alkaline soils may be defined as those with a pH of more than 8.0. They make up one third
of the world’s soils (Guerinot 2007). In Australia, alkaline soils occupy 23.8% of the land
area (Northcote & Skene 1972) (Figure 2.1). In Southern Australia, approximately 8 million
hectares within the cropping zone are alkaline (Wilhelm & Hollaway 1998). Calcarosols,
vertosols and alkaline duplex soils are among the most common Australian alkaline soils and
represent the majority of soils used for grain production in Southern Australia (Bertrand et al.
2002). Over 80% of soils in the cereal zone in South Australia have a high pH, ranging
between 8.5 and 10.0 in subsoils (20-60cm depth) (Ma et al. 2003).
Figure 2.1 Extent of Australia’s alkaline soils.
NOTE: This figure is included on page 8 of the print copy of the thesis held in the University of Adelaide Library.

9
2.1.2 Determinants of alkalinity
Alkalinity refers to the concentration of hydroxide (OH-) ions in the soil. The hydroxide
producing anions in soil are usually carbonate and bicarbonate. Figure 2.2 shows a direct
relationship between carbonate/bicarbonate and hydroxide ion concentration, while proton
(H+) concentration is inversely related to carbonate/bicarbonate concentration. The carbonate
comes from the dissolution of minerals such as calcite, dolomite and ankerite.
The reactions are:
Calcite (Stumm 1992):
CaCO3 + H+ � Ca2+ + HCO3-
Dolomite (Sherman & Barak 2000):
CaMg(CO3)2 + 2H+ � 2HCO3- + Ca2+ + Mg2+
Ankerite (Balistrieri et al. 1999):
Ca (Fe0.61, Mg0.24, Mn0.093) (CO3)2 + 2H+ � Ca2+ +0.61Fe2+ +0.24Mg2+ +0.093Mn2+ +
2HCO3-
Figure 2.2 Relationship between carbonate/bicarbonate and proton/hydroxide concentrations (Brady and Weil 1999).

10
In regions where precipitation is less than evapotranspiration, leaching may not occur and
cations (especially sodium and calcium) released by mineral weathering accumulate.
Carbonate reacts with these salts to form sodium carbonate or calcium carbonate which
dissociates in water to form carbonic acid e.g.:
Na2CO3 + 2H2O � 2Na + + 2OH- + H2CO3
The carbonic acid, (H2CO3), is unstable and produces water and carbon dioxide:
H2CO3 � H2O + CO2
The net reaction is:
Na2CO3 + H2O � 2Na + + 2OH- + CO2
Thus the OH- anions are responsible for the high alkalinity.
Because sodium carbonates and bicarbonates are more water soluble than calcium carbonates,
more hydroxyl ions are produced by them and a higher pH results (Brady & Weil 1999).
Whereas calcium carbonate-dominated soils typically have a pH of around 8.3, association
between sodium and carbonate species can result in a higher pH (10 or more).
Alkalinity then is a function of soil carbonate levels; specifically:
Alkalinity = [HCO3-] + 2[CO3
2-] + [OH-] – [H+] (Sposito 1989)
The carbonate is multiplied by a factor of two because one mole of carbonate neutralises two
moles of H+.
Phosphates, borates and some organic molecules can also contribute to high soil pH.
2.1.3 Carbonate species and pH
Figure 2.3 shows the distribution of carbonate species as a fraction of total dissolved
carbonate in relation to solution pH (assuming an external (to the carbonate system) control
on pH). At pH 8.3 and higher, the proportion of bicarbonate (HCO3-) begins to decrease as it
is converted to carbonate: HCO3- + OH- � CO3
2- + H2O

11
Figure 2.3 Relative proportions of carbonate species with changing pH (Lindsay 1979a).
Whereas bicarbonate exists in solution up to and beyond a pH of 12, the relative proportion in
solution decreases as carbonate formation occurs at a rate 10 times faster than bicarbonate per
unit increase in pH (Lindsay 1979a). This is illustrated by the steeper slope of the carbonate
line compared to that of the bicarbonate line in Figure 2.4. At a pH of 10.3, the molar ratio of
carbonate to bicarbonate is equal. Beyond pH 10.3, carbonate becomes the dominant carbon
species.
Figure 2.4 Increase in carbonate and bicarbonate with increasing pH (Lindsay 1979a).
Mole fraction of total carbonate
pH

12
2.1.4 Agriculture and alkaline soils - phytotoxicity
Alkaline soils typically have poor soil structure and low water infiltration capacity. Nutrient
deficiency is a problem commonly associated with alkaline soils. High calcium carbonate
levels may fix micronutrient cations and the high pH reduces micronutrient solubility in
many cases (Rashid & Ryan 2004).
Low iron availability is common in alkaline calcareous soils and its deficiency is
characterised by intervenal chlorosis and light green or yellow colouration. Phosphorus
deficiency, caused by the formation of calcium and magnesium phosphates may result in
reduced growth rate and light green or purplish colouration (Maynard 1979). Manganese
deficiency results in severe disruption of chloroplast structure and the development of
chlorosis. Zinc deficiency is characterised by shortened internodes and chlorosis. Adsorption
of boron to soil colloids in alkaline soils leads to low boron availability, expressed as a
necrosis of young expanding leaves followed by death of the entire growing point (Maynard
1979); conversely, high levels of molybdenum in alkaline soils may result in toxicity to both
plants and grazing animals (Brady & Weil 1999).
2.1.5 A new constraint in alkaline soils? Aluminium phytotoxicity.
Recent surveys on wheat growing in Southern Australian soils with high pH have shown
higher-than-usual concentration of aluminium in the wheat grains. There is a need to
determine if aluminium phytotoxicity may also occur in alkaline soils.
2.2 Aluminium phytotoxicity
2.2.1 Aluminium in soils
Aluminium (Al), the most abundant metal and the third most common element in the Earth’s
crust (Kinraide 1991, Kochian 1995, Ma et al. 2003) is present in all soils (Rout et al. 2001).
It makes up approximately 7.1% of the solid matter in an average soil (Lindsay 1979b).
Scientists have been aware that Al ions are potentially toxic to plant roots since the early
twentieth century (Andersson 1988). Aluminium becomes toxic to many plants at
concentrations greater than 2-3 parts per million in acidic soils (Balsberg Pahlsson 1990),
13
therefore the potential for soils to be Al-toxic is considerable (Delhaize & Ryan 1995). Al
toxicity is a recognised widespread problem in biology (Hodson and Evens 1995).
2.2.2 Traditional paradigm of Al toxicity
Historically, Al toxicity research has focused on acidic soil conditions. Kochian (1995) after
an extensive review of literature on Al phytotoxicity states that Al toxicity is the major factor
limiting crop productivity on acid soils and Delhaize and Ryan (1995), after a similar review,
state that solubilisation of Al is enhanced by low pH and Al toxicity is a major factor limiting
plant production in acid soils. Text books have supported this view, with many featuring
diagrams displaying Al in soil solution only at low pH values. However, there is growing
dissent with this paradigm.
2.2.3 Al toxicity in high pH soils
In response to the above mentioned field survey (Section 2.1.5), Ma et al (2003) conducted
experiments to assess the phytotoxicity of Al to wheat varieties at high pH in solution
cultures with pH maintained at about 9.2. They found that the anionic form of Al present in
alkaline solutions at pH > 9.0 was toxic to wheat plants even at concentrations as low as
1mg/litre, significantly reducing root growth compared with alkaline medium without Al.
The reduction in root growth in alkaline solutions without added Al was also significant when
compared to deionised water i.e. Al toxicity compounded the toxic effects of alkalinity.
The literature shows that there is precedent for these observations although they have not
been widely appreciated. As far back as the 1920’s, Magistad (1925) showed that Al could be
absorbed by plants at pH values above 7.5 and in the 1950’s, Rees and Sidrak (1955) found
high levels of Al accumulated in plants growing on fly ash at a field pH of between 8.5 and
9.0. Jones (1961) showed that mobile aluminium is present in fly ash at high pH values and
that it is available to plants grown in the ash.
More recently, Kinraide (1991) conducted experiments on wheat and red clover in aerated
aluminate solutions at pH 8.0 to 8.9 and concluded that cationic polynuclear Al13 species
were responsible for toxic effects. Piha et al (1995) were involved in trying to establish
vegetation on mine and coal ash wastes in semi-arid regions. Their chemical analysis

14
suggested that high pH and high concentrations of soluble aluminium may have been
adversely affecting plant growth (pH 8.6, Al concentration 43.8 ug g-1).
Critically, little research has been conducted in actual alkaline soils (as opposed to solution
cultures) under controlled conditions. Al toxicity under such conditions needs to be verified.
2.2.4 Sources and speciation of aluminium in soils.
Aluminium is released into soil solution from Al-containing minerals. Mineral forms of Al
that may exist in soils include hydrous oxides, alumino silicates, sulfates and phosphates.
Hydrogen ions in soil may react with aluminium containing solid-phase compounds releasing
equivalent amounts of Al ions (Zhang & Yu 1997). Minerals important for the release of Al
include: gibbsite, amorphous Al(OH)3 , kaolinite, illite and smectite. For example;
Gibbsite
Al(OH)3 + 3H+ � Al3+ + 3H2O
Amorphous Aluminium
Al(OH)3 + 3H+ � Al3+ + 3H2O
Kaolinite
Al2Si2O5(OH)4 + 6H+ � 2Al3+ + 2H4SiO4 + H2O
Illite
K0.6Mg0.25Al2.3Si3.5O10(OH)2 +8H+ +H2O �0.6K+ +0.25Mg2+ +2.3Al3+ +3.5H4SiO4
(Zhang & Yu 1997)
It is soil pH that determines the relative contributions of minerals to Al release. For example,
in a system where all of the above minerals coexist, illite may control Al concentration in
solution at a pH higher than 4.5 and amorphous aluminium hydroxide may dominate
aluminium release at a pH less than 4.5 (Zhang & Yu 1997).

15
The rate of Al release is enhanced by adsorption of ions that react with only one metal centre
in the crystal lattice (Stumm & Wieland 1990) and retarded by surface complexation of
soluble ions that react with more than one metal centre or by precipitation coating the surface
and blocking potential dissolution sites (Furrer 1993). Aggregation of clay particles can also
slow down dissolution rates because H+ ions have to diffuse through an aggregate before
being adsorbed at a soil reactive site.
Mineralogical composition is a major influence on rates of ion exchange. Exchange is rapid
onto external surface sites or internal sites of highly expanded 2:1 layer silicates, but slow
when access to internal sites is hindered by ion swelling or by the presence of selectively
absorbed cations (Sparks 1989).
2.2.5 Aluminium speciation
2.2.5.1 Aluminium speciation and pH.
Soil pH largely determines the species of Al available to a plant. Once released from
minerals, the actual Al species present is determined by hydrolysis reactions between water
and the aluminium ions. For example, at pH 5:
Al3+ + H2O � Al(OH)2+ + H+
Subsequent species of aluminium in solution (and hence available to plants) are determined
by the pH of the soil. If soil pH increases, that is more hydroxide ions are added, new Al
species are formed.
Al(OH)2+ + (OH)- � Al(OH)3
In alkaline conditions, negatively charged aluminate forms.
Al(OH)3 + (OH)- � Al(OH)4-
It is these negatively charged Al species that are likely to be responsible for phytotoxicity in
high pH soils. There is some uncertainty as to what specific species of negatively charged
aluminium is responsible for this toxicity.

16
Figure 2.5 shows the calculated theoretical relative abundance of Al species as pH changes.
Figure 2.5 Relative activity of Al species with changing pH (Marion et al. 1976).
2.2.6 Polymer species
Hydrolysis in solutions of high aluminium concentrations may generate polymeric Al forms.
There are competing theories as to how Al polymers are formed. One argument is that
polymeric forms are built up from single ring [Al6(OH)12(H2O)12]6+ or double ring
[Al10(OH)22(H2O)16]8+ species. These polynuclear units coalesce with aging via deprotonation
of edge group water molecules with the subsequent formation of double hydroxide bridges
between units (Bertsch 1989).
Concentration of polynuclear species can increase in acidic conditions or decrease in basic
solutions ((Bertsch 1989, Parker et al. 1989, Kinraide & Parker 1990). Neutralisation in soil
environments may be caused by physical, chemical or microbial processes such as degassing
of CO2, weathering of carbonates and other minerals or by biomass decomposition. If a soil
solution is partially neutralized more than half of the initially monomeric Al3+ is transformed
to an Al polymer. It is thought that Al(OH)4- is a required precursor to Al13 polymer
formation. Al13 consists of a highly symmetrical tetrahedrally coordinated aluminium
centralised in a cage-like structure composed of 12 octahedrally coordinated aluminium
NOTE: This figure is included on page 16 of the print copy of the thesis held in the University of Adelaide Library.

17
atoms. The Al13 polymer forms when Al(OH)4- interacts with 12 octahedrally coordinated
aluminium ions (Furrer 1993). At high pH uncertainty exists as to whether Al(OH)4- or an
anionic polymeric species is responsible for Al phytotoxicity.
2.2.7 Entry of aluminium into the plant.
Plant root cells are most susceptible to damage from Al toxicity compared to plant stems
(Rincon & Gonzales 1992, Wagatsuma et al. 1987). The root apex (root cap, meristem and
elongation zone) accumulates more Al than the mature root tissues. When aluminium is
selectively applied to the elongation zone or to all the root except the apex, growth is
unaffected (Ryan et al 1993). Only the terminal 2 – 3 millimetres of a root need be exposed
to aluminium to cause inhibition of root growth. Entry of aluminium into the plant would
seem to occur in this area.
2.2.7.1 Mechanisms of aluminium phytotoxicity.
Research has focused on whether the primary site for Al toxicity is the symplasm (the inner
side of the plasma membrane; the collection of all interconnected cytoplasm and nuclei of a
cell) or apoplasm (the free diffusional space outside the plasma membrane).
2.2.7.2 Phytotoxicity in the apoplasm
Aluminium has easy and rapid access to the apoplasm. It is estimated that 45 -75% of Al may
be apoplasmically located after three hours exposure (Taylor 1988). Resultant potentially
harmful interactions include: binding to pectic residues or proteins in the cell wall, decreased
hydraulic conductivity, displacement of other ions from critical sites on the cell wall or
membrane and binding to the lipid bi-layer or membrane-bound proteins to inhibit nutrient
transport or disrupt intracellular metabolism from the apoplasm by triggering secondary
messenger pathways (Haug et al. 1994, Haug 1984, Taylor 1988, Bennet & Breen 1991,
Rengel 1992).
2.2.7.3 Phytotoxicity in the symplasm
Half or more of the Al present in the root apex may be located in the symplasm. For example,
Tice et al (1992) found 50 to 70% of Al was estimated to be in the root apical symplasm of
wheat after two days growth in aluminium. Possible methods of aluminium transport across

18
the plasma membrane and into the symplasm include endocytosis and utilisation of
magnesium cation channels or Fe3+ transport systems (Delhaize & Ryan 1995).
Further evidence for rapid Al uptake into the root apical symplasm comes from work on
soybean roots (Lazof et al. 1994) using secondary ion mass spectrometry. After 30 minutes
exposure to a solution containing 38µM Al3+, aluminium was found in the symplasm of the
outer three layers of cells in the root apex.
Aluminium is thought to damage components of the symplasm due to its high binding affinity
for many metabolically important molecules. The primary cause of the toxicity results from
the formation of an Al-ligand complex. Either Al inhibits the vital function of the ligand that
binds it or the Al-ligand complex itself poisons other metabolic processes (Delhaize & Ryan
1995).
There is no consensus on the cellular site of Al toxicity (Kochian 1995), and the mechanism
behind it remains open to investigation because there is an inability to resolve the symplastic
and apoplasmic fractions of Al (Delhaize & Ryan 1995).
2.2.8 Symptoms of aluminium toxicity
Al phytotoxicity symptoms include: overall stunting, small dark green leaves, late maturity,
purpling of stems, leaves and leaf veins and yellowing and death of leaf tips, curling or
rolling of young leaves and collapse of growing points or petioles. Roots are
characteristically stubby and brittle. Root tips and lateral roots become thickened and turn
brown. The root system as a whole becomes corraloid in appearance with many stubby lateral
roots but lacks fine branching (Foy et al. 1978).

19
2.3 Ameliorating aluminium phytotoxicity in alkaline soils
2.3.1 Methods of amelioration
There are two broad approaches to ameliorating Al phytotoxicity.
1. Lower soil pH to a level where phytotoxic species of Al are no longer prevalent.
2. Formation of Al complexes so that Al is no longer in a form accessible by the plant.
However lowering soil pH necessitates an understanding of an alkaline soil’s response to the
addition of acid.
2.3.2 Alkaline buffering intensity
Addition of an acid to a calcareous soil will not linearly lower soil pH because protons added
to the system react with carbonates e.g.
CaCO3 � Ca2+ + CO32-
CO32- + H+ � HCO3
-
The carbonate acts as a sink for H+ ions, buffering against pH change.
Proton exchange reactions with soil components and their relation to soil pH are described by
the soil’s alkaline buffering intensity and acid neutralising capacity (ANC). A soil’s alkaline
buffering intensity can be expressed as the number of moles of proton charge that are
complexed by a soil when the soil’s pH decreases by one unit. This is the converse of the
soil’s acid buffering intensity (Sposito 1989). While the buffering intensity of acid soils has
been researched thoroughly, the corresponding buffering intensity of alkaline soils and its
relationship with carbonate quantity and species have not been studied in detail.
A soil’s ANC is defined as the base equivalence less the strong acid equivalence of a system
or alternatively as the amount of strong acid required to reduce the pH of a system to a
reference pH value (Van Breemen et al. 1983).

20
It may be represented as:
ANC = [HCO3-] + 2[CO3
2-] + [OH-] – [H+]
which is also equivalent to soil alkalinity (Sposito 1989).
The reference value is determined according to the characteristics of the soil of interest.
Factors affecting the ANC of soils will be further explored in Chapter Five.
2.3.3 Lowering soil pH
2.3.3.1 Chemically lowering soil pH
Some fertilizers, particularly those containing ammonium sulfate, urea or ammonium nitrate,
are known to acidify soils via the process of ammonification. Organic nitrogen compounds
are hydrolysed to yield NH4+ ions. The ammonium is further processed to yield H+ ions:
2NH4+ + 3O2----- bacteria-------> 2NO2
- + 2H2O + 4H+
Oxidation of ammoniacal fertilizers can generate two net moles of H+ for every mole of
nitrogen (Bolan et al. 1991). However, in a closed system no net generation of H+ ions
occurs. Protons generated are neutralised in reduction reactions and synthesis reactions by
plants. Continual addition of fertilisers is needed if low pH soils are to be maintained.
The addition of elemental sulphur can lower soil pH. Sulphuric acid forms when elemental
sulphur is added to the soil. The process of sulphur oxidation (conversion of elemental
sulphur to sulfate) is the result of microbial activity:
CO2 + S + 0.5O2 + 2H2O-----bacteria--------> CH2O + SO42-
+ 2H+.
Although sulphur is the most efficient of widely used pH-reducing chemicals (five times
more efficient than gypsum), large quantities are still needed. For example, to change soil pH
from 8.5 to 6.5 in non-calcareous clay top soil, 1,660 kg of sulphur per hectare is required. In
calcareous soils, required amounts are even greater. For a soil containing 2% calcium
carbonate, 45 tons of sulphur are needed per hectare simply to neutralise the carbonate before
additional sulphur is added to lower soil pH (Mullen et al. 2007).

21
More economic solutions than sulphur or gypsum to lowering soil pH must be investigated.
One possibility is the use of organic matter.
2.3.3.2 Organically lowering soil pH
Soil organic matter mineralisation may result in the formation of organic and inorganic acids
that provide H+ to the soil, thus lowering pH. However, results are not conclusive; different
types of organic matter increase, decrease or have no effect on soil pH (Pocknee & Sumner
1997). Clearly, the mechanisms by which organic matter affects soil pH is not well
understood (Tang & Yu 1999).
Soil properties such as moisture content, texture, initial soil pH, available nitrogen and
organic matter concentration have significant impacts on the decomposition of organic matter
and thus on soil pH changes (Jarvis et al. 1996). Initial pH is the most important of these
attributes; low pH decreases microbial activity and decomposition of organic matter
(Motavalli et al. 1995). Nitrification - an acid producing process - is sensitive to low pH. Soil
pH may also greatly affect association and dissociation of organic compounds released from
plant materials thereby influencing soil pH change (Ritchie & Dolling 1985).
The complexity of the issue is further illustrated in a study by Tang and Yu (1999) who
examined the effect of addition of wheat straw and legume residues on soil pH. They showed
that application of plant materials significantly changed soil pH within 100 days of
incubation, however the direction and extent of soil pH change was dependant on the
characteristics of both plant material and soils. Concentration of organic anions and nitrogen
in plant materials and the initial pH of the soils were again the major factors affecting the
extent of change in soil pH.
If organic material is to be used to lower soil pH, careful attention needs to be paid to the
above factors if the desired goal is to be achieved.

22
2.3.3.3 Micro-organisms and soil pH
A potential remediation method for alkaline soils involves the stimulation of microbial
activity to produce acid. For example, glucose treatment of soil at a rate of 2 or 4% and
watered to a 60% moisture content, may lead to the production of acetic acid and butyric
acid by stimulating the activity of Clostridium spp (Odell 2000). The use of glucose to
stimulate microbial activity is not feasible on a commercial scale, however alternative
nutrient sources for microbes may exist. For example, Kandeler and Gerfried (1993) showed
that incorporation of organic material, (cattle slurry), into soil promotes microbial growth
with a consequent increase in enzyme activity. More research on stimulating microbial
populations could lead to an economically viable solution.
2.3.3.4 Plant roots and soil pH
Roots can induce pH changes at the root-soil interface. Soil pH near the root surface can
differ considerably from the soil a few millimetres away from the root surface (Nye 1981).
pH changes in the rhizosphere are caused by unequal net uptake of cation and anion
equivalents (Breteler 1973, Hedley et al. 1982). Such root induced pH change depends on
nitrogen sources (Gahoonia & Nielsen 1992), plant species (Marschner & Romheld 1983)
initial soil pH and the pH buffering capacity of the soils (Nye 1981).
In general, NH4-N application to plants decreases rhizosphere soil pH. In a treatment by
Gahoonia (1993), the soil pH near the roots of NH4-N treated plants decreased from 6.8 to
4.4. NH4-N treatment increased the sum of cations over anions absorbed by the plants
resulting in the release of H+ ions in the rhizosphere to maintain electric neutrality across the
boundary between soil and roots. The soil acidification effect stopped beyond 1.5mm from
the root. Gahoonia and Nelson (1992) expanded this result by adjusting pH by varying the
percentage of total N supplied as NH4-N (15, 6 or 0). NH4-N0 increased pH, NH4-N6 had little
effect but NH4-N15 decreased soil pH. At about 1.65mm the effect disappeared i.e. the pH
change was again strongly localized around the root.
In addition to H+ ions, roots may exude organic acids such as citric acid, oxalic acid and
tartaric acid (Hoffland et al. 1989, Parfitt 1979). A study by Hue et al (1986) showed citric
acid was most effective in alleviating toxic Al effects.

23
There is clearly a need to compare the effectiveness of the above methods in order to develop
an efficient method of lowering soil pH.
The formation of Al complexes in order to alleviate Al phytotoxicity is an alternative method
worthy of further research.
2.3.4 Al complexion methods
Stevenson and Vance (1989) identified two classes of organic compounds that form stable
complexes with Al:
1. Humic and fulvic acids.
2. Biochemical compounds synthesised by living organisms
Al complexation occurs predominantly with organic groups containing oxygen; those
containing nitrogen generally form weak interactions.
Humic substances (organic matter derived from the partial decomposition of plant and animal
remains) are able to form complexes with Al because of their unusually high number of
oxygen-containing functional groups (including COOH, phenolic- , enolic-, and aliphatic-OH
groups (Stevenson and Vance 1989). Complexion occurs at a large number of reaction sites
with binding affinity that ranges from weak ionic to formation of stable coordinate linkages
(Stevenson & Vance 1989). Coordinate linkages and ring complexes form the strongest
complexes. The main reaction for the binding of metal ions by humic substances is at a
COOH-phenolic site or adjacent COOH group (Schnitzer & Khan 1972) (Figure 2.6).
Figure 2.6 Typical binding sites for aluminium ions (Stevenson and Vance 1989).

24
When monomeric Al becomes bound to soluble humic material it may no longer be toxic to
plants. For example, Tan and Binger (1986) added humic acid at 100-350 mg kg-1
concentration and succeeded in ameliorating the negative effect of increasing Al
concentrations on maize plants.
Harper (1995) found that when fulvic acid was added to soil solution, Al was almost entirely
complexed and virtually no monomeric Al was detectable. Hue (1986) showed that soluble
organic acids (e.g. formic, acetic, lactic, oxalic and citric) at 5 – 50µM concentrations were
effective at detoxifying Al, with citric, oxalic and tartaric being the most effective. However,
the acids are highly susceptible to microbial degradation and hence need to be constantly
applied to ensure complexion of soluble aluminium.
A positive relationship between Al tolerance and organic acid efflux has been reported for
several plant species (Delhaize et al. 1993, Basu et al. 1994, Ryan et al. 1995, Pellet et al.
1996). For example, Jones (1961) showed that malate from root macerate was able to chelate
Al. Silvia et al (2001) determined that differential tolerance of soybean genotypes to Al was
associated with sustaining high rates of citrate release into the external solution and high
levels of citrate in the root tip over time. The Al tolerance was attributed to external
formation of Al citrate complexes. Similarly, root tips of Al tolerant wheat genotypes are able
to excrete malate shortly after exposure to Al, and a positive correlation was found between
malate efflux and relative root elongation of 36 wheat genotypes with a wide range of
tolerance to Al (Delhaize & Ryan 1995, Ryan et al. 1995).
Green manures and animal wastes have also been used to effectively reduce Al concentration
in solution due to complexation of the Al (Hue et al. 1986).
2.4 Further research
This review has highlighted significant gaps in our understanding of plant/aluminium
interactions in alkaline soils. Specific issues that need to be addressed include:
� Confirmation that aluminium is phytotoxic in high pH soils. Much of the work in this
area has been performed in solutions and there is a need to verify that Al
phytotoxicity does indeed occur in alkaline soils.

25
� Determine the precise pH where this phytotoxicity is expressed, that is, affects the
development of plants to the extent that agricultural production is constrained.
� Determine if speciation of Al at high pH is responsible for this toxicity.
� Analysis of the causes of alkalinity, carbonate composition of alkaline soils and an
alkaline soil’s innate ability to buffer against acid induced pH change. Assessment of
the soils buffering intensity is needed to determine if using acid to lower soil pH as a
means of negating Al phytotoxicity is feasible.
� Determination of the effectiveness of alternate means of ameliorating alkaline soils by
lowering soil pH i.e. chemical vs. organic additives vs. plant root exudates.
� Verify complexation of Al at high pH as a potential means of ameliorating Al
phytotoxicity in alkaline soils.
It is hoped that by answering the above this study will allow for improved agricultural
production in alkaline soils.

26
2.5 References
Andersson, M. (1988) Toxicity and tolerance of aluminium in vascular plants. Water, Air and
Soil Pollution, 39, 439-462.
ASRIS (2008) National Land and Water Resources audit 2001.
http://www.sardi.sa.gov.au/_data/assets/pdf_file/0016/45025/00609_bcg_fact_sheet.pdf
[accessed 07/06/2010]
Balistrieri, L.S., Box, S.E., Bookstrom, A.A. Ikramuddin, M. (1999) assessing the influence
of reacting pyrite and carbonate minerals on the geochemistry of drainage in the
Coeur d’Alene mining district. Enviromental Science & Technology. 33 3347-3353
Balsberg Pahlsson, A. M. (1990) Influence of aluminium on biomass, nutrients, soluble
carbohydrates, and phenols in beech (Fagus sylvatica). Physiologia Plantarum, 78(1),
79-84.
Basu, U., D. Godbold & G. J. Taylor (1994) Aluminium resistance in Triticum aestivum
associated with enhanced exudation of malate. Journal of plant physiology, 144, 747-
753.
Bennet, R. J. & C. M. Breen (1991) The aluminium signal: New dimensions to mechanisms
of aluminium tolerance. Plant and Soil, 134, 153 - 166.

27
Bertrand, I., L. J. Janik, R. E. Holloway, R. D. Armstrong & M. J. McLaughlin (2002) The
rapid assessment of concentrations and solid phase associations of macro- and
micronutrients in alkaline soils by mid-infrared diffuse reflectance spectroscopy.
CSIRO Publishing.
Bertsch, P. M. (1989) Aqueous Polynuclear Aluminium Species. In G. Sposito (ed.), The
Environmental Chemistry of Aluminium. CRC Press, Boca Raton, Florida.
Bolan, N. S., M. J. Hedley & R. E. White (1991) Processes of soil acidification during
nitrogen cycling with emphasis on legume based pastures. Plant and Soil, 134, 53-63.
Brady, N. C. & R. R. Weil (1999) Soils of dryland regions: alkalinity, salinity & sodicity The
nature and property of soils. Prentice Hall, Upper Saddle Hall, NJ.
Breteler, H. (1973) A comparison between ammonium and nitrate nutrition of young sugar-
beet plants grown in nutrient solutions at constant acidity. I. Production of dry matter,
ionic balance and chemical composition. Netherlands Journal of Agricultural Science,
21, 227-244.
Delhaize, E. & P. R. Ryan (1995) Aluminium toxicity and tolerance in plants. Plant
Physiology, 107, 315-321.
Delhaize, E., P. R. Ryan & P. J. Randall (1993) Aluminium tolerance in wheat (Triticum
aestivum L.) II. Aluminium -stimulated excretion of malic acid from root apices.
Plant Physiology, 103, 695-702.

28
Foy, C. D., R. L. Chaney & M. C. White (1978) The physiology of metal toxicity in plants.
Annual review of plant physiology, 29, 511-566.
Furrer, G. (1993) New aspects on the chemistry of aluminium in soils. Aquatic Sciences,
55(4), 281-290.
Gahoonia, T. S. (1993) Influence of root-induced pH on the solubility of soil aluminium in
the rhizosphere. Plant and Soil, 149, 289-281.
Gahoonia, T. S. & N. E. Nielsen (1992) Control of pH at the soil-root interface. Plant and
Soil, 140, 49-54.
Guerinot, M. L. (2007) It's elementary: enhancing Fe3+ reduction improves rice yield.
Proceedings of the National Academy of Sciences, 104(18), 7311-7312.
Harper, S. M., D. G. Edwards, G. L. Kerven & C. J. Asher (1995) Effects of organic acid
fractions extracted from Eucalyptus camaldulensis leaves on root elongation of maize
(Zea mays) in the presence and absence of aluminium. Plant Soil, 68, 289-308.
Haug, A., B. Shi & V. Vitorello (1994) Aluminium interactions with phosphoinositide-
associated signal transduction. Archives of toxicology, 68, 1-7.
Haug, A. R. (1984) Molecular aspects of aluminium toxicity. CRC Critical reviews in plant
sciences, 1, 345 - 373.

29
Hedley, M. J., P. H. Nye & R. E. White (1982) Plant-induced changes in the rhizosphere of
rape (Brassica napus var. Emerald) seedlings. II Origin of the pH change. New
Phytologist, 91, 31-44.
Hodson, M.J., Evan, D.E. (1995) Aluminium/silicon interactions in higher plants. Journal of
Experimental Botany. 46 (283) 161-171.
Hoffland, E., G. R. Findenegg & J. A. Nelemans (1989) Solubilization of rock phosphate by
rape. II Local root exudation of organic acids as a response to P-starvation. Plant and
Soil, 113, 161-165.
Hue, N. V., G. R. Craddock & F. Adams (1986) Effect of organic acids on aluminum toxicity
in subsoils. Soil Science of America Journal, 50, 28-34.
Jarvis, S. C., E. A. Stockdale, M. A. Shepherd & D. S. Powlson (1996) Nitrogen
mineralisation in temperate agricultural soils: Processes and measurements. Advances
in Agronomy, 57, 187-235.
Jones, L. H. (1961) Aluminium uptake and toxicity in plants. Plant and Soil, 9(4), 297-310.
Kandeler, E. & E. Gerfried (1993) Effect of cattle slurry in grassland on microbial biomass
and on activities of various enzymes. Biology and Fertility of Soils, 16, 249-254.

30
Kinraide, T. B. (1991) Identity of the rhizotoxic aluminium species. Plant and Soil, 134, 167-
178.
Kinraide, T. B. & D. R. Parker (1990) Apparent phytotoxicity of mononuclear hydroxy-
aluminium to four dicotyledonous species. Physiologia Plantarum, 79, 283-288.
Kochian, L. V. (1995) Cellular mechanisms of aluminium toxicity and resistance in plants.
Annual Review of Plant Physiology and Plant Molecular Biology, 46, 237-260.
Lazof, D. B., J. G. Goldsmith, T. W. Rufty & R. W. Linton (1994) Rapid uptake of
aluminium into cells of intact soybean root tips. A microanalytical study using
secondary ion mass spectrometry. Plant Physiology, 106, 1107-1114.
Lindsay, W. L. (1979a) Carbonate equilibria. Chemical equilibria in soils. Wiley, New York.
Lindsay, W. L. (1979b) Chemical equilibria in soils. Wiley-Interscience, New York.
Ma, G., P. Rengasamy & A. J. Rathgen (2003) Phytotoxicity of aluminium to wheat plants in
high-pH solutions. Australian Journal of Experimental Agriculture, 43, 497-501.
Magisted, O. C. (1925) The aluminium content of the soil solution and its relation to soil
reaction and plant growth. Soil Science, 20(181).
Marion, G. M., D. M. Hendricks, G. R. Dutt & W. H. Fuller (1976) Aluminium and silica
solubility in soils. Soil Science, 127, 76-85.

31
Marschner, H. & V. Romheld (1983) In vivo measurements of root-induced pH changes at
the soil-root interface. Z Pflanzenphysiol., 111, 241-251.
Maynard, D. N. (1979) Nutritional disorders of vegetable crops: a review. Journal of Plant
Nutrition, 1(1), 1-23.
Motavalli, P. P., C. A. Palm, W. J. Parton, E. T. Elliot & S. D. Frey (1995) Soil pH and
organic C dynamics in tropical forest soils: Evidence from laboratory and simulation
studies. Soil Biology and Biochemistry, 27, 1589-1599.
Mullen, R., E. Lentz & M. Watson (2007) Soil acidification: how to lower soil pH [online].
The Ohio State University.
Northcote, K. H. & J. K. M. Skene (1972) Australian soils with saline and sodic properties.
CSIRO Soil Publication, 27.
Nye, P. H. (1981) pH changes across the rhizosphere induced by roots. Plant and Soil, 61, 7-
26.
Odell, S. P. (2000) Microbial reclamation of alkaline sodic soils. Department of Soil and
Water. University of Adelaide, Adelaide.
Parfitt, R. L. (1979) The availability of P from phosphate-goethite bridging complexes.
Desorption and uptake by ryegrass. Plant and Soil, 53, 55-65.

32
Parker, D. R., T. B. Kinraide & L. W. Zelazny (1989) On the phytotoxicity of polynuclear
hydroxy-aluminium complexes. Soil Science Society of America journal, 53, 789-786.
Pellet, D. M., L. A. Papernik & L. V. Kochian (1996) Multiple aluminium-resistance
mechanisms in wheat - Roles of root apical phosphate and malate exudation. Plant
Physiology, 112, 591-597.
Piha, M. I., H. W. Vallack, B. M. Reeler & N. Michael (1995) A low input approach to
vegetation establishment on mine and coal ash wastes in semi-arid regions. I. tin mine
tailings in Zimbabwe. The Journal of Applied Ecology., 32(2), 372-381.
Pocknee, S. & M. E. Summer (1997) Carbon and nitrogen contents of organic matter
determine its soil liming potential. Soil Science Society of America journal, 61, 86-92.
Rashid, A. & J. Ryan (2004) Micronutrient constraints to crop production in soils with
medeterranean-type characteristics: a review. Journal of Plant Nutrition, 27(6), 959-
975.
Rees, W. J. & G. H. Sidrak (1955) Plant growth on fly-ash. Nature, 176(352).
Rengel, Z. (1992) The role of calcium in salt toxicity. Plant, Cell and Environment., 15(6),
625 - 632.

33
Rincon, M. & R. A. Gonzales (1992) Aluminium partitioning in intact roots of aluminium-
tolerant and aluminium-sensitive wheat (Triticum aestivum L.) cultivars. Plant
Physiology, 99, 1021 -1028.
Ritchie, G. S. P. & P. J. Dolling (1985) The role of organic matter in soil acidification.
Australian Journal of Soil Research, 23, 569-576.
Rout, G. R., S. Samantaray & P. Das (2001) Aluminium toxicity in plants: a review.
Agronomie, 21, 3-21.
Ryan, P. R., E. Delhaize & P. J. Randall (1995) Characterisation of Al-stimulated malate
efflux from roor apices of Al-tolerant genotypes of wheat. Planta, 196, 103-110.
Schnitzer, M. & S. U. Khan (1972) Humic substances in the environment
Marcel Dekker, New York.
Sherman, L.A. & Barak, P. (2000) Solubility and dissolution kinetics of dolomite in Ca-Mg-
HCO3/CO3 solutions at 250C and 0.1 MPa carbon dioxide. Soil Science Society of
America journal. 64 1959-1968.
Silva, I. R., T. J. Smyth, C. D. Raper, T. E. Carter & T. W. Rufty (2001) Differential
aluminium tolerance in soybean: An evaluation of the role of organic acids.
Physiologia Plantarum, 112, 200-210.
Sparks, D. L. (1989) Kinetics of Soil Processes. Academic Press, San Diego.
34
Sposito, G. (1989) Soil acidity. The chemistry of soils. Oxford university press, Oxford.
Stevenson, F. J. & G. F. Vance (1989) Naturally occuring aluminium -organic complexes. In
G. Sposito (ed.), The environmental chemistry of aluminium. CRC Press, Boca Raton.
Stumm, E. & E. Wieland (1990) Dissolution of oxide and silicate minerals: rates depend on
surface speciation. In W. Stumm (ed.), Aquatic Chemical Kinetics. John Wiley, New
York, USA.
Stumm, W. (1992) Carbonates and their reactivities Chemistry of the solid-water interface.
Wiley-Interscience, New York.
Tan, K. H. & A. Binger (1986) Effect of humic acid on aluminium toxicity in corn plants.
Soil Science, 141, 20-25.
Tang, C. & Q. Yu (1999) Impact of chemical composition of legume residues and initial soil
pH on pH change of a soil after residue incorporation. Plant and Soil, 215, 29-38.
Tice, K.R., Parker, D.R., DeMason. (1992) Operationally defined apoplastic and symplastic
aluminium fractions in root tips of aluminium-intoxicated wheat. Plant Physiology
100, 309-318.
Van Breeman, N., Mulder, J., Drscoll, C.T. (1983) Acidification and alkalinisation of soils.
Plant and Soil. 75 283-308.

35
Wagatsuma, T., M. Kaneko & Y. Hayasaka (1987) Destruction process of plant root cells by
aluminium. Soil Science and Plant Nutrition, 33, 161-175.
Wilhelm, N. & K. Hollaway (1998) Persistence of sulfonylurea herbicides on alkaline soils.
9th Australian Agronomy Conference. Wagga Wagga.
Zhang, F. S. & T. R. Yu (1997) Reactions with Hydrogen Ions. In T. R. Yu (ed.), Chemistry of Variable Charge Soils. Oxford University Press, Oxford.

36
Chapter 3: Soil Characterisation
3.1 Soil selection and classification
Soils selected and used throughout this study were chosen for their high pH and use for
agricultural production in Southern Australia (Figure 3.1).
Figure 3.1 Locations within South Australia that soils used in this study were selected from (CSIRO 1968).
All soils are high pH calcarosols according to the Australian Soil Classification (Isbell 1996).
Soils were taken from the B horizon at a depth of 20 - 70 cm.
NOTE: This figure is included on page 36 of the print copy of the thesis held in the University of Adelaide Library.

37
3.2 Soil Characterisation
Soil characteristics are listed in Table 3.1
Soil pH and electrical conductivity were measured in 1:5 soil-water solutions using an Orion
960 pH meter and Model 170 conductivity meter respectively.
Total soil inorganic carbonate was measured using the Modified Pressure-Calcimeter method
(Sherrod et al. 2002) as outlined in Chapter 5 (5.2.2).
Soil Organic carbon content was established using the Walkley and Black’s rapid titration
procedure (Nelson & Sommers 1982) (Chapter 5, 5.2.2).
Particle size distribution was determined using the hydrometer method as outlined by Gee
and Bauder (1990).
Exchangeable cations and cation exchange capacity was determined using the method
outlined by Tucker and Beatty (1974).

38
Table 3.1 Soil characteristics.
*CEC is sum of exchangeable cations.
Soil pH EC (ds/m)
Particle size distribution
Carbonate (%)
CEC* (Meq/100g)
Exchangeable cations
(Meq/100g) ESP
Organic Carbon
(%) Clay Silt Sand Ca Mg K Na
Monarto 8.7 0.11 41 10 49 36.0 25.0 10.8 8.6 2.6 3.0 12.0 0.5
Ardrossan 9.5 0.27 50 19 31 39.4 22.0 9.4 6.8 1.2 4.6 20.9 0.9
Minlaton 8.8 0.19 45 15 40 35.5 26.0 9.8 8.7 1.6 5.9 22.3 0.6
Paskerville 9.6 0.47 49 14 37 45.2 24.0 8.8 6.9 2.4 5.9 24.6 0.8
Keilira 1 9.9 0.86 67 6 27 52.0 38.0 15.6 10.8 1.8 9.8 25.8 0.8
Keilira 2 9.2 0.70 70 9 21 53.9 42.0 16.8 12.5 2.0 10.7 25.4 0.9
Bordertown 9.3 0.84 40 30 30 6.0 18.0 5.6 7.7 1.4 3.3 18.3 0.96

39
3.3 References
CSIRO (1968) Soil map of South Australia. [on line]
http://www.atlas.sa.gov.au/go/resources/atlas-of-south-australia-1986/environment-
resources/soils [accessed 4/3/2010].
Gee, G. W. & J. W. Bauder (1990) Particle-size Analysis. In A. Klute (ed.), Methods of soil
analysis Part 1 Physical and mineralogical methods. American Society of Agronomy
Inc., Soil Science Society of America Inc., Madison.
Isbell, R. F. (1996) The Australian Soil Classification. CSIRO Publishing
Collingwood, Victoria.
Nelson, D. W. & L. E. Sommers (1982) Total Carbon, Organic Carbon and Organic Matter.
In A. L. Page, R. H. Miller & D. R. Keeney (eds.), Methods of soil analysis part 2 -
chemical and microbiological properties. Madison, Wisconsin.
Sherrod, L. A., G. Dunn, G. A. Peterson & R. L. Kolberg (2002) Inorganic carbon analysis by
modified pressure-calcimeter method. Soil Science Society of America journal, 66,
299-305.
Tucker, B.M., Beatty, H.J. (1974) Exchangeable cations and cation exchange capacity, in
Loveday, J (ed), Methods for Analysis of Irrigated Soils, Commonwealth Bureau of
Soils Technical Communication No 54.
40
Chapter 4: Aluminium Phytotoxicity and Speciation
4.1 Introduction
Chapter Two (Section 2.1.4) highlighted some of the problems commonly associated with
alkaline soils including poor soil structure and low water infiltration capacity, nutrient
deficiency, (e.g. iron, phosphorus, manganese, zinc and boron) and high molybdenum levels.
Studies conducted by the Central Soil Salinity Research Institute (2007) have highlighted
retardation of plant growth in alkaline soils. Pot experiments involving Jatropha Curas and
Pongamia plants showed that a pH greater than 9.0 significantly reduced plant stem and root
development. Maximum growth retardation occurred when pH was 9.5 or more.
This phenomenon was confirmed in a study by David Cooper (2004). A negative correlation
was found between soil pH and grain yield for Tamaroi, a variety of durum wheat (Figure
4.1). Again, yield decrease was most evident at a pH greater than 9.0.
Figure 4.1 The relationship between soil pH sampled between 30-40cm and grain yield of Tamaroi (wheat) ( adapted from Cooper 2004).
NOTE: This figure is included on page 40 of the print copy of the thesis held in the University of Adelaide Library.

41
A possible explanation for this phenomenon was provided by Ma et al (2003). They assessed
the phytotoxicity of Al to wheat varieties in alkaline solution cultures with pH maintained at
9.2. They found that the anionic form of Al present in alkaline solutions at a pH greater than
9.0 was toxic to plants even at concentrations as low as 1mg/litre.
Little research has been done linking Al to phytotoxicity in alkaline soils as opposed to
solution cultures. This chapter seeks to verify that aluminium is responsible for inhibiting
plant growth in alkaline soils and the specific pH at which this phytotoxicity occurs.
That aluminium may be present in soils but not phytotoxic at neutral pH is evidence that not
all forms of Al are phytotoxic to plants and that the species of Al taken up by plants may
change in the alkaline pH range. For example, at neutral pH Al species may precipitate out of
solution and be unavailable to the plant. Therefore the speciation of Al and its relationship to
pH is investigated. It is hoped that by understanding this relationship an effective and
economic remediation method may be developed to eliminate Al phytotoxicity in alkaline
soils.
In summary, this chapter seeks to:
� Verify the phytotoxicity of Al in alkaline soils.
� Identify the precise pH where this phytotoxicity begins
� Provide insight into the charge and species of Al responsible.

42
4.2 Methods
Aluminium speciation
4.2.1 Experiment 1: Aluminium charge and pH.
Zeta potential (ZP) is a method of measuring the charge associated with a particle. It is the
electrical potential at the boundary of the particle and associated ions (i.e. between the
particle and surrounding medium). Charged particles are attracted towards an electrode of
opposite charge. Viscous forces acting on the particle oppose this charge. When equilibrium
between these two forces is reached, the particle moves with constant velocity. This velocity
is called the particles electrophoretic mobility (EM).
ZP is proportional to EM as described by the Henry equation:
UE = (2 Ɛ z f (ka))/3ƞ
Where:
UE = electrophoretic mobility
Ɛ = dialectric constant
z = zeta potential
ƞ = viscosity
f(ka) = Henry’s function (value equals 1.5 or 1 depending on if the media is polar or non
polar).
To aid in identifying Al speciation in alkaline soils, the pH at which the net charge of Al in
solution becomes negative was investigated. 0.1 molar sodium aluminate was adjusted to pH
6, 7, 8, 9, 10 and 11 using HCl, and its electrophoretic mobility determined using a Malvern
Zetamaster.

43
4.2.2 Experiment 2: Al speciation determined using NMR analysis
Initial attempts to determine Al speciation at varying pH involved utilising Raman
Spectroscopy. This proved unsuccessful as the Al concentrations used, (approximately
10ppm to simulate real world soil Al concentrations), were below the spectrometer’s
detection limits.
Further attempts were made using Nuclear Magnetic Resonance spectroscopy (NMR). NMR
uses the principle that nuclei have charge and a quantum property of spin. Some nuclei exist
in discrete nuclear spin states. NMR observes the spin states induced by a radio frequency
electromagnetic field. The frequency of absorption for the nucleus of interest relative to a
molecular standard is called the atomic shift of the nucleus and is used to generate a unique
NMR spectrum.
Sodium aluminate solutions were prepared at 0.001 and 0.0001 molar concentrations and
adjusted to pH 8.5, 9.1, 9.4 and 10.5 using HCl and sodium carbonate (pH 9.1 and 9.4 were
chosen based on the results of Experiment 1 (Section 4.2.1) above i.e. the point at which net
solution charge becomes negative).
The solutions were analysed on an Avancell Bruker 300MHz ultrashield NMR running
Topspin software. 27Al NMR spectra were acquired with a recovery delay of 3s, pulse of 12µs
and an acquisition time of 0.26 s. Spectra were generally detected after just 2-3 minutes.
4.2.3 Experiment 3: Aluminium speciation determined using precipitation
Sodium aluminate (Na Al (OH4)) is a negatively charged Al species that exists at high pH. As
pH decreases via the addition of protons, the neutrally charged sodium aluminium hydroxide
(Na Al (OH3)) forms.

44
Al (OH) 4- + H+ � Al (OH) 3 + H2O
Whereas aluminate is highly soluble, aluminium hydroxide has low solubility in water
(0.0001 g/100ml at 20oC) and precipitates out of solution. By measuring the Al present in
solution at varying pH, it is possible to measure the relative concentrations of the two Al
species as pH changes.
0.01 molar sodium aluminate was titrated with HCl to pH 7.0, 7.5, 8.0, 8.5, 9.1, 9.3, 9.5 10.0
and 10.5. At each pH, approximately 10ml of titrate was extracted and filtered through
Whatman No 40 filter paper. The filtrate was then analysed by ICP AES for aluminium
content. The ICP analysis only detects Al in solution (not precipitated) and so can be used to
determine the relative concentration of the above Al species.
4.2.4 Experiment 4: Aluminium speciation determined using electrical conductivity.
The electrical conductivity of aluminate solutions at varying pH was trialled as a means of
determining Al speciation. Varying species of Al have a specific charge associated with
them. Electrical conductivity is proportional to the charge of the Al species present. 0.01
molar sodium aluminate solution was prepared and adjusted to pH 9, 9.5, 10 and 11 using
HCl as required. EC was measured using an Orion 170 conductivity meter.
4.2.5 Experiment 5: Aluminium entry into plants.
This experiment was conducted to verify that Al species present at alkaline pH are capable of
being taken up by plants. Exchange resins are an effective method of simulating ion uptake of
elements by plants (e.g. (van Raij et al (2009)). An anion exchange resin was used to simulate
the uptake of Al anions by the test plants. Two sodium aluminate solutions (0.1 molar) were
prepared and adjusted to pH 9.0 and 9.5. Anion exchange resins were inserted into the
solutions and the solutions shaken for 1 hour on an end over end shaker. The anion exchange
resins were removed, washed and eluted with 0.5 molar HCl. The elutions were ICP tested
for Al content.

45
4.2.6 Experiment 6: Pot experiment to verify aluminium phytotoxicity at high pH.
Growth medium
Aluminium is known to be toxic to plants at a concentration greater than 2-3 ppm (Balsberg
Pahlsson 1990). In order to minimise plant exposure to natural (non-added) Al in the growth
medium, test plants were grown in an artificial soil medium consisting of a laponite/sand
mixture (10% laponite, 90% sand).
ICP analysis showed that average Al concentration of the sand was of the order of 2.6 ppm.
To lower this concentration below 2 ppm, the sand was acid washed. 10ml of 0.1 molar HCL
was added to 10 litres of water for a 0.0001 molar HCL solution. The solution was added to
the sand and stirred for 2 minutes to ensure mixing. After 24 hours, the acid solution was
separated from the sand and the sand water washed. This procedure was repeated three times.
ICP testing of the acid washed sand showed Al concentration of approximately 1.2 ppm,
which was deemed acceptable i.e. unlikely to be toxic to plants.
Laponite is a synthetic silicate clay (primarily SiO2 (59.5%), MgO (27.5%), Na2O (2.8%),
other (10.2%)) It was combined with the acid-washed sand to introduce a clay component,
better representing a naturally occurring soil without adding to the growth medium’s Al
content.
Solutions.
The laponite/sand soil’s pH was adjusted using 0.1 molar hydrochloric acid or sodium
hydroxide as required. Soil Al content was adjusted by adding 0.1 molar sodium aluminate
until a concentration of 10ppm was attained for the Al treatments.

46
Soil treatments
6 soil treatments were implemented:
a) A control with near neutral pH (7.5) and no aluminate added.
b) High pH (9.0 and 9.5) with no aluminate added.
c) Near neutral pH (7.5) with aluminate added.
d) High pH (9.0 and 9.5) with aluminate added.
Test plant
Santi is a midseason flowering and maturing white pea developed by Dr Musharaf Ali of the
South Australian Research and Development Institute Pea Breeding Program. It was chosen
as the test subject due to its good growth performance in alkaline soils. Approximately 100
seeds were placed in a plastic container and covered with very warm water. When the seeds
began to germinate (after approx. 3 days), they were transferred to a sieve placed above the
container and covered with a warm wet towel. After a further 3 days, when roots had
developed to a length of approximately 2-3 centimetres, well developed seedlings were
selected and placed in the treated soil, four per pot, such that the tip of the plant was visible
through the soil.
Four pots were used per treatment, with one kg of soil and four plants per pot. Water was
allowed to drain via holes drilled in the bottom of each pot. Each week the plants were
watered with 100ml of RO water and, 2 days later, with 50ml of Nutrosol plant nutrient
solution. The experiment was run for 5 weeks; this was deemed sufficient time to observe any
difference in plant growth and plant aluminium content between treatments.

47
After 5 weeks the plants were removed from the soil and the plant stems separated from the
roots. Stem length and root length were measured. The stems and roots were washed to
remove sand particles. The plant material was oven dried, then analysed using ICP to
determine Al content for the pH 7.5 and 9.5 treatments. The samples were digested using
nitric/perchloric acid in open glass tubes on a programmable digestion system.
4.3 Results/Discussion
4.3.1 Experiment 1: Aluminium charge and pH.
Electrophoretic mobility analysis showed that the net charge of 0.1 molar sodium aluminate
solution became negative at a pH of 9.2 (Figure 4.2). It is likely that at pH 9.2, Al(OH)4- ions
become the dominant form of Al, driving the net charge negative:
Al(OH)30 + (OH)- ↔ Al(OH)4
-
As more alkalinity was introduced into the system, Al(OH)52- formed, further increasing the
negative charge of the solution:
Al(OH)4- + OH- ↔ Al(OH)5
2-
The change to a net negative charge at pH 9.2 is confirmed by the point of zero net charge
(PZNC) between pH 8.0 and 9.0 for gibbsite (aluminium hydroxide) (Sposito 1989). The
PZNC occurs when neutrally charged aluminium hydroxide is the dominant form of
aluminium (pH < 9.2). At higher pH, negatively charged species of aluminium dominate.

48
Figure 4.2 Zeta potential of 0.1 molar sodium aluminate solutions at varying pH.
4.3.2 Experiment 2: Aluminium speciation determined using NMR analysis
Support that aluminate is the agent responsible for the net negative charge at pH greater than
9.2 was provided via NMR analysis using 27Al spectra. At pH 10, a chemical shift was
detected at 80.64 ppm (Figure 4.3) which is generally associated with tetrahedrally
coordinated aluminium, specifically Al(OH)4- (Sipos et al. 2006, Sarpola 2007).
Spiking the solution with acid to lower pH into the acidic range (< 4) resulted in a chemical
shift occurring at 0.7 ppm, (Figure 4.4) corresponding to Al ions in octahedral coordination,
such as Al3+, Al(OH)2+, Al(OH)2+, and possibly the dimeric complex [Al2(OH)x(H2O)10-x](6-x)+
(Sarpola 2007) .
No chemical shifts were detected between pH 10 and neutral pH values as Al precipitated out
of solution in the form of aluminium hydroxide. The amount of soluble Al remaining fell
below the detection levels of the NMR machine.
-60
-40
-20
0
20
40
60
6 7 8 9 10 11
Zeta
pot
entia
l (m
V )
pH
Al(OH)2+ & Al(OH)2+
Al(OH)4- &
Al(OH)52- dominant
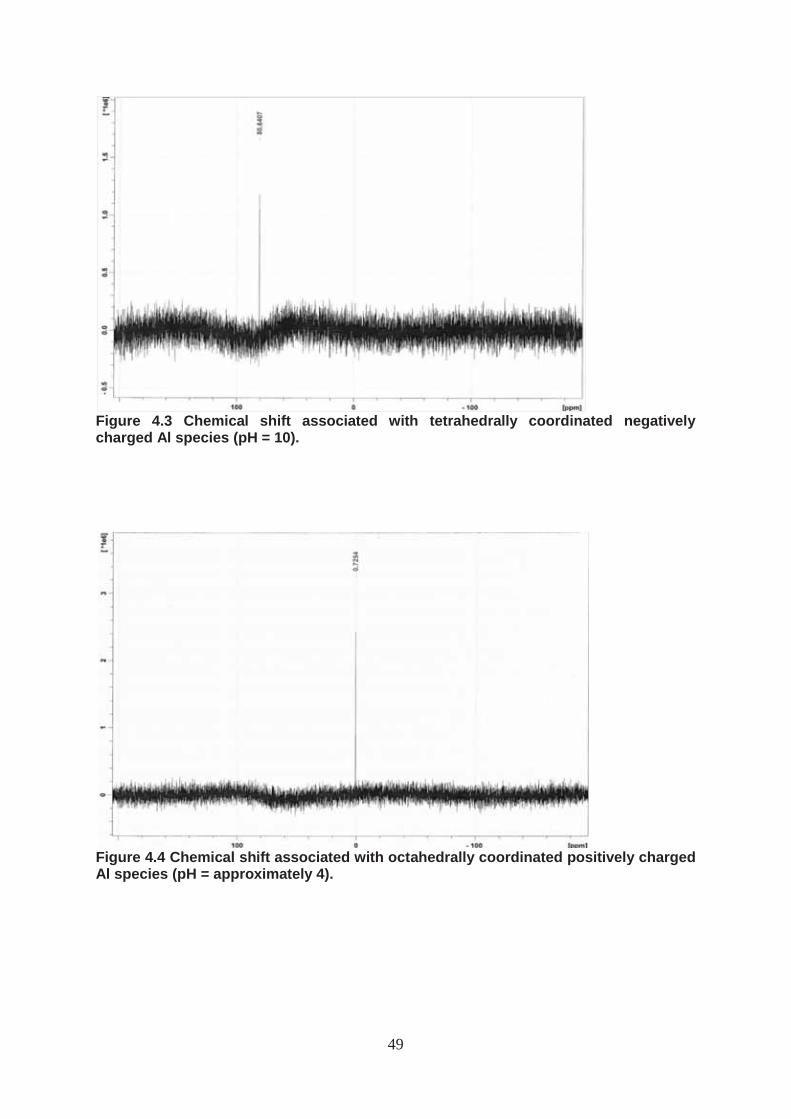
49
Figure 4.3 Chemical shift associated with tetrahedrally coordinated negatively charged Al species (pH = 10).
Figure 4.4 Chemical shift associated with octahedrally coordinated positively charged Al species (pH = approximately 4).

50
4.3.3 Experiment 3: Aluminium speciation determined using precipitation
To determine Al speciation in the pH range not detectable by NMR, (neutral to
approximately 10), the solubility characteristics of varying Al species were utilised. Sodium
aluminate is soluble but aluminium hydroxide precipitates out of solution. Figure 4.5 shows
the relative percentage of Al in the form of the neutrally charged insoluble Al (OH)30
compared to the soluble negatively charged species Al(OH)4- and Al(OH)5
2- with varying pH.
At pH 8.0, virtually all of the Al was precipitated. It is likely that most of this was aluminium
hydroxide with positively charged species (Al(OH)2+, Al(OH)2-) adsorbed to the surface of
the precipitate. As alkalinity increased, the aluminium converted to the anionic species
Al (OH)4-
At pH 9.1, approximately 10% of the aluminium was in solution as Al(OH)4- . The net charge
of the solution remained slightly positive as the anionic species were offset by the cations
Al(OH)2+ / Al(OH)2+ still in solution. At pH of approximately 10.3, the majority of Al was
soluble and the solution charge strongly negative. i.e. most of the sodium hydroxide had
converted to aluminate. By pH 10.5 and above, nearly all Al was soluble i.e. in the form of
Al(OH)4- or Al(OH)5
2-, hence the large negative charge.
Figure 4.5. Percentage of Al in solution and zeta potential at varying pH.
-50
-40
-30
-20
-10
0
10
20
30
40
0
20
40
60
80
100
8 8.5 9 9.5 10 10.5 11
Zeta
Pot
enti
al
% A
l in
solu
tion
/pre
cipi
taed
pH
In solution Precipitated Net Charge

51
4.3.4 Experiment 4: Aluminium speciation determined using electrical conductivity
To further refine Al speciation with varying pH, electrical conductivity (EC) of aluminate
solution was measured as a proxy for charge. The charge of aluminium varies with its
speciation e.g. Al(OH)2+, Al(OH)2+, Al(OH)3
0, Al(OH)4-.
At the molarity of Al used in this experiment (10 mmol), an EC reading of 1000µs/cm
equated to a charge of 1.0. Figure 4.6 shows that between a pH of approximately 8.0 to 9.0,
average charge was equal to approximately 1.5, made up of a mix of Al species. Charge
began to fall with increasing pH as the concentration of positively charged species declined at
a faster rate than the concentration of negatively charged species increased (with the neutrally
charged aluminium hydroxide making up the difference). At pH 10.5, charge was
approximately 1.0. It is likely that at this point only Al(OH)4- remained in solution (hence a
negative charge of 1.0, i.e. all aluminium hydroxide was converted to aluminate). Beyond pH
10.5 charge again started to increase as Al(OH)52- formed:
(Al(OH)4- +(OH)- � Al(OH)5
2-).
Figure 4.6. Electrical conductivity of Al solution at varying pH.
0
200
400
600
800
1000
1200
1400
1600
8 8.5 9 9.5 10 10.5 11 11.5
EC (u
s/cm
)
pH

52
Figure 4.7 attempts to summarise the change in aluminium species with changing pH
discussed in the analysis above. Below a pH of approximately 8.0 all Al species present are
cationic or neutrally charged (it is possible that some of this Al may be polymeric in nature).
Above pH 8.0, anionic species may form but overall charge remains positive as the cationic
forms of Al are more numerous. At a pH of approximately 9.2 anionic forms of aluminium
become dominant and the net charge of the solution becomes negative. From pH 10.5 and
higher only negative species of aluminium are present.
Figure 4.7 Summary of speciation of aluminium with varying pH.
4.3.5 Experiment 5: Aluminium entry into plants.
Average concentration of Al in the elution taken from the anion exchange resin was
approximately 2.4 ppm at pH 9.0 and 2.1 ppm at pH 9.5, verifying that negatively charged Al
species at alkaline pH can indeed be taken up by plants. The similar magnitude of the uptake
rate at pH 9.0 and 9.5 suggests it is primarily the species of Al, not the quantity, that may be
responsible for phytotoxicity at highly alkaline pH (> 9.2).

53
4.3.6 Experiment 6: Pot experiment to verify aluminium phytotoxicity at high pH.
Plant Growth
Stems; soil pH
Stem length varied significantly (p = 7.9 x 10⁻⁸) (ANOVA 2-way analysis with replication,
alpha = 5%) between pH treatments (Figure 4.8 – 4.10, 4.11). Average stem length of pH 7.5
plants was 91mm compared to 78 mm for pH 9.0 plants and 39mm for pH 9.5 plants. This
suggests that high pH of a soil alone can affect plant stem development (independent of Al),
an expected result due to the known effect of high soil pH on nutrient availability. Average
stem length reduced by 15% for plants grown in pH 9.0 soils compared to pH 7.5 soils, and
by 50% between pH 9.0 and 9.5, indicating the phytotoxic effects of high pH are
compounded above pH 9.0 (Table 4.1).
Stems; soil aluminium content
A significant difference in stem length was observed based on soil aluminium content
(p = 0.02). At pH 7.5 there was no significant effect (stem length equalled 89mm for no Al
soils vs. 93mm for Al soils) while at pH 9.0 there was a 33% reduction in stem length and at
9.5 a 56% reduction, again suggesting aluminium toxicity is compounded when pH increases
beyond 9.0 (refer table 4.2). There was significant interaction between pH and Al on plant
growth (p = 0.01) i.e. phytotoxicity was higher for plants grown in Al treated high pH soils
compared to high pH alone.

54
Roots; soil pH
There was a significant difference in root length based on pH treatments alone
(p = 2.08x10⁻¹⁰) (Figure 4.12). Root length reduction between pH 7.5 and 9.0 was 43%
compared to 66% between 9.0 and 9.5 (Table 4.1), again indicating the effects of pH are
compounded above pH 9.0.
Roots; soil aluminium content
The effect of Al on root development followed the same pattern as stem development with Al
exposed plant roots showing a significant length reduction (p = 0.0008) and the reduction
increasing above pH 9.0 (Table 4.2).
Reduction in plant development at pH 9.0 or less may still be attributed to negative species of
Al because such species exist in solution at these pH values, although net charge may be
positive due to the presence of positive Al species. As pH rises above 9.2, anionic species
become more prevalent and the phytotoxic effect increases.
Aluminium content
Stems
ICP analysis of the Al content of plant stems for the pH 7.5 and 9.5 treatments showed that
aluminium content averaged a 70% increase for the aluminium treatments over the no-Al
treatments, verifying aluminium was indeed entering the plant. However, there was no
significant difference in Al content between pH 7.5 and pH 9.5 treatments. Average Al
content for pH 7.5 stems was 57ppm vs. 56 ppm for high pH stems. This suggests that it is

55
not the amount of Al entering the plant that causes the phytotoxicity at high pH, but rather the
form or species of the aluminium.
Roots
There was a significant difference in the Al concentration of the roots between the pH 7.5 and
pH 9.5 treatments (p = 0.01). Average Al content for pH 7.5 roots was 873ppm vs. 354ppm
for pH 9.5 roots. There was no significant difference in root Al concentration between the
low and high Al treatments (p = 0.22). Average Al content for non Al treated roots was
527.5ppm vs. 699ppm for Al treated roots.
This statistic was inconclusive however. At pH 7.5, more Al was entering the root in the Al-
treated soil compared to the non Al treated soil, but this pattern was reversed at pH 9.5. Root
degradation was so severe at the higher pH that it is doubtful that the roots were capable of
functioning in a normal manner and so may not have been up taking Al at the rate of the pH
7.5 plants. It is in the roots that Al toxicity first manifests itself, hence the decrease in root
size and functionality at pH 9.5. It is likely that stems might display the same reduction in Al
concentration given more time. Al is taken up by the root and transported into the stem. As
root functionality decreases, Al is not taken up at as fast a rate as it is transported out of the
root and overall root Al concentration decreases. Al transported to the stem stays in the stem,
so no immediate fall in stem Al concentration is apparent (Table 4.3).

56
Figure 4.8/4.9/4.10 Effect of pH and Al on growth of SANTI variety field pea.
pH 7.5 No Al pH 7.5 Al pH 9.5 No Al pH 9.5 Al
pH 9.5 Al pH 9.5 No Al pH 7.5 Al pH 7.5 No Al
pH 9.0 No Al pH 9.0 Al pH 9.5 No Al pH 9.5 Al

57
Table 4.1 Average percentage decrease in growth of SANTI variety field pea with increasing pH
Table 4.2. Average percentage decrease in growth of SANTI field pea grown in Al
treated soil compared to no Al soil.
pH
7.5 9.0 9.5
Stem length reduction (%) 0 33 56
Root length reduction (%) 20.1 31 54
pH
7.5 to 9.0 9.0 to 9.5
Stem length reduction (%) 15 50
Root length reduction (%) 43 66

58
Figure 4.11/4.12 Effect of pH and Al concentration on SARDI variety field pea.
Table 4.3 Aluminium content of SARDI field peas at varying pH and soil Al content * root highly degraded Treatment Stem (mg/kg) Root (mg/kg)
pH 7.5 No Al 40 620
pH 7.5 Al 74 1125
pH 9.5 No Al 44 435
pH 9.5 Al 68 273*
0
20
40
60
80
100
120
7.5 9 9.5
Stem
Len
gth
mm
pH
Average Stem Length (mm)
No Aluminium
Aluminium
0
10
20
30
40
50
60
70
7.5 9 9.5
Root
Len
gth
mm
pH
Average Root Length (mm)
No Aluminium
Aluminium

59
4.4 Conclusion
The preceding analysis lends support to the following hypotheses:
1. Phytotoxicity occurs in alkaline soils.
Experiment 6 (Section 4.3.6) clearly demonstrated that plant stem and root development are
retarded at pH 9.0 and more so at 9.5 compared to pH 7.5, showing that the growth reduction
in alkaline solution culture experiments alluded to in the introduction, (Ma et al. 2003), is
also applicable to soil grown plants.
2. Aluminium compounds phytotoxicity in alkaline soils
The negative effects on plant grown in Al treated alkaline soils is greater than that of plants
grown in alkaline soils alone.
3. It is a change in Al species that is responsible for this phytotoxicity.
Growth of plants at pH 7.5 is similar between Al and no Al treatments indicating that not all
species of Al are toxic to plants. The amount of Al entering stems at pH high and low pH is
similar indicating that the phytotoxicity that occurs at high pH must be related to the species,
not the quantity of Al present.
4. It is an anionic species of aluminium that is responsible for this phytotoxicity.
The decrease in plant development positively correlates with increasing concentration of
negatively charged species of Al (probably aluminate). The above experiments have
highlighted that negative species of Al become dominant at pH 9.2, not at a pH of 7.0 as
often quoted in the literature (refer diagram page 16). Al toxicity becomes debilitating

60
beyond pH 9.2, establishing a link between Al phytotoxicity and negatively charged Al
species.
Remediation of alkaline soils then may not necessitate lowering soil pH to neutral but simply
to less than pH 9.0, where aluminate concentration is greatly reduced. In order to assess the
feasibility of achieving this, the ability of alkaline soils to resist acid induced pH change
needs to be investigated. This necessitates an understanding of factors responsible for soil
alkalinity. These issues are investigated in the following chapter.
61
4.5 References
Balsberg Pahlsson, A. M. (1990) Influence of aluminium on biomass, nutrients, soluble
carbohydrates, and phenols in beech (Fagus sylvatica). Physiologia Plantarum, 78(1),
79-84.
Cooper, D. S. (2004) Genetics and Agronomy of Transient Salinity in Triticum durum and T.
aestivum., PhD thesis, School of Agriculture and Wine. The University of Adelaide,
Adelaide.
Central Soil Salinity Research Institute (2007) Annual Report. Karnal, India.
Ma, G., P. Rengasamy & A. J. Rathgen (2003) Phytotoxicity of aluminium to wheat plants in
high-pH solutions. Australian Journal of Experimental Agriculture, 43, 497-501.
Sarpola, A. (2007) The hydrolysis of aluminium, a mass spectrometric study. Faculty of
technology, Department of process and environmental engineering, water resources
and environmental engineering laboratory. University of Oulu, Oulu.
Sipos, P., G. Hefter & P. May (2006) Al NMR and Raman spectroscopic studies of alkaline
aluminate solutions with extremely high caustic content - Does the octohedral species
Al(OH)63- exist in solution? , 1st workshop of the European Union: Analysis and
removal of contaminants from wastewaters for the implementation of the Water
Framework Directive - 1st EMCO 2005. Talanta.

62
Sposito, G. (1989) Soil particle surfaces The chemistry of soils. Oxford university press,
Oxford.
vanRaij, B., Cantarella, H., Quaggio, J.A., Prochnow, L.I., (2009) Ion exchange resin for
assessing phosphorus availability in soils. Better Crops. 93(1) 23-25
63
Chapter 5: The role of carbonates in determining soil pH and alkaline buffering capacity
5.1 Introduction
Chapter Four established that aluminium can indeed be phytotoxic in high pH soils, reducing
plant stem and root development. A potential remediation method (to be discussed in detail in
Chapter Six) is to lower soil pH to a level where phytotoxic species of Al do not occur or are
not in a form taken up by plants (i.e. to less than 9.2, or preferably 9.0). Such a method may
be desirable because it also eliminates or reduces other phytotoxic effects associated with
highly alkaline soils such as micronutrient deficiency and poor soil structure.
The above remediation method necessitates an understanding of the factors responsible for
producing and maintaining the alkalinity of a soil so that the ease of lowering soil pH via the
addition of acid can be assessed.
Alkalinity may be defined thus:
Alkalinity = [HCO3-] + 2[CO3
2-] + [OH-] – [H+] (Sposito 1989a), bicarbonate carbonate hydroxyl proton(acid) ion The definition highlights the importance of carbonates in determining soil pH. Crucially, this
formula also defines the acid neutralisation capacity (ANC) of a soil i.e. the amount of strong
acid required to reduce soil pH to a reference value (Van Breemen et al. 1983). This is
critical as any remediation method that involves lowering soil pH must necessitate the
addition of protons to that soil.

64
Carbonates then may not only cause alkalinity but play a role in maintaining it i.e. they buffer
the soil against proton-induced pH change. A soil’s alkaline buffering intensity can be
expressed as the number of moles of proton charge (H+ ions) that are complexed by a soil
when the soil pH decreases by one unit. This is the converse of the soil’s acid buffering
intensity (Sposito 1989a). Whereas the buffering intensity of acid soils has been researched
thoroughly, the corresponding buffering intensity of alkaline soils and its relationship with
carbonate quantity and species has not been studied in detail. Similarly, there has been little
research on the adsorption-to-clay characteristics of carbonates in this pH range.
In response to this knowledge deficit, the carbonate chemistry of six alkaline soils was
investigated. The soils were selected for their high pH value and location in agricultural areas
in Southern Australia. (Monarto, Paskerville, Minlaton, Ardrossan and two soils from Keilira,
hereafter designated Keilira 1 and Keilira 2). (Refer Chapter Three, Table 3.1 for soil
characterisation).
To summarise, this chapter seeks to:
� Investigate the chemistry of soil carbonates and the role it plays in creating and
maintaining alkalinity.
� Investigate the sorption characteristics of carbonates to clays.
� Identify and explain the alkaline buffering intensity of six alkaline soils.
� Based on the above, evaluate the feasibility of using acid to modify soil pH, thus
eliminating aluminium phytotoxicity and other problems related to high pH soils.

65
5.2 Methods
Soil Composition
5.2.1 Experiment 1: Mineral composition of soils
Soil mineralogy was determined quantitatively via X-ray diffraction (XRD). Samples were
lightly ground in an agate mortar and pestle and back pressed into stainless steel holders for
analysis. XRD patterns were recorded with a PANalytical X’Pert Pro microprocessor-
controlled diffractometer using Co Kα radiation, an automatic divergence slit, graphite post-
diffraction monochromators and an X’Celerator fast Si strip detector. The diffraction patterns
were recorded in steps of 0.05o 2θ with a 0.5 second counting time per step and logged to data
files on a PC using HighScore Plus and XPLOT.
5.2.2 Experiment 2: Carbonate composition of soils
Organic carbon content
Organic carbon content of the soils was established using Walkley and Black’s rapid titration
procedure (Nelson & Sommers 1982). This method quantifies the amount of oxidisable
organic matter (OM). OM is oxidised with a known amount of chromate in the presence of
sulphuric acid. A gram of ground soil was placed into a 500 ml conical flask. 10ml of 1N
potassium dichromate was added followed by 20ml of concentrated sulphuric acid. The
solution was shaken for 1 minute and allowed to stand for an hour. 200ml of distilled water
was added followed by 10 ml of concentrated orthophosphoric acid. The solution was
allowed to cool for 20 minutes, following which 0.5 ml of phenanthroline was added and the
solution titrated with ferrous sulfate solution until a change to a red colour was observed. A
reagent blank was made in the same manner, but without soil to standardise the dichromate.

66
The organic carbon content was calculated using the following formula:
Organic C % =
(meq potassium dichromate - meq ferrous sulfate) X conversion
Weight of soil(g) factor
Inorganic carbon content
The total inorganic carbonate content of the soils was determined using the Modified
Pressure-Calcimeter Method (Sherrod et al. 2002). When carbonates are treated with acid in a
closed system, the increase in pressure is linearly related to the carbon dioxide content in the
carbonates (Nelson 1982). The carbonate levels were determined by reacting the soil samples
with HCl, resulting in the release of carbon dioxide gas into a sealed container. A hypodermic
needle, connected to a pressure transducer and volt meter, was inserted in the container and
voltage output measured. The voltage was then compared to a calibration curve obtained by
mixing known concentrations of calcium carbonate with oven dried laboratory sand.
Soluble carbonate
Soluble carbonate present was determined using the Phenolphthalein End Point method
(Nollet 2000). Phenolphthalein is pink in the presence of carbonate and turns clear at a pH of
8.3. A solution is titrated with acid until the colour change occurs, indicating that all
carbonate has been converted to bicarbonate:
CO32- + H+ � HCO3
-
1:5 soil suspensions (8g of soil/ 40 ml of RO water) were mixed for an hour on an end over
end shaker. Suspensions were passed through a Whatman 42 filter paper, following which 5
ml of the suspension was pipetted into a beaker and four drops of 1% phenolphthalein
solution added. If the solution turned pink (indicating carbonate was present) the soil solution
was titrated with 0.01 molar HCl in 0.1 ml increments until the pink colour disappeared.

67
Molar quantity of H+ used to neutralise the carbonate and the equivalent moles of carbonate
in this reaction were then calculated.
Soluble bicarbonate was determined using the Methyl Orange method. Methyl Orange
changes colour at a pH of 4.5 at which point all bicarbonate has been converted to carbonic
acid.
HCO3- + H+ � H2CO3
A solution pH between 4.5 and 8.3 then is attributable to the presence of bicarbonate. The
solution is titrated with acid until the colour change is observed.
Four drops of 1% Methyl Orange solution were added to the same soil solution used for
carbonate determination and the solution again titrated with 0.01molar HCl until a colour
change was observed. Again, molar quantity of H+ used to neutralise the carbonate and
equivalent moles of carbonate in the reaction were calculated.
Soil suspensions were also titrated with 0.1 molar HCl to a pH of 8.3 (the point where all
carbonate is converted to bicarbonate) to determine carbonate content in unfiltered solutions.
The end point was measured using an Orion 960 automatic titration device. This was done in
addition to the phenolphthalein method because the colour change was difficult to observe in
soil suspensions.
Carbonate chemistry
5.2.3 Experiment 3: Carbonate chemistry and soil pH
The contribution of carbonate to soil pH was determined for the six soils. Soil pH was
measured using an Orion pH meter. Plastic mesh and filter paper were used to seal the bottom
of four plastic tubes and the tubes placed in funnels which in turn emptied into plastic bottles.

68
70 grams of each of the soils was placed in the tubes and 200ml of RO water poured gently
onto the soil. The water was allowed to drain through the soil and collect in the plastic bottle.
The process was repeated three times. The pH of the soil suspension and collected filtrate was
retested and the solutions tested for carbonate and bicarbonate using the methods outlined in
Experiment 2 (Section 5.2.2, soluble carbonates).
5.2.4 Experiment 4: Carbonate sorption to clays
To determine the adsorption characteristics of carbonate to clays in solution, thirteen 1%
bentonite clay suspensions were prepared with pH adjusted to between 8.3 and 12.0 using
0.01 molar HCl or Na2CO3 as required. The clay suspensions were filtered and the carbonate
content of both the clay suspensions and filtrate were calculated using the Phenolphthalein
End Point method outlined above (Refer section 5.2.2). By comparing the carbonate present
in suspension and filtrate, the percentage of carbonate adsorbed to the clay (and hence not
present in the filtrate) was determined.
5.2.5 Experiment 5: Clay adsorbed carbonate and alkaline buffering intensity
This experiment was carried out to verify that carbonate sorbed to the surface of clays is still
able to provide a buffering capacity against acid-induced pH change. Two solutions were
prepared;
� 100ml of sodium carbonate (0.01molar); 50ml RO water.
� 100ml sodium carbonate (0.01 molar): 50ml of 1% bentonite clay solution.
The solutions were mixed for an hour on an end over end shaker. Titration of the solutions
was carried out as for Experiment 6 (5.2.6), but terminated when a pH of 7.0 was reached.
The buffering capacity of the two solutions was compared.

69
5.2.6 Experiment 6: Titration of six alkaline soils to determine soil alkaline buffering
intensity
1:5 soil suspensions (20 grams of soil; 100ml of RO water) were mixed for an hour on an
end-over-end shaker. Titrations were carried out on an Orion 960 automatic titration device
by addition of 0.5 molar HCl to the soil suspensions in 5ml increments. The suspensions were
auto-stirred for 60 minutes after each addition of HCl to allow equilibrium to be reached
before pH was measured. The titration was terminated when a pH of 6.0 was reached.
5.3 Results/Discussion
Soil composition
5.3.1 Experiment 1: Mineral composition of soils.
Total soil
X-ray diffraction analysis showed soil mineralogy was dominated by carbonates, (primarily
calcite/Mg-calcite and dolomite/ankerite). Quartz made up between 15- 42 percent of the
soils and smectite featured prominently in all soils (17 – 28%). The soils generally showed
small amounts of orthoclase/microcline, kaolin and albite/anorthite (Table 5.1).
Clay component
The clay component of the soils was dominated by smectite (58-90%). Calcite was prominent
in Keilira 1 whereas calcite and dolomite/ankerite were significant for Keilira 2 (17 and 14%
respectively) (Table 5.2).

70
Table 5.1 Mineralogy of whole soils as determined by X-ray diffraction % (accuracy +/- 5%).
Table 5.2 Mineralogy of clay component as determined by X-ray diffraction % (accuracy +/- 5%).
Soil Quartz Orthoclase/ Albite/ Anatase Hematite Calcite/ Dolomite/ Kaolin Smectite Illite Microcline Anorthite Mg-Calcite Ankerite Monarto 42 2 1 0 1 33 3 1 17 0
Ardrossan 29 2 2 0 0 39 0 2 26 0
Paskerville 31 2 2 0 <1 29 16 1 18 0
Minlaton 39 3 3 0 0 33 3 1 18 0
Keilira 1 23 0 <1 0 0 41 11 <1 23 0
Keilira 2 15 <1 <1 0 0 29 25 <1 28 0
Soil Quartz Orthoclase/ Albite/ Anatase Hematite Calcite/ Dolomite/ Kaolin Smectite Illite Microcline Anorthite Mg-Calcite Ankerite Monarto 3 0 0 <1 0 <1 <1 6 90 0
Ardrossan 3 0 <1 <1 1 0 0 5 68 24
Paskerville 3 0 0 <1 <1 <1 <1 9 88 0
Minlaton 10 0 0 1 0 <1 <1 4 84 0
Keilira 1 3 <1 <1 <1 0 24 6 0 66 0
Keilira 2 1 <1 0 <1 0 17 14 0 58 9

71
5.3.2 Experiment 2: Carbonate composition of soils
All six soils showed a high total carbonate content (including non extractable carbonate
sorbed to clay surface, soluble bicarbonate and mineral carbonates), ranging from 35.5 to
53.9% (Table 5.3). Soluble carbonate was detected in the soil suspensions in concentrations
ranging from 3.0 to 20.4%. No carbonate was detected in filtered soil solutions. Soluble
bicarbonate was present in both soil suspensions and filtered soil solutions in concentrations
ranging from 11.6 to 17.1%. Organic carbon levels were less than 1% for all soils.
Table 5.3 Soil carbonate content and mineralogy
Soil Total
carbonate (%)
Organic carbon (%)
Non-extractable carbonate
(%)*
Soluble bicarbonate
(%) Calcite
(%) Dolomite/ Ankerite
(%)
Monarto 36.0 <1 4.2 11.6 18.4 1.8
Ardrossan 39.4 <1 4.8 14.0 20.6 ND
Minlaton 35.5 <1 3.0 12.2 18.5 1.8
Paskerville 45.2 <1 8.4 16.5 13.2 7.1
Keilira 1 52 <1 20.4 17.1 11.5 3.0
Keilira 2 53.9 <1 7.2 11.6 19.3 15.8
* soluble carbonate detected in soil suspension but not in filtered solution. ND = not detected

72
Carbonate behaviour
5.3.3 Experiment 3: Carbonate content and soil pH
The pH of the soils ranged from 8.7 to 9.9. This high alkalinity was generally attributed to
high levels of soluble inorganic carbonate/bicarbonate in the soils. The correlation coefficient
between non-extractable carbonate and soil pH was r = 0.78. Soil carbonate was sourced
directly from carbonate minerals (calcite/dolomite/ankerite) found within the soil particles.
This carbonate reacted with sodium salts to form sodium carbonate which dissociated in
water to form carbonic acid;
Na2CO3 + 2H2O � 2Na + + 2OH- + H2CO3
The carbonic acid, (H2CO3), was unstable and produced water and carbon dioxide:
H2CO3 � H2O + CO2
leaving the OH- anion responsible for the high alkalinity.
i.e. Na2CO3 + H2O � 2Na + + 2OH- + CO2
A pH of greater than 8.3 was attributed to high carbonate rather than bicarbonate levels, an
assertion supported by two pieces of experimental evidence:
1. The pH of 1:5 soil:water suspensions ranged from 8.7 to 9.9. When the suspensions were
filtered, the filtrate pH fell to around 8.3, indicating that soluble bicarbonate, present in both
the suspensions and filtered solutions, was not responsible for maintaining pH at the higher
level found in the suspensions (Table 5.4).

73
2. Leaching of the soils to remove soluble carbonates and bicarbonates resulted in little
change in the soil suspension pH whereas the leachate pH fell to approximately 8.3 (Table
5.4). As only bicarbonate was detected in the leachate, strength was lent to the assertion that
bicarbonate was not responsible for maintaining pH above 8.3. Carbonate must have been
responsible for the high pH in the soil suspensions.
At high pH, bicarbonate is still present in soils but in reduced concentration. Above a pH of
8.3 bicarbonate concentration starts to decrease and carbonates dominate. According to
Lindsay (1979) the activity of carbonate increases at a rate 10 times faster per unit increase in
pH than bicarbonates (refer Chapter 2, Figure 2.4).
Table 5.4 Effect of filtering/leaching on soil suspension pH.
Soil Suspension pH before
leaching or filtering
Filtrate pH Suspension pH after leaching Leachate pH
Monarto 8.7 8.3 8.7 8.3
Ardrossan 9.5 8.4 9.4 8.3
Minlaton 8.8 8.3 8.8 8.3
Paskerville 9.6 8.6 9.6 8.6
Keilira 1 9.9 8.7 9.9 8.7
Keilira 2 9.2 8.3 9.2 8.4
High soil pH then is likely maintained by carbonate species sorbed to soil clay particles. The
carbonate was not detected in the filtered solution because its intimate association with soil
particles prevented it from passing through the filter.

74
5.3.4 Experiment 4: Carbonate sorption to clay
Carbonate can sorb to a clay surface via the mechanism of outer-sphere surface complexation
of anions. This may involve coordination to a protonated hydroxyl group and/or coordination
to a surface metal cation (Sposito 1989b). This is pictorially represented in Figure 5.1.
- OH - OH2CO3
-Na -NaCO3
Figure 5.1 Mechanism for the sorption of carbonate to clay particles.
Figure 5.2 shows the adsorption characteristics of carbonate to bentonite clay at varying pH.
At high pH, (pH > 11), there was little sorption of carbonate to the clay surface and carbonate
was readily available in solution. At high pH, fewer protons were available and the
protonated hydroxyl group no longer formed, denying the carbonate anion this bonding site.
Also, surface metal cations may have been utilised by the increased number of hydroxyl
groups, denying the site to carbonate anions.
As pH decreased, adsorption of carbonate to clay increased until, at a pH of approximately
9.2, all of the carbonate was adsorbed and hence not present in the filtered solution. Protons
were available at pH < 9.2 to bond to hydroxyl groups at the clay surface forming protonated
hydroxyl groups. Carbonates used these sites to sorb to clay particles.
Clay
Clay
H
CO3
CO3

75
Figure 5.2 Relationship between pH and sorption of carbonate to a bentonite clay.
5.3.5 Experiment 5: Clay adsorbed carbonate and buffering intensity.
The initial higher pH of the carbonate/water solution compared to the carbonate/bentonite
solution (Figure 5.3) is caused by hydroxyl groups formed when the carbonate reacts with
water.
Na2CO3 + H2O � 2Na + 2OH + CO2
Carbonate sorbed to the bentonite cannot react with water to form the hydroxyl ions, hence
the lower pH.
Figure 5.3 shows that while both carbonate/water and carbonate/bentonite solutions provided
a buffering capacity, the steeper slope of the carbonate/bentonite line suggests that carbonate
sorbed to clay is less efficient in buffering against acid induced pH change than carbonate
freely in solution.
0
20
40
60
80
100
120
8 9 10 11 12 13
% o
f max
. ads
orpt
ion
pH

76
Figure 5.3: Comparison of buffering intensity of carbonate and carbonate/bentonite solutions
At a pH of approximately 9.5, all the carbonate had reacted with H+ in the carbonate/water
solution i.e. buffering capacity was exhausted and pH fell rapidly. The dissolution rate of the
additional carbonate provided by the bentonite in the sodium carbonate/bentonite solution
increased as pH fell, providing additional buffering, so the rapid decline stage was not seen
for this solution. The message here is that sorbed carbonate is still able to provide a buffering
capacity against acid-induced change albeit less that provided by non-adsorbed carbonate.
5.3.6 Experiment 6: Titration of six alkaline soils to determine soil alkaline buffering
intensity.
All soils had a high initial pH (8.7 to 9.9, Table 5.4). In all cases titration of the soil
suspensions with HCl was characterised by an initial large reduction in soil pH to between
7.2 and 7.7 (Figure 5.4) followed by a plateau phase where addition of acid had little effect
6
7
8
9
10
11
0 2 4 6 8 10 12
pH
ml of HCl
NaCarbonate/ROwater
NaCarbonate/Bentonite

77
on soil pH. The final phase, exhibited by only some of the soils (Paskerville, Monarto,
Ardrossan), was a rapid fall in pH. The following explains the shape of the titration graph.
Figure 5.4 pH change for 6 alkaline soils when titrated with H+
Phase of rapid decline
All soils needed very little addition of acid to lower pH to less than 8.0. The dissolution rate
of mineral carbonates was very slow at higher pH and hence the released carbonate was
quickly neutralised by acid, providing very little buffering. Following this, the remaining
protons rapidly lowered the solution pH.
Plateau phase
As pH falls the dissolution rate of mineral carbonates increases (Stumm 1992) and greater
quantities of soluble bicarbonate form. For example, as pH decreases 9.0 to 7.5, calcite
dissolution rate increases from 10-10.5 mol cm-2 sec-1 to 10-10 mol cm-2 sec-1 and the dissolution
5
6
7
8
9
10
0 20 40 60 80 100 120 140 160
pH
mmol of H+
pH buffering capacity of alkaline soils PaskervilleArdrossanKeilira 1
MonartoMilnton
Keilira 2

78
rate of dolomite from 10-11.5 mol cm-2 sec-1 to approximately 10-11 mol cm-2 sec-1. Eventually
there is enough soluble bicarbonate present from this dissolution to offset the acid introduced
into the system and the rate of pH reduction is greatly decreased (i.e. the soils are buffered).
The extent of the buffering, (length of plateau), is dependent on the carbonate mineralogy. As
described above, rates of mineral dissolution are not uniform between carbonate mineral
forms, e.g.calcite dissolves faster than dolomite and ankerite.
The reactions are:
Calcite (Stumm 1992):
CaCO3 + H+ � Ca2+ + HCO3-
Dolomite (Sherman & Barak 2000):
CaMg(CO3)2 + 2H+ � 2HCO3- + Ca2+ + Mg2+
Ankerite (Balistrieri et al. 1999):
Ca (Fe0.61, Mg0.24, Mn0.093) (CO3)2 + 2H+ � Ca2+ +0.61Fe2+ +0.24Mg2+ +0.093Mn2+ +
2HCO3-
The bicarbonate provides the buffering reaction:
HCO3- + H+ � H2CO3
It is likely that because of the slower dissolution rate of dolomite and ankerite, those soils
with higher quantities of these minerals showed a stronger buffering intensity i.e. when
calcite had entirely dissolved into soluble form and reacted with the introduced protons,
solution pH fell and the dissolution rate of dolomite/ankerite increased, providing additional
buffering against further pH change. This is supported by a high correlation rate between the
proportion of dolomite and ankerite in the soil and acid needed to lower pH to less than 6 (r =
0.78). The larger quantity of carbonate minerals found in the clay component of the Keilira 1

79
and Keilira 2 soils is also likely to have contributed to the extended buffering capacity of
these soils.
Second phase of decline
Eventually all forms of mineral carbonate dissolve and react with the introduced protons,
exhausting the soil’s ability to buffer against further pH change and pH again decreases
rapidly. This state was achieved via the titration for the Paskerville, Ardrossan and Monarto
soils (Figure 5.4).
5.4 Conclusion
Crops grown in highly alkaline soils often display sub-optimal development due to
aluminium toxicity and other problems such as poor nutrient availability or high molybdenum
levels. Many of these problems only occur when soil pH is 9.2 or greater, a consequence of
which is that soil pH need not be reduced to neutral pH (6-8) to improve crop production, but
only to 9.0 or less.
It appears that high alkalinity (8.5 - 9.5) is primarily due to the presence of carbonate sorbed
to soil clay particles, probably via the mechanism of outer-sphere complexation i.e. sorbed to
a protonated hydroxyl group or surface metal cation. This association means the carbonate
cannot be leached and so high pH is maintained. In this pH range the dissolution rate of
carbonate minerals is slow enough that the quantity of carbonate available is not sufficient to
provide significant buffering capacity against acid induced pH change. The addition of acid
will result in a rapid decrease in soil pH.

80
At pH 8.0 or less, the dissolution rate of carbonate minerals is faster and provides a buffering
function against further pH change.
The practical significance of the above is that it requires very little acid to lower soil pH to
below 8.0. At this pH many of the problems associated with alkaline soils are no longer
evident, so it may be economically feasible to remediate alkaline soils in this manner in
cropping regions. Chapter Six explores and compares various methods that may be used to
alter soil pH.

81
5.5 References
Balistrieri, L. S., S. E. Box, A. A. Bookstrom & M. Ikramuddin (1999) Assessing the
influence of reacting pyrite and carbonate minerals on the geochemistry of drainage in
the Coeur d'Alene mining district. . Environmental Science and Technology, 33, 3347-
3353.
Lindsay, W. L. (1979) Carbonate equilibria. Chemical equilibria in soils. Wiley, New York.
Nelson, D. W. & L. E. Sommers (1982) Total Carbon, Organic Carbon and Organic Matter.
In A. L. Page, R. H. Miller & D. R. Keeney (eds.), Methods of soil analysis part 2 -
chemical and microbiological properties. Madison, Wisconsin.
Nelson, R. E. (1982) Carbonate and gypsum. In A. L. Page, R. H. Miller & D. R. Keeney
(eds.), Methods of soil analysis part 2 - chemical and microbiological properties.
Madison.
Nollet, L. M. R. (2000) Handbook of water analysis. Marcel Dekker, New York.
Sherman, L. A. & P. Barak (2000) Solubility and dissolution kinetics of dolomite in Ca-Mg-
HCO3/CO3 solutions at 250C and 0.1 MPa carbon dioxide. Soil Science Society of
America journal, 64, 1959-1968.
Sherrod, L. A., G. Dunn, G. A. Peterson & R. L. Kolberg (2002) Inorganic carbon analysis by
modified pressure-calcimeter method. Soil Science Society of America journal, 66,
299-305.

82
Sposito, G. (1989a) Soil acidity. The chemistry of soils. Oxford university press, Oxford.
Sposito, G. (1989b) Soil adsorption phenomena. The chemistry of soils. Oxford university
press, Oxford.
Stumm, W. (1992) Carbonates and their reactivities Chemistry of the solid-water interface.
Wiley-Interscience, New York.
Van Breemen, N., J. Mulder & C. T. Driscoll (1983) Acidification and alkalinization of soils.
Plant and Soil, 75, 283-308.

83
Appendix
Whole soil X-ray diffraction graphs
Monarto
Ardrossan
46- 1045 QUARTZ, SYN 36- 426 DOLOMITE 9- 466 ALBITE, ORDERED 5- 586 CALCITE, SYN 14- 164 KAOLINITE-1A 19- 932 MICROCLINE, INTERMEDIATE 41- 586 ANKERITE 43- 697 CALCITE, MG-RICH
File Name: u:\...\xrd\23425.xpt
1
2-Theta Angle (deg)10.00 20.00 30.00 40.00 50.00 60.00 70.00 80.00
2
4
6
8
10
Inte
nsity
(Cou
nts)
X 1
000
7.1514.484
4.251
4.025
3.844
3.7093.475
3.340
3.2443.186
3.025
2.9132.8332.6952.566
2.4892.456
2.279
2.234
2.1992.161
2.1272.089
2.026
1.9801.921
1.9081.869
1.817
1.801 1.696
1.671
1.6581.6221.601
1.540
1.5221.5041.4711.4531.4371.418
46- 1045 QUARTZ, SYN 36- 426 DOLOMITE 9- 466 ALBITE, ORDERED 5- 586 CALCITE, SYN 14- 164 KAOLINITE-1A 19- 932 MICROCLINE, INTERMEDIATE 13- 135 MONTMORILLONITE-15A
File Name: u:\...\xrd\23426.xpt
2
2-Theta Angle (deg)10.00 20.00 30.00 40.00 50.00 60.00 70.00 80.00
10
20
30
40
50
60
70
Inte
nsity
(Cou
nts)
X 1
00
7.211
4.466
3.849
3.7673.650
3.344
3.2473.185
3.029
2.836 2.576
2.491
2.458
2.281
2.236 2.126
2.090
1.981
1.922
1.9091.872
1.818
1.803
1.6721.659
1.623
1.602
1.584
1.541
1.5221.506
1.4701.453
1.4371.419

84
Paskerville
Minlaton
46- 1045 QUARTZ, SYN 36- 426 DOLOMITE 9- 466 ALBITE, ORDERED 5- 586 CALCITE, SYN 14- 164 KAOLINITE-1A 19- 932 MICROCLINE, INTERMEDIATE 13- 135 MONTMORILLONITE-15A 43- 697 CALCITE, MG-RICH
File Name: u:\...\xrd\23427.xpt
3
2-Theta Angle (deg)10.00 20.00 30.00 40.00 50.00 60.00 70.00 80.00
10
20
30
40
50
60
70
80
Inten
sity (
Coun
ts) X
100
7.1894.454
4.255
4.026
3.8363.7013.533
3.342
3.2963.2453.187
3.019
2.898
2.8292.6892.568
2.4862.458
2.410
2.277
2.2362.200
2.126
2.086
2.0201.978
1.9451.919
1.9061.866
1.817
1.8011.713
1.6721.6591.621
1.598
1.541
1.506 1.4691.4531.4341.419
46- 1045 QUARTZ, SYN 36- 426 DOLOMITE 9- 466 ALBITE, ORDERED 5- 586 CALCITE, SYN 14- 164 KAOLINITE-1A 19- 932 MICROCLINE, INTERMEDIATE 13- 135 MONTMORILLONITE-15A 41- 586 ANKERITE
File Name: u:\...\xrd\23428.xpt
4
2-Theta Angle (deg)10.00 20.00 30.00 40.00 50.00 60.00 70.00 80.00
10
20
30
40
50
60
70
80
Inten
sity (
Coun
ts) X
100
5.0014.499
4.256
4.027
3.848
3.470
3.343
3.2923.2473.190
3.027
2.8972.836 2.568
2.4872.458
2.281
2.236
2.200
2.126
2.090
2.0271.9781.922
1.9061.8701.817
1.672
1.6591.621
1.600
1.541
1.5221.5151.5081.4701.453
1.4371.419

85
Keilira 1
Keilira 2
46- 1045 QUARTZ, SYN 36- 426 DOLOMITE 9- 466 ALBITE, ORDERED 5- 586 CALCITE, SYN 14- 164 KAOLINITE-1A 19- 932 MICROCLINE, INTERMEDIATE 13- 135 MONTMORILLONITE-15A 41- 586 ANKERITE 43- 697 CALCITE, MG-RICH
File Name: u:\...\xrd\23429.xpt
5
2-Theta Angle (deg)10.00 20.00 30.00 40.00 50.00 60.00 70.00 80.00
8
16
24
32
40
Inten
sity (
Coun
ts) X
100
13.8827.211
4.580
4.2573.835
3.349
3.011
2.928
2.8192.576
2.481
2.431
2.270
2.214
2.129
2.082
2.031
1.981
1.8981.863
1.820
1.758 1.6721.620
1.6001.5921.540
1.5101.433
1.410
46- 1045 QUARTZ, SYN 36- 426 DOLOMITE 9- 466 ALBITE, ORDERED 5- 586 CALCITE, SYN 14- 164 KAOLINITE-1A 19- 932 MICROCLINE, INTERMEDIATE 13- 135 MONTMORILLONITE-15A 41- 586 ANKERITE 43- 697 CALCITE, MG-RICH
File Name: u:\...\xrd\23430.xpt
6
2-Theta Angle (deg)10.00 20.00 30.00 40.00 50.00 60.00 70.00 80.00
4
8
12
16
20
Inten
sity (
Coun
ts) X
100
14.832 4.500
4.252
4.037
3.8163.723
3.346
3.2413.187
3.007
2.925
2.804
2.602
2.560
2.473
2.457
2.424
2.2792.266
2.239
2.212
2.128
2.077
2.029
1.980
1.896
1.8591.819
1.803
1.673
1.594
1.5421.510
1.4781.4281.400
86
Chapter 6: Amelioration of aluminium phytotoxicity in alkaline soils
6.1 Introduction
Chapter Four established that Al is phytotoxic to plants in alkaline soils but that toxicity is
not significant until a pH of 9.0 is reached and not critical until soil pH is 9.2 or more. This is
attributed to the formation and dominance of aluminate in this pH range. Further, Chapter
Five established that many alkaline soils have little capacity to buffer against acid induced pH
change until soil pH has dropped to below 8.0, at which point the dissolution rate of
carbonate in soil minerals becomes fast enough to allow the release of enough carbonate to
react with protons and neutralise acidity.
With this in mind, it is possible that remediating Al toxicity in alkaline soils by lowering soil
pH may be feasible, as the soil pH need only be lowered to below 9.0 and not to neutral pH
values. Many alternatives have been trialled, (refer Chapter 2, Section 2.3.3), but their
comparative effectiveness needs to be assessed.
In this chapter the effectiveness of various methods in lowering soil pH are compared,
specifically:
1. Addition of chemical additives - Gypsum is a common soil additive used primarily to
improve soil structure. Some studies have shown it also has an effect on soil pH in alkaline
sodic soils (Batra et al. 1997, Chorom & Rengasamy 1997). This study seeks to verify the

87
effect of gypsum on soil pH in alkaline soils and use it as a benchmark against which other
remediation methods may be compared.
2. Addition of organic additives – glucose, molasses, horse manure, green manure and humus
are compared. This method primarily relies on increasing the population of microbes in the
soil which in turn secrete acid, lowering soil pH.
3. Use of leguminous plant root exudates – Plant roots are capable of releasing protons,
acidifying the soil. This study will determine the area of influence of the root exudates
(rhizosphere soil vs. bulk soil) as well as its efficiency compared to other remediation
methods.
4. Influence of worms on soil pH - There is a reoccurring idea in the non scientific literature
that earthworms can neutralise soil pH. Earthworm castings have a neutral pH and may
modify soil pH towards neutral over time. This study will verify if this is indeed possible.
Alternately, it may be possible to complex aluminium in high pH soils to a form no longer
accessible to the plant. A laboratory experiment is performed to determine if organic
compounds can complex aluminium at high pH, rendering it no longer accessible to plants.

88
In summary, this study will:
� Assess the effect of gypsum on soil pH.
� Assess the effectiveness of various organic additives in lowering alkaline soil pH.
� Relate point two above to the underlying soil microbial population.
� Assess the effectiveness of various leguminous plant types in lowering soil pH.
� Determine if worms can modify the pH of soils.
� Investigate if complexing of Al as a means of limiting phytotoxicity in alkaline soils
is a valid alternative to lowering soil pH.
� Determine the most effective of the above methods in lowering soil pH.
6.2 Methods
6.2.1 Experiment 1: Use of gypsum to modify soil pH
Gypsum (CaSO4*2H2O) is known to lower soil pH when added to alkaline sodic soils (e.g.
Toma et al. (1999), Muraoka & dosSantos (2002)). To determine the degree of change in soil
pH and provide a benchmark against which to compare other amendments, a pot experiment
was performed whereby 2 soils (Bordertown, Minlaton) were treated with gypsum applied at
a concentration of 2 g/kg, 5g/kg and 10g/kg with three replications for each treatment.
Gypsum was mixed throughout the soil. Water content was maintained at field capacity. pH
was measured 3 months after application of the gypsum. 1:5 soil solutions were prepared (8g
soil, 40 ml RO water) and shaken for 1 hour on an end over end shaker. pH was then
measured on an Orion pH meter.

89
6.2.2 Experiment 2: Use of plant root exudates to modify soil pH.
Two soils were selected (Monarto and Minlaton) to determine the effect of plant root
exudates on soil pH.
Four plant species were trialled:
1. Lucerne (Medicago sativa) SARDI 7 variety.
2. Faba bean (Vicia faba).
3. Peas (Pisum sativum) SARDI variety.
4. Vetch (Vicia sativum) Morava vetch variety.
These varieties were selected as they are commercial crops in their own right and hence, if
successful as soil ameliorants, it is likely their use would be economically viable.
Legume and faba bean seeds were placed in a plastic container and covered with very warm
water. When the seeds began to germinate (after approx. 3 days), they were transferred to a
sieve placed above the container and covered with a warm wet towel. After a further 3 days,
when roots had developed to a length of approximately 2-3 centimetres, the seeds were
placed in soil.
Vetch and lucerne seeds were placed upon filter paper in petri dishes and covered with 4ml of
RO water. The petri dishes were placed in a plastic bag and left for 1 week after which the
seedlings were planted.
In all cases, only healthy well developed seedlings were selected for planting. Four seedlings
were planted per pot, with three replicates per treatment. The plants were watered once per

90
week and treated with 100ml of Neutrosol nutrient solution once per week, 2 days after
watering. The experiment was run for 12 weeks after which soil was taken from two pot
locations:
1. Bulk soil – soil taken away from any root presence.
2. Rhizosphere soil – soil collected from around the fine root hairs.
Soil pH was determined using the method described in Experiment 1 (Section 6.2.1). Plant
material was then removed from the pots and the soil pH tested after a further 12 weeks (i.e. 6
months after planting of seeds).
6.2.3 Experiment 3: Plant root exudates used in conjunction with gypsum
An additional trial was made using gypsum applied at 5g/kg in combination with the addition
of faba beans (Vicia faba) or peas (Pisum satiuum SARDI variety). The trial was performed
to assess any cumulative effect on soil pH by combining chemical and plant root ameliorants
(for germination methods, see 6.2.2). Four plants were added per pot with three replicates per
treatment. Soil moisture was kept at field capacity. All treatments were left for 12 weeks after
which soil was removed at various depths from the pot for pH testing. Plant shoot and plant
root material were removed from the soil and soil pH retested after a further 3 months (i.e. 6
months in total after application of gypsum and planting of seeds).

91
6.2.4 Experiment 4: Use of organic additives to modify soil pH.
Three soils were chosen, (Monarto, Bordertown and Ardrossan) to test the effect of organic
additives on soil pH, with starting pH ranging from 8.6 to 9.5.
Six treatments were trialled:
1. Control (no additives)
2. Glucose
3. Molasses
4. Green manure (Lucerne (Medicago sativa) cuttings)
5. Horse manure
6. Humus
All additives were added at a concentration of 2% of soil weight (i.e. 20 grams of additive in
approximately 1kg of soil) and mixed evenly into the soil. Soils were kept moist throughout
the experiment, a prerequisite for microbial survival. Soil pH was tested once a month using
the method outlined in Experiment 1 (Section 6.2.1).
Four pots of soil were used per treatment (i.e. 3 soils times 4 pots times 6 treatments equals
72 pots in total). The experiment was run for 16 weeks.
Microbial analysis of soils
A microbial analysis was performed on the above soil treatments so that change in soil pH
could be related to underlying microbial populations. The analysis was carried out 5 weeks
after addition of the amendments. The analysis was performed by Fatty Acid Methyl Ester
(FAME) analysis using an Agilent 6850 gas chromatograph and Sherlock pattern recognition
software according to MIDI laboratory accreditation standards.

92
6.2.5 Experiment 5: Use of earthworms to modify soil pH.
The Minlaton soil was selected as the test medium and maintained in a moist state for all
treatments (400ml of RO water per pot initially, then as required), a prerequisite for
earthworm survival. Horse manure was selected as a food source for the worms.
3 treatments were performed, with 2 replicates per treatment.
1. Soil alone (1 kg per pot).
2. Soil plus 20 grams of horse manure.
3. Soil plus horse manure plus 100 red worms (Eisenia foetida) per pot.
Selected worm density was set well above natural field density (0.2 – 0.3 worms per 100cm3)
to maximise the likelihood of achieving a change in soil pH.
The worms were fed with 20 grams of horse manure twice weekly. For the soil/horse
manure/no worm treatment, the manure was removed and replaced twice weekly in line with
the soil/manure/worm treatment. The experiment was run for 8 weeks and pH tested at the
end of the period using the method described in Experiment 1.
6.2.6 Experiment 6: Complexation of aluminium to ameliorate Al phytotoxicity
Sodium acetate (NaCH3COO) was trialled to assess the ability of compounds to complex Al,
rendering it unavailable to plants. Two treatments were prepared:
1. A control consisting of 100 ml of sodium aluminate and 100 ml of RO water.
2. 100ml of 0.01 molar sodium aluminate combined with 100 ml of 0.01 molar sodium
acetate.

93
Anion exchange resin strips were inserted into each solution. The anion exchange resins
simulated plant root ability to take up negatively charged ions. The solutions were shaken for
1 hour on an end over end shaker. The anion exchange resins were removed and eluted with
0.5 molar HCl. The Al content of the elutions was measured via ICP analysis.
6.3 Results and Discussion
6.3.1 Experiment 1: Use of gypsum to modify soil pH
Application of gypsum decreased soil pH for both soils (Figure 6.1). Average soil pH
decrease when gypsum was applied at 2g/kg was 0.9 pH units. This increased to 1.2 pH units
when gypsum was applied at a concentration of 5g/kg and 1.4 pH units when applied at
10g/kg.
Gypsum reacts with the sodium common in alkaline sodic soils. Exchangeable sodium is
replaced by calcium and the calcium ions also react with soil carbonate forming calcium
carbonate (CaCO3).
Na2CO3 + CaSO4 � CaCO3 + Na2 SO4 ____________________________________1
precipitate
The calcium carbonate is precipitated, reducing the concentration of soluble carbonates in the
soil. As a result soil pH decreased from pH 10 and 9.7 to 8.4 for the Bordertown and
Minlaton soils respectively.
The large decrease in soil pH for the Bordertown soil at 2g/kg application rate is likely due to
lower level of carbonates found in this soil (refer Chapter 3, Table 3.2). For both soils, pH
decreased to less than 9.0 when gypsum was applied at 5g/kg. The marginal decrease

94
achieved when applying gypsum at 10g/kg compared to 5g/kg (0.3 of a pH unit) is not
economic given that Al phytotoxicity is ameliorated at a 5g/kg application rate.
Figure 6.1 Effect of varying concentrations of gypsum on soil pH after 12 weeks.
6.3.2 Experiment 2: Use of plant root exudates to modify soil pH
All plants trialled were able to reduce soil pH in both soils (Figures 6.2 and 6.3). Not
surprisingly, the effect was greater in soil taken from the rhizosphere (i.e. directly adjacent to
the root hairs) than in soil taken from the bulk soil. It is expected that organic acids exuded
by roots would be more concentrated closer to the roots. Average bulk soil decrease was 0.5
of a pH unit. Average rhizosphere decrease in soil pH was 1.1 pH units.
Lucerne and faba bean were most successful in lowering bulk soil pH. Average pH decrease
was 0.6 pH units for lucerne-treated soils and 0.7 pH units for faba bean. Vetch and faba bean
were most successful at lowering rhizosphere soil pH. Average decrease in soil pH for the
vetch trial was 1.2 pH units and for the faba bean trial 1.4 pH units.
For both soils, pH reduction in the rhizosphere zone was approximately double that found in
the bulk soil. Nevertheless, for both soils and for all plants trialled, soil pH fell below 9.0 in
both zones, meaning formation of negatively charged species of aluminium was inhibited.
7.5
8
8.5
9
9.5
10
10.5
Control 2g/kg 5g/kg 10g/kg
pH
Treatment
BordertownMinlaton

95
These results support other studies showing a decrease in soil pH in crop environments. For
example, Xu et al (2002) found an acidification rate of 1.26 kmol H+/ha/year for wheat-bean
crop rotations and 1.36 kmol H+/ha/year for wheat-lupin rotations. Similarly, Yan et al (1996)
found that eight legumes planted in 5 kg of soil released 32.7 mmol of H+, decreasing soil pH
by 0.4 of a unit in 45 days.
The effect of roots on soil pH may be highly variable however. The composition of root
exudates is dependent not only on plant species but the physiochemical environment with
factors such as nutrient stress, phosphorus deficiency and iron deficiency playing a part. One
of the primary factors determining organic acid levels in roots is their degree of cation/anion
imbalance. When roots take up an excess of cations, the negative charge required to balance
this may be provided by organic acids. This in turn affects the quantity of organic acid efflux
(Jones 1998).
According to Hauter and Steffens (1985) nitrate uptake by plants critically affects the extent
to which they acidify soil. If nitrate uptake is high, plants will recycle H+ ions released by
their cellular ATP pump back into the cytosol, however if nitrate uptake is low, the H+ ions
are not recycled but released into the soil, lowering soil pH. Plants with low nitrate uptake
then would seem ideal for rehabilitating alkaline soils.
While environmental conditions were kept constant between treatments in the experiment
decribed here, plant response to environmental factors was species-dependent, hence the
varying degree of effect by the plants on soil pH.

96
Upon removal of the plant from the soil, soil pH returned to pre-modified levels within 3
months (Figure 6.4A). It is likely that exchangeable sodium in the soil reacted with soil
carbonates such as calcites forming sodium carbonate and increasing soil pH. Then the
following reaction occurred:
Na2CO3 + 2H2O � 2Na+ + 2OH- + H2CO3 _________________________________2
The OH- was responsible for the rise in soil pH.
The lowering of soil pH then is temporary i.e. will cease when the plant is no longer available
to generate protons. The effect on pH of leaving plant material in the soil upon the death of
the plant rather than removing it will be considered in section 6.3.4.
6.3.3 Experiment 3: Plant root exudates used in conjunction with gypsum
When gypsum was applied to soil in conjunction with plants (field pea, faba bean), pH
reduction was of the same order as when gypsum alone was applied (Figure 6.5). However
soil pH did not rise upon removal of the plants (Figure 6.4B), with pH reduction maintained
for a further 12 weeks below 9.0. Gypsum removes exchangeable sodium whereas organic
acid exudates decompose soluble carbonates. Because of the removal of sodium, there is no
reformation of Na2CO3 (as represented in equation 2) and pH does not rise. Anecdotal
evidence suggests that effects of applying gypsum to soil may last for years, for example
Toma et al (1999) found that the effect of gypsum on exchangeable Ca and SO4 were
detectable even after 16 years. Long term studies are needed to confirm gypsum’s long term
effects on soil pH however.

97
Figure 6.2 and 6.3 Effect of varying plant types on soil pH after 12 weeks for Monarto and Minlaton soils
A B
Figure 6.4 Effect of plant roots (A) and plant roots + gypsum (B) on soil pH over time.
* plant material removed after 3 months
7
7.5
8
8.5
9
9.5
Control + nutrients
Lucerne Vetch Faba bean Field pea
pH
Treatment
Minlaton soil
Bulk soil
Rhizosphere soil
77.5
88.5
99.5
Control + nutrients
Lucerne Vetch Faba bean Field pea
pH
Treatment
Monarto soil
Bulk soil
Rhizosphere soil
7
7.5
8
8.5
9
9.5
0 months 3 months* 6 months
pH
TimeMonarto plants
Minlaton plants
8
8.5
9
9.5
10
10.5
0 months 3 months* 6 months
pH
TimeBordertown plants + gypsum
Minlaton plants + gypsum

98
Root systems of some plants may facilitate the movement of gypsum down the soil profile.
Jarwel et al (2001) found that the effect of gypsum on soil pH varied based on the type of
crop used, for example, Chickpea-canola was 4 times more effective than wheat-safflower in
modifying soil pH, a result which was attributed to the tap root system of the former.
Synergistic benefits may apply when plants and gypsum are used together then.
Figure 6.5 Effect of varying concentrations of gypsum used in conjunction with plant roots on soil pH after 12 weeks.
6.3.4 Experiment 4: Use of organic amendments to lower soil pH
The following is a summary of the effects of various organic amendments over time on soil
pH (refer Figures 6.6 – 6.9).
Control (no amendments). Only minor fluctuations in soil pH (0.1 - 0.2 of a pH unit) were
observed in all control soils over the study period. The small rise in control soil pH over time
is probably due to carbonate in the soil reacting with water:
7.5
8
8.5
9
9.5
10
10.5
Control 5g kg + faba bean 5g kg + field pea
pH
Treatment
Bordertown
Minlaton

99
CO32- + 2 H2O � 2 OH - + H2CO3
The carbonic acid breaks down into H2O and CO2 leaving the hydroxyl groups to increase
soil pH.
Glucose: The pH of the glucose solution itself was 5.7. Immediately after application, the
glucose had little effect on soil pH. Four to eight weeks after application, soil pH decreased
an average of 0.9 of a pH unit. This is attributable to increased microbial populations (refer
Table 6.1) After 8 weeks, soil pH began to increase, returning to pre-amendment application
levels or higher by week 16 for two of the three soils. This is probably due to the exhaustion
of the glucose as a food supply for the soil microbes leading to cessation of acid producing
activity. Soil pH increased due to the mechanism described above for the control. Alternately,
volatile fatty acids synthesised by the microbes could have reacted with soil carbonates
resulting in the formation of basic organic anions. Subsequent decarboxylation of these
anions resulted in the consumption of H+, neutralising acidity i.e.:
R-CO2 + H+ � R-H + CO2
Molasses: The pH of the molasses itself was 5.8. Soil pH decreased by an average of 0.5 of a
pH unit upon application of the amendment to the soil. After 4 weeks there was a further drop
in soil pH of approximately 0.2 of a pH unit on average (for the Bordertown soil, this
occurred between weeks 4 and 8). For all soils, this initial drop in pH was followed by a rise
to pre-amendment application levels after 16 weeks, probably via the same mechanisms
described for glucose.

100
Horse manure: The pH of the horse manure itself was 7.6. The manure had little impact on
soil pH upon application and pH remained fairly constant over the 16 week study. Some
studies have found that the addition of animal manure may actually increase soil pH. For
example Walker et al (2004) determined that the addition of cow manure to soils increased
soil pH by 1.6 – 2.0 pH units, preventing soil acidification. This could be due to the addition
of basic cations and production of NH3 during decomposition of the manure. Alternately, the
displacement of hydroxyl groups from sesquioxide surfaces by organic anions may be
responsible (Pocknee & Summer 1997). It is possible that the above mechanisms offset the
acidity introduced by microbes resulting in little net change in soil pH.
Green manure: The pH of the green manure itself (as measured in a 1:5 manure/RO water
suspension) was 6.0. Like the horse manure amendment there was little effect on soil pH
upon application and pH remained reasonably stable over the study period. Lignin and
cellulose found in green manure are some of the toughest, most slowly decomposing
components of vegetation and may have been indigestible to microbes over the time period of
the study. It is possible that, given more time, microbial action could further break down
these substances allowing successive species of acid producing microbes to feed and increase
in population, modifying soil pH.
Alternately, microbial breakdown of organic anions in the green manure may result in
increasing soil pH. These organic ions may also have contributed to soil pH change through
direct reactions with soil surfaces such as ligand exchanges between hydroxyl groups and the
organic anions (Tang & Yu 1999). As with the horse manure above, these processes may
provide a counterbalance to the acid produced by microbes, resulting in little change to soil
pH. Depending on the type of manure used, there may actually be a net increase in soil pH

101
over time due to the mechanisms referred to above (e.g. Tang and Yu (1999), Chorom and
Rengasamy (1997)).
Humus: The pH of the humus itself was 9.6. There was little effect on soil pH upon
application but soil pH increased slightly over the first 8 weeks (0.2 of a pH unit). From
weeks 8 to 16 soil pH remained constant (slightly elevated.) The small increase in soil pH
was likely the result of exudates released from the humus. Humic substances are formed from
the microbial degradation of dead plant matter such as lignin and hence are very resistant to
further microbial degradation. The mechanisms described for green and horse manures may
also be at work here, providing a counterbalance to microbial acid excretion.
Microbial analysis
Table 6.1 shows that microbial (both bacteria and fungi) population was far greater in the
Monarto soil than either Bordertown or Ardrossan soils i.e. 74% greater than the Bordertown
soil and 103% greater than the Ardrossan soil. This was almost certainly caused by the initial
soil pH. Total microbial population was extremely strongly negatively correlated with soil pH
(r = - 0.998), a trend applicable to both bacteria (r = -0.83) and fungi (r = -0.997).
Fungi are producers of organic acids such as oxalic acid and citric acid. (Gadd 1999)
According to Arvieu et al (2003) the presence of CaCO3 and NaHCO3 in alkaline soils
increases oxalate production by fungi and many species may exhibit increased proton efflux
in the presence of CaCO3. Casarin et al (2003) found that the fungi species R.roseolus
strongly acidified the rhizosphere, releasing oxalate ions and protons simultaneously. The
degree of proton efflux was highly species dependant however.

102
There is support in the literature that many microbes cannot tolerate alkaline conditions.
O’Dell (2000) found the alkali tolerance of actinomycetes decreased from 100% survival at
pH 7.0 to 70% at pH 12. Alkaline effects were strongly dependent on type of microbes
present however. Similarly, Bhardwaj (1974) found bacterial numbers decreased rapidly
when soil pH was greater than 9.5. It is possible then that in extremely alkaline soils (pH >
10), the strategy of increasing the population of acid producing microorganisms to decrease
soil pH may be of limited benefit.

103
Figure 6.6 – 6.9 Effect of organic amendments on soil pH over time.
7.5
8
8.5
9
9.5
0 weeks 4 weeks 8 weeks 12 weeks 16 weeks
pH
Time
Monarto Control
Glucose
Molasses
Horse manureGreen manure
8
8.5
9
9.5
0 weeks 4 weeks 8 weeks 12 weeks
16 weeks
pH
Time
Bordertown
7.5
8
8.5
9
9.5
10
0 weeks 4 weeks 8 weeks 12 weeks 16 weeks
pH
Time
Ardrossan
7.5
8.0
8.5
9.0
9.5
0 weeks 4 weeks 8 weeks 12 weeks 16 weeks
pH
Time
Average of all soils

104
Table 6.1 Effect of organic amendments on soil microbial population and corresponding change in soil pH.
Soil Treatment Bacteria kg/ha (‘000’s)
Fungi kg/ha (‘000’s)
Total Microbes kg/ha (‘000’s)
Change in pH
Bordertown Glucose 5.4 29.2 34.6 -0.8
Molasses 5.3 36.2 41.5 -0.8
Green manure 4 17.3 21.3 -0.1
Horse manure 3.1 4.4 7.5 0.0
Control 2.2 8.3 10.5 0.0
Humus 1.9 5.0 6.9 0.0
Monarto Glucose 10.7 82.7 93.4 -1.0
Molasses 7.6 30.2 37.8 -0.5
Green manure 5.3 14.1 19.4 -0.4
Horse manure 10.3 18.3 28.6 0.1
Control 9.9 10.8 20.7 0.0
Humus 3.1 9.2 12.3 0.4
Ardrossan Glucose 8.0 22.7 30.7 -1.3
Molasses 6.9 13.0 19.9 -1.9
Green manure 6 12.8 18.8 0.0
Horse manure 2.6 8.4 11 0.0
Control 5.9 10 15.9 0.0
Humus 1.6 6.8 8.4 0.1

105
6.3.5 Experiment 5: Use of worms to modify soil pH.
Soil pH of the untreated control soil and the soil/manure/no worm treatments remained
relatively constant over the 10 week study period (Figure 6.10). A reduction of 1.2 pH units
was achieved over the 10 week period to a pH of 8.0 for the soil/manure/worm treatment.
Figures 6.11 and 6.12 show that worms spread the manure throughout the soil, i.e. worms
came to the surface to feed and then dragged the manure down into the soil as they burrowed.
Soil pH then moved closer to that of the manure itself over time as the manure spread
throughout the soil.
Worm density decreased from 100 per pot to an average of 57 so the decomposing bodies of
the worms themselves may have released exudates and contributed to a lowering of the soil
pH. Also the spread of the manure through the soil may have increased the soil microbial
population which may in turn have lead to a decrease in soil pH via microbial acid secretion
although this seems unlikely given the results using horse manure in Experiment 4 (6.3.4).
More likely is that digestion of the horse manure by the worms may have further broken
down the horse manure releasing organic acids. Microbes may have been able to feed upon
the worm casts and subsequently secrete acid.
It is likely that the primary means by which worms can help to lower soil pH is by
distributing a given ameliorant throughout the soil. The effectiveness of this is contingent on
the nature and pH of the ameliorant itself.

106
Figure 6.10. Effect of manure and red worms on soil pH over time.
Figures 6.11 and 6:12 Photos showing distribution of organic matter (dark material) through the soil by worms.
7.5
8
8.5
9
9.5
0 2 4 6 8 10
pH
Time (weeks)
Soil only
Soil +Manure mod
Soil + Manure+Worms

107
6.3.6 Experiment 6: Complexation of aluminium: a preliminary study.
ICP analysis showed that Al content of the sodium aluminate/RO water elution was 9.1 mg/l
compared to 8.1 mg/l for the sodium aluminate/sodium acetate solution. This indicates that
some of the solution Al was complexed with the sodium acetate rendering it into a form no
longer available to the exchange resin (or plant roots). Complexation of Al then may be a
viable method to ameliorate Al toxicity in high pH soils, however such methods will do little
to solve other problems associated with high pH soil.
6.4 Conclusion
Figure 6.13 Decrease in average soil pH achieved via application of various ameliorants (Soil pH for plant ameliorants measured in the bulk soil).
Figure 6.13 shows that nearly all amendments trialled, chemical, organic or biological,
proved effective at modifying soil pH i.e. they lowered soil pH below 9.2, the point at which
negatively charged phytotoxic species of Al become dominant. In fact, those that successfully
decreased soil pH lowered it to below 9.0, meaning Al phytotoxicity would be minimised.
-1
-0.5
0
0.5
1
1.5
2
Uni
t dec
reas
e in
pH
ach
ieve
d
Treatment

108
Over the time-frame of the experiment, the worm study showed worms not so much to be an
amelioration method in their own right but rather help to increase the effectiveness of any
given amendment. The worms achieve this by helping to breakdown, distribute and mix the
ameliorant throughout the soil. A problem here is that earthworms generally favour neutral
pH soils (Bodenheimer (1935), Petrov (1946)); and alkaline soils may be detrimental to their
survival. For example, El-Duweini and Gabbour (1965) found that increasing soil pH from
7.25 to 8.25 decreased earthworm numbers significantly. This study supports that
assumption, with worm numbers decreasing by 43% in the trialled alkaline soils over the life
of the study. Worms then are unlikely to occur naturally in highly alkaline soils in numbers
great enough to significantly modify soil pH and, if artificially introduced, would be unlikely
to survive for long periods and would need constant replenishing.
Of the chemical ameliorants, glucose and molasses proved the most efficient at lowering soil
pH, but the short time frame (4 - 8 weeks) before pH began to rise into the highly alkaline
range again means the need for reapplication could render such methods economically
unviable (certainly in the case of glucose). While green manure achieved an average 0.2
reduction in soil pH during the study, in two of the three soils, soil pH at the end of the period
had risen to a level comparable to that of the control i.e. it is unlikely that the manure can
lower soil pH over the long term. This rise is likely due to the decarboxylation of organic
anions as it is decomposed by microbes (Yan et al. 1996) meaning the benefits of green
manure are problematical. This may be highly dependent on the species of green manure
used; more research is required here.
Gypsum was very effective in lowering soil pH and, importantly, the effects are long lasting,
although just how long requires further research. While utilising gypsum in conjunction with

109
plants did not result in greater reduction in soil pH than gypsum alone, it is possible that
gypsum can be used in smaller quantities when partnered with root exudates i.e. use plant
roots to lower soil pH, then smaller amounts of gypsum to maintain the low pH by causing
carbonate to precipitate. More research is needed to quantify the amount of gypsum needed to
maintain the lowered pH.
Application of gypsum has other benefits to crop production. Use of gypsum to reclaim sodic
soils has been shown to increase crop production by 10-75% in field trials (Kelly &
Rengasamy 2006) primarily by improving soil structure. Application of gypsum at 5
tonnes/hectare has achieved increases in wheat crop yield of up to 0.6 tonnes/hectare (CSSRI
2007-2008).
Plants too may have benefits beyond lowering soil pH. For example, organic acids secreted
by roots such as malate, citrate and oxalate are involved in processes such as nutrient
acquisition, metal detoxification and alleviation of anaerobic stress in roots (Jones 1998). The
plants themselves may be a viable crop in their own right, making the use of root exudates to
lower soil pH commercially viable.
In summary, this study concludes;
� Gypsum is the most effective ameliorant at lowering soil pH.
� Additive effects (beyond the scope of just lowering soil pH) are likely when gypsum
is used in conjunction with plant root exudates.

110
� Biological amendments, even when successful at lowering soil pH, tend to have short
term effects only and may actually be counterproductive over the long term. The
result is very dependent on the type of amendment used and the soil type.
� Worms may aid in lowering soil pH by spreading ameliorants down into the soil.

111
6.5 References
Arvieu, J., F. Leprince & C. Plassard (2003) Release of oxalate and protons by
ectomycorrhizal fungi in response to P-deficiency and calcium carbonate in nutrient
solution. Annals of forest science, 60, 815-821.
Batra, L., A. Kumer, M. C. Manna & R. Chhabra (1997) Microbial and chemical
amelioration of alkaline soils by growing karnal grass and gypsum application.
Experimental Agriculture, 33(04), 389-397.
Bhardwaj, K.K. (1974) Numbers of bacteria in saline-alkali soils determined by a plate
method. Soil Biology & Biochemistry, 6, 69-70.
Bodenheimer, F. S. (1935) Soil conditions which limit earthworm distribution.
Zoogeographica, 2, 572-578.
Casarin, V., C. Plassard, G. Souche & J. Arvieu (2003) Quantification of oxalate ions and
protons released by ectomycorrhizal fungi in rhizosphere soil. Agronomy for
sustainable development, 23(5-6), 461-469.
Chorom, M. & P. Rengasamy (1997) Carbonate chemistry, pH and physical properties of an
alkaline sodic soil as affected by various amendments. Australian Journal of Soil
Research, 35, 149-161.
CSSRI (2007-2008) Annual Report. Central Soil Salinity Research Institute Karnal, India.

112
El-Duweini, A. K. & S. I. Ghabbour (1965) Population density and biomass of earthworms in
different types of Egyptian soils Journal of Applied Ecology, 2, 271-287.
Gadd, G. M. (1999) Fungal production of citric and oxalic acid: importance in metal
speciation, physiology and biogeochemical processes. Advances in microbial
physiology, 41, 47-92.
Hauter, R. & D. Steffens (1985) Influence of mineral and symbiotic nitrogen on proton
release of roots, phosphorus-uptake and root development of red clover Zeitschrift fur
pflanzenernahrung und bodenkunde., 148(6), 633-646.
Jarwal, S. D., R. D. Armstrong & P. Rengasamy (2001) Effect of gypsum and stubble
retention on crop productivity in Western Victoria. 10th Australian Agronomy
Conference. Science and Technology: Delivering results for agriculture. Australian
Society of Agronomy, Hobart, tasmania.
Jones, L. J. (1998) Organic acids in the rhizosphere - a critical review. Plant and Soil, 205,
25-44.
Kelly, J. & P. Rengasamy (2006) Diagnosis and management of soil constraints: transient
salinity, sodicity and alkalinity. The University of Adelaide, Adelaide.

113
Muraoka, T. & R. V. dosSantos (2002) Nutrition of vigna plants on a gypsum amended
saline-sodic soil. Plant nutrition. Food security and sustainability of agro-ecosystems
through basic and applied research. Springer Netherlands.
Odell, S. P. (2000) Microbial reclamation of alkaline sodic soils. Department of Soil and
Water. University of Adelaide, Adelaide.
Petrov, B. C. (1946) The active reaction of soil (pH) as a factor in the distribution of
earthworms. Zoological Journal, 25(1), 107-110.
Pocknee, S. & M. E. Summer (1997) Carbon and nitrogen contents of organic matter
determine its soil liming potential. Soil Science Society of America journal, 61, 86-92.
Tang, C. & Q. Yu (1999) Impact of chemical composition of legume residues and initial soil
pH on pH change of a soil after residue incorporation. Plant and Soil, 215, 29-38.
Toma, M., M. E. Sumner, G. Weeks & M. Saigusa (1999) Long-term effects of gypsum on
crop yield and subsoil chemical properties. Soil Science Society of America journal,
39, 891-895.
Walker, D. J., M. Clemente & P. Bernal (2004) Contrasting effects of manure and compost
on soil pH, heavy metal availability and growth of Chenopodium album L. in a soil
contaminated by pyritic mine waste. Chemosphere, 57, 215-224.

114
Xu, R. K., D. R. Coventry, A. Farhoodi & J. E. Schultz (2002) Soil acidification as
influenced by crop rotations, stubble management, and application of nitrogenous
fertiliser, Tarlee, South Australia. Australian Journal of Soil Research., 40, 483-496.
Yan, F., S. Schubert & K. Mengal (1996) Soil pH increase due to biological decarboxylation
of organic anions. Soil Biology and Biochemistry, 28 17-24.

115
Chapter 7: Conclusion
The pot experiments detailed in Chapter Four clearly show that the concept of aluminium
phytotoxicity needs to be expanded beyond that occurring in acidic soils. Plant stem and root
development were significantly retarded compared to that induced by high pH alone,
confirming that this is a problem not limited to solution cultures (as shown by Ma et al.
2003), but probably affecting agricultural production in alkaline soil environments.
It was established that although some growth reduction may be observed at pH 9.0, critical
growth reduction occurs at a pH of 9.2 and beyond. Importantly, the amount of Al entering
the plant at this pH is of the same order as at neutral pH where phytotoxicity does not occur,
evidence that the phytotoxicity was driven by a speciation change in aluminium at high pH
rather than quantity of Al present.
The developing toxicity as pH approached 9.0 corresponded to an increased concentration of
negatively charged species of aluminium (mostly aluminate). It was shown that at pH 9.2
(rather than pH 7.0 as often stated in the literature) and above these anionic forms of
aluminium became the dominant species. It is very likely then that it is the anionic species of
aluminium which are responsible for the phytotoxicity observed in alkaline soils.
Remediation of alkaline soils then may not necessitate lowering soil pH to neutral but simply
to less than pH 9.0, where the concentration of negatively charged aluminate species is
greatly reduced. Significantly, many other problems associated with high pH soils such as
poor soil structure, decreased nutrient availability and carbonate toxicity may reduce below
this pH value as well.

116
Chapter Five showed that high alkalinity (> 8.5) is primarily due to the presence of carbonate
sorbed to soil clay particles, probably via a protonated hydroxyl group or surface metal
cation. The titration of alkaline soils showed that they have very little ability to buffer against
acid induced pH change until soil pH falls to below 8.0. At higher pH, the dissolution rate of
carbonate minerals is slow, so the quantity of carbonate available, mainly in the form of
soluble Na2CO3, is not sufficient to provide significant buffering capacity against protons.
The addition of acid caused pH to decrease rapidly.
At pH 8.0 or less, the dissolution rate of carbonate minerals is faster and this dissolved
carbonate is predominantly now in the form of bicarbonate. The dissolution of carbonate
containing minerals buffers against pH reduction below 8.0, reflecting the relationship
between pK (solubility) and pH in CaCO3 systems. Very little acid then is required to lower
soil pH to below 8.0 so it may be economically feasible to remediate alkaline soils in this
manner in cropping regions.
Because of this limited buffering capacity at high pH, nearly all of the amendments trialled in
Chapter Six proved effective at lowering soil pH to less than 9.0 and hence would likely
alleviate aluminium phytotoxicity caused by negatively charged species of aluminium.
While some organic amendments, (glucose, molasses), were successful at modifying soil pH,
increasing microbial populations which in turn secreted acid, the literature suggests that their
effectiveness can be highly variable in nature. The degree of success achieved with an
amendment such as green manure may be highly dependent on the type of manure and also
the characteristics of the soil, so it is important not to generalise the effect of these additives
to all manure and soil types.

117
While glucose and molasses were amongst the most efficient additives at lowering soil pH, it
may not be economic to use these on an agricultural scale. Also, for all organic amendments
trialled, pH began to revert to the highly alkaline range after 4 to 8 weeks. The need for
continual reapplication of the ameliorants could render such methods economically unviable
and certainly time consuming.
All plant types trialled were effective in lowering soil pH but again the effect is not long
lasting, with soil pH returning to pre-treatment levels within 3 months of removal of the
plants. This method then, like the use of organic amendments, would require the continual
reapplication of the ameliorant.
Gypsum, the benchmark ameliorant for this trial, was very effective in lowering soil pH and
there is evidence in the literature that its effects may be long lasting. Further study is required
to determine its long-term effects on alkaline soils.
Utilising gypsum in conjunction with plants did not result in greater reduction in soil pH than
gypsum alone, but stopped a rise in pH occurring upon removal of the plants, alleviating the
need for replanting. It is possible that by using plants to lower soil pH, only small amounts of
gypsum may need to be added to maintain it at the low level. More research is needed to
quantify the amount of gypsum needed not to lower soil pH but to maintain the lowered pH.
The additive effects of using gypsum and plant root exudates together, combined with the
other benefits attained using these ameliorants outlined in Chapter Six (e.g. improved soil
structure, nutrient acquisition etc) suggest that this may be the optimum method of reclaiming
alkaline soils and eliminating aluminium phytotoxicity.

118
Finally the study provides evidence that aluminium may be complexed with amendments to a
form no longer accessible to crops. However, while such a method may indeed alleviate
aluminium phytotoxicity, it will do little or nothing to alleviate other problems crops suffer in
high pH soils (e.g. poor soil structure, low nutrient availability) and so is not recommended.
In summary then this study concludes:
� Aluminium may be toxic to crops at high pH (> 9.0).
� This toxicity becomes debilitating at pH 9.2 and above.
� It is negatively charged species of aluminium that are responsible for this toxicity.
� Alkaline soils show little ability to buffer against pH change until pH is less than 8.0
due to the slow dissolution rate of carbonate containing minerals at high pH.
� Lowering soil pH to less than 9.0 via the introduction of acid then is a feasible method
of remediating alkaline soils
� The additive benefits of using plant root exudates to lower soil pH, then gypsum to
maintain the lowered pH is suggested as the most beneficial method of ameliorating
alkaline soils and alleviating aluminium phytotoxicity.
It is hoped that by confirming the existence of Al phytotoxicity in alkaline soils, determining
the characteristics of the species of Al responsible and trialling effective methods of
ameliorating the soils, the results and conclusions presented in this thesis may help to
improve agricultural crop production in alkaline soils in the future.

119
References
Ma, G., P. Rengasamy & A. J. Rathgen (2003) Phytotoxicity of aluminium to wheat plants in
high-pH solutions. Australian Journal of Experimental Agriculture, 43, 497-501.