chemical survey of the waters of mount meru, …
TRANSCRIPT

A. CHEMICAL SURVEY OF THE WATERS OF MOUNT MERU,TANGANYIKA TERRITORY,
ESPECIALLYWITHREGARDTO THEIRQUALITIESFORIRRIGATION.
BySTURDY,B.A.
Agriculture, Tanganyika),and
E. CALTON,B.A., and G. MILNE,M.SC.,F.I.C.
(East African Agricultural Research Station, A:mani).
In this paper are presented the results of a number of analysesof water-samples taken during the years 1931 and 1932 from thestreams and minor lakes occurring on the slopes of Meru, thedominating mountain of the district of Arusha, Northern Province,Tanganyika Territory. The work originated in the examination atAmani of a few samples from streams on the south-west of themountain, at the request of Mr. E. Harrison, Director of Agriculturefor Tanganyika, who on the occasion of a visit to the area inDecember, 1930, expressed the opinion that alkali salts, eitheroriginating naturally in the soil or introduced by irrigation, werepossibly causing injury to coffee, the principal economic crop of thedietnct. It is common knowledge, locally, that the streams drainingfrom Meru contain " soda" in greater or less amount, bu~ in spite ofthis they have been employed for irrigation, sometimes on a lavishscale. The results of these first analyses made it clear that asystematic chemical survey was desirable if guidance was to beoffered on the merits of this practice in the several divisions of thedistrict, and one of us (D. S., in his capacity as District AgriculturalOfficer, Arusha) began a series of periodical samplings of the principalstreams. The analyses were carried out by another of us (W.E.C.)in the soils laboratory at Amani. At a later stage, in view of therelevance of the whole subject to the study of the volcanic soils ofthe, area, it was decided to extend the samplings beyond the rangeoriginally contemplated, so as to include all waters rising on themountain whether or not they came into question for irrigation.This was done during a circuit of the mountain made by D.S. andW.E.C. in company in August, 1932.
There has resulted a body of information for which we use theword " survey " rather diffidently, for no chemical survey should be
1

content with single samples, and at many points we were able tosample only once. Yet the number of sub-localities examinedaltogether is fairly large, some streams were sampled frequently andat several points in their course, and there is a fair distribution ofthe sampling-dates over the seasons. Also it would be misleadingto call it a " preliminary survey," incomplete though it is in manyways; for there is no immediate prospect of further chemist's timebeing spared to amplify the work in the same district. The resultsare however sufficient to form a fairly clear picture.
Short accounts of the topography, climate, and (within thelimits of very scanty data) geology of the mountain are prefixed tothe analytical results as an aid to the discussion which follows them.Finally the agriculture of the district is briefly sketched, in so faras its practices touch irrigation. The conclusion is inevitably drawnthat the waters are for the most part of undesirable quality forirrigation purposes. It should however be made clear that this paperis not a discussion of the existence of an " alkali problem " in thearea, except on the evidence of stream-composition. Soil propertiesas such are touched upon only very briefly. The reconnaissance soilsurvey which is in progress as part of a joint programme of theDepartment of Agriculture, Tanganyika, and the Research Station,Amani, and to which this paper is in its degree contributory, shouldin due course enable irrigation-practice to take more account of soilproperties.
TOPOGRA,PHY OF THE MOUNTAIN.
Meru (14,995 feet) is the third highest of a series of volcanicpeaks that occur along a line running approximately east and westacross the north of the Territory. Its neighbours on the east areShira (12,800 feet), Kibo (19,300 feet), and Mawenzi (17,580 feet),which together make up the Kilimanjaro massif; and on the westMeandet, Mondul, EI Burko, and Essimongor, none exceeding 7,500feet. The plains at the foot of Meru are about 4,000 feet above sealevel. It rises very steeply, making much of its height at a meanslope of 30· to the horizontal. * On the east there is an extendingarm, of the mountain, trending somewhat southwards, and containinga large subsidiary crater, Engurdoto, and a smaller one, Meruni, thelatter at 5,000 feet. On the west there is a shorter arm with a highahoulder forming a plateau at 9,800 feet. On the northern face,below the edge of the main crater, there is a considerable conicalmass (Little Meru) having the appearance of being the eroded neckor crater-wall of an older volcano; and at lower levels on this slope
* See Meyer (1) (1909), who compares this angle with that of Kilimanjaro,namely 8 degrees (except for the summit-slopes), and attributes the differenceW a higher viscosity of the Meru lavas.
2
there are several notable lesser cones (e.g., 01 Doinyo Sambu, Longringo), some of which have relatively fresh craters. Around the settlemant of Engare Nanyuki at the north-east foot, and also on thesouthern and south-western lower flanks, are found numbers of smallervolcanic hills. Of those on the south, Kibwezi (6,300 ft.) overhangsArusha township, and still maintains a mantle of forest. Amongthese secondary hills to the south lies the crater-lake 01 BalbalDuluti.
Above 9,000 feet the main mountain is but a hollow shell. Fromthe north, west, or south it appears solid to the summit, but fromthe east the interior of the great crater is fully visible, for its wholeePtern wall has been blown out and is scattered in a litter of lavablQC~ over the countryside at the mountain-foot, towards Kilimanjaro.This scattering of the debris of the crater-wall has resulted in anirregular damming-up of the drainage from the eastern slopes in anumber of small lakes, having no outlet, at the foot of the mountain.The chief of these are Elduroto Ebor (the Sanya salt-pans) and theMomela lakes. (See analyses, Table IX.) Within the remainingnorth, west and south walls three concentric crater-formations havebe.en recognised (Uhlig (2) (1904), and (3) (1911», and in the innermost is an immense ash cone of extremely recent appearance, withlava-flows at its foot so fresh that Uhlig was led to consider that thelast outflow might have occurred within a few decades of his visit.The crater is 4 kilometres across internally, and is bounded byprecipitous walls except at the eastern breach, where the floor is8,900 feet above sea level. The highest point of the mountain is onthe south-west edge of the crater lip.
It is from within the main crater that the Engare Nanyuki riverflows, eastwards at first through the great breach, turning northwardsafter reaching the forest belt. It runs for some miles in a deepgorge, and after reaching the plain is lost in a swamp a few miles tothe north. This is the only considerable river going in this direction,the other north-flowing streams to the west being represented formost of the year by dry gorges, or small streams barely reachingbeyond the forest edge. (See Tables IX and X.)
The southward-flowing rivers may be divided into two groups, (i)those which run from the south-western slopes into the Masai steppe,and are lost in their river-beds or in swamps as are the northernstreams; (ii) those which unite in the south-east corner of the areato form the Kikuletwa river, and later join with Kilimanjaro watersto form the Ruvu (or Pangani), finally reaching sea at Pangani. Inthe tables of analyses it has been found convenient to make severalfurther sub-groupings of these south-flowing streams. The sketchmap shows the drain;:tge of the whole area, and indicates the samplingpoints by numbers corresponding to the sample-numbers in the lefthand column of the tables ..
3

SKETCH-MAP of MERU ••hewing STREAMS and; SAMPLING POINTS.Nuonb • ..". CO •.•.••• JooOD.t roo _-"".~.,_Q'....-t.-_ I,", 'lh. T ••ble •.
foot.pa'"
s,•.t. L UO.OOO £.." •• J.I. * .0 ~ n.1.., •..
-.-:~ ..••...~ .••..;~ --.-..~.=..___.•.....•*- .•..ShO ,,-w.-o.. i.~ a_ 6--_".
'.
\ - ..
~- ••. - _ ••.••• '*
tfauo.. .•• -·-", ~
c.:.'\;" .•( ••••. "''1 ••••. (IIs.l., •.•.-J
",,..-~

Including the settled lands on its lowermost slopes, ~e base onwhich Mere stands has an area of roughly 450 square miles, or abouttwice the size of the Isle of Man.
GEOLOGY OF THE MOUNTAIN.
Rock-exposures in the river gorges show that the older lavas ofthe main mountain and its secondary hills, while exposed and,weathered to form maturing soils on the southern flanks, are stillcovered by ash, tuff, and conglomerate on the other three sides andalso at the south-west and south-east corners. It will appear fromthe analyses that this principal distinction between the older (or atany rate more fully weathered) and the more recent (or at any ratefresher) rocks is well reflected in the dissolved matter of the streams.
Recorded geological information on the mountain is scanty.J. W. Gregory (4) (1921) emphasizes the fact that the lavas of EastAfrican volcanoes belong generally to the alkalic division, rich in sodaand poor in lime, and he quotes Mauritz (5) (1908) as follows onparticular rocks collected on Meru: "Mauritz shows the predominance of the alkaline lavas and kenyte .... He describesnephelinite .... from tuffs at Elduroto Ebor; also kenyte (trachydolerite) at 4,250 feet at the southern foot. On Meru as often elsewhere the lavas are especially alkaline, and include the phonolitickenyte of the Meruni crater and Towaila on the S.E., and a leucitenepheline-tephrite tuff at 5,900 feet on the E." It should be observedthat the above quotation, though carrying Gregory's authority, isperhaps misleading as to the state of petrological knowledge for themountain, for Mauritz had actually no more than one specimen eachfrom the five localities quoted, and in his original paper offers nogeneralisation. The rocks of the mountain as a whole, and particularly the ash, pumice, and tuffs which bulk so largely in the superficial covering of the west, north and east sides, still await the attention of petrologists.* The apparently very recent date of some ofthe rocks within the crater has already been referred to.
CLIMATE.
Meru receives rain during two wet s'easons, a short one in lateOctober and early November, and a long one from the middle ofMarch to the latter half of May. Following the long rainy seasonthere are two months of cold weather, after which temperatures
gradually increase till the break of the next rains. Rainfall recordshave only been taken within the narrow belt alienated for Europeansettlement, but from the scanty figures available an approximaterainfall map has been prepared sufficient for the purposes of thispaper.
* By the· kindness of the Director and officers of the Tanganyika GeologicalSnrvey, a number of rock-specimens collected in 1932 by one of us (G.M.) inconnection with the soil survey are now under examination at the Surveylaboratory at Dodoma.
4

,,I,\,
Lsoh'(iltS (ton lllches)
fOTeSr BOUlldCll)
Ro.l.. Lu.Jo' 7
t •,,~ J'~ -""
••..- *-_____ .••. Jooo- Shoo.'Tlbo. .a,~ ~L-' "-- ~\u 0. ..,.., P
..•
t
-- - - --
AfJfJroximate Map of Rainfall of Mount Meru.

The effect of an unequal distribution of the rainfall around themountain is shown by the natural vegetation. On the southern slopesMeru has been forest-clad from about 4,500 feet to 8,900 feet, abovewhich continuous forest ceases. Cultivation has now destroyed thisforest up to about 6,000 feet, above which the forest is reserved. Onthe other three sides the forest has never come so low down as onthe south, but there is little doubt that the line to which it nowreaches, and at which it is reserved, is a line to which it has beenthrust back, by grass fires, in quite recent times. On the north thelowest edge of the forest barely reaches down to 7,000 feet, and inone place a gap occurs right through it.
The areas of highest rainfall and of broadest intervals betweenisohyets are to the south and south-east. In this respect Meru differsslightly from its neighbour Kilimanjaro, which receives its greatestrainfall to the south and south-west.
SAMPLING.
The collection of samples began in May, 1931, towards the closeof the long rainy season. The streams then first sampled (Engare 01Motonyi, Selian, Engare Narok) were those near which the questionof alkali damage to coffee had arisen, and could be visited at approximately fortnightly intervals in the course of other duties. Thesampling was later extended as already described. Samples weretaken from as near as possible to the swiftest flow of the current.Some time necessarily elapsed during transit to Amani for analysis,but it is not considered that the analytical determinations, directedas they were to ends quite different from those in view when watersare examined for potable quality, were vitiated by the delay exceptin the case of pH values, to which reference is made in the nextsection.
ANALYTICAL METHODS.
The short account of these that follows will assist in the interpretation of the results.
Total bica'rbonate.-This reflects the total alkalinity of the water,i.e. the sum of the bases lime, magnesia, soda and potash, not combined as sulphate or chloride. It was determined by titration withN/20 sulphuric acid using methyl orange, and is expressed as " partsof bicarbonate-ion (HC03) per million of water." For every 100 partsof bicarbonate-ion recorded, about 85 parts of solid alkaline matter(mixed calcium, magnesium, sodium, and potassium carbonates)could be realised as residue on evaporation of the water.
" Soda " was determined by a method adopted by the AmericanAssociation of Official Agricultural Chemists (I), (1925) for the
5

examination of waters suspected to contain" black alkali." It represenfi$ the sodium and potassium bicarbonates (or carbonates) presentin the water, calculated for convenience as sodium carbonate (Na3CO.',,'in parts per million. The alkalinity it represents is included in, andis not additional to, that recorded as total bicarbonate. In column 8of the tables of analyses the "soda" alkalinity of the water iscalculated as a percentage of the total alkalinity after reducing bothto the same units.
Sulphate and chloride determinations, by the usual methods, arerecorded as parts per million of the respective ions.
The pH values that are recorded were determined colorimetrically by the Hellige comparator or electrometrically by the quinhydrone electrode. Salt errors were corrected for by making theassunfption that the total dissolved-salt concentration was effectivelyrepresented by the total bicarbonate. The colorimetric figures are inbrackets. At, the beginning of the investigation it was thought thatthe colorimetric pH tests would serve usefully in the field for diagnosisof alkalinity. It was soon found, however, that the method wassubject to several errors, e.g. the salt-error mentioned above, whichfor these waters is by no means negligible and cannot be estimatedin the field. Also it often failed to distinguish between waters ofvery different soda-content. The pH determinations were thereforegiven up, more especially as we were not concerned with biologicalconditions in the waters. The values are however given in the tablesas a matter of interest. The results of determinations made on longbottled samples cannot be expected to give very accurate or veryuseful information.
The determinations above-described are sufficient to classify thewaters from the original viewpoint of the survey (suitability for usein irrigation), but lead to only a partial statement of their chemicalcomposition and leave several questions of in.terest unanswered.They will be referred to below as the partial analyses. A more complete analysis has been possible for certain streams only, for whichthe numbers of samples available at one time were sufficient to allowof composite samples of large volume being made up. The resultsfor these streams are reported in Table XIII, which follows after thediscussion of the partial analyses.
6
COMPOSITION OF THE WATERS-PARTIAL ANALYSES."-
(See Tables I to X.)TABLE I.
ENGARE OL MOTONYI.
1
23456
~.. '8.:l ;.:::~ :~'..~~ ·!i .io . "8 CD ••••••••
••.• .Q ""Cl . (J ~.51l .;::~ 5 8 J3 "ft ~ i .s ,E;< 0" ~ .
III~ iii P=l : Z f:l.< w..9 Jj w. 0 6
p..
No.Locality. Date.p.p.m. p.p.m. % p.p.m. p.p.m.
19
Forest Station 2/ 9/31278180741277.5
8
Nairobi Rd. Drift 8/ 6/313022087997
9
"20/ 6/313552488010810
"
10/ 7/3138524674126
11
"24/ 7/3131522783126
16
"7/ 8/3131524088146
13
"22/ 8/3131423787346
18,
"2/ 9/3132821576117(8.1)
~"19/ 9/3131120877147(7.6)
21
"2/10/3133822275157(7.4)
22
"19/10/3131320073137(8.6)
.23
.,6/11/3130720276127(8.6)
24"24/11/3129420379116(7.6)
.25
"19/12/3131221078126(8.1)
26
"25/ 2/3232722579157(7.9)27
"22/ 3/3223716881125(7.6)-- -- -- -Mean (15 samples)
31721779146.5
.60
Mbugwe Rd. Drift 1/ 6/31282189,772457.6
7

TABLE II.BELIAN RIVER.
1
23456>.
..,~ "a.8 .~~ :.'''~]i 0)o. olO., •...•...; 'l:l..0 ., "'t:S C:>" 0 ~ cc d 0;::c;; ~ 0 0 ~ ce ~.-a .~0~CJo ClJcC~l'Tj"-o:a.
=Eo< ~ = : Z p.. J3 .S J5 C1.2 0 6 Q.,
No.Locality. Date.p.p.In. p.p.In. % p.p.m. p.p.m.
148
Forest boundary23/ 8/3225921696215
1
Drift,Farm 194 23/ 5/3126818278256
2
"8/ 6/3127919781225
3
"20/ 6/3128620583253
4
"10/ 7/3127219582226
5
"24/ 7/3126619685205
6"7/ 8/3131621177nd*2
7
"22/ 8/312711968396
28
"2/ 9/312951847288(7.0)
29
"19/ 9/312721928196(7.1)
30
"2/10/3126918981[25{7.61
31
"19/10/3142021659129(6.3)
32
"6/11/3127119382106(7.5)
33
"24/11/312521898696(7.7)
34
"19/12/31 .25218484125(8.6)
36
..22/ 3/3226719785126(7.4)---Mean (14 samples, No. 31 excluded) 27419381.5 155---35
Belian-SunoniFurrow
25/ 2/3228820281166(7.5)
61
"9/ 5/32203137781737.55
.•nd-not determined.B
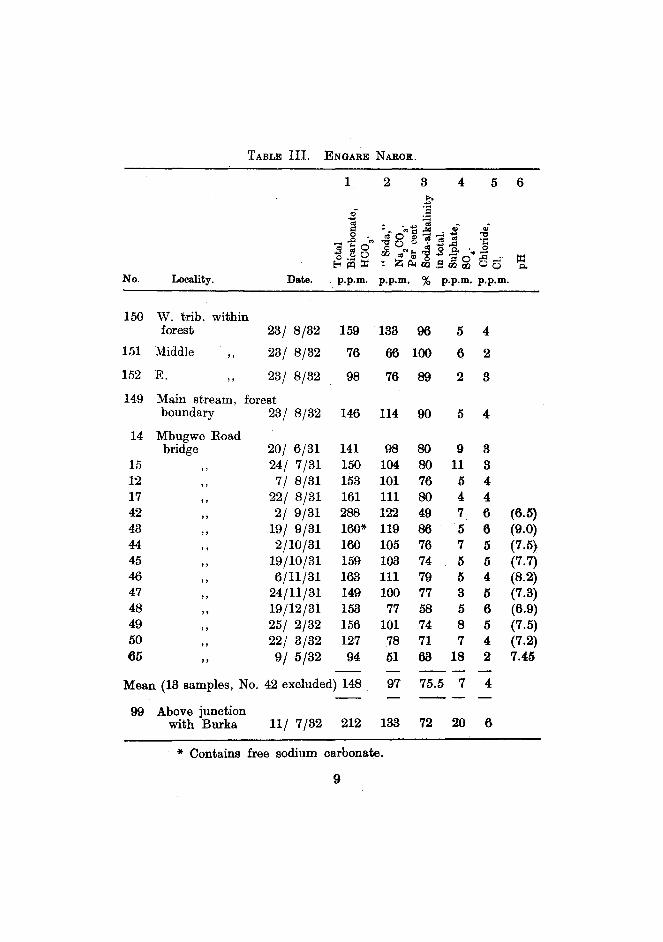
TABLE III. ENGARE NAROR.
1 2 3 4 5 6
No. Locality.
I»..,.. °a
~ :.=~ •••• ~ QS ••• 0)'"
§ -:e·o"~:!!!.....;~ "C
•...• of 0" "C 0 t) 'l' .! ;g '/::•• ", 0" "'op..·O+> '" 0 00 '" ~ "C.., •...•o":a . III~PSIIl : Z~~.SJjoo 00 p..
Date. p.p.m. p.p.m. % p.p.m. p.p.m.
150 W. 'trib. withinforest 23/ 8/32 159
151 Middle " 23/ 8/32 76
152 E. .. 23/ 8/32 98
133 96
66 100
76 89
5 4
6 2
2 3
149 Main stream,boundary
14 Mbugwe Roadbridge
15
12
17424344
454647
48
495065
"
"
"
""
forest23/ 8/32
20/ 6/3124/ 7/31
7/ 8/3122/ 8/31
2/ 9/3119/ 9/312/10/31
19/10/316/11/31
24/11/3119/12/3125/ 2/3222/ 3/329/ 5/32
146
141150
153
161288
160*160159163149153
156
12794
114
98
104
101111122
119105
10311110077
10178
51
00
80
80
76
80
49
8676
74
7977
5874
7163
5
911
5475755358718
4
33446655456542
(6.5)(9.0)(7.5}(7.7)(8.2)(7.3)(6.9)(7.5)(7.2)7.45
Mean (13 samples, No. 42 excluded) 148 97 75.5 7 4
99 Above junctionwith Burka 11/ 7/32 212 133 7220 6
* Contains free sodium carbonate.
9

TABLEIV.l3UBJtA-'l'm:,,:IRIVU SYSTEM.-1 23456~
.. ·S.s :.=•• ". J3 ••= "• .,..•. ~ U>o . .eo =-;- "Cl-of ""Clo~,.g.a '0::.g •• 0 0 •• .e .0 i:l. '•• 0o .S 0 ~.e ~ -g'" "3 0 :a ...•
=~ j:l:I= - Z c.. 00 .5 00 00 0 0i:l.
No.Locality. Date.p.p.ro.p.p.ro.%p.p.m. p.p.m.
63 Burka Spring No.2 (W)
1/ 6/32301207793147.5102
"" 11/ 7/3231623184188103
"No.1 (E)11/ 7/3236425079209
104"No.3 (upper) 11/ 7/32376262801910
62 Mololosyoke afHuent9/ 5/3224713663947.8il
37 Burka R. at Mbugwe Rd. bridge 19/10/31
327222781912(6.7}38
"""" 6/11/31325227801610(7.5)39
"""" 24/11/31335233801410(7.4)40
"""" 25/ 2/3233722677148(7.4}41
"""" 19/ 3/3233320972108(7.0}64
........ 1/ 6/32349229753077.8--
Mean (6 samples)33422477179
100 Burka above junction withEngare N arok
11/ 7/32480346833013
101 Burka below junction with Engare N arok11/ 7/3231621277229
51Themi at Arusha 3/10/31117565.~54(7.2)
52" " 19/10/31126766984(7.1)
53" " 25/ 2/32124787343(7.3)
54" " 31/ 3/32117727174(7.3}
68" " 6/ 5/3262254714?Tr. 7.45
L07.. .. 12/ 7/32102596762
Mean (6 samples)
108616573
LOB
Nauru R.,Arusha Township 12/ 7/32143584712466
"Loloda" Furrow, Themi R.2/ 5/328940521017.4
106 Themi below junction with Burka12/ 7/322081216796
109 Olgeju Loldiloi (Themi) below gorge13/ 7/322091256985
67 Kijenge R.2/ 5/3211933321627.45
L05 Kijengi R.near house, Farm 15112/ 7/32192613685-- 10

TABLE V. NDURUMU R., AND MANIRE-DuLUTI AREA.
1 2 3 4 5 6
No. Locality. Date.
112 Nduruma, Upper Rd. bridge 16/7/32 83
111 Nduruma, Moshi Rd. bridge 16/ 7/32 104
41 57
47 52
4 3
5 3
69 " 2/ 5/32 82 37 52 15 1 7.35
PO " at Olgedereda(lower Nduruma) 16/ 7/32 105 49 53 9 3
Mean (4 samples) 94 44 54 8 2.5
113 Manire Springs
114 Sinana Springs
115 Mkumbundu Springs
16/ 7/32 65
16/ 7/32 89
16/ 7/32 133
8 14 5 2
15 19 5 2
49 42 15 3
116 Manire R. at Moshi Rd.bridge 16/ 7/32 167 55 38 5 3
70 2/ 5/32 157 55 40 15 3 7.55
117 L. Duluti (N.E. edge) 16/ 7/32 198
118 Loingare Springs, Farm 97 16/ 7/32 141
11
89 52
72 59
6 6
15 4

TABLE VI. TBNGERU RIVBIt8.
1 2 3 4 IS 6
No. Locality.
.to'S
~ ;:::ce ••• ..:l CIS· •• '"'"8 - . .,~~.....;~ ~
..0 '•• ~ 0 ., ~ OJ OJ ••.•-~ooD~~~,.Q.~~ 5 0 00 .," ••• "0 .s ,.e.o":a . =~ i:Ci = : Z ~ ~ .S Jj 00 0 6 Q..
Date. p.p.m. p.p.m. % p.p.m. p.p.m.
7.55
7.6
7.35
7.6
7.45
7.35
(7.1)
(7.1)
3
3
4
2
2
2
4
4
2
2
5
2
3
15
5
6
4
2
4
5
35
2
5
5
4
8
9
8
13
5
2
68
70
56
71
66
72
70
50
45
52
74
61
62
55
71
76
72
55
35
24
47
35
49
36
70
81
72
71
64
65
70
105
85
80
63
1m
119
146
105
114
112
174
123
66
91
75
112
122
15/ 7/:52
2/ 5/32
9/ 6/32
9/ 6/32
2/ 5/32
16/ 7/32
15/7/32
15/ 7/32
15/ 7/32
2/ 5/32
16/ 7/32
16/ 7/32
2/ 5/32
30/10/31
13/11/31
"
" "" furrow, Farm 131
"
Nsungu·Makitengo junction(Upper Road) 15/ 7/32
Tengeru, above junctionwith Uriilo
Mpembe, Upper Rd. bridge
Tengeru, Moshi :Rd. bridgeMakumira R. above in·fall
of Karamu
" Moshi Rd. bridge
Kigeri R.,Capt. Rydon's dam
" Moshi Rd. bridge
Kigeri Ndogo Spring,farm 76
Kigeri R. at junctionwith Tengeru
Malala R., Upper Rd. bridge
Malala R., Moshi Rd. bridge
123
124
72
126
73
75
76
74
127
128
119
120
71
55
56
122
125 Tengeru R. at junctionwith Kigeri 15/ 7/32
121 Malala R. " " 15/ 7/32
129 Combined Tengeru Rivers belowMalala.Kigeri junction 15/ 7/32
112
96
117
65
46
69
67
55
68
3
4
6
4
4
5
12

TABLE VII.USA RIVERS.
1
23456»
..,cD
]..,<Il •.• ~ ce •..•..= -ei •• ~ ~ ....; .$ ~0 _ 1: .C1
'tl g Q ~. '" <Il '':
.g~go '" ..,..cl 0
00 ~"J-t "t:J ..s Q., -..,-~iXllIl- Z~~ =-=0 c3....; III- .~ r£l r£l 0 Q.No.Locality. Date.p.p.m.p.p.m.%p.p.m. p.p.m.-
145
Tema Springs,Magdarisho R.
15/ 7/32124726754
144
Magdarisho R., lower endof Tema Estate
13/ 7/32149816254
57
N durumanga Spring,Magdarisho R.
9/ 8/31113646655(7.8)
77
Magdarisho R., Moshi Rd.bridge
2/ 5/321287265737.55
140 Usa Springs
14/ 7/32136998465
139 Usa R.from Western Springs 14/ 7/32
112838633
138 Usa R. from Eastern Springs(above tributary fromNgongongare)
14/ 7/321661238586
137
Tributary to Usa R. fromN gongongare Swamp
14/ 7/322792219161
141
Usa R. at KilimanjaroSaw Mills 14/ 7/32
130998864
82 Usa furrow, intake
9/ 6/3214389711547.75
83 Usr. furrow, end
9/ 6/32146101791037.65
. 141 ;Loliondo Spring, Usa R.
15/ 7/32121716843
'18 U•• R., MOIhi Rd. bridge
2/ 5/321409679447.65
84
" ""9/ 6/321368874i537.65
143
II••"16/ 7/32130877754
13

TABLE VIII. MAll-VA-CHAI AND COKBINim USA RIYfts.
1 2 3 4 58
No. Locality. Date.
~]••• CIS ••••
". "~;!!!.....;oS ~
~ 0° 2l ~ .s ~ '':o ~ o..cl • 000 "," ~ 'g ~ ~ 0'. :cl....; =: Z p., 00 .5 00 00 0 0 ""
p.p.m. % p.p.m. p.p.m.
79 Chern Chern R., Moshi Rd.bridge 2/5 /32
136 Maji ya Chai Ndogo, on pathto Loliondo's Chai Estate 14/ 7/32
131 Garden Spring, Ngongongare,Maji ya Chai 14/ 7/32
277
341
174
201
277
124
84
93
82
3
3
8
4 7.9
4
6
5 4 7.9
6 1
5 4
7 5
11 1114 10 8.1
8 5 7.75
90
93
84
83
79
78
75
244 167
202 145
340 265I
326 264
244 177
151 98
150 102
16/ 7/32
2/ 5/32
8/ 6/32"""""80
81
146
132 ••Forest Stream,"Ngongongare,MajiyaChai 14/7/32 194 141 84 6 5
133 Southern tributary,Ngongongare,MajiyaChai 14/7/32 166 122 84 4 2
134 Maji ya Chai, Loliondo'sChai Estate 14/ 7/32 305 231 87 14 9
135 Maji ya Chai, MoshiRd. bridge
Combined Usa Rivers,Kalangai Drift 14/ 7/32
85 Combined Usa Rivers,Kalangai Drift 9/ 6/32
130 Kikuletwa R. below junction ofcombined Tengeru & Usa Rivers 15/ 7/32
147 Kikuletwa R. at EngareRongai Sisal Estates 14/ 7/32
14

TABLE IX. ENGARE NANYUKI RIVERS.
1 2 3 4 5
No. Locality.
»...,~ °8
..s :.:=
~ : .01) ~..= . (U~ .;o ·0 ....--...,;. "tJ
,.Q '•• " h ~ ., ., <IS •••-~o't1,-" cC""-:'''= F-4
~ .~ 0 ~ .," 6j "g ~ ~ C;;":a ...•E-l t:q ~ : Z Po; 00 .•• 00 00 0 0
Date. p.p.m. p.p.m. % p.p.m. p.p.m.
88 Engare Nanyuki (Mangas),Main Stream at Momela
87 Engare Nanyuki sweet streamat Momela
86 Engare Nanyuki below fallsat Momela
8/ 7/32
8/ 7/32
8/ 7/32
872*
627
723
732
522
579
97
96
92
159
59
93
76
32
39
93 Kimosan Spring
94 Kimosan furrow to Farm 29
89 Engare Nanyuki small stream,Momela Gate
91) Engare Nanyuki larger stream,Momela Gate
92 Engare Nanyuki at Kiranyi Ford
91 Kiranyi stream flowing acrosssalterns 1446* 1278 (>1001) 63
412 317 89 33
58 "
8/ 7/32
8/ 7/32
9/ 7/32
8/ 7/32
9/ 7/32
9/ 7/32
16/ 3/32
740*
742*
672
414
452
624
636
565
317
318
97
99
97
88
81
112
102
65
25
33
56
55
40
73
19
19
25
95 Kimosan ••Spruit," belowPolice Post 9/ 7/32 532 388 84 34 16
* Contains free sodium carbonate.
174 lIlomela Lake (2nd or principal lake) COa, 2494 ppm=Na~POa' 4404 ppm.HCOa, 3177ppm. = NaHCOa, 4376ppm.SO~, 890 ppm.=NaaSO~, 1316 ppm.Cl, 369 ppm.=NaCl, 608 ppm.
15

TABLE X. OL DOINYO SAMBU A~D NORTHERN STREAKS.
1 2 3 4 5 6
No. Locality. Date.
.t'S:=:l
: ~ ' •• "'5 ~ __ i ~~g2l~~,g .;::o "~~ 0 p... •.••• ~
00 ~ '" 0+>"30 .J:l __ I:I:\: Z P-t 00 .S 00 00 0 0 $:l.o
p.p.m. % p.p.m. p.p.m.
96 Natgonosais R., furrow toFarm 227
9/ 7/3220515889189
97 Engare Narok (N) It..,furrow to Farm 217
9/ 7/3239027581206
98 Valatia R., furrow to farm 214 9/ 7/32
31622281183
59
...... 14/ 3/32331217761~4(8.3)
For those streams which were sampled repeatedly at the samepoint the tables include an average figure, but the samplings are alsoreported individually in full, as the detailed figures possess an interestwhich a mere statement of averages would withhold. The averagesshould be regarded only as convenient signposts. For most of thestreams we can offer only a single analysis at anyone pomt. Interpretation of detail in particular cases should therefore be cautious,as small differences may have no significance.
In spite of sampling-limitations, however, the tables show veryclearly the features common to the Meru waters as a group, andalso that well-marked differences exist which correspond to thegeographical grouping of the streams and their head-waters aroundthe mountain.
The outstanding common features are, first, aI high, frequentlyvery high, proportion of •• soda " in the total alkalinity, and a correspondingly low content of the alkaline-earth bases; second, a relativelylow content of neutral salts (sulphates and chlorides).
The first point is illustrated by the following summary of thefigures bearing upon it in the tables. The samples came in all from90 localities within the area. The streams at only 10 localities (11samples) contained less than 50 per cent. of their alkalinity as,. soda." 75 localities (126 samples) contained 60 per cent. or more,
16

60 localities (110 samples) 70 per cent. or more, 37 localities (57samples) 80 per cent. or more, and 14 localities (15 samples) 90 percent. or more of their alkalinity as " soda." The absolute amountsof •• soda," calculated as parts of sodium carbonate per million ofwater, ranged up to 280 p.p.m. outside the Engare Nanyuki area,and up to 730 p.p.m. including that area but still excluding someextreme cases.
With regard to the second point above-mentioned, it will be seenthat figures exceeding 20 p.p.m. of sulphate or 10 p.p.m. of chlorideare. rare, exceEt in the Enga;l'e Nanyuki area.
Turning now from the common features to the differences, andconsidering first the soda-alkalinity, the range of variation met withand the position of individual streams can be judged from thediagram, Fig. 1. Here the total alkalinity is plotted horizontally~nd the percentage of soda-alkalinity in the total is plotted vertically.The data are those of columns 1 and 3 of the tables, and the pointsare labelled by their serial sample-numbers. Each locality (i.e.each separately-sampled point along the course of a stream) is represented once only, the averages being employed, in tbe ., signpost .,sense, for localities sampled repeatedly. In these cases the designating number on the diagram is that of the earliest sample taken.
The scattering of points is considerable, but they lie mainly inthe upper half of the diagram above the 50 per cent line. The highertot1-t1alkalinities lie. entirely above the 70 per cent. line, and thereis a general upward trend of the points towards the right-hand sideof the diagram. It appears from this that the local circumstanceswhich lead toa high total amount of alkaline dissolved matter leadalso, on the whole, to a high proportion of soda in it. (Two examplesof non-conformity with this will be noted later.) The converse ishowever not true. There are points above the 80 per cent. lineacross t.he whole width of the diagram: that is, streams of quite lowor moderate total dissolved matter may still contain a high proportion of it as ': soda."
With the aid of Fig. 1 and the data of the tables, it is possibleto group the waters by composition, adopting the percentage of" soda " in the total alkalinity to define the groups. The result isTable XI.
17

100-200 p.p.m.
} 200-400 p.p.",.150-201)p.p m.100--200 p.p.m.
Total bicarbonateName of stream. (approx. range).
Engare Nanyuki 400-800 p.p.m.
Maji-ya-Chai 1250-35Headwaters of Selian .I 0 p.p.m.
Headwaters of Usa \ 75-150 mHeadwaters of Engare Narok J p.p ..01 Doinyo Sambu streamsBurkaSelianEngare 01 MotonyiHeadwaters of Ma]j·ya·,Chi:l~Engare NarokThemi (variable)Usa RiverMagdarishoKigeriKikuletwaTengeru, lower reaches.Malala furrow
Malala, except Malala furrow 50--150 p.p.m.Tengeru, upper reaches.NdurumaLoingareThemi (variable)KijengeManire.Nauru
B 75- 85%
C 65---,80%
E 30- 50%
D 50-- 60%
TABLE XI.
GROUPING OF STREAM8 BY PERCENTAGE OF SODA IN TOTAL ALKA,LINITY.
Per cent. sodaGroup. in total.
A 85-100%
The significance of this grouping is at once apparent when it iseompared with the sketch-map and the notes on topography andclimate already given. Groups A and B, with the highest proportionof soda, form a horseshoe enclosing the mountain but open to thesouth, having its horns on the S.W. and S.E. flanks. These groupsinclude the dry northern aIIld western, ash- and tuff-covered slopes,also the region of the crater and the slopes carrying recent eruptivematerial, below its great eastern breach. Proceeding south-westwardfrom the eastern extremity of the horseshoe, and south-eastward fromits western extremity, Group C, with more modera.te proportion ofsoda, is entered upon from both directions, but it is not continuous
18

across the southern slopes, for the wet,test, southern face of the mountain is occupied by Groups D and E, with the lowest soda-content.Groups D and E drain the geologicwlly less recent, or at any rate morefully-weathered, formations, which carry brown or grey-brown loamsoils, as distinct from the powdery grey or yellow-grey immature soilsof the east, north and west.
The streams differ less markedly amongst themselves in neutralsalt content, except for the Engare Nanyuki and Kimoswn, whichto their high total alkalinity and Group A soda-proportion add ahigh content of both sulphate and chloride. It is, however,possible to distinguish a grouping amongst the other streams. Theircontent of sulphate and chloride is low and fairly uniform, but theratio of t,hese to total alkalinity shows an interesting geographicaldistribution round the mountain. In Table XII, total bicarbonate isput at 100 for all samples, a.nd sulphate and chloride recalculated proportionately. The streams are listed in the order in which they wouldbe encountered in proceeding round the mountain counter-clockwise,starting from 01 Doinyo Sambu.
19

TABLEXII.
PROPORTIONOF SULPHATEANDOllLORIDETO TOTALAUALINITY.Str~am8.
Bicarkmate.Sulphate.Chloride.
ROO"SO,01.
West and South-Wed. Engare Narok (N.) ...
...100...5'....2
Valatia .........100...5...1
Engare 01 Motonyi '"...100...4...2
Selian·.....·..100...5...2
Burka......···1100...6·..3
Engare N arok......100...5...8
Themi.........100...6...B-- --
Mean for the group·..100...5...2.5
South.Nauru
·..·.....100...8...3Kijenge
......••• j100...8·..3Nduruma
......100...9...3Manire
•• 00;
·.....100·..7...2
Loingare·........100...11...3
Ma1a1a...·.....100...10
....4--Mean for the group
·..100...9...3
South-east.Tengeru
......·..100...4...3Kigeri
.......(·..100...4·..2Magdarisb0
.........100...4...3Usa
...·..·.....100·..4·..3
Maji-ya-Ohai ...·..•• °1100...3...2
Kikuletwa......'·..100...4...2-- --
Mean for the group••• 1
100·..4...2.5
East.Momela Lake ...
......1QO••• 1
14·..7
Engare Nanyuki...·..100·..11·..4
North ..Kimosan
·..·.....,100·..7...4
Natgonasais
...'
·..·..100·..9...4
20

The figures for each natural group of neighbouring streams a;reclosely consistent among themselves, but those for different groups arewell contrasted. It appears that there is more sulphate per unit ofdissolved matter in the streams of the wet south side of :Mero thanelsewhere on the mountain except in the Engare Nanyuki and itstwo small northern neighbours. This point has some geochemicalinterest,. which is discussed la.ter; but the table as a whole emphasizesthe non-significance of dissolved neutral salt,s in the region generally.
A number of items of local interest in connection with particularstreams may be mentioned here before proceeding further. The orderfollowed is that of Tables I to X.
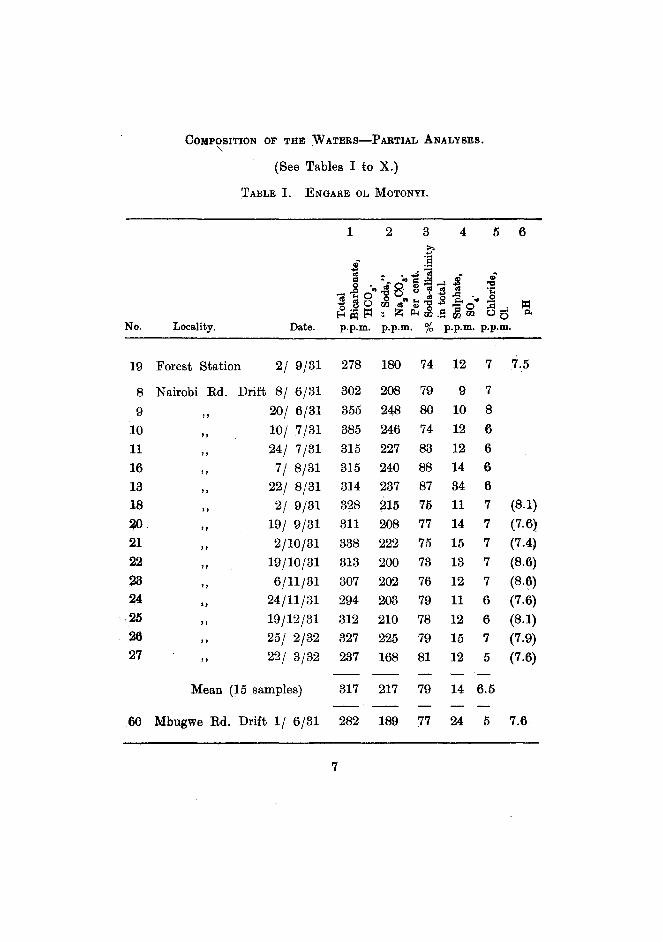
ENGAREOL MOTONYI(Table I). This is the farthest west of allthe streams on the south side, and eventually loses itself in the Masaisteppe between Meru and 01 Doinyo Lolkisale to the south-west. TheForest Station is some miles upstream and about 500 ft. highpr thanthe Nairobi Road Drift, whereas the Mbugwe Rood Drift is down~tream and about 100 ft. lower. The samples are consistent in (Iomposition throughout.
SELIAN(Table II). The Selian river loses itself in irrigationchannels and in its own bed before joining the Burka stream belowthe Burka Springs, but the dry watercourse can be traced to thejunction. The samples are somewhat lower in absolute amounts ofdissolved matter than those of Table I, but the percente,ge soda-alkalinity is similar. The sulphate-content varies rather more, butabout the same mean. No 148, taken a·t the forest boundary, up-stream of the other points of sampling, contains a markedly higherpercentage soda-alkalinit;y than the resh-contrast the parallel sample,No. 19, for Engare 01 Motonyi.
ENGARENARoK(Table III). This joins the Burka-Themi riversystem at certain seasons, but for much of the year the lower part ofits river-bed is dry. It has only a,bout hal~ the total alkalinity of itsneighbours to the west, but with a similar proportionate soda-percentage. Samples Nos. 150, 151, and 152 are of interest in that it wasnoted at the time of sampling that the tributary which now proves tocontain the greatest absolute Jo>oda-content(No. 150) drained a conglomerate formation while the other two came from lava. The forestsamples as a group resemble the Selian forest sample (No. 148, TableII) in containing a larger proportion of soda. than the main streambelow; their alkaline-earth content is extremely low. Samples 42 and48 present an anomaly which is discussed later (p. 25). The high pHvalue of No. 43 corresponds to its content of free sodium carbonate-an exceptional occurrence, not paralleled in this pa.rt of the district inany other sample, but occurring frequently in the Engare Nanyuki area(see Table IX). The usua;l form in which the " soda" occurs is of
21

course sodium bicarbonate, with a much less alkaline reaction to~dicators.
BURKA-THEMIRIVER8Y8'I'EM(Table IV). The Burka and theThemijoin some way south of Arusha, and therea.fter are known asthe OlgejuLoldiloi, which flows south-east in a deep gorge. Onleaving the gorge it turns due south and loses iteelf 10 miles furtheron in the Shambarai swamp.
The Burka clearly belongs as to composition to the group ofalkaline streams to the west. It has a maximum alkalinity just aboveits junction with the Engare Narok, and it appears from this and froma comparison of sample No. 99 of Engare Narok, taken near this point,with the rest of the Narok samples (Table III), that both strpamsreceive an accession of very alkaline seepage water from the groundnear their junction.
The Nauru, Themi, and Kijenge are of variable composition, butbelong as lJjwhole to the less alkaline groups. Some of the sampleswere amongst the purest waters found in the area. The Kijenge hasits alkalinity mainly in the desirable form of alkaline-earthbicarbonllltes.
NDURUMA(Table V). Few samples are available for this, but theyare enough to make it cleal1 that it is one of the purer rivers. TheNduruma flows into the Kikuletwa at a point below any sampling thatwas made of the latter river. It collecte practically the full amountof its flow within the forest reserve, and runs for the greater part ofits course in deep gorges lined with trees. It appears from sa.mples112, Ill, and 110, all taken on the same day, that an accession ofalkaline water is received, containing however a smaller proportion ofsoda, between the crossing of the upper foot-road and that of theArusha-Moshi main road. Presumably this is from the Songota andBaraa tributaries.
MANIRE-DuLUTIAREA(Table V). The Manire and Loingare riversfollow separate courses south-east, and eventually join the Kikuletwa.They are amongst the purer streams. The Manire receives its wa.terfrom springs arising below the forest level. These (Nos. 113, 114,115) vary a good deal amongst themselves.
Sample 117 was taken from the N.E. edge of Lake Dulutiandm8jy not fairly represent the lake as a whole. It contains somewhatmore soda than the streams of the neighbourhood, which may be duemerely to a precipitation of alkaline-earth bica.rbonates on the lakebottom, and a slight accumulation of soda in solution. The water isquite •• fresh," though there is no known surface inlet or outlet.
TENOERURIVERS.(Table VI). Under this head have been groupedthe Malala and all streams ea.st of it which join with the Kigeri before
22

flowing Bouth~east to the Usa River to form the Kikuletwa. Theybelong to Groups C and D of Table XI, ,and in general the head-watersha.ve less alkalinity than the lower courses.
USA RIVERS (Tables VII and VIII). In this group are placed allthe rema.ining rivers of the south side of the mountain. They all jointogether above the railway bridge at Usa River Station, and furtherdown join the Tengeru rivers to form the Kikuletwa.
Th~ Usa. River proper falls into Group G, but its own headwatersand the M3iji-ya-Chai fall into Group A with a very high proportionatesoda-alkalinity. All samples to the east of the Usa furrow (whichitself appears to receive more soda as it passes along) contain considerably more, soda than any others on the south of the mountain as far a.sbeyond Arusha on the west. The sources of the Maji-ya-Chai atNgongongare carry much less dissolved matter than the main streamfurther dovl'n, and by the time it reaches the Moshi road it has approximately doubled its content of soda. Much alkalIne seepage-waterevidently reaches it about its middle course.
The Kikuletwa in its lower course, after Itaving the Meru foothills,receives the waters of the Shira stream and the Kikafu River,both draining from western and south-western Kilimanjaro; but continues under the SMIle name until, at Arusha Chini, it receives theWeru-Weru, carrying the combined waters of the south flank ofKilimanjaro. An observation made by one of us (G.M.) at thisjunction is of interest. The Kikuletwa, carrying mainly Meru waterwith some addition of purer water from Kilima.njaro, was turbid, withpH=8.7 (a rough colorimetric test). The Weru-Weru, carryingKilimanjaro waters only, was quite clear, with pH=8.0 (March 26th,1932). The confluence is shown in the photograph, Plate II.
ENGARENANYUKI (Table IX). The course of the main stream hasalready been described (p.. 3). The Kiranyi stream flows acrossgrassy flats, on which, in many bare or scorched patches, soda-incrustations were much in evidence, at the time of sampling.* Sample No.87 is from a small tributary to the Engare Nanyuki, locally considereda •• sweet " stream.
These streams are by far the most alkaline, and also the mostsaline, of all the flowing waters of the Meru drainage. In four of thesamples free sodium carbonate was pres~nt, giving w red colour withphenol-phthalein.
The sample from the Momela lakes (No. 174) is a very concentrated water. The high soda- and salt-content of these lakes is dueto their lying in a closed drainage area, into which much water of the
* Soil samples taken in the green turf of these fiats have be~n found to havea pH =10.2, measured by the hydrogen electrode in a 1 :2i soil :watersuspension.
23

Engare Nanyuki character enters, and there concentrates byeva.poration.
OL DOINYO .SAMBU(Table X). These streams flow off the westernand north-western slopes, in deep-cut, precipitous gorges, and are lostin the plain. On the whole they resemble the streams of the southwest .
. COMPLETE ANALYSES OF COMPOSITE SAMPLES.
These are available for the Tengeru, Usa, and Maji-ya-Chai groupsof rivers onlv. The results are contained in Table XIII. The totalcontent of dissolved inorganic solids is represented by the figure•• salinity,' '* in parts per million. The figure •• soda" has the sameconventional meaning as in column 2 of 'fables I to X. The remainingfigures express the percentage composition of the dissolved inorganicsolids, all bicarbonates being calculated to their equivalent in normalcarbonates in arriving at the figure 100a. The absolute content ofsilica is also given, in parts per million.
TABLE XIII.
SalinityCOa0180.CaMgNaKFe20a + Al20a8i02
COMPLETE ANALYSES, COMPOSITE SAMPLES.
Tengeru R. Usa R. Maji-ya Chai.151 p.p. m 1~5 p.p.m. '" 28] p.p.m.
38.43% 46.14% 49.75%2.05 2.65 2.35
2.32 B.ll 2.399.74 7.96 4.2]1.13 0.52 ._. 0.57
16.17 24.79 29.544.24 6.28 7.132.52 3.11 2.21
23.40 5.44 ". 1.85
II Soda," p.p.m.8i02' p.p.m.
100.00
5735.5
100.00
918.5
100.00
2015.2
The new features brought out by the complete analyses are thegreat differences in the silica-content of the three rivers, the greatexcess of calcium over magnesium, and the considerable amounts ofpotassium present, occurring in a constant ratio of about one quarterof the amounts of sodium.
• An unfortunate term in the present connection, since the waters in questionare not appreciably ••saline" as the word is usually understood, i.e. theirneutral-salt content is small. We use the term here for the sake of uniformitywith the form of statement adopted throughout in F. W. Clark's standardcompilation (9) (1924), from which some analyses are quoted at the end ofthis paper for comparison.
24

It is clear tha.t the materials from which the three rivers derivetheir soluble matter are very different in character, or if originallysimilar, are now in very different stages of weathering. This will bediscussed presently.
OTHER DETERMINATIONS.
As has been mentioned, the ileterminations of hydrogen-ionconcentration were abandoned at an early stage, but the figuresobtained may be briefly commented on. In general they,are wellon the alkaline side, but afford little furiher guidance to the' amount orcomposition of the matter in solution. In two instances, however(No, 31, Selian, and No. 42, Eng. Narok), an anomaly occurs, whichmay indicate the presence in those samples of fair amounts ofphosphate. The pH values faU on the acid side of neutrality, yet theyare accompanied by an unusually high titratable alkalinity, of whichan unusually low proportion consists of •• soda." A third example,not so well marked, is No. 48 (Eng. Narok). Phosphoric acid is theonly one o~ all the weak acids likely to occur in natural waters thathas a greater dissociation-constant than carbonic acid; and the sug·gested explanation is supportBd by qualitative teats on the waters, bythe occurrence of phosphate in t·he salt-deposit samples to bedescribed later in this paper, and from the mention by Mauritz (loc.cit.) of apa.tite as an accessory mineral in all the rocks he examined.The kenyte from south Mel'll which he analysed had 0.63% P20~, afairly high figure.
It is of interest to note an example of how imperfect a picture ofa water's dissolved alkaline matter is given by either total alkalinityor pH, separately, or even by the two together when the soda-contentis not stated, from the recently-published accounts by Worthingtonand others ( (1) and (8) (1932)) of the results of the Cambridge
expedition of 1930-31 to the lakes of Kenya and Uganda. LakeEdward, with a titratable alkalinity of .01 normal, had pH =8.7 to 8.9.Lake George, alkalinity .002 normal or one-fifth of the other, had pH=9.3 to 9.9. The local evidence adduced as to soda-content is thatL. George receives none but relatively pure waters from Ruwenzori,a non-volcanic massif, while Lake Edward receives soda-bearing watersfrom the Mfumbiro volcanoes. Yet from the figures quoted above itmight have been concluded very reasonably that it was L. George thathad the higher proportion of soda in its total alkalinity, as shown byits much higher pH values.
The possibility that the Meru waters contain borates has beenconsidered, as boron compounds are often associa,ted with the productsof volcanic action. When present in water used for irrigation theymay be a cause of injury to crops. Thus certain Californian waters(see Schofield and Wilcox eO) (1931) ) were found to be damaging fruit
25

trees from this cause, and it was concluded that a boron-content ofmore than 1 part per million may be injurious to boron-senaitivGplants.
The det.ermination of boron in waters in such small amounts a.athese, even qualitatively, requires rather large sample.s and consider·able precautions, particularly in the use of boron-free laboratory gIBBs.ware. and in the present work both chemist'!; time and the quantitiesof sample were too limited for 11Sto proceed far in the matter. Someof t.be Selian, Engare 01 Motonyi, and Engare Narok samples wereexamined with results that were inconclusive except as indicating thatno very large quantities of boron are present. The matter may deservefuller investigation aot some tim~ if any question on the point arisesjn the district as a field problem.
The brown colour of the Maji-ya-Chai, and the red colour of theEngare Nanyuki-the origin of both their names-appear to be duesimply to the fact tha.t these alkaline rivers pass through, or receiveseepage from, swamps containing much humic material readily solublein alkali. Though already alkaline, the Enga.re Nanyuki at MomelaGate (far upstream) is quite clear and colo111'1ess,and the Maji-ya-Chaiupstream of Ngongongare has the same appearance. The MomelaLake sample (No. 174) is much more alkaline than any of the Nanyukisamples, but is practically colourless when its greenish scum isfiltered off.
INTERPRETATION OF THE RESULTS.
The trend of t.he conclusions to be drawn from the analyses, fromthe point of view of the use of the waters in irrigation, will havebecome apparent during the foregoing partial discussions. Thefeatures common to the area as a whole were noted on p. 16. It isclear that sodium sulphate, the characteristic salt of cert·ain types ofalkali-soils, a.nd sodium chloride, can be dismissed from considerationthroughout most of the district. The amounts of them are negligible,except in the Engare Nanyuki area, where in any case the waters areunsuita.ble on other counts.
The soda-content of the waters, and its relation to the alkalineearth bicarbonates present, is however a matter not to be dismissedso summarily. The state of affa.irs represented by the analytical datais one that renders caution necessary in matters of irrigat.ion throughout the whole area. This is not to say that water-qualit.ies at! a wholeare so bad that none of the streams may be safely used if properprecautions are ta.ken. But soda-alkalinit.y is an undesirable property,and it is so widespread in these streams, and its degree so high in manylocalities, that the general attitude in the district should be towardsavoidance of irrigation wherever possible: and if the case for irrigat.ing a particular farm or a particular crop is strong on all other counts
26

.and a decision to irrigate is taken, then the loca\l water should b8jexamined and advice sought on the best methods of using it safely.
The analysis by groups given in Table XI may be re-stated asfollows. The risk of encountering the disadvantages of high sodaconten1j diminishes as one passes from the districts of Groups A andE, where it is almost a certainty, through Group C where the totalalkalinity is likely to be less and the proportion of soda slightly less, toGroups D and E where lime-alkalinity bulks more largely in the totaland soda-alkalinity, though still present, is not very great.
The agricultural literature of semi-arid regions contains many8lttemptsto frame criteria by which a water may be judged when thelocal circumstances attending its use are known. For example,Hoagland and Christie (11) (1919) consider the dissolved matter foundin the water under four categories: primary and secondary alkalinity,which we may label for convenience I and II, and primary andsecondary salinity, III and IV. Ca.tegory I is approximately the•• soda " of our tables, II is the alkaline earth bicarbonates, III thealkali sulphates and chlorides, IV the aJkaline earth sulphates andchlorides. Roughly speaking, a water is the better the more it has ofII, and the worse the more it has of I and III, IV being indifferent inmoderate quantities. If calculruted in t,hese terms, for most Qf theMeru stream~ I is fairly high, II variable but on the whole. low, IIIand IV almost absent,. The conclusions on quality would therefore besimilar to ours above.
It is impracticruble to attempt, on tp.e data to hand, a labelling ofparticular streams as good, bad, or indifferent, except as· above in ageneralised statement of probabilities, and this is al~ we alre justifiedin offering. For most of the streams we have not examined seasonalfluctuations in composition, and uncertainties alwBiYsattach to theanalysis of single samples. But apart from these limitations, it isimpossible to judge a water finally without reference to how it is tobe used, and especially to the drainage that is to be provided. Arelatively pure water may do damage if it is used irresponsibly; andone of poor quality 'may do good service in the hands of one who isprepared to go to trouble and expense in providing against the riskshe is incurring.
As rega,.rds the other factors entering into one's judgment of anirrigation-water, an essential one, namely the degree of tolerance ofthe irrigated crop to concentrations of salt or soda in the soil, isalmost unknown for the principal crop of this are~. Coffee elsewherein the world is usually grown in places where the rainfall is ample and'the soils are leached, so that, the question dOOSlnot arise. The Mel'llarellj will itself no doubt provide the information, when its eetablishedpopulation of coffee-trees COmes to be studied in detail from this
27

viewpoint. Mention of the gross amounts of •• soda" likely to beinvolved per acre when irrigalting with typical waters, is made in theconcluding section of this paper.
From a geochemical point of view the composition of the strealli6:fits in very well with the other compunents of the picture for themountain. As has been mentioned, petrological information is scanty ,but that available is to the effoot thrut the rocks of Meru have beenderived from a magma which is basic or moderately basic, and alkalic.i.e. having a low to medium silica-content, and a predominance ofsoda-bearing minerals. Such rocks weather rapidly. Their firststages of decomposition yield carbonates of the alkalies (Na, K) andalkaJine earths (Ca, Mg)" the former in considerable excess. At alater stage, under humid conditions of weathering where the solubleproducts can be carried off, the silicates break down further, yieldingagain carbonates of the bases, together with silica, to the percolatingwaters; but as this stage is reached after the original excess of alkalibruses has been lost in the drainage, the carbonates are now principally those of the alkaline earths. 'Veathering is assisted by finenessof sub-division, and an ash or pumice will decompose throughoutits bulk more rapidly than a compact glassy or crystaJline lava undersimilar climatic conditions. Under moderate but periodic rainfall andhigh evaporation, an ash of the given composition will develop anabundance of alkali carbonates to be washed into the periodic streamswhich drain it; but they will be very incompletely washed out, andthe onset of the second (hme- a.nd silica-yielding) stage of weatheringwill be slow. The streamsl therefore receive much soda, proportionately little lime, and very little silica. This is the condition of GroupsA and B of Table XI. On the south of the mountain, however, zonesof high or moderate rainfall occupy the whole of the slopes. Such ofthe superficia~ rocks as were ash or tuff are probably weathered bynow quite beyond their first (soda-yielding) stage, and the main bulkof their soluble products has long since gone in the drainage of thepast. In so far as they have survived bodily removal by mecha.nicalerosion, their soluble products of to-day will be those of stage 2. Theunderlying hard lavas, more resistant to mechanical erosion andwea,thering more slowly, are likely to be yielding soluble productsof both stages, i.e. still containing much soda but with fair amountsof lime and silica. This corresponds with the ascertained compositionof the southern streams. The variable nature of the rocks from pointto point, and in pa.rticular the occurrence of relatively young depositoSin the neighbourhood of subsidiary craters or vents formed late in thevolcanic history of the mountain, will account for the feU>' localanomalies. The fact that the rivers of Tables VII and VIII (Usaand Maii-ya-Chai) lie on a sector having broad high-rainfall zones, andyet include some with notably high soda-content, is by no means an
28

anomaly, for the high-soda streams lie to the east, and drain theslopes below the great breach of the main crater. The superficialrocks here are either a fine powdery ash that must belong to arelatively late eruption, or shattered lava debris from the destroyedcrater-wall. They form a large bulk of material well advanced into,but not past, the early stages of weathering.
In view of the evidence from the complete analyses (Table XIII)that potassium occurs in a steady ratio along with sodium in thewaters, it wilt be understood that the word " soda " in the abovediscussions generally means soda and potash. The ratio of potassiumto sodium in the waters is however less than that commonly found ineruptive nepheline-bearing rocks. Mauritz (loc. cit. (5» gives noanalysis for his nephelinite, but a somewhat less basic trachydolerite(or kenyte) from the plain at the S. foot of Meru contained
SiOI52.7%
CaO5.0
MgO1.6
KP3.9
Thi$ is fairly typical of the. usual proportions of the alkali.bases in suchrooks. They are therefore yielding soda more rapidly, as theyweather, than potash, in proportion to the amounts present. Theeffect may of. course also be due in part to the occurrence of eruptivematerial on Meru much richer in soda than such rock-analyses as thatabove-quoted .would lead one to expect. The discussion cannothowever be carried further until more complete analyses are available,both of rocks and waters.
M/;\uritz's petrographic aescriptions include mention of sodaliteas an accessory mineral, and he reports 0.32% Cl in the above-mentioned trachydolerite. This is sufficent to account. for the small andvery steady chloride content of the waters (except Engare Nanyuki).It is unlikely that chloride is derived in appreciable amounts eitherfrom human pollution or as " cyclic" salt., i.e. salt returning fromthe sea via the rain-bringing winds.
Sulphur-bearing minerals are not mentioned by Mauritz, but it
seems likely that in these rocks the sources of sulphate are mineralsof: the noselite or hauynite type. As in other volcanic regions, nativesulphur 'and sulphides may possibly occur. Table XII appeared toindicate that the sources of sulphur occur more variably around themountain than do the sources of chloride. The waters of south andof north Meru contain more sulphate per unit of bicarbonate than therest. A.s regards the north, this effect and the high chloride-contentare probably both ascribable to the extremely fresh state of the recentejecta, .and especially the ash-cone, in the main crater where theEngare Nanyuki rises. Sulphates and chlorides are not improbably
29

there as direct reaction-products of acid volcanic gases upon alkali.rich minerals. As regards south Meru, the greater proportionatesulphate-content may conceivably reflect mineral differences, but may.(limply be due to the greater activity of vegetation under the moregenerous rainfall, and hence to a more rapid turnover of sulp'hur inthe deoomposition of plant-protein.
THE INFLUENCE OF RAINFALL. SEASONAL VARIATIONS.
It is to be expected that the composition of a stream at any givenpoint will bear some relation to season, and in particular to rainfall,for the different formations of the catchment area will not contributein the same proportions to the total volume of flow in times of heavyand light rainfall. For two of the streams sampled (Eng. Narok andEng. 01 Motonyi) we hoped to be able to trace the relationship. Thereare rainfall-measuring stations in the forest belt at their headwaters,and rough gauges of stream-volume were fixed at the points visitedfor the periodical samplings. The graphs constructed to compare thethree sets of observations have however afforded no conclusions exceptan indication that the effect of heavy rainfall is to dilute the watersomewhat-not a startling result, but showing that run-off water, inspite of its greater erosive power, carries off less dissolved matter thandoes percolating water penetrating the deeper soil horizons.
Some points however deserve mention. The fluctuations inchemical composition are relatively slight, except at the onset of thelong rains for the Engare Narok (samples' 50 and 65). rhere is a lowflow in both streams from August to October inclusive, which, asmeasured at the gauges, is partly due to the great demand for waterfor irrigation purposes during those months at points upstream. Thedemand is very much reduced by January when the main crops areharvested or are approaching harvest time, and still further byFebruary. The actual lowest water in the rivers if this is allowed foris probably at the end of January or early February, or some sixweeks after the end of the short rains. It may be noted that for theUsa River, on the wetter southern slopes, it ~s locally well known thatthe greatest flow comes two to three months after the greatest rain.The samples taken from the Usa in early May, mid-June, and midJuly (Nos. 78, 84, 143) therefore correspond approximately with periodsboth before and at the peak of the long rains; yet the differences indilution are relatively slight.
The graphs have not been considered worth reproducing forpublication. Their inconclusiveness has an interest as a demonstration that the seasonal behaviour of streams cannotO be profitahlystudied without setting up a thorough organisation for the work 0 Thereadings of a single rain-gauge near the headwaters of a river are
30

altogether too slender a basis on which to form an estimate of 1,hbprecipitation in its whole catchment area. If sampling-dates arespaced more than a few days apart, a spate or high-water peak mayeasily be missed and critical information thus lost. Yet if samplingis done very frequently, the burden both of travelling and of analyticalwork becomes serious. Stream-gauging with accuracy is no easymatter. And the observations should relate to the full cycle ofseaaons over several years. That such work upon some of the Memstreams would produce results of much scientific interest and localvalue, there can be no doubt; but it seems unlikely that the importance of the streams will justify undertaking it on economic grounds.
COMPOSITION OF SALT-DEPOSITS.
While collecting the water-samples the opportunity was taken toexamine and sample certain minor saIt-accumulations that oocur hereand there in the district. Analyses of these are given below (TableXIV).
TABLE XIV. SALT-DEPOSITS.
No. 1.Sanya.
No.2. No.3. No.4.Kiranyi. Engare Burka.
Nanyuki Falls.
No.5.Usa.
No.6.l'engeru.
BiOi
FeJO. }AlJO •.Ca. (PO",),CaSO~CaCO.MgCO.Na2S0~NaCINa,CO.NaHCO.
6.87%4.36
1.163.680.481.54
4.7443.0834.09
14.55%'11.08
2.365.41
2.692.95
34.9226.04
18.73%23,43
2.802.262.72
1.6430.0318.39
12.47%7.13
1.04tr.
8.54tr.
tr.56.8913.g3
9.10%11.57
1.52
5.37tr.
0.6054.4017.44
10.51%10.02
0.833.330.340.45
3,4847.7623.28
100.00 100.00 100.00 100.00 100.00 100.00
They consist of deposits at lake edges, and the residues left by seepagewaters as they evaporate. No.1 is a dirty grey amorphous materi.llwhich is deposited at the edges of the Sanya salt-lakes, whose wat3fsare very alkaline in reaction. No.2 is a similar sample from the Kiranyisalt flats near the Engare Nanyuki. No.3 was collected from theclift face at the Engare Nanyuki Falls at Momela. It has a lightbrownish colour and occurs in a conglomerate forma.tion at a depth of
31

about 100 ft. from the surface. Nos. 4, 5, and 6 are •• seep salts"that occur on the surface of the ground at Burka, Usa and Tengerurespectively.
They are all essentially soda-deposits, and confirm the generalpicture given by the water-analyses. The results are expressed aspercentages (in the sample) of constituents soluble in hot dilutehydrochloric acid. The alkali carbonates and bicarbonates, puttingsodium and potassium together, were calculated from the excess ofCO. and RCO. over that required to combine the alkaUne earths.The sesquioxides are conspicuously high in No.3, and appear to bemainly alumina. All samples contain phosphate in appreciableamounts, from which it would appear that the soils ~nd rocks of thedistrict carry phosphate in fair quantities. Sulphates and chloridesare present in minor amounts only, as in the waters. The molecularratio of Na.CO. to NaRCO. in the two lake-edge deposits is verynearly that of the mineral trona, which is the' chief soda mineralworked at Lake Magadi in Kenya.
All these salt deposits are collected locally by the natives and fedto cattle. ,Those at Sanya are in the Chagga country, the remainderare used by the Wa·Meru except that at Burka, which is'the propertyof the Wa-Arusha.
THE AGRICULTURE OF MOUNT MERU.
It remains to add a short account of the relevant features ofnative and European agriculture, to assist in placing the subject ofstream-composition in its proper relation to local economics.
NATIVE AGRICULTURE.
Two tribes are found on Meru, namely the Wa-Meru, who areakin to the western branches of the Wachagga of Kilimanjaro, and theWa-Arusha, a tribe speaking a language similar to that of the Masaiof the surrounding plains, and further imitating many Masai customs.The Wa-Meru OCCUp)fthe southern foothills of the mountain betweenthe Usa and Nduruma rivers, and the Wa-Arusha the south-westernfoothills between the Nduruma and the Engare 01 Motonyi. Bothadopt almoRt the 1l8me agricultunl practices. Neither tribe has beenlong in the land, but no trace of former inhabitants, if any, is to beobserved.
Old native furrows exist taking water from.aIl the streams in theareas above-mentioned except the two, Usa and Engare 01 Motonyi,which form respectively their eastern and western boundaries.Furrows of recent date are taken from all the streams on thesouthern slopes without exception. The Masai of the steppes surrounding Meru have two large furrows for the purpose of watering
32

stock. One, in the north, ca.rries water from the Engare Nanyuki onto the Engasserai plains between Kilimanjaro and Longido. Theother carries water from the Engare 01 Motonyi to the Kisongo plainssouth of Mondul mountain, west of Amsha. The construction ofthis latter furrow played a very important part in the history of thedistrict, for it was for this purpose that the Wa-Arusha were broughtby the Masai as slaves from the area south of MosIrt now known asAmsha Chini. After the completion of this work they were releasedand settled on the slopes of Meru ..
Both the agricultural tribes settled in forest country, approximately between 4,500 and 6,000 feet above sea level, and did not usethe grasslands for cultivation. This forest country has a soil of lightyeHpwish grey colour, dusty when dry and very open and light intexture, but apparently more mature than the grey soils of the grasslands. They irrigate extensively with water of the better qualities,the principal streams used by them being those of Groups C, D, andE of Table XI. The crops irrigated are chiefly maize, eleusine, andto a less extent bananas.
The rainfall over the original area occupied by the tribes variesfrom 25 inches in the extreme south-west of the Wa-Arusha countryto 60 inches and more along the forest boundary, and for the mostpart averages 45 to 50 inches.
PLANTATION AGRICULTURE.
From 1908 to 1914 under the former German Government largeareas of land about. Meru were alienated, and the cultivation of coffeewas commenced. Most of the early plantations were started in orimmediately adjoining the "Loliondo"* forest which formed thesouthern (lower) boundary of the land in native occupation. The soilhere is usually of a heavier type than elsewhere .. Though still dustywhen dry, it tends to cake in hard lumps, and is inclined to form asticky pan about one foot down. On these estates shade was usuallyestablished, using Grevillea robusta. The principal exceptions to thegeneralisation that the alienation was in or adjoining the Loliondoforest were the Usa-Maji-ya-Chai block of farms and the SouthAfrican Dutch settlements of Engare 01 Motonyi, 01 Doinyo Sambu,Kampfontein, and Engare Nanyuki, around the west and north ofthe mountain. The Dutch were however at that time almost entirelygraziers and cereal growers, and did not turn their attention to coffee.Their farms, and the other exceptions mentioned, are grasslands witha proportion of thorn and scrub, and. have a soil consisting of arelatively fresh volcanic ash. These ash soils may be divided into two
• Loliondo (a Masai name)= Olea H ochstetteri, Baker, or Linociera Welwitschii,:Baker, both Oleaceae, valuable timbers.

main types: those which are shallow and overlie a table of hard lava,more or less weathered, as at Usa and Engare Nanyuki, and thOlewhich are deep and overlie loose eruptive material, principallypumice, or semi-consolidated tuff.
The coffee planted in the early years was all heavily irrigated.For the most part the waters used were those of the comparativelypure central southern streams, as in the native-farmed belt, but theBurka, Selian, and also the Usa began to be used at this stage.Since the war there has been a great increase of coffee-growing, andpractically all the rivers have been employed for irrigation except thoseat 01 Doinyo Sambu, where there is not enough flow. Planting nastaken place to a greater or less extent in every part of the district,including large acreages on the immature grassland soils mentionedabove, where the cheap clearing costs proved an attraction. On m!'lnyplantations developed since the war shade has not been used, andespecially is this the case on the grassland soils.
Failures to establish coffee are only recorded twice. Both werein very dry areas where the waters of the Engare Nanyuki wereemployed for watering nurseries. Sample No. 92 may be taken asrepresenting the water used. In one of these cases the land hadbeen periodically flooded for years, to encourage a short turf for sheepgrazing. Here not only coffee, but maize too, failed. In the othercase, though coffee failed, maize is grown and irrigated successfullywith the water in question. In one further instance the coffee plantedhas died out almost entirely after yielding very large crops for twoor three years. The water used was the Kimosan Spruit, a tributaryof the Engare Nanyuki. The district where all these failures haveoccurred has probably not more than 20 inches of rain per annum, andthe irrigation would be, heavy.
Elsewhere around the mountain, including places along the forestedge at Engare Nanyuki, coffee is being successfully grown both withand without irrigation. ,There is, however, room for improvement inthe bearing life of the trees in certain areas. At present they maturein a very short time, and too large a proportion of them bear a fewheavy crops and then suffer serious defoliation and die. This conditionoccurs chiefly on the immature " ash " soils of the grass-and-thornscrub region.
For a period of years immediately following the war, practicallyevery plantation was irrigated-it could be said to be the universalpractice of the district. The irrigation of coffee is not now, howeve!:,carried on to the same extent as formerly. Many estates have abandoned the practice altogether in recent years, and a number of newplantings exist that have never been irrigated.
34
A Water Board under the Natural Water Supply Ordinancecontrols the use of water from all streams.
The practice most often adopted when irrigating coffee has beento fill with water a plate-like depression (termed a 8ahani, Kiswahili)around each tree. Thirty to forty gallons per tree at each wateringwould be applied in this way up to bearing age, and between 100 and150 gallons per tree to bearing coffee, these estimates including theloss by seepage in the network of furrows within the planta,tion. Asan average there may be 700 trees to the acre. A bearing plantationwould therefore receive between 70,000 and 100,000 gallons per acreat each watering. This may be done once, twice, up to as many asfive times per annum. In one case an irriga,tion was given every sixweeks except when rain fell fairly heavily. Taking now an exampleof the significance of the data presented in this paper in the light oflocal irrigation-practice, let us suppose 100 gallons given per tree,ofa. water containing 200 parts per million of sodium carbonate. Theamount of soda added per tree would be 100 x 10 x .0002 lb. =0.2 lb.per tree, or 140 lb. per acre, at each irrigation. If three irrigationsper annum are given, 420 lb., or nearly 4 cwt. of soda per acre arebrought on to the land. This may not be a net figure, for no accountis taken of any loss in through-drainage. But it is clear that in suchan example sodium carbonate, undoubtedly an undesirable soil constituent, is being brought in in quantities comparable with ordinarydressings of artificial fertilisers.
It is not the purpose of this paper to pursue the matter further,for its agricultural significance cannot be fully assessed without amuch closer analysis of factors of soil, soil management (especiallydrainage), climate, tolerance of crop to alkali, and so on, than is atpresent possible. A knowledge of the composition of the watersshould however be of assistance, within its limits, in the furtherhandling of some of the questions that must inevitably be raised bysuch a disturbing conclusion as that of the last sentence of theparagraph above.
COMPARISON WITH OTHER WATERS.
Partial analyses are available for a few other water-samples fromnorthern Tanganyika received at Amani during the course of theMeru survey. They contrast strongly with the Meru waters. Thusthree samples from Kiru and Ndareda, near Babati, had 30, 41 and53 parts per million of total bicarbonate, containing 0, 5%' and 17%(of the total as soda, respectively; sulphate and chloride from 2 to 6p.p.m.; pH 6.5 to 6.9. Volcanic rocks occur locally in the area inquestion, near the wall of the Eastern Rift Valley, but the drainageis mainly from the gneiss. Typical waters from gneiss are those of
35

East; Usambara, two. examples af which, bath fram feeders af the SigiRiver in the rain-forest at 3,000 to 3,500 feet, had 13 and 15 p.p.m~total bicarbo.nate, no. sada, sulphate and chlaride abaut 6 p.p.m.,pH 6.2.
An irrigatian-water used at; Engare Nairabi, N.W. Kilimanjaro,had 18 p.p.m. tata,l bicarbanate, sulphate 20 p.p.m. On the appositeside of Kilimanjaro., at Taveta, two. springs o.f a hard alkaline-earthwater occur, bath having 165 p.p.m. total bicarbanate, with anly 9%of it as sada, and very little sulphate and chlaride. It will be af grea.tinterest to explore the Kilimanjaro. waters in detail, when o.ppo.rtunityoffers.
With a view to assisting further a comparison of the Meru waterswith others, we reproduce below in Table XV, from variaus authorities,same co.mplete analyses o.f waters from elsewhere in East Africa, andalso. some from Europe. These are stated in similar terms to. tho.seused for the complete analyses of the three Meru rivers of Table XIII.
TABLEXV.COMPOSITIONOF DISSOLVEDMATTER,OTHERWATERS.---Typical European Waters.l'"::;
S
0<D
.!l::;.. ~
...•.sci
<D..,
.eZ •... •...
ell
~ ~., 0'" ",'".;::: ~~
..•~8;<;::so±:8 vi<D"~
.,0 ., .;., > ~~~~1) .ol.==-:::~ ...•e~8~o~~...• ~~~Z
~~ •.••0.ol .ol .•.•,..:n>~Zr;..~r;..$r;..eE-<E-<Cl
Salinity,p.p.m.
13517413016265343603272
CO, %
(approx.)
42.143.041.839.030.546.933.041.9
01...9.34.62.24.36.41.72.95.2
SO....1.90.255.67.414.18.027.7n.8
Oa...7.09.818.47.011.920.022.130.1
Mg...5.13.04.73.03.65.75.32.0
Na...t 25.1
17.75.417.710.66.23.42.3;K
... I 6.81.38.25.63.22.72.2Fe2Oa&AI2Oa
1.9--2.6-0.6-0.5
8i02
...7.614.720.610.817.37.72.9~ 3
100.00
99.85 100.00 100.00 100.00 100.00 100.0099.3
1.
Quoted fram the ariginal saurces by F. W. Olark (') (1924).2.
Calculated fram the data given by L. C. Beadle (8) (1932),pp. 171 and 207.
36

/ SUMMARY.
A chemical survey of the streams draining Mount Meru ho,s shownthat their characteristic common features area considerable, sometimes high, soda-alkalinity, .and a small, usually negligible, content ofalkali sulphates and chlorides.
The differences in the above respects, and particularly in thepercentage contribution of the alkali carbonates and bicarbonates tothe total alkalinity, enable a grouping of the streams to be made,which corresponds very well with the climatic and lithological featuresof the mountain on its various slopes.
The state of affairs represented by the analytical data is one thatrenders caution necessary throughout the whole area, when consideringthe use of any stream for irrigation. Guidance is given on the likelihood of encountering serious soda-alkalinity in the various districts.The greatest risk lies in the Engare Nanyuki area, the least in themiddle area of the southern slopes.
Seasonal fluctuations in composition are discussed for severalstreams, but this part of the work has been inconclusive.
An account is given of the relevant features of both native andplantation agriculture, with an example of the significance of watercomposition in terms of current irrigation-practice.
The discussion of "alkali," in the sense in which the word is com·monly used in regard to soils, is confined throughout to the evidencegiven by stream-composition only, in order not to anticipate the conclusions of the soil-survey and of field studies of coffee-behaviour thatare in hand.
Certain minor salt-deposits in the area have been examined, andfound to yield evidence in corroboration of the water-analyses.
ACKNOWLEDGMENTS.
We wish to thank Mr. E. Harrison, Director of Agriculture,Tanganyika Territory, and Mr. W. Nowell, Director of the East AfricanAgricultural Research Station, Amani, for the facilities which they haveafforded for the carrying out of the work; and also Mr. A. J. Wakefield,Senior Agricultural Officer, Moshi, for his interest and active assistance.
REFERENCES.
1. MEYER, Hans. Das Deutsche Kolonialreich, I, Ostafrika (1909); section•• Der Meru," pp. 242-248.
2. UHLIG, C. Vom Kilimanjaro zum Meru. Zeitschr. der Ges. fiir Erdkundezu Berlin (1904), p. 717, quoted by Meyer, loco cit. (1).
3. UHLIG, C. Die Tatigkeit des Vulkans Meru. Geogr. Zeitschr., 17 (1911),pp. 278-281. The plate illustrating this paper gives four excellent photographsof the interior of the crater-the lava-field, the ash-cone, and the crater-walls.
3'7

4. GREGORY, J. W. The :Rift Valleys and GeOlogy of East Africa (1sm).p.148.
5. MAURITZ, B. Ueber einige Gesteine des Vulkans Mern in Ostafrika.Tschermaks Min. und Petrogr. Mitteilungen, ';:1 (1908), pp.315-326.
6. Official and Tentative Methods of the .Association of Official .AgriculturalChemists, Washington (1925), p. 108.
7. WORTHINGTON, E. B. The Lakes of ;Kenya and Uganda Geogt.Journal, 79 (1932),pp. ';:15-297,analyses on p. 292.
8. Scientific results of the Cambridge Expedition to the East .African Lakes,1930-31-4, The waters of some East .African Lakes in relation to theirfauna and flora, by L. C. Beadle. Journ. Linnean Soc., 28, Zoology (Oci.,1932), pp. 157-203,esp. pp. 193 and 195.
9. CL.ARK, F. W. The Data of Geochemistry, Bull. 770, U.S. GeologicalSurvey (1924), section on lakes and rivers.
10. SCHOFIELD, C. S., and WILCOX, L. V. Boron in Irrigation Waters,U.S. Dept. .Agric. Tech. Bull. No. 264 (1931).
11. HO.AGL.AND,D. R., and CHRISTIE, .A. W.. The effect of several typesof irrigation water on the pH-value and freezing-point depression of varioustypes of soils. Univ. Californa Publ . .Agr. Sci. 4 (1919).
The comprehensive paper by F. Jaeger (Geogr. Zeitschr., 1906) on whichMeyer apparently bases his account in (1) above, has been available to us onlyin the form of a short abstract in Geogr. Journal, 29 (1907), p. 88.
38

PLATE I.
Meru from the south slopes.Photo: D. Stu1'dy.
Mern from the south-east slopes, showing both walls of the crater.Photo: D. Sturdy.
JHel'u horn the forest edge, near the headwaters of the Engare Narok(c<r.nl.'h. TT~"''''''+ ,.,1 ........•...."'.-. \

PLATE II.
;onfluence of Kikuletwa (1.) and Weru-Weru (1'.) in gallery-forest at Arusha-ChinPhoto: G. Milne.
Lolonclo forest, Tengeru, south slopes of Meru.Photo: G. Milne.