chemical fluxes in time through forest ecosystems in the uk – soil response to pollution recovery
TRANSCRIPT
lable at ScienceDirect
Environmental Pollution 158 (2010) 1857–1869
Contents lists avai
Environmental Pollution
journal homepage: www.elsevier .com/locate/envpol
Chemical fluxes in time through forest ecosystems in the UK – Soil responseto pollution recovery
E.I. Vanguelova a,*, S. Benham a, R. Pitman a, A.J. Moffat a, M. Broadmeadow b, T. Nisbet a, D. Durrant a,N. Barsoum a, M. Wilkinson a, F. Bochereau a, T. Hutchings a, S. Broadmeadow a, P. Crow a, P. Taylor a,T. Durrant Houston c
a Centre of Forestry and Climate Change, Forest Research, Alice Holt Lodge, Farnham, Surrey GU10 4LH, UKb Forestry Commission, England, Alice Holt, Farnham, Surrey GU10 4LH, UKc DG Joint Research Centre - European Commission, Institute for Environment and Sustainability, Land Management & Natural Hazards Unit - TP 261, Ispra, I-21027, Italy
Forest soils are recovering from acid and sulphur pollution in the UKuncertain.
, but soil responses to nitrogen deposition and climatic changes are still
a r t i c l e i n f o
Article history:Received 17 February 2009Received in revised form13 October 2009Accepted 27 October 2009
Keywords:Acid depositionChemical fluxesDissolved organic carbonForest ecosystemsLong term monitoring trendsNitrogenSulphurSoil solutionThroughfallBulk precipitationSoil response
* Corresponding author. Tel.: þ44 1420 526174; faxE-mail address: [email protected]
0269-7491/$ – see front matter Crown Copyright � 2doi:10.1016/j.envpol.2009.10.044
a b s t r a c t
Long term trend analysis of bulk precipitation, throughfall and soil solution elemental fluxes from 12years monitoring at 10 ICP Level II forest sites in the UK reveal coherent national chemical trendsindicating recovery from sulphur deposition and acidification. Soil solution pH increased and sulphateand aluminium decreased at most sites. Trends in nitrogen were variable and dependant on its form.Dissolved organic nitrogen increased in bulk precipitation, throughfall and soil solution at most sites.Nitrate in soil solution declined at sites receiving high nitrogen deposition. Increase in soil dissolvedorganic carbon was detected – a response to pollution recovery, changes in soil temperature and/orincreased microbial activity. An increase of sodium and chloride was evident – a possible result of morefrequent storm events at exposed sites. The intensive and integrated nature of monitoring enables therelationships between climate/pollutant exposure and chemical/biological response in forestry to beexplored.
Crown Copyright � 2009 Published by Elsevier Ltd. All rights reserved.
1. Introduction
During the last two decades, much attention has been devotedto the effects of acid rain. The main cause of acidification was theemission of sulphur and nitrogen compounds (SO2, NOx and NH3)into the atmosphere. Detrimental changes to soil and waterecosystems due to acid deposition and acidification have led to thedevelopment of national and international policies aimed atreducing emissions of acidifying pollutants. For example, in Europereductions were agreed as part of the Gothenburg Protocol in 1999,which targeted emissions reductions of sulphur dioxide, nitrogenoxides and ammonia of 80%, 50% and 12%, respectively, by 2010when compared to the 1990 baseline (Jenkins and Cullen, 2001).
: þ44 1420 520180..uk (E.I. Vanguelova).
009 Published by Elsevier Ltd. All
Increasingly, policies have adopted an effects-based approach toproposing solutions for environmental problems and implement-ing emissions reductions in a targeted and cost-effective way. Asa part of this process there is a need to provide policy makers withinformation highlighting the consequences of changing emissionson the environment and its constituent ecosystems.
Many environmental pollutants (particularly S and N compounds)can affect the functioning of forest ecosystems (Luttermann andFreedman, 2000). The availability of N compounds controls manybiogeochemical processes and has a strong influence on net primaryproduction in terrestrial ecosystems (Pussinen et al., 2002; Hyvonenet al., 2007). Deposition of N and S can also cause soil acidification,leaching of base cations and aluminium from the soil (Stoddard et al.,1999) and increased movement of nitrogen compounds, base cationand aluminium into surface waters (Beier et al., 2001). It has beensuggested that more forest ecosystems will reach a state of nitrogensaturation and nitrogen leaching from soils may increase (Eichhorn
rights reserved.
Sitka spruce
Scots pine
Oak
Tummel
Grizedale
Sherwood
Thetford
Savernake
Alice Holt
Rannoch
Loch Awe
Coalburn
Llyn Brianne
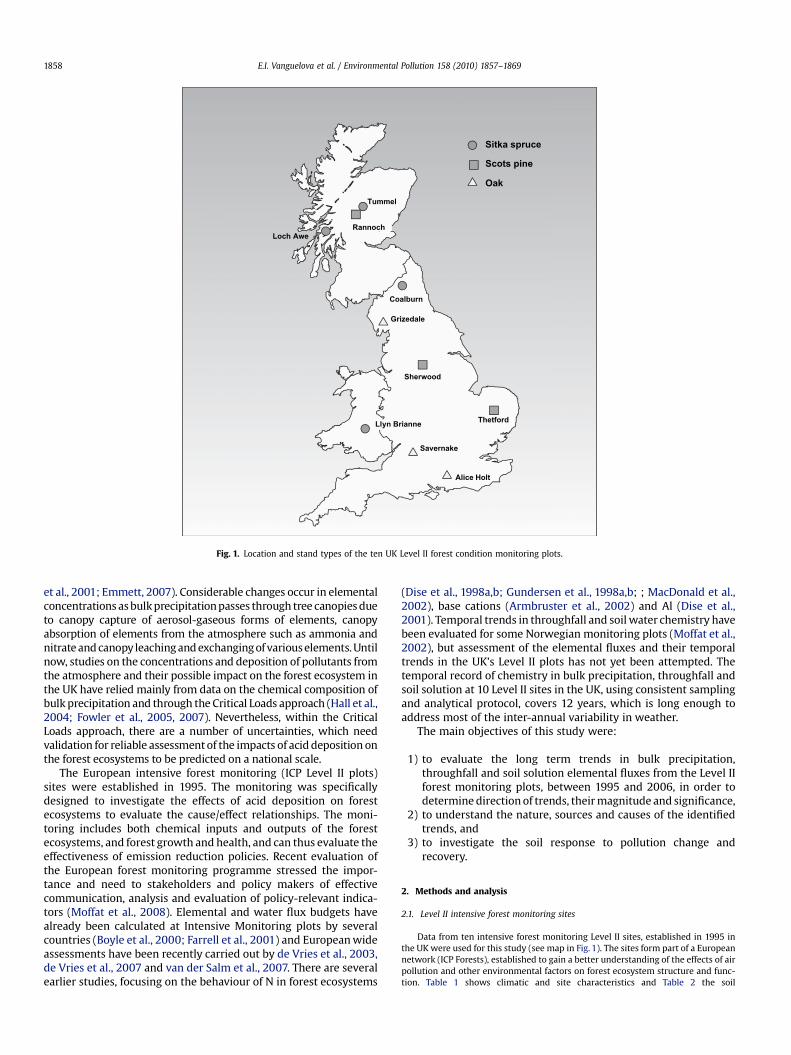
Fig. 1. Location and stand types of the ten UK Level II forest condition monitoring plots.
E.I. Vanguelova et al. / Environmental Pollution 158 (2010) 1857–18691858
et al., 2001; Emmett, 2007). Considerable changes occur in elementalconcentrations as bulk precipitation passes through tree canopies dueto canopy capture of aerosol-gaseous forms of elements, canopyabsorption of elements from the atmosphere such as ammonia andnitrate and canopy leaching and exchanging of various elements. Untilnow, studies on the concentrations and deposition of pollutants fromthe atmosphere and their possible impact on the forest ecosystem inthe UK have relied mainly from data on the chemical composition ofbulk precipitation and through the Critical Loads approach (Hall et al.,2004; Fowler et al., 2005, 2007). Nevertheless, within the CriticalLoads approach, there are a number of uncertainties, which needvalidation for reliable assessment of the impacts of acid deposition onthe forest ecosystems to be predicted on a national scale.
The European intensive forest monitoring (ICP Level II plots)sites were established in 1995. The monitoring was specificallydesigned to investigate the effects of acid deposition on forestecosystems to evaluate the cause/effect relationships. The moni-toring includes both chemical inputs and outputs of the forestecosystems, and forest growth and health, and can thus evaluate theeffectiveness of emission reduction policies. Recent evaluation ofthe European forest monitoring programme stressed the impor-tance and need to stakeholders and policy makers of effectivecommunication, analysis and evaluation of policy-relevant indica-tors (Moffat et al., 2008). Elemental and water flux budgets havealready been calculated at Intensive Monitoring plots by severalcountries (Boyle et al., 2000; Farrell et al., 2001) and European wideassessments have been recently carried out by de Vries et al., 2003,de Vries et al., 2007 and van der Salm et al., 2007. There are severalearlier studies, focusing on the behaviour of N in forest ecosystems
(Dise et al., 1998a,b; Gundersen et al., 1998a,b; ; MacDonald et al.,2002), base cations (Armbruster et al., 2002) and Al (Dise et al.,2001). Temporal trends in throughfall and soil water chemistry havebeen evaluated for some Norwegian monitoring plots (Moffat et al.,2002), but assessment of the elemental fluxes and their temporaltrends in the UK’s Level II plots has not yet been attempted. Thetemporal record of chemistry in bulk precipitation, throughfall andsoil solution at 10 Level II sites in the UK, using consistent samplingand analytical protocol, covers 12 years, which is long enough toaddress most of the inter-annual variability in weather.
The main objectives of this study were:
1) to evaluate the long term trends in bulk precipitation,throughfall and soil solution elemental fluxes from the Level IIforest monitoring plots, between 1995 and 2006, in order todetermine direction of trends, their magnitude and significance,
2) to understand the nature, sources and causes of the identifiedtrends, and
3) to investigate the soil response to pollution change andrecovery.
2. Methods and analysis
2.1. Level II intensive forest monitoring sites
Data from ten intensive forest monitoring Level II sites, established in 1995 inthe UK were used for this study (see map in Fig. 1). The sites form part of a Europeannetwork (ICP Forests), established to gain a better understanding of the effects of airpollution and other environmental factors on forest ecosystem structure and func-tion. Table 1 shows climatic and site characteristics and Table 2 the soil

Table 1Site and climatic characteristics of 10 Intensive Forest Monitoring Level II sites in the UK. Basal area was measured in 1995. Averaged annual temperature at the sites is reported.
Site name/number Tree species Planting year Basal area (m2 ha–1) Elevation (m) Slope (%) Rain (mm) T (�C)
Alice Holt/512 Oak 1935 22.0 80 0 800 11.6Savernake/516 Oak 1950 20.0 107 1 750 11.3Grizedale/517 Oak 1920 20.0 115 30 1800 9.5
Thetford/715 Scots pine 1967 36.6 20 1 600 11.3Sherwood/716 Scots pine 1952 39.3 265 22 1200 9.8Rannoch/717 Scots pine 1965 32.8 470 25–30 1400 8.5
Coalburn/919 Sitka spruce 1974 47.1 300 1 1400 9.0Tummel/920 Sitka spruce 1969 59.2 400 6–10 1100 7.5Loch Awe/921 Sitka spruce 1971 55.0 40 5 2300 7.5Llyn Brianne/922 Sitka spruce 1973 47.3 450 20 2100 10.1
E.I. Vanguelova et al. / Environmental Pollution 158 (2010) 1857–1869 1859
characteristics of the ten sites. Additional information about this monitoringnetwork is available in Vanguelova et al. (2007a).
2.2. Measurements and analysis
Bulk precipitation, throughfall and soil solution samples have been collectedfrom 10 Level II plots. In each site, samples from 2 bulk precipitation (installed in theopen ground near the forest plots) and 10 throughfall collectors (installed under thestands canopy) were collected every two weeks from 1995 until 2006. Soil lysim-eters have been used to sample soil solution every two weeks from 9 Level II sites.There are 12 lysimeters (PRENART SuperQuartz soil water samplers, PlenartEquipment Aps, Denmark) at each site, 6 located at 10 cm soil depth and the other 6located at 50 cm soil depth. Bulk precipitation, throughfall and soil solution werecollected and measured according to Level II protocols described in detail in the ICPforests manuals (Manual, 2002, 2004). Water samples were filtered througha 0.45 mm membrane filter and analysed for pH by pH meter; Al, Ca, Mg, K, Na, P, S,Mn and Fe by ICP-OES (Spectro flame, spectro Ltd.), NH4–N colorimetrically, dis-solved organic carbon (DOC) and total N by Carbon analyser (Shimadzu 5000, Osaka,Japan) and sulphate (SO4
2�), phosphate (PO43�), nitrate NO3–N and chloride (Cl�) by
Ion Chromatography (Dionex DX-500). Dissolved organic nitrogen (DON) is calcu-lated from measured total and inorganic nitrogen forms. Aluminium (Al) andmanganese (Mn) in bulk precipitation and throughfall were not measured. Qualityassurance and quality control on dissolved ion concentrations in bulk deposition,throughfall and soil solution are described by de Vries et al. (2001). The bulkprecipitation and throughfall elemental fluxes were calculated using measuredwater volumes at the sites and measured elemental concentrations. Stemflow wascalculated for broadleaves and conifers, based on measurements at one oak and oneScots pine site (0.6% and 0.4% of bulk precipitation respectively) by Arcangeli et al.(2007). The soil solution elemental fluxes were calculated by the climatic waterbalance model using bulk precipitation, throughfall and evapotranspiration,estimated by the Penman-Monteith semi-empirical model (Monteith andUnsworth, 1990; Hough and Jones, 1997). Input daily meteorological data for the
Table 2Soil type and soil pH, carbon, nitrogen, Cation Exchange Capacity (CEC by BaCl2 extractioSoil characteristics are shown only for the two horizons for each plot where the soil solu
Site name Soil type (FAO) Soil horizon Soil pH (H2O
Alice Holt Eutric vertisol Ah 5.4BCg 6.2
Savernake Eutric vertisol E 4.72BCtg 6.2
Grizedale Cambic podzol Ah 4.3Bs 5.1
Thetford Ferralic arenosol Ah 5.3Bw 7.0
Sherwood Cabric podzol Ah 4.1BC 4.5
Rannoch Gleyic podzol E 4.2Bs 4.8
Coalburn Umbric gleysol Ah(g) 4.0Bg 3.8
Tummel Ferric podzol Ah 5.1Bs 5.9
Loch Awe Dystric gleysol Ah 3.9Bs 4.8
Llyn Brianne Umbric gleysol A 4.0Bg 4.3
Penman-Monteith model came from local meteorological stations at the sites and/orthe nearest automated weather stations (AWS), where data were provided by theBritish Atmospheric Data Centre (BADC). Monthly elemental fluxes for bulkprecipitation, throughfall and soil solution were calculated from monthly waterfluxes and bimonthly water and chemistry measurements. Dry deposition, canopynutrient and base cation uptake and leaching were calculated by the ‘Canopy BudgetModel’ as proposed by Ulrich (1983) and implemented by Draaijers and Erisman(1995) and used also recently by Zhang et al. (2006). Only results on dry depositionof sulphur are discussed in this study. Soil solution sampling and analysis at Coal-burn (for shallow soil) and the Rannoch sites started in 2002; soil solution samplingwas not done at Loch Awe.
2.3. Statistical analysis
Twelve years (from 1995 to 2006) of monthly bulk precipitation, throughfall andsoil solution elemental fluxes were quality checked according to quality criteria setin the ICP forests manuals (Manual, 2002, 2004). Data on DOC and DON in bulkprecipitation, throughfall and soil solution have only been collected since 2002, soonly five years of data were used in the analysis of these two variables. The SeasonalMann-Kendall Test (SKT) (Mann, 1945; Kendall, 1975; Hirsch et al., 1982; Hirsch andSlack, 1984; Claudia, 2004), as described in detail by Evans et al. (2001) was used todetermine statistically significant temporal trends in bulk precipitation, throughfalland soil solution chemistry at individual sites. The SKT is a non-parametric test fordetecting monotonic but not necessarily linear change over the period of record.Non-parametric tests are more suitable for non-normally distributed data, missingand extreme values, which are frequently encountered in environmental time series(Yue and Pilon, 2002). Trend analyses were also undertaken to determine thesignificance of changes in the bulk precipitation, throughfall and soil solution waterfluxes. Pearson’s Product–Moment Correlation was used to reveal relationshipsbetween water quantity and ion concentrations in bulk precipitation, throughfalland soil solution over the whole monitoring period. The statistical package GenStat(GenStat, 2003) was used for these analysis.
n) and Base Saturation (BS) of 10 Intensive Forest Monitoring Level II sites in the UK.tion samplers are situated.
) C% N% Soil CEC cmolc kg–1 Soil BS%
2.69 0.56 23.10 951.08 0.027 25.83 963.47 0.138 15.73 221.21 0.068 23.15 998.27 0.456 12.92 95.01 0.279 6.71 7
1.98 0.482 4.93 920.31 0.285 3.23 992.69 0.161 6.51 41.37 0.064 2.58 73.87 0.111 10.03 93.42 0.082 2.35 13
6.52 0.357 17.46 61.66 0.060 12.41 332.5 0.185 6.3 520.4 0.027 0.9 543.46 0.426 12.6 111.21 0.178 4.2 44.44 0.29 16.36 33.51 0.05 13.18 2
300
500
700
900
1100
1300
1500
1700
1900
1994199519961997199819992000200120022003200420052006
Year
Rain
fa
ll,
th
ro
ug
hfall
an
dd
rain
ag
e(m
m) Rainfall
ThroughfallDrainage
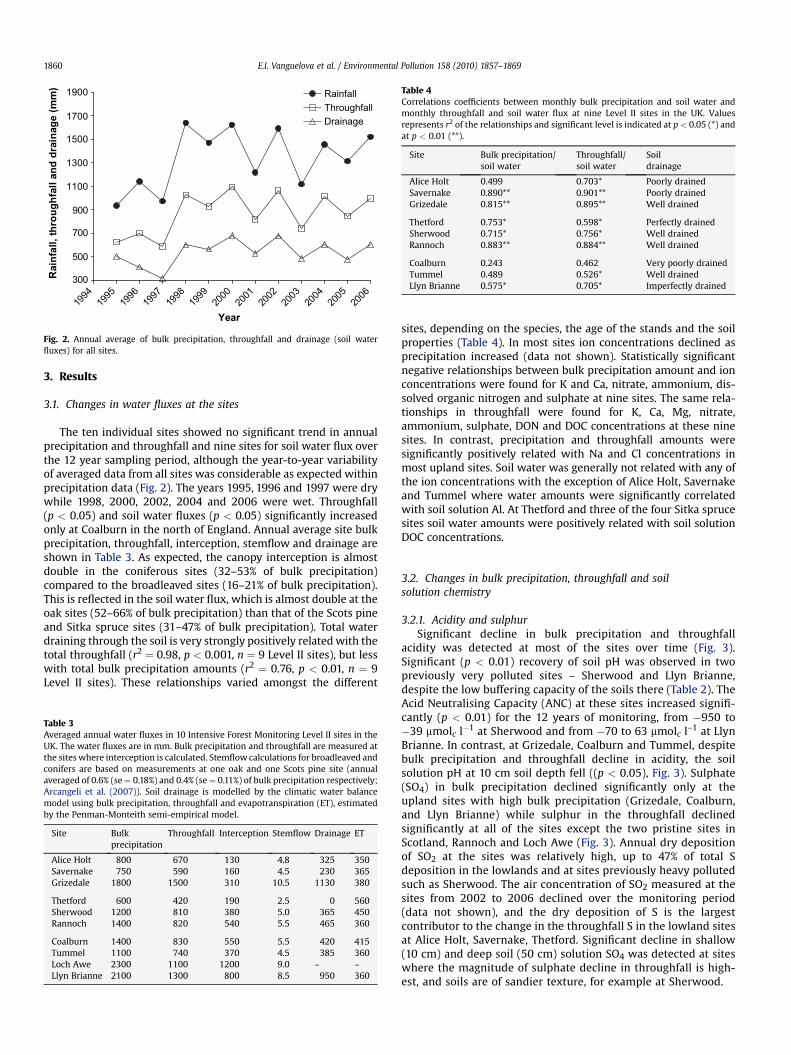
Fig. 2. Annual average of bulk precipitation, throughfall and drainage (soil waterfluxes) for all sites.
Table 4Correlations coefficients between monthly bulk precipitation and soil water andmonthly throughfall and soil water flux at nine Level II sites in the UK. Valuesrepresents r2 of the relationships and significant level is indicated at p < 0.05 (*) andat p < 0.01 (**).
Site Bulk precipitation/soil water
Throughfall/soil water
Soildrainage
Alice Holt 0.499 0.703* Poorly drainedSavernake 0.890** 0.901** Poorly drainedGrizedale 0.815** 0.895** Well drained
Thetford 0.753* 0.598* Perfectly drainedSherwood 0.715* 0.756* Well drainedRannoch 0.883** 0.884** Well drained
Coalburn 0.243 0.462 Very poorly drainedTummel 0.489 0.526* Well drainedLlyn Brianne 0.575* 0.705* Imperfectly drained
E.I. Vanguelova et al. / Environmental Pollution 158 (2010) 1857–18691860
3. Results
3.1. Changes in water fluxes at the sites
The ten individual sites showed no significant trend in annualprecipitation and throughfall and nine sites for soil water flux overthe 12 year sampling period, although the year-to-year variabilityof averaged data from all sites was considerable as expected withinprecipitation data (Fig. 2). The years 1995, 1996 and 1997 were drywhile 1998, 2000, 2002, 2004 and 2006 were wet. Throughfall(p < 0.05) and soil water fluxes (p < 0.05) significantly increasedonly at Coalburn in the north of England. Annual average site bulkprecipitation, throughfall, interception, stemflow and drainage areshown in Table 3. As expected, the canopy interception is almostdouble in the coniferous sites (32–53% of bulk precipitation)compared to the broadleaved sites (16–21% of bulk precipitation).This is reflected in the soil water flux, which is almost double at theoak sites (52–66% of bulk precipitation) than that of the Scots pineand Sitka spruce sites (31–47% of bulk precipitation). Total waterdraining through the soil is very strongly positively related with thetotal throughfall (r2 ¼ 0.98, p < 0.001, n ¼ 9 Level II sites), but lesswith total bulk precipitation amounts (r2 ¼ 0.76, p < 0.01, n ¼ 9Level II sites). These relationships varied amongst the different
Table 3Averaged annual water fluxes in 10 Intensive Forest Monitoring Level II sites in theUK. The water fluxes are in mm. Bulk precipitation and throughfall are measured atthe sites where interception is calculated. Stemflow calculations for broadleaved andconifers are based on measurements at one oak and one Scots pine site (annualaveraged of 0.6% (se¼ 0.18%) and 0.4% (se¼ 0.11%) of bulk precipitation respectively;Arcangeli et al. (2007)). Soil drainage is modelled by the climatic water balancemodel using bulk precipitation, throughfall and evapotranspiration (ET), estimatedby the Penman-Monteith semi-empirical model.
Site Bulkprecipitation
Throughfall Interception Stemflow Drainage ET
Alice Holt 800 670 130 4.8 325 350Savernake 750 590 160 4.5 230 365Grizedale 1800 1500 310 10.5 1130 380
Thetford 600 420 190 2.5 0 560Sherwood 1200 810 380 5.0 365 450Rannoch 1400 820 540 5.5 465 360
Coalburn 1400 830 550 5.5 420 415Tummel 1100 740 370 4.5 385 360Loch Awe 2300 1100 1200 9.0 – –Llyn Brianne 2100 1300 800 8.5 950 360
sites, depending on the species, the age of the stands and the soilproperties (Table 4). In most sites ion concentrations declined asprecipitation increased (data not shown). Statistically significantnegative relationships between bulk precipitation amount and ionconcentrations were found for K and Ca, nitrate, ammonium, dis-solved organic nitrogen and sulphate at nine sites. The same rela-tionships in throughfall were found for K, Ca, Mg, nitrate,ammonium, sulphate, DON and DOC concentrations at these ninesites. In contrast, precipitation and throughfall amounts weresignificantly positively related with Na and Cl concentrations inmost upland sites. Soil water was generally not related with any ofthe ion concentrations with the exception of Alice Holt, Savernakeand Tummel where water amounts were significantly correlatedwith soil solution Al. At Thetford and three of the four Sitka sprucesites soil water amounts were positively related with soil solutionDOC concentrations.
3.2. Changes in bulk precipitation, throughfall and soilsolution chemistry
3.2.1. Acidity and sulphurSignificant decline in bulk precipitation and throughfall
acidity was detected at most of the sites over time (Fig. 3).Significant (p < 0.01) recovery of soil pH was observed in twopreviously very polluted sites – Sherwood and Llyn Brianne,despite the low buffering capacity of the soils there (Table 2). TheAcid Neutralising Capacity (ANC) at these sites increased signifi-cantly (p < 0.01) for the 12 years of monitoring, from �950 to�39 mmolc l�1 at Sherwood and from �70 to 63 mmolc l–1 at LlynBrianne. In contrast, at Grizedale, Coalburn and Tummel, despitebulk precipitation and throughfall decline in acidity, the soilsolution pH at 10 cm soil depth fell ((p < 0.05), Fig. 3). Sulphate(SO4) in bulk precipitation declined significantly only at theupland sites with high bulk precipitation (Grizedale, Coalburn,and Llyn Brianne) while sulphur in the throughfall declinedsignificantly at all of the sites except the two pristine sites inScotland, Rannoch and Loch Awe (Fig. 3). Annual dry depositionof SO2 at the sites was relatively high, up to 47% of total Sdeposition in the lowlands and at sites previously heavy pollutedsuch as Sherwood. The air concentration of SO2 measured at thesites from 2002 to 2006 declined over the monitoring period(data not shown), and the dry deposition of S is the largestcontributor to the change in the throughfall S in the lowland sitesat Alice Holt, Savernake, Thetford. Significant decline in shallow(10 cm) and deep soil (50 cm) solution SO4 was detected at siteswhere the magnitude of sulphate decline in throughfall is high-est, and soils are of sandier texture, for example at Sherwood.

Rainfall H+
-3-2-10123
512 516 517 715 716 717 919 920 921 922
He
qh
a-1
y-1 Rainfall SO
4
-3-2
-10
1
23
512 516 517 715 716 717 919 920 921 922
SO
4e
qh
a-1
y-1
Throughfall H+
-3
-2
-1
0
1
2
3
He
qh
a-1
y-1
Throughfall SO4
-3
-2
-1
0
1
2
3
SO
4e
qh
a-1
y-1
Deep soil H+
-2
-1
0
1
2
He
qh
a-1
y-1 Deep soil SO
4
-10
-5
0
5
10
SO
4e
qh
a-1
y-1
Shallow soil SO4
-10
-5
0
5
10512 516 517 715 716 717 919 920 921 922
SO
4e
qh
a-1
y-1
Shallow soil H+
-2
-1
0
1
2512 516 517 715 716 717 919 920 921 922
He
qh
a-1
y-1
Fig. 3. Slopes and significance levels of trends from the Seasonal Mann-Kendall Test for acidity and sulphate in bulk precipitation, throughfall, shallow (10 cm depth) and deep(50 cm depth) soil solution at individual sites (sites numbers are as specified in Table 1). Black bars represent trends significant at p < 0.01, grey bars those significant at p < 0.05 anddotted bars are those not significant.
E.I. Vanguelova et al. / Environmental Pollution 158 (2010) 1857–1869 1861
3.2.2. Ammonium, nitrate, dissolved organic nitrogenand dissolved organic carbon
Nitrate (NO3–N) in bulk precipitation showed significant decline atonly two upland sites – Loch Awe and Llyn Brianne and it was veryvariable in throughfall in all sites (Fig. 4). Ammonium (NH4–N) in bulkprecipitation and throughfall significantly declined in most of theupland sites and in the throughfall of the lowland oak site at Alice Holt(Fig. 4). The contribution of reduced nitrogen to the total N in bulkprecipitation was high at all sites, from 33 to 55%, while oxidisednitrogen was between 26 and 38% of the total N in bulk precipitation.Nitrate concentrations (NO3–N) in soil solution varied greatly betweensites, reflecting the range of current atmospheric deposition (Fig. 4). Forexample, at the Scots pine sites, the nitrate concentration at 50 cmdepth was negligible at Rannoch in highland Perthshire (annualaverage of 0.04 mg l–1), relatively high at Sherwood in the Pennines(annual average of 3.6 mg l–1), and very high at Thetford in East Anglia(annual average of 19.8 mg l–1). Soil solution NO3–N at 10 and 50 cmdepth significantly declined at the latter sites which have been underdeclining SO2, acidity pollution and high N loading respectively.However, at two other sites – Grizedale and Tummel, NO3–N at both 10and 50 cm depth soil solution increased significantly (Fig. 4).
The contribution of DON to total N in bulk precipitation wasbetween 14 and 50% across the sites. In contrast to the generaldecline in oxidised and reduced N forms, dissolved organic nitrogen(DON) was found to significantly increase in bulk precipitation andthroughfall (p < 0.05) at 5 out of the 10 sites (Fig. 5). A significantincrease in DON was also detected in the soil solution at shallow soil
depth at 4 sites (p< 0.05) and at deep soil depth at 3 sites (p< 0.05)(Fig. 5). A significant increase in throughfall dissolved organic carbon(DOC) is apparent only at Tummel (p < 0.05) (Fig. 5). Soil solutionDOC at shallow soil depth increased significantly (p < 0.05) at 5 outof the 9 sites including the sites as for DON changes detected (Fig. 5).
3.2.3. Base cations – calcium, magnesium and potassiumBulk precipitation and throughfall Ca declined at most Level II
sites, being significant in the throughfall only at the Alice Holt site(p < 0.05) (Fig. 6). Significant decrease in soil solution Ca concen-trations was evident at Thetford, a Ca rich site on sandy soil overchalk, and at Sherwood and Llyn Brianne, which are sites on acid,sandy soils with low initial soil Ca reserves (e.g. soil base saturationof 4–7% and 2–4% respectively) (Fig. 6). Bulk precipitation andthroughfall Mg were very variable and declined significantly only inthe throughfall under oak at the Alice Holt site (Fig. 6). Soil solutionMg decreased significantly only at the Thetford site. Bulk precipi-tation K changed little, but at Grizedale and Llyn Brianne,throughfall K increased significantly, which resulted in an increaseof K in the soil solution (Fig. 6). Four of the other sites appeared tobe losing K significantly from both their shallow and deep soils.
3.2.4. Sodium and chlorideBulk precipitation and throughfall sodium (Na) and chloride (Cl)
increased significantly at most upland sites and this increase wasespecially pronounced (p < 0.01) in the throughfall at two veryexposed sites – Loch Awe in far West of Scotland and Llyn Brianne

Shallow soil N-NO3
-10
-5
0
5
10512 516 517 715 716 717 919 920 921 922
N-N
O3
eq
ha
-1
y-1
Rainfall NH4-N
-3
-2
-1
0
1
2
3512 516 517 715 716 717 919 920 921 922
NH
4-N
eq
ha
-1
y-1
Rainfall NO3-N
-3
-2
-1
0
1
2
3512 516 517 715 716 717 919 920 921 922
NO
3-N
eq
ha
-1
y-1
Throughfall NO3-N
-3
-2
-1
0
1
2
3
NO
3-N
eq
ha
-1
y-1
Throughfall NH4-N
-3
-2
-1
0
1
2
3
NH
4-N
eq
ha
-1
y-1
Deep soil N-NO3
-10
-5
0
5
10
N-N
O3
eq
ha
-1
y-1
Deep soil N-NH4
-1.5
-1
-0.5
0
0.5
1
1.5
N-N
H4
eq
ha
-1
y-1
Shallow soil N-NH4
-1.5
-1
-0.5
0
0.5
1
1.5512 516 517 715 716 717 919 920 921 922
N-N
H4
eq
ha
-1
y-1
Fig. 4. Slopes and significance levels of trends from the Seasonal Mann-Kendall Test for NO3-N and NH4-N in bulk precipitation, throughfall, shallow (10 cm depth) and deep (50 cmdepth) soil solution at individual sites (sites numbers are as specified in Table 1). Black bars represent trends significant at p < 0.01, grey bars those significant at p < 0.05 and dottedbars are those not significant.
E.I. Vanguelova et al. / Environmental Pollution 158 (2010) 1857–18691862
in South-western Wales (Fig. 7). Soil solution Na and Cl wereunchanged, with the exception of Coalburn where Na and Cl levelsincreased significantly (p < 0.05) at shallow depth (Fig. 7).
3.2.5. Soil solution aluminium and manganeseSoil solution total Al and Mn both declined significantly at 10
and 50 cm depth at Sherwood and Llyn Brianne, sites recoveringfrom pollution (Fig. 8). In addition, Al declined significantly at50 cm and Mn at both soil depths at the Thetford site. In contrast,Coalburn experienced a large increase in Al and in Grizedale andTummel, Mn increased significantly at 10 cm soil depth (Fig. 8).These three sites experienced soil acidification for the last 12 yearsas shown in Fig. 3. The soil solution Ca/Al molar ratio decreasedsignificantly at most sites with an exception of Alice Holt, a site onwell-buffered clay soil (data not shown) (Vanguelova, 2004).
4. Discussion
4.1. Changes in deposition – trends, nature and causes
Trends in concentrations of SO2 and NO2, and the deposition ofsulphur and nitrogen in bulk precipitation and throughfall are
falling (Figs. 3 and 4) in line with both emission reductions (NEG-TAP, 2001) and with the reduction of acidity in bulk precipitation,as monitored over the last 16 years in the 32 Acid DepositionMonitoring Network sites in the UK (Fowler et al., 2005, 2007).Forests are particularly efficient at scavenging air pollutants. Forexample, SO4 in throughfall is two to three times higher comparedto bulk precipitation as it combines the wash-off of previously dry-deposited sulphate particles and SO2 and leaching of internal plantsulphur from foliage (Nyborg et al., 1977; Lindberg and Garten,1988). This explains the steeper and significant decline in sulphatein throughfall compared with the more gradual and less significantdecline of sulphate in bulk precipitation seen at the UK level II sites.The decline in bulk precipitation and throughfall Ca is expected tocontinue as a consequence of overall SO4 decrease and pollutionrecovery. In general, the well-buffered sites may show the largestproportional decrease in base cation concentration in their soils,which is already evident at Thetford – a Ca rich site.
Level II data indicate large spatial variation in the levels ofnitrogen in deposition and NH3 concentrations and concernremains over the impacts of ammonia (NH3) on forest ecosystems(Vanguelova et al., 2007a). Given the large decline in SO4 and acidity,the scavenging of NH4 would also be expected to change – in

Shallow soil DON
-100
-50
0
50
100
512 516 517 715 716 717 919 920 921 922
DO
Nm
gh
a-1
y-1
Deep soil DON
-100
-50
0
50
100
DO
Nm
gh
a-1
y-1
Deep soil DOC
-2000
-1000
0
1000
2000
DO
Cm
gh
a-1
y-1
Shallow soil DOC
-2000
-1000
0
1000
2000
512 516 517 715 716 717 919 920 921 922
DO
Cm
gh
a-1
y-1
Rainfall DON
-100
-50
0
50
100
512 516 517 715 716 717 919 920 921 922
DO
Nm
gh
a-1
y-1
Rainfall DOC
-2000
-1000
0
1000
2000
512 516 517 715 716 717 919 920 921 922
DO
Cm
gh
a-1
y-1
Throughfall DON
-100
-50
0
50
100
DO
Nm
gh
a-1
y-1
Throughfall DOC
-2000
-1000
0
1000
2000
DO
Cm
gh
a-1
y-1
Fig. 5. Slopes and significance levels of trends from the Seasonal Mann-Kendall Test for DON and DOC in bulk precipitation, throughfall, shallow (10 cm depth) and deep (50 cmdepth) soil solution at individual sites (sites numbers are as specified in Table 1). Black bars represent trends significant at p < 0.01, grey bars those significant at p < 0.05 and dottedbars are those not significant.
E.I. Vanguelova et al. / Environmental Pollution 158 (2010) 1857–1869 1863
particular with increasing travel distance of NH4 and the gradualchange in the partitioning of NH3/NH4 (Fowler et al., 2005). Emis-sions of NOx and NH3 in the UK were reduced by 35% and 15%respectively over the monitoring period (Goodwin et al., 2004) andthe reduction of NH4 and NO3 in deposition seen at some of our sites(Fig. 4) is broadly consistent with the reduction in bulk precipitationNH4 and NO3 detected from the UK Acid Deposition Monitoringnetwork (Fowler et al., 2005). In some parts of Europe and NorthAmerica reduction of emissions of oxidised N are contributing toa stabilisation or decline in deposition, but there is currently limitedcontrol of emissions of reduced N (Emmett, 2007). In addition,although total deposition is declining linearly with the decline inemissions, the partitioning between wet and dry deposition isexpected to change (Fowler et al., 2005, 2007). This will ensure thatN will continue to have a significant impact for some time to come inmany regions (Galloway et al., 2003).
The significant increase in bulk precipitation and throughfallDON observed in the short period of between 2000 and 2006(Fig. 5) at a number of forest monitoring sites is of concern and addsto the complex picture of nitrogen inputs, cycling and forestecosystem response. The source of DON in bulk precipitation isuncertain. It has been assumed that it may be generated by agri-cultural practices, due to its high correlation to NH4 (Ham andTamiya, 2007), but also may be driven by changes in water, gas andaerosol circulation and deposition (Wedyan and Fandi, 2007).Rainwater amounts and DON concentrations were negativelycorrelated only at Alice Holt and the Llyn Brianne sites, which
excludes water as a general driver for DON increase. Annual aver-aged bulk precipitation DON was positively related with NH4 andNO3 (n¼ 9, r2¼ 0.672 p< 0.05 and r2¼ 0.677 p< 0.05 respectively).However, monthly bulk precipitation DON was not or was veryweakly related with NH4 and NO3, suggesting that although DONand NH4 and NO3 may share a similar source, their seasonalpatterns are different. Despite the large number of reportsconsidered in a global review by Cornell et al. (2003), evidence forlong-term temporal changes in rainwater organic nitrogenconcentrations is ambiguous. With regard to sources, the samereview highlighted the likelihood that some of the DON and otherorganic material observed may not be locally generated, butundergo extensive or long-range atmospheric transport (Cornellet al., 2003), with a land-to-sea gradient in organic nitrogenconcentration.
A detailed examination of the nature and causes for the significantincreases in throughfall DON, DOC and K alone at some sites suggestedthat these trends are due to episodic peaks of DON, DOC and K whichare not detected in the bulk precipitation but are detected in the soil(Pitman et al., 2008). These are seen particularly in the DOC increasesat the Tummel site, which were linked with aphid infestation and theDON and K increase at the Grizedale site which were linked withcaterpillar infestation (Pitman et al., 2008). The results from the UK’sForest Condition Survey for the period 1993–2003 clearly show twooccasions when the crown density of Sitka spruce deterioratedmarkedly (at a national level) in 1996 and 1997, and between 2001and 2002 (Hendry, 2005) which supports the evidence from the

Deep soil Ca
-4
-2
0
2
4
Ca
eq
ha
-1
y-1
Shallow soil Ca
-4
-2
0
2
4512 516 517 715 716 717 919 920 921 922
Ca
eq
ha
-1
y-1
Deep soil Mg
-4
-2
0
2
4
Mg
eq
ha
-1
y-1
Shallow soil Mg
-4
-2
0
2
4512 516 517 715 716 717 919 920 921 922
Mg
eq
ha
-1
y-1 Shallow soil K
-4
-2
0
2
4512 516 517 715 716 717 919 920 921 922
Ke
qh
a-1
y-1
Deep soil K
-4
-2
0
2
4
Ke
qh
a-1
y-1
Rainfall Ca
-3
-2
-1
0
1
2
3512 516 517 715 716 717 919 920 921 922
Ca
eq
ha
-1y
-1
Rainfall K
-3
-2
-1
0
1
2
3512 516 517 715 716 717 919 920 921 922
Ke
qh
a-1
y-1
Rainfall Mg
-3
-2
-1
0
1
2
3512 516 517 715 716 717 919 920 921 922
Mg
eq
ha
-1y
-1
Throughfall Mg
-3
-2
-1
0
1
2
3
Mg
eq
ha
-1y
-1
Throughfall K
-3
-2
-1
0
1
2
3
Ke
qh
a-1
y-1
Throughfall Ca
-3
-2
-1
0
1
2
3
Ca
eq
ha
-1y
-1
Fig. 6. Slopes and significance levels of trends from the Seasonal Mann-Kendall Test for Ca, Mg and K in bulk precipitation, throughfall, shallow (10 cm depth) and deep (50 cmdepth) soil solution at individual sites (sites numbers are as specified in Table 1). Black bars represent trends significant at p < 0.01, grey bars those significant at p < 0.05 and dottedbars are those not significant.
E.I. Vanguelova et al. / Environmental Pollution 158 (2010) 1857–18691864
intensive Level II monitoring (Vanguelova et al., 2007a; Pitman et al.,2008). It is suggested that some insect pests may become moredamaging as a result of climate change, in part, driven by expectationsthat more frequent and severe summer droughts will make treesmore susceptible to biotic agents (Broadmeadow, 2002). Thus, thebiotic impacts on forest chemical fluxes cannot be neglected becausethese can be of similar magnitude to pollution impacts and also couldbecome more significant in the future.
Another possible link between changing climate and chemicalfluxes in forest is suggested through the increase in bulk precipi-tation and throughfall Na and Cl in the upland sites, especially inthe western coastline sites (Llyn Brianne, Grizedale and Loch Awe,Fig. 7). These changes are most likely related to an increasingnumber of storm events as is also suggested by the significantpositive relationships between Na and Cl in bulk precipitation andthroughfall and water amounts only at these sites. An example ofthese are the number of windthrows of Sitka spruce which haveoccurred at the Loch Awe site during the monitoring period, whichare the result of repeated storms in the past 5 years. Some of thechanges in Na and Cl are detected only in throughfall but not in bulkprecipitation, particularly at Sherwood and Rannoch and this couldbe due to the higher fog and mist interception by upland forests butalso due to the sea salt particles which would also be higher inthroughfall than in bulk deposition (Hultberg and Grennfelt, 1992;Chiwa et al., 2004).
4.2. Soil response to changes in deposition chemistry
Despite the decrease in atmospheric sulphur deposition,significant downward trends in sulphate in soil solution were onlyobserved at the previously very polluted sites such as Sherwoodand Llyn Brianne, or at sites with predominant sandy or sandy loamtexture soils such as Thetford and Grizedale (Table 2). There was nodetectable change in the sulphate in highly clay soils such as in theAlice Holt and Savernake and on the highly organic soils such as inthe Coalburn site, where SO4 is likely to be adsorbed onto clayminerals and organic matter respectively. Recovery of the soil pH atpolluted sites such as Sherwood and Lynn Brianne is evidentdespite being slow because of the very low buffering capacity of thesoils at these sites. The application of the dynamic biogeochemicalmodel SAFE (Soil Acidification of Forest Ecosystems) predictslimited changes in the soil solution in the timescale of 10–40 yearsat the Level II sites, under current emission reductions (Langanet al., 2009). The application of the MAGIC dynamic model,however, predicts that in the long term, despite the observedrecovery of the coniferous sites, there will be re-acidification,associated with predicted increases in NO3 leaching at Sherwood,and base cation depletion (due to forest uptake) at Llyn Brianne(Evans et al., 2007). Soil acidification at the Coalburn, Grizedale andTummel sites is not related to changes of deposition inputs but isa response to increased water or increased canopy generated

Shallow soil Na
-20
-10
0
10
20
512 516 517 715 716 717 919 920 921 922
Na
eq
ha
-1
y-1
Rainfall Na
-10
-5
0
5
10
512 516 517 715 716 717 919 920 921 922
Na
eq
ha
-1
y-1
Rainfall Cl
-10
-5
0
5
10512 516 517 715 716 717 919 920 921 922
Cl
eq
ha
-1
y-1
Throughfall Na
-10
-5
0
5
10
Na
eq
ha
-1
y-1
Throughfall Cl
-10
-5
0
5
10
Cl
eq
ha
-1
y-1
Deep soil Na
-20
-10
0
10
20
Na
eq
ha
-1
y-1
Deep soil Cl
-20
-10
0
10
20
Cl
eq
ha
-1
y-1
Shallow soil Cl
-20
-10
0
10
20
512 516 517 715 716 717 919 920 921 922
Cl
eq
ha
-1
y-1
Fig. 7. Slopes and significance levels of trends from the Seasonal Mann-Kendall Test for Na and Cl in bulk precipitation, throughfall, shallow (10 cm depth) and deep (50 cm depth)soil solution at individual sites (sites numbers are as specified in Table 1). Black bars represent trends significant at p < 0.01, grey bars those significant at p < 0.05 and dotted barsare those not significant.
E.I. Vanguelova et al. / Environmental Pollution 158 (2010) 1857–1869 1865
nitrogen input due to repeated insect infestations (Pitman et al.,2008). These results highlight the importance of drivers other thanpollution. For example Waterlogging in the soil related to increasednitrification and acidification, was followed by an increase in Al inthe soil solution in earlier studies of a Scots pine stand on a podzol(Vanguelova et al., 2005). The observed changes in soil solutionchemistry were of similar magnitude to those induced by deposi-tion (Vanguelova et al., 2007c).
Several soil chemical indicators suggest that the infertile soils atsome Level II sites such as at Grizedale, Sherwood, and Llyn Brianneare vulnerable to loss of base cations as a result of acid deposition(Vanguelova et al., 2007a). The results from this study confirm thatthese sites have significantly lost Ca and in some intances K over thelast decade (Fig. 6). This loss may be partly due to pollution recovery,but also due to demand from tree growth. These sites are mainly onpodzolic and peaty podzolic gley soils, which are representative ofa significant proportion of British forests. The soils at Thetford havesignificantly lost soil Ca, Mg and K. These changes may not be directlyrelated to changes in atmospheric pollutant inputs. This may beexplained by comparing water fluxes in dry years (1995, 1996, 1997)which lead to less leaching through the soil and consequently main-tain high in cations, than the subsequent wetter years (1998–2006)giving rise to increased leaching and a concurrent fall in base cations(Table 2). Foliar Ca, Mg and K at the Level II sites have responded to the
decline in base cations in soil solution. However, although declining,foliar base cation concentrations are still in the intermediate oroptimal range for tree growth and there is no sign of nutrient defi-ciency at present at the sites. Llyn Brianne is the exception, where thevery low Ca reserve in the soil and the long term decrease in Ca in soilsolution have resulted in foliar Ca levels falling to the critical value of0.12% dry matter as proposed by Van Den Burg (1985). The decline insoil base cations at Llyn Brianne and Thetford suggest that at conif-erous acid sensitive sites this may become more of a managementproblem when decisions on forest harvesting practices need to bemade – such as between stem only harvesting or whole tree har-vesting. For example, whole tree harvesting in the Hubbard BrookExperimental Forest increased SO4 adsorption in subsoil and reducedsolution concentrations and watershed efflux of SO4 (Fuller et al.,1987). However, increased mineralisation and nitrification led tosubstantial NO3 loss, soil solution acidification and potentially toxic Allevels. Base cation budget research, applying different harvestingscenarios inSweden has shown that these cation stores in the soils canbe depleted by harvesting to rates that could lead to negative effectson trees and runoff water quality within one forest rotation (Aksels-son et al., 2007).
The soil solution calcium to aluminium molar ratio is veryvariable across the Level II sites (Vanguelova, 2004), but ratiosbelow the critical threshold of 1.0, which indicate a potential risk of

Shallow soil Al
-1500
-1000
-500
0
500
1000
1500512 516 517 715 716 717 919 920 921 922
Al
mg
ha
-1
y-1
Deep soil Al
-1500
-1000
-500
0
500
1000
1500
Al
mg
ha
-1
y-1
Deep soil Mn
-10
-5
0
5
10
Mn
mg
ha
-1
y-1
Shallow soil Mn
-10
-5
0
5
10512 516 517 715 716 717 919 920 921 922
Mn
mg
ha
-1
y-1
Fig. 8. Slopes and significance levels of trends from the Seasonal Mann-Kendall Test for Al and Mn in shallow (10 cm depth) and deep (50 cm depth) soil solution at individual sites(sites numbers are as specified in Table 1). Black bars represent trends significant at p < 0.01, grey bars those significant at p < 0.05 and dotted bars are those not significant.
E.I. Vanguelova et al. / Environmental Pollution 158 (2010) 1857–18691866
aluminium toxicity to tree fine roots and tree nutrient uptake(Cronan and Grigal, 1995; Vanguelova et al., 2007b), have beenobserved at Grizedale, Sherwood and Llyn Brianne. These sites havereceived the highest atmospheric pollution inputs of acidity,sulphur and nitrogen (Vanguelova et al., 2007a) and represent themost sensitive soils (Table 2). Other Level II sites, such as Thetford(sand over chalky drift), Alice Holt and Savernake (both on heavyclay soils) (Table 2), are more resilient to soil acidification due totheir high soil base status. The decline in Ca/Al molar ratio at mostsites is due to Ca depletion at Sherwood, Llyn Brianne, Grizedaleand Thetford and due to Al increase in Coalburn and Tummel sites.It has been shown that low Ca/Al ratios together with high free Al inthe soil solution can affect fine root growth and increase rootmortality in Scots pine (Vanguelova et al., 2007b,c). Nevertheless,studies have failed to show a relationship between soil solutionCa/Al molar ratio and forest increment rates, defoliation and/orfoliar chemistry for either Norway spruce, Sitka spruce or Beech inDenmark (Hansen et al., 2007). Two soil surveys of the EuropeanLevel I forest condition monitoring plots found no link between soilacidity and above-ground forest conditions and growth, and workby Freer-Smith and Read (1995) failed to link the crown conditionwith aluminium or base cations in soil solution in the UK. Incontrast, numerous field research studies have established rela-tionships between soil acidification and root functioning whichwere recently reviewed in Vanguelova et al. (2007b). This suggestsa real difference in the sensitivity of the belowground tree responsecompared with that above ground and the likely time lag betweenthe two responses.
Out of all ten Level II sites, the Thetford site is the only N satu-rated site according to the different ‘‘stage of N saturation’’ asdescribed by Aber (1989, 1998). This site is in East Anglia, close tointensive animal units. Nitrogen enrichment due to high N depo-sition (ranging from 13 to 19 kg ha–1 a–1) combined with low bulkprecipitation (annual average of 600 mm) results in a very highNO3–N concentration in the soil solution throughout the year. Thedrainage at this site is very limited (e.g. 190 mm annual average),and a concentration effect is observed in the soil with monthlypeaks of NO3 concentrations of up to 140 mg l–1 and mean annualconcentrations of up to 40 mg l–1 – a concentration 3 times higher
that the UK water drinking standard of 11.3 mg l–1. These resultssuggest that forest soils with a low organic matter content andsurrounded by intensive agriculture, are at risk from the effects ofhigh nitrogen deposition (Pitcairn et al., 1998). This is clearlydemonstrated by an extremely low soil carbon to nitrogen ratio ofunder 5 at Thetford, reflecting excess nitrogen mineralisation andleaching (Emmett, 2002). The Scots pine at Thetford already showsvery high N concentrations in the needles, with values much above1.7%, which has been quoted to indicate nutrient imbalance inconifers (Gundersen, 1999). This is confirmed by the consistentdecline of foliar P, Mg and K over the last 12 years at this site (datanot shown). On the positive side, soil solution NO3 has significantlydeclined at Thetford over the last 12 years of record, which is likelyto be a response to the overall decline in N emissions at high Ndeposition areas such as East Anglia (Fowler et al., 2005). Changesin ground flora at the site for the last 12 years have also confirmedthe N recovery process (data not shown).
Nitrate concentrations in soil solution have increased dramati-cally at two of the Sitka spruce sites, Tummel and Coalburn, but notas a response to N deposition. At Tummel, N increase followedrepeated severe defoliation by the green spruce aphid, which isconfirmed by increases in throughfall DOC and by litter-fall analysis(Pitman et al., 2008). The increase in nitrate levels at Coalburn arelikely to be a result of increased water flux and build up of nitrate inthe soil due to the presence of subsoil heavy clay horizon andconsequent very poor drainage (Tables 3 and 4). Therefore, increasein NO3–N at these sites is not due to external inputs but was eithercanopy generated or driven by changes in soil water regime.
In contrast, the increase in soil solution DON at 5 out of 9 sitesseems to be a direct response to increased bulk precipitation andthroughfall DON deposition. However, indirect drivers such asdecreased acidity and increased microbial activity in the soilorganic layer might have also contributed to the increase in soilsolution DON and should not be ruled out. The increase in DONcould be also directly related to the increase in DOC.
Soil solution DOC has risen significantly at 10 cm soil depth atthree Level II sites. The increase in Sherwood and Llyn Brianne islikely to be driven by the recovery from pollution. It has beensuggested in numerous studies that high acidity and sulphate

E.I. Vanguelova et al. / Environmental Pollution 158 (2010) 1857–1869 1867
inhibit organic matter decomposition (Monteith et al., 2007;Chapman et al., 2008; Clark et al., 2006). Atmospheric depositioncan affect soil organic matter solubility through at least twomechanisms – by changing either the acidity of soils or the ionicstrength of the soil solution, or both. The soil solution pH increasedand ionic strength of soil solutions decreased the most at Sherwoodand Llyn Brianne due to the large decrease in SO4, base cations andaluminium. Soil pH also determines the solubility of Al, as seen inthe increase in pH and decrease in Al at Sherwood and Llyn Brianneand vice-versa at Coalburn. Higher Al release during the process ofacidification can bind with organic molecules, neutralising high-affinity binding sites and thereby triggering SOM coagulation(Tipping and Woof, 1991). Thus, declining acid deposition may alsoaffect DOC concentrations indirectly by reducing aluminiummobilisation. Reduced acidity in throughfall reaching the forestfloor, on one hand will directly stimulate organic matter decom-position based on the chemical balance mechanism but also indi-rectly stimulate microbial activity in the soil organic layers.
Carbon loss might be also dependent on the high organicmatter in the peaty gley soils, as in Coalburn where the peat layeris between 18 and 22 cm deep and at Llyn Brianne between 25 and30 cm. In addition, changes in soil DOC could be driven by changesin soil water. This is suggested by the strong positive relationshipsbetween soil water flux and DOC concentrations at all Sitka sprucesites, but also at the Thetford site. The importance of soiltemperature in stimulating microbial activity and release ofcarbon should also not be overlooked. Meteorological measure-ments for the last 20–30 years suggest that there has been anannual average soil temperature increase of 1–2 �C at 30 cm soildepth, measured near most of the Level II sites, which could havealso stimulated a release of organic carbon from topsoil to soilsolution.
Overall the soil carbon stocks at the 10 Level II sites are highlyvariable, with values of between 47 tC ha–1 and 500 tC ha–1 for thetop 1 m of soil (Vanguelova et al., 2007a). This range of soil C stock isto be expected given that the monitoring sites are under bothbroadleaf (on soils with lower C content) and conifer forests (onsoils with high soil C stock) where there is a distinct differencebetween humus layer development due to quality of litter(e.g. acidity, lignin content, etc.), the light reaching the forest floor,consequent understory vegetation development and differentdecomposition rates. Generally, the sites with higher soil C content;e.g. Lynn Brianne, Coalburn and Grizedale (Table 2) have higherDOC fluxes at shallow depth of soil, (e.g. annual DOC fluxesbetween 110 and 233 kg ha–1 a–1) than the sites with lower soil C;e.g. Alice Holt, Savernake, Thetford (e.g. annual DOC fluxes between1 and 60 kg ha–1 a–1) (Morison et al., 2008). The magnitude of thesoil carbon stock may be a factor determining the soil sensitivity tocarbon release, however changes in environmental (climate andpollution) factors are much more important drivers for soil Cdynamics, both in terms of magnitude and direction.
5. Conclusions
The evaluation of the long term trends in bulk precipitation anddry deposition at the Level II intensive forest monitoring sitesprovides evidence for changes in important deposition chemistrywhich confirm the successful implementation of the emissionreduction policies in the UK. Long term trends in throughfall andsoil solution chemical fluxes at these sites show the ecosystemresponse to changes in deposition and the rate of chemicalrecovery, particularly from acid and sulphur deposition. However,concerns over the local effects of excess nitrogen depositionpollution remain, alongside those of potential climate change,which is predicted to have both direct and indirect impacts on
forest ecosystems. This study also reports important findings forthe carbon and nitrogen cycling in forest ecosystems, withincreasing trends of soil solution DOC and DON likely to be a directresponse to pollution recovery, but also to monitored changes insoil temperature resulting in increased microbial activity. In addi-tion, climate change driven changes have been detected by thesignificant increase of Na and Cl deposition over the period ofmonitoring, supporting a trend of increased storm events at somewestern and exposed forest sites. Declining base cations andspecifically Ca in soils and tree uptake at some coniferous acidsensitive monitoring sites, highlights the need to carefully evaluatesite conditions in terms of soil and geology when decisions onforest harvesting practices are made. Detailed environmentalstudies of some monitoring sites suggest significant importance ofbiological influence on the chemical cycling on both broadleaf andconifer systems. This has helped the evaluation of direct and indi-rect impacts of air pollution and climate change on forestecosystem biogeochemisty and tree health and improved ourunderstanding of the interrelationship between chemical andbiological impacts.
The intensive monitoring programme is a unique forestsurveillance network, providing continuous, detailed informationon the condition of the forest ecosystem and its interaction with thewider environment at both local and regional scales. The integratednature of monitoring across the Level II network enables the rela-tionships between climate, pollutant exposure and chemical andbiological response in forestry to be explored. The network also hasimportant value in supporting international reporting commit-ments concerning sustainable forest management in the UK.
Acknowledgements
We would like to thank the Forestry Commission for fundingthis research. Dr. Fiona Kennedy, a former colleague is gratefullyacknowledged for her scientific contribution to the Level II moni-toring in the UK. Numerous staff from the Technical Support Unitsand the Chemical Laboratory at Alice Holt are also acknowledgedfor collecting and analysing the water samples for 12 years at theLevel II network in the UK.
References
Aber, J.D., Nadelhoffer, K.J., Steudler, P., Melillo, J.M., 1989. Nitrogen saturation innorthern forest ecosystems. Bioscience 39, 378–386.
Aber, J.D., McDowell, W., Nadelhoffer, K., Magill, A., Berntson, G., Kamakea, M., 1998.Nitrogen saturation in temperate forest ecosystems: hypotheses revisited.Bioscience 48, 921–934.
Akselsson, C., Westlinga, O., Sverdrup, H., Gundersen, P., 2007. Nutrient and carbonbudgets in forest soils as decision support in sustainable forest management.Forest Ecology and Management 238, 167–174.
Arcangeli, C., Wilkinson, M., Williams, M., Morgan, G., Taylor, P. 2007. Modellingrainfall interception. Final Report, Programme No. FF0304UK01 entitled ‘‘ForestFocus – UK 2003-2004’’ Request No. UK7.
Armbruster, M., MacDonald, J.A., Dise, N.B., Matzner, E., 2002. Throughfall andoutput fluxes of Mg in European forest ecosystems: a regional assessment.Forest Ecology and Management 164, 137–147.
Beier, C., Eckersten, H., Gundersen, P., 2001. Nitrogen cycling in a Norway spruceplantation in Denmark – A SOILN model application including organic N uptake.The Scientific World 1 (S2), 394–406.
Broadmeadow, M.S.J., 2002. Climate change: Impacts on UK forests. ForestryCommission Bulletin 125. Forestry Commission, Edinburgh.
Boyle, G.M., Farrell, E.P., Cummins, T., Nunan, N., 2000. Monitoring of forestecosystems in Ireland. Forest Ecosystem Research Group Report 48. UniversityCollege Dublin, Ireland.
Claudia, L., 2004. A program for the computation of multivariate and partial Mann-Kendall test. Manual.
Clark, J.M., Chapman, P.J., Heathwaite, A.L., Adamson, J.K., 2006. Suppression ofdissolved organic carbon by sulfate induced acidification during simulateddroughts. Environmental Science and Technology 40 (6), 1776–1783.
Chapman, P.J., Clark, J.M., Reynolds, B., Adamson, J.K., 2008. The influence of organicacids in relation to acid deposition in controlling the acidity of soil and streamwaters on a seasonal basis. Environmental Pollution 151, 110–120.

E.I. Vanguelova et al. / Environmental Pollution 158 (2010) 1857–18691868
Chiwa, M., Crossley, A., Sheppard, L.J., Sakugawa, H., Cape, J.N., 2004. Throughfall chemistryand canopy interactions in a Sitka spruce plantation sprayed with six differentsimulated polluted mist treatments. Environmental Pollution 127 (1), 57–64.
Cornell, S.E., Jickells, T.D., Cape, J.N., Rowland, A.P., Duce, R.A., 2003. Organicnitrogen deposition on land and coastal environments: a review of methodsand data. Atmospheric Environment 37, 2173–2191.
Cronan, C.S., Grigal, D.F., 1995. Use of calcium/aluminum ratios as indicators ofstress in forest ecosystems. Journal of Environmental Quality 24, 209–226.
De Vries, W., Reinds, G.J., van der Salm, C., Draaijers, G.P.J., Bleeker, A., Erisman, J.W.,Auee, J., Gundersen, P., Kristensen, H.L., van Dobben, H., de Zwart, D., Derome, J.,Voogd, J.C.H., Vel, E.M., 2001. Intensive monitoring of forest ecosystems inEurope. Technical report 2001. UN/ECE, EC. Forest Intensive Monitoring Coor-dinating Institute, Geneva/Brussels.
De Vries, W., Reinds, G.J., Vel, E., 2003. Intensive monitoring of forest ecosystems inEurope 2. Atmospheric deposition and its impacts on soil solution chemistry.Forest Ecology and Management 174, 97–115.
De Vries, W., van der Salm, C., Reinds, G.J., Erisman, J.W., 2007. Element fluxesthrough European forest ecosystems and their relationships with stand and sitecharacteristics. Environmental Pollution 148, 501–513.
Dise, N.B., Matzner, E., Forsium, M., 1998a. Evaluation of organic horizon C: N ratioas an indicator of nitrate leaching in conifer forests across Europe. Environ-mental Pollution 102, 453–456.
Dise, N.B., Matzner, E., Gundersen, P., 1998b. Synthesis of nitrogen pools and fluxesfrom European forest ecosystems. Water, Air and Soil Pollution 105, 143–154.
Dise, N.B., Matzner, E., Armbruster, M., MacDonald, J.A., 2001. Aluminum outputfluxes from forest ecosystems in Europe: a regional assessment. Journal ofEnvironmental Quality 30, 1747–1756.
Draaijers, G.P.J., Erisman, J.W., 1995. A canopy budget model to assess atmospheric depo-sition from throughfall measurements. Water, Air and Soil Pollution 85, 2253–2258.
Eichhorn, J., Haussmann, T., Paar, U., Reinds, G.J., de Vries, W., 2001. Assessment ofimpacts of nitrogen deposition on beech forests: results from the Pan-Europeanintensive monitoring programme. The Scientific World 1 (S2), 423–432.
Emmett, B.A., 2002. The impact of nitrogen deposition in forest ecosystems:a review. CEH Project No: C00311. Department of the Environment. Food andRural Affairs, Terrestrial Umbrella Phase II.
Emmett, B.A., 2007. Nitrogen saturation of terrestrial ecosystems: some recentfindings and their implications for our conceptual framework. Water, Air andSoil Pollution 7 (1–3), 99–109.
Evans, C.D., Cullen, J.M., Alewell, C., Kopacek, J., Marchetto, A., Moldan, F.,Prechtel, A., Rogora, M., Vesely, J., Wright, R., 2001. Recovery from acidificationin European surface waters. Hydrology and Earth System Sciences 5, 283–297.
Evans, C.D., Hall, J., Rowe, E., Aherne, J., Helliwell, R., Jenkins, A., Hutchins, M., Cosby,J., Smart, S., Howard, D., Norris, D., Coull, M., Lilly, A., Bonjean, M., Broughton, R.,O’Hanlon, S., Heywood, E., Ullyett, J., 2007. Critical Loads and DynamicaModelling. Report to the Department of the Environment, Food and RuralAffairs under Contract No: CPEA 19, Final Report, July 2007, CEH Contract No:C02661, page 8.
Farrell, E.P., Aherne, J., Boyle, G.M., Nunan, N., 2001. Long-term monitoring ofatmospheric deposition and the implication of ionic inputs for the sustainabilityof a coniferous forest ecosystem. Water, Air and Soil Pollution 130, 1055–1060.
Fowler, D., Smith, R.A., Muller, J.B.A., Hayman, G., Vincent, K.J., 2005. Changes inatmospheric deposition of acidifying compounds in the UK between 1986 and2001. Environmental Pollution 137, 15–25.
Fowler, D., Smith, R., Muller, J., Cape, J.N., Sutton, M., Erisman, J.W., Fagerli, H., 2007.Long term trends in sulphur and nitrogen deposition in Europe and the cause ofnon-linearily. Water, Air and Soil Pollution 7 (1–3), 41–47.
Freer-Smith, P.H., Read, D.B., 1995. The relationship between crown condition andsoil solution chemistry in oak and Sitka spruce in England and Wales. ForestEcology and Management 79, 185–196.
Fuller, R.D., Driscoll, C.T., Lawrence, G.B., Nodvin, S.C., 1987. Processes regulatingsulphate flux after whole-tree harvesting. Nature 325, 707–710.
Galloway, J.N., Aber, J.D., Erisman, J.W., Seitzinger, S.P., Howarth, R.W., Cowling, E.B.,2003. The nitrogen cascade. Bioscience 53, 341–356.
GenStat, 2003. The guide to GenStat release 7.1 part 2. In: Payne, R.W. (Ed.),Statistics. Lawes Agricultural Trust, Rothamsted Experimental Station. VSNInternational, Oxford.
Goodwin, J.W.L., Salway, A.G., Dore, C.J., Murrells, T.P., Passant, N.R., Watterson, J.D.,Hobson, M.M., Haigh, K.E., King, K.R., Pye, S.T., Coleman, P.J., Conolly, C.M., 2004.UK emissions of air pollutants 1970 to 2000. AEA Technology plc, Abingdon,Oxfordshire, UK.
Gundersen, P., Callesen, I., de Vries, W., 1998a. Nitrate leaching in forest ecosystemsis related to forest floor C/N ratios. Environmental Pollution 102, 403–407.
Gundersen, P., Emmet, B.A., Kjonaas, O.J., Koopmans, C.J., Tietema, A., 1998b. Impactof nitrogen deposition on nitrogen cycling in forests: a synthesis of NITREXdata. Forest Ecology and Management 101, 37–56.
Gundersen, P., 1999. Nitrogen status and impact of nitrogen in forests – indicatorsand their possible use in critical load assessment. Paper presented at Confer-ence on Critical Loads, Copenhagen, November, 1999.
Hall, J., Ullyett, J., Heywood, L., Broughton, R., 12 UK Experts., 2004. Update to: TheStatus of UK Critical Loads - Critical Loads Methods, Data and Maps. Report toDepartment of the Environment, Food and Rural Affairs, Contract EPG 1/3/185,February 2004, (http://critloads.ceh.ac.uk).
Ham, Y.-S., Tamiya, S., 2007. Contribution of dissolved organic nitrogen depositionto total dissolved nitrogen deposition under intensive agricultural activities.Water, Air and Soil Pollution 178, 5–13.
Hansen, K., Vesterdal, L., Bastrup-Birk, A., Billie-Hansen, J., 2007. Are indicators forcritical loads exceedance related to forest condition? Water, Air and SoilPollution 183, 183–308.
Hendry, S.J., 2005. Forest condition 2004. Information note 75. Forestry Commis-sion, Edinburgh. http://www.forestry.gov.uk/website/publications.nsf/.
Hirsch, R.M., Slack, J.R., 1984. A nonparametric test for seasonal data with serialdependence. Water Resources Research 20, 727–732.
Hirsch, R.M., Slack, J.R., Smith, R.A., 1982. Techniques of trend analysis for monthlywater quality data. Water Resources Research 18, 107–121.
Hough, M.N., Jones, R.J.A., 1997. The United Kingdom Meteorological Office bulkprecipitation and evaporation calculation system: MORECS version 2.0-anoverview. Hydrology and Earth System Sciences 1 (2), 227–239.
Hultberg, H., Grennfelt, P., 1992. Sulphur and seasalt deposition as reflected bythroughfall and runoff chemistry in forested catchments. EnvironmentalPollution 75 (2), 215–222.
Hyvonen, R., 22 others, 2007. The likely impact of elevated [CO2], nitrogen deposition,increased temperature and management on carbon sequestration in temperateand boreal forest ecosystems: a literature review. New Phytologist 173, 463–480.
Jenkins, A., Cullen, J.M., 2001. An assessment of the potential impact of the Goth-enburg protocol on surface water chemistry using the dynamic MAGIC model atacid sensitive sites in the UK. Hydrology and Earth System Sciences 5, 529–541.
Kendall, M.G., 1975. Rank correlation methods. Charles Griffin, London.Langan, S.J., Fransson, L., Vanguelova, E., 2009. Dynamic modelling of the response
of UK forest soils to changes in acid deposition using the SAFE model. Science ofthe Total Environment 407, 5605–5619.
Lindberg, S.E., Garten, C.T., 1988. Sources of sulphur in forest canopy throughfall.Nature 336, 148–151.
Luttermann, A., Freedman, B., 2000. Risks to forests in heavily polluted regions. In:Innes, J.L., Oleksyn, J. (Eds.), Forest Dynamics in Heavily Polluted Regions, Report 1of the IUFRO Task Force on Environmental Change. CABI Publishing, UK, pp. 9–26.
MacDonald, J.A., Dise, N.A., Matzner, E., Armbruster, M., Gundersen, P., Forsius, M.,2002. Nitrogen input together with ecosystem nitrogen enrichment predictnitrate leaching from European forests. Global Change Biology 8, 1028–1033.
Mann, H.B., 1945. Nonparametric tests against trend. Econometrica 13, 245–259.Manual on Methods and criteria for harmonised sampling, assessment, monitoring,
and analysis of the effects of air pollution on forests. 2002. Soil solution collectionand analysis. Elaborated by the EU Expert Panel on Soil, Part b, 111–137.
Manual on Methods and criteria for harmonised sampling, assessment, monitoring,and analysis of the effects of air pollution on forests. 2004. Sampling andAnalysis of Deposition. Elaborated by the EU Expert Panel on Deposition, PartVI, 70 pages.
Moffat, A.J., Kvaalen, H., Solberg, S., Clarke, N., 2002. Temporal trends in throughfalland soil water chemistry at three Norwegian forests, 1986–1997. Forest Ecologyand Management 168, 15–28.
Moffat, A.J., Davies, S., Finer, L., 2008. Reporting the results of forest monitoring – anevaluation of the European forest monitoring programme. Forestry 81 (1), 75–90.
Monteith, D.T., Stoddard, J.L., Evans, C.D., de Wit, H.A., Forsius, M., Hogasen, T.,Wilander, A., Skjelkvale, B.L., Jeffries, D.S., Vuorenmaa, J., Keller, B., Kopacek, J.,Vesely, J., 2007. Dissolved organic carbon trends resulting from changes inatmospheric deposition chemistry. Nature 450, 537–540.
Monteith, J.L., Unsworth, M.H., 1990. Principles of environmental physics’, seconded,. Edward Arnold, 291 pp.
Morison, J., Matthews, R., Perks, M., Randle, T., Vanguelova, E., White, M. andYamulki, S., 2008. The Carbon and GHG Balance of the UK forests – a Review.Report, Forest Research, Alice Holt, 130 pp.
NEGTAP, 2001. Transboundary Air Pollution: Acidification, Eutrophication andGround-level Ozone in the UK. Report of the national group on transboundaryair pollution. Department of the Environment, Food and Rural Affairs, London.
Nyborg, M., Repin, D., Hocking, D., Baker, J., 1977. Effect of sulphur dioxide onprecipitation and on the sulphur content and acidity of soils in Alberta, Canada.Water, Air and Soil Pollution 7 (4), 439–448.
Pitcairn, C.E.R., Leith, I.D., Sheppard, L.J., Sutton, M.A., Fowler, D., Munro, R.C.,Tsng, S., Wilson, D., 1998. The relationship between nitrogen deposition, speciescomposition and foliar nitrogen concentrations in woodland flora in the vicinityof livestock farms. Environmental Pollution 102 (S1), 41–48.
Pitman, R., Vanguelova, E.I., Benham, S., 2008. Effects of phytophagous insects onthe nutrient fluxes through forest stands in the UK Level II network. Proceed-ings of EU COST Workshop ‘‘Forest Ecosystems in an Changing Environment’’,Istanbul, Turkey, 11–13 March 2008.
Pussinen, A., Karjalainen, T., Makipaa, R., Valsta, L., Kellomaki, S., 2002. Forest carbonsequestration and harvests in Scots pine stand under different climate andnitrogen deposition scenarios. Forest Ecology and Management 158, 103–115.
Stoddard, J.L., 22 others, 1999. Regional trends in aquatic recovery from acidificationin North America and Europe. Nature 401, 575–578.
Tipping, E., Woof, C.,1991. The distribution of humic substances between the solid andaqueous phases of acid organic soils: a description based on humic heterogeneityand chanrge-dependent sorption equilibria. Journal of Soil Science 42, 437–448.
Ulrich, B., 1983. Interactions of forest canopies with atmospheric constituents: SO2,alkali cations and chloride. In: Ulrich, B., Pankrath, J. (Eds.), Effects of Accumulationof Air Pollutants in Forest Ecosystems. Reidel, Dordrecht, Netherlands, pp. 33–45.
Van Den Burg, J., 1985. Foliar analysis for determination of tree nutrient status –a compilation of literature data. Report No 414, Rijksinstituut voor Onderzoek inde Bos – en Landschapsbouw ‘de Dorschkamp’, Wageningen, The Netherlands.
Van der Salm, C., Reinds, G.J., de Vries, W., 2007. Water balances in intensivemonitored forest ecosystem in Europe. Environmental Pollution 148, 201–212.

E.I. Vanguelova et al. / Environmental Pollution 158 (2010) 1857–1869 1869
Vanguelova, E.I., 2004. Application of Level II intensive forest monitoring in soilsustainability research. Forestry Commission Report, October, 2004, 26 pp.
Vanguelova, E.I., Nortcliff, S., Moffat, A.J., Kennedy, F., 2005. Morphology, biomassand nutrient status of fine roots of Scots pine (Pinus sylvestris) as influenced byseasonal fluctuations in soil moisture and soil solution chemistry. Plant and Soil270, 233–247.
Vanguelova, E.I., Barsoum, N., Benham, S., Broadmeadow, M., Moffat, A., Nisbet, T.,Pitman, R., 2007a. Ten Years of Intensive Environmental Monitoring of BritishForests. Forestry Commission Information Note 88, Edinburgh.
Vanguelova, E.I., Hirano, Y., Eldhuset, T.D., Sas-Paszt, L., Bakker, M., Puttsepp, U.,Brunner, I., Lohmus, K., Godbold, D., 2007b. Tree fine root Ca/Al molar ratio –indicator of Al and acidity stress. Plant Biosystems 3, 460–480.
Vanguelova, E.I., Nortcliff, S., Moffat, A.J., Kennedy, F., 2007c. Short-term effects ofmanipulated increase in acid deposition on soil, soil solution chemistry andfine roots of Scots pine (Pinus sylvestris) stand on a podzol. Plant and Soil294, 41–54.
Wedyan, M.A., Fandi, K., 2007. Soluble organic nitrogen in the marine aerosol overthe Gulf of Aqaba (Jordan). Journal of Applied Sciences Research 3 (8), 787–790.
Yue, S., Pilon, P., 2002. Power of the Mann-Kendall and Spearman’s rho tests fordetecting monotonic trends in hydrological series. Journal of Hydrology 259,254–271.
Zhang, G., Zeng, G.M., Jiang, Y.M., Du, C.Y., Huang, G.H., Yao, J.M., Zeng, M.,Zhang, X.L., Tan, W., 2006. Seasonal dry deposition and canopy leaching of basecations in a subtropical evergreen mixed forest. Silva Fennica 40 (3), 417–428.