chehalis river flood storage dam fish … fish...chehalis river flood storage dam fish population...
TRANSCRIPT

CHEHALIS RIVER FLOOD STORAGE DAM
FISH POPULATION IMPACT STUDY
Prepared for Chehalis River Basin Flood Authority
Lewis County Board of County Commissioners
315 NW North Street, Room 209
Chehalis, Washington 98532
Prepared by Anchor QEA, LLC
720 Olive Way, Suite 1900
Seattle, Washington 98101
In association with:
Watershed GeoDynamics and Normandeau Associates, Inc.
April 2012
CHEHALIS RIVER FLOOD STORAGE DAM FISH POPULATION IMPACT STUDY
Prepared for Chehalis River Basin Flood Authority
Lewis County Board of County Commissioners
315 NW North Street, Rm. 209
Chehalis, Washington 98532
Prepared by Anchor QEA, LLC 720 Olive Way, Suite 1900 Seattle, Washington 98101 In Association with: Normandeau Associates, Inc. and Watershed GeoDynamics, Inc
April 2012

The authors of this report would like to acknowledge and thank the many individuals who offered data, advice, and/or time during the completion of this study.
• Chehalis River Basin Flood Authority
• Data Collection Meeting Participants
Bob Burkle, Washington Department of Fish and Wildlife
Bruce Treichler, Wild Game Fish Conservation International
Charmane Ashbrook, Washington Department of Fish and Wildlife
Curt Holt, Washington Department of Fish and Wildlife
David Plotts, Lewis County Public Utility District
Edna Fund, City of Centralia, Flood Authority
Greg Reub, ENVIRON on behalf of Confederated Tribes of the Chehalis Reservation
Julie Balmelli-Powe, City of Chehalis, Flood Authority
Kirt Hughes, Washington Department of Fish and Wildlife
Larry Durham, Confederated Tribes of the Chehalis Reservation
Mark Mobbs, Quinault Indian Nation
Mark Swartout, Thurston County
Mike Ackley, Washington Department of Fish and Wildlife
Ron Averill, Lewis County, Flood Authority
Terry Willis, Grays Harbor County, Flood Authority
Travis Nelson, Washington Department of Fish and Wildlife
Vickie Raines, City of Cosmopolis, Flood Authority
• Reviewing Organizations
City of Chehalis
Confederated Tribes of the Chehalis Reservation
Lewis County Public Utility District
Quinault Indian Nation
Thurston County
Washington State Department of Ecology

Washington Department of Fish and Wildlife
Washington State Department of Transportation
Wild Game Fish Conservation International
• Fish Impact Study Consultant Team
Anchor QEA, LLC
Paul Schlenger, FP-C
Bob Montgomery, P.E.
Pradeep Mugunthan, Ph.D., P.E.
Mike Schiewe, Ph.D.
Jim Shannon
Adam Hill, P.E.
Aaron Short
Binglei Gong
Emily Pizzichemi
Carmen Andonaegui
Normandeau Associates, Inc.
Tom Payne
Steve Eggers
Watershed GeoDynamics
Kathy Dubé, LEG
Hilborn Consulting
Ray Hilborn, Ph.D.
• Chehalis River Flood Authority Program Management Consultants
Lara Fowler, Gordon Thomas Honeywell, LLP
Greg Hueckel, SBGH-Partners, LLC

Chehalis River Flood Storage Dam April 2012 Fish Population Impact Study i 100705-01.01
TABLE OF CONTENTS EXECUTIVE SUMMARY .................................................................................................... ES-1
Flood Storage Only Dam Alternative ................................................................................... ES-1
Multi-Purpose Dam ............................................................................................................... ES-4
Conclusions ............................................................................................................................ ES-6
1 INTRODUCTION ................................................................................................................ 1
1.1 Study Approach ................................................................................................................3
1.2 Process for Obtaining Input to Study..............................................................................5
1.3 Study Assumptions ...........................................................................................................6
1.4 Report Contents ...............................................................................................................8
2 HYDROLOGY AND HYDRAULICS ................................................................................... 9
2.1 Basic Approach .................................................................................................................9
2.1.1 Description of Hydrologic Analyses Performed .....................................................10
2.1.1.1 HEC-ResSIM Model ....................................................................................... 10
2.1.1.2 Flow Exceedance Calculations ....................................................................... 12
2.1.2 Description of Hydraulic Analyses Performed .......................................................13
2.1.2.1 HEC-RAS Model ............................................................................................. 13
2.2 Summary of Results ........................................................................................................14
2.2.1 Hydrologic Modeling Results ..................................................................................14
2.2.1.1 HEC-ResSIM Modeling .................................................................................. 14
2.2.1.2 Flow Exceedance Results ............................................................................... 18
2.2.2 Hydraulic Modeling Results ....................................................................................22
2.2.2.1 HEC-RAS Modeling ....................................................................................... 22
2.2.2.2 Sediment Transport Capacity ......................................................................... 27
2.2.2.3 Water Temperature Modeling ....................................................................... 28
2.3 Further Study Needs for Areas of Uncertainty .............................................................28
3 SEDIMENT AND LARGE WOODY DEBRIS TRANSPORT EVALUATION ................... 30
3.1 Basic Approach ...............................................................................................................30
3.2 Summary of Results ........................................................................................................32
3.3 Further Study Needs for Areas of Uncertainty .............................................................34
4 WATER QUALITY ............................................................................................................ 35

Chehalis River Flood Storage Dam April 2012 Fish Population Impact Study ii 100705-01.01
4.1 Basic Approach ...............................................................................................................36
4.1.1 Water Quality Data Collection ................................................................................37
4.1.2 Reservoir Temperature and DO Model ...................................................................37
4.1.3 Downstream Temperature and DO Model .............................................................39
4.2 Summary of Results ........................................................................................................40
4.2.1 Water Quality Data ..................................................................................................40
4.2.2 Water Quality and Temperature Modeling ............................................................45
4.3 Further Study Needs for Areas of Uncertainty .............................................................52
5 FISH HABITAT AVAILABILITY INVENTORY AND MODELING ................................ 54
5.1 Fish Habitat Availability Using PHABSIM Downstream of the Proposed Dam Site .54
5.1.1 Basic Approach .........................................................................................................54
5.1.2 Habitat Model ...........................................................................................................56
5.1.3 Summary of Results ..................................................................................................56
5.2 Fish Habitat Availability Using HEP Upstream of the Proposed Dam Site ................58
5.2.1 Basic Approach .........................................................................................................58
5.2.2 Summary of Results ..................................................................................................59
5.2.3 Estimation of Impacted Salmonid Habitat In Dam Reservoir Inundation Areas .61
5.3 Further Study Needs for Areas of Uncertainty .............................................................63
6 FISH POPULATION MODELING ..................................................................................... 65
6.1 Basic Approach ...............................................................................................................65
6.1.1 SHIRAZ Input Components ....................................................................................67
6.1.1.1 Anticipated Habitat Changes Resulting from the Construction and Operation of a Dam .......................................................................................................... 68
6.1.1.2 Fish Survival Past Dam ................................................................................... 69
6.1.2 Model Calibration .....................................................................................................71
6.1.3 Sensitivity Analyses ..................................................................................................71
6.2 Summary of Results ........................................................................................................72
6.2.1 Sensitivity Analyses ..................................................................................................77
6.3 Discussion .......................................................................................................................79
6.4 Further Study Needs for Areas of Uncertainty .............................................................80
7 CONCLUSIONS ................................................................................................................. 82
8 REFERENCES .................................................................................................................... 85

Chehalis River Flood Storage Dam April 2012 Fish Population Impact Study iii 100705-01.01
List of Tables Table 1-1 Assumptions Associated with the Proposed Chehalis River Water Storage
Dam ......................................................................................................................... 6
Table 2-1 Peak Flows and Volumes at Doty Gage ............................................................. 11
Table 2-2 Comparison of Flood Storage and Existing Conditions Modeling Results at the Doty gage .............................................................................................................. 15
Table 2-3 Flood Storage Reservoir Maximum Volume and Elevation ............................. 17
Table 2-4 Flood Storage Reservoir Emptying Time after Flood Events ........................... 18
Table 2-5 Summary of Water Surface Elevations near Chehalis and Centralia, Washington .......................................................................................................... 23
Table 2-6 Recurrence Interval of Flood Peaks in Chehalis River Basin during 1996 Flood............................................................................................................................... 27
Table 5-1 Flow (cfs) by Stream Reach and Life Stage where Maximum Usable Habitat Occurs (Range of Usable Habitat within 80% of the Maximum in Parentheses)............................................................................................................................... 57
Table 5-2 Summary of Major Habitat Characteristics by Stream Reach in the Upper Chehalis River Basin ............................................................................................ 60
Table 5-3 Comparison of Spawning and Rearing Habitat Availability in Existing and Future Scenarios ................................................................................................... 63
Table 6-1 Model Input Adjustments in Dam Scenario Analysis ....................................... 68
Table 6-2 Optimized Flow Release Schedule to Maximize Fish Habitat ......................... 69
Table 6-3 Predicted Percent Change in the Median Number of Spawners Over 50-year simulation period Between the Existing Condition and Dam Scenarios .......... 76
List of Figures Figure 1-1 Vicinity Map of Chehalis River Watershed ........................................................ 2
Figure 1-2 Conceptual Flow Chart of the Data Collection and Modeling Analysis Conducted in the Study and Contributing to the SHIRAZ Fish Population Modeling Analysis ................................................................................................. 4
Figure 2-1 Comparison of 100-year Hydrographs at Doty Gage ......................................... 16
Figure 2-2 Current Conditions and Flood Storage Alternatives: Exceedance Curves for the Doty Gage ............................................................................................................. 20
Chehalis River Flood Storage Dam April 2012 Fish Population Impact Study iv 100705-01.01
Figure 2-3 Current Conditions and Multi-Purpose Alternatives: Exceedance Curves for the Doty Gage ...................................................................................................... 21
Figure 2-4 Comparison of 100-Year Flood Profile – With Flood Control Reservoir ......... 24
Figure 2-5 Comparison of 1996 Flood Profile – With Flood Control Reservoir ................ 25
Figure 2-6 Comparison of 2007 Flood Profile – With Flood Control Reservoir ................ 26
Figure 4-1 Water Quality Sampling and Temperature Probe Locations ........................... 38
Figure 4-2 Continuous and Discrete Water Temperature Data Measured in This Study . 42
Figure 4-3 Water Quality Data Collected During Two Low-flow Events ......................... 43
Figure 4-4 Water Quality Data Collected During Two High-flow Events ........................ 44
Figure 4-5 Spatial Profiles of Temperature on Select Dates With and Without the Proposed Reservoir .............................................................................................. 47
Figure 4-6 Spatial Profiles of Dissolved Oxygen on Select Dates With and Without the Proposed Reservoir .............................................................................................. 48
Figure 4-7 Sensitivity of Downstream Temperature to Changes in Reservoir Withdrawal Elevation ............................................................................................................... 50
Figure 4-8 Sensitivity of Downstream Dissolved Oxygen to Changes in Reservoir Withdrawal Elevation ......................................................................................... 51
Figure 6-1 Example of Box Plot Figure Used to Present 50 Years of Spawner Numbers Data ....................................................................................................................... 73
Figure 6-2 Summary of the Number of Spawners Predicted in Each Analysis Scenario for Spring Chinook Salmon, Winter Steelhead, and Coho Salmon ........................ 75
Figure 6-3 Summary of the Number of Spawners Predicted in the Sensitivity Analyses for Spring Chinook Salmon, Winter Steelhead, and Coho Salmon ........................ 78
List of Appendices Appendix A Hydrologic and Hydraulic Modeling Report Appendix B Geomorphology/Sediment Transport/Large Woody Debris Report
Appendix C Water Quality Evaluations
Appendix D Fish Habitat Survey Using Physical Habitat Simulation Instream Flow Study Techniques
Appendix E Fish Habitat Survey of Upper Watershed Using Habitat Evaluation Procedures
Appendix F Fish Population Model

Chehalis River Flood Storage Dam April 2012 Fish Population Impact Study v 100705-01.01
LIST OF ACRONYMS AND ABBREVIATIONS °C degrees Celsius 1-D one-dimensional 2-D two-dimensional 7-DADMax 7-day average of the daily maximum temperature BOD biochemical oxygen demand cfs cubic feet per second DNR Washington Department of Natural Resources DO dissolved oxygen Ecology Washington State Department of Ecology FEMA Federal Emergency Management Agency Flood Authority Chehalis River Basin Flood Authority HEP Habitat Evaluation Procedure HSI Habitat Suitability Index IFIM Instream Flow Incremental Methodology LiDAR Light Detection and Ranging LWD large woody debris mg/l milligram per liter mm Millimeter NGVD 29 National Geodetic Vertical Datum of 1929 NOAA National Oceanic and Atmospheric Administration PHABSIM Physical Habitat Simulation RM river mile SOD sediment oxygen demand TMDL total maximum daily load TSS total suspended solids USACE U.S. Army Corps of Engineers USFWS U.S. Fish and Wildlife Service USGS U.S. Geological Survey WDFW Washington Department of Fish and Wildlife WSEL water surface elevation WUA Weighted Usable Area

Chehalis River Flood Storage Dam April 2012 Fish Population Impact Study ES-1 100705-01.01
EXECUTIVE SUMMARY
The Chehalis River Basin Flood Authority (Flood Authority) is evaluating the feasibility of reducing the frequency and severity of flooding on the Chehalis River by means of a flood retention structure on the upper mainstem Chehalis River at river mile (RM) 108.3. The evaluation considers two types of structure: 1) a flood storage only dam that would temporarily impound water in a reservoir during a high-flow event for a more gradual release into the lower watershed, and 2) a multi-purpose dam that would provide the same flood capacity as the flood storage only dam, but would continuously maintain a reservoir behind the dam in order to release flows at a rate beneficial to fish and to generate hydropower as a secondary purpose. . The Flood Authority hired Anchor QEA to conduct a study to evaluate the potential effects of the flood retention structure on fish populations in the mainstem Chehalis River between its headwaters near RM 126 and the town of Porter, Washington, at RM 33. The fish study focused on three salmonid species—spring Chinook salmon, winter steelhead, and coho salmon. These species are commercially, recreationally, and culturally important. These species also use spatially diverse areas in the mainstem river and represent a diversity of anadromous life history strategies and habitat requirements. In order to assess the potential impacts on salmonid populations, the fish study included evaluations of hydrology and hydraulics, water quality, sediment transport, large woody debris (LWD), and fish habitat. The information provided by each of these evaluations was used in a salmonid population simulation model named SHIRAZ to interpret potential impacts to fish populations. SHIRAZ is a spatially explicit life-cycle modeling platform that simulates the effects of environmental change on salmon populations (Battin et al. 2007). SHIRAZ employs a set of user-defined functional relationships among habitat characteristics, fish survival, and carrying capacity to evaluate population performance across space and time (Scheuerell et al. 2006). The model is used to translate the effects of changes to habitat quantity and quality resulting from a dam into consequences for salmonid population abundance and productivity in the basin.
Flood Storage Only Dam Alternative
The flood storage only dam used in the analysis was a 238-foot-tall structure that would temporarily impound water in a reservoir during a high flow event. The reservoir associated

Executive Summary
Chehalis River Flood Storage Dam April 2012 Fish Population Impact Study ES-2 100705-01.01
with a flood storage dam would provide 80,000 acre-feet of flood storage capacity. Following a high-flow event, the reservoir would be drained through the gradual release (maximum 2,000 cubic feet per second [cfs]) of water. The proposed reservoir would significantly reduce flood flows in the upper Chehalis River basin, by 58 to 60 percent for 10-year to 100-year recurrence interval floods. The resulting decrease in flow would reduce flood levels from the upper Chehalis River downstream to the study boundary, which is RM 33, the location of the U.S. Geological Survey (USGS) gage at Porter (Porter gage). In the reach of the Chehalis River between the Newaukum River and the USGS gage at Grand Mound, which contains the cities of Chehalis and Centralia, the flood levels are predicted to decrease by 1.6 to 2.0 feet for a 100-year flood. With smaller floods, smaller reductions will occur. The estimated reduction during the 1996 flood is from 0.7 to 1.1 feet and the estimated reduction during the 2007 flood is 2.6 to 3.1 feet. A flood storage only dam would reduce peak flows in the Chehalis River downstream from the reservoir. Because the reservoir would be filling or full during peak flows when the majority of coarse sediment (cobble, gravel, coarse sand) and wood is transported, it was assumed that large wood and coarse sediment from the upstream watershed would be trapped in the reservoir. The most pronounced effect from the change in peak flows and input and transport of sediment would be in the area between the proposed dam site and the confluence of the South Fork Chehalis River (RM 93.5 to RM107.8). Bedload transport capacity is calculated to be reduced to 4 to 9 percent of existing capacity under either storage scenario while coarse sediment input is estimated to be reduced to 39 to 54 percent compared to existing conditions. This reduction may result in some aggradation in the channel if input rates exceed transport capacity. Large woody debris levels would be lower because the large episodic input of wood from the upper watershed would be greatly reduced. The effects decline downstream as additional flow, sediment and wood are input to the river from downstream sources (e.g., tributaries). At RM 61.7, downstream of the City of Centralia, a bedrock control exists that resets upstream bedload input rates. The grade control is located downstream of most of the major tributaries (South Fork Chehalis, Newaukum, and Skookumchuck rivers). The effects of the flood storage alternative on peak flows, bedload transport, large wood, and river geomorphology would be much more muted downstream of the City of Centralia than in upstream reaches. A slight decrease in bedload

Executive Summary
Chehalis River Flood Storage Dam April 2012 Fish Population Impact Study ES-3 100705-01.01
transport capacity compared to input rates is likely to occur; however the slight reduction in peak flows would likely also result in a reduction in bank erosion, so the input of gravel and cobble from the banks would also decrease. There would likely be a slight reduction in large wood inputs as bank erosion rates decrease, but the majority of these changes would not be noticeable. An evaluation of water quality changes was undertaken to assess impacts from the proposed structure. Evaluations focused on assessing changes in water temperature and dissolved oxygen (DO) downstream of the proposed structure. The flood storage alternative does not propose to store water other than for a short time period after high-flow events. No effect on water temperature or DO would occur in the summertime, when water quality conditions tend to be most harmful to fish. The fish population modeling of flood storage only dam scenario included separate analyses depending on assumed fish passage survival rates. In the analysis, the model inputs with a flood storage facility included the following changes to habitat quantity and quality:
1. Decreased frequency and magnitude of high-flow events, which is beneficial to salmonids
2. Decreased quantity of habitat available in the upper watershed related to the presence of the reservoir during and after high-flow events
3. Decreased habitat quantity to account for loss of sediment bedload and large wood from the upper river as well as channel maintenance flows
4. Increased percentage of fine sediments in the reach downstream of the dam. In the flood storage only dam analysis, the population modeling predicted substantial declines to all three salmonid species analyzed. Assuming the target fish passage survival at the dam could be achieved, the median annual number of spawners was predicted to decrease by 22 percent among spring Chinook salmon, 43 percent among winter steelhead, and 43 percent among coho salmon. The predicted declines increase to 60 percent or more if only poor fish passage survival, such as that reported for the Cowlitz Falls facility, were to be achieved.

Executive Summary
Chehalis River Flood Storage Dam April 2012 Fish Population Impact Study ES-4 100705-01.01
Multi-Purpose Dam
The proposed multi-purpose dam would have the same storage volume allocated for flood reduction as the flood storage only alternative (80,000 acre-feet), but it is designed to have an additional 65,000 acre-feet for storing high flows experienced in the winter and spring time and releasing the flows at a controlled rate throughout the year. The flood reduction benefits would be the same as for the flood storage alternative. The dam would be 288 feet tall. The multi-purpose dam would continuously maintain a reservoir upstream of the dam, although water levels in the reservoir would fluctuate throughout the year. The year-round presence of a reservoir would allow for the release of water in low-flow periods to augment river flow downstream of the dam. In this analysis, it was assumed that a multi-purpose dam would be operated to manage flow releases (up to an outtake maximum release flow of 2,000 cfs) for the benefit of fish. An optimized water release schedule was developed for the three salmonid species analyzed. In the optimized water release schedule, minimum flows of 150 cfs to 250 cfs would be released during different months of the year. The optimized water release schedule for fish assumed that hydroelectric generation is subordinate to flow releases for fish. Using an optimized water release schedule, fish population impacts were evaluated. This alternative showed significant peak flow changes compared to existing conditions. As with the flood storage only dam alternative, the highest flows were decreased in magnitude due to flood events being stored at the reservoir. The controlled release of flows after high-flow events caused slightly higher median flows in the winter. Flow releases for hydropower operations would significantly increase instream flow in the upper Chehalis River in the May to October time period. For example, the median flow in September at the Doty gage for existing conditions was 30 cfs. With this alternative, the median flow increased to 171 cfs. In general, the magnitude of flow changes along the Chehalis River proceeding in a downstream direction was similar to that in the upper Chehalis River, but the effects would be less noticeable as the percentage of flow changed would be much less at the Grand Mound and Porter gages.
Executive Summary
Chehalis River Flood Storage Dam April 2012 Fish Population Impact Study ES-5 100705-01.01
The existing water temperature regime during the summer in the Chehalis River adversely impacts salmonids. The multi-purpose reservoir alternative, assuming withdrawal of cool water from the bottom of the reservoir, was predicted to lower summertime water temperatures in the Chehalis River, which would be beneficial for salmonids. A water quality model predicts that water temperatures in the upper Chehalis River, particularly upstream of confluence with the South Fork Chehalis River, would have greater compliance with salmonid temperature criteria compared to existing conditions. The benefits of low-flow augmentation were predicted to diminish progressively downstream, particularly downstream of the Newaukum River confluence, as tributary inflows begin to dominate instream conditions in the mainstem Chehalis River. Similar results are simulated for DO. Augmenting summer low flow with cooler water, at a higher DO, enables higher concentrations of DO, particularly in the upper Chehalis River. As with temperature, these benefits diminish in a downstream direction as DO levels downstream of the Skookumchuck River confluence are predicted to be nearly identical between existing and with project conditions. The fish population modeling of a multi-purpose dam scenario included separate analyses depending on assumed fish passage survival rates. In the analysis, the model inputs with a multi-purpose dam included the following changes to habitat quantity and quality:
1. Decreased frequency and magnitude of high-flow events, which is beneficial to salmonids
2. Increased base flows in the lower river due to releases from the multi-purpose reservoir
3. Altered water temperatures downstream of dam depending on whether water is released from the bottom or surface of the reservoir
4. Decreased quantity of habitat available in the upper watershed related to the presence of the reservoir during and after high-flow events
5. Decreased habitat quantity to account for loss of sediment bedload and large wood from the upper river as well as channel maintenance flows
6. Increased percentage of fine sediments in the area downstream of the dam

Executive Summary
Chehalis River Flood Storage Dam April 2012 Fish Population Impact Study ES-6 100705-01.01
In the optimized multi-purpose dam analysis that assumed target fish passage survival at the dam and reservoir could be achieved, the population modeling predicted a substantial increase (140 percent) in the median number of spring Chinook salmon spawners. It is hypothesized that this increase is due to the optimized water releases rates that maximize fish habitat spawning and rearing area downstream of the proposed dam site, as well as the improved (lower) water temperatures downstream of such a facility. These changes in mainstem river conditions downstream of a dam would improve habitat conditions for the portion of the river in which Washington Department of Fish and Wildlife (WDFW) estimates 94 percent of the spring Chinook salmon mainstem spawning occurs. The apparent contribution of the optimized flows to the spring Chinook salmon results was supported by the preliminary analysis of scenario that involves the multi-purpose dam without flows to maximize habitat, as the predicted number of spring Chinook salmon spawners in that scenario was reduced by more than 50 percent, compared to existing conditions, regardless of fish passage survival. For winter steelhead and coho salmon, in the scenario of an optimized multi-purpose dam with the assumption that target fish passage survival was achieved, declines of 32 and 28 percent, respectively, were predicted in the median annual number of spawners. If only poor fish passage survival was achieved, such as those survival rates reported for the Cowlitz Falls facility, then the predicted median number of winter steelhead spawners would be reduced by 52 percent, and the predicted median number of coho salmon would be reduced by 52 percent.
Conclusions
This analysis of the potential impacts of either a flood storage only dam or a multi-purpose dam on the upper mainstem of the Chehalis River predicted substantial declines for two or more of the mainstem salmonid populations studied. The only exception to this finding was the predicted increase in the number of spring Chinook salmon if a multi-purpose dam was installed that was operated to maximize suitable fish habitat downstream of the dam through water releases from the reservoir. For spring Chinook salmon in such an optimized multi-purpose dam scenario, the SHIRAZ model estimated increases in numbers of more than 100 percent. For winter steelhead and coho salmon, two species that depend heavily on high quality habitat in the upper watershed, reductions in population numbers of 32 and 28 percent, respectively, were predicted for dam operation at the target fish passage survival

Executive Summary
Chehalis River Flood Storage Dam April 2012 Fish Population Impact Study ES-7 100705-01.01
rate. Greater population reductions, more than 50 percent, would occur for winter steelhead and coho salmon with poor fish passage survival rates. For the flood storage only dam, reductions of 22 percent for spring Chinook salmon populations and 43 percent for winter steelhead and coho salmon populations were predicted for operations with the target fish passage survival rate. Reductions of more than 60 percent are predicted for poor fish passage survival conditions. Larger reductions in numbers of spawners were predicted for all three salmonid species in the flood storage only dam compared to the multi-purpose dam. A water release schedule from a multi-purpose dam that is not optimized to maximize fish habitat for the species and life stages present during different months of the year would be expected to cause larger reductions than those predicted in the optimized multi-purpose dam scenario analyzed in this study. Because the multi-purpose dam scenario that was analyzed optimized flow releases for fish habitat, the analysis would be applicable whether a turbine for hydropower is included at the dam or not. The hydrology and hydraulics analysis estimated that the optimized flow release schedule could support hydropower generation for approximately 200 days per year. A water release schedule with more of an emphasis on hydropower generation would be expected to result in fewer salmonid spawners than reported in the scenarios analyzed in this study. The likelihood of fish passage operations successfully passing salmonids is uncertain, particularly for downstream migrating juvenile salmonids, but has a major impact on the magnitude of population impacts. The results of this analysis suggest that fish passage operations achieving target survival rates (in this study, 80 percent survival of juveniles and 95 percent survival of adults) would be necessary in order to not reduce salmonid populations by more than 50 percent, with the exception of spring Chinook salmon in the optimized multi-purpose dam scenario. This analysis focused on the mainstem populations of three salmonid species. Either type of dam would also be expected to impact other fish in the mainstem and upper watershed study area, as well as fish populations in the tributaries off the mainstem Chehalis River that may use the mainstem habitats for migration or rearing. For those fish species in the upper

Executive Summary
Chehalis River Flood Storage Dam April 2012 Fish Population Impact Study ES-8 100705-01.01
watershed, habitat quantity and quality may be detrimentally impacted. For those fish species in tributaries off the mainstem Chehalis River and migrating through the lower mainstem, the augmented low flows provided in the optimized multi-purpose dam scenario may improve habitat quantity and quality. These potential detrimental and beneficial impacts to other fish, as well as other aquatic organisms and wildlife species, should be evaluated in a comprehensive assessment of the environmental impacts of a dam on the upper mainstem of the Chehalis River.

Chehalis River Flood Storage Dam April 2012 Fish Population Impact Study 1 100705-01.01
1 INTRODUCTION
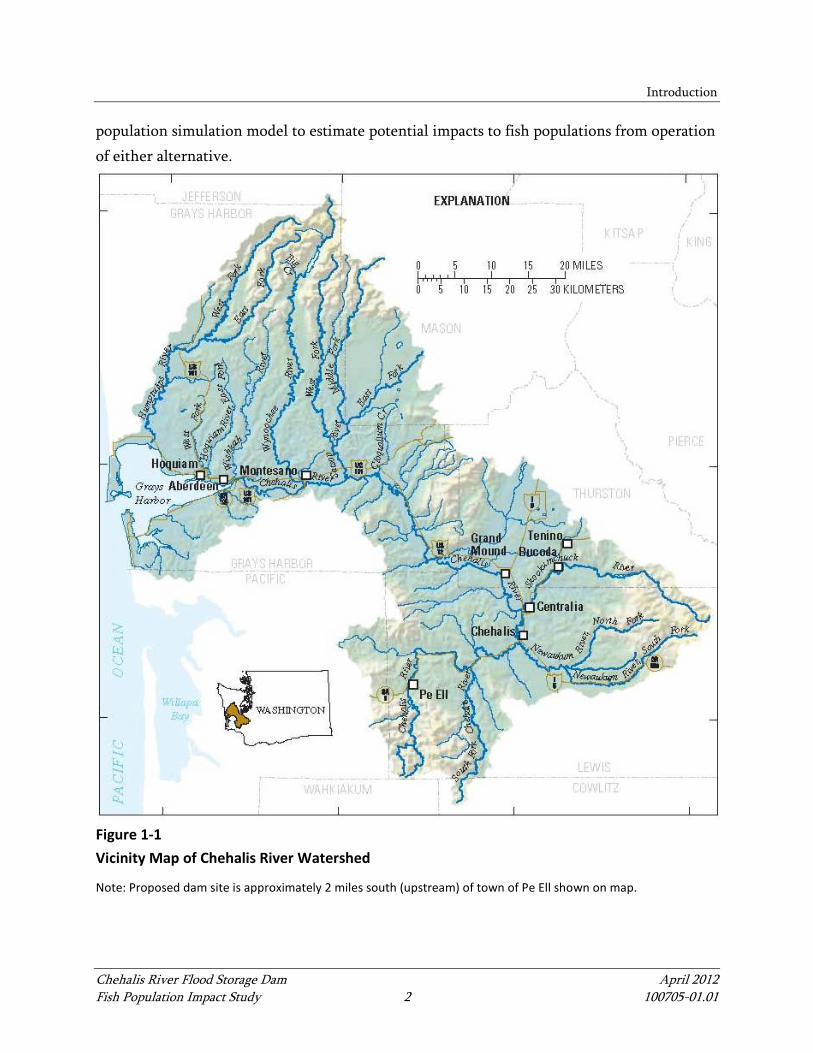
The Chehalis River, located in southwest Washington (Figure 1-1), is the second largest watershed in the state of Washington outside the Columbia River Basin. The watershed is prone to very high flood events during winter storms and in recent years multiple large flood events have caused extensive damage in the watershed. The Chehalis River Basin Flood Authority (Flood Authority) is evaluating the feasibility of reducing the frequency and severity of flooding on the Chehalis River by means of a flood retention structure on the upper mainstem Chehalis River at river mile (RM) 108.3. The Flood Authority is considering two types of facilities: 1) a flood storage only dam that would temporarily impound water in a reservoir during a high-flow event for a more gradual release into the lower watershed, and 2) a multi-purpose dam that would provide the same flood capacity as the flood storage only dam, but would continuously maintain a reservoir behind the dam in order to augment flows into the lower river over an extended time period and to generate hydropower as a secondary purpose. The Flood Authority hired Anchor QEA to conduct a fish impact study to evaluate the potential effects of the flood retention structure on fish populations in the mainstem Chehalis River between its headwaters near RM 126 and the town of Porter at RM 33. The scope of the fish study was originally developed as a 9-month analysis based largely on existing data. Although time extensions prolonged the study period, the scope of analysis remained the same. The study was designed to provide the Flood Authority with an initial analysis of potential effects to salmonids to inform their decisions regarding how to reduce flooding in the watershed. If planning for a dam continues, more comprehensive environmental assessment would be conducted. The fish study focused on three salmonid species—spring Chinook salmon, winter steelhead, and coho salmon. These species are commercially, recreationally, and culturally important. These species also use spatially diverse areas in the mainstem river and represent a diversity of anadromous life history strategies and habitat requirements. In order to assess the potential impacts on salmonid populations, the fish study included evaluations of hydrology and hydraulics, water quality, sediment transport, large woody debris (LWD), and fish habitat. The information provided by each of these evaluations was used in a salmonid
Introduction
Chehalis River Flood Storage Dam April 2012 Fish Population Impact Study 2 100705-01.01
population simulation model to estimate potential impacts to fish populations from operation of either alternative.
Figure 1-1 Vicinity Map of Chehalis River Watershed
Note: Proposed dam site is approximately 2 miles south (upstream) of town of Pe Ell shown on map.

Introduction
Chehalis River Flood Storage Dam April 2012 Fish Population Impact Study 3 100705-01.01
1.1 Study Approach
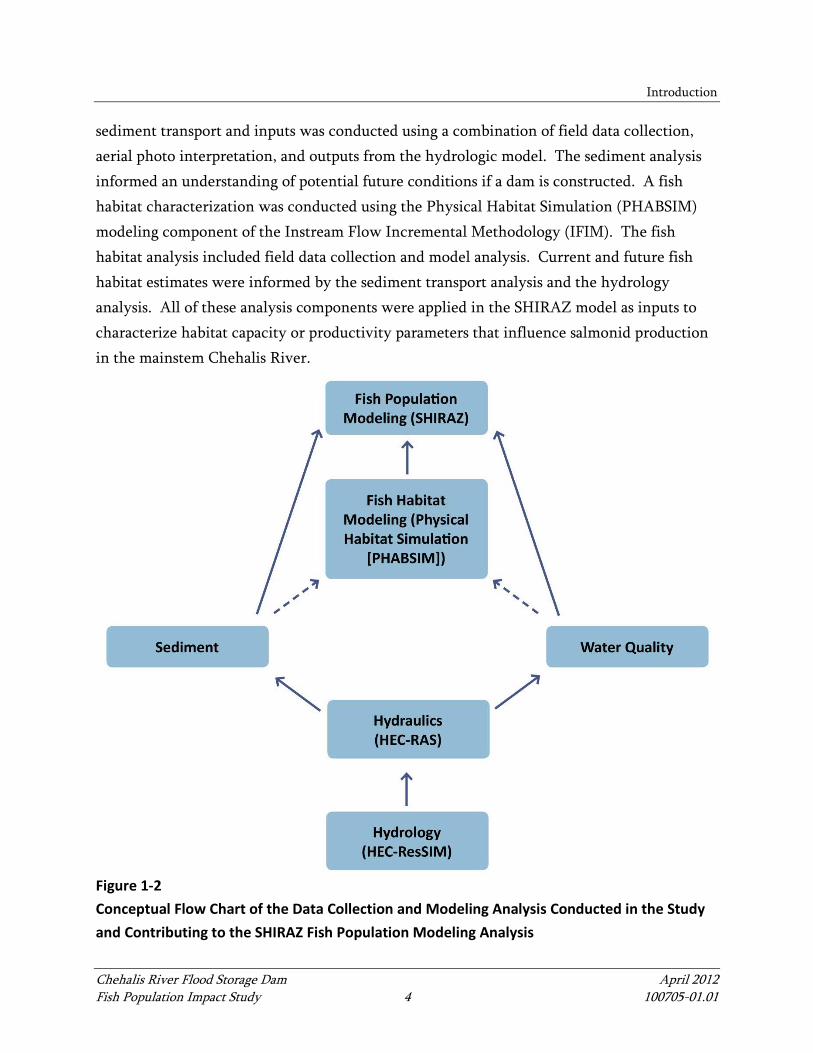
The analysis of the potential effects of a dam on the mainstem Chehalis River populations of spring Chinook salmon, winter steelhead, and coho salmon was conducted using the SHIRAZ modeling platform. SHIRAZ is a spatially explicit life-cycle modeling platform that simulates the effects of environmental change on salmon populations (Battin et al. 2007). SHIRAZ utilizes a set of user-defined relationships among habitat characteristics, fish survival, and carrying capacity to evaluate population performance across space and time (Scheuerell et al. 2006). The model is used to translate the effects of changes to habitat quantity and quality resulting from a dam to be translated into consequences for salmonid population abundance and productivity in the basin. To investigate the potential effects of a dam, SHIRAZ models were developed specifically for the Chehalis River. The data inputs to SHIRAZ on the salmonid populations, habitat capacity, and habitat productivity were developed through the compilation of available data for the study area, as well as the completion of data collection and modeling analyses to provide additional information on existing conditions and predicted future conditions. The fish population analysis incorporated information from the following contributing study components: hydrology and hydraulics, geomorphology, sediment transport, and large woody debris (LWD) transport, water quality, and fish habitat inventory and modeling. Figure 1-2 presents a flow chart describing how each component of the analysis leads into the next. A primary factor influencing the analysis of existing and future conditions was the river flows in the mainstem. An analysis of the hydrologic and hydraulic conditions of the basin was conducted using HEC-ResSIM and HEC-RAS models. The analysis used historic data on river flows to characterize existing flow conditions and estimate future flows with no dam, a flood storage only dam, or a multi-purpose dam. The scenarios with a dam include characterization of the reservoir impoundment and water releases from the reservoir following high-flow events. These hydrologic and hydraulic data were used in an analysis of water quality (temperature and dissolved oxygen [DO]) in the multi-purpose dam reservoir and downstream of the proposed dam site. The reservoir water quality analysis was conducted using the CE-QUAL-W2 model while the Chehalis River water quality analysis was performed using the temperature routine of the HEC-RAS model. An analysis of
Introduction
Chehalis River Flood Storage Dam April 2012 Fish Population Impact Study 4 100705-01.01
sediment transport and inputs was conducted using a combination of field data collection, aerial photo interpretation, and outputs from the hydrologic model. The sediment analysis informed an understanding of potential future conditions if a dam is constructed. A fish habitat characterization was conducted using the Physical Habitat Simulation (PHABSIM) modeling component of the Instream Flow Incremental Methodology (IFIM). The fish habitat analysis included field data collection and model analysis. Current and future fish habitat estimates were informed by the sediment transport analysis and the hydrology analysis. All of these analysis components were applied in the SHIRAZ model as inputs to characterize habitat capacity or productivity parameters that influence salmonid production in the mainstem Chehalis River.
Figure 1-2 Conceptual Flow Chart of the Data Collection and Modeling Analysis Conducted in the Study and Contributing to the SHIRAZ Fish Population Modeling Analysis

Introduction
Chehalis River Flood Storage Dam April 2012 Fish Population Impact Study 5 100705-01.01
1.2 Process for Obtaining Input to Study
During the completion of the study, input was sought and obtained from several interested parties in the Chehalis River watershed. During the preparation of the draft report, one Flood Authority update meeting and three Data Collection Group meetings were convened. The Data Collection Group meetings were open discussions of available data sources that had been identified and additional data sources that should be obtained. A draft report was delivered in November 2011 and comments were sought. The comment period extended to mid-January 2012 to allow sufficient time for the review of the materials. Anchor QEA conducted a Data Transfer Workshop in December 2011 to describe the models used in the analysis. This workshop was open to all and advertised in the local newspaper. A series of presentations of the draft results was conducted during the comment period. These presentations were made to (in chronological order): the Flood Authority, Quinault Indian Nation and Northwest Indian Fish Commission, and the Confederated Tribes of the Chehalis Reservation. More than 400 written comments on the draft report and appendices were submitted by the following organizations:
• Washington Department of Fish and Wildlife • Washington State Department of Ecology • Washington State Department of Transportation • Confederated Tribes of the Chehalis Reservation • Quinault Indian Nation • City of Chehalis • Wild Game Fish Conservation International • Lewis County Public Utility District • Thurston County
These comments were used in the preparation of this final report. A comment-response table to explain how comments were addressed was prepared and submitted with this final report.

Introduction
Chehalis River Flood Storage Dam April 2012 Fish Population Impact Study 6 100705-01.01
1.3 Study Assumptions
The investigation of the potential impacts to salmon in the mainstem Chehalis River entailed characterizing existing conditions and predicting future conditions that are relevant to the quantity and quality of available fish habitat. The modeling efforts required data inputs related to the proposed flood retention structure and its operation. Because some of the details related to the structure and its operation have not been determined, it was necessary to make assumptions to inform the modeling. To the extent possible, the model assumptions were based on information on the flood retention structure that was provided in the EES Consulting report titled Chehalis River Flood Water Storage Facilities Appendix B: Phase IIB Engineering Feasibility Studies Report (2011). For the analysis of the potential impacts of a multi-purpose dam, it was assumed that operations are optimized to maximize available fish habitat. That is, it was assumed that water storage and release from the reservoir was managed to augment low flows in the river to provide as much habitat as possible for salmonids. Table 1-1 documents the Anchor QEA Team’s understanding of the attributes of the Upper Chehalis mainstem flood retention dam that are relevant to the fish study, as well as assumptions regarding dam operations.
Table 1-1 Assumptions Associated with the Proposed Chehalis River Water Storage Dam
Flood Retention Structure or Operational Element Flood Storage Only Dam Multi-Purpose Dam
Structure Location RM 108.3 (two miles upstream from town of Pe Ell)
RM 108.3 (two miles upstream from town of Pe Ell)
Watershed Area above Structure 68.8 square miles 68.8 square miles Structure Height 238 feet 288 feet Lowest Streambed Elevation at Structure Axis
432 feet 432 feet
Crest Elevation 670 feet 720 feet Base Width 1,300 feet 1,600 feet Reservoir Capacity 80,000 acre-feet for flood storage
when reservoir filled to elevation 650 feet
145,000 acre-feet when reservoir filled to elevation 700 feet (80,000 acre-feet for flood storage and 65,000 acre-feet for hydropower generation)

Introduction
Chehalis River Flood Storage Dam April 2012 Fish Population Impact Study 7 100705-01.01
Flood Retention Structure or Operational Element Flood Storage Only Dam Multi-Purpose Dam
Reservoir Surface Area 1,000 acres when reservoir filled to elevation 650 feet
1,450 acres when reservoir filled to elevation 700 feet
Maximum Water Depth in Reservoir during Non-flood Conditions
Water depths will be determined by flows from upper watershed; no water impoundment during non-flood conditions
203 feet
Minimum Water Depth in Reservoir during Non-flood Conditions
58.5 feet
Maximum Water Depth during Flood Conditions
237.5 feet when reservoir filled to elevation 669.5 feet
287.5 feet when reservoir filled to elevation 719.5 feet
Flow at which Structure Starts to Hold Water
A pre-determined maximum flow threshold, probably 2,000 cubic feet per second (cfs)
Flood storage aspect of structure is in effect when reservoir water surface elevation exceeds 635 feet
Flow Release Rate during Flooding A pre-determined release dependent on reservoir inflow (release of 2,000 cfs when inflow is between 2,000 and 5,000 cfs; release of 1,000 cfs for three days when inflow is between 5,000 and 10,000 cfs; release of 200 cfs for three days when inflow is more than 10,000 cfs)
A lagged release of 2,000 cfs three days after flood storage is activated
Duration of 2,000 cfs Flow Release following Event Utilizing Flood Storage Capacity
25 days for 100-year flood 25 days for 100-year flood
Flow Release Rate during Non-flood Conditions
Natural flows from the upper watershed will pass through the reservoir reach and structure; no water impoundment during non-flood conditions
250 cfs for November through February; 200 cfs for March through June; 150 cfs in July; 160 cfs for August through October
Elevation of Water Release Within Reservoir
Release likely to be from base of reservoir
An intake tower or multiple outlets will be used to allow water to be released at varying depths depending on reservoir water surface elevation and desired temperature of releases
Spillway Capacity 49,640 cfs when reservoir filled to elevation 669.5 feet
49,640 cfs when reservoir filled to elevation 719.5 feet
Upstream and Downstream Fish Passage
Will be provided Will be provided
Sediment Transport from Upper Watershed
All coarse sediment load and some fraction of the fine sediment load (silt/clay) will be retained
All coarse sediment load and some fraction of the fine sediment load (silt/clay) will be retained

Introduction
Chehalis River Flood Storage Dam April 2012 Fish Population Impact Study 8 100705-01.01
Flood Retention Structure or Operational Element Flood Storage Only Dam Multi-Purpose Dam
Large Woody Debris (LWD) Transport from Upper Watershed
Because the reservoir will be filled during peak flows when most large wood is transported, it is assumed that the structure does not allow LWD transport from the upper watershed
Because the reservoir will be maintained throughout the year, it is assumed that the structure does not allow LWD transport from the upper watershed
1.4 Report Contents
This report summarizes the analysis and findings of several study components. The study components are described in detail in six appendices. The study component appendices are as follows:
• Appendix A – Hydrologic and Hydraulic Modeling Report • Appendix B – Geomorphology/Sediment Transport/Large Woody Debris Report • Appendix C – Water Quality Evaluations • Appendix D – Fish Habitat Survey Using Physical Habitat Simulation Instream Flow
Study Techniques • Appendix E – Fish Habitat Survey of Upper Watershed Using Habitat Evaluation
Procedures • Appendix F – Fish Population Model
In this summary report, each individual study component is presented in a separate section, except for the fish habitat survey information. The two fish habitat survey components from Appendices D and E are presented in one section in this summary report.
Chehalis River Flood Storage Dam April 2012 Fish Population Impact Study 9 100705-01.01
2 HYDROLOGY AND HYDRAULICS
2.1 Basic Approach
Existing conditions and the two reservoir configurations (flood storage only and multi-purpose) were analyzed in the hydrologic and hydraulic studies. The purpose of the flood storage only reservoir is to store water during flood events on the Chehalis River and release flow at a greatly reduced rate in order to reduce peak flows in downstream areas that are susceptible to flooding and damage from flooding. The multi-purpose alternative assumes a 145,000-acre-foot capacity reservoir with 65,000 acre-feet available for storage for fish flow releases and hydropower generation and 80,000 acre-feet available for flood storage. The flood storage capacity of the multi-purpose alternative is the same as that of the flood storage only alternative. The additional reservoir storage for the recommended fish flow releases will allow water to be stored and released at rates that will benefit fisheries in downstream reaches, including in the summertime. The hydrologic and hydraulic models HEC-ResSIM and HEC-RAS were used to determine the effects of the proposed reservoirs on flow and flood levels as well as to calculate hydraulic properties along the Chehalis River, which were used in other analyses (sediment transport, LWD, water quality). The HEC-ResSIM and HEC-RAS models were both developed by the U.S. Army Corps of Engineers (USACE) Hydrologic Engineering Center. The HEC-ResSIM model is commonly used for reservoir planning and operations analyses. The HEC-RAS model is a one-dimensional (1-D) hydraulic routing model that can be run in a steady-state or unsteady-state mode. It is the most commonly used hydraulic model for rivers and streams. Elevations used in the HEC-ResSIM and HEC-RAS models were converted to National Geodetic Vertical Datum of 1929 (NGVD 29) + 1,000 feet to match the vertical datum used in an existing Federal Emergency Management Agency (FEMA) HEC-RAS model of the Chehalis River. The following sections provide a summary of the methods and results of hydrologic and hydraulic modeling performed for this study. Additional detail and results are provided in Appendix A.

Hydrology and Hydraulics
Chehalis River Flood Storage Dam April 2012 Fish Population Impact Study 10 100705-01.01
2.1.1 Description of Hydrologic Analyses Performed
2.1.1.1 HEC-ResSIM Model
The HEC-ResSIM model was used to model the operations of each reservoir alternative, and to route flows in the Upper Chehalis River to the U.S. Geological Survey (USGS) Gage No. 12020000 Chehalis River near Doty (Doty gage). The HEC-ResSIM model for the Upper Chehalis River included the following basic components, from upstream to downstream:
• Estimate of inflow into proposed reservoir • Analysis of operations of the reservoir alternatives and calculation of outflow from
the reservoir • Hydrologic routing between the proposed dam and the Doty gage
Inflow into the proposed reservoir was estimated using a USGS method for scaling discharge from a gaged site (Doty gage) to an ungaged site (reservoir) based upon drainage area (USGS 2001). Discharge records are available for the Doty gage from October 1, 1988, to present. In addition, synthetic hydrographs were used that represent floods with recurrence intervals of 2, 10, 50 and 100 years at the Doty gage. To evaluate the performance of the reservoir alternatives in reducing floods and to analyze the effect on streamflow in the Chehalis River, hourly data from the Doty gage for the period from October 1, 1988, to March 15, 2011, were used in the model. That period of record includes the two highest flows on record at the Doty gage—in February 1996 and in December 2007. The synthetic hydrographs representing 10-, 50- and 100-year recurrence interval floods were obtained from FEMA and their study contractor, NHC (2009). The hydrographs prepared by NHC were based upon statistical analyses of peak flows and volumes of flow for floods at the Doty gage. In addition, a synthetic hydrograph representing a 2-year recurrence interval flood was developed by Anchor QEA using the same methodology as

Hydrology and Hydraulics
Chehalis River Flood Storage Dam April 2012 Fish Population Impact Study 11 100705-01.01
NHC. A summary of those peak flows and 7-day volumes at the Doty gage is shown in Table 2-1.
Table 2-1 Peak Flows and Volumes at Doty Gage
Recurrence Interval Peak Flow (cfs) 7-day Volume (acre-feet)
2-year 9,967 48,884
10-year 19,857 75,842
50-year 32,562 101,788
100-year 39,353 113,541
The operations of the reservoir alternatives were analyzed using HEC-ResSIM with the configurations of the reservoirs described in Table 1-1. The flood storage only alternative assumes an 80,000-acre-foot capacity reservoir is placed to store water during high flow events. Anchor QEA developed a reservoir operating scheme for this alternative, which is described herein. The outflow from the reservoir will depend on the reservoir inflow. The outflow will equal the inflow until the reservoir low-level outlet capacity of 2,000 cubic feet per second (cfs) is exceeded or when a flood condition is anticipated or exists. Reservoir operating rules input into the HEC-ResSIM model for the flood storage alternative are:
• The reservoir outflow equals inflow when inflow is less than 2,000 cfs. • When the reservoir inflow is between 2,000 and 5,000 cfs, the outflow will be held at
2,000 cfs (maximum low-level outlet capacity). • If the reservoir inflow is between 5,000 and 10,000 cfs, the outflow will be reduced to
1,000 cfs for three days (72 hours) to allow the flood to pass through downstream reaches of the Chehalis River.
• If the reservoir inflow exceeds 10,000 cfs, the outflow will be reduced to 200 cfs for three days (72 hours) to allow the flood to pass through downstream reaches of the Chehalis River.
• The maximum rate of change in reservoir outflow is 200 cfs per hour to prevent sudden surges of water downstream or fish stranding issues.
Hydrology and Hydraulics
Chehalis River Flood Storage Dam April 2012 Fish Population Impact Study 12 100705-01.01
The multi-purpose dam alternative assumes a 145,000-acre-foot reservoir with 65,000 acre-feet available for storage and release of fish flows and 80,000 acre-feet available for flood control. The operations of the multi-purpose reservoir were set depending on the season and reservoir pool elevation, as described by the following:
• When the reservoir is below the minimum hydroelectric operating pool of 1,610 feet, the reservoir outflow depends on desired releases for fish. Water is released through the low-level outlet (tunnel). No power is produced during this time.
• When the reservoir is above the minimum hydroelectric operating pool of 1,610 feet, outflow is discharged through the power plant and/or the low-level outlet. The releases also depend on desired releases for fish.
• When the reservoir is above the flood storage level of 1,635 feet, the reservoir outflow is increased to a maximum of 2,000 cfs after three days (72 hours) to allow a flood to pass through downstream reaches of the Chehalis River. The outflow is maintained at 2,000 cfs until the reservoir level drops to 1,635 feet.
• The maximum rate of change in reservoir outflow is 200 cfs per hour to prevent sudden surges of water downstream or fish stranding issues.
The outflow from the reservoir alternatives needed to be routed through the reach of the Chehalis River between the proposed reservoir and the Doty gage to provide an input hydrograph for the HEC-RAS model. Hydrologic routing was performed for that reach using the Muskingum-Cunge 8-point channel routing method available in HEC-ResSIM. No surveyed river channel data were available for this reach so channel data from upstream and downstream cross-sections (at the reservoir and at Doty gage) were used to approximate the channel characteristics for the channel routing.
2.1.1.2 Flow Exceedance Calculations
The hourly discharge values produced by the HEC-ResSIM model were analyzed to develop average daily flow exceedance statistics for the Chehalis River at the Doty gage for existing conditions and the two reservoir alternatives. To estimate flows at the USGS Gage No. 12027500 Chehalis River near Grand Mound (Grand Mound gage) and USGS Gage No. 12031000 Chehalis River at Porter (Porter gage), a simple method was used that accounted for flow differences at the Doty gage and the lag time between the Doty gage and
Hydrology and Hydraulics
Chehalis River Flood Storage Dam April 2012 Fish Population Impact Study 13 100705-01.01
downstream gages. Those flows were then analyzed to develop daily flow exceedance statistics at the Grand Mound and Porter gages.
2.1.2 Description of Hydraulic Analyses Performed
2.1.2.1 HEC-RAS Model
The HEC-RAS model was used to route flow through the Chehalis River beginning at the Doty gage and terminating at the Porter gage. This model was chosen because a HEC-RAS model for the Chehalis River was previously developed for flood analyses by FEMA and was available for use on this project. The model input files were transmitted by FEMA to the City of Chehalis and then to Anchor QEA (City of Chehalis 2010). The HEC-RAS model was run in unsteady-state mode for analyses of flooding along the Chehalis River. The unsteady-state mode accounts for storage of flood water in floodplain areas and release of that water back to the river. Floodplain storage attenuates peak flows in the river. The HEC-RAS model was also modified and run in steady-state mode during low-flow periods when floodplain storage is not important. The temperature analysis option in HEC-RAS was used to estimate river temperatures. The temperature analyses are summarized in Appendix C of this report. Synthetic hydrographs for the 2-, 10-, 50-, and 100-year flood events, for both existing conditions and the flood storage only dam alternative, were input to the HEC-RAS model and simulations were run to compute flood levels and hydraulic properties along the Chehalis River from the Doty gage to the Porter gage. Because the proposed reservoir would only modify the flows above the Doty gage, only the boundary condition at cross-section 101.8 (the upstream extent of the HEC-RAS model) was updated for proposed conditions. No other boundary conditions were changed. The flows used in tributaries by NHC were not changed. The tributary flows used by NHC in the model were based upon analyses of concurrent floods. For the South Fork Chehalis River, the concurrent flood used had the same recurrence interval as the Chehalis River at Doty. For example when a 100-year flood hydrograph was used at Doty, a 100-year flood hydrograph was used for the South Fork Chehalis River. For other major tributaries (the Newaukum and Skookumchuck rivers), flood hydrographs that are approximately equal to 20-year recurrence interval floods were

Hydrology and Hydraulics
Chehalis River Flood Storage Dam April 2012 Fish Population Impact Study 14 100705-01.01
used as the flood concurrent to both a 50-year and 100-year flood for the Chehalis River at Doty. The HEC-RAS model was also run to simulate the 1996 and 2007 flood events for existing and future conditions for the flood storage only alternative. The 1996 flood event occurred from February 5 to 10, 1996, and the 2007 flood event occurred from December 1 to 5, 2007. As in the other simulations, the only boundary condition updated in the HEC-RAS model was the hydrograph at cross-section 101.8 (the Doty gage).
2.2 Summary of Results
2.2.1 Hydrologic Modeling Results
2.2.1.1 HEC-ResSIM Modeling
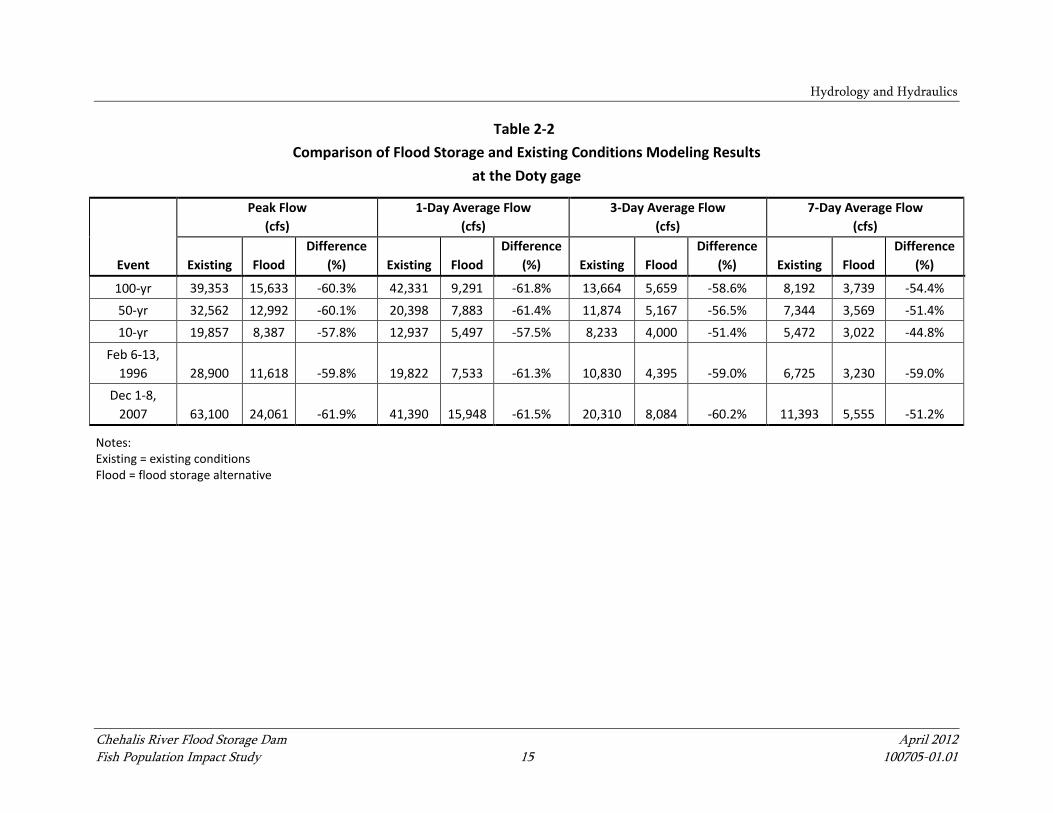
The results of HEC-ResSIM modeling for the flood storage alternative are compared to existing conditions at the Doty gage in Table 2-2. Figure 2-1 presents a comparison of the synthetic 100-year hydrograph for existing conditions and the flood storage alternative at the Doty gage. The HEC-ResSIM analyses indicated peak flows can be reduced by about 50 to 60 percent at the Doty gage, as compared with existing conditions. The 100-year event was predicted to decrease from 39,353 cfs to 15,633 cfs. The 1-day to 7-day average flows were also substantially reduced, by 45 to 62 percent. Because the outflow from the reservoir is restricted to 2,000 cfs, most of the peak flow was contributed from the Chehalis River basin area located downstream of the proposed reservoir.
Hydrology and Hydraulics
Chehalis River Flood Storage Dam April 2012 Fish Population Impact Study 15 100705-01.01
Table 2-2 Comparison of Flood Storage and Existing Conditions Modeling Results
at the Doty gage
Event
Peak Flow (cfs)
1-Day Average Flow (cfs)
3-Day Average Flow (cfs)
7-Day Average Flow (cfs)
Existing Flood Difference
(%) Existing Flood Difference
(%) Existing Flood Difference
(%) Existing Flood Difference
(%)
100-yr 39,353 15,633 -60.3% 42,331 9,291 -61.8% 13,664 5,659 -58.6% 8,192 3,739 -54.4% 50-yr 32,562 12,992 -60.1% 20,398 7,883 -61.4% 11,874 5,167 -56.5% 7,344 3,569 -51.4% 10-yr 19,857 8,387 -57.8% 12,937 5,497 -57.5% 8,233 4,000 -51.4% 5,472 3,022 -44.8%
Feb 6-13, 1996 28,900 11,618 -59.8% 19,822 7,533 -61.3% 10,830 4,395 -59.0% 6,725 3,230 -59.0%
Dec 1-8, 2007 63,100 24,061 -61.9% 41,390 15,948 -61.5% 20,310 8,084 -60.2% 11,393 5,555 -51.2%
Notes: Existing = existing conditions Flood = flood storage alternative

Figure 2-1 Comparison of 100-year Hydrographs at Doty Gage
Chehalis River Basin Fish Study
0
5,000
10,000
15,000
20,000
25,000
30,000
35,000
40,000
45,000
0 24 48 72 96 120 144 168
Flow
(cfs
)
Time (hours)
Current Conditions Flood Storage
Hydrology and Hydraulics
Chehalis River Flood Storage Dam April 2012 Fish Population Impact Study 17 100705-01.01
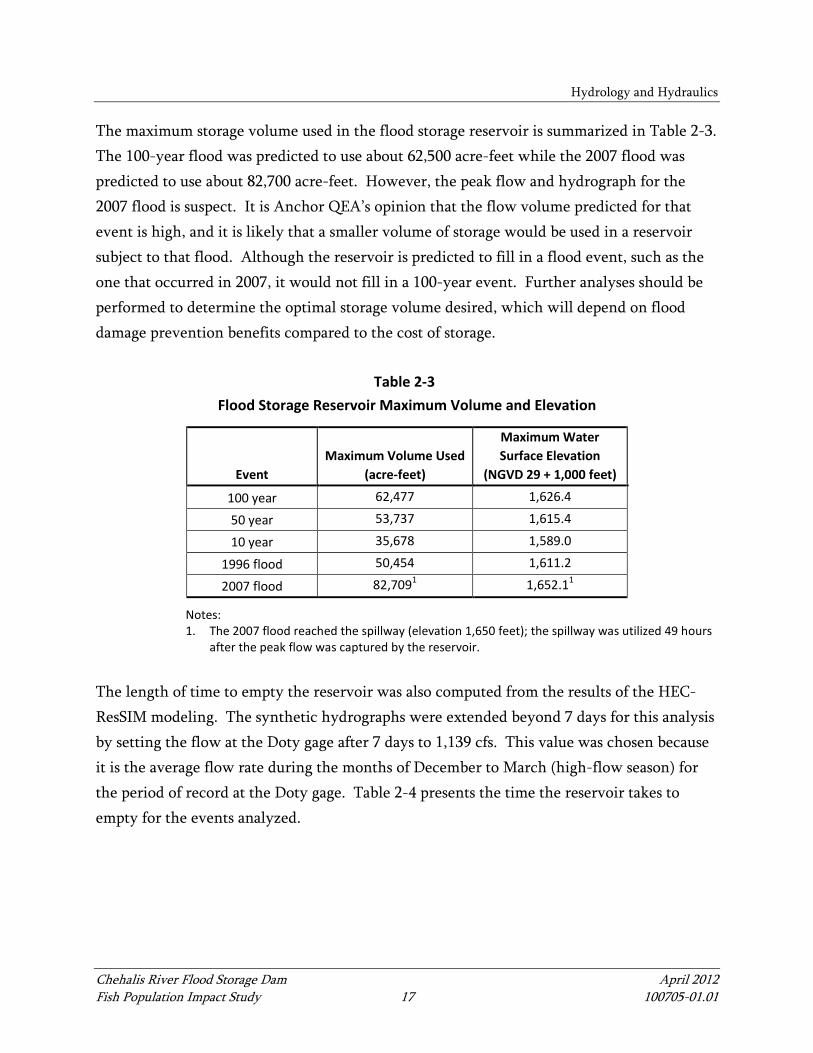
The maximum storage volume used in the flood storage reservoir is summarized in Table 2-3. The 100-year flood was predicted to use about 62,500 acre-feet while the 2007 flood was predicted to use about 82,700 acre-feet. However, the peak flow and hydrograph for the 2007 flood is suspect. It is Anchor QEA’s opinion that the flow volume predicted for that event is high, and it is likely that a smaller volume of storage would be used in a reservoir subject to that flood. Although the reservoir is predicted to fill in a flood event, such as the one that occurred in 2007, it would not fill in a 100-year event. Further analyses should be performed to determine the optimal storage volume desired, which will depend on flood damage prevention benefits compared to the cost of storage.
Table 2-3 Flood Storage Reservoir Maximum Volume and Elevation
Event Maximum Volume Used
(acre-feet)
Maximum Water Surface Elevation
(NGVD 29 + 1,000 feet)
100 year 62,477 1,626.4
50 year 53,737 1,615.4
10 year 35,678 1,589.0
1996 flood 50,454 1,611.2
2007 flood 82,7091 1,652.11
Notes: 1. The 2007 flood reached the spillway (elevation 1,650 feet); the spillway was utilized 49 hours
after the peak flow was captured by the reservoir. The length of time to empty the reservoir was also computed from the results of the HEC-ResSIM modeling. The synthetic hydrographs were extended beyond 7 days for this analysis by setting the flow at the Doty gage after 7 days to 1,139 cfs. This value was chosen because it is the average flow rate during the months of December to March (high-flow season) for the period of record at the Doty gage. Table 2-4 presents the time the reservoir takes to empty for the events analyzed.

Hydrology and Hydraulics
Chehalis River Flood Storage Dam April 2012 Fish Population Impact Study 18 100705-01.01
Table 2-4 Flood Storage Reservoir Emptying Time after Flood Events
Event Emptying Time (days)
100 year 25
50 year 21
10 year 15
1996 flood 19
2007 flood 48 Note: Time is calculated starting from the time when the reservoir storage is at its peak to the time when reservoir outflow is equal to reservoir inflow.
The flood storage only dam will empty in approximately 15 to 25 days for most large flood events. The time to empty for the December 2007 flood event was estimated to be 48 days, primarily because of the volume of flow predicted for the event and high flows that were experienced beyond the event. It is Anchor QEA’s opinion that the volume of flow in the 2007 flood has been overestimated and that the time to empty would be shorter than 48 days. Different flow patterns after a storm event would cause different emptying times. If another flood occurred when the reservoir was still partially full, then the emptying time would increase.
2.2.1.2 Flow Exceedance Results
Daily flow exceedance calculations for the Chehalis River at the Doty gage were performed by averaging the hourly discharge values produced by the HEC-ResSIM model. Figure 2-2 illustrates the flow exceedance calculations for the flood storage only dam alternative while Figure 2-3 illustrates the flow exceedance calculations for the multi-purpose dam alternative. The flow statistics demonstrated a reduction in high flows with the flood storage only dam alternative. The maximum flows were significantly reduced. Flows less than about 3,000 cfs were not significantly affected. Flows outside of the winter months (November to March) were barely affected as well because the reservoir is mostly empty in those months and large floods are rare.

Hydrology and Hydraulics
Chehalis River Flood Storage Dam April 2012 Fish Population Impact Study 19 100705-01.01
The multi-purpose dam alternative showed significant flow changes compared to existing conditions. As with the flood storage only dam alternative, the highest flows were greatly decreased in magnitude due to flood events being stored at the reservoir. The storage of water and controlled release of flows caused lower median flows (50 percent exceedance) in the November to April time period. The release of water to meet fish flows caused flows from May to October to significantly increase. For example, the median flow in September at the Doty gage was 30 cfs. With the multi-purpose dam alternative, the median flow would increase to 171 cfs.

Figure 2-2 Current Conditions and Flood Storage Alternatives: Exceedance Curves for the Doty Gage
Chehalis River Basin Fish Study
10
100
1,000
10,000
100,000
0% 10% 20% 30% 40% 50% 60% 70% 80% 90% 100%
Q, c
fs
Percent Exceedance
Existing Conditions With Flood Storage Reservoir
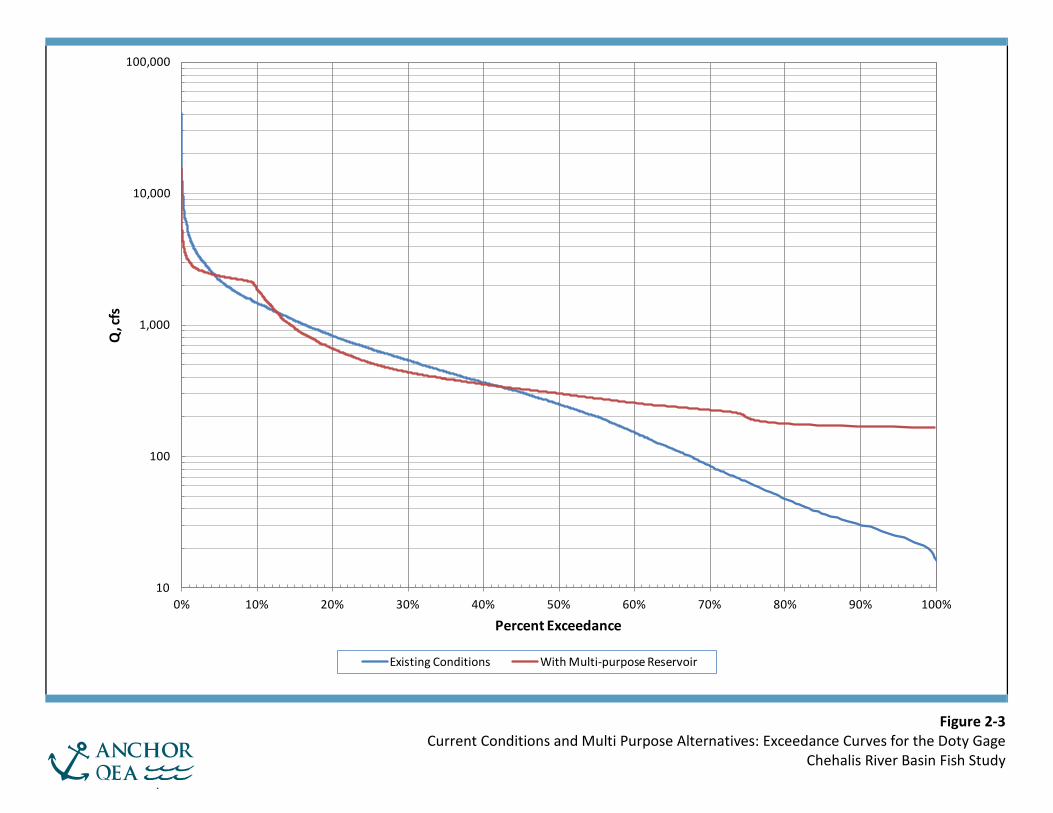
Figure 2-3 Current Conditions and Multi Purpose Alternatives: Exceedance Curves for the Doty Gage
Chehalis River Basin Fish Study
10
100
1,000
10,000
100,000
0% 10% 20% 30% 40% 50% 60% 70% 80% 90% 100%
Q, c
fs
Percent Exceedance
Existing Conditions With Multi-purpose Reservoir

Hydrology and Hydraulics
Chehalis River Flood Storage Dam April 2012 Fish Population Impact Study 22 100705-01.01
Flow exceedance calculations were also performed for both alternatives at the Grand Mound and Porter gages. In general, the magnitude of flow changes at those locations is similar to that experienced at the Doty gage, but the effects would be less noticeable as the percentage of flow changed would be much less at the Grand Mound and Porter gages because of inflow occurring between the Doty and Grand Mound gages.
2.2.2 Hydraulic Modeling Results
2.2.2.1 HEC-RAS Modeling
HEC-RAS modeling of 7-day floods for 2-, 10-, 50- and 100-year floods, as well as for the February 1996 event and December 2007 event, was performed and a comparison of flood levels predicted under existing conditions and with the reservoir alternatives was completed. Table 2-5 summarizes flood levels at key locations along the Chehalis River for existing conditions and with the flood storage only dam alternative. Figures 2-4 through 2-6 show a comparison the flood profiles for a 100-year flood, the 1996 flood event, and the 2007 flood event, respectively, to existing conditions. The area plotted in Figures 2-4 through 2-6 is located through the reach of the Chehalis River in Chehalis and Centralia, Washington, from approximately RM 75.2 to 58.89, confluence with Newaukum River to the Grand Mound gage. The figures show the area in the Chehalis River basin of highest concern and greatest economic impact from flooding. Other areas in the basin also experience severe flooding, and modeling results for other areas can be provided as desired by the Flood Authority. The configuration of the reservoir analyzed was the flood storage only alternative; however, the multi-purpose reservoir alternative would have similar flood control benefits because of the same flood storage volume provided. The largest reduction in flooding occurs in the City of Chehalis down to the Mellen Street Bridge, with a reduction in 100-year flood levels of 2.0 feet. Slightly smaller reductions of 1.6 to 1.7 feet occur at the confluence with the Newaukum and Skookumchuck rivers. Smaller reductions occur with smaller floods, with a reduction of 1.0 to 1.3 feet for a 50-year flood and 0.9 to 1.1 feet for a 10-year flood. The estimated reduction during the 1996 flood event is 0.7 to 1.1 feet, and the estimated reduction during the 2007 flood is 2.6 to 3.1 feet. At the Mellen Street Bridge, the estimated reduction in flood levels for the 2007 flood is 3.1 feet.

Chehalis River Flood Storage Dam April 2012 Fish Population Impact Study 23 100705-01.01
Table 2-5 Summary of Water Surface Elevations near Chehalis and Centralia, Washington
Flood Event
Newaukum River Confluence Cross-Section 75.2
Chehalis-Centralia Airport Cross-Section 72
Existing WSEL (NGVD29 + 1,000-feet)
Proposed WSEL
(NGVD29 + 1,000-feet) ΔH (feet)
Existing WSEL (NGVD29 + 1,000-feet)
Proposed WSEL
(NGVD29 + 1,000-feet) ΔH (ft)
100-Year 1,182.4 1,180.7 1.7 1,178.3 1,176.3 2.0 50-Year 1,181.1 1,180.1 1.0 1,176.8 1,175.5 1.3 10-Year 1,178.9 1,177.8 1.1 1,174.4 1,173.3 1.1 2-Year 1,175.0 1,174.0 1.0 1,170.2 1,169.4 0.8 1996 1,181.3 1,180.6 0.7 1,177.2 1,176.2 1.0 2007 1,183.5 1,180.9 2.6 1,179.2 1,176.3 2.9
Flood Event
Mellen Street Cross-Section 67.46
Skookumchuck Confluence Cross-Section 66.88
Existing WSEL (NGVD29 + 1,000-feet)
Proposed WSEL
(NGVD29 + 1,000-feet) ΔH (feet)
Existing WSEL (NGVD29 + 1,000-feet)
Proposed WSEL
(NGVD29 + 1,000-feet) ΔH (feet)
100-Year 1,175.5 1,173.5 2.0 1,173.0 1,171.4 1.6 50-Year 1,173.9 1,172.6 1.3 1,171.7 1,170.6 1.1 10-Year 1,171.4 1,170.3 1.1 1,169.3 1,168.4 0.9 2-Year 1,166.5 1,165.9 0.6 1,164.9 1,164.4 0.5 1996 1,174.7 1,173.6 1.1 1,172.7 1,171.7 1.0 2007 1,176.4 1,173.3 3.1 1,173.4 1,170.8 2.6
Notes: WSEL = water surface elevation ΔH = change in head or WSEL
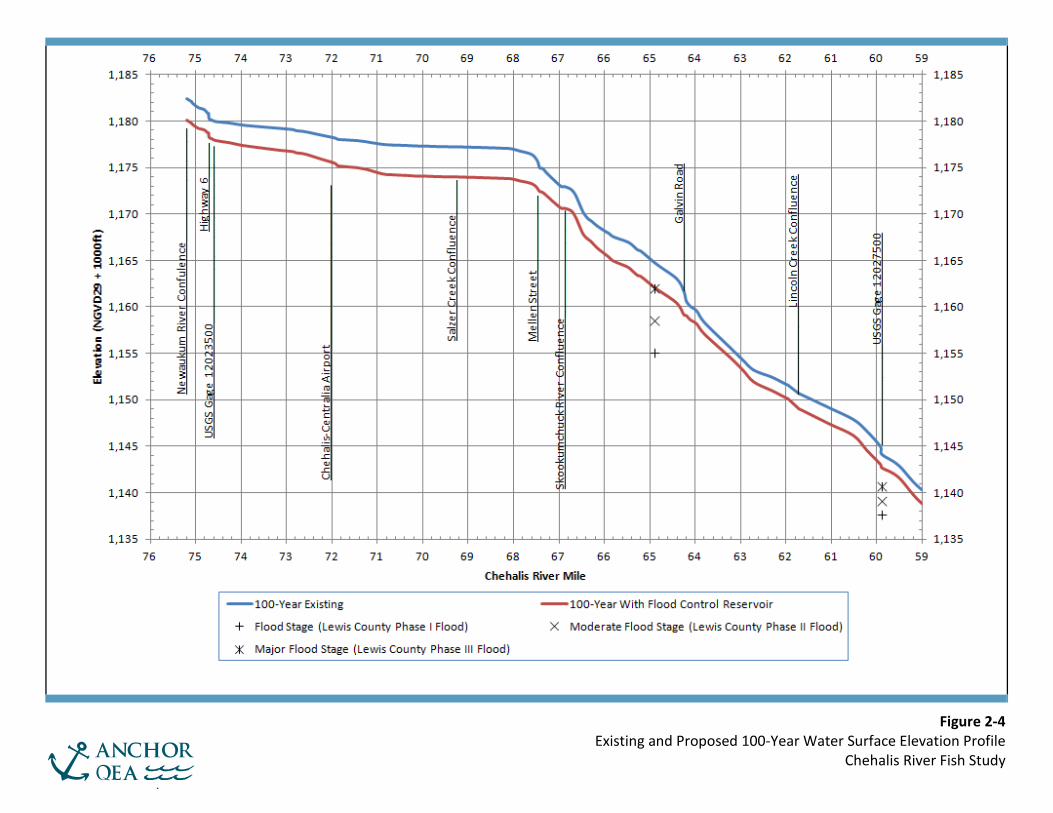
Figure 2-4 Existing and Proposed 100-Year Water Surface Elevation Profile
Chehalis River Fish Study

Figure 2-5 Existing and Proposed 1996 Flood Water Surface Elevation Profile
Chehalis River Fish Study

Figure 2-6 Existing and Proposed 2007 Flood Water Surface Elevation Profile
Chehalis River Fish Study

Hydrology and Hydraulics
Chehalis River Flood Storage Dam April 2012 Fish Population Impact Study 27 100705-01.01
The 2- through 100-year flood results as well as the 2007 flood results provide an estimate of the ability of the reservoir alternatives to reduce flooding which is primarily caused by large storms in the upper Chehalis River basin. The 1996 flood results provide an estimate of the potential to reduce floods that are caused by basin-wide storms and not primarily caused by upper Chehalis River basin precipitation. The recurrence interval of peak flows in the Chehalis River and its tributaries during the 1996 flood is provided in Table 2-6.
Table 2-6 Recurrence Interval of Flood Peaks in Chehalis River Basin during 1996 Flood
Gage Name Peak Flow (cfs) Recurrence Interval
Chehalis River at Doty 28,900 Approx. 33 years
Chehalis River at Grand Mound 74,800 Approx. 100 years
Skookumchuck River near Bucoda 11,300 Approx. 50 years
Newaukum River near Chehalis 13,300 Approx. 50 years
South Fork Chehalis River at Boistfort 9,542 Approx. 20 years
Note: The recurrence interval is based upon analyses that used the 2007 peak flow of 63,100 cfs. If that peak is not included, the recurrence interval would be more than 100 years. The recurrence interval of floods that occurred in tributaries during the 1996 flood was approximately 20 to 50 years, compared to approximately 33 years at the Doty gage. The resulting peak flow at the Grand Mound gage was approximately 100 years. That result indicates that the 1996 flood is representative of a large basin-wide flood. The flood storage reservoir could reduce flooding by 0.7 to 1.1 feet in the City of Chehalis to City of Centralia area during those types of floods.
2.2.2.2 Sediment Transport Capacity
Hydraulic properties obtained from the HEC-RAS model 7-day simulation were used to perform sediment transport calculations for the 2-, 10-, 50-, and 100-year flood events. Detailed output was specified for every hour of the simulation in order to obtain a time series of flow, flood level, shear stress, channel velocity, flow area, hydraulic radius, wetted perimeter, and channel top width. These time series were used in the sediment transport capacity calculations described in Appendix B of this study.

Hydrology and Hydraulics
Chehalis River Flood Storage Dam April 2012 Fish Population Impact Study 28 100705-01.01
2.2.2.3 Water Temperature Modeling
Changes in downstream temperature resulting from a multi-purpose dam alternative were modeled using the temperature module of the HEC-RAS model. The HEC-RAS model was modified to facilitate the use of the temperature module. The input and results of the temperature modeling are described in Appendix C of this report. To support year-round simulation of temperature, which includes summer low-flow conditions, the full HEC-RAS model was modified to exclude tributary segments, lateral structures, and storage areas, resulting in a Chehalis River mainstem only model. These modifications were necessary to maintain numerical stability in model simulations under low flow conditions. The upstream and downstream extent on the mainstem Chehalis River model remained unchanged from the flood simulation model (at RM 101.8 and 32.28, respectively).
2.3 Further Study Needs for Areas of Uncertainty
The major areas of uncertainty in the hydrologic and hydraulic analyses are the hydrology and bathymetry (channel cross-sections). There is uncertainty in the USGS estimated peak flow for the 2007 flood because the Doty gage was washed out during the flood. The USGS estimate of the peak flow for the 2007 flood was used by NHC and FEMA in a statistical analysis of flood peaks. A hydrograph was developed by NHC for the 2007 flood event which appears to have overestimated the volume of runoff. However, that volume of flow was used in a statistical analysis of flood volumes. The use of the peak flow and volume for the 2007 flood creates uncertainty in the estimates of smaller floods such as the 2- through 100-year floods. The channel cross-sections in the HEC-RAS hydraulic model are older and were surveyed before the 2007 flood event, which was a geomorphically significant event that likely changed the bathymetry of the river. Channel cross-sections in the reach between the cities of Chehalis and Centralia were surveyed in 2001; however, many of the cross-sections in the rest of the mainstem Chehalis River date back to the 1980s. To accurately represent the bathymetry of the Chehalis River, the cross-sections would need to be resurveyed.

Hydrology and Hydraulics
Chehalis River Flood Storage Dam April 2012 Fish Population Impact Study 29 100705-01.01
The uncertainties inherent in the modeling may create uncertainty in the absolute values of flood elevations; however, the difference in flood elevations when comparing existing conditions to the dam alternatives would likely be very similar. Therefore, if a reduction in flood levels of 1 foot is computed by the HEC-RAS model, a similar result would likely be found with a newly constructed model, assuming the Chehalis River channel shape has not significantly changed. Other limitations in the modeling are the assumptions of the physical configuration of the reservoir alternative and the operating characteristics of the reservoir. Changes in the operating characteristics such as outlet discharge could change the hydrologic and hydraulic modeling results. Additional optimization should be considered in future reservoir studies.

Chehalis River Flood Storage Dam April 2012 Fish Population Impact Study 30 100705-01.01
3 SEDIMENT AND LARGE WOODY DEBRIS TRANSPORT EVALUATION
Construction of a flood retention structure in the upper Chehalis River would alter peak flows and the input and transport rates of sediment and LWD in the river downstream of the structure. The rate of change of each of these elements determines the net effect of the structure on the geomorphology and bedload transport, which in turn affects substrate and aquatic habitat characteristics. This section summarizes sediment and LWD analyses described in Appendix B.
3.1 Basic Approach
Changes to river geomorphology, bedload transport, and LWD were analyzed based on a combination of field data, field observations, and modeling. Channel migration and watershed conditions were assessed using historical aerial photographs and maps. Four sets of maps and photos were chosen to span the 1850 to 2006 period. The centerline of the Chehalis River channel was digitized from the 1876 survey map, 1945 orthophotos, 1991 orthophotos, and 2006 orthophotos, and then compared to determine channel migration rates. The existing grain size distribution of 28 gravel/cobble bars along the Chehalis River and five bars along the South Fork Chehalis River was sampled in September 2010 to provide data for sediment transport modeling and information on current substrate characteristics. At each gravel sample site, armor and sub-armor layer samples were taken from a location that was representative of bedload movement. The armor layer sample followed the Wolman pebble count method and was based on randomly selecting 100+ surface rocks from the designated sample area and passing them through a gravelometer. The sub-armor layer sample was taken by scraping away the armor layer and excavating approximately one 5-gallon bucket of underlying material by shovel. The sub-armor layer was dried and sieved. Sediment inputs were assessed based on existing data from sediment load measurements and watershed/land slide studies. Suspended sediment measurements were made by the USGS at 19 gaging stations in the Chehalis River basin between 1961 and 1965 (Glancy 1971). The average annual yields (tons/square mile) at the three gages on the Chehalis River and four major tributaries (South Fork Chehalis, Newaukum, Skookumchuck, and Black rivers) were

Sediment and LWD Transport Evaluation
Chehalis River Flood Storage Dam April 2012 Fish Population Impact Study 31 100705-01.01
compiled to help determine sediment yields from different parts of the watershed. No direct measurements of bedload inputs have been made in the watershed, but bedload in gravel bedded rivers like the Chehalis is generally 5 to 10 percent of the total sediment discharge (Reid and Dunne 1996). Data from two watershed analyses conducted in the headwaters of the Chehalis were used to estimated average annual sediment inputs from mass wasting and surface erosion (Weyerhaeuser 1994a, 1994b). The Washington Department of Natural Resources (DNR) also conducted an aerial reconnaissance to map landslides in parts of the Chehalis watershed following the 2007 storms (Sarikhan et al. 2008). An estimate of sediment input from the December 2007 storm was made using the mapped landslides and average slide depth, delivery, and grain size parameters collected during a field reconnaissance of mass wasting features. The bedload transport capacity in the main channel of the Chehalis River was calculated at 15 locations using the results of the HEC-RAS 1-D hydraulic model and several applicable coarse sediment mobility and transport formulae. The four sediment transport models used in this analysis were: 1) Wilcock and Crowe (2003); 2) Wilcock (2001); 3) Meyer-Peter and Müller (1948, as modified by Wong and Parker 2006); and 4) Cui (2007). These analyses compared the hydrologic regimes for the existing condition and the proposed flood retention facility options to evaluate their influence on sediment dynamics at locations along the Chehalis River. The sediment mass transport capacity graphs for the 100-year flood events were used to construct discharge versus bedload transport rating curves for 14 of the cross-sections that had substantial bedload transport. These rating curves were applied to the mean daily flow record for the 1989 to 2010 period at these locations to calculate average annual bedload transport capacity under existing, flood storage only dam, and multi-purpose dam conditions. The analysis of LWD loading was based on data collected as part of this study and past reports. Existing levels of LWD were inventoried between the town of Chehalis and Elk Creek near Doty (approximately RMs 70 to 100) in 2010 as part of habitat mapping for the instream flow study. Estimates of LWD inputs and channel/floodplain deposits in the Chehalis watershed upstream of Pe Ell and in the South Fork Chehalis following the 2007 storm event were compiled by Entrix (2009). There is little quantitative data on LWD input

Sediment and LWD Transport Evaluation
Chehalis River Flood Storage Dam April 2012 Fish Population Impact Study 32 100705-01.01
or transport other than the 2007 storm data. A qualitative assessment of the effects of the proposed impoundment was made based on LWD data and field observations during the gravel sampling.
3.2 Summary of Results
The Chehalis River watershed covers approximately 2,100 square miles in southwestern Washington, with headwaters in the Willapa Hills, Cascade Range, and Olympic Mountains. The study area for this project includes the watershed upstream of RM 33, an area of 1,294 square miles. Six geomorphic reaches were delineated in the study area, ranging from the steeper gradient, confined reach in the headwaters to less confined and lower gradient reaches downstream. The dominant substrate in most of the river is gravel and cobble with minor amounts of sand. There is little LWD due to historic splash damming and large wood removal efforts. One unique feature of the Chehalis River is the extremely low gradient (0.03 percent) reach between RM 67.7 and RM 75.5, near the City of Chehalis. Based on field observations and sediment transport modeling, it appears that there is very minimal transport of gravel or larger particles through this reach; the coarse sediment load from the upper watershed is all deposited in the channel and floodplain upstream from this reach. As a result, the coarse sediment input is essentially reset at this point in the river, and downstream bedload input comes from the Skookumchuck River, smaller tributaries, and bank erosion/channel migration. Construction and operation of either the flood storage only or multi-purpose structure would reduce peak flows in the Chehalis River downstream from the facility. Because the impoundment behind either structure would be filling or full during peak flows when the majority of coarse sediment (cobble, gravel, coarse sand) and wood is transported, it was assumed for this analysis that large wood and coarse sediment from the upstream watershed would be trapped in the impoundment. The changes in coarse sediment and large wood input and transport in the six geomorphic reaches were analyzed to determine the net effect on river geomorphology, bedload transport, and LWD.

Sediment and LWD Transport Evaluation
Chehalis River Flood Storage Dam April 2012 Fish Population Impact Study 33 100705-01.01
The effects of either the flood storage only or multi-purpose facility would be most pronounced in geomorphic reach 2 (RM 93.5 to 107.8), which is immediately downstream from the proposed structure. Bedload transport capacity is calculated to be reduced to 2 to 9 percent of existing capacity under either storage scenario while coarse sediment input is estimated to be reduced to 39 to 54 percent of existing conditions. This may result in some aggradation in the channel if input rates exceed transport capacity. Evidence of aggradation that appears to be the result of the huge influx of sediment from landslides during the December 2007 storm event was noted in some locations in the Chehalis River during the gravel sampling field work in 2010. In the case of the 2007 floods, the sediment input rates far exceeded the transport capacity; the input-to-transport ratio change from the flood storage only or multi-purpose dams will not be as large as during the flood event, but could still result in some aggradation. An increase in the percent of fine sediment (smaller than 0.85 millimeter [mm]) in the substrate could also occur since the gravel/cobble substrate will not be mobilized as often under the with-project scenarios. Under existing conditions, bedload transport is calculated to take place in 50 to 55 percent of the years; under the multi-purpose or flood storage only scenarios, the bed would be mobilized in only 5 to 9 percent of the years. LWD levels would be lower with either of the structures in place because the large episodic input of wood from the upper watershed would be greatly reduced. There would be little channel migration in geomorphic reach 2 due to the occurrence of bedrock controls and outcrops. Geomorphic reach 3 is located just upstream of the confluence with the South Fork Chehalis River. One of the modeled transects in this reach showed similar effects as those in reach 2; the other transect showed anomalous results, but is affected by backwater from the South Fork Chehalis River. Reach 3 is less confined than reach 2, and channel migration has occurred in this reach in the past; it is likely that channel migration patterns would change with the structures in place, but the net effect is somewhat difficult to determine. The reduced peak flows would decrease the rate of channel migration, but if aggradation occurs in unconfined reaches, increased bank erosion and migration could occur if the aggradation causes the river to widen. In geomorphic reaches 4 and 5, bedload transport capacity is estimated to be 16 to 59 percent of existing conditions, and coarse sediment input rates are estimated to be reduced to 18 to

Sediment and LWD Transport Evaluation
Chehalis River Flood Storage Dam April 2012 Fish Population Impact Study 34 100705-01.01
69 percent of existing conditions. It is likely that there would be some changes to the channel and substrate characteristics as a result of operation of the flood storage only or multi-purpose structure including aggradation and increased fines in the substrate, but these changes would likely be relatively small. There would be less input of LWD from upstream sources. Geomorphic reach 6 is located downstream of the bedrock grade control that resets the upstream bedload input rates, and downstream of most of the major tributaries (South Fork Chehalis, Newaukum, and Skookumchuck rivers). As a result, the effects of either the flood storage only or multi-purpose structure on peak flows, bedload transport, large wood, and river geomorphology would be much more muted than in upstream reaches. A slight decrease in bedload transport capacity compared to input rates is likely to occur; however, the slight reduction in peak flows would likely also result in a reduction in bank erosion, so the input of gravel and cobble from the banks would also decrease. There would likely be a slight reduction in large wood inputs as bank erosion rates decrease, but it is likely that the majority of these changes will not be noticeable.
3.3 Further Study Needs for Areas of Uncertainty
This analysis of the effects of the flood storage only and multi-purpose facility scenarios was based primarily on the results of the HEC-RAS model, bedload transport modeling of selected transects, and existing data. Gravel bar sampling and limited sampling of in-river LWD augmented existing information on the grain size distribution of the river bed and current levels of large wood in the study reaches. No data on bedload transport rates in the river were found to verify the results of the bedload transport modeling, so model results should be regarded as estimates. The limitations of the HEC-RAS model described in Section 2.3 carry through to the bedload transport model. The lack of Light Detection and Ranging (LiDAR) coverage in geomorphic reaches 4 and 5 (near Centralia and Chehalis) limited the analysis of geomorphic surfaces in this area. If more accurate information is needed on the effects of the project on bedload transport, a comprehensive transport model of the river could be prepared; measurements of bedload transport rates in key locations would help to verify model results.
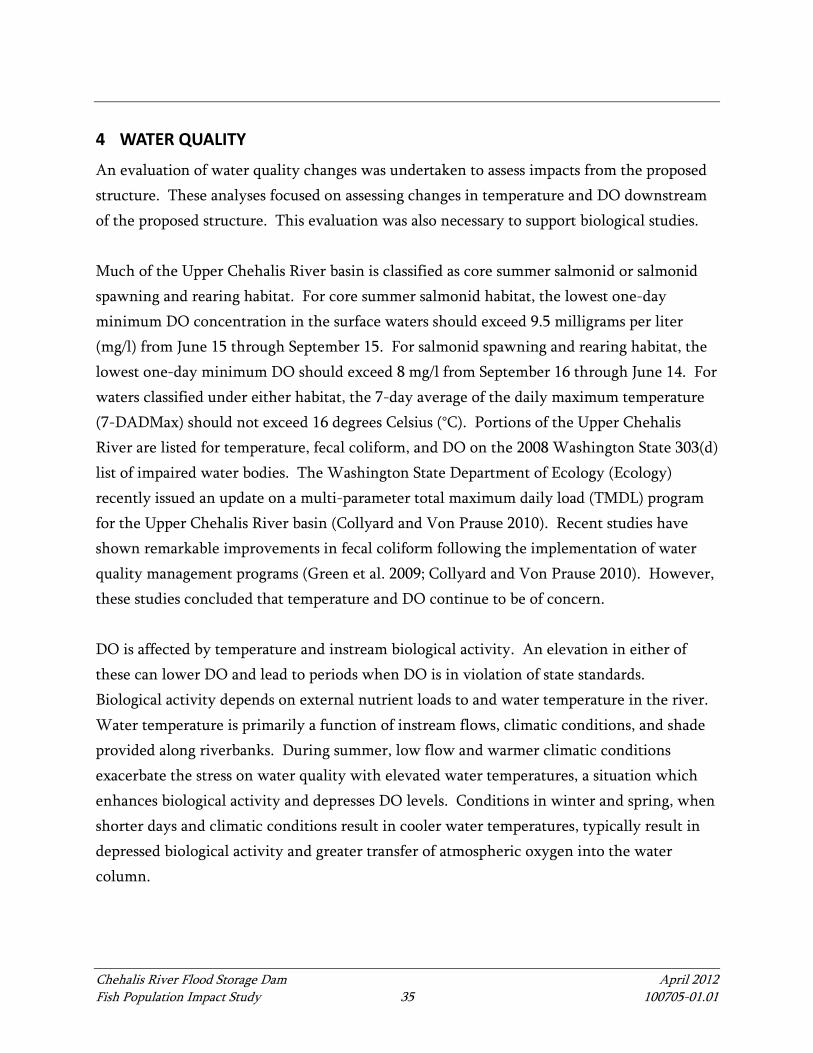
Chehalis River Flood Storage Dam April 2012 Fish Population Impact Study 35 100705-01.01
4 WATER QUALITY
An evaluation of water quality changes was undertaken to assess impacts from the proposed structure. These analyses focused on assessing changes in temperature and DO downstream of the proposed structure. This evaluation was also necessary to support biological studies. Much of the Upper Chehalis River basin is classified as core summer salmonid or salmonid spawning and rearing habitat. For core summer salmonid habitat, the lowest one-day minimum DO concentration in the surface waters should exceed 9.5 milligrams per liter (mg/l) from June 15 through September 15. For salmonid spawning and rearing habitat, the lowest one-day minimum DO should exceed 8 mg/l from September 16 through June 14. For waters classified under either habitat, the 7-day average of the daily maximum temperature (7-DADMax) should not exceed 16 degrees Celsius (°C). Portions of the Upper Chehalis River are listed for temperature, fecal coliform, and DO on the 2008 Washington State 303(d) list of impaired water bodies. The Washington State Department of Ecology (Ecology) recently issued an update on a multi-parameter total maximum daily load (TMDL) program for the Upper Chehalis River basin (Collyard and Von Prause 2010). Recent studies have shown remarkable improvements in fecal coliform following the implementation of water quality management programs (Green et al. 2009; Collyard and Von Prause 2010). However, these studies concluded that temperature and DO continue to be of concern. DO is affected by temperature and instream biological activity. An elevation in either of these can lower DO and lead to periods when DO is in violation of state standards. Biological activity depends on external nutrient loads to and water temperature in the river. Water temperature is primarily a function of instream flows, climatic conditions, and shade provided along riverbanks. During summer, low flow and warmer climatic conditions exacerbate the stress on water quality with elevated water temperatures, a situation which enhances biological activity and depresses DO levels. Conditions in winter and spring, when shorter days and climatic conditions result in cooler water temperatures, typically result in depressed biological activity and greater transfer of atmospheric oxygen into the water column.

Water Quality
Chehalis River Flood Storage Dam April 2012 Fish Population Impact Study 36 100705-01.01
The proposed structure on the Upper Chehalis River, when operated under a flood storage only scenario, will not result in a significant alteration of flow regime in summer because waters will not be impounded beyond the winter and spring high-flow season. When operated under the multi-purpose facility scenario, waters will be impounded for many months, and will be released at a slower rate throughout the year. Under the multi-purpose facility scenario, with flow augmentation in summer, downstream temperature and DO will depend on two factors: changes in flow regime caused by reservoir operation; and temperature and DO in the reservoir outflow. If waters released from the reservoir are cooler, with little or no nutrients and high DO, then conditions downstream of the reservoir can be improved by low-flow augmentation. If these criteria are not met in the reservoir outflow, then low-flow augmentation can actually contribute to the exacerbation of downstream temperature and DO. Changes in flow over winter will not result in a significant change in water quality because water temperature and biological activity will be lower, and even with the flood storage only structure in place, river flows will be higher relative to typical summer conditions. Therefore, the propensity of the proposed structure to affect water quality is greatest under low-flow conditions and warmer water temperatures. On the Upper Chehalis River, such conditions typically exist from June through October. The objective of the water quality evaluation is to estimate the changes in downstream temperature and DO that result from reservoir operation to inform biological assessments. A secondary objective of this evaluation is to estimate changes in water quality resulting from the operation of the proposed structure.
4.1 Basic Approach
Water quality evaluations were performed for the multi-purpose facility scenario with summer low-flow augmentation. The evaluations consisted of two parts: 1) estimation of water temperature and DO in the proposed reservoir; and 2) estimation of changes to downstream temperature and DO when the reservoir is in operation. Mechanistic models were used to simulate temperature and DO in each of these components. A brief discussion of data collection, model development, and calibration is provided here. Details are provided in the water quality evaluation report in Appendix C.

Water Quality
Chehalis River Flood Storage Dam April 2012 Fish Population Impact Study 37 100705-01.01
4.1.1 Water Quality Data Collection
The objectives of data collection were to establish background conditions and provide the necessary water quality and temperature data to support model development and a preliminary evaluation of expected changes in water quality when the reservoir is in operation. Continuous temperature monitoring probes were deployed at eight locations on the mainstem Chehalis River and at one location on the South Fork Chehalis River (Figure 4-1). The probes were deployed in September 2010 and were still in place at the time this report was compiled. During water quality sampling events, to the extent that flow conditions permitted access to the probe, temperature data were downloaded. At locations where the temperature probes were deployed, water quality samples were collected for two high-flow and two low-flow conditions. A hydrolab probe was deployed to measure field DO and temperature. Water quality samples were analyzed for biochemical oxygen demand (BOD), total suspended solids (TSS), and fecal coliform.
4.1.2 Reservoir Temperature and DO Model
Temperature and DO in the reservoir were simulated with CE-QUAL-W2, an open source two-dimensional (2-D) hydrodynamic and water quality model (Cole and Wells 2008). This model has been applied for modeling temperature and water quality in reservoirs and lakes at various sites in the country. The flooded area of the reservoir, which extends nearly 10 miles upstream, was represented through 13 longitudinal segments. The longitudinal variations in bathymetry were represented through differing bottom elevations of the model segments. To model vertical variations in temperature, the model was discretized to contain up to 31 layers 8 to 10 feet in thickness. Model simulations were performed for the time period from April 1, 2010, to March 1, 2011, for cases without and with the proposed structure. This period was selected because it includes focused data collection, as part of this study, to support model calibration.
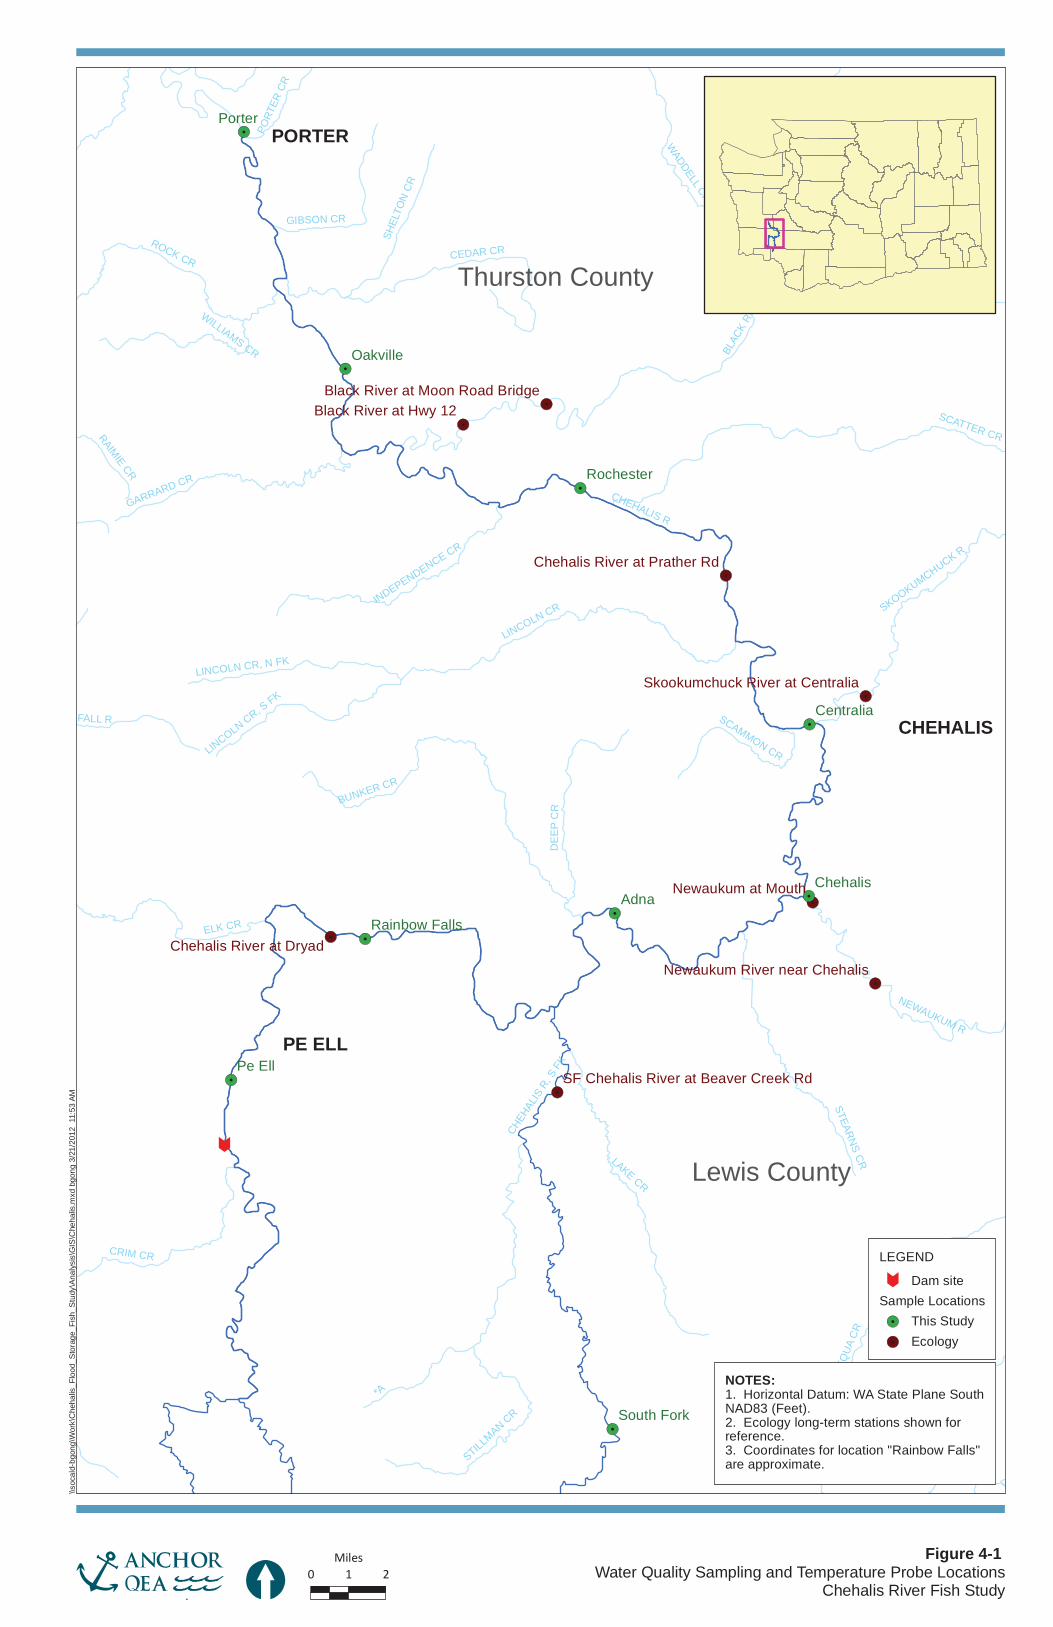
!.
!.
!.
!.
!.
!.
!.
!.
!.
!.
!.
!.
!.
!.
!.
!.
!.
Û
CHEHALIS R
*A
BLAC
K R
LAKE CR
SCATTER CR
OLE
QU
A C
R
LINCOLN CR
CHEHAL
IS R
, S F
K
BUNKER CR
ELK CR
STILLMAN C
R
CRIM CR
BEAVER CRROCK CR
STEARN
S CR
DE
EP
CR
CEDAR CR
FALL R
GARRARD CR
NEWAUKUM R
BLAC
K LA
KE
WADDELL CR
SHEL
TON
CR
SKOOKUMCHUCK R
GIBSON CR
INDEPENDENCE CR
LACAMAS C
R
LINCOLN CR, N FK
LINCOLN CR, S FK
WILLIAMS CR
PORT
ER C
R
SCAMMON CR
RAIMIE CR
Newaukum at Mouth
Black River at Hwy 12
Chehalis River at Dryad
Newaukum River near Chehalis
Chehalis River at Prather Rd
Black River at Moon Road Bridge
Skookumchuck River at Centralia
SF Chehalis River at Beaver Creek Rd
Adna
Pe Ell
Porter
Chehalis
Oakville
Centralia
Rochester
South Fork
Rainbow Falls
PE ELL
PORTER
CHEHALIS
Lewis County
Thurston County
Figure C-1Water Quality Sampling and Temperature Probe Locations
Chehalis River Fish Study
\\soc
ald-
bgon
g\W
ork\
Che
halis
_Flo
od_S
tora
ge_F
ish_
Stu
dy\A
naly
sis\
GIS
\Che
halis
.mxd
bgo
ng 3
/21/
2012
11:
53 A
M
0 1 2Miles
[
LEGEND
Û Dam siteSample Locations
!. This Study
!. Ecology
NOTES:1. Horizontal Datum: WA State Plane SouthNAD83 (Feet).2. Ecology long-term stations shown forreference.3. Coordinates for location "Rainbow Falls"are approximate.
Figure 4-1

Water Quality
Chehalis River Flood Storage Dam April 2012 Fish Population Impact Study 39 100705-01.01
Meteorological conditions were specified based on data obtained from National Oceanic and Atmospheric Administration (NOAA) and a public domain source (Weather Underground 2011) at Centralia and Olympia. Temperature for upstream inflow was specified from data collected for this study and from Ecology data from Dryad. DO at the inflow boundary was calculated by assuming saturated conditions in the inflow and estimating from the inflow temperature.
4.1.3 Downstream Temperature and DO Model
Downstream temperature and DO were modeled in HEC-RAS, a 1-D hydraulic and water quality model. The HEC-RAS model used for simulating downstream flows under baseline and flood conditions (Section 2.1) was modified and extended for water quality analyses. The modifications made to HEC-RAS flood simulation model to support water quality evaluations are discussed in Appendix A. The HEC-RAS water quality model was developed for the area between the Doty gage (RM 108.3) and the Porter gage (RM 32.3). Model simulations were performed for the same time period as the reservoir model. Temperature functions were developed from historical measurements to specify a time series of temperature at the major inflows. DO was estimated from temperature by assuming saturated conditions in the inflow. Meteorological forcing functions, also required for the downstream model, were developed from the same data sets used for the reservoir model. The model was set up to simulate existing conditions (i.e., without reservoir) for calibration. The calibrated model also provided an estimate of baseline conditions in the Chehalis River. Changes in downstream conditions resulting from the operation of the proposed structure were simulated by specifying changes in flow and water quality at the upstream boundary simulated by the flow (HEC-ResSim) and water quality (CE-QUAL-W2) reservoir models, respectively.
Water Quality
Chehalis River Flood Storage Dam April 2012 Fish Population Impact Study 40 100705-01.01
4.2 Summary of Results
4.2.1 Water Quality Data
The daily averages of the temperature data logged by the sensors are shown in Figure 4-2. Data were downloaded through mid-October 2010. Subsequent downloads were not possible at the time this report was compiled because high-flow conditions have continued to render conditions unsafe for retrieval of sensors. Instantaneous temperature measured during event sampling is also shown. Temperature data showed trends consistent with historic measurements: warmer waters in late summer and early fall cooling progressively through winter. The temperature data also suggest that, at the beginning of the monitoring period, water temperatures were naturally high enough to exceed the salmonid habitat temperature criterion of 16°C (note that the values shown are daily averages and not a 7-DADMax, which is likely to be even higher). Water quality data collected during the two high-flow and two low-flow surveys are shown in Figures 4-3 and 4-4. With the exception of the September 14 survey, all surveys represent DO conditions for spawning and rearing (the 1-day minimum DO should be greater than 8 mg/l). The September 14 survey can be interpreted to reflect core-summer habitat condition (1-day minimum DO should be greater than 9.5 mg/l). Applying these classifications, it is clear that all locations show DO concentrations that exceed the salmonid spawning and rearing habitat criterion. All but two locations satisfy the salmonid core-habitat criterion. Samples collected at the Centralia and Chehalis stations on September 14 showed DO levels slightly below the standard. Recognizing that these are single measurements, and do not necessarily coincide with the time of lowest DO on the day of measurement, it is possible that these two locations may be somewhat lower than the values plotted (typical daily temperature variations are within a few degrees, which would correspond to less than 0.5 mg/l variation in DO when the water column is saturated). In any case, the locations where DO violations were measured have been reported for DO issues in the past, particularly over the summer (Jennings and Pickett 2000). A comparison to saturation DO concentrations, estimated from temperature, illustrates that the water column was generally slightly super-saturated at nearly all locations during all four surveys (see Appendix C). This state could be a result of water column photosynthesis (all

Water Quality
Chehalis River Flood Storage Dam April 2012 Fish Population Impact Study 41 100705-01.01
these surveys were conducted during the day). However, in most instances, the super-saturation was modest, which suggests that photosynthetic activity, if any, was likely to be a minor contributor. Moreover, BOD levels in the water column were non-detect1 at all locations over all surveys, suggesting that oxygen demand from instream and external sources was minimal on the dates when water samples were taken. In light of these observations, it can be inferred that DO, at or near saturation, is controlled primarily by temperature. Continuous temperature data collected by Ecology over the summers of 2001 through 2010 at Dryad and Porter, the upstream and downstream boundary of this study, have indicated that daily maximum temperatures in July and August were greater than 16°C, frequently exceeding 20°C, for all years (Collyard and Von Prause 2010). At this temperature, the DO saturation concentration is 9.2 mg/l (see Appendix C for the calculation estimating DO saturation concentration from temperature). Thus, it is likely that DO concentration in the upper Chehalis River, even at saturation, will be lower than the Washington State salmonid core-summer habitat criterion of 9.5 mg/l. TSS data showed elevated levels and consistent spatial patterns during both high-flow sampling events. Fecal coliform similarly showed elevated levels at high flow. The fecal coliform levels measured during low-flow surveys were consistent with recently reported measurements (Collyard and Von Prause 2010).
1 One sample showed a BOD of 72 mg/l, which is likely a result of sample contamination or analytical error.

Pe Ell (RM 106.7)
0910
1010
1110
1210
0111
0211
0311
0
5
10
15
20
25
30Te
mpe
ratu
re (o C
)Rainbow Falls (RM 97.53)
0910
1010
1110
1210
0111
0211
0311
0
5
10
15
20
25
30
Tem
pera
ture
(o C)
South Fork Chehalis River
0910
1010
1110
1210
0111
0211
0311
0
5
10
15
20
25
30
Tem
pera
ture
(o C)
Adna (RM 84.00)
0910
1010
1110
1210
0111
0211
0311
0
5
10
15
20
25
30
Tem
pera
ture
(o C)
Chehalis (RM 75.41)
0910
1010
1110
1210
0111
0211
0311
0
5
10
15
20
25
30
Tem
pera
ture
(o C)
Centralia (RM 66.68)
0910
1010
1110
1210
0111
0211
0311
0
5
10
15
20
25
30
Tem
pera
ture
(o C)
Rochester (RM 54.10)
0910
1010
1110
1210
0111
0211
0311
0
5
10
15
20
25
30
Tem
pera
ture
(o C)
Oakville (RM 42.16)
0910
1010
1110
1210
0111
0211
0311
0
5
10
15
20
25
30
Tem
pera
ture
(o C)
Porter (RM 33.00)
0910
1010
1110
1210
0111
0211
0311
0
5
10
15
20
25
30
Tem
pera
ture
(o C)
TidBit DataEvent Data
Figure C-2Continuous and Discrete Water Temperature Data Measured in This Study
Chehalis River Fish StudyRM refers to river mile. Only data downloaded through October 2010 was used in modeling
The tidbit could not be located during the data download in May 2011 at the Porter station
BG - D:\Work\Chehalis_Flood_Storage_Fish_Study\Analysis\Code\Chehalis_plot_data_wtemp__report.pro Thu Apr 05 17:40:33 2012
Figure 4-2

DO
100 80 60 40River mile
02
4
6
8
10
12
14
DO
(mg/
l)BOD [2]
100 80 60 40River mile
0
1
2
3
4
5
BO
D (m
g/l)
^
TSS
100 80 60 40River mile
0
10
20
30
40
50
60
TSS
(mg/
l)
Fecal Coliform
100 80 60 40River mile
0
20
40
60
80
100
Feca
l Col
iform
(CFU
/100
ml)
9/1410/19
Notes:[1] Non-detects are shown with open symbols and plotted at half the detection limit[2] On 9/15/2010 a sample with unusually high BOD (72 mg/l) is not plotted
Figure C-3Water Quality Data Collected During Two Low Flow Events
Chehalis River Fish Study
BG - D:\Work\Chehalis_Flood_Storage_Fish_Study\Analysis\Code\Chehalis_plot_data_hydro__report_old.pro Thu Apr 05 17:44:20 2012
Figure 4-3

DO
100 80 60 40River mile
02
4
6
8
10
12
14
DO
(mg/
l)BOD
100 80 60 40River mile
0
1
2
3
4
5
BO
D (m
g/l)
TSS
100 80 60 40River mile
0
10
20
30
40
50
60
TSS
(mg/
l)
Fecal Coliform [2]
100 80 60 40River mile
0
20
40
60
80
100
Feca
l Col
iform
(CFU
/100
ml)
12/22/17
Notes:[1] Non-detects are shown with open symbols and plotted at half the detection limit[2] On 12/2/2010 in most locations the lab reported fecal coliform colonies were too numerous and therefore indistinguishable to count individual colonies
Figure C-4Water Quality Data Collected During Two High Flow Events
Chehalis River Fish Study
BG - D:\Work\Chehalis_Flood_Storage_Fish_Study\Analysis\Code\Chehalis_plot_data_hydro__report_old.pro Thu Apr 05 17:44:20 2012
Figure 4-4

Water Quality
Chehalis River Flood Storage Dam April 2012 Fish Population Impact Study 45 100705-01.01
4.2.2 Water Quality and Temperature Modeling
Temperature and DO simulations in the proposed reservoir were set up with reservoir outflow withdrawn from the bottom 12 feet of the segment immediately above the dam, which would provide a beneficial temperature release during summer months. Temperature and DO depth profiles were compared for consistency with typical stratification patterns. In addition, CE-QUAL-W2 reservoir pool storage was compared to HEC-ResSim for consistency. The reservoir model verification is discussed in detail in Appendix C. The downstream temperature model was calibrated to DO and temperature data from this study as well as to Ecology data collected in 2010. The temperature and DO simulated by the calibrated model from April 1, 2010, to March 1, 2011, provided the baseline conditions for the Chehalis River. Changes in downstream temperature and DO were simulated over this period by modifying the upstream boundary condition based on the outputs from the reservoir models. Model results were analyzed in six spatial groupings (hereafter referred to as reaches) based on the spatial resolution used in the biological population (SHIRAZ) model. Figure 4-5 shows the 7-DADMax temperatures simulated for the cases without and with the multi-purpose facility reservoir. Model-simulated temperatures under baseline conditions were consistent with measured data (not shown), and exceeded the salmonid core-summer habitat criterion through much of the summer for all six reaches. Under a reservoir operation scenario, where water impounded for hydropower was used to augment low-flow periods, the cooler waters from the bottom of the reservoir had a dramatic impact on the downstream temperature in the upper reaches of the river. Temperatures in the upper reaches, particularly upstream of the confluence with the South Fork Chehalis River, exhibited far greater compliance with salmonid temperature criteria compared to baseline conditions. The benefit from low-flow augmentation was predicted to diminish progressively downstream, particularly downstream of the Newaukum River confluence, as tributary inflows began to dominate instream conditions. Similar results were simulated for the spatially averaged 1-day minimum DO (Figure 4-6). Under baseline conditions, the model simulated DO levels that were lower than the core-summer salmonid habitat criterion of 9.5 mg/l. Augmenting summer low flow with cooler

Water Quality
Chehalis River Flood Storage Dam April 2012 Fish Population Impact Study 46 100705-01.01
waters, at a higher DO, enabled higher concentrations, particularly in the upper reaches. As with temperature, these benefits diminished in the lower reaches as DO levels downstream of the Skookumchuck River confluence were predicted to be nearly identical with or without the proposed project.

Apr 15
100 80 60 40River mile
0
5
10
15
20
25
30
Tem
pera
ture
(o C)
Aug 15
100 80 60 40River mile
0
5
10
15
20
25
30
Tem
pera
ture
(o C)
Nov 15
100 80 60 40River mile
0
5
10
15
20
25
30
Tem
pera
ture
(o C)
Feb 15
100 80 60 40River mile
0
5
10
15
20
25
30
Tem
pera
ture
(o C)
Base CaseMulti-purpose Scenario
Figure C-31Spatial Profiles of Temperature on Select Dates With and Without the Proposed Reservoir
Chehalis River Fish StudyResults shown are daily maximums.
Model simulation with reservoir represents multi-purpose scenario with flood control, hydropowerand low flow augmentation.
Model run IDs: Run034,Run038BG - D:\Work\Chehalis_Flood_Storage_Fish_Study\Analysis\Code\Chehalis_plot_model_spatial_fig29_to_30.pro Wed Apr 04 14:45:24 2012
Figure 4-5

Apr 15
100 80 60 40River mile
02
4
6
8
10
12
14
Dis
solv
ed O
xyge
n (m
g/l)
Aug 15
100 80 60 40River mile
02
4
6
8
10
12
14
Dis
solv
ed O
xyge
n (m
g/l)
Nov 15
100 80 60 40River mile
02
4
6
8
10
12
14
Dis
solv
ed O
xyge
n (m
g/l)
Feb 15
100 80 60 40River mile
02
4
6
8
10
12
14
Dis
solv
ed O
xyge
n (m
g/l)
Base CaseMulti-purpose Scenario
Figure C-32Spatial Profiles of Dissolved Oxygen on Select Dates With and Without the Proposed Reservoir
Chehalis River Fish StudyResults shown are daily minimums.
Model simulation with reservoir represents multi-purpose scenario with flood control, hydropowerand low flow augmentation.
Model run IDs: Run034,Run038BG - D:\Work\Chehalis_Flood_Storage_Fish_Study\Analysis\Code\Chehalis_plot_model_spatial_fig29_to_30.pro Wed Apr 04 14:53:52 2012
Figure 4-6

Water Quality
Chehalis River Flood Storage Dam April 2012 Fish Population Impact Study 49 100705-01.01
Temperature outputs for each of the reaches were provided for use in fisheries analysis. The outputs were provided as daily averages and daily maximums to support the development of SHIRAZ model inputs. DO outputs, while not part of the SHIRAZ modeling, were used qualitatively. The withdrawal elevation of 1,440 feet (bottom of reservoir, NGVD 29 plus 1,000 feet) would provide outflow temperature consistent with the lower layers of the reservoir. For this analysis, two other reservoir withdrawal elevations were selected, such that the outflow temperature reflected the temperature at the thermocline (1,560 feet) and the upper mixed layer of the reservoir (1,600 feet; surface of reservoir). These two choices, along with the withdrawal elevation of 1,440 feet, cover the range of temperatures present in the reservoir at any given time. For each of these cases, HEC-RAS model simulations were setup by modifying the upstream temperature and DO boundary conditions, which were specified based on CE-QUAL-W2 model results. Figure 4-7 shows the time course of reach-specific average temperature simulated in the HEC-RAS model. Downstream temperatures can be significantly impacted by releasing warmer waters from the surface. In the upper sections of the river, when water was withdrawn close to the reservoir surface (1,600 feet), temperatures in the Chehalis River could exceed 25oC between the South Fork Chehalis River and Newaukum River confluences. The upper reaches showed waters warming to nearly double the temperature expected for the case when outflows from the reservoir were withdrawn from the bottom (1,440 feet). Figure 4-8 shows that the impact of withdrawal elevation on DO was substantial. Downstream DO was impacted not only by reduced DO from upstream but also by the warmer downstream temperatures. Between the South Fork Chehalis River and Newaukum River confluences, under a surface withdrawal alternative, DO concentrations could be expected to fall below 8.5 mg/l, the state DO standard for Class A waters. The impact of withdrawal elevations on DO diminished past the Newaukum River confluence, and there was little difference between the three cases from the Skookumchuck River confluence to Porter.

Dam Site to Elk Creek
0410
0510
0610
0710
0810
0910
1010
1110
1210
0111
0211
0311
0
5
10
15
20
25
30Te
mpe
ratu
re (o C
)Elk Creek to South Fork Chehalis
0410
0510
0610
0710
0810
0910
1010
1110
1210
0111
0211
0311
0
5
10
15
20
25
30
Tem
pera
ture
(o C)
South Fork Chehalis to Newaukum River
0410
0510
0610
0710
0810
0910
1010
1110
1210
0111
0211
0311
0
5
10
15
20
25
30
Tem
pera
ture
(o C)
Newaukum River to Skookumchuck River
0410
0510
0610
0710
0810
0910
1010
1110
1210
0111
0211
0311
0
5
10
15
20
25
30
Tem
pera
ture
(o C)
Skookumchuck River to Black River
0410
0510
0610
0710
0810
0910
1010
1110
1210
0111
0211
0311
0
5
10
15
20
25
30Te
mpe
ratu
re (o C
)Black River to Porter
0410
0510
0610
0710
0810
0910
1010
1110
1210
0111
0211
0311
0
5
10
15
20
25
30
Tem
pera
ture
(o C)
1440 ft (Bottom)1560 ft (Thermocline)1600 ft (Surface)
Figure C-35Sensitivity of Downstream Temperature to Changes in Reservoir Withdrawal Elevation
Chehalis River Fish StudyModel run IDs: Run038, Run039, Run040
BG - D:\Work\Chehalis_Flood_Storage_Fish_Study\Analysis\Code\Chehalis_plot_model_spatial_sens.pro Thu Mar 22 14:55:27 2012
Figure 4-7

Dam Site to Elk Creek
0410
0510
0610
0710
0810
0910
1010
1110
1210
0111
0211
0311
0
2
4
6
8
10
12
14D
isso
lved
Oxy
gen
(mg/
l)Elk Creek to South Fork Chehalis
0410
0510
0610
0710
0810
0910
1010
1110
1210
0111
0211
0311
0
2
4
6
8
10
12
14
Dis
solv
ed O
xyge
n (m
g/l)
South Fork Chehalis to Newaukum River
0410
0510
0610
0710
0810
0910
1010
1110
1210
0111
0211
0311
0
2
4
6
8
10
12
14
Dis
solv
ed O
xyge
n (m
g/l)
Newaukum River to Skookumchuck River
0410
0510
0610
0710
0810
0910
1010
1110
1210
0111
0211
0311
0
2
4
6
8
10
12
14
Dis
solv
ed O
xyge
n (m
g/l)
Skookumchuck River to Black River
0410
0510
0610
0710
0810
0910
1010
1110
1210
0111
0211
0311
0
2
4
6
8
10
12
14D
isso
lved
Oxy
gen
(mg/
l)Black River to Porter
0410
0510
0610
0710
0810
0910
1010
1110
1210
0111
0211
0311
0
2
4
6
8
10
12
14
Dis
solv
ed O
xyge
n (m
g/l)
1440 ft (Bottom)1560 ft (Thermocline)1600 ft (Surface)
Figure C-36Sensitivity of Downstream Dissolved Oxygen to Changes in Reservoir Withdrawal Elevation
Chehalis River Fish StudyModel run IDs: Run038, Run039, Run040
BG - D:\Work\Chehalis_Flood_Storage_Fish_Study\Analysis\Code\Chehalis_plot_model_spatial_sens.pro Thu Mar 22 14:55:27 2012
Figure 4-8

Water Quality
Chehalis River Flood Storage Dam April 2012 Fish Population Impact Study 52 100705-01.01
4.3 Further Study Needs for Areas of Uncertainty
The evaluations performed in this study provided an assessment of the relative effects of the reservoir operation on downstream temperature and DO. The studies met the objectives of informing the fish model and providing an assessment of relative changes. The limited timing and scope of this study entailed some simplifications and assumptions in developing the models for water quality evaluations. A sensitivity analysis was performed to identify the uncertainty in model predictions that resulted from these assumptions and simplifications. The objective of the sensitivity analysis was to provide guidance for future studies that can reduce or eliminate assumptions through focused data collection, and to identify areas for further investigation to support the evaluations. The results of these studies are summarized here. The details of the sensitivity analysis are discussed in more detail in Appendix C. The elevation at which water withdrawal from the reservoir was simulated had the greatest impact on reservoir outflow temperature and DO, which, as shown in the previous section, was predicted to have a significant impact in the upper reaches of the upper Chehalis River. The reservoir outflow temperature and DO predicted by the CE-QUAL-W2 model for different withdrawal elevations are shown in Figures 4-7 and 4-8. A withdrawal at 1,600 feet is nearly at the surface; a withdrawal at 1,560 feet is at the thermocline (the layer of water where temperature falls rapidly with depth and forms a barrier for transfer of solute and energy); and a withdrawal at 1,440 feet, the base case scenario presented in the previous section, corresponds to withdrawal from the bottom, which has the coldest temperatures. The withdrawal at 1,440 feet also produces the highest DO if there is no significant oxygen demand exerted within the reservoir. It is evident from Figures 4-7 and 4-8 that the highest temperatures and the lowest DO in the outflow can be expected when withdrawal is near the surface. The beneficial temperature and DO changes for the upper reaches predicted for a bottom withdrawal scenario diminish for a thermocline withdrawal scenario, and become detrimental for a surface withdrawal scenario. Future studies, particularly those focusing on reservoir design, must consider the sensitivity of downstream temperature and DO to withdrawal elevations.

Water Quality
Chehalis River Flood Storage Dam April 2012 Fish Population Impact Study 53 100705-01.01
The DO in the reservoir outflow was found to be sensitive to other factors. Sediment oxygen demand (SOD) in the reservoir was predicted to impact downstream DO substantially. The magnitude of the SOD will depend on reservoir productivity (i.e., photosynthetic activity in the reservoir), and the loading of degradable particulate organic matter to the system. Photosynthetic activity in turn depends on the nutrient loads that will be brought to the reservoir. Reservoir turbidity affects light penetration, which in turn affects photosynthesis and solar heat transfer to the deeper layers. Turbidity itself is a function of external suspended solid loading and in-reservoir photosynthesis. Consideration of these complex interactions was beyond the scope of this study. However, a sensitivity analysis on the reservoir model’s light extinction coefficient showed modest impact on downstream temperature and little to no impact on downstream DO. The scope of the present study did not include evaluation of nutrient loads and their impact on reservoir water quality. The effects of SOD and light extinction on downstream DO can be assessed in greater detail through a nutrient model for the reservoir. Future studies should include data collection to support such an evaluation. Effects of nutrient and organic matter loads were not considered directly in the downstream water quality model. While data measured over fall and winter showed negligible effect of BOD on DO, it is possible that impacts in summer may be greater. Synchronized water quality surveys that assess nutrient and BOD loads brought in by the tributaries during summer, in conjunction with identification of point sources, can help refine the downstream model and improve its predictive ability for summer periods.
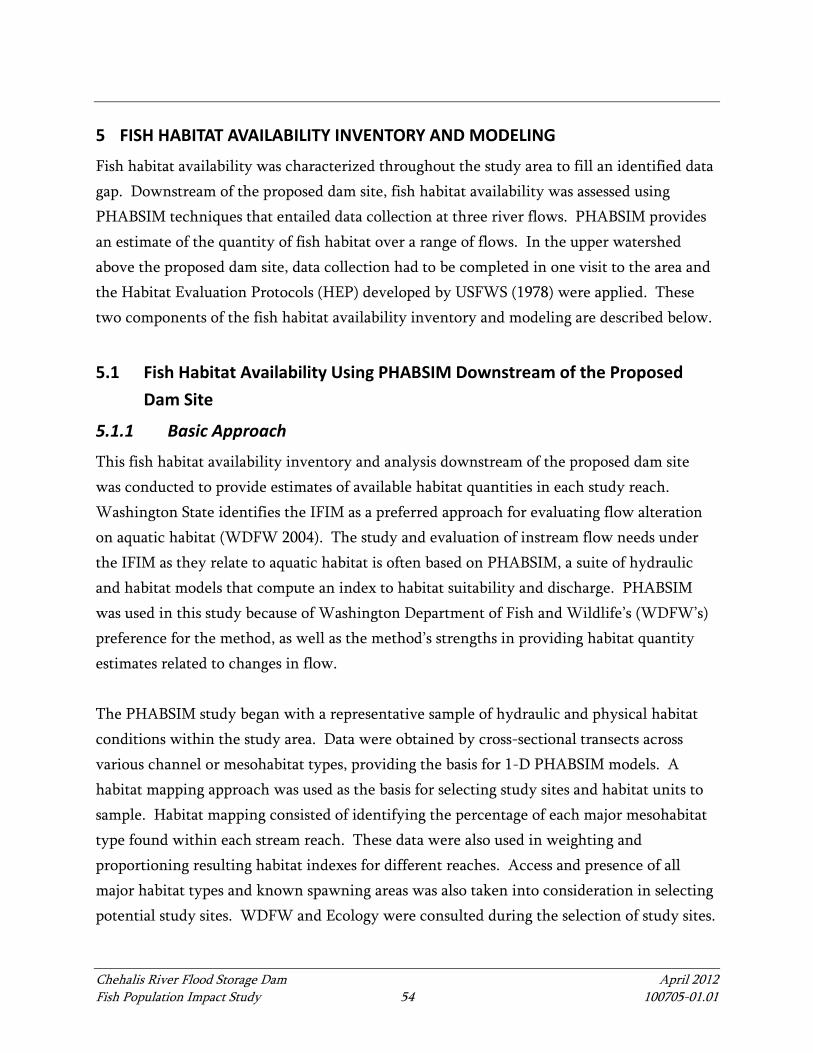
Chehalis River Flood Storage Dam April 2012 Fish Population Impact Study 54 100705-01.01
5 FISH HABITAT AVAILABILITY INVENTORY AND MODELING
Fish habitat availability was characterized throughout the study area to fill an identified data gap. Downstream of the proposed dam site, fish habitat availability was assessed using PHABSIM techniques that entailed data collection at three river flows. PHABSIM provides an estimate of the quantity of fish habitat over a range of flows. In the upper watershed above the proposed dam site, data collection had to be completed in one visit to the area and the Habitat Evaluation Protocols (HEP) developed by USFWS (1978) were applied. These two components of the fish habitat availability inventory and modeling are described below.
5.1 Fish Habitat Availability Using PHABSIM Downstream of the Proposed Dam Site
5.1.1 Basic Approach
This fish habitat availability inventory and analysis downstream of the proposed dam site was conducted to provide estimates of available habitat quantities in each study reach. Washington State identifies the IFIM as a preferred approach for evaluating flow alteration on aquatic habitat (WDFW 2004). The study and evaluation of instream flow needs under the IFIM as they relate to aquatic habitat is often based on PHABSIM, a suite of hydraulic and habitat models that compute an index to habitat suitability and discharge. PHABSIM was used in this study because of Washington Department of Fish and Wildlife’s (WDFW’s) preference for the method, as well as the method’s strengths in providing habitat quantity estimates related to changes in flow. The PHABSIM study began with a representative sample of hydraulic and physical habitat conditions within the study area. Data were obtained by cross-sectional transects across various channel or mesohabitat types, providing the basis for 1-D PHABSIM models. A habitat mapping approach was used as the basis for selecting study sites and habitat units to sample. Habitat mapping consisted of identifying the percentage of each major mesohabitat type found within each stream reach. These data were also used in weighting and proportioning resulting habitat indexes for different reaches. Access and presence of all major habitat types and known spawning areas was also taken into consideration in selecting potential study sites. WDFW and Ecology were consulted during the selection of study sites.

Fish Habitat Availability Modeling
Chehalis River Flood Storage Dam April 2012 Fish Population Impact Study 55 100705-01.01
For the instream flow study, a total of 10 study sites were established in the six study reaches on the Chehalis River:
• Pe Ell to Elk Creek (RM 106.2 to RM 100.2) – two study sites • Elk Creek to South Fork Chehalis River (RM 100.2 to RM 88.0) – two study sites • South Fork Chehalis River to Newaukum River (RM 88.0 to RM 75.3) – two study
sites • Newaukum River to Skookumchuck River (RM 75.3 to RM 66.8) – one study site • Skookumchuck River to Black River (RM 66.8 to RM 47.0) – one study site • Black River to Porter (RM 47.0 to RM 33.3) – two study sites, one downstream of
Oakville and one upstream of Porter To represent the stream section between the proposed dam site (RM 108.3) and Pe Ell (RM 106.2), a previous instream flow study done by Ecology was added (Caldwell et al. 2004). A total of 79 transects were used to represent habitat types and channel hydraulics present in the Chehalis River from the proposed dam site downstream to Porter. Data collected at each transect consisted of water surface elevation (WSEL), cross-section profile elevation (calculated from survey data or water depths), velocities, discharge, and substrate and cover information. Depth and velocity were measured at points (stations on a tape) across each transect at a minimum of one flow. The number of points established (referred to as cells in the PHABSIM model) depended on the width and complexity of a given transect. WSEL and discharge are collected at all flows. For this study, velocities were measured at all flows on a select number of transects deemed to have complex velocity patterns. Data collected in the field were entered into the hydraulic model program by individual transect. After error checking, each transect was brought into a hydraulic simulation module for calibration. Hydraulic model calibration involved generating stage-discharge relationships using measured WSEL and discharge, which was used to predict depth at different flows. Velocity calibration used a regression model or Manning’s equation (a hydraulic formula that uses bed roughness) to produce velocity adjusment factors that were applied to measured velocities. Once calibrated, the model could be used to predict depths and velocites over a range of simulated flows.

Fish Habitat Availability Modeling
Chehalis River Flood Storage Dam April 2012 Fish Population Impact Study 56 100705-01.01
5.1.2 Habitat Model
Each cell in the calibrated hydraulic model had a predicted depth and water velocity associated with a type of substrate or cover for a particular flow. A fish habitat index was computed for each cell by multiplying the corresponding suitability of each variable from Habitat Suitability Criteria (HSC) for each fish species and life stage of interest to produce a composite factor. For example, a cell may have had a velocity suitability of 0.9, a depth suitability of 0.73, and a substrate/cover suitability of 0.8, for a composite of 0.52. This cell composite number was then multiplied by the number of square feet of area in that cell. For each transect, all the cells' areas were summed to produce a total number of square feet of usable habitat available at a specified flow. This result was then multiplied by the percentage (weight) the individual transect represents as a proportion of all transects being modeled. The final result was the sum of all transects expressed as Weighted Usable Area (WUA) in square feet of habitat per 1,000 feet of stream corresponding to each simulated flow. For this study, Chinook salmon spawning and rearing, steelhead spawning and rearing, and coho spawning were evaluated. Coho rearing was not estimated because, based on recent studies by Beecher et al. (2010), it has been shown that PHABSIM does not provide WUA predictions for juvenile coho salmon that are consistent with the empirical observations of smolt production. Instead, their results indicated that the maximum WUA for coho salmon occurred at very low flows, then declined as flows increased. In this study, a similar prediction was found when WUA was calculated for juvenile coho salmon. To address this shortcoming, for the fish population model, it was assumed that habitat area for juvenile coho equaled that predicted for juvenile steelhead.
5.1.3 Summary of Results
The results exhibit a trend of increasing flow relative to maximum fish habitat for all species and life stages progressing longitudinally downstream (Table 5-1). This trend illustrates that no single reach has a greater or lesser effect on overall habitat, and usable habitat remains consistent relative to accretion. The range of flow where usable habitat is within 80 percent of the maximum is generally on the order of one-half to two. The Newaukum to
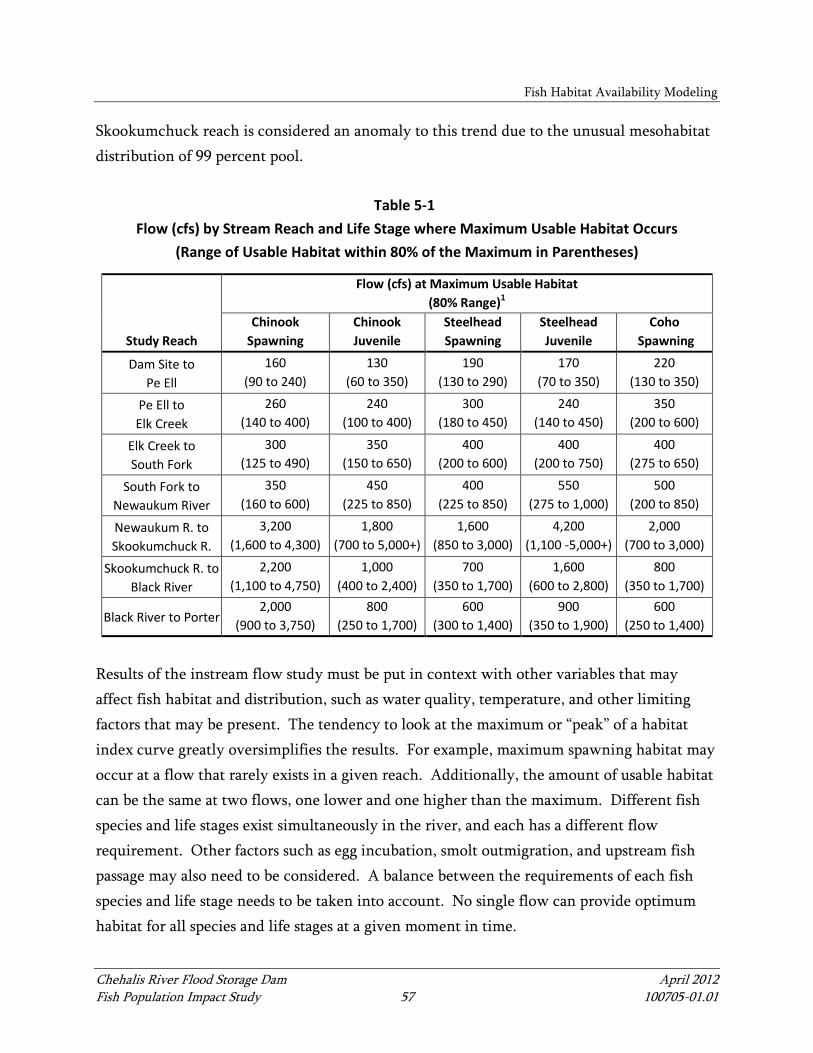
Fish Habitat Availability Modeling
Chehalis River Flood Storage Dam April 2012 Fish Population Impact Study 57 100705-01.01
Skookumchuck reach is considered an anomaly to this trend due to the unusual mesohabitat distribution of 99 percent pool.
Table 5-1 Flow (cfs) by Stream Reach and Life Stage where Maximum Usable Habitat Occurs
(Range of Usable Habitat within 80% of the Maximum in Parentheses)
Study Reach
Flow (cfs) at Maximum Usable Habitat (80% Range)1
Chinook Spawning
Chinook Juvenile
Steelhead Spawning
Steelhead Juvenile
Coho Spawning
Dam Site to Pe Ell
160 (90 to 240)
130 (60 to 350)
190 (130 to 290)
170 (70 to 350)
220 (130 to 350)
Pe Ell to Elk Creek
260 (140 to 400)
240 (100 to 400)
300 (180 to 450)
240 (140 to 450)
350 (200 to 600)
Elk Creek to South Fork
300 (125 to 490)
350 (150 to 650)
400 (200 to 600)
400 (200 to 750)
400 (275 to 650)
South Fork to Newaukum River
350 (160 to 600)
450 (225 to 850)
400 (225 to 850)
550 (275 to 1,000)
500 (200 to 850)
Newaukum R. to Skookumchuck R.
3,200 (1,600 to 4,300)
1,800 (700 to 5,000+)
1,600 (850 to 3,000)
4,200 (1,100 -5,000+)
2,000 (700 to 3,000)
Skookumchuck R. to Black River
2,200 (1,100 to 4,750)
1,000 (400 to 2,400)
700 (350 to 1,700)
1,600 (600 to 2,800)
800 (350 to 1,700)
Black River to Porter 2,000
(900 to 3,750) 800
(250 to 1,700) 600
(300 to 1,400) 900
(350 to 1,900) 600
(250 to 1,400)
Results of the instream flow study must be put in context with other variables that may affect fish habitat and distribution, such as water quality, temperature, and other limiting factors that may be present. The tendency to look at the maximum or “peak” of a habitat index curve greatly oversimplifies the results. For example, maximum spawning habitat may occur at a flow that rarely exists in a given reach. Additionally, the amount of usable habitat can be the same at two flows, one lower and one higher than the maximum. Different fish species and life stages exist simultaneously in the river, and each has a different flow requirement. Other factors such as egg incubation, smolt outmigration, and upstream fish passage may also need to be considered. A balance between the requirements of each fish species and life stage needs to be taken into account. No single flow can provide optimum habitat for all species and life stages at a given moment in time.
Fish Habitat Availability Modeling
Chehalis River Flood Storage Dam April 2012 Fish Population Impact Study 58 100705-01.01
5.2 Fish Habitat Availability Using HEP Upstream of the Proposed Dam Site
5.2.1 Basic Approach
Habitat availability data for anadromous salmonids were collected in the upper watershed areas above the proposed dam site using a HEP. The HEP was developed by USFWS (1980) to assess habitat quality and quantity for use in habitat inventory, impact assessment and mitigation. The survey included mainstem and tributary reaches in the upper watershed. HEP assesses both habitat quality and habitat quantity. Habitat quality is defined by Habitat Suitability Indices (HSI) which represents the suitability of available habitat for specific species and life stages. HSI models can include an extensive array of variables ranging from water temperature, cover and substrate to percent of specific habitat types. HSI models produce values that rate overall habitat quality on a scale of 0 (no habitat) to 1 (optimal habitat), based on the incorporation of selected habitat variables. The advantage of HSI models is the final value (i.e. score) for individual variables, life stages or combined life stages can in turn be compared directly to other studies or stream reaches. The methodology has the benefit of the ability to adjust suitability values for individual variables to account for regional conditions and/or known life history patterns without having to repeat the field sampling portion. Habitat quantity (stream area) is determined from stream channel length and width measurements, either measured or estimated from maps or aerial photos. Stream area is calculated as the average channel width for a stream segment multiplied by the length of the stream segment. Habitat Units (HU’s) are derived by multiplying the HSI value for habitat quality by the quantity of habitat (surface area). This number is intended to be a baseline assessment that can be used to predict habitat change or loss due to a project. The study area includes the mainstem Chehalis River and major tributaries in and above the proposed reservoir inundation zone associated with the flood storage only dam and multi-purpose dam scenarios. The reservoir inundation area of the multi-purpose dam is larger than the flood storage only scenario. Under a flood storage only operation scenario, the maximum reservoir inundation elevation is 669.5 feet above mean sea level (MSL). Under an

Fish Habitat Availability Modeling
Chehalis River Flood Storage Dam April 2012 Fish Population Impact Study 59 100705-01.01
alternative multi-purpose scenario, maximum inundation would extend to 719.5 feet MSL. Because it is impractical to differentiate habitat conditions between the two scenarios upper elevation extents (a difference of 50 feet), the goal was to evaluate habitat up to 720 feet MSL within the proposed reservoir footprint and determine the suitability of extrapolating those results to estimate habitat conditions in adjacent upstream reaches. The aquatic habitat evaluation was conducted within WDFW spawning index reaches on the mainstem upper Chehalis (RM 110.0 to 117.0) and major tributaries Big Creek, Thrash Creek, and Roger Creek within the proposed inundation zone. In addition, the upper Chehalis East Fork (RM 120.0 to 121.7) and the West Fork from RM 0.0 to 2.0 were selected for evaluation above the proposed inundation zone, Surveys consisted of walking the stream reach and collecting widths and depths of individual habitat types. Lengths were defined by boundaries delineated using GPS coordinates. Potential spawning areas were noted and substrate composition and area (ft2) recorded. All other variables necessary for the HEP analysis were estimated by eye. If initial reconnaissance indicated the potential for a large number of habitat units relative to the reach length, sub-sampling of habitat units was employed.
5.2.2 Summary of Results
Major habitat characteristics for all surveyed reaches are presented in Table 5-2. Pool holding habitat is poor for all adults due to lack of instream cover and depth. Instream cover for Chinook and steelhead juveniles is primarily large cobble and boulder. Off-channel backwaters and side-channel habitat for coho juvenile summer and winter rearing is rare and accounts for less than 4 percent of habitat. Percent fines in rearing and spawning areas were similar, averaging 15 percent.
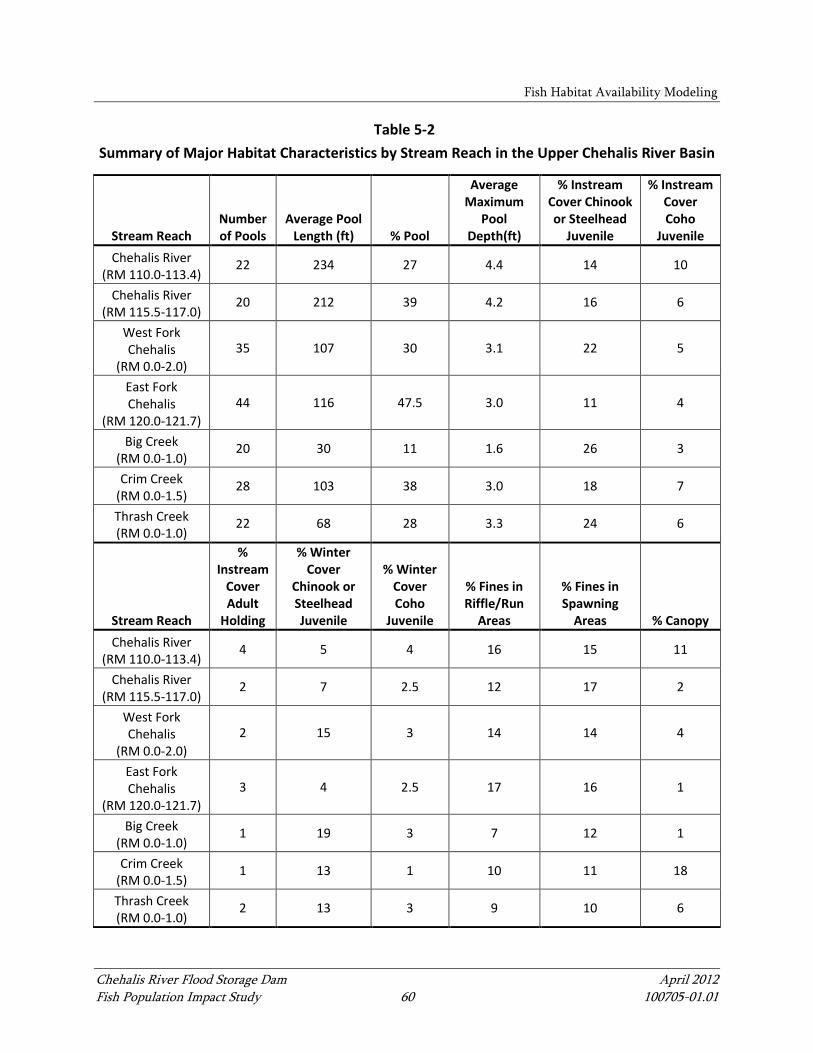
Fish Habitat Availability Modeling
Chehalis River Flood Storage Dam April 2012 Fish Population Impact Study 60 100705-01.01
Table 5-2 Summary of Major Habitat Characteristics by Stream Reach in the Upper Chehalis River Basin
Stream Reach Number of Pools
Average Pool Length (ft) % Pool
Average Maximum
Pool Depth(ft)
% Instream Cover Chinook or Steelhead
Juvenile
% Instream Cover Coho
Juvenile Chehalis River
(RM 110.0-113.4) 22 234 27 4.4 14 10
Chehalis River (RM 115.5-117.0)
20 212 39 4.2 16 6
West Fork Chehalis
(RM 0.0-2.0) 35 107 30 3.1 22 5
East Fork Chehalis
(RM 120.0-121.7) 44 116 47.5 3.0 11 4
Big Creek (RM 0.0-1.0)
20 30 11 1.6 26 3
Crim Creek (RM 0.0-1.5)
28 103 38 3.0 18 7
Thrash Creek (RM 0.0-1.0)
22 68 28 3.3 24 6
Stream Reach
% Instream
Cover Adult
Holding
% Winter Cover
Chinook or Steelhead Juvenile
% Winter Cover Coho
Juvenile
% Fines in Riffle/Run
Areas
% Fines in Spawning
Areas % Canopy Chehalis River
(RM 110.0-113.4) 4 5 4 16 15 11
Chehalis River (RM 115.5-117.0)
2 7 2.5 12 17 2
West Fork Chehalis
(RM 0.0-2.0) 2 15 3 14 14 4
East Fork Chehalis
(RM 120.0-121.7) 3 4 2.5 17 16 1
Big Creek (RM 0.0-1.0)
1 19 3 7 12 1
Crim Creek (RM 0.0-1.5)
1 13 1 10 11 18
Thrash Creek (RM 0.0-1.0)
2 13 3 9 10 6

Fish Habitat Availability Modeling
Chehalis River Flood Storage Dam April 2012 Fish Population Impact Study 61 100705-01.01
HSI scores used to calculate HU’s were based on a limiting factor analysis which assumes that all variables have an effect on habitat and the lowest suitability score cannot be compensated for by higher suitability values. HU’s were calculated for each reach by multiplying the lowest HSI score for a particular species and life stage times the total area surveyed. In order to provide a standardized comparison, HU’s per mile were also calculated for each reach. Results are presented for Chinook in the West Fork and East Fork, although there are no records indicating these areas are utilized for spawning or rearing. Similarly, coho spawning HSI scores were computed for upper mainstem Chehalis reaches though spawning is not known to occur there. Chinook are not known to utilize Big Creek, Thrash Creek or Crim Creek for spawning and rearing. Coho spawning HSI scores for should be regarded as indicators of suitable substrate for egg survival during incubation. It would be more appropriate to base coho spawning habitat on steelhead spawning HSI scores. Because there are no available coho adult suitability curves for the variables collected it should be assumed that HSI scores for adult steelhead would serve as a good surrogate. Overall, juvenile coho habitat is considered poor in all reaches evaluated based on limited summer and over-winter rearing areas. HSI scores for steelhead in the mainstem Chehalis River reaches are similar to Chinook for adult holding and juvenile rearing. Spawning habitat for steelhead is poor in the East Fork and fair in the Chehalis River (RM 115.5 to 117) reach based on the spawning suitability index. Spawning habitat for steelhead in the West Fork is considered more abundant and of higher quality than most reaches. For tributary reaches, spawning habitat and pool quality are rated poor for steelhead, though rearing habitat is adequate in all reaches.
5.2.3 Estimation of Impacted Salmonid Habitat In Dam Reservoir Inundation Areas
The HU calculations were used to estimate the amount of habitat available in the upper watershed above the proposed dam site in current conditions, with a flood storage dam, and with a multi-purpose dam. These estimates required first determining the amount of

Fish Habitat Availability Modeling
Chehalis River Flood Storage Dam April 2012 Fish Population Impact Study 62 100705-01.01
accessible habitat available in each scenario and then extrapolating data from the survey reaches to unsurveyed reaches in the upper watershed. The upper watershed areas accessible to anadromous fish varies between each species based on swimming abilities and habitat preferences. To estimate the existing extent of each species’ distribution in the upper watershed, data from the WDFW Salmon and Steelhead Inventory (WDFW 2002) and Weyerhaeuser (unpubl. data) were used. The Weyerhaeuser data are from presence/absence surveys. The stream length of fish access was calculated based on documented species presence, not specifically spawning, using GIS. In existing conditions, spring Chinook distributions extend among 15.70 miles above the proposed dam, steelhead among 21.25 miles, and coho among 20.95 miles. To estimate available habitat with either a flood storage dam or a multi-purpose dam, all stream reaches in the inundation area of the full reservoir were assumed to no longer providing suitable spawning or rearing habitat. Inundation areas in the flood storage dam and multi-purpose dam scenarios were estimated based on reservoir elevation information presented in (EES Consulting 2011) This assumption was based on the transition of the habitats from fluvial to lacustrine, as well as the degradation of stream habitats in the inundation area that would be fluvial habitats during periods when the reservoir is not full. The degradation of stream habitats in the inundation area was assumed to result from the deposition of excessive fine sediments. The reservoir areas were assumed to not provide suitable spawning habitat for the salmonid species investigated in this study. Although juvenile salmonids would rear and migrate in the reservoir, the reservoir is not considered rearing area because it would be a transition from natural and preferred rearing habitats. This approach conservatively estimates (i.e., errs on the side of under-estimating) the remaining habitat in the flood storage and multi-purpose facility scenarios. The total habitat area in square feet for each species and life stage for the study area are summarized in Table 5-3 for the existing watershed and for each of the potential dam scenarios. For every species and life stage, the multi-purpose dam reduces the available habitat more than the Flood Storage dam by 3 to 6%. For spring Chinook spawners, habitat is reduced to less than 5% in both scenarios, with no habitat remaining in the case of a multi-
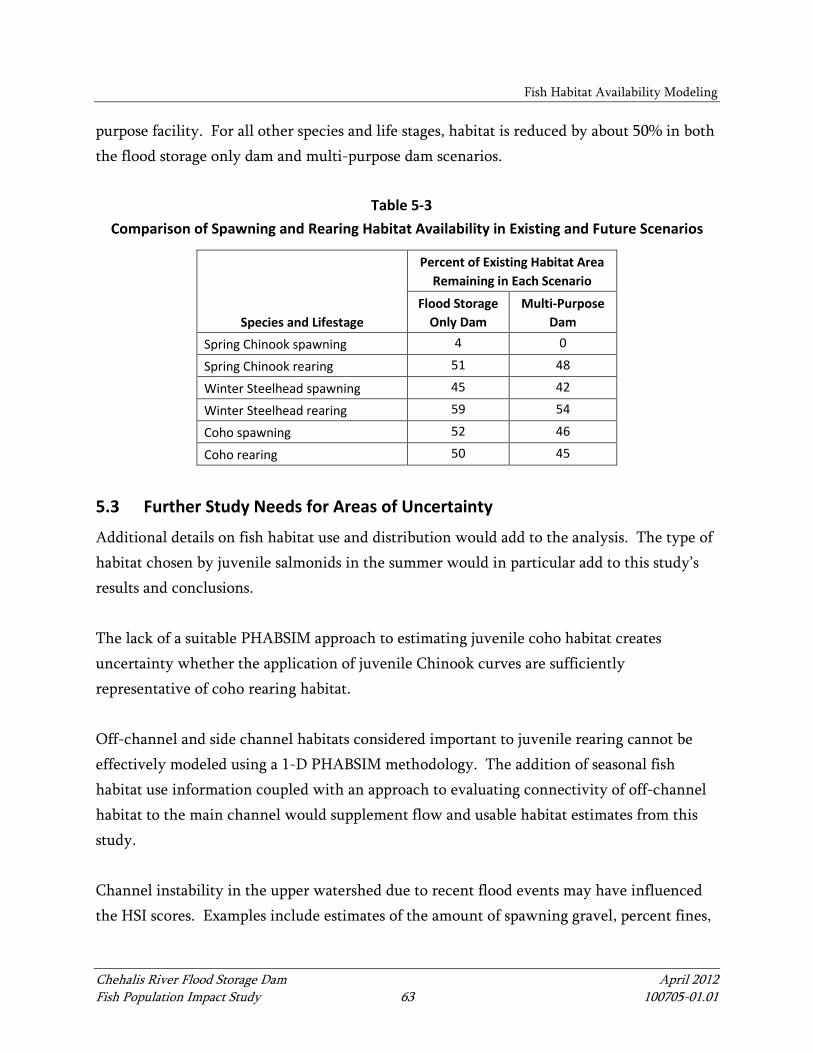
Fish Habitat Availability Modeling
Chehalis River Flood Storage Dam April 2012 Fish Population Impact Study 63 100705-01.01
purpose facility. For all other species and life stages, habitat is reduced by about 50% in both the flood storage only dam and multi-purpose dam scenarios.
Table 5-3 Comparison of Spawning and Rearing Habitat Availability in Existing and Future Scenarios
Species and Lifestage
Percent of Existing Habitat Area Remaining in Each Scenario
Flood Storage Only Dam
Multi-Purpose Dam
Spring Chinook spawning 4 0
Spring Chinook rearing 51 48
Winter Steelhead spawning 45 42
Winter Steelhead rearing 59 54
Coho spawning 52 46
Coho rearing 50 45
5.3 Further Study Needs for Areas of Uncertainty
Additional details on fish habitat use and distribution would add to the analysis. The type of habitat chosen by juvenile salmonids in the summer would in particular add to this study’s results and conclusions. The lack of a suitable PHABSIM approach to estimating juvenile coho habitat creates uncertainty whether the application of juvenile Chinook curves are sufficiently representative of coho rearing habitat. Off-channel and side channel habitats considered important to juvenile rearing cannot be effectively modeled using a 1-D PHABSIM methodology. The addition of seasonal fish habitat use information coupled with an approach to evaluating connectivity of off-channel habitat to the main channel would supplement flow and usable habitat estimates from this study. Channel instability in the upper watershed due to recent flood events may have influenced the HSI scores. Examples include estimates of the amount of spawning gravel, percent fines,

Fish Habitat Availability Modeling
Chehalis River Flood Storage Dam April 2012 Fish Population Impact Study 64 100705-01.01
riparian canopy/cover and pool depth. In the event the project proceeds, it is recommended that the survey reaches are revisited to determine if measureable changes have taken place. Variables other than those used for this study could be applied. The addition of water quality variables, water temperature in particular would provide information as to whether all reaches are suitable for rearing year-round. In addition, HSI values can be adjusted based on new data or professional judgment to provide updated scores and HU’s.
Chehalis River Flood Storage Dam April 2012 Fish Population Impact Study 65 100705-01.01
6 FISH POPULATION MODELING
The fish population modeling was conducted to investigate the potential effects on a flood retention structure on fish populations in the mainstem Chehalis River between its headwaters near RM 126 and the town of Porter at RM 33. Tributaries in the watershed were not part of the analysis area, except in the upper watershed above the dam where salmonid spawning and rearing areas would be impacted by a dam. The fish study focuses on three salmonid species, spring Chinook salmon, winter steelhead, and coho salmon, representing a diversity of anadromous life history strategies and habitat requirements.
6.1 Basic Approach
The primary tool used in this fish population analysis is a habitat-based population simulation model using the SHIRAZ modeling platform. SHIRAZ is a spatially explicit life-cycle modeling platform that simulates the effects of environmental change on salmon populations (Battin et al. 2007). SHIRAZ utilizes a set of user-defined relationships among habitat characteristics, fish survival, and carrying capacity to evaluate population performance across space and time (Scheuerell et al. 2006). The model allows us to translate the effects of changes to habitat quantity and quality resulting from a dam into consequences for salmonid population abundance and productivity in the basin. The mathematical basis of the SHIRAZ model is the Beverton-Holt stock recruitment model that describes the relationship between spawners and the number of progeny (adults) that survive to return to the natal river (Beverton and Holt 1957). SHIRAZ is a Microsoft Excel-based modeling platform that provides easy access to all algorithms and allows the user to build a model. The model is developed by defining specific habitat and salmonid population data, as well as the “functional relationships” that characterize the relationship between habitat conditions and salmonid productivity. The use of SHIRAZ to evaluate the potential salmonid population effects entailed three primary steps: 1) development and calibration of a model to predict recent annual salmonid production; 2) modification of the calibrated model to incorporate anticipated habitat changes resulting from the construction and operation of a dam; and 3) sensitivity analysis to examine if “outlier” conditions (such as increased water temperatures) among habitat input parameters alter the trends among one or more of the salmonid populations. The first step

Fish Population Modeling
Chehalis River Flood Storage Dam April 2012 Fish Population Impact Study 66 100705-01.01
was to develop separate baseline models describing existing conditions for each of the three species. Calibration of the model entails comparing empirical observations of fish abundance over multiple years. The baseline models included model inputs to estimate future conditions. Separate scenarios were analyzed to investigate fish population impacts assuming different dam configurations and operation (i.e., flood story only dam versus multi-purpose dam), as well as different fish passage survival rates past the dam. In addition, an optimization analysis was conducted for the multi-purpose dam scenario in which release flows from the reservoir were adjusted to provide maximum habitat area for the fish populations. The optimization analysis is explained further. For each of the salmonid species analyzed, the following future alternatives were analyzed:
• Continuation of existing conditions (No dam) • Flood storage only dam assuming target fish passage survival rates • Flood storage only dam assuming poor fish passage survival rates • Flood storage only dam assuming no fish passage survival • Multi-purpose dam (flood storage, hydropower, and low flow augmentation)
assuming target fish passage survival rates • Multi-purpose dam (flood storage, hydropower, and low flow augmentation)
assuming poor fish passage survival rates • Multi-purpose dam (flood storage, hydropower, and low flow augmentation)
assuming no fish passage survival The existing conditions model was calibrated to the 1978 to 2010 time period. The models simulating the alternatives listed above were run for a 50-year time period with an assumed start date of 2011. The simulations began in 2011because it is the first year without empirical data ,and starting the dam simulations in that year provided the greatest certainty of the starting conditions of the fish populations and habitat. The third step was to test the sensitivity of model outputs to changes to habitat conditions from those conditions used to develop the baseline models. The sensitivity analysis also provided an important check of whether the fish population might be particularly vulnerable to conditions outside the assigned range of those habitat inputs used in developing the

Fish Population Modeling
Chehalis River Flood Storage Dam April 2012 Fish Population Impact Study 67 100705-01.01
baseline models. The sensitivity analysis was conducted to examine changes in salmonid spawner abundance if less favorable habitat conditions occurred in the basin. The habitat parameters that were varied in the sensitivity analysis are depended on which parameters are included in the model for each species.
6.1.1 SHIRAZ Input Components
SHIRAZ requires four primary data components in order to characterize the population being analyzed and the habitat conditions affecting the population’s survival from one life stage to the next: 1) study area characteristics, 2) fish population data, 3) habitat capacity data, and 3) habitat productivity data. Each of these components is described in the following subsections. Fish population, habitat capacity, and habitat productivity information is presented for existing conditions, followed by a description of any changes made to characterize anticipated future conditions with the construction and operation of a dam are described. The habitat information collected in this study, as well as data compiled from WDFW and literature sources, were used in the models. The study area was divided into seven reaches in the analysis. Six of the reaches encompassed the mainstem Chehalis River downstream of the proposed dam site and one reach comprised the upper watershed river and tributaries upstream of the proposed dam site. Available fish population data was provided by WDFW. Additional fish population information was compiled from the scientific literature, primarily population status review documents prepared by the National Marine Fisheries Service. Habitat capacity data were derived from the fish habitat modeling reported in section 5 and appendices D and E. Functional relationships that characterize the relationship between habitat conditions and salmonid productivity were developed based on scientific literature. The habitat parameters included in the models as influencing salmonid survival difference among species and life stages. At one or more life stages, the following habitat parameters were included in the models: water temperature, fine sediments, minimum flows, peak flows, and fish passage at proposed dam.

Fish Population Modeling
Chehalis River Flood Storage Dam April 2012 Fish Population Impact Study 68 100705-01.01
6.1.1.1 Anticipated Habitat Changes Resulting from the Construction and Operation of a Dam
Several types of watershed changes are expected occur with the construction and operation of a dam. In some cases, the changes are the same with a flood storage only dam or a multi-purpose dam, while in other cases the changes differ depending on the type of dam. Table 6-1 describes the watershed changes input to the models.
Table 6-1 Model Input Adjustments in Dam Scenario Analysis
Type of Watershed Change
Dam Type Change Applies To
Flood Storage Only Dam
Multi-Purpose Dam
Decreased frequency and magnitude of high flow events
Decreased quantity of habitat available in the upper watershed
Decreased habitat quantity to account for loss of sediment bedload and large wood
Increased percent fine sediments downstream of the proposed dam
Increased base flows downstream of the proposed dam during periods of naturally low flow
Altered water temperatures downstream of dam
In the multi-purpose dam analysis, it was assumed that the dam would be operated to manage flow releases (up to an outtake maximum release flow of 2,000 cfs) for the benefit of fish. This ability to vary release flows coupled with the water storage in the reservoir would allow for the release of available water from the reservoir to be optimized to maximize the available fish habitat throughout the year. The optimized scenario in this study assumed flows were regulated to maximize fish habitat rather than hydropower generation. The habitat capacity inputs in the optimized scenario were identified by determining the priority

Fish Population Modeling
Chehalis River Flood Storage Dam April 2012 Fish Population Impact Study 69 100705-01.01
salmonid species and life stages for each month of the year. Using that information, priority study reaches were identified and PHABSIM results were used to identify flows at which maximum habitat or near-maximum habitat would be provided in the priority study reaches. Next, target recommended flows for fish habitat were identified and a hydrologic analysis was conducted (see Appendix A) to identify a flow release schedule that most closely provides the target flows given the amount of water available in the reservoir over the course of the year. The flow release schedule presented in Table 6-2 was identified to maximize fish habitat given available water. The flow releases provide flows as close to the target flows as possible.
Table 6-2 Optimized Flow Release Schedule to Maximize Fish Habitat
Month(s) Species and Life Stage Flow Release (cfs)
November through January
Coho salmon adult spawning 250
March through June
Winter steelhead adult spawning 200
July All species juvenile rearing 150
August through October
Spring Chinook salmon adult spawning 160
6.1.1.2 Fish Survival Past Dam
The construction and operation of a dam poses challenges for upstream migrating adult salmonids and downstream migrating juvenile salmonids. The continuously maintained reservoir associated with the multi-purpose dam would provide additional survival challenges. For the purposes of this study, it has been assumed that fish passage will be provided for upstream and downstream migrating fish. Given that either dam would be higher than 200 feet, it is expected that fish passage would be provided by trap and haul operations. The term “trap and haul” refers to the collection of fish at one side of the dam, transport via truck to the other side of the dam, and release back to the river. Fish passage at dams can be a very challenging proposition. Depending on the type of fish passage system in use, direct mortality can occur at the dam, in the reservoir as fish move
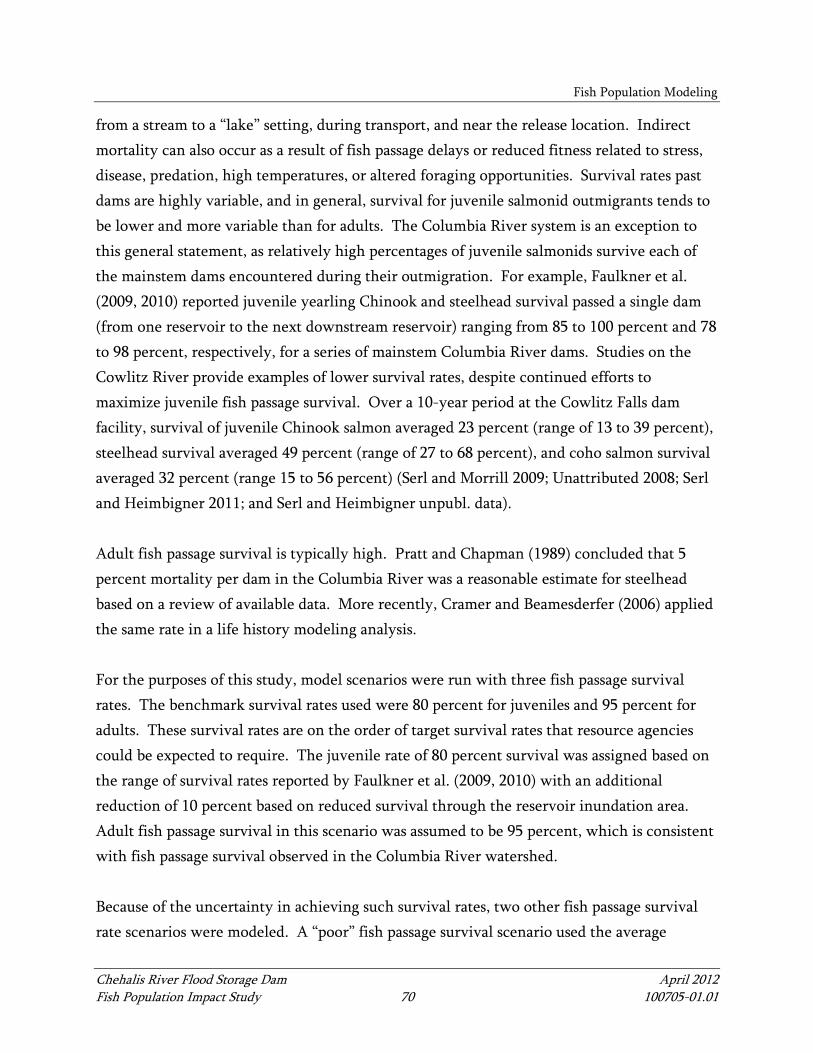
Fish Population Modeling
Chehalis River Flood Storage Dam April 2012 Fish Population Impact Study 70 100705-01.01
from a stream to a “lake” setting, during transport, and near the release location. Indirect mortality can also occur as a result of fish passage delays or reduced fitness related to stress, disease, predation, high temperatures, or altered foraging opportunities. Survival rates past dams are highly variable, and in general, survival for juvenile salmonid outmigrants tends to be lower and more variable than for adults. The Columbia River system is an exception to this general statement, as relatively high percentages of juvenile salmonids survive each of the mainstem dams encountered during their outmigration. For example, Faulkner et al. (2009, 2010) reported juvenile yearling Chinook and steelhead survival passed a single dam (from one reservoir to the next downstream reservoir) ranging from 85 to 100 percent and 78 to 98 percent, respectively, for a series of mainstem Columbia River dams. Studies on the Cowlitz River provide examples of lower survival rates, despite continued efforts to maximize juvenile fish passage survival. Over a 10-year period at the Cowlitz Falls dam facility, survival of juvenile Chinook salmon averaged 23 percent (range of 13 to 39 percent), steelhead survival averaged 49 percent (range of 27 to 68 percent), and coho salmon survival averaged 32 percent (range 15 to 56 percent) (Serl and Morrill 2009; Unattributed 2008; Serl and Heimbigner 2011; and Serl and Heimbigner unpubl. data). Adult fish passage survival is typically high. Pratt and Chapman (1989) concluded that 5 percent mortality per dam in the Columbia River was a reasonable estimate for steelhead based on a review of available data. More recently, Cramer and Beamesderfer (2006) applied the same rate in a life history modeling analysis. For the purposes of this study, model scenarios were run with three fish passage survival rates. The benchmark survival rates used were 80 percent for juveniles and 95 percent for adults. These survival rates are on the order of target survival rates that resource agencies could be expected to require. The juvenile rate of 80 percent survival was assigned based on the range of survival rates reported by Faulkner et al. (2009, 2010) with an additional reduction of 10 percent based on reduced survival through the reservoir inundation area. Adult fish passage survival in this scenario was assumed to be 95 percent, which is consistent with fish passage survival observed in the Columbia River watershed. Because of the uncertainty in achieving such survival rates, two other fish passage survival rate scenarios were modeled. A “poor” fish passage survival scenario used the average

Fish Population Modeling
Chehalis River Flood Storage Dam April 2012 Fish Population Impact Study 71 100705-01.01
observed juvenile survival rates from the Cowlitz Falls facility. In this scenario, juvenile survival was assumed to be 23 percent among spring Chinook salmon, 49 percent among winter steelhead, and 32 percent among coho salmon. Adult survival rates were assumed to be 80 percent. The third scenario that was run assumed failure of fish passage efforts and a 0 percent upstream and downstream fish passage survival rate. This run with no fish passage survival provides an estimate of fish population impacts in a worst-case fish passage survival scenario.
6.1.2 Model Calibration
Models were calibrated to salmonid population abundance estimates provided by WDFW. These WDFW estimates were based on annual spawning ground surveys in an index reach that they extrapolated to estimate the population abundance. Calibration included testing multiple iterations of functional relationship combinations to examine which productivity parameters appeared to be the best predictors. Criteria for selection were based on determining which functional relationship combinations produced results most similar to the WDFW estimates. This process resulted in different functional relationship combinations being applied to the three species examined, as described above. In calibrating the model, the modeled results were compared to WDFW estimates to examine:
• Whether the model predictions of spawner abundance were in the same approximate range compared to WDFW estimates
• Whether the model tracked increases or decreases between years (i.e., relative inter-annual trends) in a similar pattern to those estimated by WDFW
6.1.3 Sensitivity Analyses
Many of the habitat parameters affecting the survival of individual salmonids from one life stage to the next vary over time. In the models developed for each species, the model inputs to characterize habitat parameters can vary from one year to the next. For the calibration of the models described presented in the preceding sections, habitat parameter entries between the model start date (1978) and the last year of empirical data (2010) were based on documented observations in the basin, to the extent possible. Based on the mean, range, and/or variability of these parameters, estimates of each parameter’s condition in future years were input to the model either as a set value or as a random variable that varies according to

Fish Population Modeling
Chehalis River Flood Storage Dam April 2012 Fish Population Impact Study 72 100705-01.01
a user-specified range or distribution. For the purposes of preparing “most likely” future estimates, the model inputs for each habitat parameter were based on the best available data of the last 20 years. As evident in the results provided in preceding sections, this approach is useful for examining the predicted differences between no dam and each of the dam scenarios. In addition to understanding the general differences and predicted trends of each scenario, additional model scenarios were run to examine whether additional population impacts or vulnerability were evident if conditions occurred outside the identified range used for the various habitat parameters were modeled. This sensitivity analysis examined salmonid spawner abundance if less favorable habitat conditions occurred in the basin. These less favorable conditions are realistic given the uncertainty of predicting future habitat conditions, as well as the likelihood of changing conditions (e.g., climate change, decadal regime shifts, El Niño, La Niña, etc.) over the 50-year simulation period. Sensitivity analyses were conducted for the no dam scenario and the multi-purpose dam with water releases from the bottom of the reservoir and fish passage provided. The analyses investigated the effects of different assumptions for five different habitat parameter change combinations compared to those used in the calibrated models:
• Intermittent high flow events comparable to the historical hydrograph • Water temperatures increased by 2°C • Smolt-to-adult survival is reduced to be between 0.5 percent and 2.5 percent instead
of the 0.5 percent to 5.0 percent range used in the base model • Habitat degradation accelerated to 1 percent per year due to loss of sediment bedload,
LWD, and channel maintenance flows. Baseline model assumes 0.5 percent habitat degradation rate
• All four of the above changes occur in one combined scenario
6.2 Summary of Results
Calibrated models were developed for each species and twenty 50-year simulations were conducted to estimate future salmonid population sizes in each analysis scenario. Separate models were run assuming existing conditions continued into the future and for each of the flood storage only and multi-purpose facility scenarios analyzed. The existing conditions

Fish Population Modeling
Chehalis River Flood Storage Dam April 2012 Fish Population Impact Study 73 100705-01.01
model assumes that no dam is constructed and that documented recent conditions for each of the productivity parameters and capacity estimates continue throughout the period of analysis. In order to characterize the overall relative differences between the modeled effects of different dam scenarios on each salmonid species, the distribution of the predicted number of spawners throughout the 50-year simulation period was determined. For the purposes of presenting a comparison among all scenarios analyzed, the results are presented as the predicted minimum, first quartile, second quartile (median), third quartile, and maximum results2. These results are presented in a box-plot figure, as shown in Figure 6-1.
Figure 6-1 Example of Box Plot Figure Used to Present 50 Years of Spawner Numbers Data
The results of the 50-year simulations for spring Chinook salmon, winter steelhead, and coho salmon are presented in Figure 6-2 and Table 6-3. Compared to the predicted number of spawners over the 50-year simulation period with the continuation of existing conditions, the optimized multi-purpose dam is predicted to produce an increase in spring Chinook salmon. All other dam scenarios for all three salmonid species were predicted to result in substantial reductions in the predicted number of spawners.
2 The quartile results indicate the predicted number of spawners in which 25% are lower (i.e., first quartile), 50% are lower (i.e., second quartile or median), or 75% are lower (i.e., third quartile).
0
200
400
600
800
1,000
1,200
1,400
Existing
Num
ber o
f Spa
wne
rs
Analysis Scenario
Maximum
Third quartile (top of box) Median
First quartile (bottom of box) Minimum

Fish Population Modeling
Chehalis River Flood Storage Dam April 2012 Fish Population Impact Study 74 100705-01.01
Among spring Chinook salmon, the predicted median number of spawners over the 50-year simulation period assuming the continuation of existing conditions was 320 fish. Assuming the target fish passage survival could be achieved in the flood storage only dam scenario, the predicted median number of spawners was 249, a 22 percent reduction compared to existing conditions. In the poor fish passage survival and the no fish passage survival scenarios of the flood storage only dam analysis, the predicted number of spawners was reduced to 122 and 152 fish, respectively. These were reductions of 62 percent and 52 percent, respectively. Among the optimized multi-purpose dam scenarios, the predicted median number of spring Chinook spawners was 769 if target fish passage survival was achieved, 712 with poor fish passage survival, and 789 if no fish passage survival is attained. These were increases of 140 percent, 122 percent, and 146 percent relative to the number of spawners predicted with the continuation of existing conditions.
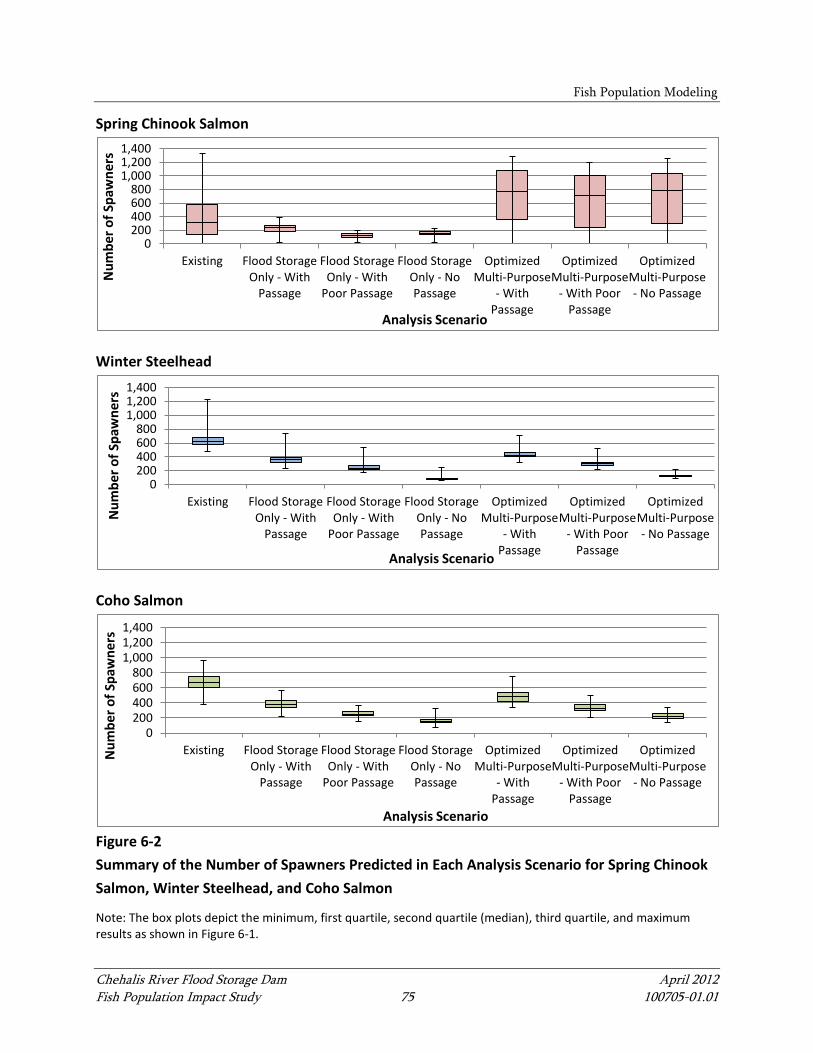
Fish Population Modeling
Chehalis River Flood Storage Dam April 2012 Fish Population Impact Study 75 100705-01.01
Spring Chinook Salmon
Winter Steelhead
Coho Salmon
Figure 6-2 Summary of the Number of Spawners Predicted in Each Analysis Scenario for Spring Chinook Salmon, Winter Steelhead, and Coho Salmon
Note: The box plots depict the minimum, first quartile, second quartile (median), third quartile, and maximum results as shown in Figure 6-1.
0200400600800
1,0001,2001,400
Existing Flood StorageOnly - With
Passage
Flood StorageOnly - With
Poor Passage
Flood StorageOnly - NoPassage
OptimizedMulti-Purpose
- WithPassage
OptimizedMulti-Purpose
- With PoorPassage
OptimizedMulti-Purpose- No Passage
Num
ber o
f Spa
wne
rs
Analysis Scenario
0200400600800
1,0001,2001,400
Existing Flood StorageOnly - With
Passage
Flood StorageOnly - With
Poor Passage
Flood StorageOnly - NoPassage
OptimizedMulti-Purpose
- WithPassage
OptimizedMulti-Purpose
- With PoorPassage
OptimizedMulti-Purpose- No Passage
Num
ber o
f Spa
wne
rs
Analysis Scenario
0200400600800
1,0001,2001,400
Existing Flood StorageOnly - With
Passage
Flood StorageOnly - With
Poor Passage
Flood StorageOnly - NoPassage
OptimizedMulti-Purpose
- WithPassage
OptimizedMulti-Purpose
- With PoorPassage
OptimizedMulti-Purpose- No Passage
Num
ber o
f Spa
wne
rs
Analysis Scenario

Fish Population Modeling
Chehalis River Flood Storage Dam April 2012 Fish Population Impact Study 76 100705-01.01
Table 6-3 Predicted Percent Change in the Median Number of Spawners Over 50-year simulation period
Between the Existing Condition and Dam Scenarios
Dam Type Fish Passage Analysis Scenario Spring Chinook
Salmon Winter
Steelhead Coho
Salmon No Dam – Continuation of Existing Conditions 0% 0% 0%
Flood Storage Only Dam
With Target Fish Passage Survival -22% -43% -43% With Poor Fish Passage Survival -62% -62% -63%
No Fish Passage Survival -52% -87% -77% Optimized
Multi-Purpose Dam
With Target Fish Passage Survival 140% -32% -28% With Poor Fish Passage Survival 122% -52% -52%
No Fish Passage Survival 146% -81% -67%
Among winter steelhead, the predicted median number of spawners over the 50-year simulation period assuming the continuation of existing conditions was 628 fish. Assuming the target fish passage survival could be achieved in the flood storage only dam scenario, the predicted median number of spawners was 355, a 43 percent reduction compared to existing conditions. In the poor fish passage survival and the no fish passage survival scenarios of the flood storage only dam analysis, the predicted number of winter steelhead spawners was reduced to 238 and 80 fish, respectively. These are reductions of 62 percent and 87 percent, respectively. Among the optimized multi-purpose dam scenarios, the predicted median number of winter steelhead spawners was 425 if target fish passage survival was achieved, 305 with poor fish passage survival, and 122 if no fish passage survival is attained. These are decreases of 32 percent, 52 percent, and 81 percent relative to the number of spawners predicted with the continuation of existing conditions. Among coho salmon, the predicted median number of spawners over the 50-year simulation period assuming the continuation of existing conditions was 676 fish. Assuming the target fish passage survival could be achieved in the flood storage only dam scenario, the predicted median number of coho salmon spawners was 386, a 43 percent reduction compared to existing conditions. In the poor fish passage survival and the no fish passage survival scenarios of the flood storage only dam analysis, the predicted number of spawners was reduced to 250 and 155 fish, respectively. These are reductions of 63 percent and 77 percent, respectively. Among the optimized multi-purpose dam scenarios, the predicted median number of coho salmon spawners was 485 if target fish passage survival was achieved, 326

Fish Population Modeling
Chehalis River Flood Storage Dam April 2012 Fish Population Impact Study 77 100705-01.01
with poor fish passage survival, and 226 if no fish passage survival is attained. These are decreases of 28 percent, 52 percent, and 67 percent relative to the number of spawners predicted with the continuation of existing conditions.
6.2.1 Sensitivity Analyses
The sensitivity analyses examined how changes in estimated future habitat conditions affected salmonid populations in each scenario. The sensitivity analyses predicted reductions in the number of spawners of each species in both dam scenarios (Figure 6-3). The predicted number of winter steelhead and coho salmon spawners in each sensitivity analysis was consistently highest with the continuation of existing conditions (i.e., no dam), followed by the optimized multi-purpose dam, and the flood storage only dam. A different pattern was evident in the spring Chinook salmon simulations. The spring Chinook sensitivity analyses assuming low marine survival and high habitat degradation both predicted the highest number of spawners in the optimized multi-purpose dam scenario. However, the opposite was predicted in the high water temperature and combination of all altered parameters as the lowest number of spring Chinook spawners was predicted in the optimized multi-purpose dam scenario. In the sensitivity analysis of all three salmonid species, the single parameter that resulted in the highest predicted reduction in the number of spawners was low marine survival. For spring Chinook salmon, the next largest reductions in the number of spawners were predicted assuming high flows or high water temperatures. For winter steelhead and coho salmon, only slight reductions were predicted compared to the baseline model in the other single parameter sensitivity analyses.

Fish Population Modeling
Chehalis River Flood Storage Dam April 2012 Fish Population Impact Study 78 100705-01.01
Spring Chinook Salmon
Winter Steelhead
Coho Salmon
Figure 6-3 Summary of the Number of Spawners Predicted in the Sensitivity Analyses for Spring Chinook Salmon, Winter Steelhead, and Coho Salmon
Note: The box plots depict the minimum, first quartile, second quartile (median), third quartile, and maximum results as shown in Figure 6-1.
0200400600800
1,0001,2001,400
Num
ber o
f Spa
wne
rs
Sensitivity Analysis Scenario
Existing Conditions (No Dam) Flood Storage Only Dam Optimized Multi-Purpose Dam Base High Flows High Water Low Marine High Habitat Combination
Model Temperatures Survival Degradation of All
0200400600800
1,0001,2001,400
Num
ber o
f Spa
wne
rs
Sensitivity Analysis Scenario
Existing Conditions (No Dam) Flood Storage Only Dam Optimized Multi-Purpose Dam
Base High Flows High Water Low Marine High Habitat Combination Model Temperatures Survival Degradation of All
0200400600800
1,0001,2001,400
Num
ber o
f Spa
wne
rs
Sensitivity Analysis Scenario
Existing Conditions (No Dam) Flood Storage Only Dam Optimized Multi-Purpose Dam
Baseline High Flows High Water Low Marine High Habitat Combination Model Temperatures Survival Degradation of All

Fish Population Modeling
Chehalis River Flood Storage Dam April 2012 Fish Population Impact Study 79 100705-01.01
6.3 Discussion
The fish population modeling analyses for all three salmonid species predicted substantial reductions in the predicted number of spawners in the flood storage only dam and optimized multi-purpose dam analyses compared to the continuation of existing conditions, except for spring Chinook salmon with an optimized multi-purpose dam. The reductions ranged from 22 percent to 87 percent depending on dam and species analyzed. These reductions occurred regardless of the fish passage survival rate achieved, although the reductions were much greater if target fish passage survival rates could not be achieved. Although fish passage designs are being continuously improved, there is an element of uncertainty regarding the success of the fish passage system. The predicted increases in the median number of spring Chinook salmon spawners in the optimized multi-purpose dam scenario were between 122 percent and 146 percent depending on the fish passage survival rate. The predicted increases were likely due to the flow rates that maximize fish habitat spawning and rearing area, as well as the improved (lower) water temperatures downstream of such a facility. These changes in mainstem river conditions downstream of a dam would improve habitat conditions where WDFW estimates 94 percent of the spring Chinook mainstem spawning occurs. The apparent contribution of the optimized flows to the spring Chinook results was supported by the preliminary analysis of the multi-purpose dam without flows to maximize habitat, as the predicted number of spring Chinook spawners was reduced by more than 50 percent regardless of fish passage survival. The predicted number of spring Chinook salmon spawners in the optimized multi-purpose dam scenario had the highest variability among all scenarios and species as the 25 percent quartile results were less than half the prediction of the median predictions. This wide range of variability may explain the anomalous prediction of a higher median number of spring Chinook salmon spawners in the no fish passage survival compared to the simulations with target fish passage survival or poor fish passage survival. None of the scenarios predicted extirpation of the salmonid populations analyzed. Winter steelhead and coho salmon are more dependent upon upper watershed habitats for spawning than spring Chinook salmon. In the scenarios assuming no fish passage survival past the dams, the predicted number winter steelhead and coho salmon spawners are reduced between 67 percent and 87 percent, which is similar to the WDFW estimate that 91 percent

Fish Population Modeling
Chehalis River Flood Storage Dam April 2012 Fish Population Impact Study 80 100705-01.01
of the spawning of both populations occurs upstream of the proposed dam site. These reductions appear to reflect that the loss of habitat is slightly offset by the fishes’ affinity for straying. Based on the results of the sensitivity analysis, salmonid populations would be less impacted through the continuation of existing conditions that if either type of dam were constructed. The only exception to this was among spring Chinook salmon in the optimized multi-purpose dam scenario. In consideration of all three salmonid species investigated, this analysis indicates that the resiliency of the salmonid populations to less favorable environmental conditions is reduced with either type of dam.
6.4 Further Study Needs for Areas of Uncertainty
This fish population analysis was based primarily upon available existing data sets for the Chehalis River. When existing data were not available, information from other basins was applied or it was necessary to make assumptions. The water temperature data for the basin was one data set in which the best available information was Ecology’s long-term database of single monthly observations. The monthly sampling did not support the application of a temperature metric based on the actual peak temperatures encountered (e.g., daily maximum temperatures) nor a metric that characterized the duration of high water temperatures (e.g., 7-day average of daily maximum temperatures). More continuous long-term temperature sampling, such as the monitoring study started with the water quality analysis in this study (see Appendix C), would provide important information on the temperature conditions encountered by salmonids. This study’s use of the existing data from Ecology provided a limited understanding of the temperature conditions in the river that was sufficient but did not fully characterize the peak temperatures encountered and may not have accurately characterized the relative temperatures between years (i.e., which years were warmer than others). Another source of uncertainty is the rearing life histories and spatial distributions of rearing by juvenile salmonids. For spring Chinook in particular, there is uncertainty about the age distribution of outmigrants. The outmigrant distribution input to the model was based on older data and observations from other basins. Additional data on the proportion of fish outmigrating as fry, parr, and yearlings would be informative. Assumptions were also

Fish Population Modeling
Chehalis River Flood Storage Dam April 2012 Fish Population Impact Study 81 100705-01.01
necessary to estimate the distributions of rearing salmonids. Additional data would add certainty to those model inputs. The amount of off-channel habitat available for rearing, particularly overwinter rearing, was not available as a dataset. The off-channel habitats are important rearing areas and information on the extent of off-channel habitats, the accessibility of the habitats, and the quality of the habitats would add certainty to the estimates of overwinter habitat availability.

Chehalis River Flood Storage Dam April 2012 Fish Population Impact Study 82 100705-01.01
7 CONCLUSIONS
The fish population modeling analyses based on the collection and modeling of future mainstem river habitat changes resulting from a dam predict substantial declines among two or more salmonid species in scenarios with either a flood storage dam or a multi-purpose dam. The only species and scenario in which a decline was not predicted was spring Chinook salmon in a scenario with a multi-purpose dam that is operated to maximize downstream fish habitat through water releases from the reservoir. For spring Chinook in such an optimized multi-purpose dam scenario, the SHIRAZ model estimates increases of greater than 100 percent. For winter steelhead and coho salmon, two species that are heavily dependent upon high quality habitat in the upper watershed, reductions of 28 percent to 87 percent are predicted depending on dam scenario and fish passage survival rates. Larger reductions in number of spawners is predicted for all three salmonid species in the flood storage only dam compared to the multi-purpose dam. A water release schedule from a multi-purpose dam that is not optimized to maximize fish habitat for the species and life stages present during different months of the year would be expected to cause larger reductions than those predicted in the optimized multi-purpose dam scenario analyzed in this study. Since the multi-purpose dam scenario analyzed optimized flow releases for fish habitat, the analysis did not consider an operating scenario incorporating hydropower. However that would not preclude hydropower from being installed at a multi-purpose dam.. The hydrology and hydraulics analysis estimated that the optimized flow release schedule could support hydropower generation for approximately 200 days per year. A water release schedule with more of an emphasis on hydropower generation would be expected to result in fewer salmonid spawners than reported in the scenarios analyzed in this study. The likelihood of fish passage operations successfully passing salmonids is uncertain, particularly for downstream migrating juvenile salmonids, but has a major impact on the magnitude of population impacts. The results of this analysis suggest that fish passage operations achieving target survival rates (in this study 80 percent survival of juveniles and 95 percent survival of adults), is necessary to not reduce salmonid populations by more than 50 percent, except spring Chinook in the optimized multi-purpose dam scenario.

Conclusions
Chehalis River Flood Storage Dam April 2012 Fish Population Impact Study 83 100705-01.01
These findings are based on the following changes to habitat that were input to the model based on modeled predictions conducted in this study (e.g., water quality) or assumptions of the type and magnitude of change based on interpretation of scientific literature:
• Decreased frequency and magnitude of high flow events. The flood reduction capabilities of the flood storage only dam or a multi-purpose facility would cause a decrease in peak flow events and benefit egg incubation survival.
• Decreased habitat capacity in the upper watershed. The quantity of habitat available in the upper watershed above a dam would decrease due to the loss of habitat in the reservoir inundation areas predicted for the flood storage only dam or multi-purpose facility. For the purposes of this analysis, it was assumed for both dam structures and operation scenarios that habitat throughout the entire reservoir area will no longer be suitable.
• Decreased habitat capacity downstream of the proposed dam site due to the degradation of habitat over time. This degradation was assumed due to the dam blocking upper watershed sediment bedload (e.g., gravel, cobbles, boulders) and large woody debris from reaching river areas downstream of the dam. Habitat capacity is expected to be reduced by a decrease in channel maintenance flows.
• Decreased habitat capacity due to changes in sediment bedload transport conditions that are expected to increase the amount of sand in the substrate between the proposed river and the confluence with the South Fork Chehalis River (RM 88).
• Increased amount of percent fine sediments downstream of the proposed dam site. The reduction in the frequency and magnitude of high flow events and the prolonged release of impounded water is expected to cause more fine sediments to be deposited downstream of either a flood storage only dam or a multi-purpose facility.
• With a multi-purpose dam, increased base flows downstream of the proposed dam site would increase available fish habitat if flow releases are managed to maximize fish habitat.
• Altered water temperatures downstream of the proposed dam site (multi-purpose facility only). The operation of a multi-purpose facility would include the release of flows throughout the year which would affect downstream water temperatures. The magnitude of any temperature changes on depends on whether the water released is from the reservoir surface, bottom, or mid-elevation. In the summer months, the

Conclusions
Chehalis River Flood Storage Dam April 2012 Fish Population Impact Study 84 100705-01.01
bottom of the reservoir is predicted to be several degrees cooler than the surface of the reservoir and the river water downstream. Thus, the release of water from the bottom of the reservoir during the summer is predicted to decrease the maximum temperatures in downstream river reaches, which would be beneficial to returning adult salmonids and rearing juvenile salmonids.
This analysis focused on the mainstem populations of three salmonid species. Either type of dam would also be expected to impact other fish in the mainstem and upper watershed study area, as well as fish populations utilizing the tributaries off the mainstem Chehalis that may utilize the mainstem habitats for migration or rearing. For those fish species in the upper watershed, the types of anticipated alterations to habitat quantity and quality may be detrimentally impacted. For those fish species utilizing tributaries off the mainstem Chehalis River and migrating through the lower mainstem, the augmented low flows provided in the optimized multi-purpose dam scenario may improve habitat quantity and quality. These potential impacts to other fish, as well as other aquatic organisms and wildlife species, should be evaluated in a comprehensive assessment of the environmental impacts of a dam on the upper mainstem of the Chehalis River.

Chehalis River Flood Storage Dam April 2012 Fish Population Impact Study 85 100705-01.01
8 REFERENCES
Battin, J., M. W. Wiley, M. H. Ruckelshaus, R. N. Palmer, E. Korb, K. K. Bartz, and H. Imaki, 2007. Projected impacts of climate change on salmon habitat restoration. Proceedings of the National Academy of Sciences of the United States of America 104:6720-6725.
Beecher, H.A., B.A. Caldwell, S.B. DeMond, D. Seiler, and S.N. Boessow, 2010. An empirical assessment of PHABSIM using long-term monitoring of coho salmon smolt production in Bingham Creek, Washington. North American Journal of Fisheries Management 30: 1529-1543.
Beverton, R.J.H. and S.J. Holt, 1957. On the dynamics of exploited fish populations. Fisheries Investment Series 2, Volume 19. U.K. Ministry of Agriculture and Fisheries, London.
Caldwell, B., J. Pacheco, H. Beecher, T. Hegy, and R. Vadas, 2004. Chehalis River Basin WRIA 22 and 23 Fish Habitat Analysis Using the Instream Flow Incremental Methodology. Prepared by the Washington Department of Ecology and the Washington Department of Fish and Wildlife. March 2004, Open File Technical Report 04-11-006.
City of Chehalis, 2010. Disk copy of files from FEMA, created on June 18, 2010.
Cole, T.M., and S. A. Wells, 2008 "CE-QUAL-W2: A two-dimensional, laterally averaged, Hydrodynamic and Water Quality Model, Version 3.6," Department of Civil and Environmental Engineering, Portland State University, Portland, OR.
Collyard, S. and M. Von Prause, 2010. Upper Chehalis River Watershed multi-parameter total maximum daily load: water quality data review. Upper Chehalis River Watershed multi-parameter total maximum daily load: water quality data review. Volume 10, Issues 3-57. Washington State Dept. of Ecology, Environmental Assessment Program, 73 pages.
Cramer, S. P. and R. C. P. Beamesderfer, 2006. Population dynamics, habitat capacity, and a life history simulation model for steelhead in the Deschutes River, Oregon. Prepared for PGE, Portland, OR. Prepared by S. P. Cramer & Associates, Inc. Portland, OR.
Cui, Y., 2007. The Unified Gravel-Sand (TUGS) Model: simulating sediment transport and gravel/sand grain size distributions in gravel-bedded rivers. Water Resources Research 43, W10436.

References
Chehalis River Flood Storage Dam April 2012 Fish Population Impact Study 86 100705-01.01
EES Consulting, 2011. Chehalis River Flood Water Storage Facilities Appendix B: Phase IIB Engineering Feasibility Studies Report. Final Submitted April 14, 2011
Entrix, 2009. Assessment of the December 2007 Flood Event in the Upper Chehalis Basin. Technical Memo prepared for Washington Forest Law Center, Seattle WA. September 14, 2009.
Faulkner, J.R., S.G. Smith, W.D. Muir, D.M. Marsh, J.G. Williams, 2009. Survival Estimates for the Passage of Spring-Migrating Juvenile Salmonids through Snake and Columbia River Dams and Reservoirs, 2008. Report by National Marine Fisheries Service to the U.S. Department of Energy, Bonneville Power Administration, Division of Fish and Wildlife, Seattle, Washington, Contract 40735, Project No. 199302900, 110 p.
Faulkner, J. R., S. G. Smith, W. D. Muir, D. M. Marsh, and J. G. Williams, 2010. Survival estimates for the passage of spring-migrating juvenile salmonids through Snake and Columbia River dams and reservoirs, 2009. Report of the National Marine Fisheries Service to the Bonneville Power Administration, Portland, Oregon.
Glancy, P.A., 1971. Sediment Transport by Streams in the Chehalis River Basin, Washington, October 1961 to September 1965. USGS Water-Supply Paper 1798-H.
Green, J., D. Loft, and R. Lehr, 2009. State-of-the-river Report for the Chehalis River Basin, 2006-2009, A Water Quality Study, Grays Harbor College, Aberdeen, WA. Available at: http://www.chehalisbasinpartnership.org/technical/State-of-the-River%20JAG%2010-11-09.pdf.
Jennings, K., and P. Pickett, 2000. Revised Upper Chehalis River Basin Dissolved Oxygen Total Maximum Daily Load. Washington State Department of Ecology Publication Number 00-10-018. March 2000. Available at: http://www.ecy.wa.gov/pubs/0010018.pdf.
Meyer-Peter, E., and R. Müller, 1948. Formulas for bed-load transport. Proceedings, 2nd Congress International Association for Hydraulic Research. Stockholm, Sweden: 39-64.
NHC, 2009. DRAFT – Hydrology Development for HEC-RAS Modeling of the Chehalis River. June 2009.

References
Chehalis River Flood Storage Dam April 2012 Fish Population Impact Study 87 100705-01.01
Pratt, K., and D. Chapman, 1989. Progress toward the run doubling goal of the Northwest Power Planning Council. Don Chapman Consultants, Inc., Boise, ID. Report to: Pacific Northwest Utilities Conference Committee, Portland, OR.
Reid, L.M. and T. Dunne, 1996. Rapid Evaluation of Sediment Budgets. Catena Verlag GMBH:Reiskirchen. 164 pp.
Sarikhan, I.Y., K.D Stranton, T.A. Contreras, M. Polenz, J. Powell, T.J. Walsh, and R.L. Logan, 2008. Landslide Reconnaissance Following the Storm Event of December 1-3, 2007, in Western Washington. Washington DNR Open File Report 2008-5. November 2008.
Scheuerell, M.D., R. Hilborn, M.H. Ruckelshaus, K.K. Bartz, K.M. Lagueux, A.D. Haas, K. Rawson, 2006. The SHIRAZ model: a tool for incorporating anthropogenic effects and fish-habitat relationships in conservation planning. Canadian Journal of Fisheries and Aquatic Science 63, 1596-1607.
Serl , J.D. and C. Morrill, 2009. Draft Data Summary for the 2009 Operation of the Cowlitz Falls Fish Facility and Related Activities. Prepared for U.S. Department of Energy, Bonneville Power Administration. December 31, 2009.
Serl, J.D. and D. Heimbigner, 2011. Data Summary for the 2010 Operation of the Cowlitz Falls Fish Facility and Related Activities. Prepared for U.S. Department of Energy, Bonneville Power Administration. June 15, 2011.
Serl and Heimbigner, unpubl. data. In preparation Draft Data Summary for the 2011 Operation of the Cowlitz Falls Fish Facility and Related Activities. Prepared for U.S. Department of Energy, Bonneville Power Administration. June 15, 2011.
Unattributed, 2008. Workshop to Investigate Solutions for Smolt Collection at or near Cowlitz Falls Dam. Background Information. Workshop March 3 and 4, 2008. Document dated February 8, 2008. 15 pp.
USFWS (U.S. Fish and Wildlife Service), 1980. Habitat Evaluation Procedures. ESM 102. Division of Ecological Services, U.S. Department of the Interior. Washington , D.C.
USGS (U.S. Geological Survey), 2001. The National Flood-Frequency Program – Methods for Estimating Flood Magnitude and Frequency in Washington. USGS Fact Sheet 016-01. March 2001.

References
Chehalis River Flood Storage Dam April 2012 Fish Population Impact Study 88 100705-01.01
WDFW, 2002. Salmon and Steelhead Stock Inventory. http://wdfw.wa.gov/webmaps/ salmonscape/sasi/full_stock_rpts/1432.pdf, Olympia, Washington.
WDFW, 2004. Instream Flow Study Guidelines: Technical and Habitat Suitability Issues including fish preference curves UPDATED, April 05, 2004 (Updated HSC provided by Jim Pacheco, WDOE 5/9/2011).
Weather Underground, 2011. Data downloaded for Chehalis-Centralia, WA from Weather station located at Salzer Valley Road, Centralia, WA, accessed March 2011 at URL: http://www.wunderground.com/weatherstation/WXDailyHistory.asp?ID=KWACENTR3&graphspan=custom&month=4&day=1&year=2010&monthend=3&dayend=21&yearend=2011
Weyerhaeuser, 1994a. Chehalis Headwaters Watershed Analysis. July 1994.
Weyerhaeuser, 1994b. Stillman Creek Headwaters Watershed Analysis. September 1994.
Wilcock, P.R., 2001. Toward a practical method for estimating sediment-transport rates in gravel-bed rivers. Earth Surface Processes and Landforms 26(13): 1395-1408.
Wilcock, P.R., and J.C. Crowe, 2003. Surface-based transport model for mixed-size sediment. Journal of Hydraulic Engineering 129(2): 120-128.
Wong, M., and G. Parker, 2006. Reanalysis and correction of bed-load relation of Meyer-Peter and Müller using their own database. Journal of Hydraulic Engineering 132(11): 1159-1168.

APPENDIX A HYDROLOGIC AND HYDRAULIC MODELING REPORT

APPENDIX B GEOMORPHOLOGY/SEDIMENT TRANSPORT/LARGE WOODY DEBRIS REPORT

APPENDIX C WATER QUALITY EVALUATIONS

APPENDIX D FISH HABITAT SURVEY USING PHYSICAL HABITAT SIMULATION INSTREAM FLOW STUDY TECHNIQUES

APPENDIX E FISH HABITAT SURVEY OF UPPER WATERSHED USING HABITAT EVALUATION PROCEDURES

APPENDIX F FISH POPULATION MODEL