chehalis river basin flood authority
TRANSCRIPT
Chehalis River Basin Flood Authority
Prepared by:
570 Kirkland Way, Suite 200 Kirkland, Washington 98033
A registered professional engineering corporation with offices in Kirkland, WA; Bellingham, WA; and Portland, OR
Telephone: (425) 889‐2700 Facsimile: (425) 889‐2725
Chehalis River Flood Water Retention ProjectPhase IIB Feasibility Study
Draft Submitted to Chehalis River Basin Flood Authority for Review
Original Draft Submitted November 10, 2010Revised and Final Submitted April 14, 2011
Imperial Irrigation District
570 Kirkland Way, Suite 200 Kirkland, Washington 98033 Telephone: 425 889-2700 Facsimile: 425 889-2725 A registered professional engineering corporation with offices in Kirkland, WA; Portland, OR; and Bellingham, WA
April 14, 2011
Mr. Bruce Mackey ESA Adolfson 1222 State Avenue, NE Suite 202 Olympia, Washington 98506
SUBJECT: Chehalis River Flood Water Retention Project - Phase IIB Feasibility Study
Dear Mr. Mackey:
Please find attached a revised and final report for the Chehalis River Flood Water Retention Project Phase IIB Feasibility Study prepared by EES Consulting. We would like to acknowledge and thank you for your contribution to this study. In addition, we would like to recognize Shannon & Wilson, Inc. for their review of engineering costs and design concepts, Northwest Hydraulic Consultants for contributing flood depth data, and the U.S. Army Corps of Engineers for engaging with us on the economic methodology. Finally, we appreciate all the comments we received after we circulated the original draft.
Please contact me directly if there are any questions regarding this final report.
Very truly yours,
Gary Saleba President
cc: Dave Muller, Lewis County PUD
Imperial Irrigation District
CHEHALIS RIVER BASIN FLOOD AUTHORITY—WATER RETENTION PROJECT PHASE IIB FEASIBILITY STUDY i
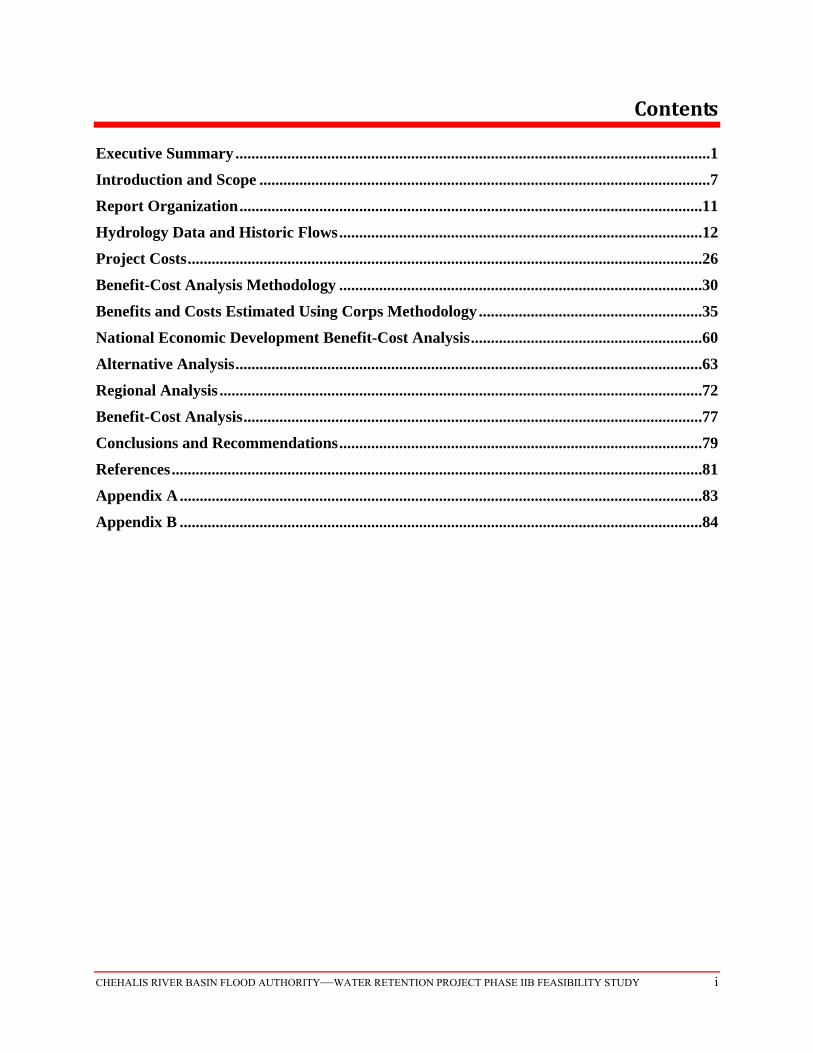
Contents
Executive Summary .......................................................................................................................1
Introduction and Scope .................................................................................................................7
Report Organization ....................................................................................................................11
Hydrology Data and Historic Flows ...........................................................................................12
Project Costs .................................................................................................................................26
Benefit-Cost Analysis Methodology ...........................................................................................30
Benefits and Costs Estimated Using Corps Methodology ........................................................35
National Economic Development Benefit-Cost Analysis ..........................................................60
Alternative Analysis .....................................................................................................................63
Regional Analysis .........................................................................................................................72
Benefit-Cost Analysis ...................................................................................................................77
Conclusions and Recommendations ...........................................................................................79
References .....................................................................................................................................81
Appendix A ...................................................................................................................................83
Appendix B ...................................................................................................................................84
Imperial Irrigation District
CHEHALIS RIVER BASIN FLOOD AUTHORITY—WATER RETENTION PROJECT PHASE IIB FEASIBILITY STUDY ii
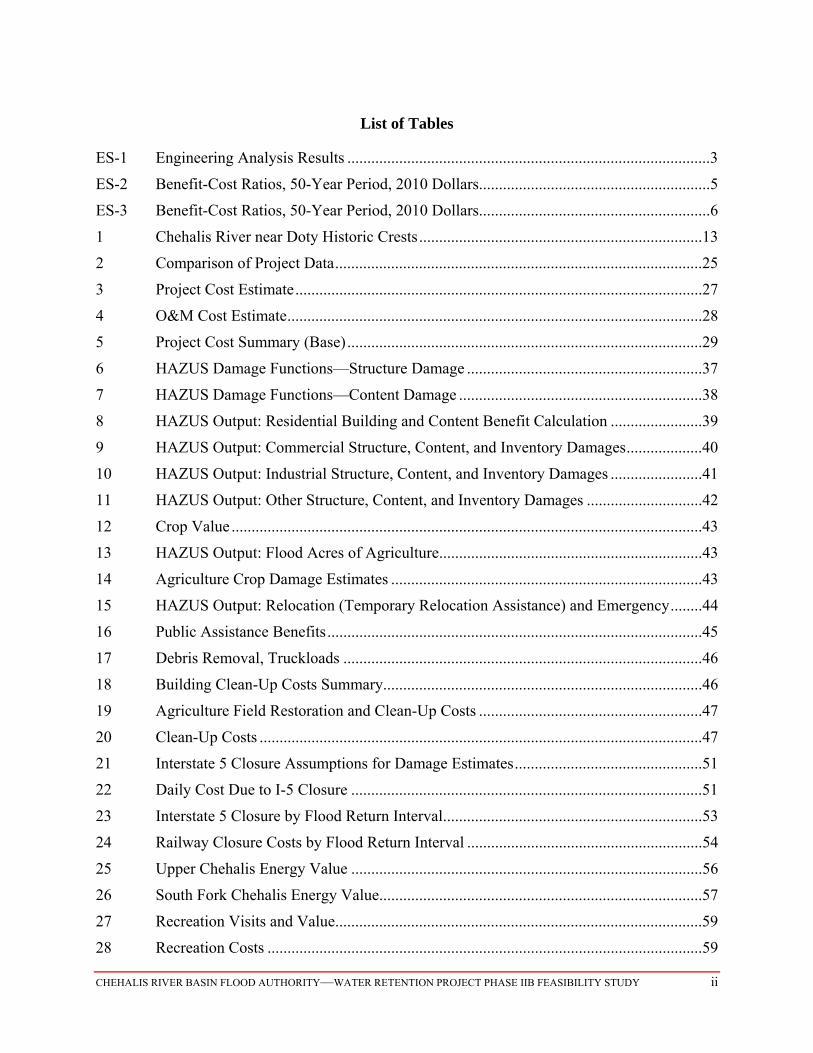
List of Tables
ES-1 Engineering Analysis Results ...........................................................................................3
ES-2 Benefit-Cost Ratios, 50-Year Period, 2010 Dollars..........................................................5
ES-3 Benefit-Cost Ratios, 50-Year Period, 2010 Dollars..........................................................6
1 Chehalis River near Doty Historic Crests .......................................................................13
2 Comparison of Project Data ............................................................................................25
3 Project Cost Estimate ......................................................................................................27
4 O&M Cost Estimate ........................................................................................................28
5 Project Cost Summary (Base) .........................................................................................29
6 HAZUS Damage Functions—Structure Damage ...........................................................37
7 HAZUS Damage Functions—Content Damage .............................................................38
8 HAZUS Output: Residential Building and Content Benefit Calculation .......................39
9 HAZUS Output: Commercial Structure, Content, and Inventory Damages ...................40
10 HAZUS Output: Industrial Structure, Content, and Inventory Damages .......................41
11 HAZUS Output: Other Structure, Content, and Inventory Damages .............................42
12 Crop Value ......................................................................................................................43
13 HAZUS Output: Flood Acres of Agriculture ..................................................................43
14 Agriculture Crop Damage Estimates ..............................................................................43
15 HAZUS Output: Relocation (Temporary Relocation Assistance) and Emergency ........44
16 Public Assistance Benefits ..............................................................................................45
17 Debris Removal, Truckloads ..........................................................................................46
18 Building Clean-Up Costs Summary................................................................................46
19 Agriculture Field Restoration and Clean-Up Costs ........................................................47
20 Clean-Up Costs ...............................................................................................................47
21 Interstate 5 Closure Assumptions for Damage Estimates ...............................................51
22 Daily Cost Due to I-5 Closure ........................................................................................51
23 Interstate 5 Closure by Flood Return Interval .................................................................53
24 Railway Closure Costs by Flood Return Interval ...........................................................54
25 Upper Chehalis Energy Value ........................................................................................56
26 South Fork Chehalis Energy Value.................................................................................57
27 Recreation Visits and Value ............................................................................................59
28 Recreation Costs .............................................................................................................59
CHEHALIS RIVER BASIN FLOOD AUTHORITY—FLOOD WATER RETENTION PROJECT PHASE IIB FEASIBILITY STUDY iii
29 Avoided Damages ...........................................................................................................61
30 Multi-Purpose Project Benefits .......................................................................................61
31 NED Benefit-Cost Ratios ................................................................................................62
32 Ecosystem Values for the Chehalis River Basin .............................................................66
33 Annual Reservoir Value ..................................................................................................67
34 Upper Chehalis Wetland Added Annual Benefits ..........................................................70
35 South Fork Chehalis Wetland Added Annual Benefit ....................................................70
36 Alternative Benefit-Cost Analysis Project Benefits .......................................................71
37 Alternative Benefit-Cost Ratios ......................................................................................71
38 Now-Dry Buildings in with Project Cases ......................................................................72
39 Annual Flood Insurance Premiums .................................................................................73
40 Total Property Value Increase ........................................................................................73
41 HAZUS Output: Regional Economic Loss .....................................................................74
42 Households Affected .......................................................................................................75
43 Intrinsic Value, Year 1 ....................................................................................................75
44 Regional Benefits ............................................................................................................76
45 Regional Benefit-Cost Ratios .........................................................................................76
46 Benefit-Cost Ratios, 50-Year Period ..............................................................................77
47 Benefit-Cost Ratios with Low, Base, and High Construction Costs ..............................78
CHEHALIS RIVER BASIN FLOOD AUTHORITY—FLOOD WATER RETENTION PROJECT PHASE IIB FEASIBILITY STUDY iv
List of Figures
1 Upper Chehalis near Doty-Long Term Daily Average Flows ........................................13
2 Chehalis River near Doty Historic Gage Height .............................................................14
3 South Fork Chehalis near Wildwood-Daily Average Flows 1999 to 2005 ....................15
4 Project Map Location ......................................................................................................17
5 Map of Proposed Flood Water Retention Sites ...............................................................18
6 Freeboard Concept ..........................................................................................................19
7 Structure Height and Flood Storage ................................................................................20
8 Multi-Purpose Structure Height ......................................................................................22
9 Example Damage Curve .................................................................................................31
10 Example of Reduction in Damage Curve .......................................................................31
11 Flood Elevations and Levee Elevations near Chehalis Airport ......................................49
12 I-5 Truck Detour Routes .................................................................................................52
13 State Park Annual Visitation, Lewis County ..................................................................58
14 Example of Reduction in Damage Curve .......................................................................60
15 Reservoir Location and Forest Succesional Stages ........................................................65
16 Flood Reduction Only Project Benefit-Cost Ratio with Low, Base and High .................. Construction Costs ..........................................................................................................79
Imperial Irrigation District
CHEHALIS RIVER BASIN FLOOD AUTHORITY—FLOOD WATER RETENTION PROJECT PHASE IIB FEASIBILITY STUDY 1
ExecutiveSummary
Introduction
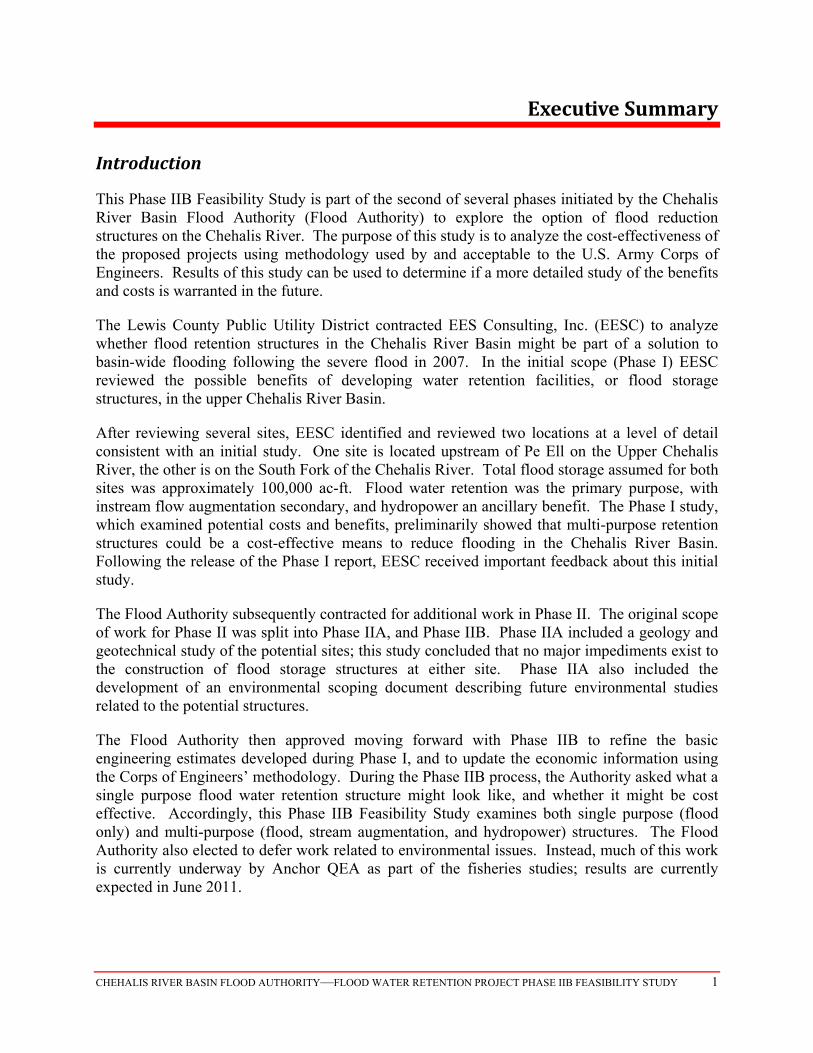
This Phase IIB Feasibility Study is part of the second of several phases initiated by the Chehalis River Basin Flood Authority (Flood Authority) to explore the option of flood reduction structures on the Chehalis River. The purpose of this study is to analyze the cost-effectiveness of the proposed projects using methodology used by and acceptable to the U.S. Army Corps of Engineers. Results of this study can be used to determine if a more detailed study of the benefits and costs is warranted in the future.
The Lewis County Public Utility District contracted EES Consulting, Inc. (EESC) to analyze whether flood retention structures in the Chehalis River Basin might be part of a solution to basin-wide flooding following the severe flood in 2007. In the initial scope (Phase I) EESC reviewed the possible benefits of developing water retention facilities, or flood storage structures, in the upper Chehalis River Basin.
After reviewing several sites, EESC identified and reviewed two locations at a level of detail consistent with an initial study. One site is located upstream of Pe Ell on the Upper Chehalis River, the other is on the South Fork of the Chehalis River. Total flood storage assumed for both sites was approximately 100,000 ac-ft. Flood water retention was the primary purpose, with instream flow augmentation secondary, and hydropower an ancillary benefit. The Phase I study, which examined potential costs and benefits, preliminarily showed that multi-purpose retention structures could be a cost-effective means to reduce flooding in the Chehalis River Basin. Following the release of the Phase I report, EESC received important feedback about this initial study.
The Flood Authority subsequently contracted for additional work in Phase II. The original scope of work for Phase II was split into Phase IIA, and Phase IIB. Phase IIA included a geology and geotechnical study of the potential sites; this study concluded that no major impediments exist to the construction of flood storage structures at either site. Phase IIA also included the development of an environmental scoping document describing future environmental studies related to the potential structures.
The Flood Authority then approved moving forward with Phase IIB to refine the basic engineering estimates developed during Phase I, and to update the economic information using the Corps of Engineers’ methodology. During the Phase IIB process, the Authority asked what a single purpose flood water retention structure might look like, and whether it might be cost effective. Accordingly, this Phase IIB Feasibility Study examines both single purpose (flood only) and multi-purpose (flood, stream augmentation, and hydropower) structures. The Flood Authority also elected to defer work related to environmental issues. Instead, much of this work is currently underway by Anchor QEA as part of the fisheries studies; results are currently expected in June 2011.
CHEHALIS RIVER BASIN FLOOD AUTHORITY—FLOOD WATER RETENTION PROJECT PHASE IIB FEASIBILITY STUDY 2
PhaseIIBIncorporatesCommentsandFeedbackfromPhaseI
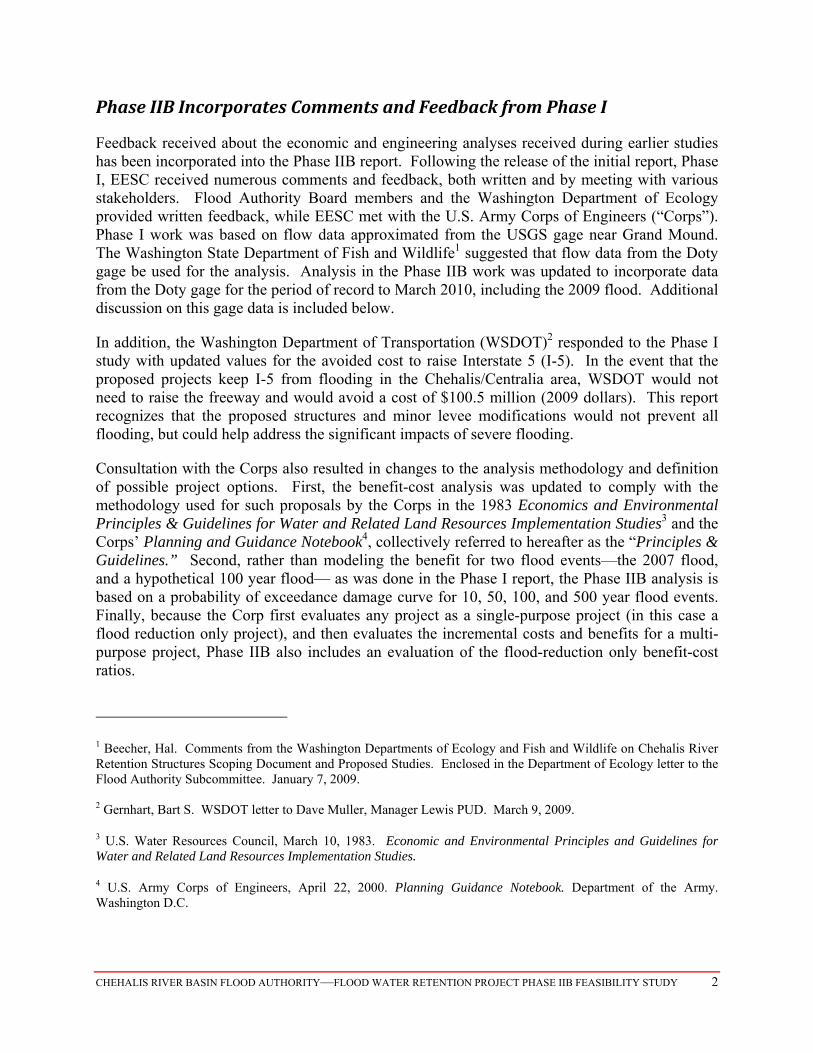
Feedback received about the economic and engineering analyses received during earlier studies has been incorporated into the Phase IIB report. Following the release of the initial report, Phase I, EESC received numerous comments and feedback, both written and by meeting with various stakeholders. Flood Authority Board members and the Washington Department of Ecology provided written feedback, while EESC met with the U.S. Army Corps of Engineers (“Corps”). Phase I work was based on flow data approximated from the USGS gage near Grand Mound. The Washington State Department of Fish and Wildlife1 suggested that flow data from the Doty gage be used for the analysis. Analysis in the Phase IIB work was updated to incorporate data from the Doty gage for the period of record to March 2010, including the 2009 flood. Additional discussion on this gage data is included below.
In addition, the Washington Department of Transportation (WSDOT)2 responded to the Phase I study with updated values for the avoided cost to raise Interstate 5 (I-5). In the event that the proposed projects keep I-5 from flooding in the Chehalis/Centralia area, WSDOT would not need to raise the freeway and would avoid a cost of $100.5 million (2009 dollars). This report recognizes that the proposed structures and minor levee modifications would not prevent all flooding, but could help address the significant impacts of severe flooding.
Consultation with the Corps also resulted in changes to the analysis methodology and definition of possible project options. First, the benefit-cost analysis was updated to comply with the methodology used for such proposals by the Corps in the 1983 Economics and Environmental Principles & Guidelines for Water and Related Land Resources Implementation Studies3 and the Corps’ Planning and Guidance Notebook4, collectively referred to hereafter as the “Principles & Guidelines.” Second, rather than modeling the benefit for two flood events—the 2007 flood, and a hypothetical 100 year flood— as was done in the Phase I report, the Phase IIB analysis is based on a probability of exceedance damage curve for 10, 50, 100, and 500 year flood events. Finally, because the Corp first evaluates any project as a single-purpose project (in this case a flood reduction only project), and then evaluates the incremental costs and benefits for a multi-purpose project, Phase IIB also includes an evaluation of the flood-reduction only benefit-cost ratios.
1 Beecher, Hal. Comments from the Washington Departments of Ecology and Fish and Wildlife on Chehalis River Retention Structures Scoping Document and Proposed Studies. Enclosed in the Department of Ecology letter to the Flood Authority Subcommittee. January 7, 2009. 2 Gernhart, Bart S. WSDOT letter to Dave Muller, Manager Lewis PUD. March 9, 2009.
3 U.S. Water Resources Council, March 10, 1983. Economic and Environmental Principles and Guidelines for Water and Related Land Resources Implementation Studies.
4 U.S. Army Corps of Engineers, April 22, 2000. Planning Guidance Notebook. Department of the Army. Washington D.C.
CHEHALIS RIVER BASIN FLOOD AUTHORITY—FLOOD WATER RETENTION PROJECT PHASE IIB FEASIBILITY STUDY 3
Comments related to the potential environmental and fisheries impacts have been given to Anchor QEA as part of the on-going Chehalis River fish study.
AssumptionsIncorporatedintoPhaseIIB
There are several basic assumptions used throughout the Phase IIB study, including the following:
The development of any large scale project is an iterative process. While the Phase IIB study provides additional information, it also indicates the needs for additional study and design work. Cost estimates will be updated as more detailed information is available.
The Phase IIB Study focuses on using the U.S. Army Corps of Engineers methodology. This methodology generally does not monetize environmental benefits or costs.
Because hydraulic modeling is not available downstream of the gage at Grand Mound (RM
59.9 near the Lewis/Thurston County border), this analysis does not include costs and benefits to Thurston and Grays Harbor County.
Because there is an on-going study by Anchor QEA about potential impacts to fisheries, the
figures included for fish mitigation are provided as a place holder. The results of these studies, plus potential opportunities for mitigation, will need to be examined further.
Detailed environmental work through the NEPA/SEPA permitting process will be necessary
to build this kind of project; this will provide significantly more detailed information.
PhaseIIBStudyResults
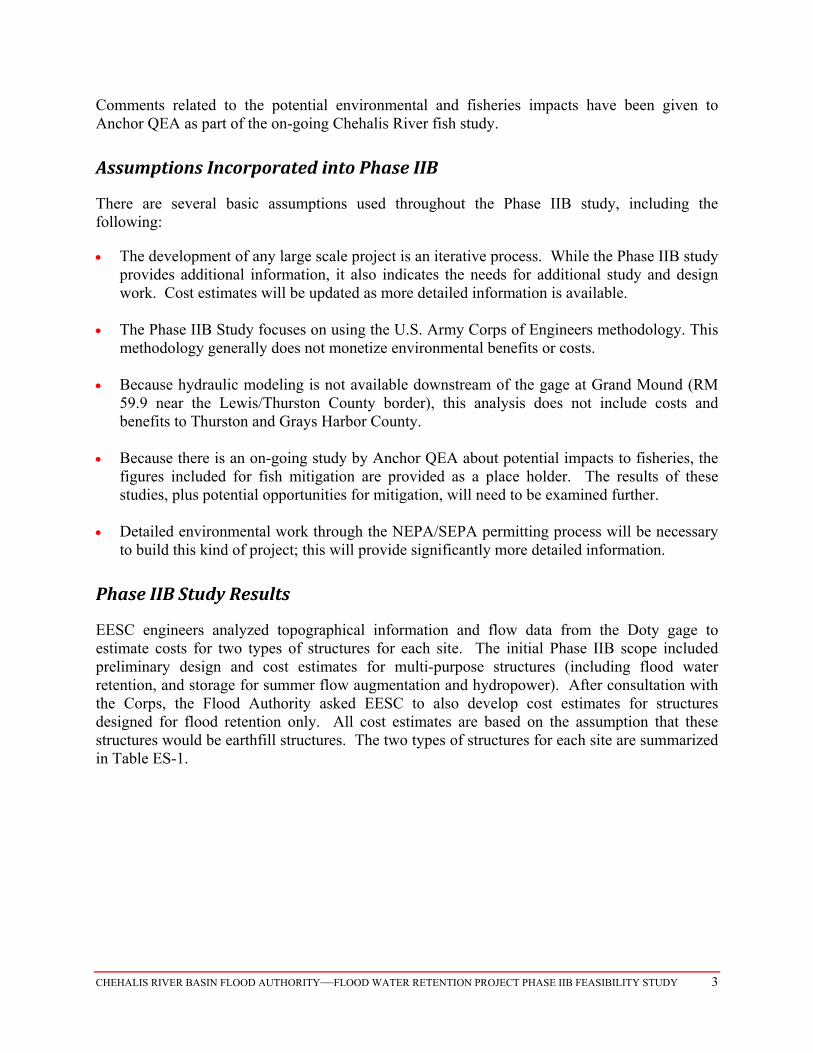
EESC engineers analyzed topographical information and flow data from the Doty gage to estimate costs for two types of structures for each site. The initial Phase IIB scope included preliminary design and cost estimates for multi-purpose structures (including flood water retention, and storage for summer flow augmentation and hydropower). After consultation with the Corps, the Flood Authority asked EESC to also develop cost estimates for structures designed for flood retention only. All cost estimates are based on the assumption that these structures would be earthfill structures. The two types of structures for each site are summarized in Table ES-1.
CHEHALIS RIVER BASIN FLOOD AUTHORITY—FLOOD WATER RETENTION PROJECT PHASE IIB FEASIBILITY STUDY 4
Table ES-1 Engineering Analysis Results
Upper Chehalis South Fork Flood Reduction Multi-Purpose Flood Reduction Multi-Purpose
Flood Storage, ac-ft 80,000 80,000 20,000 20,000
Flow Augmentation Hydropower Storage, ac-ft
NA 65,000 NA 13,500
Structural Height, ft 238 288 170 200 Construction Cost5 $165,230,000 $245,060,000 $93,060,000 $148,540,000
The flood reduction structures are free-flowing and would operate such that natural flows are not affected except during and immediately following a flood event. A free-flowing structure, as defined in this report, is one that passes river flows without interrupting those flows or changing their timing or quantity, except for short periods during and subsequent flood events. The single-purpose structures are defined as free-flowing, since, under normal conditions, they do not interfere with natural river flows. When a flood event occurs, flood waters would be retained and stored until the event subsided and they could be safely released in a controlled manner.
The multi-purpose structures store water so that releases in the summer months are greater than natural flows. The multi-purpose structures have intake towers located in the reservoirs so that water can be released from varying depths, offering the potential to take advantage of the typical pattern in temperature-stratified lakes, where sub-surface waters are typically cooler than water in the uppermost layers. Accordingly, flow augmentation in the summer months may be managed to yield lower in-stream water temperatures in the reaches below the structure(s).
As a safety requirement, both the single-purpose and the multi-purpose structures have uncontrolled spillways so that the structures are not overtopped.
Phase IIB also included an update on the economic benefits, and calculation of the resulting benefit/cost analysis. This analysis incorporates substantial feedback received following the Phase I report, and is based on the Corps’ Principles & Guidelines documents and the HAZUS model developed and used by the Federal Emergency Management Administration (“FEMA”).
Three benefit-cost ratios are provided for each proposed water retention structure option. First, the National Benefit-Cost Analysis is provided. These benefit-cost ratios are developed using the Principles & Guidelines methodology used by the Corps.6 Second, an Alternative Benefit-Cost Analysis added monetized environmental benefits to each project. Finally, regional benefits
5 The costs in lists construction costs in 2010 dollars, while Table ES-2 lists 50 year total cost of the project on a NPV basis. Costs will be updated as further information is available.
6 The Corps’ Principles & Guidance methodology does not consider social and environmental costs and benefits.
CHEHALIS RIVER BASIN FLOOD AUTHORITY—FLOOD WATER RETENTION PROJECT PHASE IIB FEASIBILITY STUDY 5
and costs were added for a Regional Benefit-Cost Analysis. The Regional Analysis also included the monetized environmental benefits.
The avoided costs of flooding for each structure were calculated by determining flood damages in the without-project and with-project cases. The Corps’ 2003 report7 provided the basis for methodology and source for data used to calculate avoided costs, such as clean-up costs, damages to agriculture crops and avoided transportation costs. The expected annual avoided damage is calculated using the probability of exceedance methodology used by the Corps.
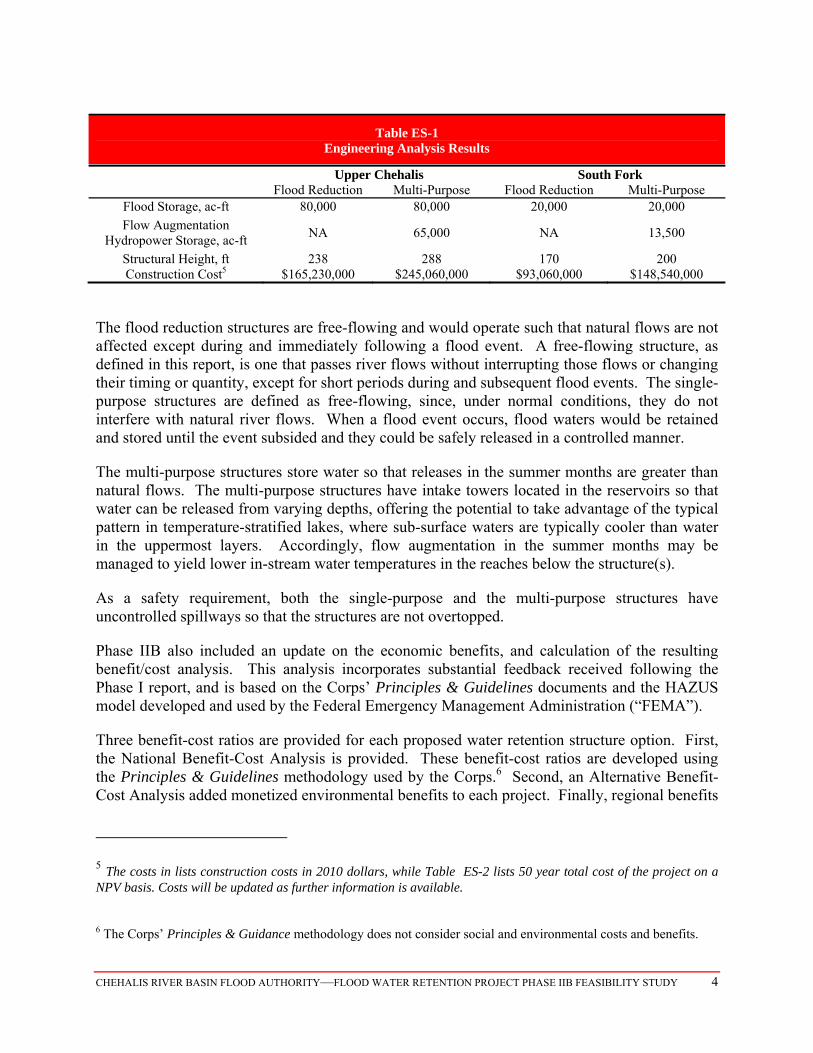
Costs and benefits were then analyzed over a 50-year period. The net present value of these costs and benefits were compared to evaluate project cost-effectiveness. Benefit-cost ratios of 1 or greater are considered cost-effective. Table ES-2 shows the National Economic Development benefit-cost analysis results. The costs in Table ES-2 include construction, financing operation and maintenance costs on a net present value (NPV) basis.
Table ES-2 Benefit-Cost Ratios, 50-Year Period, 2010 Dollars
Benefit Cost Benefit-Cost Ratio
Flood Reduction Project
Upper Chehalis $235,318,195 $206,766,205 1.14
South Fork $70,425,166 $105,352,985 0.67
Both Projects $274,267,210 $312,119,190 0.88
Multi-Purpose Project
Upper Chehalis $334,439,952 $296,479,010 1.13
South Fork $90,058,967 $162,338,251 0.55
Both Projects $387,408,239 $458,817,261 0.84
The studies conducted to date are high level reconnaissance studies. Because hydraulic modeling does not yet exist for Thurston and Grays Harbor County, these results provide the benefits for Lewis County only. If the Flood Authority decided to proceed with any of the project options, more detailed engineering and geotechnical work and economic analysis would be required to refine these results and update the benefit/cost ratio. Additional hydraulic modeling in both Thurston and Grays Harbor County would also be helpful. In addition, the environmental studies contracted by the Flood Authority have not yet been finalized. These studies will provide important information that will need to be incorporated into the analysis. Project permitting, environmental assessment under SEPA/NEPA, the Endangered Species Act, and other relevant statutes and regulations would also be required in future development phases.
7 U.S. Army Corps of Engineers, June 2003. Centralia Flood Damage Reduction Project Chehalis River, Washington. Final General Reevalutation Report. Appendix D: Economics. Department of the Army. Washington D.C.
CHEHALIS RIVER BASIN FLOOD AUTHORITY—FLOOD WATER RETENTION PROJECT PHASE IIB FEASIBILITY STUDY 6
ConclusionsandRecommendations
The benefit-cost analysis completed using the Corps’ Methodology indicated that the Upper Chehalis project may be cost-effective as a flood reduction project or multi-purpose project.8 The South Fork Chehalis benefit-cost ratios are not favorable.
The Phase IIB economic analysis included several benefits and costs analyzed according to Corps’ methodology. The scope of this study included analysis of costs and benefits of the projects following two additional benefit-cost constructs: the Alternate Analysis, and Regional Analysis. These additional benefits might be attributable to the projects, but information regarding these benefits needs further refinement beyond the scope of this study.
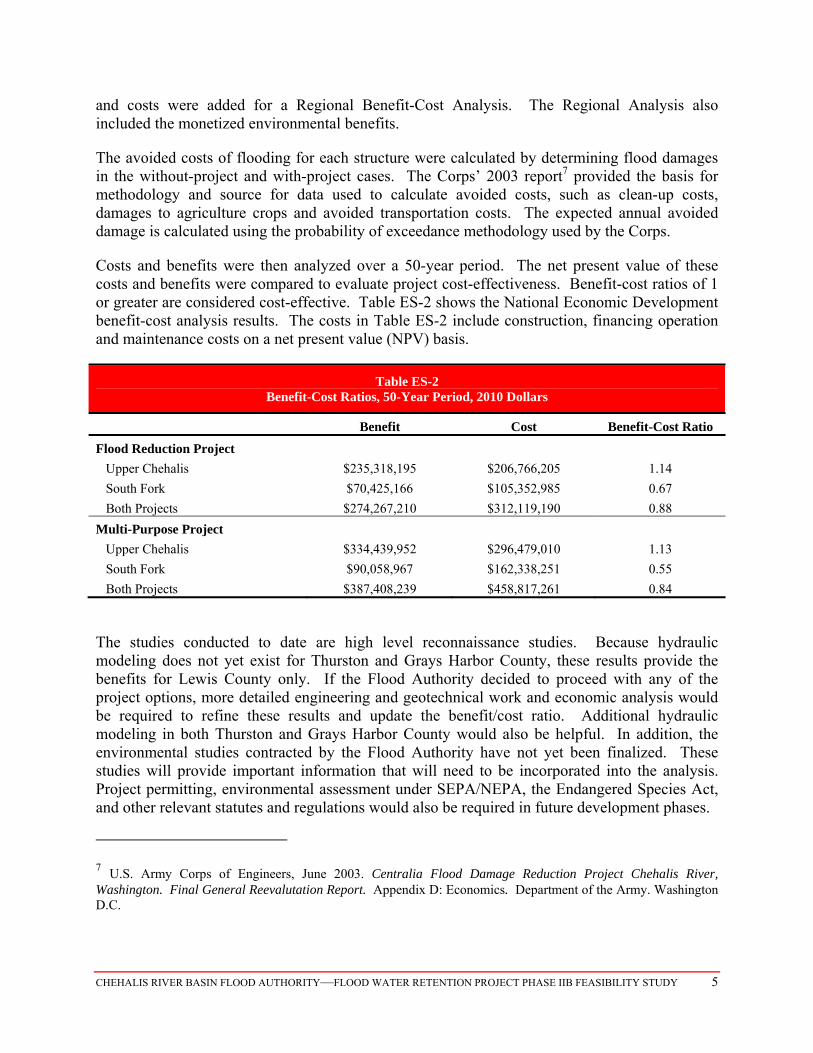
Table ES-3 summarizes the benefits and costs in NPV over a 50-year planning period.
Table ES-3 Benefit-Cost Ratios, 50-Year Period
2010 Dollars
Benefit Cost Benefit-Cost Ratio
Upper Chehalis
Flood Reduction (NED) $235,318,195 $206,766,205 1.14
Multi-Purpose (NED) $334,439,952 $296,479,010 1.13
Alternative $361,795,889 $296,479,010 1.22
Regional $372,188,297 $296,479,010 1.26
South Fork Benefit Cost Benefit/Cost Ratio
Flood Reduction (NED) $70,425,166 $105,352,985 0.67
Multi-Purpose (NED) $90,058,967 $162,338,251 0.55
Alternative $98,922,722 $162,338,251 0.61
Regional $101,459,404 $162,338,251 0.62
Both Projects Benefit Cost Benefit/Cost Ratio
Flood Reduction (NED) $274,267,210 $312,119,190 0.88
Multi-Purpose (NED) $387,408,239 $458,817,261 0.84
Alternative $423,627,932 $458,817,261 0.92
Regional $437,225,878 $458,817,261 0.95
Note: only the Multi-Purpose stuctures are considered under the “Alternative” and “Regional” cases because the multi-purpose structures provide potential additional benefits that can be examined.
8 This conclusion is based on the analysis using the Corps’ methodology, the best available data accessible to the authors, and the assumptions made, with allowances made for contingencies.
CHEHALIS RIVER BASIN FLOOD AUTHORITY—FLOOD WATER RETENTION PROJECT PHASE IIB FEASIBILITY STUDY 7
IntroductionandScope
In 2009, the Chehalis River Basin Flood Authority (Flood Authority) contracted EES Consulting, Inc. (EESC) to evaluate the feasibility of flood retention structures in the Chehalis River Basin. The feasibility studies have been conducted in phases, each building on the information developed and conclusions from the previous phases.
The purpose and scope of work for Phase I of the feasibility studies was to assess the possible benefits of developing water retention facilities, or flood reduction structures, in Lewis County, primarily the Chehalis River Basin. In particular, two sites were chosen to be reviewed at a level of detail consistent with a conceptual level study. One site is located upstream of Pe Ell on the Upper Chehalis River, the other is on the South Fork of the Chehalis River.9 Total estimated flood storage for both sites is approximately 100,000 ac-ft. The Phase I study analysis showed that retention structures at these sites could provide a cost-effective means to reduce the frequency, severity, and associated impacts of flooding in the Chehalis River Basin.
The scope of work for Phase IIA of the feasibility studies included a geotechnical study, which concluded that no geotechnical impediments exist to the construction of water retention facilities at either site. In response to community interest, the Flood Authority contracted EESC to refine the economic and engineering estimates developed during Phase I.
The scope of work for these Phase IIB economic and engineering analyses is described in detail below.
ScopeofPhaseIIB
Phase IIB includes two sets of analyses: further development of the engineering concepts, and an updated and refined economic analysis based on feedback received in Phase I.
The Phase IIB Feasibility Study is one component of the second phase of preliminary studies initiated by the Flood Authority to explore options for constructing flood reduction structures on the Chehalis River. After an initial study examined several sites, continued study has focused on two locations: one site located upstream of Pe Ell on the Upper Chehalis River, and a second site on the South Fork of the Chehalis River. The purpose of this Phase IIB Feasibility Study is to further examine the cost-effectiveness of the proposed projects. The results of the Phase IIB study may be used to determine if other studies should be conducted and if a more detailed study of the benefits and costs of the projects is warranted.
9 Phase I of the analysis considered flood storage structure locations on the Newaukum River as well as the Upper Chehalis and South Fork Chehalis. The Newaukum River locations did not provide significant storage opportunities. The proposed sites at the Upper Chehalis and South Fork Chehalis were selected based on favorable topography as well as maximum drainage area.
CHEHALIS RIVER BASIN FLOOD AUTHORITY—FLOOD WATER RETENTION PROJECT PHASE IIB FEASIBILITY STUDY 8
When the Phase IIB study began, the scope included preliminary design and cost estimates for two proposed multi-purpose structures. The multi-purpose structures would provide flood water retention, storage for summer flow augmentation, and hydropower. After consultation with the U.S. Army Corps of Engineers, the Flood Authority asked EESC to also develop cost estimates for structures designed for flood retention only (single-purpose structures). This Phase IIB report includes a refined analysis of potential configurations of structures at the two sites using the geology and geotechnical results of the Phase IIA studies. The Phase IIB Preliminary Feasibility study10 required conceptual drawings of the two proposed structures showing preferred location, cross-sections, and locations of outlet works and spillways. Once the conceptual drawings were developed, the scope required a refined estimate for construction costs for both single and multi-purpose structures. The multi-purpose structures were designed for flood water retention, to provide water storage for summer flow augmentation, and to allow the future addition of hydropower generation. These engineering cost estimates were then to be used as input to the benefit-cost analysis. The purpose of the Phase IIB economic analyses was to update the benefit-cost analysis according to methodology consistent with studies conducted by the Corps. The Phase IIB scope, therefore, included a benefit-cost analysis using the Corps’ Principles & Guidelines methodology.11 In addition to the Principles & Guidelines methodology, two other analyses were used to examine additional costs and benefits that are important to local, state, and regional interests; particularly the environmental value of the proposed facilities.12
Fisheries impacts are being evaluated in a Fish Study being conducted by Anchor QEA under separate contract; the results of this study are expected in June 2011.
Engineering Concept Development
The first part of Phase IIB included an update to the engineering and cost estimates of the proposed structures. During this work, the Flood Authority asked for analysis of both single purpose flood retention structures only, and multi-purpose structures as well. In Phase IIA of the feasibility studies, EESC and its subcontractor, Shannon & Wilson, characterized the site geology and geotechnical information at the foundations and abutments for the potential retention structures, developed soil and rock data to help guide conceptual design, and identified any potential geotechnical “fatal flaws” associated with the two proposed retention sites. The results of this work are presented in two reports written by Shannon & Wilson geotechnical consultants: a Geology Report13 and a Geotechnical Report.14 These studies
10 Part of the scope of the overall study; results included at Appendix B of the Phase IIB Feasibility Study. 11 See Notes 3 and 4, supra. 12 Source materials used in preparing this report are available upon request. 13 Shannon & Wilson. Geologic Reconnaissance Study Proposed Chehalis River and South Fork Dam Sites. Seattle, WA. October 27, 2009. 14 Shannon & Wilson. Reconnaissance-Level Geotechnical Report Proposed Chehalis River and South Fork Dam Sites. Seattle, Washington. October 28, 2009.
CHEHALIS RIVER BASIN FLOOD AUTHORITY—FLOOD WATER RETENTION PROJECT PHASE IIB FEASIBILITY STUDY 9
identified several issues at each potential site, but concluded that these issues could be effectively addressed during design and through engineering solutions. No fatal flaws, such as unsuitable foundations, or active earthquake faults under the potential sites, were identified. However, these conclusions will eventually need to be confirmed through sub-surface investigations, such as core drilling, and addressed with engineering solutions in a future scope of work if the Flood Authority or a successor entity decides to move aheadThis kind of field work was not included in the Phase IIB scope of work. Phase IIB includes a refined analysis of potential configurations of the two structures utilizing the geology and geotechnical results of the Phase IIA studies. The Phase IIB Preliminary Feasibility study report presents the conceptual drawings of the two proposed structures showing preferred location, cross-sections, and locations of outlet works and spillways. These conceptual drawings were then used to refine construction cost estimates for both single and multi-purpose structures. The single purpose structures are for the retention of flood waters only. The multi-purpose structures were designed for flood water retention, to provide water storage for summer flow augmentation, and to allow the future addition of hydropower generation if desired. These engineering cost estimates were then used as input to the benefit-cost analysis. Economic Analysis
The second part of Phase IIB includes updating the economic analysis in a manner that complies with Corps standards and uses new or additional information from the Corps and other stakeholders. The economic analysis performed in Phase I of the feasibility studies used available data to determine if the Chehalis River Water Retention project had economic viability. No additional work on the economic analysis was performed during Phase IIA. Phase IIB focused on updating the economic analysis with new or additional information and input from the U.S. Army Corps of Engineers and other stakeholders. After the Phase I benefit-cost study was circulated, several areas were identified for additional refinement. Consultation with the Corps during Phase I resulted in a plan for updating the benefit-cost analysis to be consistent with the methodology required by the Water Resources Development Act (WRDA) for federally funded projects. Specifically, the updated benefit-cost analysis conforms to the Principles & Guidelines methodology.
Restricted Scope of Study
Note that the analysis for this Phase IIB Feasibility Study was performed using methodologies and following the Principles & Guidelines methodology for national economic benefit-cost analyses and only considers a strictly defined set of parameters; not all conceivable topics were addressed nor all possible analyses performed. As befits its preliminary and limited nature, this feasibility study focused on direct economic costs and impacts at a relatively coarse level. In many cases, the analysis relied on assumptions and analogous situations on a “best available information” basis as opposed to targeted, independent study. Independent studies will be conducted as needed if the project moves forward.
CHEHALIS RIVER BASIN FLOOD AUTHORITY—FLOOD WATER RETENTION PROJECT PHASE IIB FEASIBILITY STUDY 10
Specifically, the Corps’ methodology does not include the monetization of environmental costs or benefits for inclusion in a cost-benefit analysis.15 Fisheries and related environmental impacts are being evaluated in a Fish Study being conducted by Anchor QEA under separate contract, which will consider the biological and ecological issues in more depth. It is to be expected that results from this focused Fish Study may produce outcomes concerning the economic costs of fisheries impacts and/or mitigation that differ from the estimates and assumptions used in this Phase IIB Feasibility Study; such results will be considered at the appropriate points in subsequent planning and decision-making. These issues will also be thoroughly addressed in the environmental review and permitting processes under NEPA and SEPA.
The purpose of this Phase IIB Feasibility Study is not to determine whether the project, or some variant thereof, should be built. It is meant instead to make a threshold determination whether further study is warranted and to help focus where such study is most likely to produce informative results.
15 The Corps’ methodology also does not consider such factors as cultural (tribal) hunting and fishing at this stage of analysis, treating them instead as “Other Social Effects” subject to evaluation and discussion at other points in the planning, permitting, and environmental review processes.
CHEHALIS RIVER BASIN FLOOD AUTHORITY—FLOOD WATER RETENTION PROJECT PHASE IIB FEASIBILITY STUDY 11
ReportOrganization
The remainder of the Phase IIB report is broken into four major pieces.
First, the report summarizes the site hydrology from the hydrological data obtained from the USGS.
Second, the report then provides updated cost information. This includes a summary of updated engineering concepts and designs, followed by project cost information. The full engineering report is included as an appendix to this report (Appendix B).
Third, the report incorporates the updated cost estimates into the economic analysis to update the benefit-cost ratios. The economic analysis is described in the following sections:
Benefit-Cost Methodology: Provides background on the economic analysis methodology used by the Corps and an alternative methodology used in select parts of the United States.
Benefits Estimated Using Corps Methodology: Follows the Corps methodology to monetize
benefits of flood reduction structures. National Economic Benefit-Cost Analysis: Focuses on only national benefits and costs as
prescribed by the Principles & Guidelines to complete an economic analysis. Alternative Analysis: Uses precedents from other parts of the country to monetize
environmental effects from the projects. Regional Analysis: Incorporates regional benefits to the benefit-cost analyses in the previous
sections. Benefit-Cost Analysis Summary: Compares all benefit-cost ratios in the report and varies
cost assumptions to test the robustness of results.
Finally, the report summarizes the overall findings and recommends further review and refinement.
CHEHALIS RIVER BASIN FLOOD AUTHORITY—FLOOD WATER RETENTION PROJECT PHASE IIB FEASIBILITY STUDY 12
HydrologyDataandHistoricFlows
This section describes the hydrology of the two sites and historic flows under flooding conditions based on available data. Northwest Hydraulic Consultants (“NHC”) used the full period of record, as presented below, to determine flood return intervals. The periods of record used in the computation of flood flow quantiles were different for different gages but all were extended to include the December 2007 flood event. For the updated work completed in 2010, NHC used flow data up through January 2009, including the December 2007 event.
UpperChehalisSite
Flow and Gage Height Characteristics
This report relies on data describing flows recorded at the U.S. Geological Survey (USGS) gage near Doty. The Doty gage is used for the Upper Chehalis site because it is the gage located closest to the site of the proposed structure. The use of this gage is different from the Phase I analysis, which relied on the gage near Grand Mound because the Doty gage was washed out in the 2007 flood. However, feedback received on the Phase I report indicated that the Doty gage would better describe the hydrology at the two sites.16 The analysis for the Phase IIB report therefore uses the Doty gage data, including the USGS estimate for the 2007 flood. Subsequent analyses as the proposed project moves toward the design stage may incorporate data from additional gage stations, including new information obtained from gages to be installed by West Consulting as part of the Early Warning System.
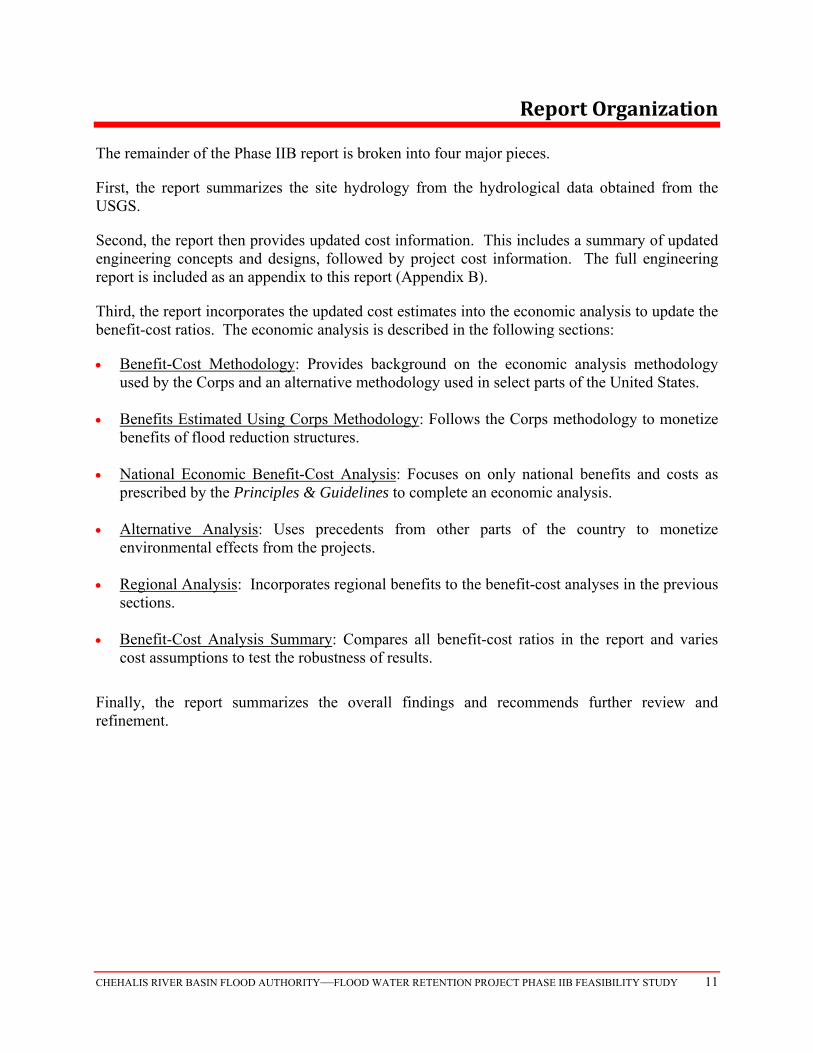
This section first describes historic average daily flow, followed by a description of historic crests and associated maximum flows.17 It should be noted that the drainage area for the gage near Doty is 113 square miles, whereas the drainage area at the proposed retention site is estimated at 68.8 square miles. Average daily flows from the Doty gage are illustrated in Figure 1. These long-term average daily flows are for the period of record from January 1940 to June 2008. Average daily flows are as low as 23 cfs in August and as high as 2,201 cfs in December.18
16 Beecher, Hal. Comments from the Washington Departments of Ecology and Fish and Wildlife on Chehalis River Retention Structures Scoping Document and Proposed Studies. Enclosed in the Department of Ecology letter to the Flood Authority Subcommittee. January 7, 2009.
17All flow data is from U.S. Geological Survey (USGS) information.
18 Maximum average daily flow likely influenced by December 2007 flood event. According to the USGS, estimated peak flows for this event are approximately 63,100 cfs.
CHEHALIS RIVER BASIN FLOOD AUTHORITY—FLOOD WATER RETENTION PROJECT PHASE IIB FEASIBILITY STUDY 13
Figure 1 Upper Chehalis near Doty - Long Term Daily Average Flows
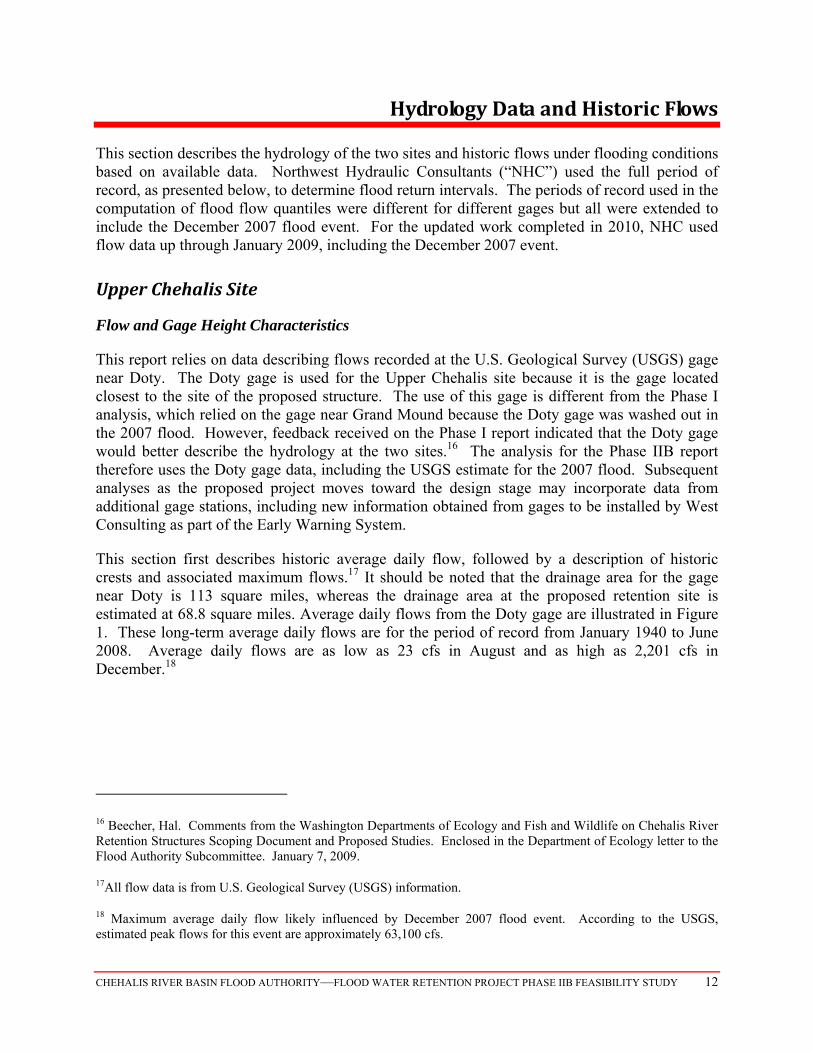
The National Oceanic and Atmospheric Administration (NOAA) makes river gage data available on the National Weather Service website. According to the Probabilistic Flow Forecast for the Doty chart, flood discharge begins at a rate of 12,988 cubic feet/second (cfs). This is a maximum weekly rate. NOAA defines the flood stage at 13 feet on the Doty gage. Table 1 illustrates the historic crests for the gage near Doty. The peak flow column provides the corresponding data from the USGS.
Table 1 Chehalis River Near Doty Historic Crests
Gage Height, Feet(1) Peak Flow, cfs Date 31.31 63,100(2) 12/03/2007 20.37 28,900 02/08/1996 19.96 27,500 01/09/1990 18.36 22,800 01/20/1972 17.80 21,400 02/07/1945 17.45 20,600 11/24/1990 16.38 Not available 01/08/2009 15.90 16,600 12/16/2001 15.58 16,000 01/30/2006 15.54 16,300 02/24/1999
(1) 12020000 Chehalis River Near Doty, WA, USGS (2) Estimated by USGS based on high water mark because gage washed out in 2007 flood
CHEHALIS RIVER BASIN FLOOD AUTHORITY—FLOOD WATER RETENTION PROJECT PHASE IIB FEASIBILITY STUDY 14
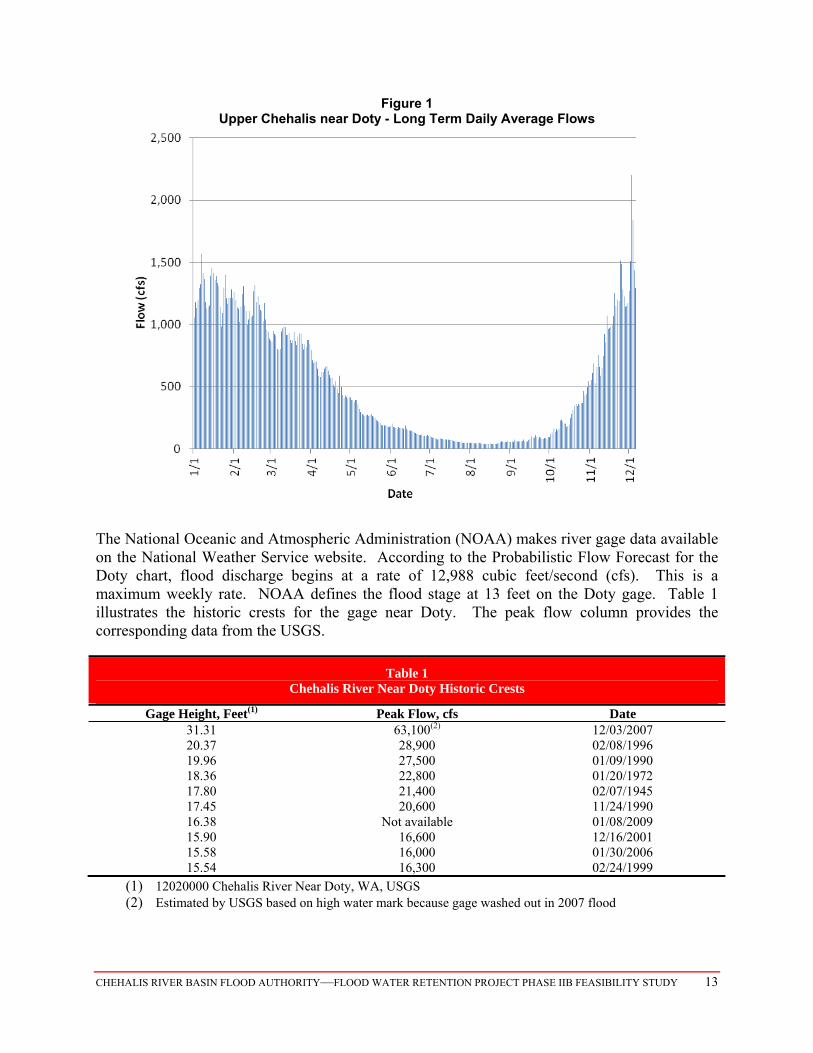
Figure 2 illustrates the gage height data from Table 1 over the period of record. Figure 2 shows that severe flooding, defined here as gage heights ≥ 15 feet where overbank flooding first occurs at 13 foot gage height, has become more frequent in the last couple of decades. This figure shows that while the frequency of occurrence of overbank flooding has not substantially changed, the severity of flood events has increased in recent years.
Figure 2 Chehalis River near Doty
Historic Gage Height ≥13 Feet19
SouthForkChehalisSite
Flow and Gage Height Characteristics
For the South Fork site, the Wildwood gage is the closest gage. The gage near Wildwood records daily flow information for October through April only. The drainage area at this gage is 27 square miles, while the drainage area at the proposed South Fork site is estimated at 22 square miles.
19 Olson, Patricia. Comments from WSDOT, Ecology, and Fish and Wildlife, Chehalis River Flood Water Retention Project Phase IIB Feasibility Study (Nov. 10, 2010).
Severe flooding ≥15 ft.
CHEHALIS RIVER BASIN FLOOD AUTHORITY—FLOOD WATER RETENTION PROJECT PHASE IIB FEASIBILITY STUDY 15
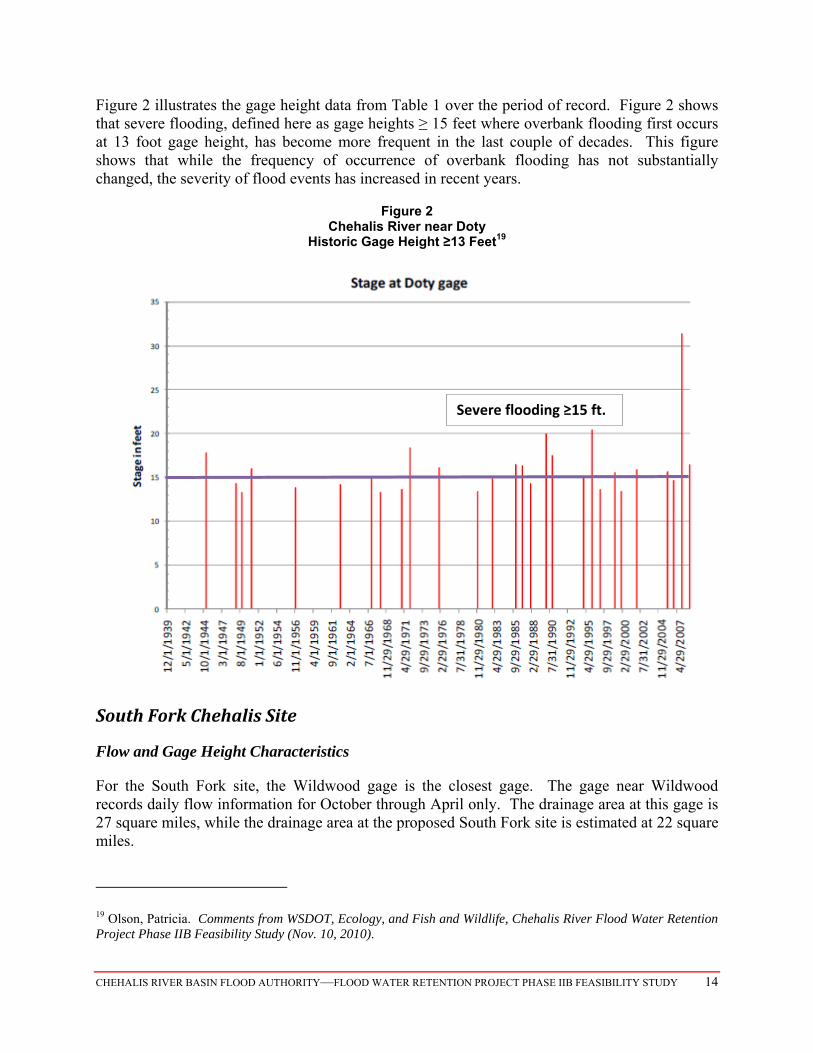
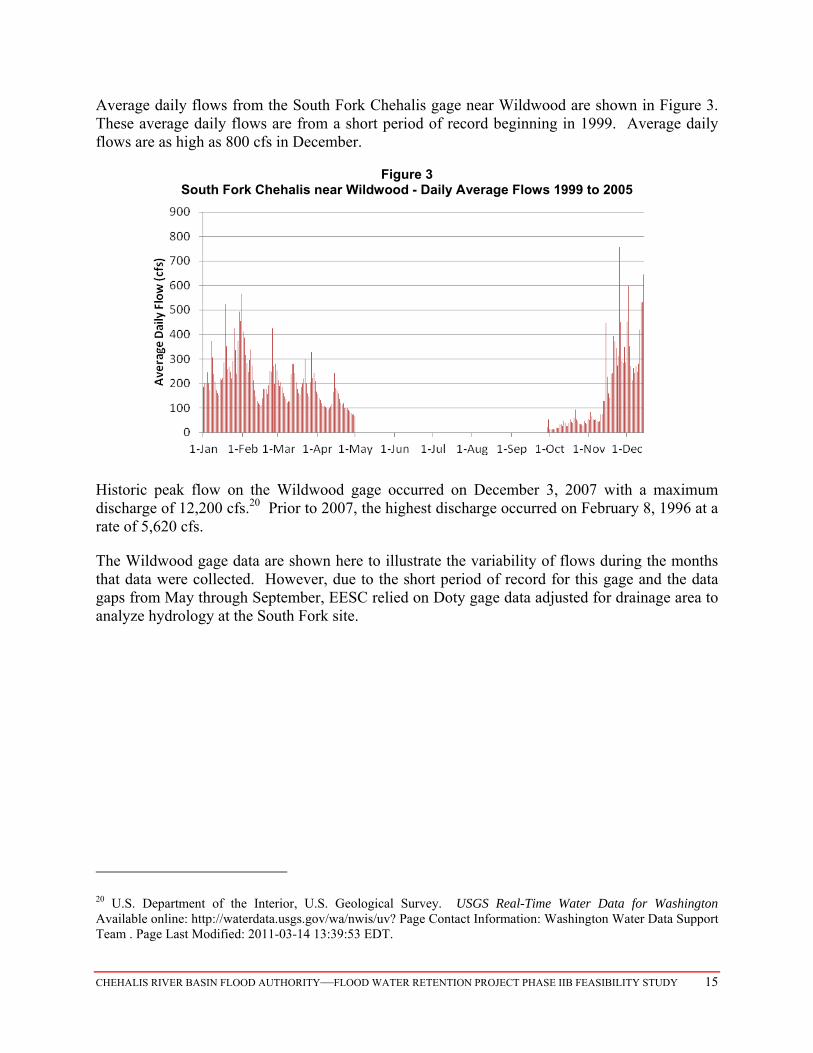
Average daily flows from the South Fork Chehalis gage near Wildwood are shown in Figure 3. These average daily flows are from a short period of record beginning in 1999. Average daily flows are as high as 800 cfs in December.
Figure 3 South Fork Chehalis near Wildwood - Daily Average Flows 1999 to 2005
Historic peak flow on the Wildwood gage occurred on December 3, 2007 with a maximum discharge of 12,200 cfs.20 Prior to 2007, the highest discharge occurred on February 8, 1996 at a rate of 5,620 cfs.
The Wildwood gage data are shown here to illustrate the variability of flows during the months that data were collected. However, due to the short period of record for this gage and the data gaps from May through September, EESC relied on Doty gage data adjusted for drainage area to analyze hydrology at the South Fork site.
20 U.S. Department of the Interior, U.S. Geological Survey. USGS Real-Time Water Data for Washington Available online: http://waterdata.usgs.gov/wa/nwis/uv? Page Contact Information: Washington Water Data Support Team . Page Last Modified: 2011-03-14 13:39:53 EDT.
CHEHALIS RIVER BASIN FLOOD AUTHORITY—FLOOD WATER RETENTION PROJECT PHASE IIB FEASIBILITY STUDY 16
SummaryofEngineeringConceptsandCosts
This section describes the general locations, characteristics, and operations of the flood reduction structures. Two different options for each site are described in this section: a flood-reduction only design and a multi-purpose design. The Phase IIB scope originally tasked EESC engineers with the design and cost estimates for multi-purpose structures. However, EESC engineers were asked to also develop design and cost estimates for flood-reduction only structures. The flood-reduction only structures are discussed first, followed by discussion of the multi-purpose structures.
Locations
EESC engineers used digital mapping with 2 foot contour intervals provided by Lewis County to identify structure locations and alignment at both sites. The sites were chosen based on the topography to maximize the drainage area while allowing for sufficient abutment height for water storage.
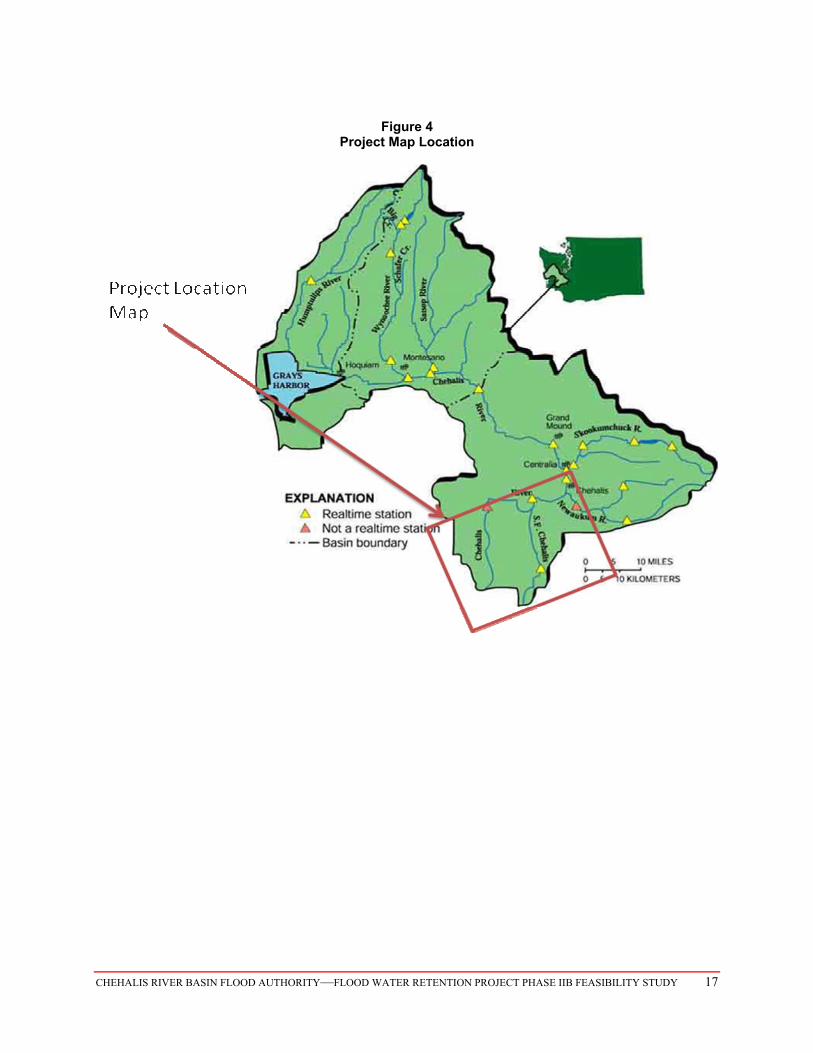
Due to a more detailed analysis regarding site topography, the Upper Chehalis site was revised slightly from the original location studied during the Phase I work. In Phase IIB, the structure was moved approximately 1,500 ft downstream and the axis rotated. This adjustment resulted in a slightly shorter crest length and a much more desirable alignment for a tunnel through the hills located on the left side of the structure (from downstream side). The tunnel will allow for water diversion past the structure.
The South Fork Structure is in approximately the same location as identified in Phase I but was rotated slightly in Phase IIB due to improved topographic data.
Figures 4 and 5 illustrate the general locations of the two sites.
CHEHALIS RIVER BASIN FLOOD AUTHORITY—FLOOD WATER RETENTION PROJECT PHASE IIB FEASIBILITY STUDY 17
Figure 4 Project Map Location

CHEHALIS RIVER BASIN FLOOD AUTHORITY—FLOOD WATER RETENTION PROJECT PHASE IIB FEASIBILITY STUDY 18
Figure 5
Map of Proposed Flood Water Retention Sites
FloodReductionStructureCharacteristics
The physical characteristics of the site topography are suitable for an earthfill structure in each location. The topography is characterized by low rolling hills and both structures are located in narrow valleys close to where those valleys open to broader flood plains. The steep valley walls have resulted in landslides at or near each of the proposed sites; therefore, erosion and related issues would need to be addressed in more detail as the project planning progresses.21
Shannon & Wilson suggest four types of structures are feasible, three of which are earth or rock filled. Although they analyzed concrete structures, their work concluded that such structures would not be practical or economical given the site conditions. The proposed flood reduction structures are run-of-river structures where natural flows are released year round, except during flood events. Each structure would have a spillway and fish passage structures. Spillways are located near the tops of the structures so that water can be safely released in the event that flood waters cannot be contained. The spillways ensure that the structures would not be overtopped.
21 Shannon & Wilson, October 27, 2009. The structures were then modified based on correspondence and recommendation given additional information about the sites; see Appendix B and associated correspondence from Shannon & Wilson.
CHEHALIS RIVER BASIN FLOOD AUTHORITY—FLOOD WATER RETENTION PROJECT PHASE IIB FEASIBILITY STUDY 19
Storage Volume and Structure Height
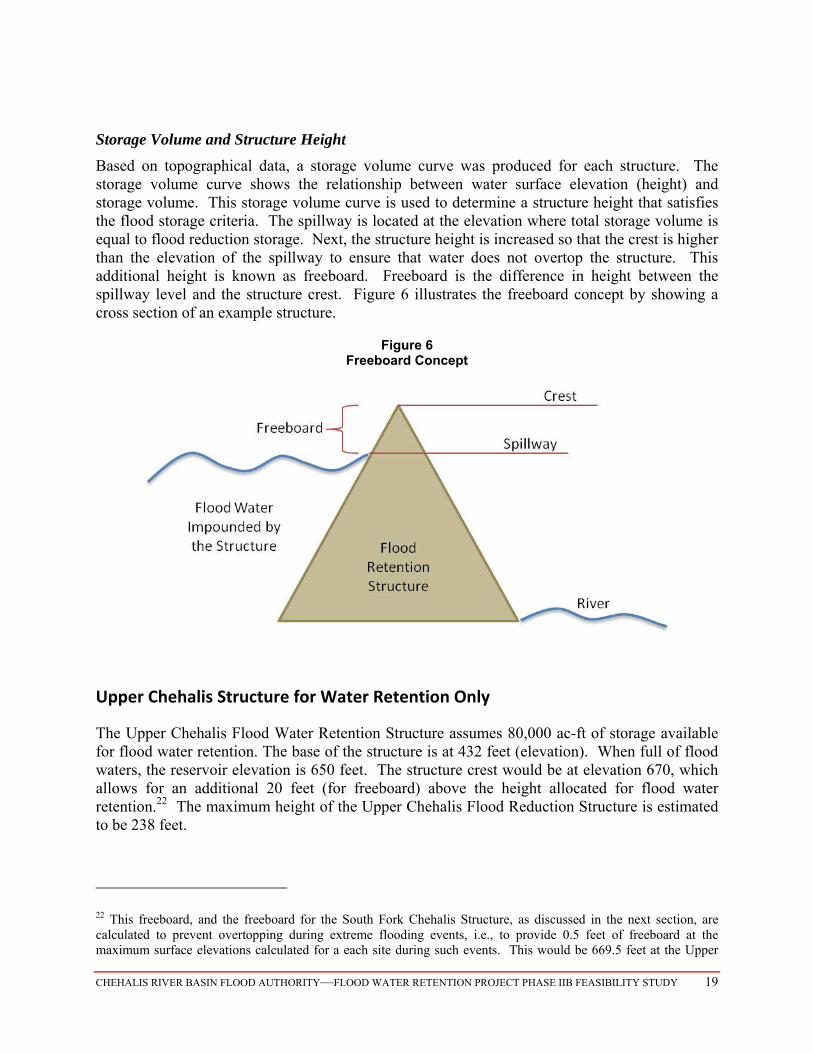
Based on topographical data, a storage volume curve was produced for each structure. The storage volume curve shows the relationship between water surface elevation (height) and storage volume. This storage volume curve is used to determine a structure height that satisfies the flood storage criteria. The spillway is located at the elevation where total storage volume is equal to flood reduction storage. Next, the structure height is increased so that the crest is higher than the elevation of the spillway to ensure that water does not overtop the structure. This additional height is known as freeboard. Freeboard is the difference in height between the spillway level and the structure crest. Figure 6 illustrates the freeboard concept by showing a cross section of an example structure.
Figure 6 Freeboard Concept
Upper Chehalis Structure for Water Retention Only
The Upper Chehalis Flood Water Retention Structure assumes 80,000 ac-ft of storage available for flood water retention. The base of the structure is at 432 feet (elevation). When full of flood waters, the reservoir elevation is 650 feet. The structure crest would be at elevation 670, which allows for an additional 20 feet (for freeboard) above the height allocated for flood water retention.22 The maximum height of the Upper Chehalis Flood Reduction Structure is estimated to be 238 feet.
22 This freeboard, and the freeboard for the South Fork Chehalis Structure, as discussed in the next section, are calculated to prevent overtopping during extreme flooding events, i.e., to provide 0.5 feet of freeboard at the maximum surface elevations calculated for a each site during such events. This would be 669.5 feet at the Upper
CHEHALIS RIVER BASIN FLOOD AUTHORITY—FLOOD WATER RETENTION PROJECT PHASE IIB FEASIBILITY STUDY 20
South Fork Chehalis Structure for Water Retention Only
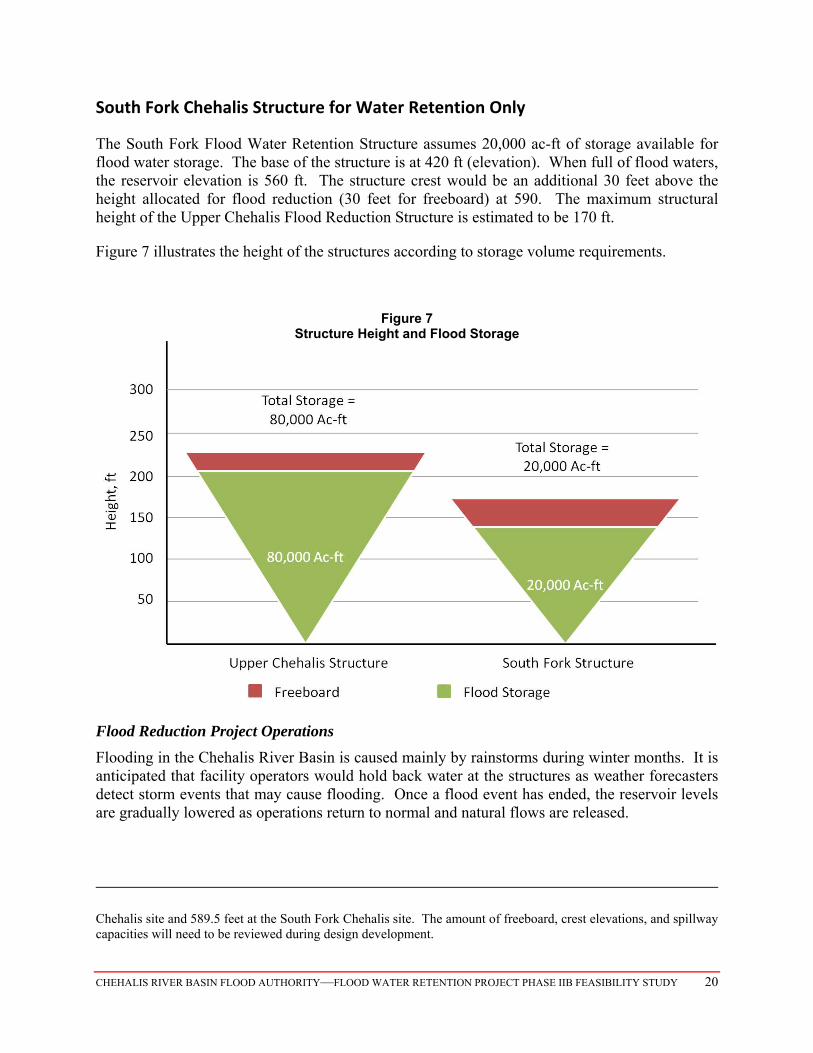
The South Fork Flood Water Retention Structure assumes 20,000 ac-ft of storage available for flood water storage. The base of the structure is at 420 ft (elevation). When full of flood waters, the reservoir elevation is 560 ft. The structure crest would be an additional 30 feet above the height allocated for flood reduction (30 feet for freeboard) at 590. The maximum structural height of the Upper Chehalis Flood Reduction Structure is estimated to be 170 ft.
Figure 7 illustrates the height of the structures according to storage volume requirements.
Figure 7 Structure Height and Flood Storage
Flood Reduction Project Operations
Flooding in the Chehalis River Basin is caused mainly by rainstorms during winter months. It is anticipated that facility operators would hold back water at the structures as weather forecasters detect storm events that may cause flooding. Once a flood event has ended, the reservoir levels are gradually lowered as operations return to normal and natural flows are released.
Chehalis site and 589.5 feet at the South Fork Chehalis site. The amount of freeboard, crest elevations, and spillway capacities will need to be reviewed during design development.
CHEHALIS RIVER BASIN FLOOD AUTHORITY—FLOOD WATER RETENTION PROJECT PHASE IIB FEASIBILITY STUDY 21
Multi‐PurposeStructureCharacteristics
The physical characteristics of the site topography are also suitable for an earthfill structure in each location with multi-purpose capabilities. The principal project features for the flood-reduction-only projects are the structure, spillway, and tunnel. Similarly, the principal project features for the multi-purpose projects are the structure, spillway, intake tower and tunnel. Each structure would have a spillway, outlet works, and fish passage. Spillways are located near the top of each structure so that water can be safely released in the event that flood waters cannot be contained. The spillways ensure that the structures would not be overtopped. Outlet works are located at the outlet side of the tunnel and allow for the regulated release of water. Intake towers will be located in the reservoirs so that water that is released through the tunnel, and eventually through the outlet works, can be drawn from varying depths (to regulate temperatures, levels of dissolved oxygen, etc.).
Storage Volume and Surface Area
Based on topographical data, a storage volume curve and a reservoir surface area curve were produced for each structure. The storage volume curve shows the relationship between water surface elevation (height) and storage volume. The surface area curve shows the relationship between water surface elevation and reservoir surface area. The storage volume curve is used to determine a structure height that ensures sufficient storage capacity to contain flood waters and additional room for stream augmentation and hydropower.
Multi-Purpose Structure Height
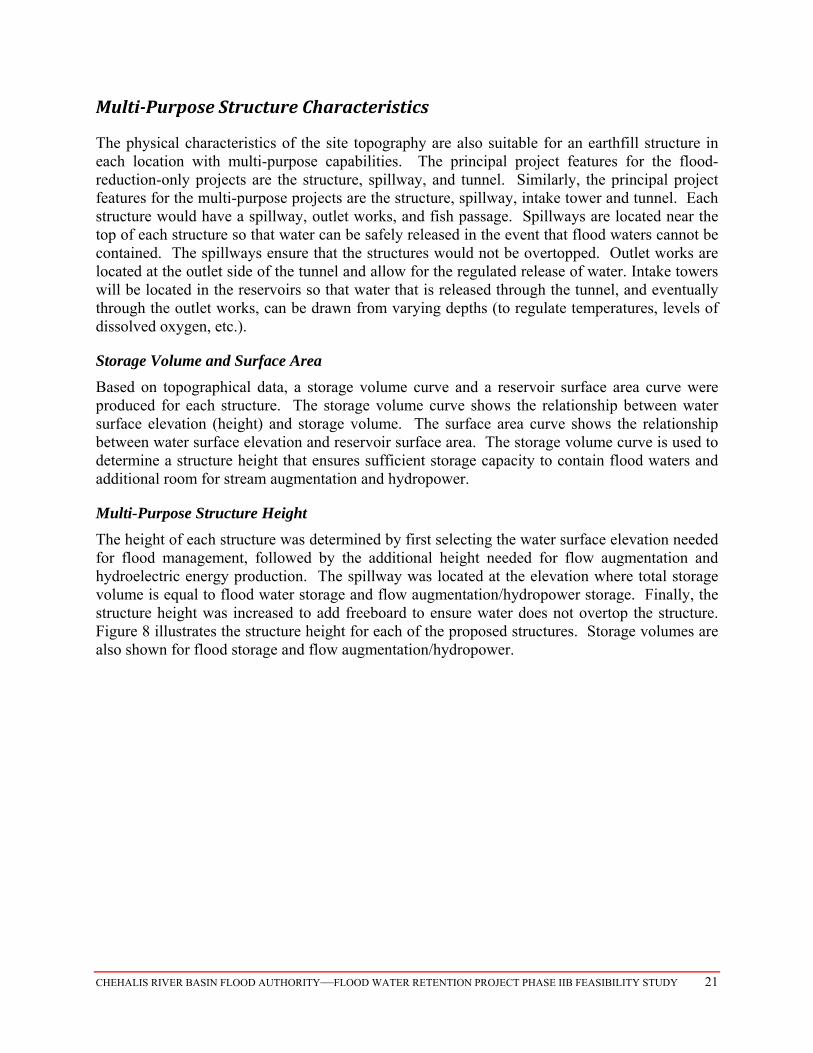
The height of each structure was determined by first selecting the water surface elevation needed for flood management, followed by the additional height needed for flow augmentation and hydroelectric energy production. The spillway was located at the elevation where total storage volume is equal to flood water storage and flow augmentation/hydropower storage. Finally, the structure height was increased to add freeboard to ensure water does not overtop the structure. Figure 8 illustrates the structure height for each of the proposed structures. Storage volumes are also shown for flood storage and flow augmentation/hydropower.
CHEHALIS RIVER BASIN FLOOD AUTHORITY—FLOOD WATER RETENTION PROJECT PHASE IIB FEASIBILITY STUDY 22
Figure 8 Multi-Purpose Structure Height
The maximum operating water surface elevations for hydro operation was selected based on two criteria: enough storage to augment summer flows and a reasonable operating level for production of hydropower. An energy production model was developed for each project to maximize hydropower output with respect to the amount of water available on an average daily flow basis.
Upper Chehalis Site with a Multi‐Purpose Structure
The characteristics of a multi-purpose structure depend on the volume needed for both hydropower generation and flood control.
The maximum water surface elevation selected for the Upper Chehalis site to generate hydropower is 195 feet (ft) from the base of the structure. The maximum volume of water for the hydro operation would be approximately 65,000 acre-feet.
Capturing an additional 80,000 ac-ft for flood reduction would require raising the water surface by 65 ft (assuming the reservoir is full at 195 feet). An additional 65 feet in structure height corresponds to the maximum reservoir capacity of 145,000 ac-ft (total). When completely full with flood waters, the Upper Chehalis reservoir would have a surface area of approximately 1,450 acres.
CHEHALIS RIVER BASIN FLOOD AUTHORITY—FLOOD WATER RETENTION PROJECT PHASE IIB FEASIBILITY STUDY 23
The structure crest would be an additional 20 feet above the height allocated for flood reduction (20 feet of freeboard). See Figure 8 above. The maximum height of the Upper Chehalis structure is estimated to be 288 feet.
South Fork Chehalis Multi‐Purpose Structure
Similarly, the characteristics for the South Fork Chehalis multi-purpose structure also depend on the amount of water needed for flood reduction and hydropower.
The maximum water surface elevation selected for the South Fork site for hydro generation is 120 ft from the base of the structure. At this height, the storage volume would be approximately 13,500 ac-ft. An additional 20,000 ac-ft of storage is required for the flood reduction purpose of this structure; therefore, the maximum reservoir capacity is 33,500 ac-ft. For 33,500 ac-ft of storage, the spillway crest would be 170 ft above the base of the structure. The structure crest would be 200 feet high allowing 30 ft for freeboard (see Figure 8 above). The South Fork structure would have a maximum height of approximately 200 ft.
Flood Reduction Project Operations
Similar to the flood reduction only projects, structure operators will begin to release water from the reservoirs as soon as weather forecasters detect storm events that may cause flooding. The additional releases in anticipation of a flood event will keep the reservoirs from filling quickly and releasing water through the uncontrolled spillway. The maximum amount of water that can be safely released has not been calculated for this study and will need to be modeled in later phases. It was assumed at 1,000 cfs and 350 cfs could safely be released for the Upper Chehalis and South Fork Chehalis structures respectively. Please see Appendix B for additional information on release assumptions.
Once a flood event has ended, the reservoir levels are gradually lowered as operations return to normal.
Hydroelectric Project Operations
Flow data based on the USGS gage near Doty was used to develop an energy production model. The gage flows were correlated to the sites using a ratio of the drainage areas. The drainage area of the Doty gage is 113 sq mi and has a daily average discharge of 349 cfs. The drainage areas are 68.8 square miles and 22.5 square miles for the Upper Chehalis and South Fork sites, respectively.
The energy production models used the reservoir storage curves developed from the digital mapping, average daily flow from the Doty gage, and flow releases. Flow releases are based on the size of the hydropower units. The size of the desired generating units was found through an iterative process. The average daily reservoir inflow and reservoir storage curves are known. From the known data, the size of the hydropower units is changed until beginning and ending reservoir levels are equal. In other words, the selected unit sizes are based on maintaining a water budget so the reservoirs fill to the same initial level at the beginning of each year.
CHEHALIS RIVER BASIN FLOOD AUTHORITY—FLOOD WATER RETENTION PROJECT PHASE IIB FEASIBILITY STUDY 24
Because hydropower is operated during the summer months, summer flows are augmented by the amount of flow equal to the hydropower outflow minus natural average flow. These augmented flows are discussed further in the “Alternative Analysis” section where potential benefits of augmented flows are analyzed. Note that the system will be operated according to the following priorities, in descending order: flood control; optimum instream flows once optimum levels have been determined; and hydropower generation.
Upper Chehalis Project
The following bullets summarize the hydro generation analysis for the Upper Chehalis structure. More detail on the modeling is provided in Appendix B. Flows at the site can support a hydropower plant with two turbines, one rated at 8.3 MW and
one at 1.7 MW, for a total capacity of 10 MW. Annual average energy production is calculated at 39,952 MWh. According to current modeling, the lowest flows would be 140 cfs in an average water year.
In drier years, the minimum release might be as low as 20 cfs. This compares to 23 cfs minimum flow during average years and 16 cfs during dry years based on historic data at the Doty gage. Further study is required to determine appropriate minimum instream flow releases. A placeholder of 20 cfs is used in this study until additional information is available.
South Fork Project
The following bullets summarize the hydro generation analysis for the South Fork Chehalis structure. More detail on the modeling is provided in Appendix B: Estimated flows at the South Fork site can support a hydropower plant with two turbines, one
rated at 1.7 MW and one at 0.3 MW, for a total capacity of 2 MW. Annual average energy production was calculated at 7,401 MWh. According to current modeling, in the case of an average water year, the lowest flows would
be 40 cfs. In drier years, the minimum release might be 10 cfs. Further study is required to determine appropriate minimum instream flow releases. A placeholder of 10 cfs is used in this study until additional information is available.
SummaryofStructureCharacteristics
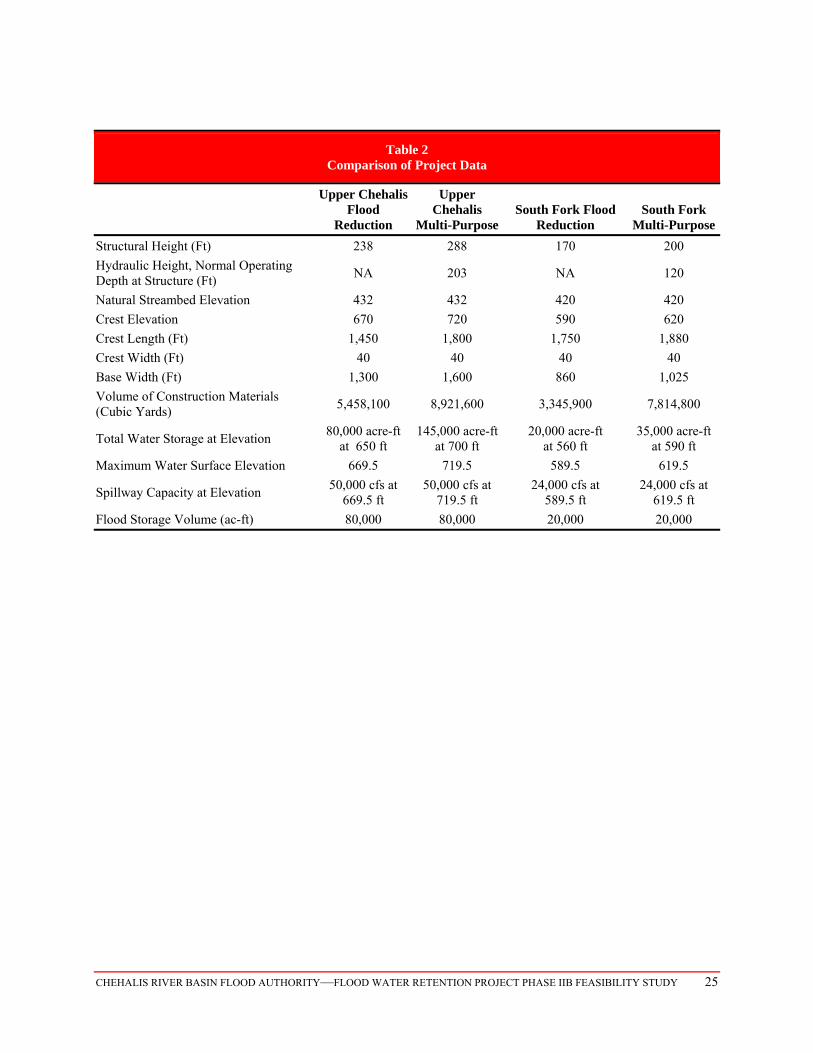
Table 2 summarizes the characteristics for the flood reduction and multi-purpose structures each site.
CHEHALIS RIVER BASIN FLOOD AUTHORITY—FLOOD WATER RETENTION PROJECT PHASE IIB FEASIBILITY STUDY 25
Table 2 Comparison of Project Data
Upper Chehalis
Flood Reduction
Upper Chehalis
Multi-PurposeSouth Fork Flood
Reduction South Fork
Multi-Purpose
Structural Height (Ft) 238 288 170 200
Hydraulic Height, Normal Operating Depth at Structure (Ft)
NA 203 NA 120
Natural Streambed Elevation 432 432 420 420
Crest Elevation 670 720 590 620
Crest Length (Ft) 1,450 1,800 1,750 1,880
Crest Width (Ft) 40 40 40 40
Base Width (Ft) 1,300 1,600 860 1,025
Volume of Construction Materials (Cubic Yards)
5,458,100 8,921,600 3,345,900 7,814,800
Total Water Storage at Elevation 80,000 acre-ft
at 650 ft 145,000 acre-ft
at 700 ft 20,000 acre-ft
at 560 ft 35,000 acre-ft
at 590 ft
Maximum Water Surface Elevation 669.5 719.5 589.5 619.5
Spillway Capacity at Elevation 50,000 cfs at
669.5 ft 50,000 cfs at
719.5 ft 24,000 cfs at
589.5 ft 24,000 cfs at
619.5 ft
Flood Storage Volume (ac-ft) 80,000 80,000 20,000 20,000
CHEHALIS RIVER BASIN FLOOD AUTHORITY—FLOOD WATER RETENTION PROJECT PHASE IIB FEASIBILITY STUDY 26
ProjectCosts
This section summarizes cost estimates developed by EESC engineers for structure design and construction. Operation and maintenance costs are estimated using relevant literature and verified by EESC engineers. Costs for interest during construction are also discussed.
ConstructionCosts
The estimated costs of development and construction of the Flood Reduction Structures are $165,230,000 for the Upper Chehalis Project and $93,060,000 for the South Fork Project. The estimated costs of development and construction of the Multi-Purpose Structures are $245,060,000 for the Upper Chehalis Project and $148,540,000 for the South Fork Project. These cost estimated include a 30% contingency factor.23 The cost estimates developed for each project are presented in Appendix B. The total estimated costs are believed to be accurate within 30%. Shannon & Wilson reviewed the cost estimates and concurred with EESC’s final assessment. In addition, feedback from the state agencies noted that “A conservative, well thought out engineering design process was followed, fully in compliance with Dam Safety’s December 2009 letter of concurrence.”24
These estimates represent the probable project development costs as best they can be determined at this preliminary stage. The estimates are based on the Phase I investigations, preliminary drawings, material quantity take-offs, construction cost guides, recent construction bids, literature research, opinion, judgment and allowances. Note that additional reviews will need to be carried out after further site investigation takes place and development of geotechnical, seismic, hydrology, and other supporting reports for the Project have been completed. EESC requested assistance from Shannon & Wilson for unit construction costs for selected items, such as embankment and tunneling. Land and land right costs such as land acquisition, FERC licensing, state and local permits, Bonneville Power Administration coordination fees have been included, but internal agency/Flood Authority costs and legal fees have not.
The construction schedule is assumed to take about 4 years once permits have been issued. The issuance of permits will take some time in order to comply with environmental permitting requirements.
23 Thirty percent contingency values are used in the engineering cost estimates. The amount of contingency used for this cost estimate depended on the level engineering detail and design used in developing the estimate. Not only was geotechnical information available for this project, quantities of materials for the dam and tunnel were fairly well defined. These structures account for the majority of the estimate. Based on the professional experience of EES Consulting’s engineers, the level of information available, and the level of design completed under Phase IIB, a 30% contingency is considered appropriate.
24 Comments from David Cummings, P.E., Department of Ecology on Phase IIB Feasibility Study (Nov. 10, 2010 Draft).
CHEHALIS RIVER BASIN FLOOD AUTHORITY—FLOOD WATER RETENTION PROJECT PHASE IIB FEASIBILITY STUDY 27
Cost Scenarios
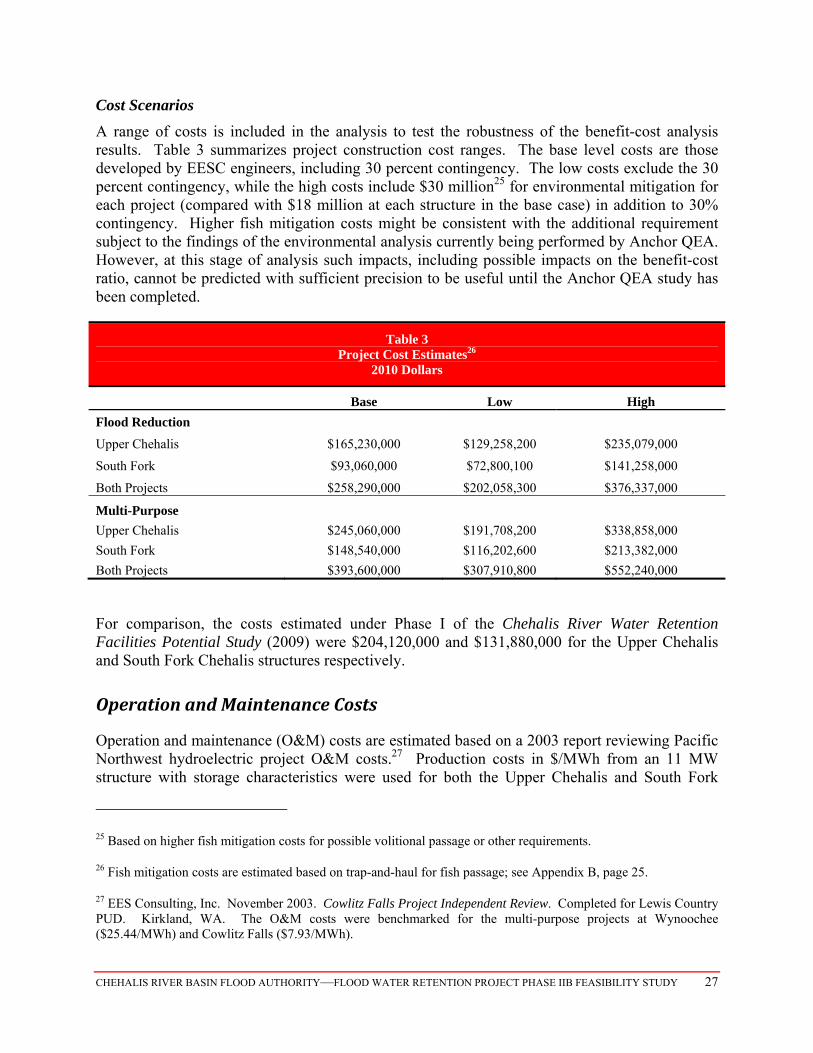
A range of costs is included in the analysis to test the robustness of the benefit-cost analysis results. Table 3 summarizes project construction cost ranges. The base level costs are those developed by EESC engineers, including 30 percent contingency. The low costs exclude the 30 percent contingency, while the high costs include $30 million25 for environmental mitigation for each project (compared with $18 million at each structure in the base case) in addition to 30% contingency. Higher fish mitigation costs might be consistent with the additional requirement subject to the findings of the environmental analysis currently being performed by Anchor QEA. However, at this stage of analysis such impacts, including possible impacts on the benefit-cost ratio, cannot be predicted with sufficient precision to be useful until the Anchor QEA study has been completed.
Table 3 Project Cost Estimates26
2010 Dollars
Base Low High
Flood Reduction
Upper Chehalis $165,230,000 $129,258,200 $235,079,000
South Fork $93,060,000 $72,800,100 $141,258,000
Both Projects $258,290,000 $202,058,300 $376,337,000
Multi-Purpose
Upper Chehalis $245,060,000 $191,708,200 $338,858,000
South Fork $148,540,000 $116,202,600 $213,382,000
Both Projects $393,600,000 $307,910,800 $552,240,000
For comparison, the costs estimated under Phase I of the Chehalis River Water Retention Facilities Potential Study (2009) were $204,120,000 and $131,880,000 for the Upper Chehalis and South Fork Chehalis structures respectively.
OperationandMaintenanceCosts
Operation and maintenance (O&M) costs are estimated based on a 2003 report reviewing Pacific Northwest hydroelectric project O&M costs.27 Production costs in $/MWh from an 11 MW structure with storage characteristics were used for both the Upper Chehalis and South Fork
25 Based on higher fish mitigation costs for possible volitional passage or other requirements.
26 Fish mitigation costs are estimated based on trap-and-haul for fish passage; see Appendix B, page 25.
27 EES Consulting, Inc. November 2003. Cowlitz Falls Project Independent Review. Completed for Lewis Country PUD. Kirkland, WA. The O&M costs were benchmarked for the multi-purpose projects at Wynoochee ($25.44/MWh) and Cowlitz Falls ($7.93/MWh).
CHEHALIS RIVER BASIN FLOOD AUTHORITY—FLOOD WATER RETENTION PROJECT PHASE IIB FEASIBILITY STUDY 28
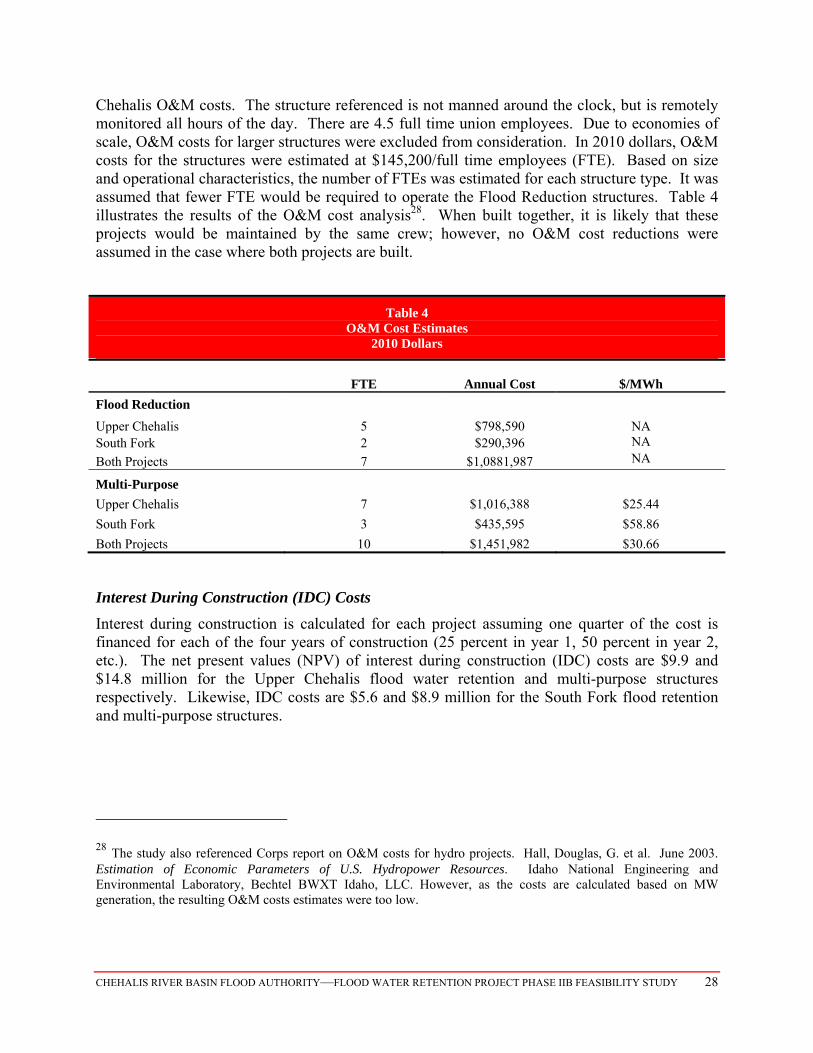
Chehalis O&M costs. The structure referenced is not manned around the clock, but is remotely monitored all hours of the day. There are 4.5 full time union employees. Due to economies of scale, O&M costs for larger structures were excluded from consideration. In 2010 dollars, O&M costs for the structures were estimated at $145,200/full time employees (FTE). Based on size and operational characteristics, the number of FTEs was estimated for each structure type. It was assumed that fewer FTE would be required to operate the Flood Reduction structures. Table 4 illustrates the results of the O&M cost analysis28. When built together, it is likely that these projects would be maintained by the same crew; however, no O&M cost reductions were assumed in the case where both projects are built.
Table 4 O&M Cost Estimates
2010 Dollars
FTE
Annual Cost $/MWh
Flood Reduction
Upper Chehalis 5 $798,590 NA South Fork 2 $290,396 NA Both Projects 7 $1,0881,987 NA
Multi-Purpose
Upper Chehalis 7 $1,016,388 $25.44
South Fork 3 $435,595 $58.86
Both Projects 10 $1,451,982 $30.66
Interest During Construction (IDC) Costs
Interest during construction is calculated for each project assuming one quarter of the cost is financed for each of the four years of construction (25 percent in year 1, 50 percent in year 2, etc.). The net present values (NPV) of interest during construction (IDC) costs are $9.9 and $14.8 million for the Upper Chehalis flood water retention and multi-purpose structures respectively. Likewise, IDC costs are $5.6 and $8.9 million for the South Fork flood retention and multi-purpose structures.
28 The study also referenced Corps report on O&M costs for hydro projects. Hall, Douglas, G. et al. June 2003. Estimation of Economic Parameters of U.S. Hydropower Resources. Idaho National Engineering and Environmental Laboratory, Bechtel BWXT Idaho, LLC. However, as the costs are calculated based on MW generation, the resulting O&M costs estimates were too low.
CHEHALIS RIVER BASIN FLOOD AUTHORITY—FLOOD WATER RETENTION PROJECT PHASE IIB FEASIBILITY STUDY 29
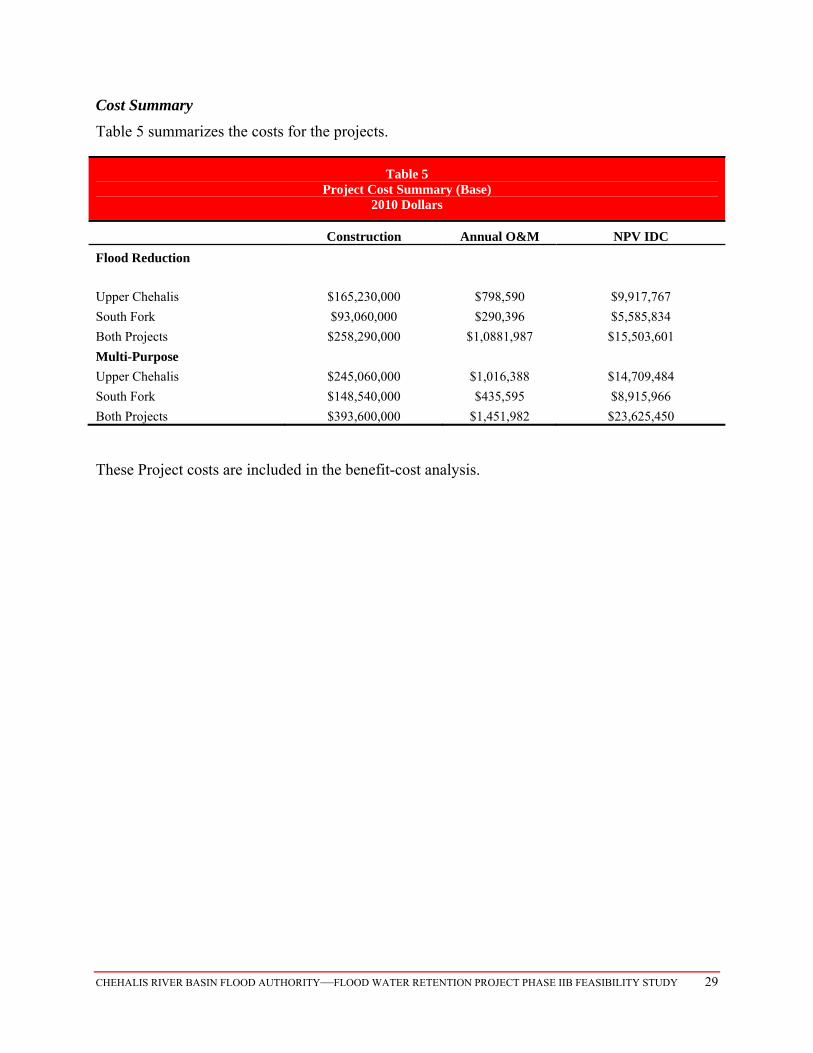
Cost Summary
Table 5 summarizes the costs for the projects.
Table 5 Project Cost Summary (Base)
2010 Dollars
Construction Annual O&M NPV IDC
Flood Reduction
Upper Chehalis $165,230,000 $798,590 $9,917,767
South Fork $93,060,000 $290,396 $5,585,834
Both Projects $258,290,000 $1,0881,987 $15,503,601
Multi-Purpose
Upper Chehalis $245,060,000 $1,016,388 $14,709,484
South Fork $148,540,000 $435,595 $8,915,966
Both Projects $393,600,000 $1,451,982 $23,625,450
These Project costs are included in the benefit-cost analysis.
Imperial Irrigation District
CHEHALIS RIVER BASIN FLOOD AUTHORITY—FLOOD WATER RETENTION PROJECT PHASE IIB FEASIBILITY STUDY 30
Benefit‐CostAnalysisMethodology
This report presents an economic analysis and benefit-cost ratios developed using the U.S. Army Corps of Engineers’ Principles & Guidelines methodology, which considers costs and benefits from a national perspective. Because there are numerous costs and benefits that occur on a local, state, and regional basis, this analysis also includes an Alternative Analysis. The primary addition to the Alternative Analysis is the quantified costs and benefits to the affected environment and ecosystem. A Regional Analysis of costs and benefits is also conducted from a local perspective. This section contains a brief summary of the different types of analyses, followed by greater detail for each analysis.
NationalPerspective
The Corps approves flood reduction projects based on the results of a benefit-cost analysis using its Principles & Guidelines methodology, which evaluates costs and benefits from a national perspective. Relevant national costs and benefits attributable to the proposed projects are described below. These values were monetized; non-monetized values are discussed later in this section. Relevant National Costs
Capital construction costs Operation, maintenance, and replacement Permitting costs, such as FERC licensing, state and local permits
National Benefits
Reduced estimated annual damage to building structures and contents, agriculture crops and equipment
Avoided clean-up costs Avoided transportation delays or detours Avoided infrastructure improvement or operation and maintenance Increased availability of water for irrigation or other use Value of hydropower and its renewable qualities Increased recreation visits
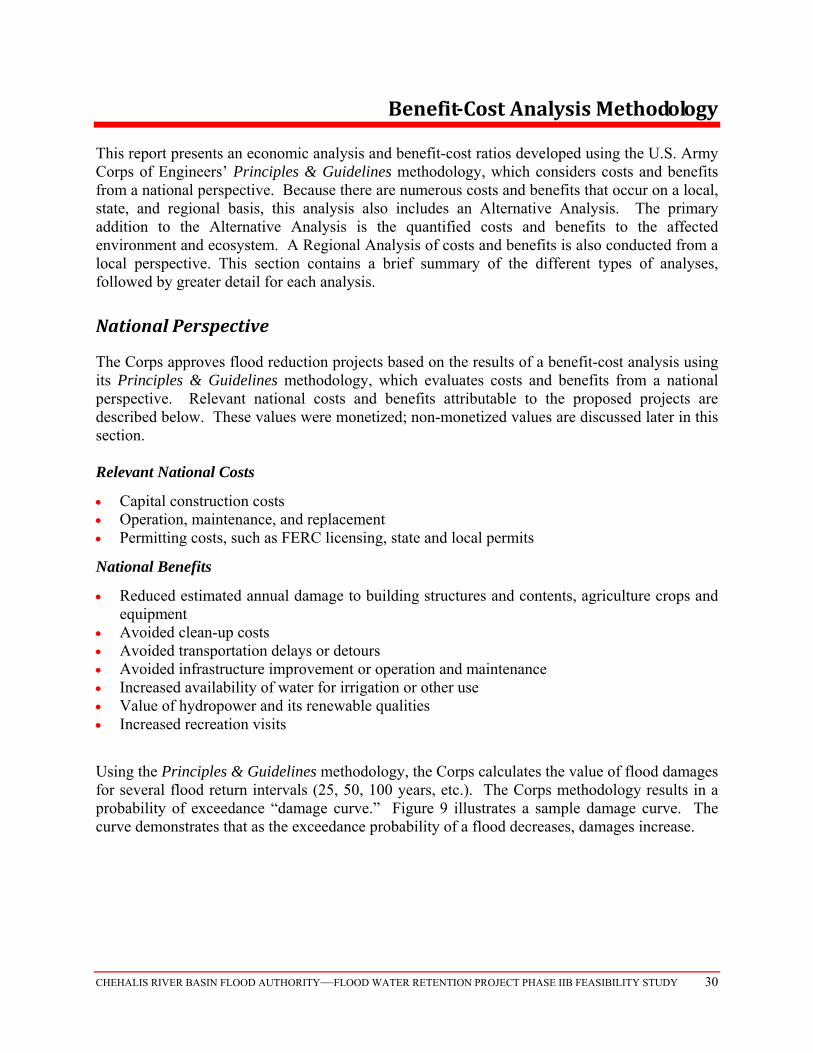
Using the Principles & Guidelines methodology, the Corps calculates the value of flood damages for several flood return intervals (25, 50, 100 years, etc.). The Corps methodology results in a probability of exceedance “damage curve.” Figure 9 illustrates a sample damage curve. The curve demonstrates that as the exceedance probability of a flood decreases, damages increase.
CHEHALIS RIVER BASIN FLOOD AUTHORITY—FLOOD WATER RETENTION PROJECT PHASE IIB FEASIBILITY STUDY 31
Figure 9 Example Damage Curve
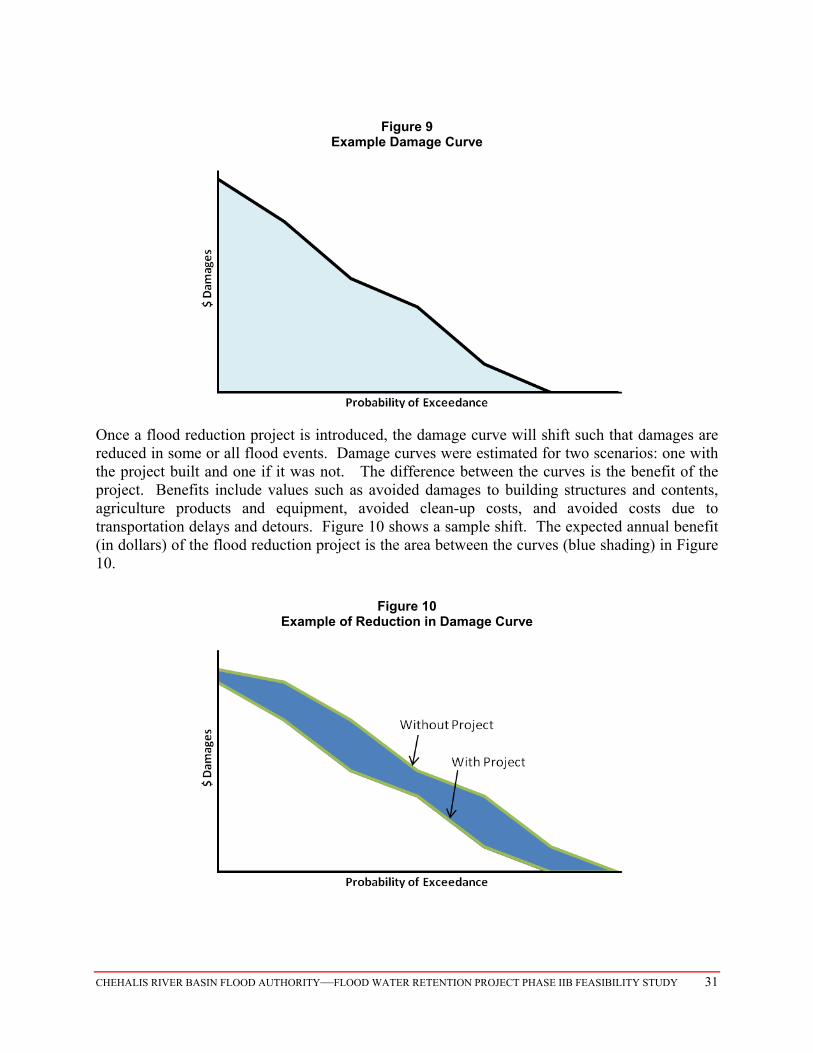
Once a flood reduction project is introduced, the damage curve will shift such that damages are reduced in some or all flood events. Damage curves were estimated for two scenarios: one with the project built and one if it was not. The difference between the curves is the benefit of the project. Benefits include values such as avoided damages to building structures and contents, agriculture products and equipment, avoided clean-up costs, and avoided costs due to transportation delays and detours. Figure 10 shows a sample shift. The expected annual benefit (in dollars) of the flood reduction project is the area between the curves (blue shading) in Figure 10.
Figure 10 Example of Reduction in Damage Curve
CHEHALIS RIVER BASIN FLOOD AUTHORITY—FLOOD WATER RETENTION PROJECT PHASE IIB FEASIBILITY STUDY 32
It should be noted that the Corps’ damage curves for the most recent flood events (2007 and 2009) are not available. In addition, the damage curves estimated in the 2003 Corps report only surveyed properties near the I-5 corridor in Lewis County. Over the past 20 years, however, Chehalis River flooding has resulted in flood damages from Doty to Aberdeen and not just in the I-5 corridor cities of Chehalis and Centralia. Since the Corps has not yet completed updated damage curves, EESC estimated these curves using flood depth data from Northwest Hydraulic Consultants with FEMA’s GIS-based HAZUS model to determine flood damages at 10, 50, 100, and 500 year events, for the following cases: With Upper Chehalis Structure; With South Fork Chehalis Structure; With both structures; and Without either structure.
RegionalPerspective
According to the Principles & Guidelines, however, regional benefits and costs may be included under a separate analysis when evaluating alternatives for federal funding. Regional perspectives are not valued as highly as national perspectives because regional costs and benefits often transfer from one region to another. For example, the local grocery stores in Lewis County may lose sales during a flood event; however, grocery stores in a neighboring county or state may experience increased sales. From a national benefit perspective, this transfer of sales is not counted. However, for the local grocer, the loss of sales may have a big impact and could be counted in a regional analysis. Since the Corps is a federally funded agency, projects must have favorable economics from a national perspective. For this study, however, state and regional benefits are important, as stakeholders at the local, state and regional levels will play an important part in determining the best overall solution based on a local and regional perspective. Regional benefits and costs for this study include: Changes in property values and taxes Changes in local employment and business income Avoided lost business income
QualitativeCostsandBenefits
The Corps’ policy as expressed in its Principles & Guidelines documents does not currently monetize environmental costs and benefits or other social effects (with the exception of historical properties). These effects are generally discussed qualitatively in project reports by the Corps. Although the Corps would not strongly emphasize environmental effects, these are important to the flood retention projects due to local, state, and regional interests in improving river and fisheries habitat values. Additional project-related environmental and social costs and benefits that were considered in the Alternatives Analysis and Regional Analysis are described below.
CHEHALIS RIVER BASIN FLOOD AUTHORITY—FLOOD WATER RETENTION PROJECT PHASE IIB FEASIBILITY STUDY 33
Environmental Changes in acreage of ecosystem coverage type, including lost terrestrial and riparian habitat,
or gained lake/reservoir habitat Effects on fish and wildlife, including water quality changes, effects on salmon and steelhead
spawning, rearing, and survival, effects of predatory animals resulting from changes in fish populations, and others
Reduction in carbon dioxide or other air pollutants from possible eventual inclusion of hydropower29
Other Social Effects Positive effects on historical or cultural properties, such as the reduced flooding of historic
structures Positive urban and community impacts, such as quality of community life or population
distribution Beneficial effects on public safety, health, or life
AlternativeAnalysis
The scope of work for the Phase IIB analysis calls for the quantification of environmental benefits and costs under an Alternative Benefit-Cost Analysis. The precedent for quantifying the project ecosystem benefits comes from the current work to restore the Mississippi River Delta. The Louisiana State legislature approved the use of multi-criteria methodology where the preferred alternative is selected based on all accounts (benefit-cost analysis, wetlands restoration, and public safety). As a result of the Louisiana legislature’s decision, Earth Economics30 is examining the dollar value of storm protection, carbon sequestration, and other ecosystem services provided by the wetlands of the Mississippi Delta. The valuation of these ecosystem and public safety benefits may show that protection and restoration of wetlands in conjunction with smaller levees is more economically efficient in providing hurricane protection than levee construction alone. Using these principles provides a construct for monetizing ecosystem benefits for the proposed projects. Ecosystem improvements (and costs) are based on a report completed by Earth Economics for the Chehalis River Basin.31 The analysis valued changes in ecosystem types (terrestrial vs. lake), improved riparian habitat, and ability of the new wetlands to mitigate flood events.
29 While the carbon impacts attributable to construction might offset these benefits to some unknown extent, an analysis of such effects is beyond the scope of this study and is not considered under the Corps’ methodology at this stage of analysis. In any event, it is likely that the inclusion of hydropower capacity will not add substantially to the emissions associated with building the dam(s) exclusively for flood control, making it more likely that carbon benefits from hydropower will provide a net reduction in carbon emissions.
30 Earth Economics is a consulting firm based in Tacoma, Washington: http://www.eartheconomics.org/
31 Batker, David, Briana Lovell and Maya Kocian. Flood Protection and Ecosystem Services in the Chehalis River Basin. Final Report. 2010. Tacoma, WA.
CHEHALIS RIVER BASIN FLOOD AUTHORITY—FLOOD WATER RETENTION PROJECT PHASE IIB FEASIBILITY STUDY 34
Fisheries Analysis
Fisheries benefits and costs are being studied under a separate contract with the Flood Authority by Anchor QEA. The results of that effort will not be known until mid-2011, and are not included in this report.
RegionalAnalysis
Because state and other regional funding decisions may be based on transfers in and out of the region, a regional analysis is provided. This regional analysis includes the monetized environmental benefits and avoided personal and business income losses. EESC used FEMA’s HAZUS model estimate of the value of economic activity disrupted during flood events.

CHEHALIS RIVER BASIN FLOOD AUTHORITY—FLOOD WATER RETENTION PROJECT PHASE IIB FEASIBILITY STUDY 35
BenefitsandCostsEstimatedUsingCorpsMethodology
Introduction
National Economic Development (NED) flood damages are estimated using a benefit-cost model developed by EESC based on the methodology described in the Corps’ 2003 report, the Principles & Guidelines documents and with inputs from a FEMA developed model (HAZUS) which also follows the Corps’ methodology. The Corps approves flood reduction projects based on the results of a benefit-cost analysis using its Principles & Guidelines methodology, which evaluates economic development costs and benefits from a national perspective. The project benefit is equal to the avoided flood damages resulting from building a project.
There are a number of different costs and damages included. The HAZUS model identifies damages to building, structure, and contents as well as land based on different levels of flood event. In addition, EESC incorporated damage estimates due to transportation delays, public assistance and emergency aid, and other items not included in the HAZUS model but used in the Corps methodology. Each retention structure is modeled separately in the benefit-cost analysis.
Relevant national benefits, as defined by the Corps’ methodology, attributable to the proposed projects are described below:
National Benefits32
Reduced estimated annual damage to building structures and contents, agriculture crops and equipment
Avoided clean-up costs Avoided transportation delays or detours Avoided infrastructure improvement or operation and maintenance Increased availability of water for irrigation or other use Value of hydropower and its renewable qualities Increased recreation visits
These values were monetized; non-monetized values are discussed later in this section.
FloodDamages
This section first describes the data used in the HAZUS flood model to estimate flood damages. Then, the calculation of each of the avoided damages listed above are provided to quantify the amount of benefits
32 Note that the proposed flood reduction projects are not intended to completely prevent flooding and the consequent damages under any and all circumstances.
CHEHALIS RIVER BASIN FLOOD AUTHORITY—FLOOD WATER RETENTION PROJECT PHASE IIB FEASIBILITY STUDY 36
Building and Content Damage
The HAZUS flood model uses damage functions to evaluate dollar value of building and content damages based on building type. A damage function relates flood depth (feet) and percent of damage. To estimate building-related damages, HAZUS uses either depth of flooding at a particular building or an area weighted depth throughout the census block. Census blocks might correspond to one city block or might encompass several acres of vacant land. Content value is based on depreciated building value. Table 6 summarizes default structure damage functions in the HAZUS model. USACE-Galveston damage curves are generally used to determine flood damages if no local data is available.33
33 While calibration of the Corps and HAZUS damage prediction models against local conditions could be desirable, this is beyond the scope of this Phase IIB Feasibility Study.
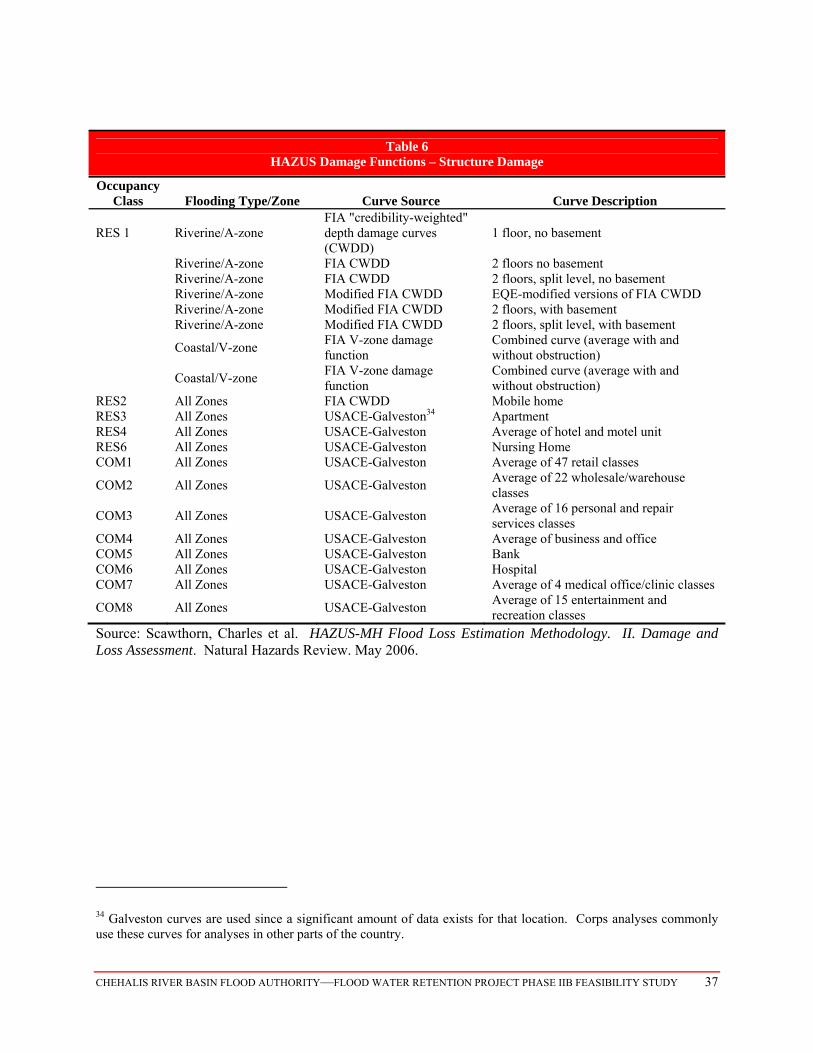
CHEHALIS RIVER BASIN FLOOD AUTHORITY—FLOOD WATER RETENTION PROJECT PHASE IIB FEASIBILITY STUDY 37
Table 6 HAZUS Damage Functions – Structure Damage
Occupancy Class Flooding Type/Zone Curve Source Curve Description
RES 1 Riverine/A-zone FIA "credibility-weighted" depth damage curves (CWDD)
1 floor, no basement
Riverine/A-zone FIA CWDD 2 floors no basement Riverine/A-zone FIA CWDD 2 floors, split level, no basement Riverine/A-zone Modified FIA CWDD EQE-modified versions of FIA CWDD Riverine/A-zone Modified FIA CWDD 2 floors, with basement Riverine/A-zone Modified FIA CWDD 2 floors, split level, with basement
Coastal/V-zone FIA V-zone damage function
Combined curve (average with and without obstruction)
Coastal/V-zone FIA V-zone damage function
Combined curve (average with and without obstruction)
RES2 All Zones FIA CWDD Mobile home RES3 All Zones USACE-Galveston34 Apartment RES4 All Zones USACE-Galveston Average of hotel and motel unit RES6 All Zones USACE-Galveston Nursing Home COM1 All Zones USACE-Galveston Average of 47 retail classes
COM2 All Zones USACE-Galveston Average of 22 wholesale/warehouse classes
COM3 All Zones USACE-Galveston Average of 16 personal and repair services classes
COM4 All Zones USACE-Galveston Average of business and office COM5 All Zones USACE-Galveston Bank COM6 All Zones USACE-Galveston Hospital COM7 All Zones USACE-Galveston Average of 4 medical office/clinic classes
COM8 All Zones USACE-Galveston Average of 15 entertainment and recreation classes
Source: Scawthorn, Charles et al. HAZUS-MH Flood Loss Estimation Methodology. II. Damage and Loss Assessment. Natural Hazards Review. May 2006.
34 Galveston curves are used since a significant amount of data exists for that location. Corps analyses commonly use these curves for analyses in other parts of the country.
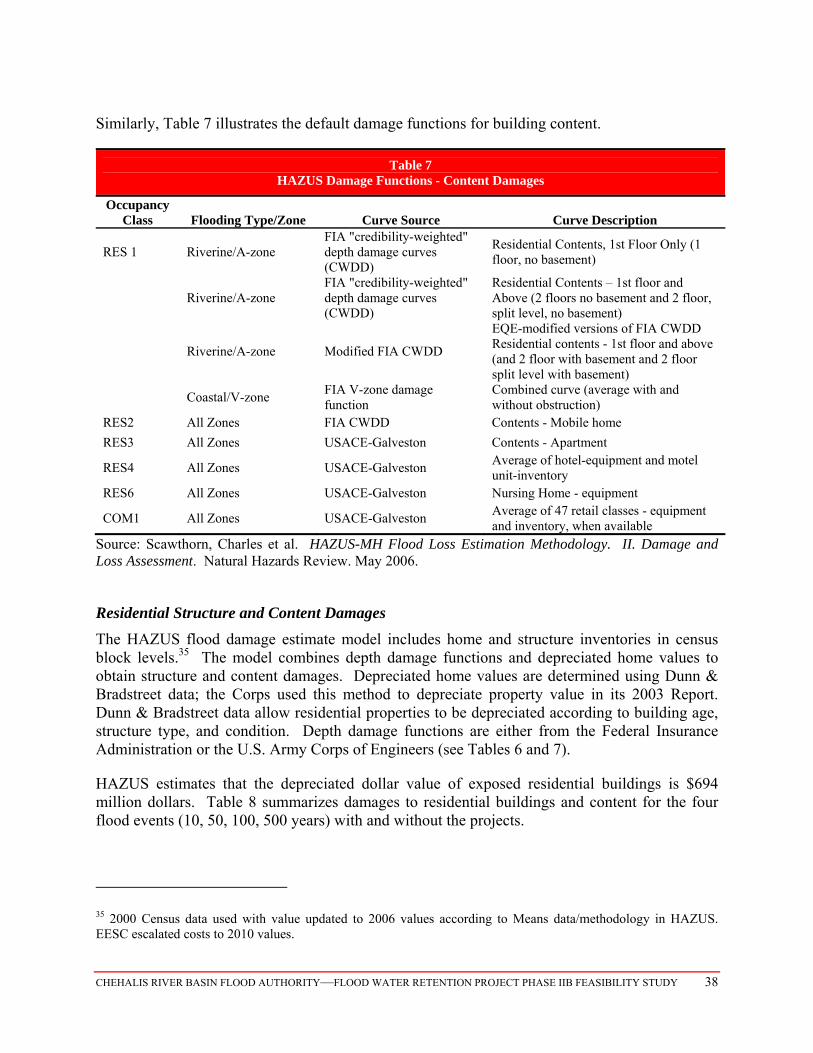
CHEHALIS RIVER BASIN FLOOD AUTHORITY—FLOOD WATER RETENTION PROJECT PHASE IIB FEASIBILITY STUDY 38
Similarly, Table 7 illustrates the default damage functions for building content.
Table 7 HAZUS Damage Functions - Content Damages
Occupancy Class Flooding Type/Zone Curve Source Curve Description
RES 1 Riverine/A-zone FIA "credibility-weighted" depth damage curves (CWDD)
Residential Contents, 1st Floor Only (1 floor, no basement)
Riverine/A-zone FIA "credibility-weighted" depth damage curves (CWDD)
Residential Contents – 1st floor and Above (2 floors no basement and 2 floor, split level, no basement)
Riverine/A-zone Modified FIA CWDD
EQE-modified versions of FIA CWDD Residential contents - 1st floor and above (and 2 floor with basement and 2 floor split level with basement)
Coastal/V-zone FIA V-zone damage function
Combined curve (average with and without obstruction)
RES2 All Zones FIA CWDD Contents - Mobile home
RES3 All Zones USACE-Galveston Contents - Apartment
RES4 All Zones USACE-Galveston Average of hotel-equipment and motel unit-inventory
RES6 All Zones USACE-Galveston Nursing Home - equipment
COM1 All Zones USACE-Galveston Average of 47 retail classes - equipment and inventory, when available
Source: Scawthorn, Charles et al. HAZUS-MH Flood Loss Estimation Methodology. II. Damage and Loss Assessment. Natural Hazards Review. May 2006.
Residential Structure and Content Damages
The HAZUS flood damage estimate model includes home and structure inventories in census block levels.35 The model combines depth damage functions and depreciated home values to obtain structure and content damages. Depreciated home values are determined using Dunn & Bradstreet data; the Corps used this method to depreciate property value in its 2003 Report. Dunn & Bradstreet data allow residential properties to be depreciated according to building age, structure type, and condition. Depth damage functions are either from the Federal Insurance Administration or the U.S. Army Corps of Engineers (see Tables 6 and 7).
HAZUS estimates that the depreciated dollar value of exposed residential buildings is $694 million dollars. Table 8 summarizes damages to residential buildings and content for the four flood events (10, 50, 100, 500 years) with and without the projects.
35 2000 Census data used with value updated to 2006 values according to Means data/methodology in HAZUS. EESC escalated costs to 2010 values.
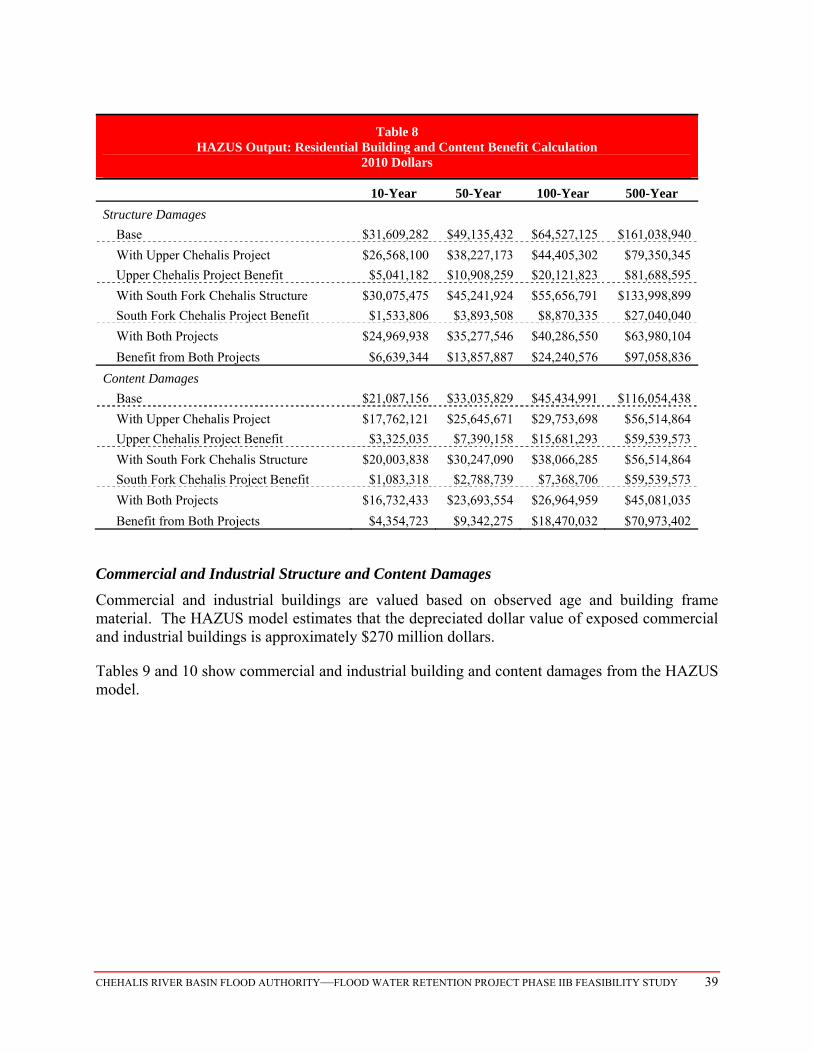
CHEHALIS RIVER BASIN FLOOD AUTHORITY—FLOOD WATER RETENTION PROJECT PHASE IIB FEASIBILITY STUDY 39
Table 8 HAZUS Output: Residential Building and Content Benefit Calculation
2010 Dollars
10-Year 50-Year 100-Year 500-Year
Structure Damages
Base $31,609,282 $49,135,432 $64,527,125 $161,038,940
With Upper Chehalis Project $26,568,100 $38,227,173 $44,405,302 $79,350,345
Upper Chehalis Project Benefit $5,041,182 $10,908,259 $20,121,823 $81,688,595
With South Fork Chehalis Structure $30,075,475 $45,241,924 $55,656,791 $133,998,899
South Fork Chehalis Project Benefit $1,533,806 $3,893,508 $8,870,335 $27,040,040
With Both Projects $24,969,938 $35,277,546 $40,286,550 $63,980,104
Benefit from Both Projects $6,639,344 $13,857,887 $24,240,576 $97,058,836
Content Damages
Base $21,087,156 $33,035,829 $45,434,991 $116,054,438
With Upper Chehalis Project $17,762,121 $25,645,671 $29,753,698 $56,514,864
Upper Chehalis Project Benefit $3,325,035 $7,390,158 $15,681,293 $59,539,573
With South Fork Chehalis Structure $20,003,838 $30,247,090 $38,066,285 $56,514,864
South Fork Chehalis Project Benefit $1,083,318 $2,788,739 $7,368,706 $59,539,573
With Both Projects $16,732,433 $23,693,554 $26,964,959 $45,081,035
Benefit from Both Projects $4,354,723 $9,342,275 $18,470,032 $70,973,402
Commercial and Industrial Structure and Content Damages
Commercial and industrial buildings are valued based on observed age and building frame material. The HAZUS model estimates that the depreciated dollar value of exposed commercial and industrial buildings is approximately $270 million dollars.
Tables 9 and 10 show commercial and industrial building and content damages from the HAZUS model.
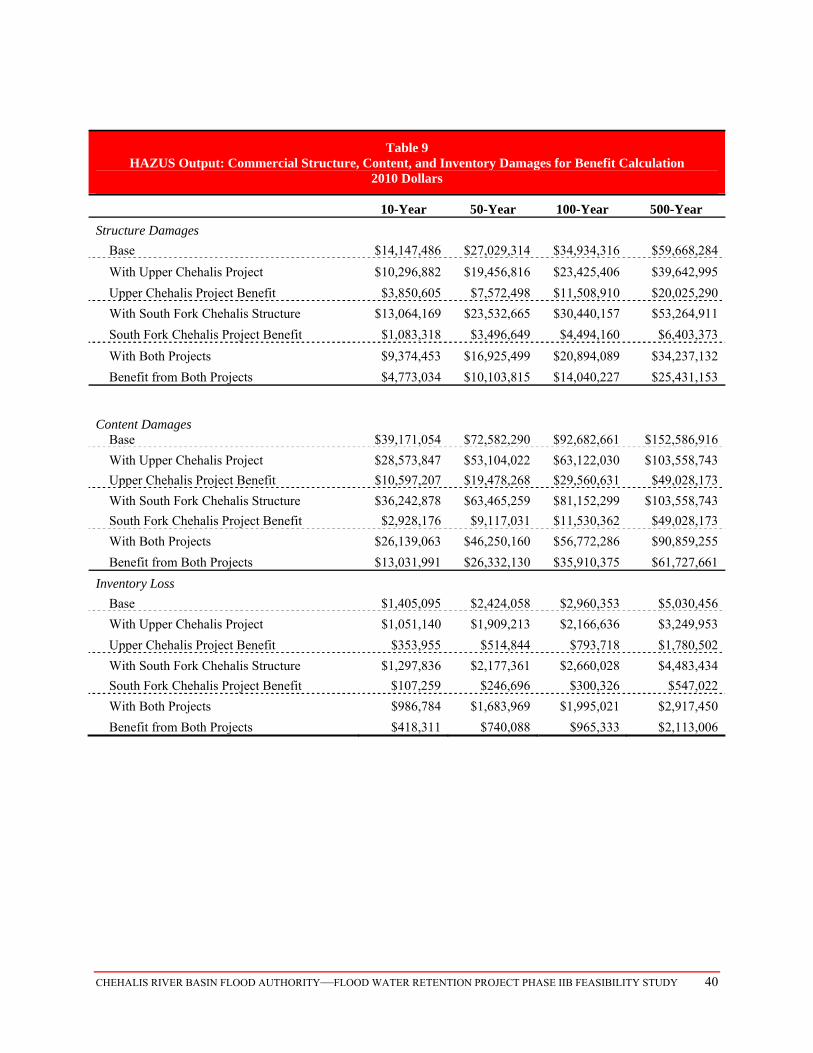
CHEHALIS RIVER BASIN FLOOD AUTHORITY—FLOOD WATER RETENTION PROJECT PHASE IIB FEASIBILITY STUDY 40
Table 9 HAZUS Output: Commercial Structure, Content, and Inventory Damages for Benefit Calculation
2010 Dollars
10-Year 50-Year 100-Year 500-Year
Structure Damages
Base $14,147,486 $27,029,314 $34,934,316 $59,668,284
With Upper Chehalis Project $10,296,882 $19,456,816 $23,425,406 $39,642,995
Upper Chehalis Project Benefit $3,850,605 $7,572,498 $11,508,910 $20,025,290
With South Fork Chehalis Structure $13,064,169 $23,532,665 $30,440,157 $53,264,911
South Fork Chehalis Project Benefit $1,083,318 $3,496,649 $4,494,160 $6,403,373
With Both Projects $9,374,453 $16,925,499 $20,894,089 $34,237,132
Benefit from Both Projects $4,773,034 $10,103,815 $14,040,227 $25,431,153 Content Damages
Base $39,171,054 $72,582,290 $92,682,661 $152,586,916
With Upper Chehalis Project $28,573,847 $53,104,022 $63,122,030 $103,558,743
Upper Chehalis Project Benefit $10,597,207 $19,478,268 $29,560,631 $49,028,173
With South Fork Chehalis Structure $36,242,878 $63,465,259 $81,152,299 $103,558,743
South Fork Chehalis Project Benefit $2,928,176 $9,117,031 $11,530,362 $49,028,173
With Both Projects $26,139,063 $46,250,160 $56,772,286 $90,859,255
Benefit from Both Projects $13,031,991 $26,332,130 $35,910,375 $61,727,661
Inventory Loss
Base $1,405,095 $2,424,058 $2,960,353 $5,030,456
With Upper Chehalis Project $1,051,140 $1,909,213 $2,166,636 $3,249,953
Upper Chehalis Project Benefit $353,955 $514,844 $793,718 $1,780,502
With South Fork Chehalis Structure $1,297,836 $2,177,361 $2,660,028 $4,483,434
South Fork Chehalis Project Benefit $107,259 $246,696 $300,326 $547,022
With Both Projects $986,784 $1,683,969 $1,995,021 $2,917,450
Benefit from Both Projects $418,311 $740,088 $965,333 $2,113,006
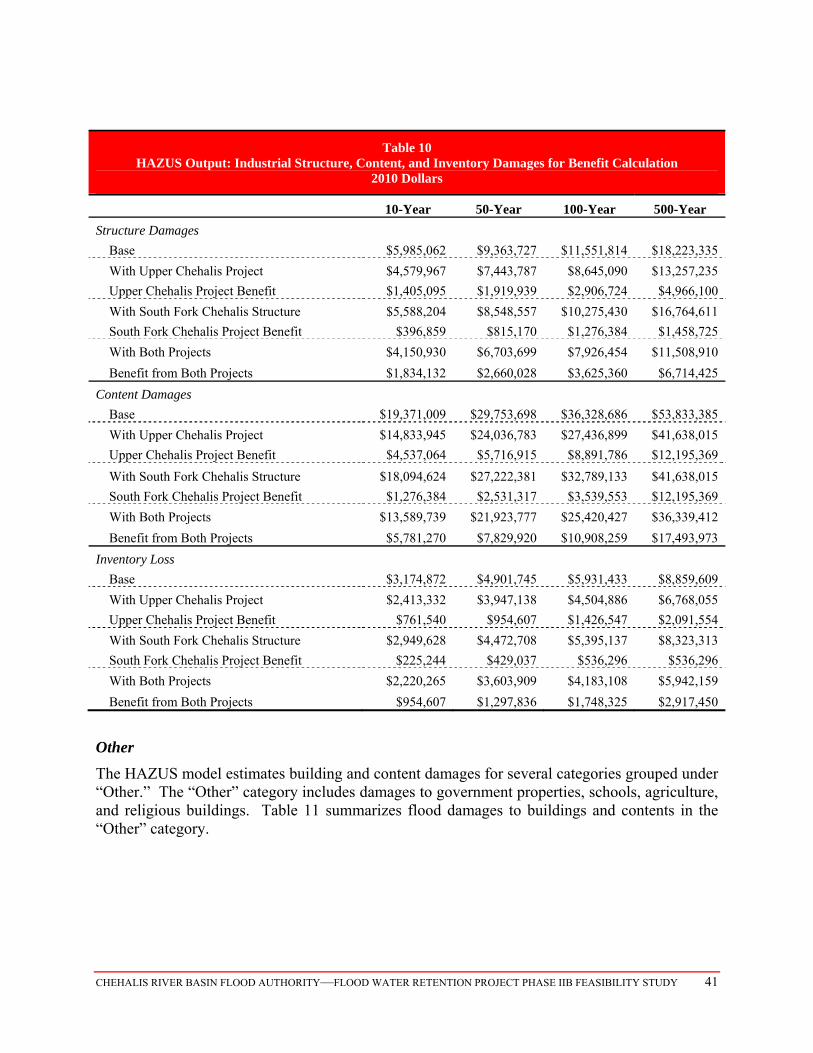
CHEHALIS RIVER BASIN FLOOD AUTHORITY—FLOOD WATER RETENTION PROJECT PHASE IIB FEASIBILITY STUDY 41
Table 10 HAZUS Output: Industrial Structure, Content, and Inventory Damages for Benefit Calculation
2010 Dollars
10-Year 50-Year 100-Year 500-Year
Structure Damages
Base $5,985,062 $9,363,727 $11,551,814 $18,223,335
With Upper Chehalis Project $4,579,967 $7,443,787 $8,645,090 $13,257,235
Upper Chehalis Project Benefit $1,405,095 $1,919,939 $2,906,724 $4,966,100
With South Fork Chehalis Structure $5,588,204 $8,548,557 $10,275,430 $16,764,611
South Fork Chehalis Project Benefit $396,859 $815,170 $1,276,384 $1,458,725
With Both Projects $4,150,930 $6,703,699 $7,926,454 $11,508,910
Benefit from Both Projects $1,834,132 $2,660,028 $3,625,360 $6,714,425
Content Damages
Base $19,371,009 $29,753,698 $36,328,686 $53,833,385
With Upper Chehalis Project $14,833,945 $24,036,783 $27,436,899 $41,638,015
Upper Chehalis Project Benefit $4,537,064 $5,716,915 $8,891,786 $12,195,369
With South Fork Chehalis Structure $18,094,624 $27,222,381 $32,789,133 $41,638,015
South Fork Chehalis Project Benefit $1,276,384 $2,531,317 $3,539,553 $12,195,369
With Both Projects $13,589,739 $21,923,777 $25,420,427 $36,339,412
Benefit from Both Projects $5,781,270 $7,829,920 $10,908,259 $17,493,973
Inventory Loss
Base $3,174,872 $4,901,745 $5,931,433 $8,859,609
With Upper Chehalis Project $2,413,332 $3,947,138 $4,504,886 $6,768,055
Upper Chehalis Project Benefit $761,540 $954,607 $1,426,547 $2,091,554
With South Fork Chehalis Structure $2,949,628 $4,472,708 $5,395,137 $8,323,313
South Fork Chehalis Project Benefit $225,244 $429,037 $536,296 $536,296
With Both Projects $2,220,265 $3,603,909 $4,183,108 $5,942,159
Benefit from Both Projects $954,607 $1,297,836 $1,748,325 $2,917,450
Other
The HAZUS model estimates building and content damages for several categories grouped under “Other.” The “Other” category includes damages to government properties, schools, agriculture, and religious buildings. Table 11 summarizes flood damages to buildings and contents in the “Other” category.
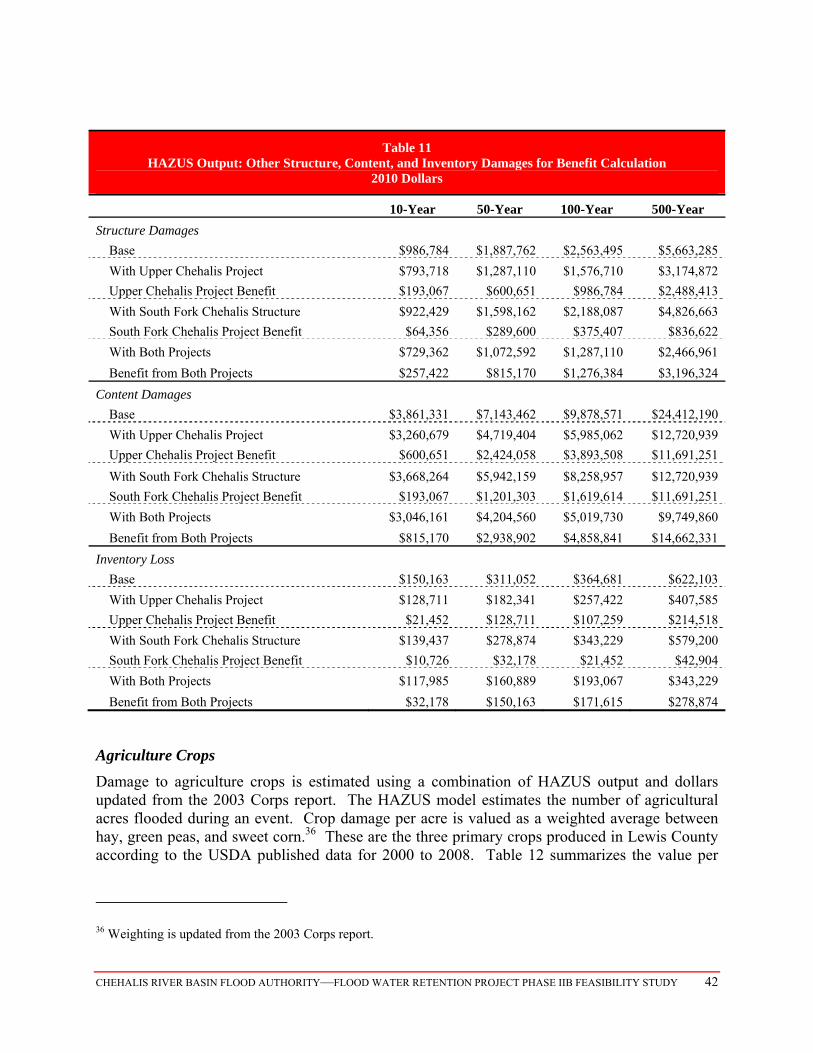
CHEHALIS RIVER BASIN FLOOD AUTHORITY—FLOOD WATER RETENTION PROJECT PHASE IIB FEASIBILITY STUDY 42
Table 11 HAZUS Output: Other Structure, Content, and Inventory Damages for Benefit Calculation
2010 Dollars
10-Year 50-Year 100-Year 500-Year
Structure Damages
Base $986,784 $1,887,762 $2,563,495 $5,663,285
With Upper Chehalis Project $793,718 $1,287,110 $1,576,710 $3,174,872
Upper Chehalis Project Benefit $193,067 $600,651 $986,784 $2,488,413
With South Fork Chehalis Structure $922,429 $1,598,162 $2,188,087 $4,826,663
South Fork Chehalis Project Benefit $64,356 $289,600 $375,407 $836,622
With Both Projects $729,362 $1,072,592 $1,287,110 $2,466,961
Benefit from Both Projects $257,422 $815,170 $1,276,384 $3,196,324
Content Damages
Base $3,861,331 $7,143,462 $9,878,571 $24,412,190
With Upper Chehalis Project $3,260,679 $4,719,404 $5,985,062 $12,720,939
Upper Chehalis Project Benefit $600,651 $2,424,058 $3,893,508 $11,691,251
With South Fork Chehalis Structure $3,668,264 $5,942,159 $8,258,957 $12,720,939
South Fork Chehalis Project Benefit $193,067 $1,201,303 $1,619,614 $11,691,251
With Both Projects $3,046,161 $4,204,560 $5,019,730 $9,749,860
Benefit from Both Projects $815,170 $2,938,902 $4,858,841 $14,662,331
Inventory Loss
Base $150,163 $311,052 $364,681 $622,103
With Upper Chehalis Project $128,711 $182,341 $257,422 $407,585
Upper Chehalis Project Benefit $21,452 $128,711 $107,259 $214,518
With South Fork Chehalis Structure $139,437 $278,874 $343,229 $579,200
South Fork Chehalis Project Benefit $10,726 $32,178 $21,452 $42,904
With Both Projects $117,985 $160,889 $193,067 $343,229
Benefit from Both Projects $32,178 $150,163 $171,615 $278,874
Agriculture Crops
Damage to agriculture crops is estimated using a combination of HAZUS output and dollars updated from the 2003 Corps report. The HAZUS model estimates the number of agricultural acres flooded during an event. Crop damage per acre is valued as a weighted average between hay, green peas, and sweet corn.36 These are the three primary crops produced in Lewis County according to the USDA published data for 2000 to 2008. Table 12 summarizes the value per
36 Weighting is updated from the 2003 Corps report.
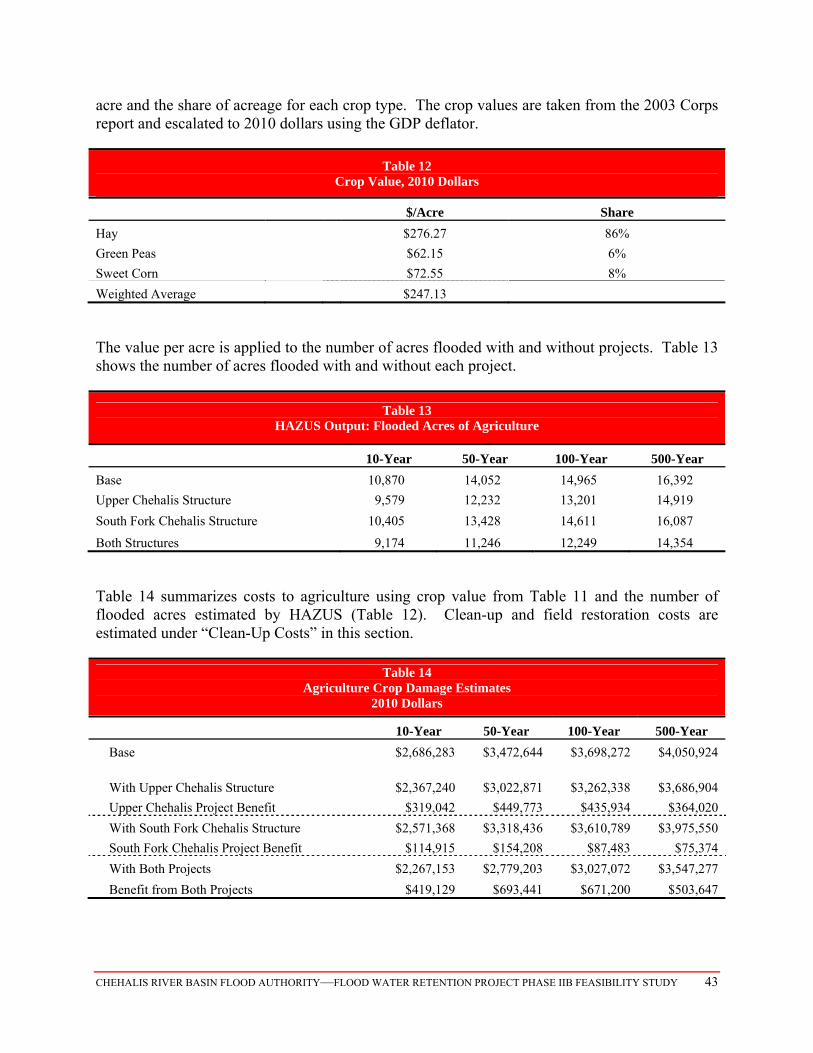
CHEHALIS RIVER BASIN FLOOD AUTHORITY—FLOOD WATER RETENTION PROJECT PHASE IIB FEASIBILITY STUDY 43
acre and the share of acreage for each crop type. The crop values are taken from the 2003 Corps report and escalated to 2010 dollars using the GDP deflator.
Table 12 Crop Value, 2010 Dollars
$/Acre Share
Hay $276.27 86%
Green Peas $62.15 6%
Sweet Corn $72.55 8%
Weighted Average $247.13
The value per acre is applied to the number of acres flooded with and without projects. Table 13 shows the number of acres flooded with and without each project.
Table 13 HAZUS Output: Flooded Acres of Agriculture
10-Year 50-Year 100-Year 500-Year
Base 10,870 14,052 14,965 16,392
Upper Chehalis Structure 9,579 12,232 13,201 14,919
South Fork Chehalis Structure 10,405 13,428 14,611 16,087
Both Structures 9,174 11,246 12,249 14,354
Table 14 summarizes costs to agriculture using crop value from Table 11 and the number of flooded acres estimated by HAZUS (Table 12). Clean-up and field restoration costs are estimated under “Clean-Up Costs” in this section.
Table 14 Agriculture Crop Damage Estimates
2010 Dollars
10-Year 50-Year 100-Year 500-Year
Base $2,686,283 $3,472,644 $3,698,272 $4,050,924
With Upper Chehalis Structure $2,367,240 $3,022,871 $3,262,338 $3,686,904
Upper Chehalis Project Benefit $319,042 $449,773 $435,934 $364,020
With South Fork Chehalis Structure $2,571,368 $3,318,436 $3,610,789 $3,975,550
South Fork Chehalis Project Benefit $114,915 $154,208 $87,483 $75,374
With Both Projects $2,267,153 $2,779,203 $3,027,072 $3,547,277
Benefit from Both Projects $419,129 $693,441 $671,200 $503,647
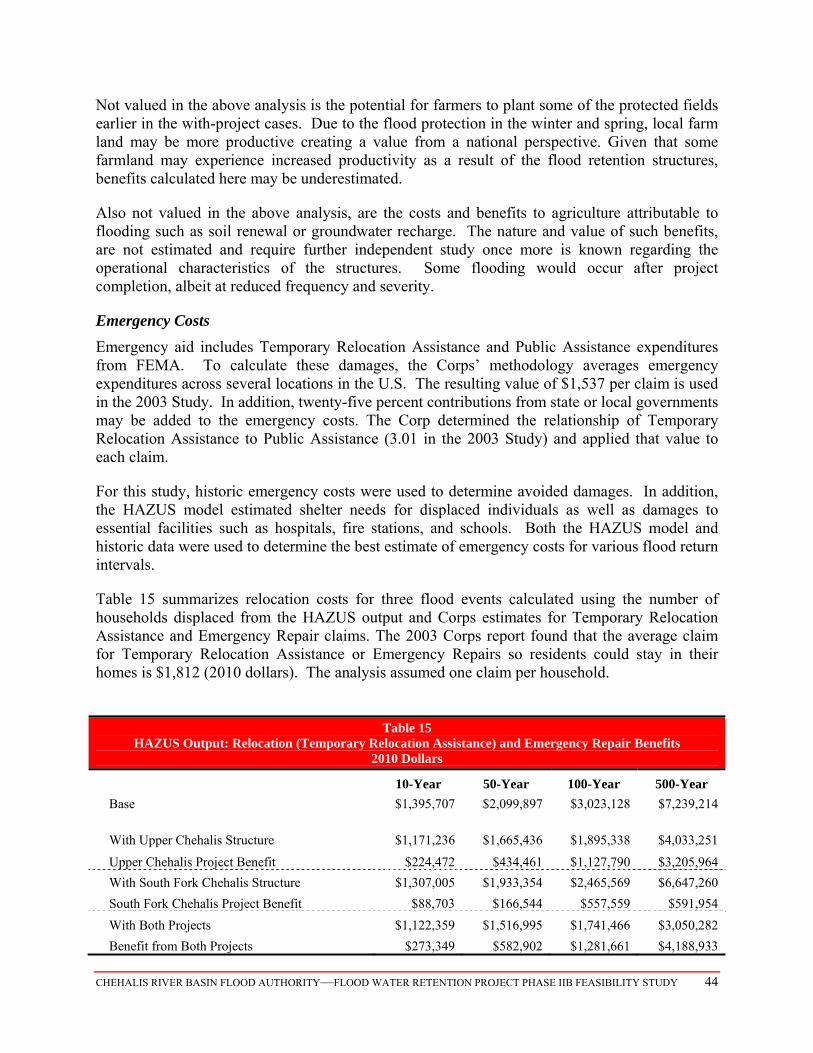
CHEHALIS RIVER BASIN FLOOD AUTHORITY—FLOOD WATER RETENTION PROJECT PHASE IIB FEASIBILITY STUDY 44
Not valued in the above analysis is the potential for farmers to plant some of the protected fields earlier in the with-project cases. Due to the flood protection in the winter and spring, local farm land may be more productive creating a value from a national perspective. Given that some farmland may experience increased productivity as a result of the flood retention structures, benefits calculated here may be underestimated.
Also not valued in the above analysis, are the costs and benefits to agriculture attributable to flooding such as soil renewal or groundwater recharge. The nature and value of such benefits, are not estimated and require further independent study once more is known regarding the operational characteristics of the structures. Some flooding would occur after project completion, albeit at reduced frequency and severity.
Emergency Costs
Emergency aid includes Temporary Relocation Assistance and Public Assistance expenditures from FEMA. To calculate these damages, the Corps’ methodology averages emergency expenditures across several locations in the U.S. The resulting value of $1,537 per claim is used in the 2003 Study. In addition, twenty-five percent contributions from state or local governments may be added to the emergency costs. The Corp determined the relationship of Temporary Relocation Assistance to Public Assistance (3.01 in the 2003 Study) and applied that value to each claim.
For this study, historic emergency costs were used to determine avoided damages. In addition, the HAZUS model estimated shelter needs for displaced individuals as well as damages to essential facilities such as hospitals, fire stations, and schools. Both the HAZUS model and historic data were used to determine the best estimate of emergency costs for various flood return intervals.
Table 15 summarizes relocation costs for three flood events calculated using the number of households displaced from the HAZUS output and Corps estimates for Temporary Relocation Assistance and Emergency Repair claims. The 2003 Corps report found that the average claim for Temporary Relocation Assistance or Emergency Repairs so residents could stay in their homes is $1,812 (2010 dollars). The analysis assumed one claim per household.
Table 15
HAZUS Output: Relocation (Temporary Relocation Assistance) and Emergency Repair Benefits 2010 Dollars
10-Year 50-Year 100-Year 500-Year
Base $1,395,707 $2,099,897 $3,023,128 $7,239,214
With Upper Chehalis Structure $1,171,236 $1,665,436 $1,895,338 $4,033,251
Upper Chehalis Project Benefit $224,472 $434,461 $1,127,790 $3,205,964
With South Fork Chehalis Structure $1,307,005 $1,933,354 $2,465,569 $6,647,260
South Fork Chehalis Project Benefit $88,703 $166,544 $557,559 $591,954
With Both Projects $1,122,359 $1,516,995 $1,741,466 $3,050,282
Benefit from Both Projects $273,349 $582,902 $1,281,661 $4,188,933
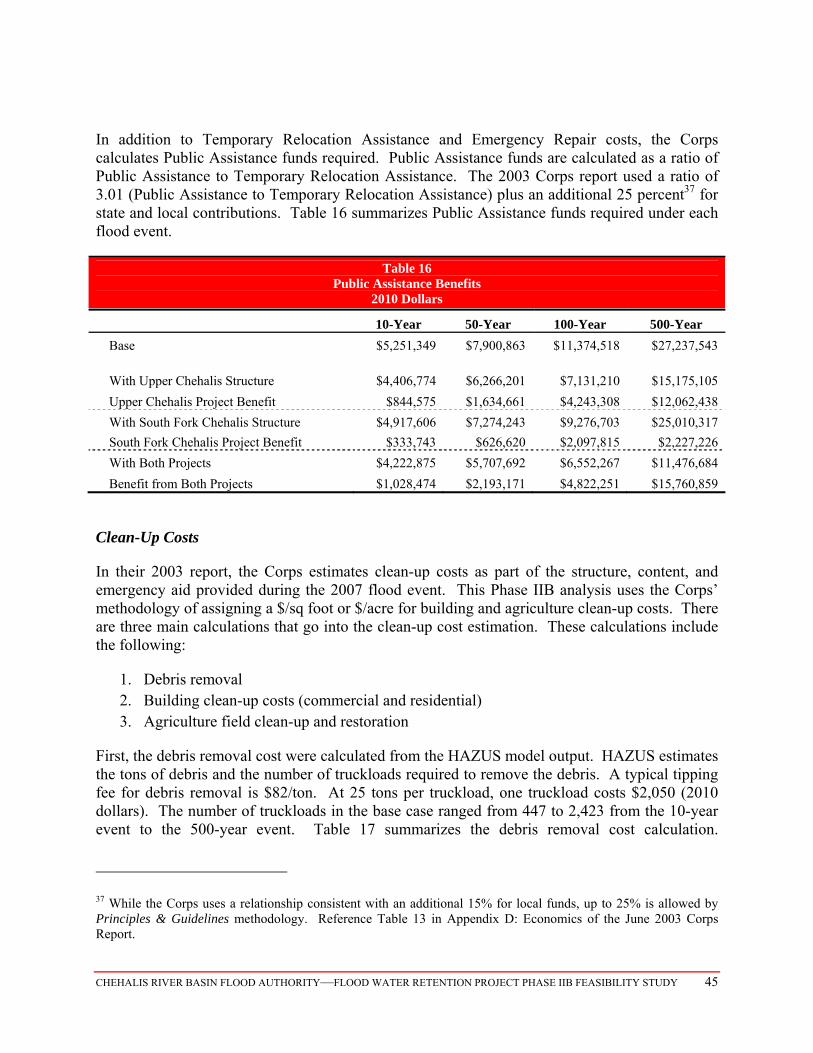
CHEHALIS RIVER BASIN FLOOD AUTHORITY—FLOOD WATER RETENTION PROJECT PHASE IIB FEASIBILITY STUDY 45
In addition to Temporary Relocation Assistance and Emergency Repair costs, the Corps calculates Public Assistance funds required. Public Assistance funds are calculated as a ratio of Public Assistance to Temporary Relocation Assistance. The 2003 Corps report used a ratio of 3.01 (Public Assistance to Temporary Relocation Assistance) plus an additional 25 percent37 for state and local contributions. Table 16 summarizes Public Assistance funds required under each flood event.
Table 16 Public Assistance Benefits
2010 Dollars
10-Year 50-Year 100-Year 500-Year
Base $5,251,349 $7,900,863 $11,374,518 $27,237,543
With Upper Chehalis Structure $4,406,774 $6,266,201 $7,131,210 $15,175,105
Upper Chehalis Project Benefit $844,575 $1,634,661 $4,243,308 $12,062,438
With South Fork Chehalis Structure $4,917,606 $7,274,243 $9,276,703 $25,010,317
South Fork Chehalis Project Benefit $333,743 $626,620 $2,097,815 $2,227,226
With Both Projects $4,222,875 $5,707,692 $6,552,267 $11,476,684
Benefit from Both Projects $1,028,474 $2,193,171 $4,822,251 $15,760,859
Clean-Up Costs
In their 2003 report, the Corps estimates clean-up costs as part of the structure, content, and emergency aid provided during the 2007 flood event. This Phase IIB analysis uses the Corps’ methodology of assigning a $/sq foot or $/acre for building and agriculture clean-up costs. There are three main calculations that go into the clean-up cost estimation. These calculations include the following:
1. Debris removal 2. Building clean-up costs (commercial and residential) 3. Agriculture field clean-up and restoration
First, the debris removal cost were calculated from the HAZUS model output. HAZUS estimates the tons of debris and the number of truckloads required to remove the debris. A typical tipping fee for debris removal is $82/ton. At 25 tons per truckload, one truckload costs $2,050 (2010 dollars). The number of truckloads in the base case ranged from 447 to 2,423 from the 10-year event to the 500-year event. Table 17 summarizes the debris removal cost calculation.
37 While the Corps uses a relationship consistent with an additional 15% for local funds, up to 25% is allowed by Principles & Guidelines methodology. Reference Table 13 in Appendix D: Economics of the June 2003 Corps Report.
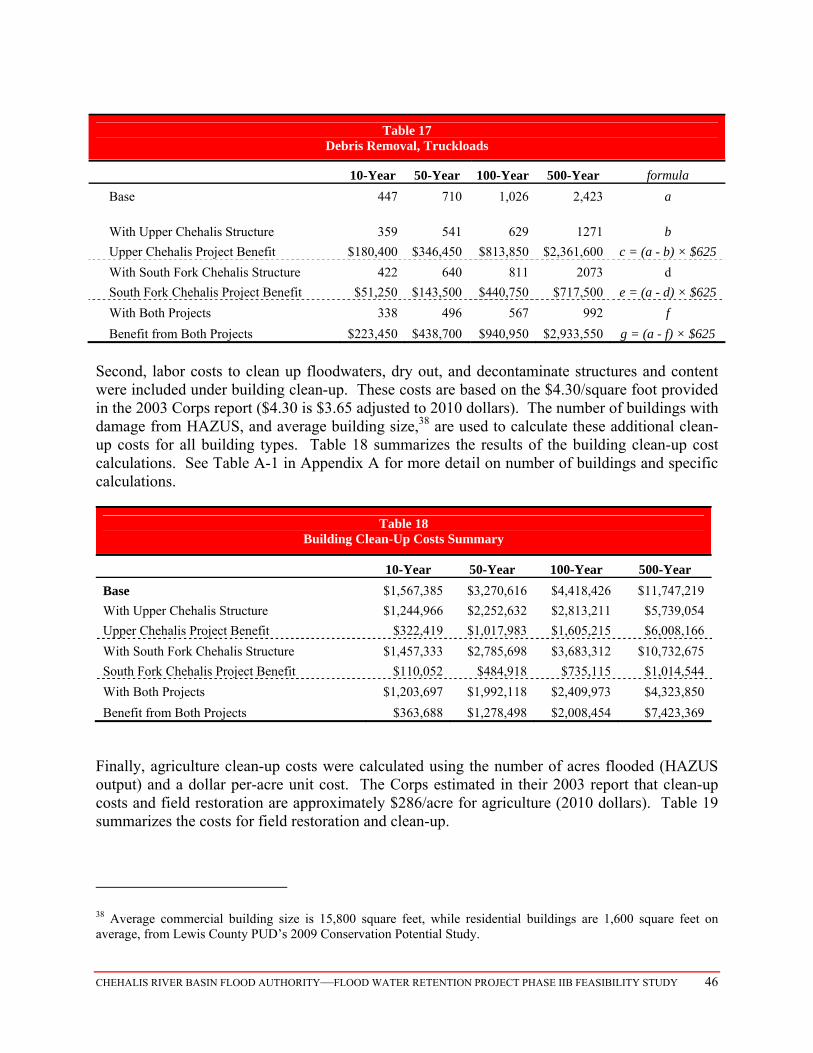
CHEHALIS RIVER BASIN FLOOD AUTHORITY—FLOOD WATER RETENTION PROJECT PHASE IIB FEASIBILITY STUDY 46
Table 17 Debris Removal, Truckloads
10-Year 50-Year 100-Year 500-Year formula
Base 447 710 1,026 2,423 a
With Upper Chehalis Structure 359 541 629 1271 b
Upper Chehalis Project Benefit $180,400 $346,450 $813,850 $2,361,600 c = (a - b) × $625
With South Fork Chehalis Structure 422 640 811 2073 d
South Fork Chehalis Project Benefit $51,250 $143,500 $440,750 $717,500 e = (a - d) × $625
With Both Projects 338 496 567 992 f
Benefit from Both Projects $223,450 $438,700 $940,950 $2,933,550 g = (a - f) × $625
Second, labor costs to clean up floodwaters, dry out, and decontaminate structures and content were included under building clean-up. These costs are based on the $4.30/square foot provided in the 2003 Corps report ($4.30 is $3.65 adjusted to 2010 dollars). The number of buildings with damage from HAZUS, and average building size,38 are used to calculate these additional clean-up costs for all building types. Table 18 summarizes the results of the building clean-up cost calculations. See Table A-1 in Appendix A for more detail on number of buildings and specific calculations.
Table 18 Building Clean-Up Costs Summary
10-Year 50-Year 100-Year 500-Year
Base $1,567,385 $3,270,616 $4,418,426 $11,747,219
With Upper Chehalis Structure $1,244,966 $2,252,632 $2,813,211 $5,739,054
Upper Chehalis Project Benefit $322,419 $1,017,983 $1,605,215 $6,008,166
With South Fork Chehalis Structure $1,457,333 $2,785,698 $3,683,312 $10,732,675
South Fork Chehalis Project Benefit $110,052 $484,918 $735,115 $1,014,544
With Both Projects $1,203,697 $1,992,118 $2,409,973 $4,323,850
Benefit from Both Projects $363,688 $1,278,498 $2,008,454 $7,423,369
Finally, agriculture clean-up costs were calculated using the number of acres flooded (HAZUS output) and a dollar per-acre unit cost. The Corps estimated in their 2003 report that clean-up costs and field restoration are approximately $286/acre for agriculture (2010 dollars). Table 19 summarizes the costs for field restoration and clean-up.
38 Average commercial building size is 15,800 square feet, while residential buildings are 1,600 square feet on average, from Lewis County PUD’s 2009 Conservation Potential Study.
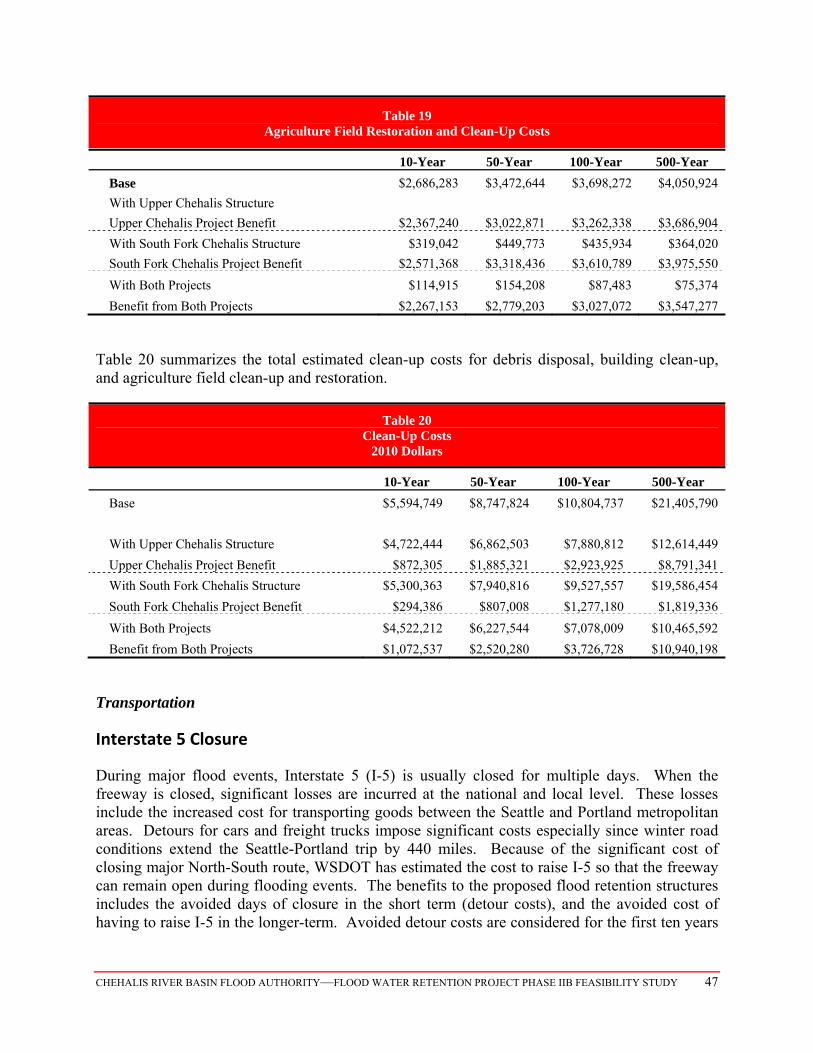
CHEHALIS RIVER BASIN FLOOD AUTHORITY—FLOOD WATER RETENTION PROJECT PHASE IIB FEASIBILITY STUDY 47
Table 19 Agriculture Field Restoration and Clean-Up Costs
10-Year 50-Year 100-Year 500-Year
Base $2,686,283 $3,472,644 $3,698,272 $4,050,924
With Upper Chehalis Structure
Upper Chehalis Project Benefit $2,367,240 $3,022,871 $3,262,338 $3,686,904
With South Fork Chehalis Structure $319,042 $449,773 $435,934 $364,020
South Fork Chehalis Project Benefit $2,571,368 $3,318,436 $3,610,789 $3,975,550
With Both Projects $114,915 $154,208 $87,483 $75,374
Benefit from Both Projects $2,267,153 $2,779,203 $3,027,072 $3,547,277
Table 20 summarizes the total estimated clean-up costs for debris disposal, building clean-up, and agriculture field clean-up and restoration.
Table 20 Clean-Up Costs
2010 Dollars
10-Year 50-Year 100-Year 500-Year
Base $5,594,749 $8,747,824 $10,804,737 $21,405,790
With Upper Chehalis Structure $4,722,444 $6,862,503 $7,880,812 $12,614,449
Upper Chehalis Project Benefit $872,305 $1,885,321 $2,923,925 $8,791,341
With South Fork Chehalis Structure $5,300,363 $7,940,816 $9,527,557 $19,586,454
South Fork Chehalis Project Benefit $294,386 $807,008 $1,277,180 $1,819,336
With Both Projects $4,522,212 $6,227,544 $7,078,009 $10,465,592
Benefit from Both Projects $1,072,537 $2,520,280 $3,726,728 $10,940,198
Transportation
Interstate 5 Closure
During major flood events, Interstate 5 (I-5) is usually closed for multiple days. When the freeway is closed, significant losses are incurred at the national and local level. These losses include the increased cost for transporting goods between the Seattle and Portland metropolitan areas. Detours for cars and freight trucks impose significant costs especially since winter road conditions extend the Seattle-Portland trip by 440 miles. Because of the significant cost of closing major North-South route, WSDOT has estimated the cost to raise I-5 so that the freeway can remain open during flooding events. The benefits to the proposed flood retention structures includes the avoided days of closure in the short term (detour costs), and the avoided cost of having to raise I-5 in the longer-term. Avoided detour costs are considered for the first ten years
CHEHALIS RIVER BASIN FLOOD AUTHORITY—FLOOD WATER RETENTION PROJECT PHASE IIB FEASIBILITY STUDY 48
of the analysis, while avoided costs for raising the I-5 roadway level are included as benefits after year 10.
In general, I-5 transportation delay and detour costs are estimated using cost per vehicle separated into cars (and light trucks) and freight traffic. The methodology used to estimate both the number of trips and the value of trips for cars is taken directly from the Corps’ 2003 report. This methodology accounts only for current traffic volumes (no escalation due to economic or population growth). The value of each trip is calculated using updated assumptions from the Corp’s 2003 analysis as well. These assumptions include the median household income, detour route, vehicle mileage costs, and occupancy. Future studies could utilize more sophisticated and detailed modeling of traffic to account for different types of trips (business, personal, charity) and to account for the value of trips that do not occur when that value differs across purpose and duration of closure. In particular, WSDOT has a traffic model for Lewis County that includes I-5 information. As more detailed studies are conducted, analysts could utilize the traffic model and its data to more accurately estimate the cost of I-5 closure on car traffic.
The section below first discusses the methodology used to value the flood reduction benefits to I-5 of each with project scenario. Following the methodology description, the cost estimates are given.
Avoided Cost to Raise I-5
The key assumption made for the analysis is that WSDOT would not raise the freeway if I-5 stays dry in the 100-year flood, thereby avoiding a cost of approximately $100 million. Historically, I-5 has been flooded in three main areas: the Highway 6 overpass, near the airport, and Salzer Creek to Mellen Street. Northwest Hydraulic Consultants modeled several flood events for with- and without project scenarios. From their modeling, the area of I-5 near the airport was the only concern.39
In past flood events, water has overtopped the airport levee creating pools on the other side and over I-5. Even when flood waters recede, the pool behind the airport levee is slow to drain since the water is trapped behind the levee. In 2009, the levee was temporarily breached to allow flood waters to drain back into the river. NHC analyzed flood elevations near the airport levee for each with and without project scenario. Figure 11 compares the average levee elevation and flood levels for a 100 year event.
39 The following caveats should be considered with regard to the data provided by NHC. The existing levee elevations are average; there are high and low spots along the reaches modeled. The flood events modeled refer to flows consistent with the flood return interval events on the Chehalis River. In addition, significant events on tributaries are not considered. Finally, while the hydrology model is calibrated to the 100 year events, the model is not calibrated for the 10, 50 and 500-year events.
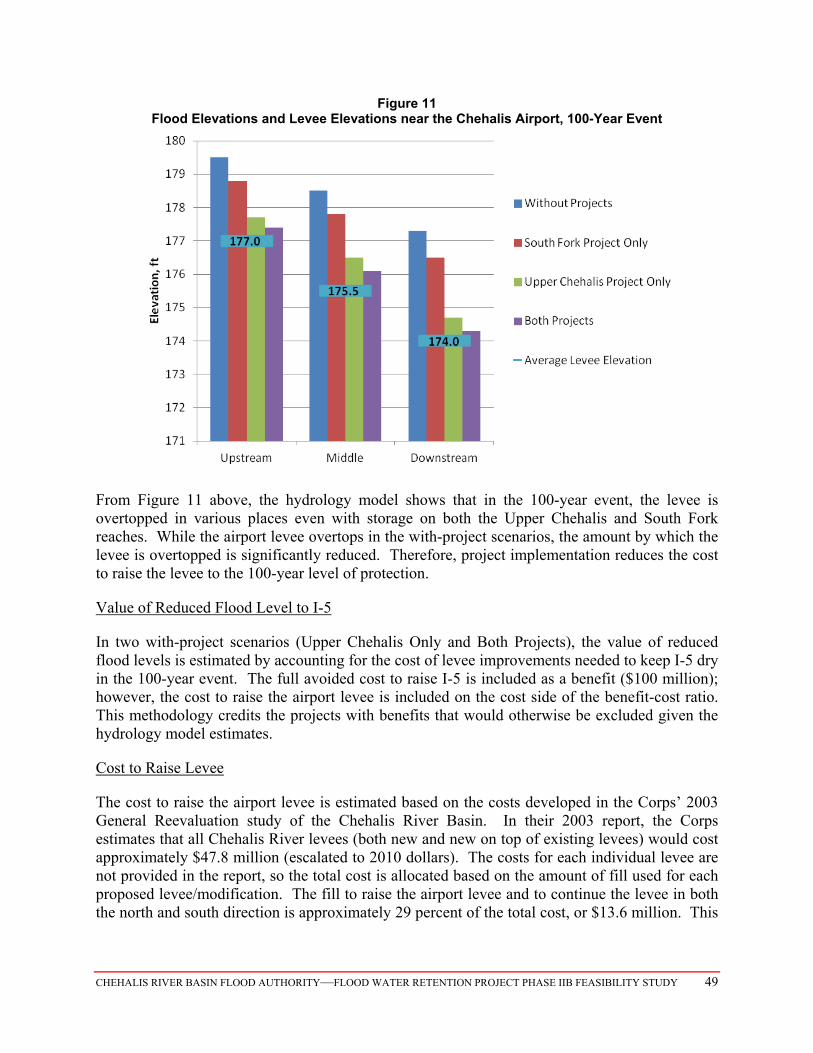
CHEHALIS RIVER BASIN FLOOD AUTHORITY—FLOOD WATER RETENTION PROJECT PHASE IIB FEASIBILITY STUDY 49
Figure 11 Flood Elevations and Levee Elevations near the Chehalis Airport, 100-Year Event
From Figure 11 above, the hydrology model shows that in the 100-year event, the levee is overtopped in various places even with storage on both the Upper Chehalis and South Fork reaches. While the airport levee overtops in the with-project scenarios, the amount by which the levee is overtopped is significantly reduced. Therefore, project implementation reduces the cost to raise the levee to the 100-year level of protection.
Value of Reduced Flood Level to I-5
In two with-project scenarios (Upper Chehalis Only and Both Projects), the value of reduced flood levels is estimated by accounting for the cost of levee improvements needed to keep I-5 dry in the 100-year event. The full avoided cost to raise I-5 is included as a benefit ($100 million); however, the cost to raise the airport levee is included on the cost side of the benefit-cost ratio. This methodology credits the projects with benefits that would otherwise be excluded given the hydrology model estimates.
Cost to Raise Levee
The cost to raise the airport levee is estimated based on the costs developed in the Corps’ 2003 General Reevaluation study of the Chehalis River Basin. In their 2003 report, the Corps estimates that all Chehalis River levees (both new and new on top of existing levees) would cost approximately $47.8 million (escalated to 2010 dollars). The costs for each individual levee are not provided in the report, so the total cost is allocated based on the amount of fill used for each proposed levee/modification. The fill to raise the airport levee and to continue the levee in both the north and south direction is approximately 29 percent of the total cost, or $13.6 million. This
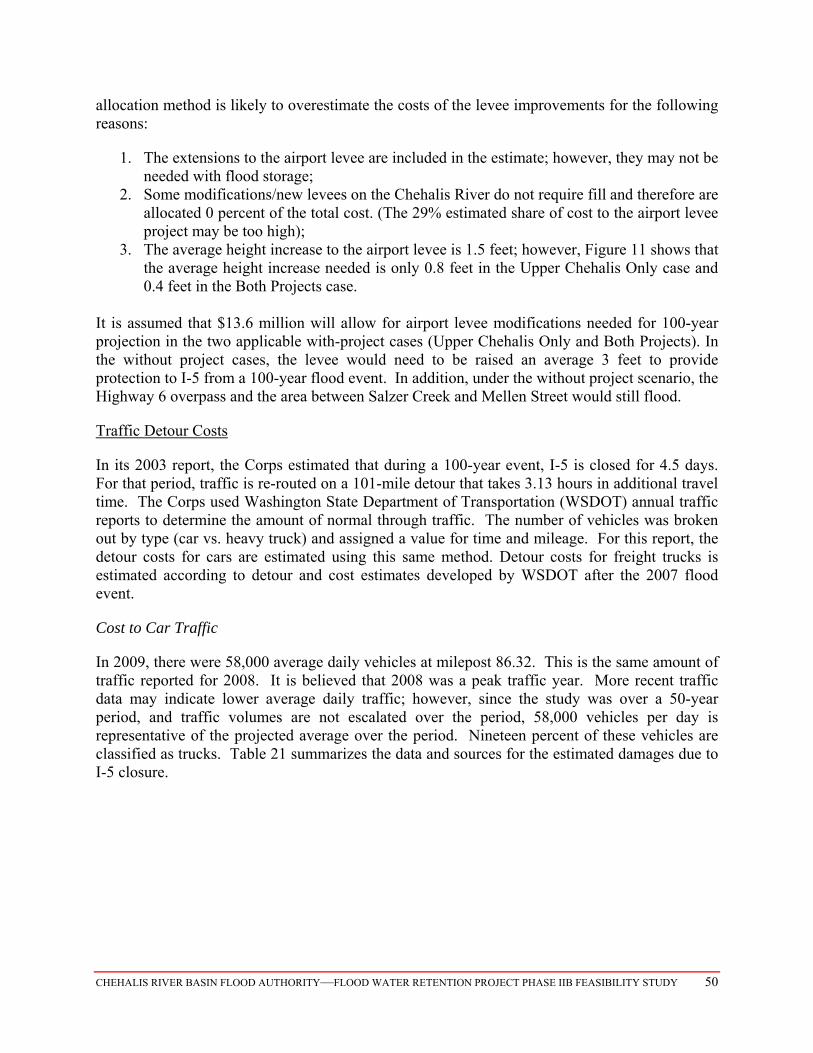
CHEHALIS RIVER BASIN FLOOD AUTHORITY—FLOOD WATER RETENTION PROJECT PHASE IIB FEASIBILITY STUDY 50
allocation method is likely to overestimate the costs of the levee improvements for the following reasons:
1. The extensions to the airport levee are included in the estimate; however, they may not be needed with flood storage;
2. Some modifications/new levees on the Chehalis River do not require fill and therefore are allocated 0 percent of the total cost. (The 29% estimated share of cost to the airport levee project may be too high);
3. The average height increase to the airport levee is 1.5 feet; however, Figure 11 shows that the average height increase needed is only 0.8 feet in the Upper Chehalis Only case and 0.4 feet in the Both Projects case.
It is assumed that $13.6 million will allow for airport levee modifications needed for 100-year projection in the two applicable with-project cases (Upper Chehalis Only and Both Projects). In the without project cases, the levee would need to be raised an average 3 feet to provide protection to I-5 from a 100-year flood event. In addition, under the without project scenario, the Highway 6 overpass and the area between Salzer Creek and Mellen Street would still flood.
Traffic Detour Costs
In its 2003 report, the Corps estimated that during a 100-year event, I-5 is closed for 4.5 days. For that period, traffic is re-routed on a 101-mile detour that takes 3.13 hours in additional travel time. The Corps used Washington State Department of Transportation (WSDOT) annual traffic reports to determine the amount of normal through traffic. The number of vehicles was broken out by type (car vs. heavy truck) and assigned a value for time and mileage. For this report, the detour costs for cars are estimated using this same method. Detour costs for freight trucks is estimated according to detour and cost estimates developed by WSDOT after the 2007 flood event.
Cost to Car Traffic
In 2009, there were 58,000 average daily vehicles at milepost 86.32. This is the same amount of traffic reported for 2008. It is believed that 2008 was a peak traffic year. More recent traffic data may indicate lower average daily traffic; however, since the study was over a 50-year period, and traffic volumes are not escalated over the period, 58,000 vehicles per day is representative of the projected average over the period. Nineteen percent of these vehicles are classified as trucks. Table 21 summarizes the data and sources for the estimated damages due to I-5 closure.
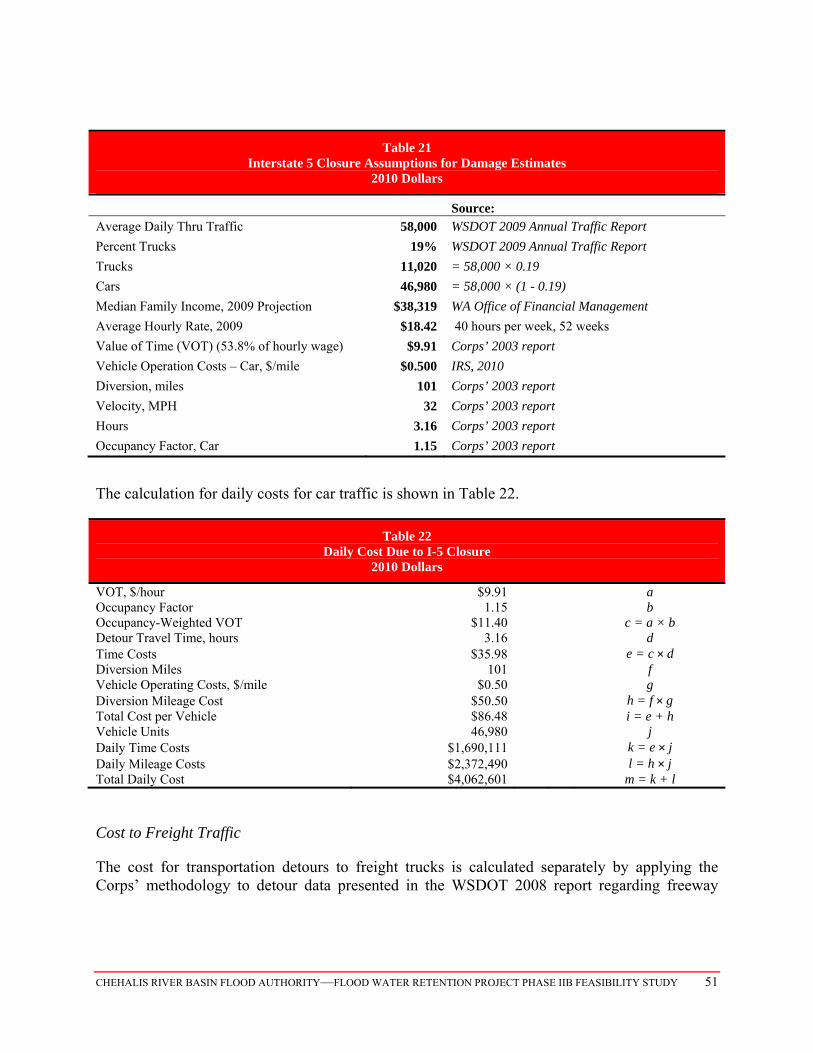
CHEHALIS RIVER BASIN FLOOD AUTHORITY—FLOOD WATER RETENTION PROJECT PHASE IIB FEASIBILITY STUDY 51
Table 21 Interstate 5 Closure Assumptions for Damage Estimates
2010 Dollars
Source: Average Daily Thru Traffic 58,000 WSDOT 2009 Annual Traffic Report
Percent Trucks 19% WSDOT 2009 Annual Traffic Report
Trucks 11,020 = 58,000 × 0.19
Cars 46,980 = 58,000 × (1 - 0.19)
Median Family Income, 2009 Projection $38,319 WA Office of Financial Management
Average Hourly Rate, 2009 $18.42 40 hours per week, 52 weeks
Value of Time (VOT) (53.8% of hourly wage) $9.91 Corps’ 2003 report
Vehicle Operation Costs – Car, $/mile $0.500 IRS, 2010
Diversion, miles 101 Corps’ 2003 report
Velocity, MPH 32 Corps’ 2003 report
Hours 3.16 Corps’ 2003 report
Occupancy Factor, Car 1.15 Corps’ 2003 report
The calculation for daily costs for car traffic is shown in Table 22.
Table 22 Daily Cost Due to I-5 Closure
2010 Dollars
VOT, $/hour $9.91 a Occupancy Factor 1.15 b Occupancy-Weighted VOT $11.40 c = a × b Detour Travel Time, hours 3.16 d Time Costs $35.98 e = c × d Diversion Miles 101 f Vehicle Operating Costs, $/mile $0.50 g Diversion Mileage Cost $50.50 h = f × g Total Cost per Vehicle $86.48 i = e + h Vehicle Units 46,980 j Daily Time Costs $1,690,111 k = e × j Daily Mileage Costs $2,372,490 l = h × j Total Daily Cost $4,062,601 m = k + l
Cost to Freight Traffic
The cost for transportation detours to freight trucks is calculated separately by applying the Corps’ methodology to detour data presented in the WSDOT 2008 report regarding freeway

CHEHALIS RIVER BASIN FLOOD AUTHORITY—FLOOD WATER RETENTION PROJECT PHASE IIB FEASIBILITY STUDY 52
closures in 2007.40 According to the report, freight companies reported that the detour routes cost an additional $500 to $850 per truckload. The cost per truck used in this analysis is calculated from a weighted average based on the number of trips taken for each detour route during the 2007 closure. The number of trips per detour route was estimated based on the actual traffic volumes during the week of the 2007 flood compared to the same week the previous year. The resulting weighted average is $551 per truck. These costs take into consideration additional time, fuel, mileage, and the 10-hour rest period required for drivers after 11 hours of driving. The four detour routes below were considered.
I-84 in Oregon, over I-82 and I-90 in Washington (additional 440 miles) – cost: $800-$850/truckload
US 97 to I-82 and I-90 in Washington (344 additional miles) – Cost is $500/truckload US 97 to US 12 to US 7 – Cost is $500/truckload US 12 to US 7 (85 additional miles, certain trucks allowed on a case-by-case basis) – Cost is
$100/truckload
These routes are illustrated in Figure 12.
Figure 12 I-5 Truck Detour Routes
40 WSDOT. Storm-Related Closures of I-5 and I-90: Freight Transportation Economic Impact Assessment Report. Winter 2007-2008. Final Research Report September 2008.
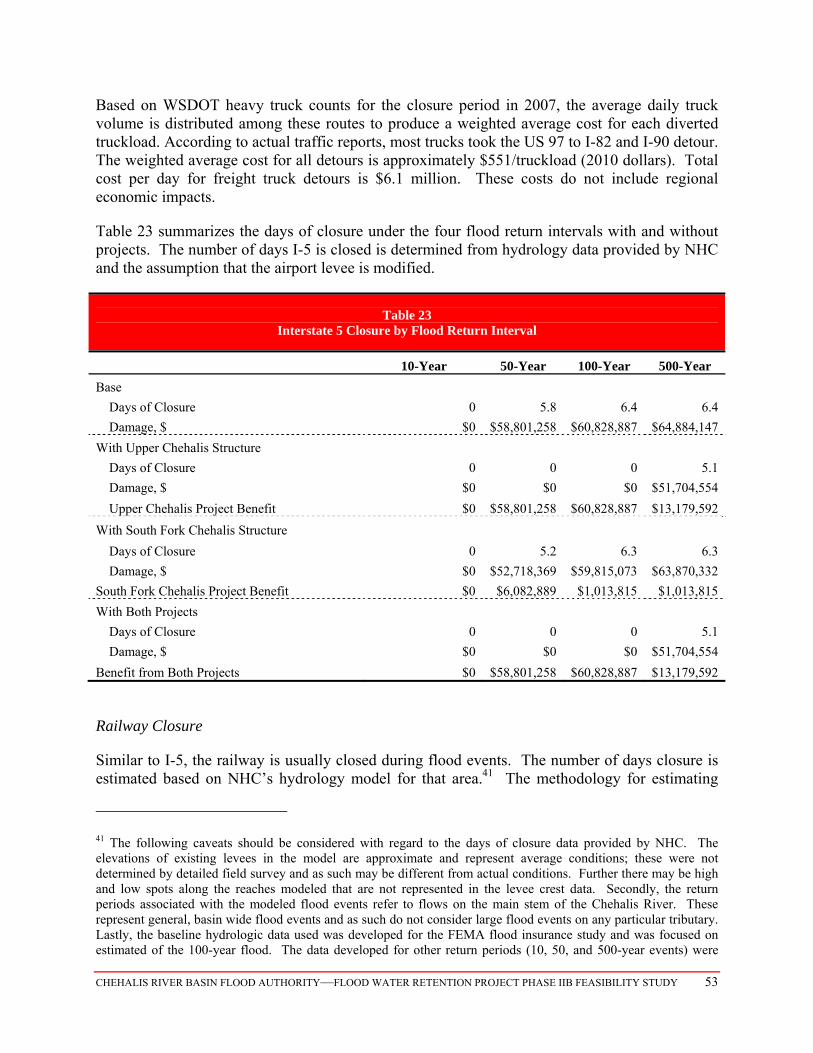
CHEHALIS RIVER BASIN FLOOD AUTHORITY—FLOOD WATER RETENTION PROJECT PHASE IIB FEASIBILITY STUDY 53
Based on WSDOT heavy truck counts for the closure period in 2007, the average daily truck volume is distributed among these routes to produce a weighted average cost for each diverted truckload. According to actual traffic reports, most trucks took the US 97 to I-82 and I-90 detour. The weighted average cost for all detours is approximately $551/truckload (2010 dollars). Total cost per day for freight truck detours is $6.1 million. These costs do not include regional economic impacts.
Table 23 summarizes the days of closure under the four flood return intervals with and without projects. The number of days I-5 is closed is determined from hydrology data provided by NHC and the assumption that the airport levee is modified.
Table 23 Interstate 5 Closure by Flood Return Interval
10-Year 50-Year 100-Year 500-Year
Base
Days of Closure 0 5.8 6.4 6.4
Damage, $ $0 $58,801,258 $60,828,887 $64,884,147
With Upper Chehalis Structure
Days of Closure 0 0 0 5.1
Damage, $ $0 $0 $0 $51,704,554
Upper Chehalis Project Benefit $0 $58,801,258 $60,828,887 $13,179,592
With South Fork Chehalis Structure
Days of Closure 0 5.2 6.3 6.3
Damage, $ $0 $52,718,369 $59,815,073 $63,870,332
South Fork Chehalis Project Benefit $0 $6,082,889 $1,013,815 $1,013,815
With Both Projects
Days of Closure 0 0 0 5.1
Damage, $ $0 $0 $0 $51,704,554
Benefit from Both Projects $0 $58,801,258 $60,828,887 $13,179,592
Railway Closure
Similar to I-5, the railway is usually closed during flood events. The number of days closure is estimated based on NHC’s hydrology model for that area.41 The methodology for estimating
41 The following caveats should be considered with regard to the days of closure data provided by NHC. The elevations of existing levees in the model are approximate and represent average conditions; these were not determined by detailed field survey and as such may be different from actual conditions. Further there may be high and low spots along the reaches modeled that are not represented in the levee crest data. Secondly, the return periods associated with the modeled flood events refer to flows on the main stem of the Chehalis River. These represent general, basin wide flood events and as such do not consider large flood events on any particular tributary. Lastly, the baseline hydrologic data used was developed for the FEMA flood insurance study and was focused on estimated of the 100-year flood. The data developed for other return periods (10, 50, and 500-year events) were
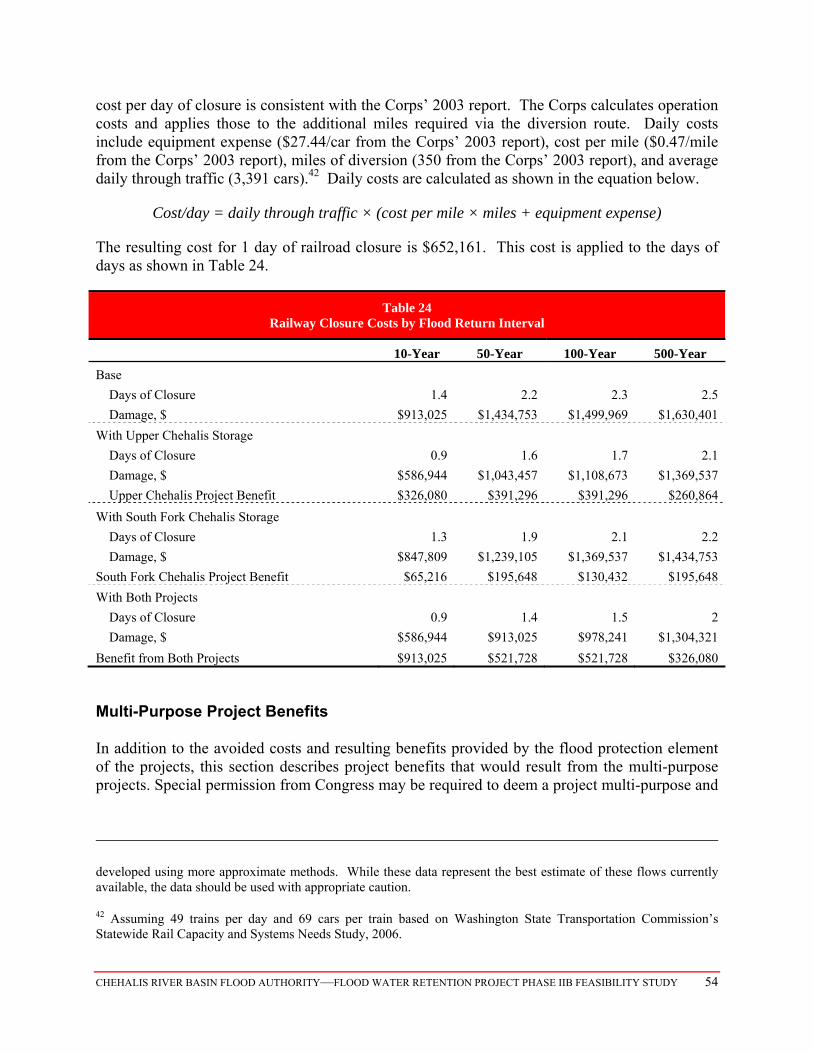
CHEHALIS RIVER BASIN FLOOD AUTHORITY—FLOOD WATER RETENTION PROJECT PHASE IIB FEASIBILITY STUDY 54
cost per day of closure is consistent with the Corps’ 2003 report. The Corps calculates operation costs and applies those to the additional miles required via the diversion route. Daily costs include equipment expense ($27.44/car from the Corps’ 2003 report), cost per mile ($0.47/mile from the Corps’ 2003 report), miles of diversion (350 from the Corps’ 2003 report), and average daily through traffic (3,391 cars).42 Daily costs are calculated as shown in the equation below.
Cost/day = daily through traffic × (cost per mile × miles + equipment expense)
The resulting cost for 1 day of railroad closure is $652,161. This cost is applied to the days of days as shown in Table 24.
Table 24 Railway Closure Costs by Flood Return Interval
10-Year 50-Year 100-Year 500-Year
Base
Days of Closure 1.4 2.2 2.3 2.5
Damage, $ $913,025 $1,434,753 $1,499,969 $1,630,401
With Upper Chehalis Storage
Days of Closure 0.9 1.6 1.7 2.1
Damage, $ $586,944 $1,043,457 $1,108,673 $1,369,537
Upper Chehalis Project Benefit $326,080 $391,296 $391,296 $260,864
With South Fork Chehalis Storage
Days of Closure 1.3 1.9 2.1 2.2
Damage, $ $847,809 $1,239,105 $1,369,537 $1,434,753
South Fork Chehalis Project Benefit $65,216 $195,648 $130,432 $195,648
With Both Projects
Days of Closure 0.9 1.4 1.5 2
Damage, $ $586,944 $913,025 $978,241 $1,304,321
Benefit from Both Projects $913,025 $521,728 $521,728 $326,080
Multi-Purpose Project Benefits In addition to the avoided costs and resulting benefits provided by the flood protection element of the projects, this section describes project benefits that would result from the multi-purpose projects. Special permission from Congress may be required to deem a project multi-purpose and
developed using more approximate methods. While these data represent the best estimate of these flows currently available, the data should be used with appropriate caution. 42 Assuming 49 trains per day and 69 cars per train based on Washington State Transportation Commission’s Statewide Rail Capacity and Systems Needs Study, 2006.
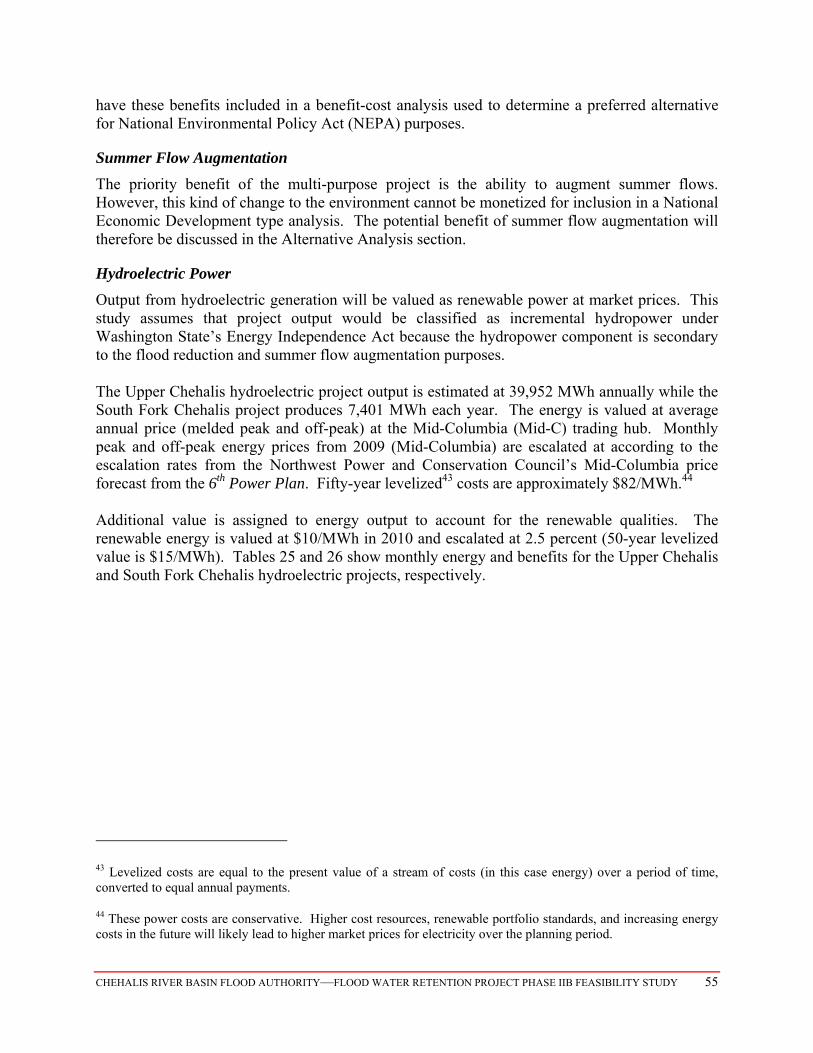
CHEHALIS RIVER BASIN FLOOD AUTHORITY—FLOOD WATER RETENTION PROJECT PHASE IIB FEASIBILITY STUDY 55
have these benefits included in a benefit-cost analysis used to determine a preferred alternative for National Environmental Policy Act (NEPA) purposes.
Summer Flow Augmentation
The priority benefit of the multi-purpose project is the ability to augment summer flows. However, this kind of change to the environment cannot be monetized for inclusion in a National Economic Development type analysis. The potential benefit of summer flow augmentation will therefore be discussed in the Alternative Analysis section.
Hydroelectric Power
Output from hydroelectric generation will be valued as renewable power at market prices. This study assumes that project output would be classified as incremental hydropower under Washington State’s Energy Independence Act because the hydropower component is secondary to the flood reduction and summer flow augmentation purposes. The Upper Chehalis hydroelectric project output is estimated at 39,952 MWh annually while the South Fork Chehalis project produces 7,401 MWh each year. The energy is valued at average annual price (melded peak and off-peak) at the Mid-Columbia (Mid-C) trading hub. Monthly peak and off-peak energy prices from 2009 (Mid-Columbia) are escalated at according to the escalation rates from the Northwest Power and Conservation Council’s Mid-Columbia price forecast from the 6th Power Plan. Fifty-year levelized43 costs are approximately $82/MWh.44 Additional value is assigned to energy output to account for the renewable qualities. The renewable energy is valued at $10/MWh in 2010 and escalated at 2.5 percent (50-year levelized value is $15/MWh). Tables 25 and 26 show monthly energy and benefits for the Upper Chehalis and South Fork Chehalis hydroelectric projects, respectively.
43 Levelized costs are equal to the present value of a stream of costs (in this case energy) over a period of time, converted to equal annual payments.
44 These power costs are conservative. Higher cost resources, renewable portfolio standards, and increasing energy costs in the future will likely lead to higher market prices for electricity over the planning period.
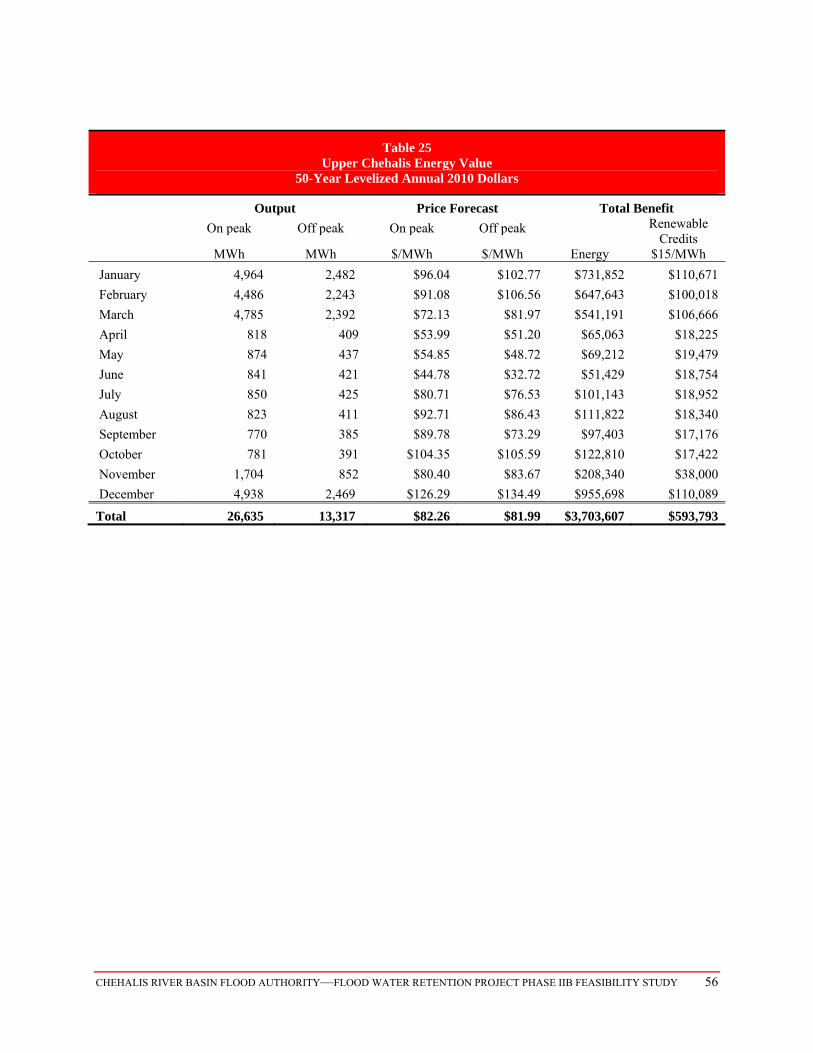
CHEHALIS RIVER BASIN FLOOD AUTHORITY—FLOOD WATER RETENTION PROJECT PHASE IIB FEASIBILITY STUDY 56
Table 25 Upper Chehalis Energy Value
50-Year Levelized Annual 2010 Dollars
Output Price Forecast Total Benefit
On peak Off peak On peak Off peak Renewable Credits
$15/MWh MWh MWh $/MWh $/MWh Energy
January 4,964 2,482 $96.04 $102.77 $731,852 $110,671
February 4,486 2,243 $91.08 $106.56 $647,643 $100,018
March 4,785 2,392 $72.13 $81.97 $541,191 $106,666
April 818 409 $53.99 $51.20 $65,063 $18,225
May 874 437 $54.85 $48.72 $69,212 $19,479
June 841 421 $44.78 $32.72 $51,429 $18,754
July 850 425 $80.71 $76.53 $101,143 $18,952
August 823 411 $92.71 $86.43 $111,822 $18,340
September 770 385 $89.78 $73.29 $97,403 $17,176
October 781 391 $104.35 $105.59 $122,810 $17,422
November 1,704 852 $80.40 $83.67 $208,340 $38,000
December 4,938 2,469 $126.29 $134.49 $955,698 $110,089
Total 26,635 13,317 $82.26 $81.99 $3,703,607 $593,793
CHEHALIS RIVER BASIN FLOOD AUTHORITY—FLOOD WATER RETENTION PROJECT PHASE IIB FEASIBILITY STUDY 57
Table 26 South Fork Chehalis Energy Value
50-Year Levelized Annual 2010 Dollars
Output Price Forecast Total Benefit
On peak Off peak On peak Off peak Renewable Credits
$15/MWh MWh MWh $/MWh $/MWh Energy
January 857 428 $96.04 $102.77 $126,324 $19,103
February 827 413 $91.08 $106.56 $119,325 $18,428
March 840 420 $72.13 $81.97 $95,013 $18,727
April 139 70 $53.99 $51.20 $11,077 $3,103
May 166 83 $54.85 $48.72 $13,188 $3,712
June 161 80 $44.78 $32.72 $9,843 $3,589
July 156 78 $80.71 $76.53 $18,597 $3,485
August 141 70 $92.71 $86.43 $19,120 $3,136
September 122 61 $89.78 $73.29 $15,366 $2,710
October 119 59 $104.35 $105.59 $18,642 $2,645
November 631 316 $80.40 $83.67 $77,152 $14,072
December 775 388 $126.29 $134.49 $150,068 $17,287
Total 4,934 2,467 $82.26 $81.99 $673,715 $109,994
Recreation Recreational use of the proposed facilities may provide some regional benefit. The information below provides a very high level overview of potential benefits; additional study is needed to better determine the potential benefits. The number of annual visits to the reservoirs is based on the Corps’ REAS model output for a similarly situated reservoir in Washington at Mud Mountain Dam.45 The Mud Mountain Dam on the White River, outside of Enumclaw, WA receives 84,702 day-use visitors per year. Mud Mountain reservoir holds 106,000 ac-ft of water and is approximately 5.5 miles long. This reservoir is similar in size to the two projects together. Therefore, the number of annual visits to the proposed reservoirs is estimated at 84,702, with approximately 63,527 and 21,176 annual visits based on weighting the size of the reservoirs for the Upper Chehalis and South Fork Chehalis Reservoirs respectively. Recreation activities at the proposed reservoirs and Mud Mountain Dam are expected to be similar and include hiking, biking, equestrian, swimming, fishing, boating, and picnic. For reference, visits to nearby parks in Lewis County are provided in Figure 13.
45 While significant differences exist between the proposed flood control impoundments and Mud Mountain Dam, it does provide the best available analog for an artificial lake in this part of the state. Licenses and permits for the proposed flood control reservoirs can contain conditions that enhance their recreational value.
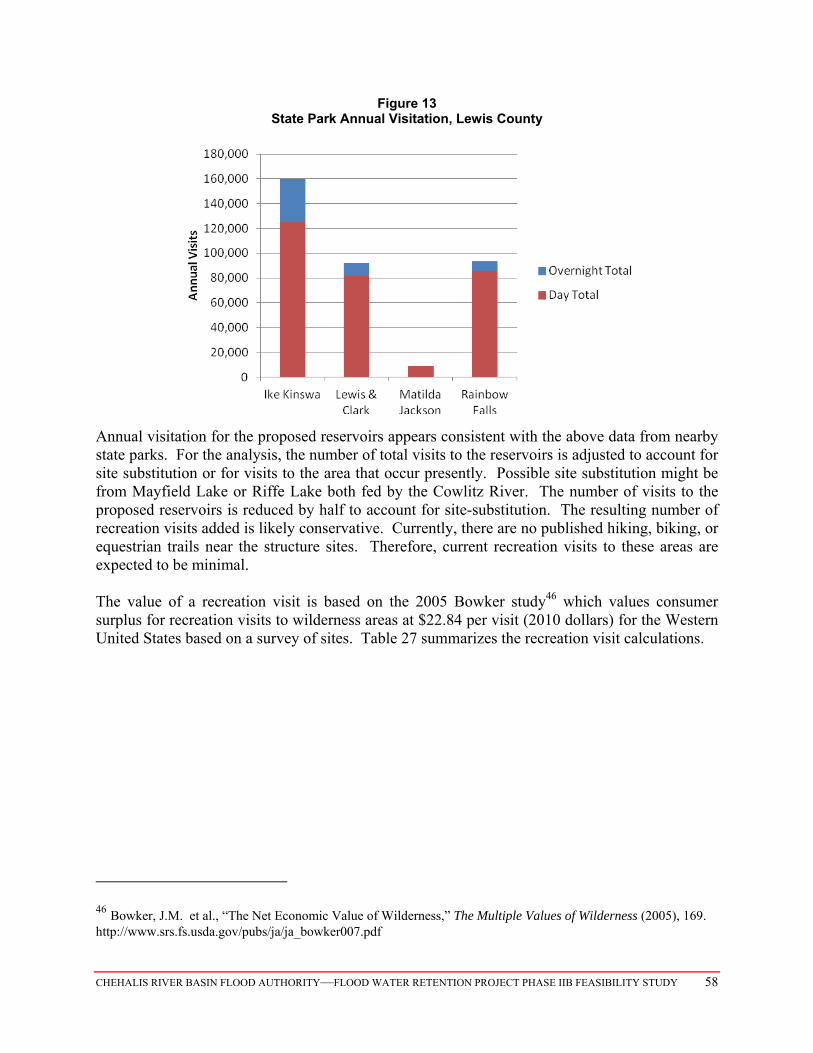
CHEHALIS RIVER BASIN FLOOD AUTHORITY—FLOOD WATER RETENTION PROJECT PHASE IIB FEASIBILITY STUDY 58
Figure 13 State Park Annual Visitation, Lewis County
Annual visitation for the proposed reservoirs appears consistent with the above data from nearby state parks. For the analysis, the number of total visits to the reservoirs is adjusted to account for site substitution or for visits to the area that occur presently. Possible site substitution might be from Mayfield Lake or Riffe Lake both fed by the Cowlitz River. The number of visits to the proposed reservoirs is reduced by half to account for site-substitution. The resulting number of recreation visits added is likely conservative. Currently, there are no published hiking, biking, or equestrian trails near the structure sites. Therefore, current recreation visits to these areas are expected to be minimal. The value of a recreation visit is based on the 2005 Bowker study46 which values consumer surplus for recreation visits to wilderness areas at $22.84 per visit (2010 dollars) for the Western United States based on a survey of sites. Table 27 summarizes the recreation visit calculations.
46 Bowker, J.M. et al., “The Net Economic Value of Wilderness,” The Multiple Values of Wilderness (2005), 169. http://www.srs.fs.usda.gov/pubs/ja/ja_bowker007.pdf
CHEHALIS RIVER BASIN FLOOD AUTHORITY—FLOOD WATER RETENTION PROJECT PHASE IIB FEASIBILITY STUDY 59
Table 27 Recreation Visits and Value
2010 Dollars
Annual Visits, total 84,702
Site Substitution 50% Incremental Annual Visits 42,351 Value per person per year $22.84 Share, % Net Annual Visits Annual Value Upper Chehalis 0.75 31,763 $725,360 South Fork Chehalis 0.25 10,588 $241,787 Total 1.00 42,351 $967,146
Costs
Costs to build and maintain the facilities are included to produce net recreation benefits. In the past, annual expenditures on Lewis and Clark State Park have totaled $287,410.47 Construction costs for a boat ramp, parking, and picnic areas are estimated according to the 2002 INEEL study referenced for O&M costs. Table 28 summarizes the construction costs and O&M costs assumed for the recreation facilities.
Table 28 Recreation Costs
2010 Dollars
O&M $287,410
Construction, Upper Chehalis $5 million Share, % Annual O&M Construction Upper Chehalis 0.75 $215,558 $2,692,424 South Fork Chehalis 0.25 $71,853 $565,122 Total 1.00 $287,410 $3,257,546
The 50-year present value of net benefits due to recreation (includes O&M and construction) is estimated at $13.8 million and $4.9 million for the Upper Chehalis and South Fork Chehalis structures respectively.
47 Washington Trails Association. Projected Park Closures. Accessed September 24, 2010. Available online:http://www.wta.org/trail-news/magazine/projected-state-park-closures
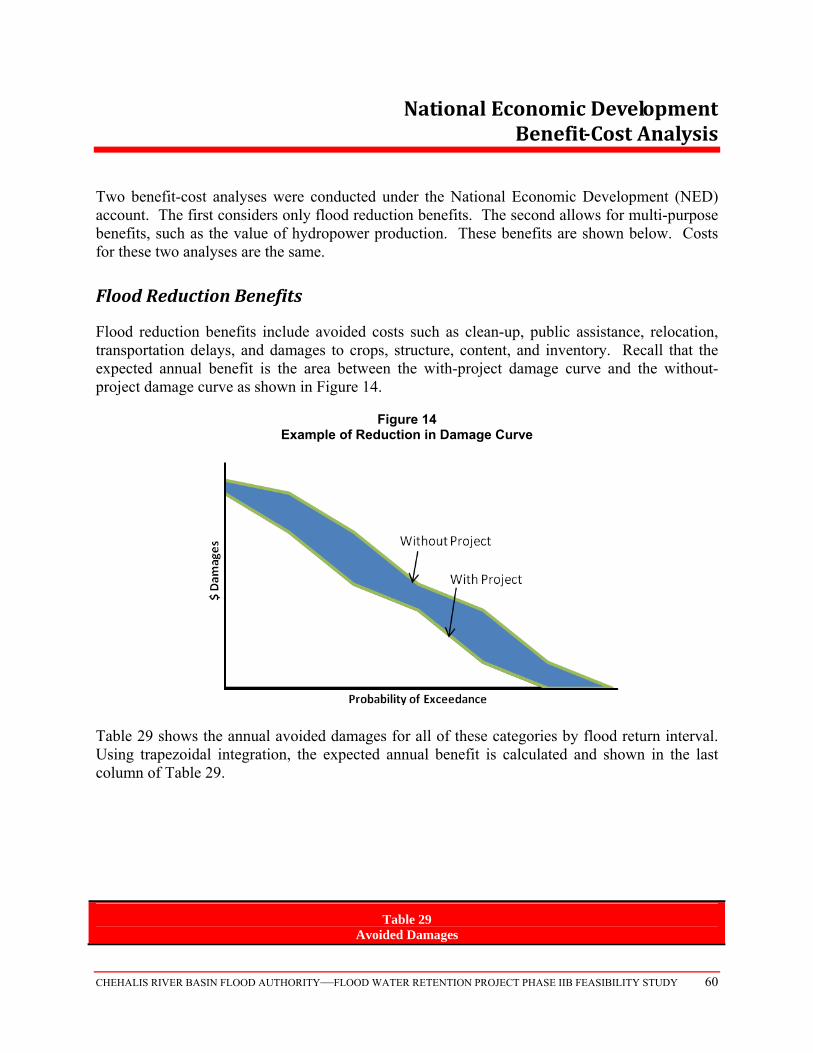
CHEHALIS RIVER BASIN FLOOD AUTHORITY—FLOOD WATER RETENTION PROJECT PHASE IIB FEASIBILITY STUDY 60
NationalEconomicDevelopmentBenefit‐CostAnalysis
Two benefit-cost analyses were conducted under the National Economic Development (NED) account. The first considers only flood reduction benefits. The second allows for multi-purpose benefits, such as the value of hydropower production. These benefits are shown below. Costs for these two analyses are the same.
FloodReductionBenefits
Flood reduction benefits include avoided costs such as clean-up, public assistance, relocation, transportation delays, and damages to crops, structure, content, and inventory. Recall that the expected annual benefit is the area between the with-project damage curve and the without-project damage curve as shown in Figure 14.
Figure 14 Example of Reduction in Damage Curve
Table 29 shows the annual avoided damages for all of these categories by flood return interval. Using trapezoidal integration, the expected annual benefit is calculated and shown in the last column of Table 29.
Table 29 Avoided Damages
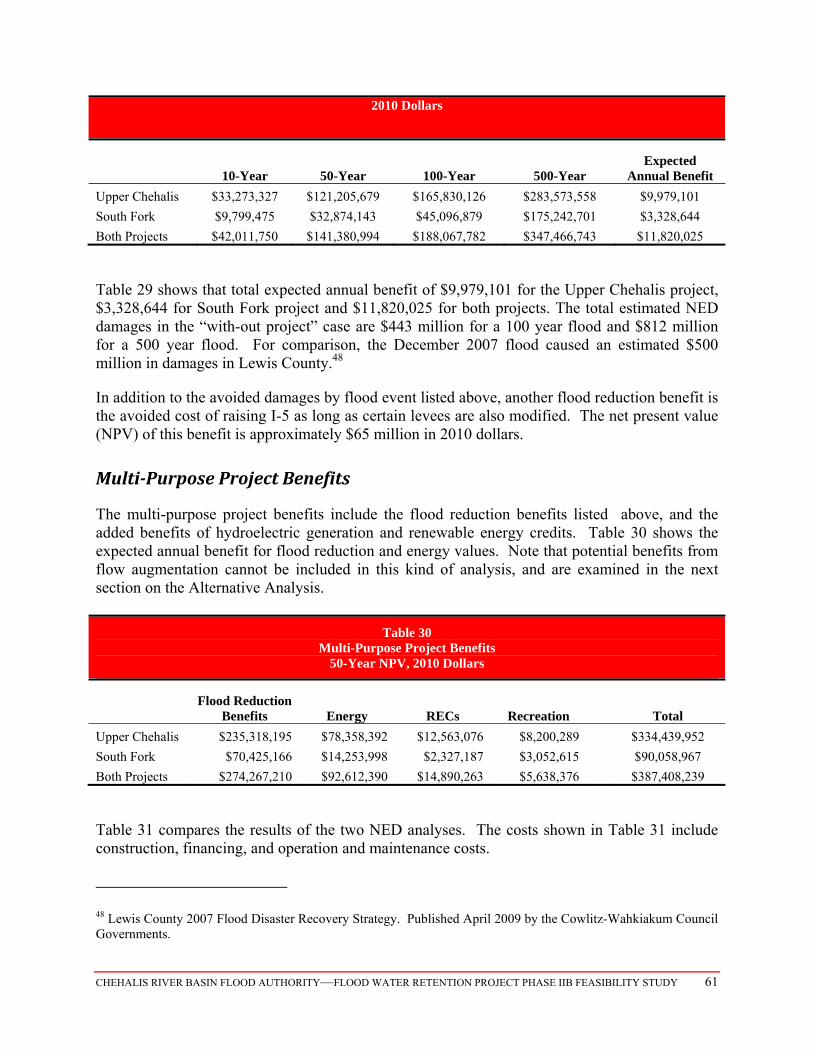
CHEHALIS RIVER BASIN FLOOD AUTHORITY—FLOOD WATER RETENTION PROJECT PHASE IIB FEASIBILITY STUDY 61
2010 Dollars
10-Year 50-Year 100-Year 500-Year Expected
Annual Benefit
Upper Chehalis $33,273,327 $121,205,679 $165,830,126 $283,573,558 $9,979,101
South Fork $9,799,475 $32,874,143 $45,096,879 $175,242,701 $3,328,644
Both Projects $42,011,750 $141,380,994 $188,067,782 $347,466,743 $11,820,025
Table 29 shows that total expected annual benefit of $9,979,101 for the Upper Chehalis project, $3,328,644 for South Fork project and $11,820,025 for both projects. The total estimated NED damages in the “with-out project” case are $443 million for a 100 year flood and $812 million for a 500 year flood. For comparison, the December 2007 flood caused an estimated $500 million in damages in Lewis County.48
In addition to the avoided damages by flood event listed above, another flood reduction benefit is the avoided cost of raising I-5 as long as certain levees are also modified. The net present value (NPV) of this benefit is approximately $65 million in 2010 dollars.
Multi‐PurposeProjectBenefits
The multi-purpose project benefits include the flood reduction benefits listed above, and the added benefits of hydroelectric generation and renewable energy credits. Table 30 shows the expected annual benefit for flood reduction and energy values. Note that potential benefits from flow augmentation cannot be included in this kind of analysis, and are examined in the next section on the Alternative Analysis.
Table 30 Multi-Purpose Project Benefits
50-Year NPV, 2010 Dollars
Flood Reduction
Benefits Energy RECs Recreation Total
Upper Chehalis $235,318,195 $78,358,392 $12,563,076 $8,200,289 $334,439,952
South Fork $70,425,166 $14,253,998 $2,327,187 $3,052,615 $90,058,967
Both Projects $274,267,210 $92,612,390 $14,890,263 $5,638,376 $387,408,239
Table 31 compares the results of the two NED analyses. The costs shown in Table 31 include construction, financing, and operation and maintenance costs.
48 Lewis County 2007 Flood Disaster Recovery Strategy. Published April 2009 by the Cowlitz-Wahkiakum Council Governments.
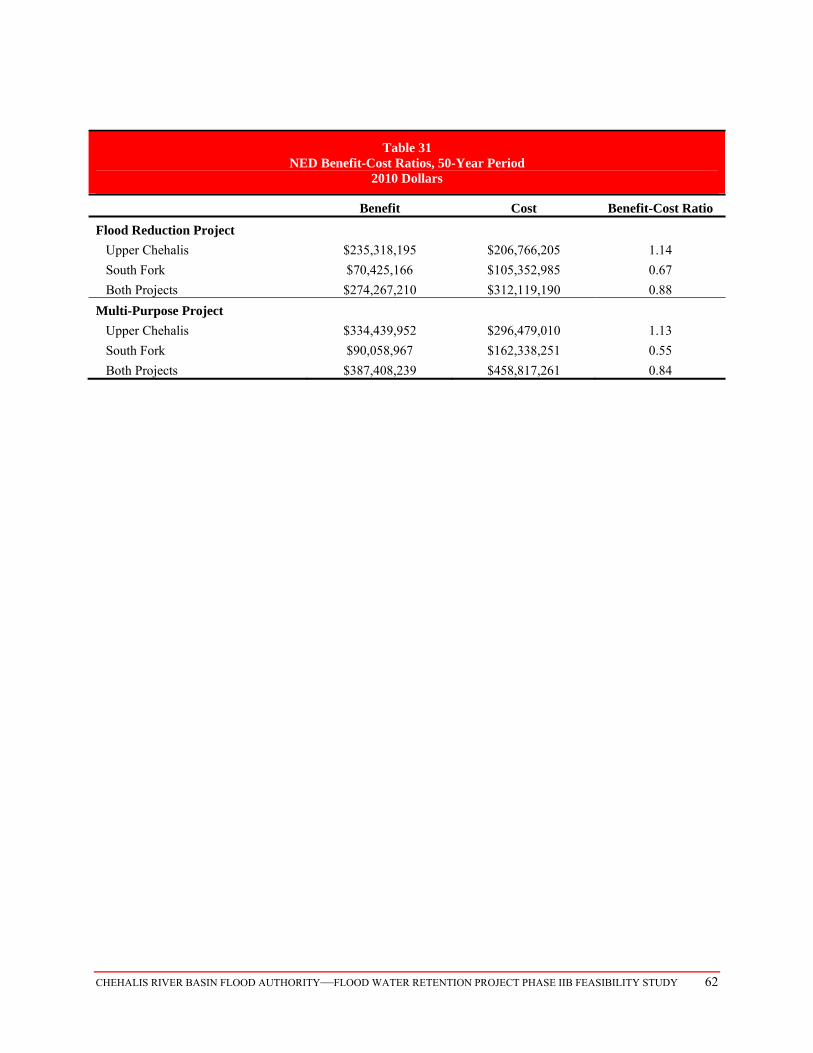
CHEHALIS RIVER BASIN FLOOD AUTHORITY—FLOOD WATER RETENTION PROJECT PHASE IIB FEASIBILITY STUDY 62
Table 31 NED Benefit-Cost Ratios, 50-Year Period
2010 Dollars
Benefit Cost Benefit-Cost Ratio
Flood Reduction Project
Upper Chehalis $235,318,195 $206,766,205 1.14
South Fork $70,425,166 $105,352,985 0.67
Both Projects $274,267,210 $312,119,190 0.88
Multi-Purpose Project
Upper Chehalis $334,439,952 $296,479,010 1.13
South Fork $90,058,967 $162,338,251 0.55
Both Projects $387,408,239 $458,817,261 0.84
CHEHALIS RIVER BASIN FLOOD AUTHORITY—FLOOD WATER RETENTION PROJECT PHASE IIB FEASIBILITY STUDY 63
AlternativeAnalysis
This section of the report monetizes possible environmental benefits of the projects. These benefits are included in both the Alternative and Regional analyses. The scope of work included analysis of environmental benefits and costs to be quantified for benefit-cost analysis. This analysis is outside the Corps’ Principles & Guidelines methodology, but has been used elsewhere in the United States following Hurricane Katrina.
Background
The precedent for quantifying the project ecosystem benefits comes from the current work to restore the Mississippi River Delta. The Louisiana State legislature approved the use of multi-criteria methodology where the preferred alternative is selected based on all accounts (benefit-cost analysis, wetlands restoration, and public safety). As a result of the Louisiana legislature’s decision, Earth Economics49 has examined the dollar value of storm protection, carbon sequestration, and other ecosystem benefits provided by the wetlands of the Mississippi Delta. The valuation of these ecosystem and public safety benefits may show that protection and restoration of wetlands in conjunction with smaller levees is more economically efficient in providing hurricane protection than levee construction alone. These principles provide a construct for monetizing ecosystem benefits that may produce a more balanced analysis of the proposed Chehalis River projects.
Earth Economics has conducted a high-level review of the methodologies used in this report to monetize environmental benefits from the proposed structures. While the methodology is not approved by Earth Economics, Dave Batker provided general suggestions to update the analysis and offered that while the analysis is rough, it is not unreasonable. It was suggested that for a more accurate study, the GIS model developed for the Chehalis basin should be used to determine the exact benefits from reduced flooding. Based on the review by Earth Economics, EESC decided that using the lowest value estimate from Earth Economics study would be appropriate for a conservative analysis.
NetEnvironmentalBenefits
Reservoir Value
The proposed structures would result in several changes to the natural environment in the Chehalis watershed. Most notably, a portion of the river, riparian habitat, and surrounding terrestrial territory would be converted to reservoir habitat. These changes in habitat are valued using an ecosystem analysis by Earth Economics50 and result in a range of values of $88,495 to
49 Earth Economics. Flood Protection and Ecosystem Services in the Chehalis River Basin. May 2010. Tacoma, WA.
50 Earth Economics has provided a high-level review of the environmental analysis and has provided suggestions for improvement. Due to the high-level nature of the review, Earth Economics does not endorse or approve the results of the analysis.
CHEHALIS RIVER BASIN FLOOD AUTHORITY—FLOOD WATER RETENTION PROJECT PHASE IIB FEASIBILITY STUDY 64
$25,055,178. The discussion below provides the basis for these figures. Given the uncertainties associated with these figures and the need for further study, the lowest figure of $88,495 was used in the benefit/cost analysis.
Upper Chehalis Site
Construction of a potential water retention facility at the Upper Chehalis River site would result in a reservoir with about 940 acres of surface area when filled to the maximum operating level for flow augmentation and hydropower production. The riparian habitat of the Upper Chehalis in the area would be covered by the new reservoir. About 9.6 river miles of the Upper Chehalis would be covered by the full reservoir. Assuming an average river bed width is 40 feet in this reach, about 46.5 acres of river habitat would be inundated and converted to still water (reservoir) habitat. About 940 acres of terrestrial habitat, mostly forested lands, would be lost due to the inundation, but it would be replaced with 940 acres of lake/reservoir habitat.
South Fork Chehalis Site
Construction of the proposed water retention facility at the South Fork of the Chehalis River would result in a reservoir with about 300 acres of surface area at the maximum operating level for flow augmentation and hydropower production. The existing riparian habitat of the South Fork in this area would be covered by the new reservoir. About 4.6 river miles of the South Fork would also be covered. Assuming an average river bed width is 30 feet in this reach about 16.7 acres of river habitat would be inundated and converted to still water (reservoir) habitat. About 300 acres of terrestrial habitat, mostly forested lands, would be lost due to the inundation, but it would be replaced with 300 acres of lake/reservoir habitat.
Figure 15 illustrates roughly where the two reservoirs are proposed to be located and the types of forest that characterize those areas. The figure shows that the reservoirs would replace “no succesional” to “mid-succesional” forested areas. As an average value for the lost terrestrial habitat, the value for pole forest from the Earth Economics study is used. According to the Earth Economics Study pole forest habitat is valued in the range of $12 to $636 per acre.
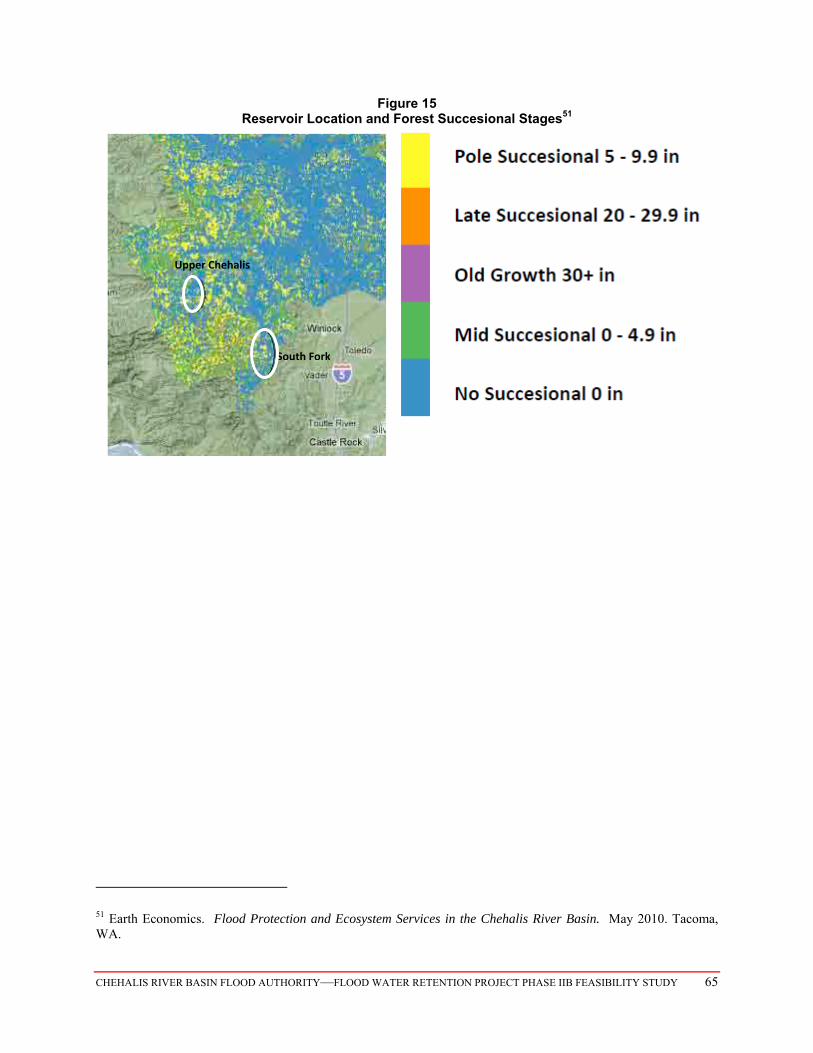
CHEHALIS RIVER BASIN FLOOD AUTHORITY—FLOOD WATER RETENTION PROJECT PHASE IIB FEASIBILITY STUDY 65
Figure 15 Reservoir Location and Forest Succesional Stages51
51 Earth Economics. Flood Protection and Ecosystem Services in the Chehalis River Basin. May 2010. Tacoma, WA.
Upper Chehalis
South Fork
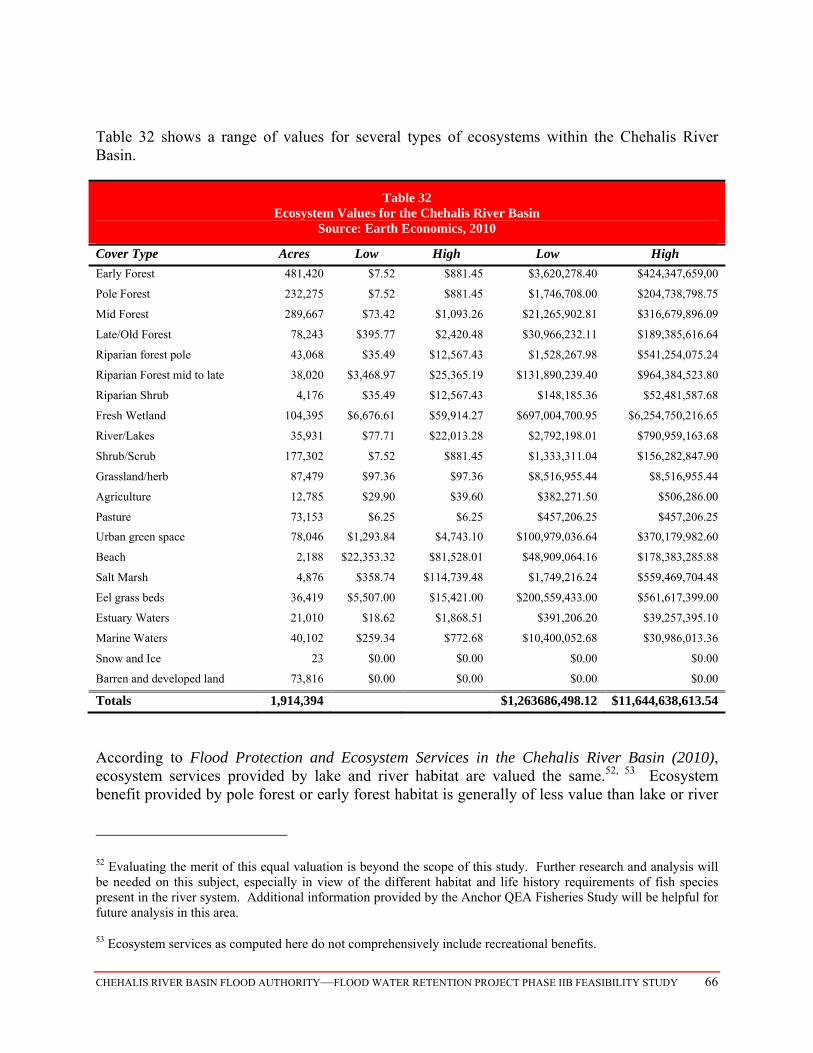
CHEHALIS RIVER BASIN FLOOD AUTHORITY—FLOOD WATER RETENTION PROJECT PHASE IIB FEASIBILITY STUDY 66
Table 32 shows a range of values for several types of ecosystems within the Chehalis River Basin.
Table 32 Ecosystem Values for the Chehalis River Basin
Source: Earth Economics, 2010
Cover Type Acres Low High Low High
Early Forest 481,420 $7.52 $881.45 $3,620,278.40 $424,347,659,00
Pole Forest 232,275 $7.52 $881.45 $1,746,708.00 $204,738,798.75
Mid Forest 289,667 $73.42 $1,093.26 $21,265,902.81 $316,679,896.09
Late/Old Forest 78,243 $395.77 $2,420.48 $30,966,232.11 $189,385,616.64
Riparian forest pole 43,068 $35.49 $12,567.43 $1,528,267.98 $541,254,075.24
Riparian Forest mid to late 38,020 $3,468.97 $25,365.19 $131,890,239.40 $964,384,523.80
Riparian Shrub 4,176 $35.49 $12,567.43 $148,185.36 $52,481,587.68
Fresh Wetland 104,395 $6,676.61 $59,914.27 $697,004,700.95 $6,254,750,216.65
River/Lakes 35,931 $77.71 $22,013.28 $2,792,198.01 $790,959,163.68
Shrub/Scrub 177,302 $7.52 $881.45 $1,333,311.04 $156,282,847.90
Grassland/herb 87,479 $97.36 $97.36 $8,516,955.44 $8,516,955.44
Agriculture 12,785 $29.90 $39.60 $382,271.50 $506,286.00
Pasture 73,153 $6.25 $6.25 $457,206.25 $457,206.25
Urban green space 78,046 $1,293.84 $4,743.10 $100,979,036.64 $370,179,982.60
Beach 2,188 $22,353.32 $81,528.01 $48,909,064.16 $178,383,285.88
Salt Marsh 4,876 $358.74 $114,739.48 $1,749,216.24 $559,469,704.48
Eel grass beds 36,419 $5,507.00 $15,421.00 $200,559,433.00 $561,617,399.00
Estuary Waters 21,010 $18.62 $1,868.51 $391,206.20 $39,257,395.10
Marine Waters 40,102 $259.34 $772.68 $10,400,052.68 $30,986,013.36
Snow and Ice 23 $0.00 $0.00 $0.00 $0.00
Barren and developed land 73,816 $0.00 $0.00 $0.00 $0.00
Totals 1,914,394 $1,263686,498.12 $11,644,638,613.54
According to Flood Protection and Ecosystem Services in the Chehalis River Basin (2010), ecosystem services provided by lake and river habitat are valued the same.52, 53 Ecosystem benefit provided by pole forest or early forest habitat is generally of less value than lake or river
52 Evaluating the merit of this equal valuation is beyond the scope of this study. Further research and analysis will be needed on this subject, especially in view of the different habitat and life history requirements of fish species present in the river system. Additional information provided by the Anchor QEA Fisheries Study will be helpful for future analysis in this area.
53 Ecosystem services as computed here do not comprehensively include recreational benefits.
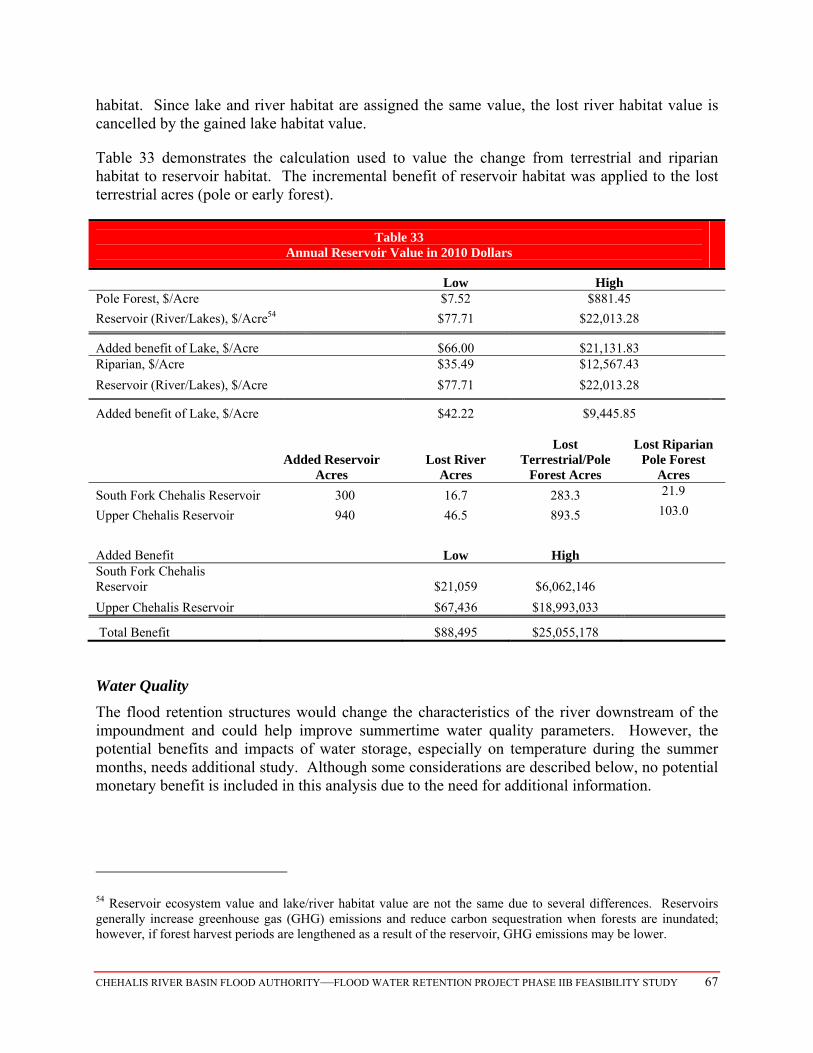
CHEHALIS RIVER BASIN FLOOD AUTHORITY—FLOOD WATER RETENTION PROJECT PHASE IIB FEASIBILITY STUDY 67
habitat. Since lake and river habitat are assigned the same value, the lost river habitat value is cancelled by the gained lake habitat value.
Table 33 demonstrates the calculation used to value the change from terrestrial and riparian habitat to reservoir habitat. The incremental benefit of reservoir habitat was applied to the lost terrestrial acres (pole or early forest).
Table 33 Annual Reservoir Value in 2010 Dollars
Low High
Pole Forest, $/Acre $7.52 $881.45
Reservoir (River/Lakes), $/Acre54 $77.71 $22,013.28
Added benefit of Lake, $/Acre $66.00 $21,131.83
Riparian, $/Acre $35.49 $12,567.43
Reservoir (River/Lakes), $/Acre $77.71 $22,013.28
Added benefit of Lake, $/Acre $42.22 $9,445.85
Added Reservoir
Acres Lost River
Acres
Lost Terrestrial/Pole
Forest Acres
Lost Riparian Pole Forest
Acres
South Fork Chehalis Reservoir 300 16.7 283.3 21.9
Upper Chehalis Reservoir 940 46.5 893.5 103.0
Added Benefit Low High
South Fork Chehalis Reservoir $21,059 $6,062,146
Upper Chehalis Reservoir $67,436 $18,993,033
Total Benefit $88,495 $25,055,178
Water Quality
The flood retention structures would change the characteristics of the river downstream of the impoundment and could help improve summertime water quality parameters. However, the potential benefits and impacts of water storage, especially on temperature during the summer months, needs additional study. Although some considerations are described below, no potential monetary benefit is included in this analysis due to the need for additional information.
54 Reservoir ecosystem value and lake/river habitat value are not the same due to several differences. Reservoirs generally increase greenhouse gas (GHG) emissions and reduce carbon sequestration when forests are inundated; however, if forest harvest periods are lengthened as a result of the reservoir, GHG emissions may be lower.
CHEHALIS RIVER BASIN FLOOD AUTHORITY—FLOOD WATER RETENTION PROJECT PHASE IIB FEASIBILITY STUDY 68
Upper Chehalis Water Quality
Water quality is of particular concern in the Upper Chehalis during the summer time. Currently, estimated average stream flow at the Upper Chehalis site is 50 cfs from June through September, or approximately 14 percent of the average annual daily flow of 348 cfs. These low summer flows and high temperatures in the summer cause fish kills in some years. For example, extensive fish kills occurred in the Chehalis and Newaukum Rivers during periods that coincided with high temperatures55 in the summer of 2009. The Washington Department of Ecology has documented high water temperatures at Doty nearly every summer since it began making measurements it is not uncommon that the lethal temperatures are recorded for at least one week per year. During these periods, fisheries biologists confirmed that high temperatures resulted in fish mortality of adult salmon and other fish species below Pe Ell on the mainstem. In August 2009, fisheries biologists conducted snorkeling surveys to determine if juvenile salmonids were present at six sites on the Chehalis River from upstream of Pe Ell to 15 miles downstream. The survey found no adult or juvenile species present downstream of Pe Ell. Recorded temperatures for these waters ranged from 68 degrees at Pe Ell to 79 degrees three miles downstream from Pe Ell. Studies have shown that adult salmon and steelhead begin to die at water temperatures in the 69.8 to 71.6 degree range (Fahrenheit).56 The biologists concluded that high river temperatures in the Chehalis River during hot summer months can be lethal to salmon, steelhead, and several other species.
Upstream storage could help increase summertime flows. Under the multi-purpose operation design developed for this Phase IIB study, average daily flow at the Upper Chehalis site would be 140 cfs in the summer months in an average water year. These augmented flows are nearly three times the estimated average natural flow (40 cfs). Based on nearly triple the natural flow, and potentially cooler than natural water temperatures, it can be inferred that fish kill incidents might be greatly reduced for up to several miles downstream of the water retention sites. However, additional study on this question is needed and the benefits of any potential improvements are not included in this study.57
South Fork Chehalis Water Quality
Similar to the mainstem Chehalis, the South Fork Chehalis also has low summertime flows. During an average water year, average daily flow from June through September is estimated at 16.4 cfs, or 14.4% of average annual daily flow using the Doty gage approximation. Augmented flows during the June through September timeframe could be 40 cfs or an average of 240 percent of natural flow in an average year. Detailed flow studies would be required to determine the true
55 Kohn, Rittmueller, and Warnock 2010
56 Kohn, Rittmueller, and Warnock 2010
57 WDOE and Washington Department of Fish and Wildlife (WDFW) documented the relationship between Chinook habitat availability and streamflow. Chinook spawning habitat decreases rapidly as streamflows decrease below 160 – 170 cfs in the Upper Chehalis River; rearing habitat experiences a similar decrease when streamflows drop below 70 cfs. Limiting habitat factors for Chum are similar. (EES Consulting, Inc. November 10, 2009).
CHEHALIS RIVER BASIN FLOOD AUTHORITY—FLOOD WATER RETENTION PROJECT PHASE IIB FEASIBILITY STUDY 69
amount of summer flow augmentation. In addition, specific environmental studies are required to evaluate the improved water quality/habitat and associated value. Additional Benefits Needing Further Study The proposed multi-purpose flood retention structures may provide several other benefits since they have the capacity to store high winter flows and then to release those flows during the summer months when natural flows on the Chehalis River are typically low. Summer flow augmentation may provide significant benefit to wildlife habitat, and could make additional water available for agricultural use or rural and municipal consumption, providing significant economic and social benefits to local farmers and communities. In addition, greater summer flows may recharge ground water supplies. Given improved water quality and improved fish habitat, greater production in salmon and steelhead species could promote economic development. However, the benefit of such summer flow augmentation have not been studied, nor have they been incorporated into the Phase IIB benefit-cost analysis. Wetland Benefits
Augmented summer flows may provide opportunities for wetland creation. Wetlands are known to have the ability to mitigate flooding events near urban areas.58 Wetlands near the Chehalis and Centralia may help to regulate water flows such that flooding is reduced further than indicated in this study.
Direct impacts, positive or negative, from the projects to existing freshwater wetlands were not evaluated specifically since that is beyond the scope of a Phase IIB Feasibility Study and the Corps’ guidelines for such studies; however, the value of additional wetlands was estimated based on work completed by Earth Economics. It is not known what type of wetlands might be created (off channel slough or other) nor is it assumed that existing wetlands are inundated. Due to low summer flows, the acres of existing wetlands that might be inundated are expected to be insignificant. Wetland benefits were calculated assuming that added wetland areas are downstream from any water quality benefits. This analysis assumes that wetlands are relatively inexpensive to create and that landowners are compensated at market prices for land converted to wetland habitat. Based on flood-depth maps, it was estimated that the summer augmentation flows (90 cfs of additional water) from the Upper Chehalis site could be used to convert 179 acres of pasture59 to wetland habitat. Landowners are compensated $2,000 per acre60 for a total cost of $396,000. Using fresh water wetland values developed by Earth Economics, Table 34 summarizes a range of values for wetland creation from the Upper Chehalis multi-purpose project site.
58 Batker, David et al. June 2010. Gaining Ground. Wetlands, Hurricanes, and the Economy: The Value of Restoring the Mississippi River Delta. Earth Economics, Tacoma, WA.
59 Pastureland values are used in the analysis, however, it is likely that created wetlands might be located on land that is not currently used and therefore has a value of $0/acre for ecosystem services.
60 Value based on 2010 taxable land value for representative property near the South Fork Chehalis River.
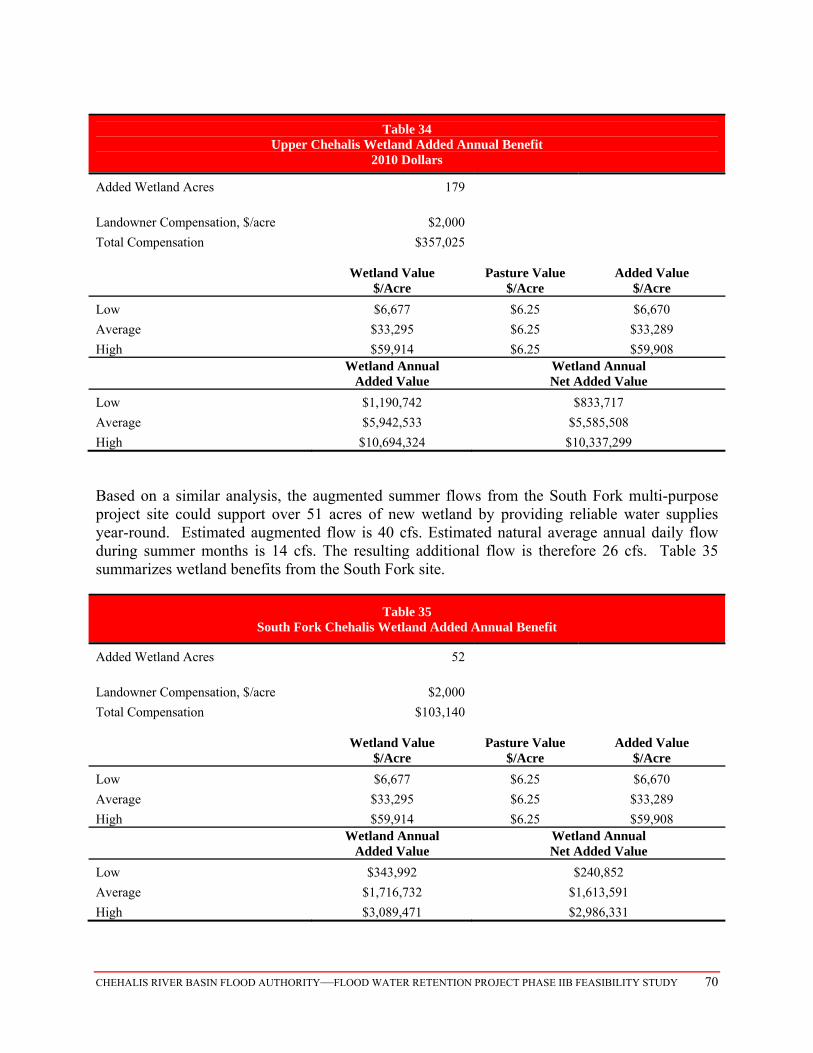
CHEHALIS RIVER BASIN FLOOD AUTHORITY—FLOOD WATER RETENTION PROJECT PHASE IIB FEASIBILITY STUDY 70
Table 34 Upper Chehalis Wetland Added Annual Benefit
2010 Dollars
Added Wetland Acres 179
Landowner Compensation, $/acre $2,000
Total Compensation $357,025
Wetland Value
$/Acre Pasture Value
$/Acre Added Value
$/Acre
Low $6,677 $6.25 $6,670
Average $33,295 $6.25 $33,289
High $59,914 $6.25 $59,908
Wetland Annual
Added Value Wetland Annual Net Added Value
Low $1,190,742 $833,717
Average $5,942,533 $5,585,508
High $10,694,324 $10,337,299
Based on a similar analysis, the augmented summer flows from the South Fork multi-purpose project site could support over 51 acres of new wetland by providing reliable water supplies year-round. Estimated augmented flow is 40 cfs. Estimated natural average annual daily flow during summer months is 14 cfs. The resulting additional flow is therefore 26 cfs. Table 35 summarizes wetland benefits from the South Fork site.
Table 35 South Fork Chehalis Wetland Added Annual Benefit
Added Wetland Acres 52
Landowner Compensation, $/acre $2,000
Total Compensation $103,140
Wetland Value
$/Acre Pasture Value
$/Acre Added Value
$/Acre
Low $6,677 $6.25 $6,670
Average $33,295 $6.25 $33,289
High $59,914 $6.25 $59,908
Wetland Annual
Added Value Wetland Annual Net Added Value
Low $343,992 $240,852
Average $1,716,732 $1,613,591
High $3,089,471 $2,986,331
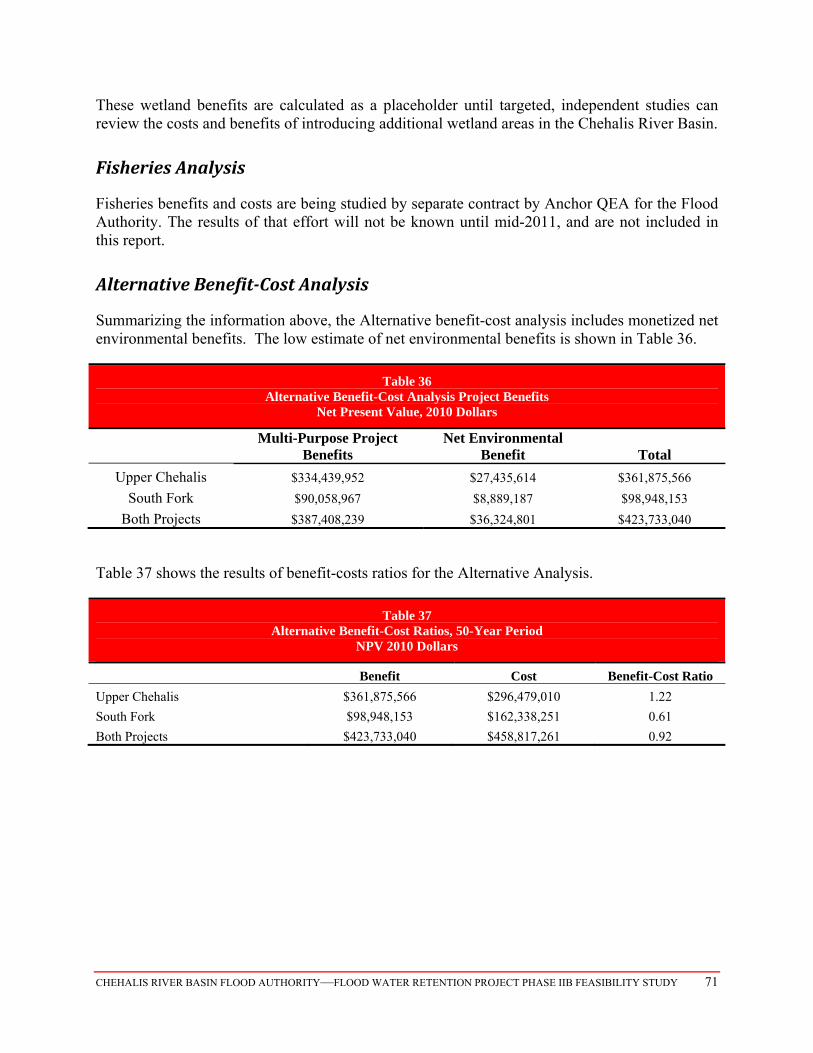
CHEHALIS RIVER BASIN FLOOD AUTHORITY—FLOOD WATER RETENTION PROJECT PHASE IIB FEASIBILITY STUDY 71
These wetland benefits are calculated as a placeholder until targeted, independent studies can review the costs and benefits of introducing additional wetland areas in the Chehalis River Basin.
FisheriesAnalysis
Fisheries benefits and costs are being studied by separate contract by Anchor QEA for the Flood Authority. The results of that effort will not be known until mid-2011, and are not included in this report.
AlternativeBenefit‐CostAnalysis
Summarizing the information above, the Alternative benefit-cost analysis includes monetized net environmental benefits. The low estimate of net environmental benefits is shown in Table 36.
Table 36 Alternative Benefit-Cost Analysis Project Benefits
Net Present Value, 2010 Dollars
Multi-Purpose Project Benefits
Net Environmental Benefit Total
Upper Chehalis $334,439,952 $27,435,614 $361,875,566
South Fork $90,058,967 $8,889,187 $98,948,153
Both Projects $387,408,239 $36,324,801 $423,733,040
Table 37 shows the results of benefit-costs ratios for the Alternative Analysis.
Table 37 Alternative Benefit-Cost Ratios, 50-Year Period
NPV 2010 Dollars
Benefit Cost Benefit-Cost Ratio
Upper Chehalis $361,875,566 $296,479,010 1.22
South Fork $98,948,153 $162,338,251 0.61
Both Projects $423,733,040 $458,817,261 0.92
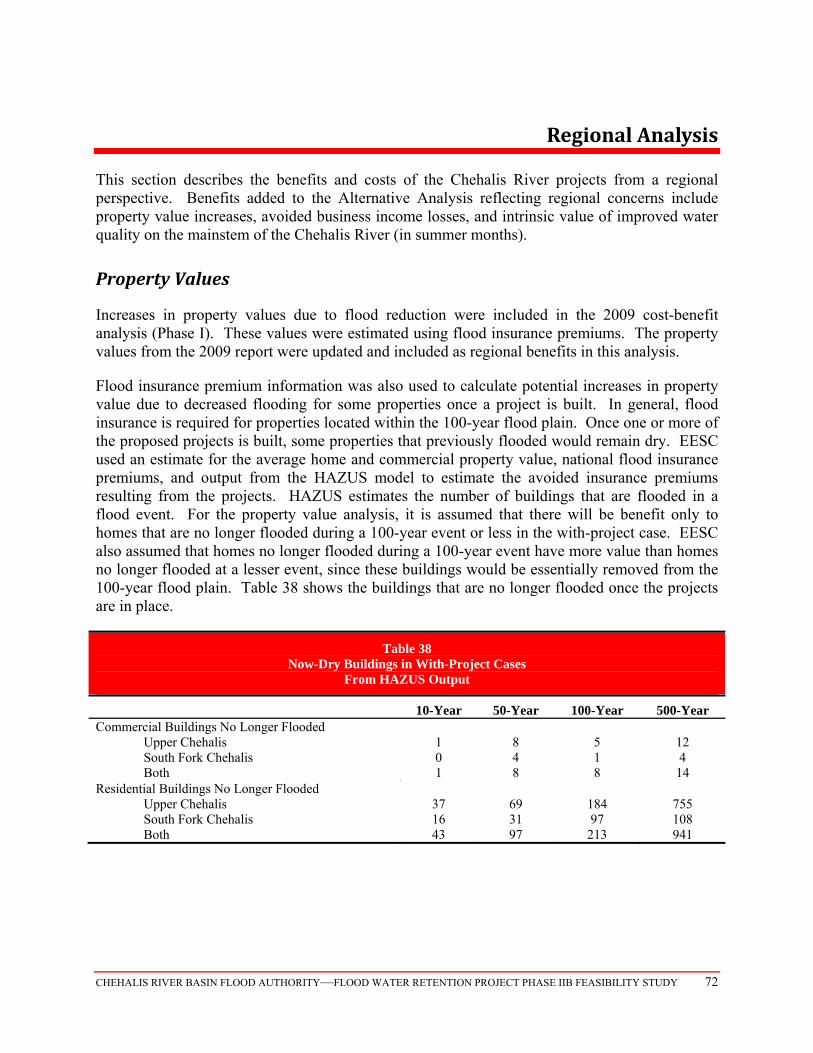
CHEHALIS RIVER BASIN FLOOD AUTHORITY—FLOOD WATER RETENTION PROJECT PHASE IIB FEASIBILITY STUDY 72
RegionalAnalysis
This section describes the benefits and costs of the Chehalis River projects from a regional perspective. Benefits added to the Alternative Analysis reflecting regional concerns include property value increases, avoided business income losses, and intrinsic value of improved water quality on the mainstem of the Chehalis River (in summer months).
PropertyValues
Increases in property values due to flood reduction were included in the 2009 cost-benefit analysis (Phase I). These values were estimated using flood insurance premiums. The property values from the 2009 report were updated and included as regional benefits in this analysis.
Flood insurance premium information was also used to calculate potential increases in property value due to decreased flooding for some properties once a project is built. In general, flood insurance is required for properties located within the 100-year flood plain. Once one or more of the proposed projects is built, some properties that previously flooded would remain dry. EESC used an estimate for the average home and commercial property value, national flood insurance premiums, and output from the HAZUS model to estimate the avoided insurance premiums resulting from the projects. HAZUS estimates the number of buildings that are flooded in a flood event. For the property value analysis, it is assumed that there will be benefit only to homes that are no longer flooded during a 100-year event or less in the with-project case. EESC also assumed that homes no longer flooded during a 100-year event have more value than homes no longer flooded at a lesser event, since these buildings would be essentially removed from the 100-year flood plain. Table 38 shows the buildings that are no longer flooded once the projects are in place.
Table 38 Now-Dry Buildings in With-Project Cases
From HAZUS Output
10-Year 50-Year 100-Year 500-Year Commercial Buildings No Longer Flooded
Upper Chehalis 1 8 5 12 South Fork Chehalis 0 4 1 4 Both 1 8 8 14
Residential Buildings No Longer Flooded Upper Chehalis 37 69 184 755 South Fork Chehalis 16 31 97 108 Both 43 97 213 941
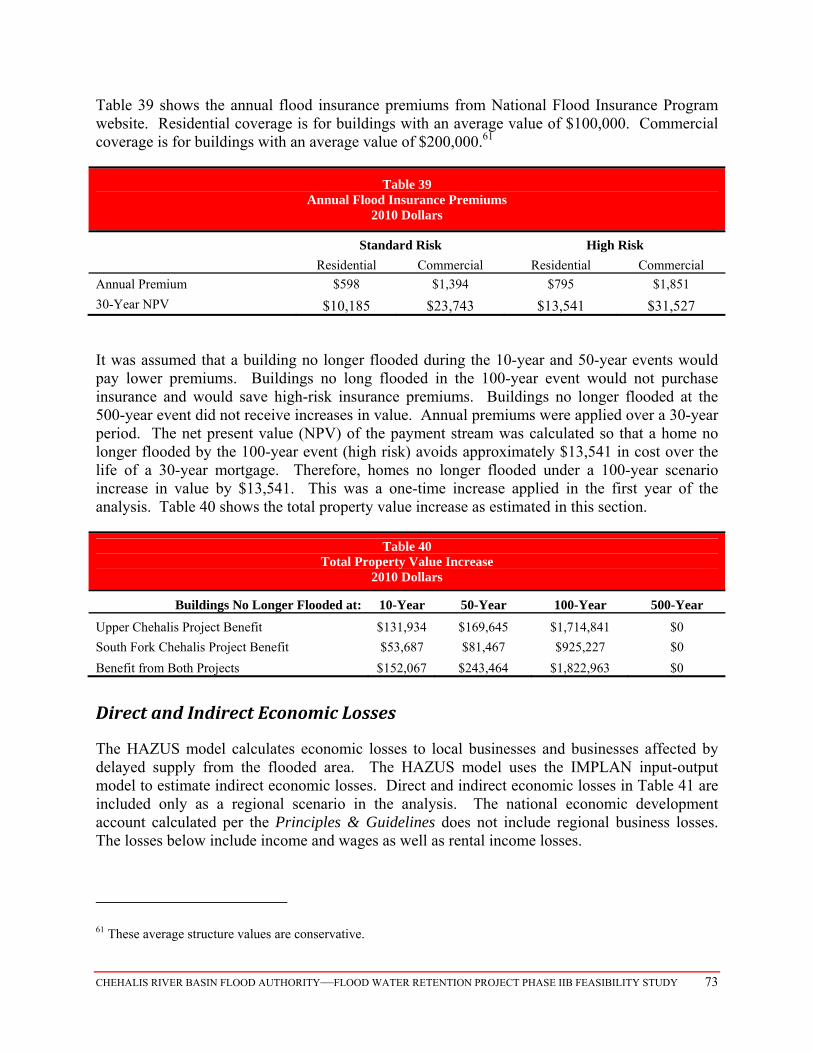
CHEHALIS RIVER BASIN FLOOD AUTHORITY—FLOOD WATER RETENTION PROJECT PHASE IIB FEASIBILITY STUDY 73
Table 39 shows the annual flood insurance premiums from National Flood Insurance Program website. Residential coverage is for buildings with an average value of $100,000. Commercial coverage is for buildings with an average value of $200,000.61
Table 39 Annual Flood Insurance Premiums
2010 Dollars
Standard Risk High Risk Residential Commercial Residential Commercial
Annual Premium $598 $1,394 $795 $1,851
30-Year NPV $10,185 $23,743 $13,541 $31,527
It was assumed that a building no longer flooded during the 10-year and 50-year events would pay lower premiums. Buildings no long flooded in the 100-year event would not purchase insurance and would save high-risk insurance premiums. Buildings no longer flooded at the 500-year event did not receive increases in value. Annual premiums were applied over a 30-year period. The net present value (NPV) of the payment stream was calculated so that a home no longer flooded by the 100-year event (high risk) avoids approximately $13,541 in cost over the life of a 30-year mortgage. Therefore, homes no longer flooded under a 100-year scenario increase in value by $13,541. This was a one-time increase applied in the first year of the analysis. Table 40 shows the total property value increase as estimated in this section.
Table 40 Total Property Value Increase
2010 Dollars
Buildings No Longer Flooded at: 10-Year 50-Year 100-Year 500-Year
Upper Chehalis Project Benefit $131,934 $169,645 $1,714,841 $0
South Fork Chehalis Project Benefit $53,687 $81,467 $925,227 $0
Benefit from Both Projects $152,067 $243,464 $1,822,963 $0
DirectandIndirectEconomicLosses
The HAZUS model calculates economic losses to local businesses and businesses affected by delayed supply from the flooded area. The HAZUS model uses the IMPLAN input-output model to estimate indirect economic losses. Direct and indirect economic losses in Table 41 are included only as a regional scenario in the analysis. The national economic development account calculated per the Principles & Guidelines does not include regional business losses. The losses below include income and wages as well as rental income losses.
61 These average structure values are conservative.
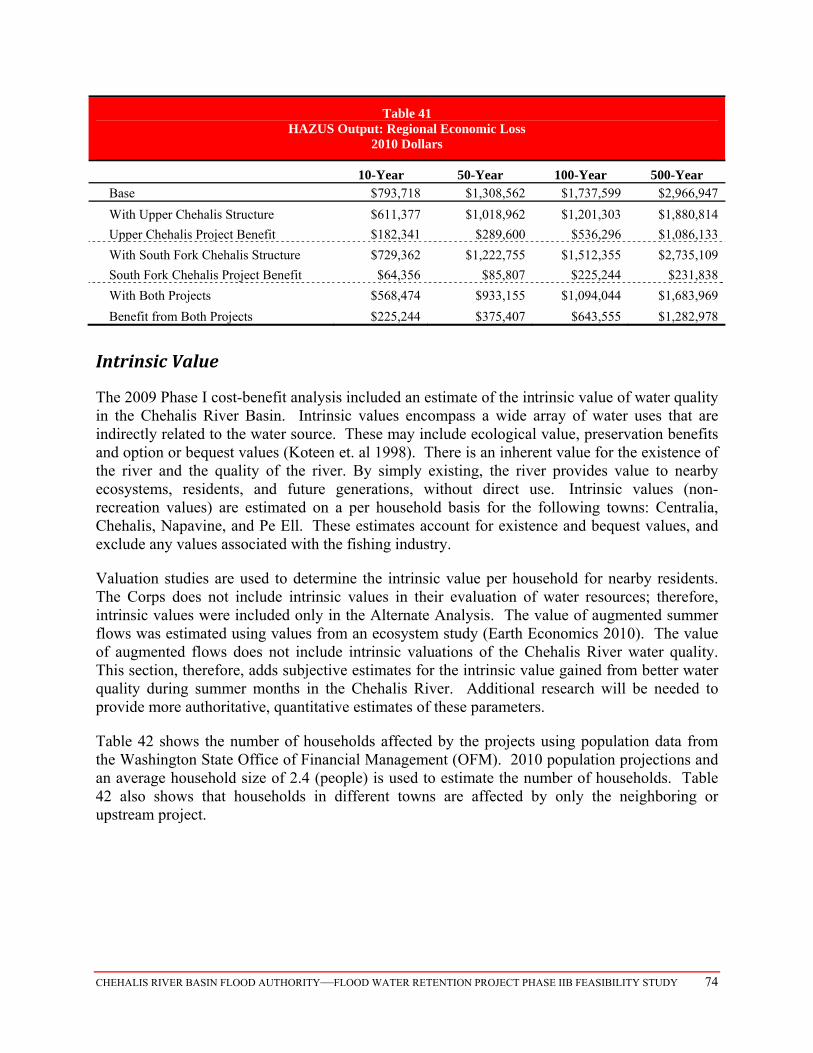
CHEHALIS RIVER BASIN FLOOD AUTHORITY—FLOOD WATER RETENTION PROJECT PHASE IIB FEASIBILITY STUDY 74
Table 41 HAZUS Output: Regional Economic Loss
2010 Dollars
10-Year 50-Year 100-Year 500-Year Base $793,718 $1,308,562 $1,737,599 $2,966,947
With Upper Chehalis Structure $611,377 $1,018,962 $1,201,303 $1,880,814
Upper Chehalis Project Benefit $182,341 $289,600 $536,296 $1,086,133
With South Fork Chehalis Structure $729,362 $1,222,755 $1,512,355 $2,735,109
South Fork Chehalis Project Benefit $64,356 $85,807 $225,244 $231,838
With Both Projects $568,474 $933,155 $1,094,044 $1,683,969
Benefit from Both Projects $225,244 $375,407 $643,555 $1,282,978
IntrinsicValue
The 2009 Phase I cost-benefit analysis included an estimate of the intrinsic value of water quality in the Chehalis River Basin. Intrinsic values encompass a wide array of water uses that are indirectly related to the water source. These may include ecological value, preservation benefits and option or bequest values (Koteen et. al 1998). There is an inherent value for the existence of the river and the quality of the river. By simply existing, the river provides value to nearby ecosystems, residents, and future generations, without direct use. Intrinsic values (non-recreation values) are estimated on a per household basis for the following towns: Centralia, Chehalis, Napavine, and Pe Ell. These estimates account for existence and bequest values, and exclude any values associated with the fishing industry.
Valuation studies are used to determine the intrinsic value per household for nearby residents. The Corps does not include intrinsic values in their evaluation of water resources; therefore, intrinsic values were included only in the Alternate Analysis. The value of augmented summer flows was estimated using values from an ecosystem study (Earth Economics 2010). The value of augmented flows does not include intrinsic valuations of the Chehalis River water quality. This section, therefore, adds subjective estimates for the intrinsic value gained from better water quality during summer months in the Chehalis River. Additional research will be needed to provide more authoritative, quantitative estimates of these parameters.
Table 42 shows the number of households affected by the projects using population data from the Washington State Office of Financial Management (OFM). 2010 population projections and an average household size of 2.4 (people) is used to estimate the number of households. Table 42 also shows that households in different towns are affected by only the neighboring or upstream project.
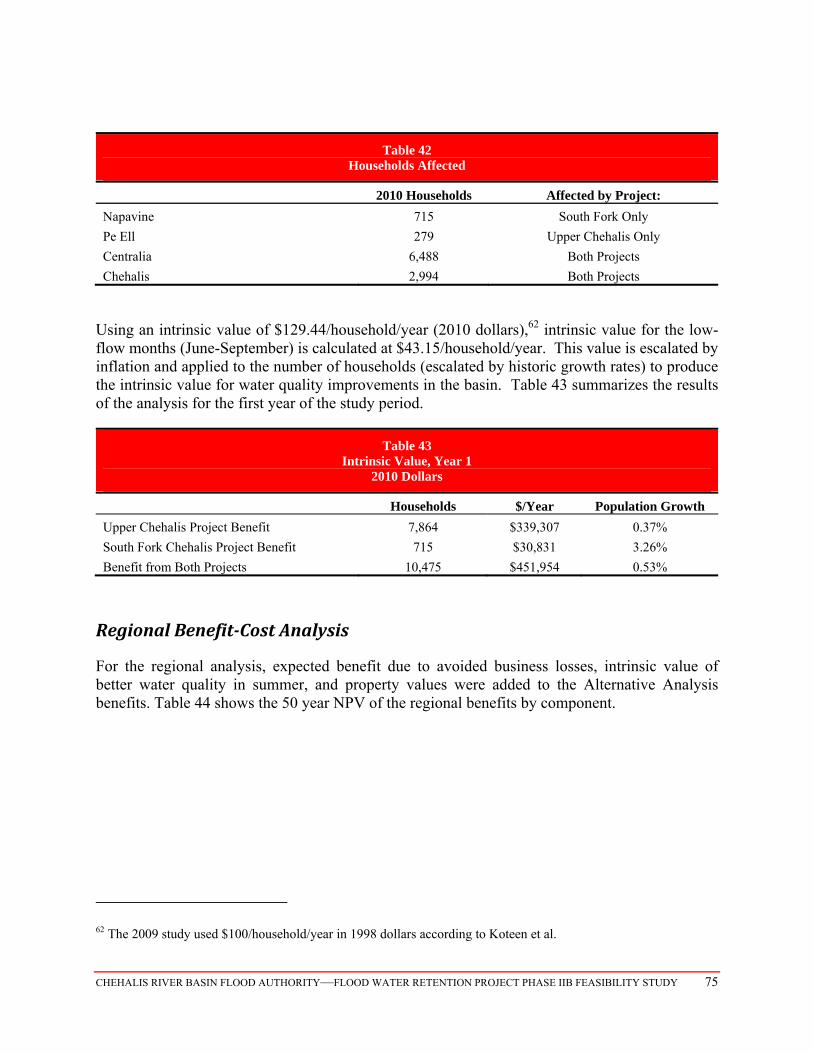
CHEHALIS RIVER BASIN FLOOD AUTHORITY—FLOOD WATER RETENTION PROJECT PHASE IIB FEASIBILITY STUDY 75
Table 42 Households Affected
2010 Households Affected by Project:
Napavine 715 South Fork Only
Pe Ell 279 Upper Chehalis Only
Centralia 6,488 Both Projects
Chehalis 2,994 Both Projects
Using an intrinsic value of $129.44/household/year (2010 dollars),62 intrinsic value for the low-flow months (June-September) is calculated at $43.15/household/year. This value is escalated by inflation and applied to the number of households (escalated by historic growth rates) to produce the intrinsic value for water quality improvements in the basin. Table 43 summarizes the results of the analysis for the first year of the study period.
Table 43 Intrinsic Value, Year 1
2010 Dollars
Households $/Year Population Growth
Upper Chehalis Project Benefit 7,864 $339,307 0.37%
South Fork Chehalis Project Benefit 715 $30,831 3.26%
Benefit from Both Projects 10,475 $451,954 0.53%
RegionalBenefit‐CostAnalysis
For the regional analysis, expected benefit due to avoided business losses, intrinsic value of better water quality in summer, and property values were added to the Alternative Analysis benefits. Table 44 shows the 50 year NPV of the regional benefits by component.
62 The 2009 study used $100/household/year in 1998 dollars according to Koteen et al.
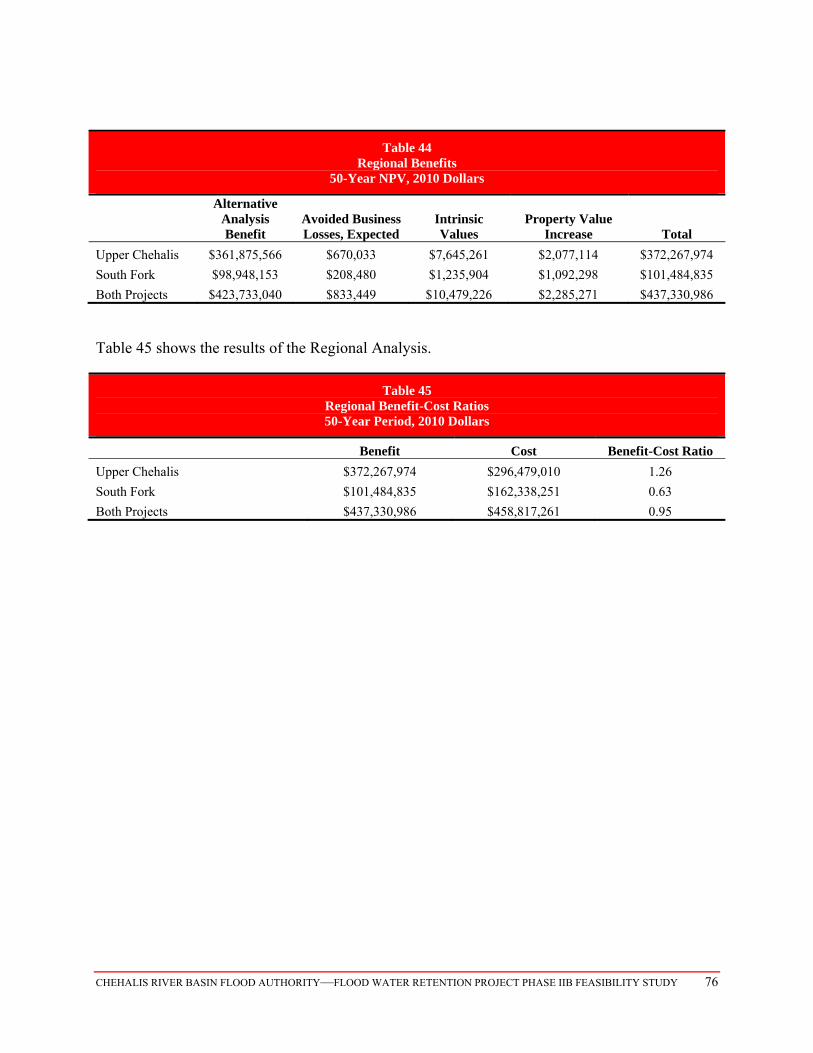
CHEHALIS RIVER BASIN FLOOD AUTHORITY—FLOOD WATER RETENTION PROJECT PHASE IIB FEASIBILITY STUDY 76
Table 44 Regional Benefits
50-Year NPV, 2010 Dollars
Alternative Analysis Benefit
Avoided Business Losses, Expected
Intrinsic Values
Property Value Increase Total
Upper Chehalis $361,875,566 $670,033 $7,645,261 $2,077,114 $372,267,974
South Fork $98,948,153 $208,480 $1,235,904 $1,092,298 $101,484,835
Both Projects $423,733,040 $833,449 $10,479,226 $2,285,271 $437,330,986
Table 45 shows the results of the Regional Analysis.
Table 45 Regional Benefit-Cost Ratios 50-Year Period, 2010 Dollars
Benefit Cost Benefit-Cost Ratio
Upper Chehalis $372,267,974 $296,479,010 1.26
South Fork $101,484,835 $162,338,251 0.63
Both Projects $437,330,986 $458,817,261 0.95
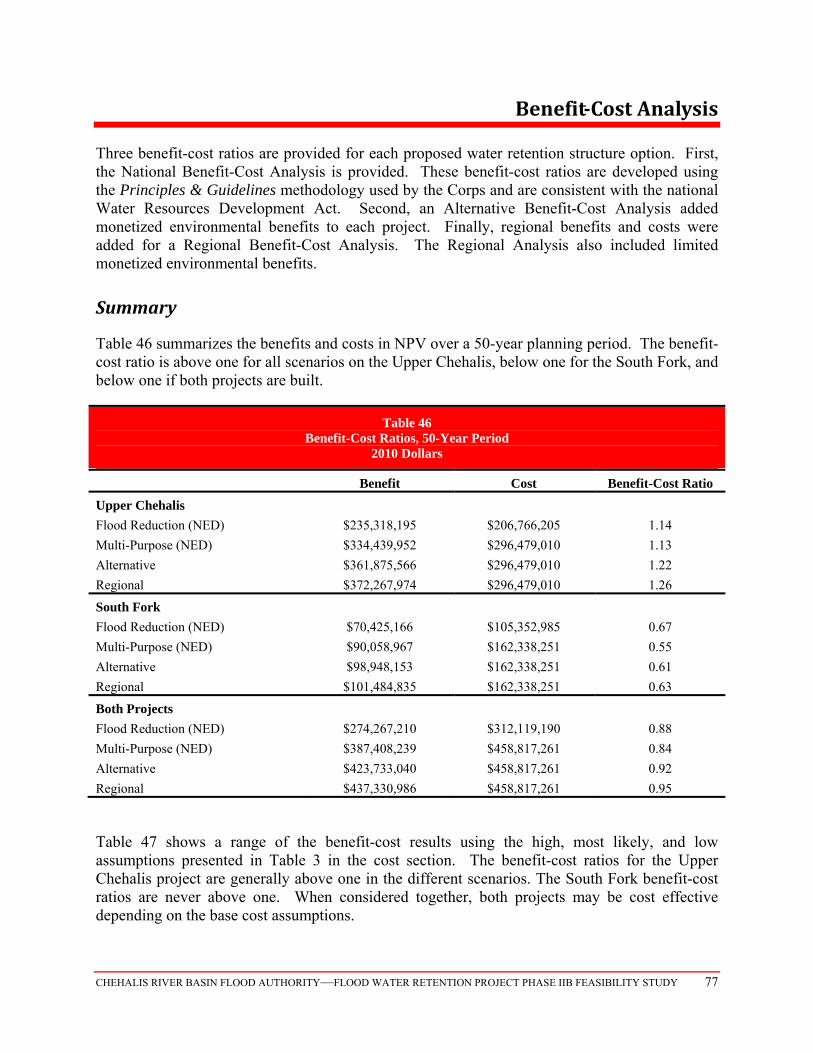
CHEHALIS RIVER BASIN FLOOD AUTHORITY—FLOOD WATER RETENTION PROJECT PHASE IIB FEASIBILITY STUDY 77
Benefit‐CostAnalysis
Three benefit-cost ratios are provided for each proposed water retention structure option. First, the National Benefit-Cost Analysis is provided. These benefit-cost ratios are developed using the Principles & Guidelines methodology used by the Corps and are consistent with the national Water Resources Development Act. Second, an Alternative Benefit-Cost Analysis added monetized environmental benefits to each project. Finally, regional benefits and costs were added for a Regional Benefit-Cost Analysis. The Regional Analysis also included limited monetized environmental benefits.
Summary
Table 46 summarizes the benefits and costs in NPV over a 50-year planning period. The benefit-cost ratio is above one for all scenarios on the Upper Chehalis, below one for the South Fork, and below one if both projects are built.
Table 46 Benefit-Cost Ratios, 50-Year Period
2010 Dollars
Benefit Cost Benefit-Cost Ratio
Upper Chehalis
Flood Reduction (NED) $235,318,195 $206,766,205 1.14
Multi-Purpose (NED) $334,439,952 $296,479,010 1.13
Alternative $361,875,566 $296,479,010 1.22
Regional $372,267,974 $296,479,010 1.26
South Fork
Flood Reduction (NED) $70,425,166 $105,352,985 0.67
Multi-Purpose (NED) $90,058,967 $162,338,251 0.55
Alternative $98,948,153 $162,338,251 0.61
Regional $101,484,835 $162,338,251 0.63
Both Projects
Flood Reduction (NED) $274,267,210 $312,119,190 0.88
Multi-Purpose (NED) $387,408,239 $458,817,261 0.84
Alternative $423,733,040 $458,817,261 0.92
Regional $437,330,986 $458,817,261 0.95
Table 47 shows a range of the benefit-cost results using the high, most likely, and low assumptions presented in Table 3 in the cost section. The benefit-cost ratios for the Upper Chehalis project are generally above one in the different scenarios. The South Fork benefit-cost ratios are never above one. When considered together, both projects may be cost effective depending on the base cost assumptions.
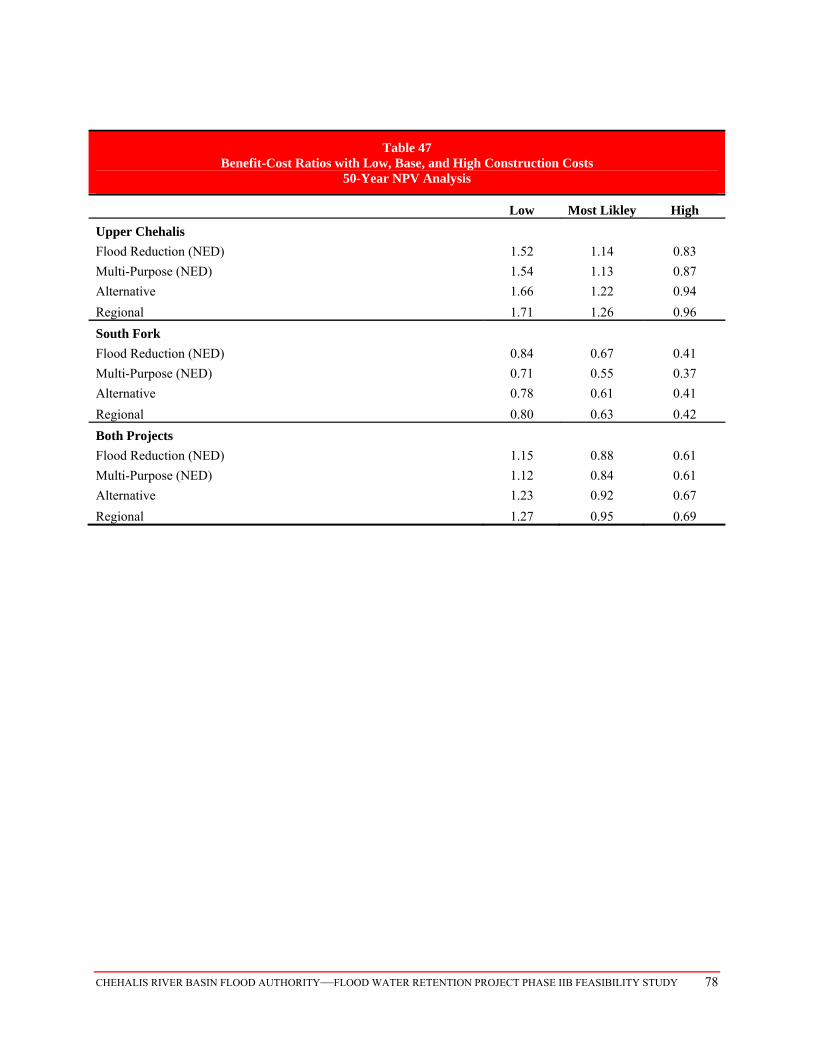
CHEHALIS RIVER BASIN FLOOD AUTHORITY—FLOOD WATER RETENTION PROJECT PHASE IIB FEASIBILITY STUDY 78
Table 47 Benefit-Cost Ratios with Low, Base, and High Construction Costs
50-Year NPV Analysis
Low Most Likley High
Upper Chehalis
Flood Reduction (NED) 1.52 1.14 0.83
Multi-Purpose (NED) 1.54 1.13 0.87
Alternative 1.66 1.22 0.94
Regional 1.71 1.26 0.96
South Fork
Flood Reduction (NED) 0.84 0.67 0.41
Multi-Purpose (NED) 0.71 0.55 0.37
Alternative 0.78 0.61 0.41
Regional 0.80 0.63 0.42
Both Projects
Flood Reduction (NED) 1.15 0.88 0.61
Multi-Purpose (NED) 1.12 0.84 0.61
Alternative 1.23 0.92 0.67
Regional 1.27 0.95 0.69

CHEHALIS RIVER BASIN FLOOD AUTHORITY—FLOOD WATER RETENTION PROJECT PHASE IIB FEASIBILITY STUDY 79
ConclusionsandRecommendations
Summary
Under the Corps’ methodology outlined in the Principles & Guidelines documents, the benefit-cost analysis indicates that the Upper Chehalis project is likely cost effective as either a single purpose or multi-purpose facility. The South Fork Chehalis benefit-cost ratios are not favorable. Figure 16 illustrates the range of benefit-cost ratios calculated given different cost assumptions. In most cost scenarios, the Upper Chehalis project is a cost-effective flood reduction project.
Figure 16 Flood Reduction Only Project Benefit-Cost Ratio with Low, Most Likely, and High Construction
Costs
FurtherReviewandRefinement
The Phase IIB economic analysis included several benefits and costs according to Corps methodology or precedents set in other parts of the country. These costs and benefits were analyzed within the scope of the study; however, additional costs and benefits might be attributed to the projects if further study is funded. Some of the potential studies and updates that could be pursued are described below.
Additional study is required to determine effects on fish, habitat, and mitigation requirements, a portion of which is being studied under separate contract for the Flood Authority.
Additional study on the effect of stream augmentation is required to evaluate temperature
changes to fish and wildlife habitat during low flow seasons.
CHEHALIS RIVER BASIN FLOOD AUTHORITY—FLOOD WATER RETENTION PROJECT PHASE IIB FEASIBILITY STUDY 80
Additional study of stream augmentation during low flow seasons is needed to evaluate dissolved oxygen, turbidity, sediment transport, and hydrologic impacts on fish habitat and behavior, using a dynamic, vertically stratified model.
The hydrology model needs to be updated to include Grays Harbor County and Thurston
County impacts. Additional work is needed to calculate miscellaneous agriculture damages. For example, the
2007 flood event crippled many farms so that they were unable to plant the subsequent season. In addition, damage to dairy inventories, animals, and farming equipment are not accounted for in the analysis. Survey work could be done to determine the exposure to damage from flooding.
Additional work is needed to conduct a wildlife impact study using a methodology such as
the Habitat Evaluation Procedures. Additional study is needed on potential benefits to wetlands. For example, the Flood
Authority or other stakeholders could hire a consultant to evaluate the impact, if any, of created wetlands on flooding. The value of wetlands is estimated according to existing studies; however, the study would benefit from specific information regarding wetland placement for maximum flood reduction capacities using GIS modeling already developed for the basin.
Update the HAZUS model with 2010 Census Block Data. When available, using current
census data will ensure that economic development since 2000 is accounted for in the damage assessment.
Refining the Regional Analysis in the future to include replacement value of structures where
this report includes depreciated values. Using replacement value would increase the cost-effectiveness of all projects.
Additional work to incorporate Corps updated benefits information from the Twin Cities
Project once it is available.
It is important to note that this study represents one piece of a much larger set of studies should major water retentions facilities be pursued. These kinds of projects involve significant work, time and resources to study, permit, and implement.
CHEHALIS RIVER BASIN FLOOD AUTHORITY—FLOOD WATER RETENTION PROJECT PHASE IIB FEASIBILITY STUDY 81
References
Batker, David et al. June 2010. Gaining Ground Wetlands, Hurricanes, and the Economy: The Value of Restoring the Mississippi River Delta. Earth Economics. Tacoma, WA.
Batker, David, Briana Lovell and Maya Kocian. Flood Protection and Ecosystem Services in the Chehalis River Basin. Earth Economics. Tacoma, WA.
Beecher, Hal. Comments from the Washington Departments of Ecology and Fish and Wildlife on Chehalis River Retention Structures Scoping Document and Proposed Studies. Enclosed in the Department of Ecology letter to the Flood Authority Subcommittee. January 7, 2009. Bowker, J.M. et al., “The Net Economic Value of Wilderness,” The Multiple Values of Wilderness (2005), 169. http://www.srs.fs.usda.gov/pubs/ja/ja_bowker007.pdf Cowlitz-Lewis Economic Development District. April 2009. Lewis County 2007 Flood Disaster Recovery Strategy. Kelso, WA.
EES Consulting, Inc. November 2003. Cowlitz Falls Project Independent Review. Completed for Lewis Country PUD. Kirkland, WA.
EES Consulting, Inc. February 18, 2009. Chehalis River Water Retention Facilities Potential Study. Kirkland, WA.
EES Consulting, Inc. October 26, 2009. Lewis County PUD #1 Conservation Potential Assessment, Final Report. Kirkland, WA.
EES Consulting, Inc. November 10, 2009. Chehalis River Water Retention Structures Scoping Document and Proposed Studies. Prepared for: Chehalis River Fish and Aquatics Work Group, Chehalis Basin Flood Authority. Revised Working Draft. Bellingham, WA.
Engineers, U. A., June 2003. Centralia Flood Damage Reduction Project Chehalis River, Washington. Final General Reevalutation Report. Appendix D: Economics. Department of the Army. Washington D.C.: U.S. Army Corps of Engineers.
Engineers, U. A., April 22, 2000. Planning Guidance Notebook. Department of the Army. Washington D.C.: U.S. Army Corps of Engineers.
Hall, Douglas, G. et al. June 2003. Estimation of Economic Parameters of U.S. Hydropower Resources. Idaho National Engineering and Environmental Laboratory, Bechtel BWXT Idaho, LLC.
Kohn, Mike, Pete Rittmueller, and Cory Warnock. 2010. Elevated River Temperatures Result in Salmon Kills in the Chehalis River Basin Summary of Fisheries Investigation July 30-August 27, 2009. EES Consulting, Inc. Bellingham, WA.
CHEHALIS RIVER BASIN FLOOD AUTHORITY—FLOOD WATER RETENTION PROJECT PHASE IIB FEASIBILITY STUDY 82
National Oceanic and Atmospheric Association. Historical Crests for Chehalis River near Doty. Available online: http://water.weather.gov/ahps2/crests.php?wfo=sew&gage=dotw1.
Olson, Patricia. Comments from WSDOT, Ecology, and Fish and Wildlife, Chehalis River Flood Water Retention Project Phase IIB Feasibility Study (Nov. 10, 2010).
Schreiber, Dan. November 26, 2008. The Flood: One Year On. The Chronicle Online.
State of Washington Office of Financial Management. 2007 County Projections by Single Year after 2010. Medium. Accessed May 17, 2010. Available online at: http://www.ofm.wa.gov/pop/gma/projections07.asp
Scawthorn, Charles et al. May 2006. HAZUS-MH Loss Estimation Methodology. I. Overview and Flood Hazard Characterization. Natural Hazards Review, American Society of Civil Engineers. Reston, VA.
Scawthorn, Charles et al. May 2006. HAZUS-MH Loss Estimation Methodology. II. Damage and Loss Assessment. Natural Hazards Review, American Society of Civil Engineers. Reston, VA.
Shannon & Wilson. October 28, 2009. Reconnaissance-Level Geotechnical Report Proposed Chehalis River and South Fork Dam Sites. Seattle, WA.
Shannon & Wilson. October 27, 2009. Geologic Reconnaissance Study Proposed Chehalis River and South Fork Dam Sites. Seattle, WA.
USGS. Gage 12020000. Real-Time Water Data for the Nation. Available at: http://waterdata.usgs.gov/nwis/uv?
USGS Water-Data Report 2009. 12020000 Chehalis River Near Doty, WA. Available at: http://wdr.water.usgs.gov/wy2009/pdfs/12020000.2009.pdf
Washington Department of Transportation. 2009. Annual Traffic Report. Available at: http://www.wsdot.wa.gov/mapsdata/tdo/annualtrafficreport.htm
Washington Department of Transportation. September 2008. Storm-Related Closures of I-5 and I-90: Freight transportation Economic Impact Assessment Report.
Washington State Transportation Commission. December 2006. Statewide Rail Capacity and System Needs Study. Task 10.2 – Washington State Rail Investment Plan. Available at www.wstc.com.
Washington Trails Association. Projected Park Closures. Accessed September 24, 2010. Available online:http://www.wta.org/trail-news/magazine/projected-state-park-closures

CHEHALIS RIVER BASIN FLOOD AUTHORITY—FLOOD WATER RETENTION PROJECT PHASE IIB FEASIBILITY STUDY 83
AppendixA
Table A-1 Building Clean-Up Costs Detail
10-Year 50-Year 100-Year 500-Year formula
Base
Residential Buildings, number 218 357 514 1461 a
Damaged Residential Floor space, sq ft 348,800 571,200 822,400 2,337,600 b = a × 1,600
Commercial Buildings, number 1 12 13 25 c
Damaged Commercial Floor space, sq ft 15,800 189,600 205,400 395,000 d = c × 15,800
Total Damage, $ $1,567,385 $3,270,616 $4,418,426 $11,747,219 e = (b + d) × $4.30
With Upper Chehalis Structure
Residential Buildings, number 181 288 330 706 f
Damaged Residential Floor space, sq ft 289,600 460,800 528,000 1,129,600 g = f × 1,600
Commercial Buildings, number 0 4 8 13 h
Damaged Commercial Floor space, sq ft 0 63,200 126,400 205,400 i = h × 15,800
Total Damage, $ $1,244,966 $2,252,632 $2,813,211 $5,739,054 j = (g + i) × $4.30
Upper Chehalis Project Benefit $322,419 $1,017,983 $1,605,215 $6,008,166 k = e - j
With South Fork Chehalis Structure
Residential Buildings, number 202 326 417 1353 l
Damaged Residential Floor space, sq ft 323,200 521,600 667,200 2,164,800 m = l × 1,600
Commercial Buildings, number 1 8 12 21 n
Damaged Commercial Floor space, sq ft 15,800 126,400 189,600 331,800 o = n × 15,800
Total Damage, $ $1,457,333 $2,785,698 $3,683,312 $10,732,675 p = (m + o) × $4.30
South Fork Chehalis Project Benefit $110,052 $484,918 $735,115 $1,014,544 q = e - p
With Both Projects
Residential Buildings, number 175 260 301 520 r
Damaged Residential Floor space, sq ft 280,000 416,000 481,600 832,000 s = r × 1,600
Commercial Buildings, number 0 3 5 11 t
Damaged Commercial Floor space, sq ft 0 47,400 79,000 173,800 u = t × 15,800
Total Damage, $ $1,203,697 $1,992,118 $2,409,973 $4,323,850 v = (s + u) × $4.30
Benefit from Both Projects $363,688 $1,278,498 $2,008,454 $7,423,369 w = e - v

CHEHALIS RIVER BASIN FLOOD AUTHORITY—FLOOD WATER RETENTION PROJECT PHASE IIB FEASIBILITY STUDY 84
AppendixB