check in presentation 2016 david pyman
TRANSCRIPT

Check In Wellbeing Program
David Pyman St. Peters College, Adelaide

My Background

Whyalla, South Australia

St. Peter’s College

School & Allen Boarding

∗ 90 boys from Yr 7 – 12 ∗ Boys split into Mentor Groups of approximately 15
boys ∗ Yr 7&8 group ∗ 5 Yr 9-12 Mentor Groups. Each one supervised by a
teaching member of the boarding house
School & Allen Boarding House

∗ From Pastoral Care to Wellbeing
∗Why the change?
Wellbeing

∗ 3 million Australians are currently living with depression or anxiety
∗ 45% of Australians will experience a mental illness in their lifetime
∗ 65% of people with mental illness do not access any treatment
∗ 1 in 5 Australians between the age of 15-85 experience a mental illness in any given year
Wellbeing

Wellbeing

Wellbeing
World Health Organisation estimates that depression will be the #1 health concern across the World by 2030

∗ 6 Australians die from suicide per day. ∗ 60,000 attempt suicide per year. The majority are
female. ∗ Suicide is the #1 cause of death in people aged
15-24 ∗ The vast majority of suicide deaths are male – 75% ∗ Other major groups;
Wellbeing
Indigenous Rural & Remote
L. G. B. TChildren

∗ Even among young people with the most severe mental health problems, only about 50% receive professional help
∗ The ‘Kevin Factor’
Talking to Teenagers
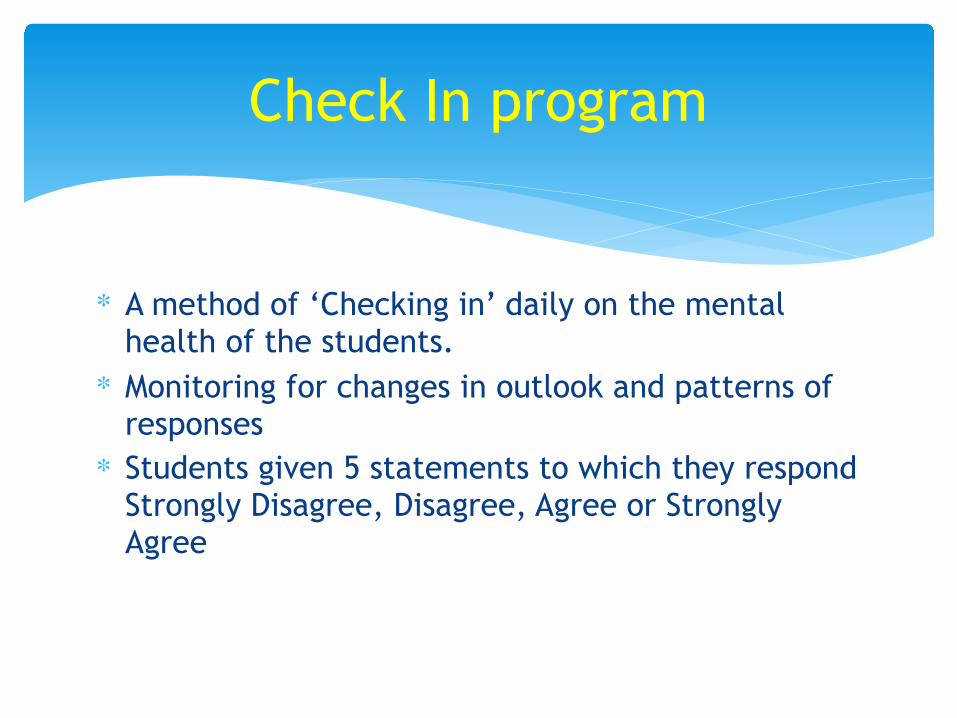
∗ A method of ‘Checking in’ daily on the mental health of the students.
∗ Monitoring for changes in outlook and patterns of responses
∗ Students given 5 statements to which they respond Strongly Disagree, Disagree, Agree or Strongly Agree
Check In program
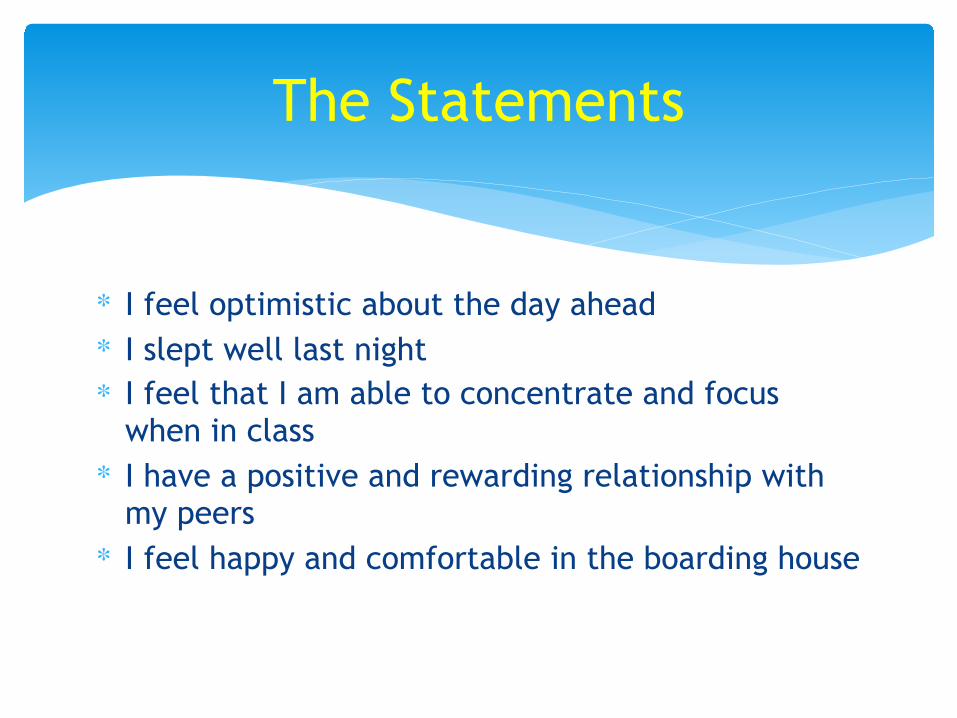
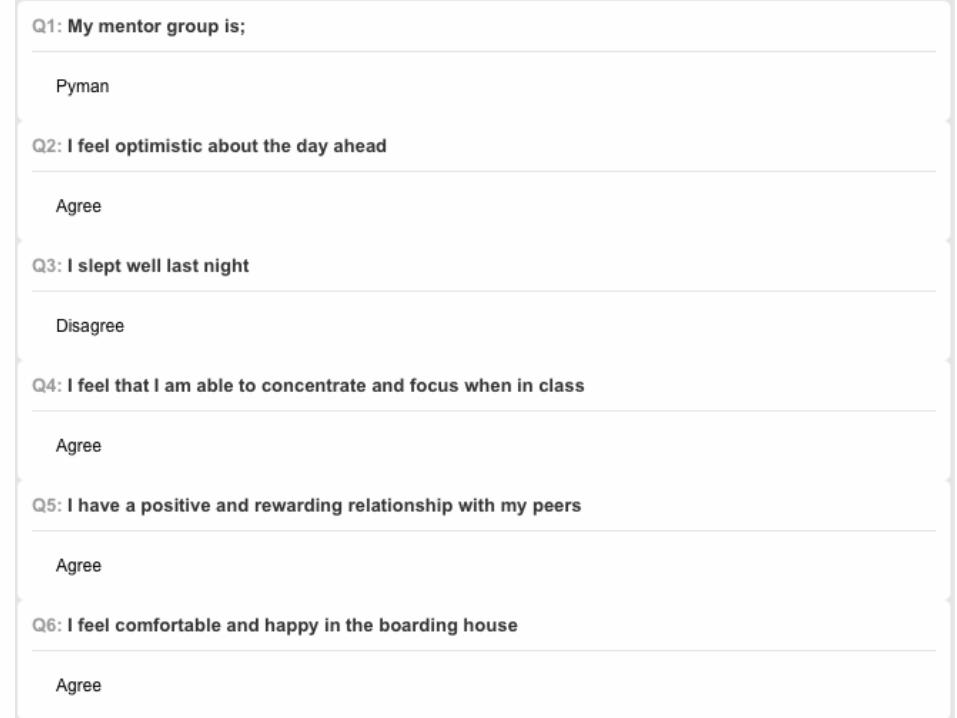
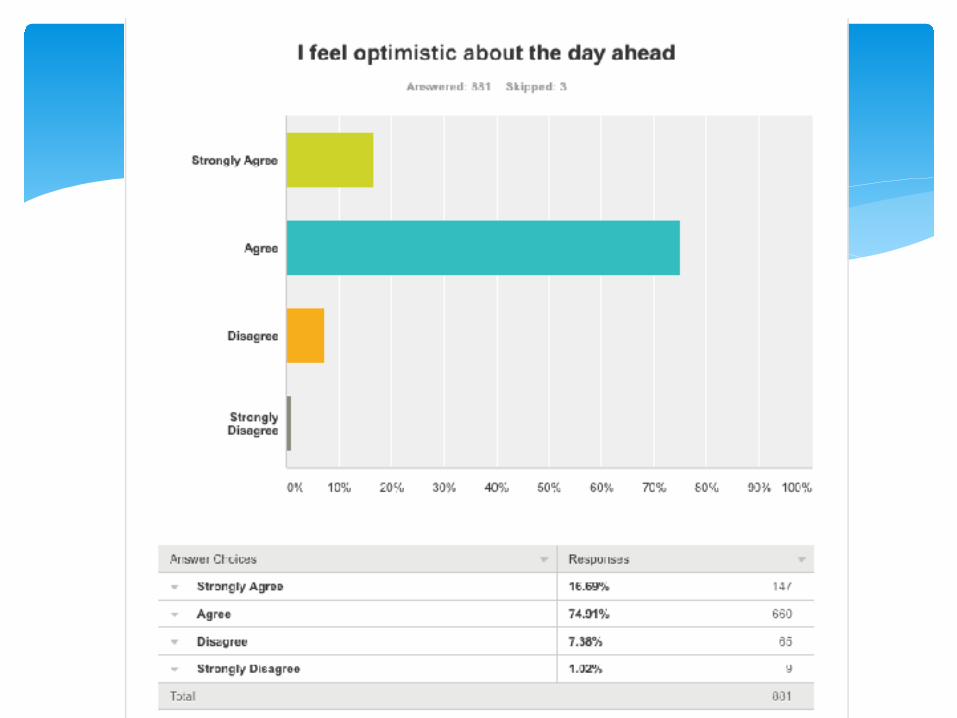
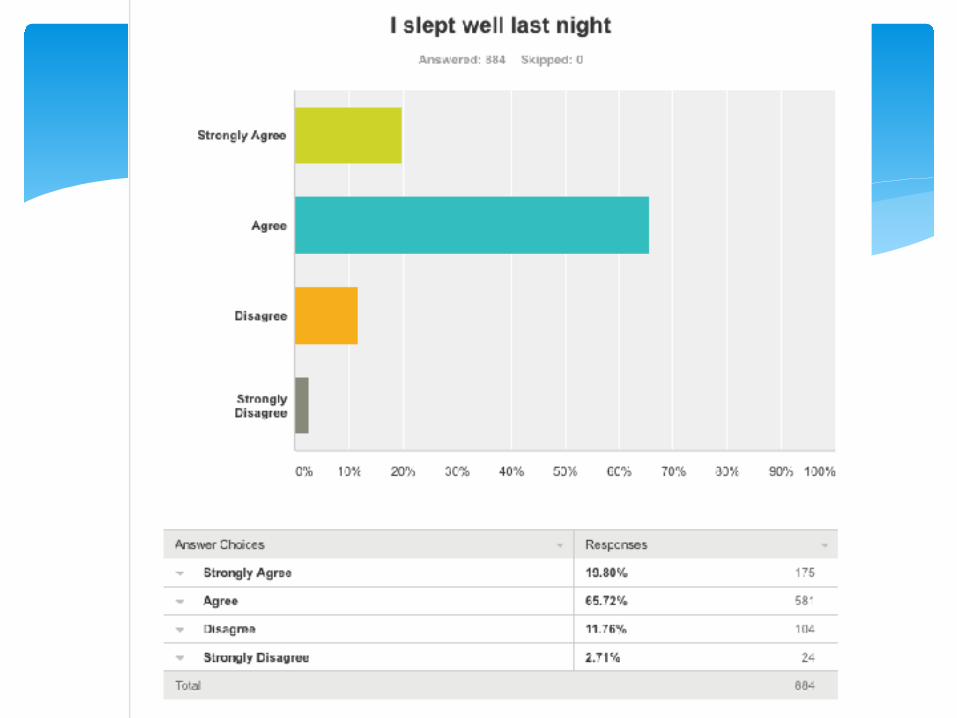
∗ I feel optimistic about the day ahead ∗ I slept well last night ∗ I feel that I am able to concentrate and focus
when in class ∗ I have a positive and rewarding relationship with
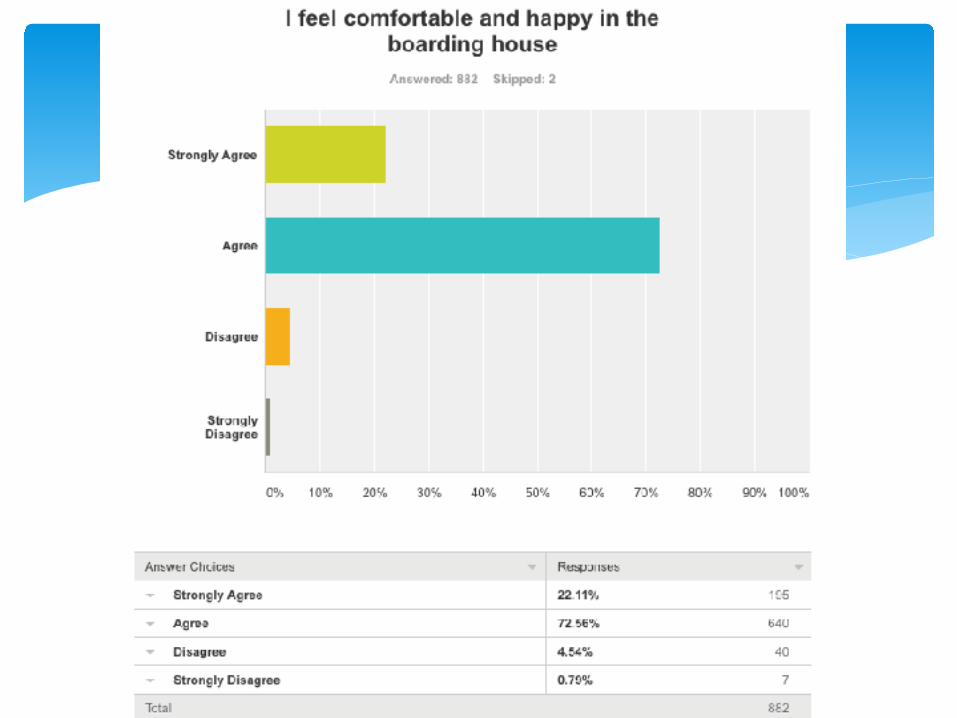
my peers ∗ I feel happy and comfortable in the boarding house
The Statements

What it looks like

∗ Results can be analysed at an individual level or as a group
The Results

SurveyMonkey Options Page
The Results

Results - Patterns
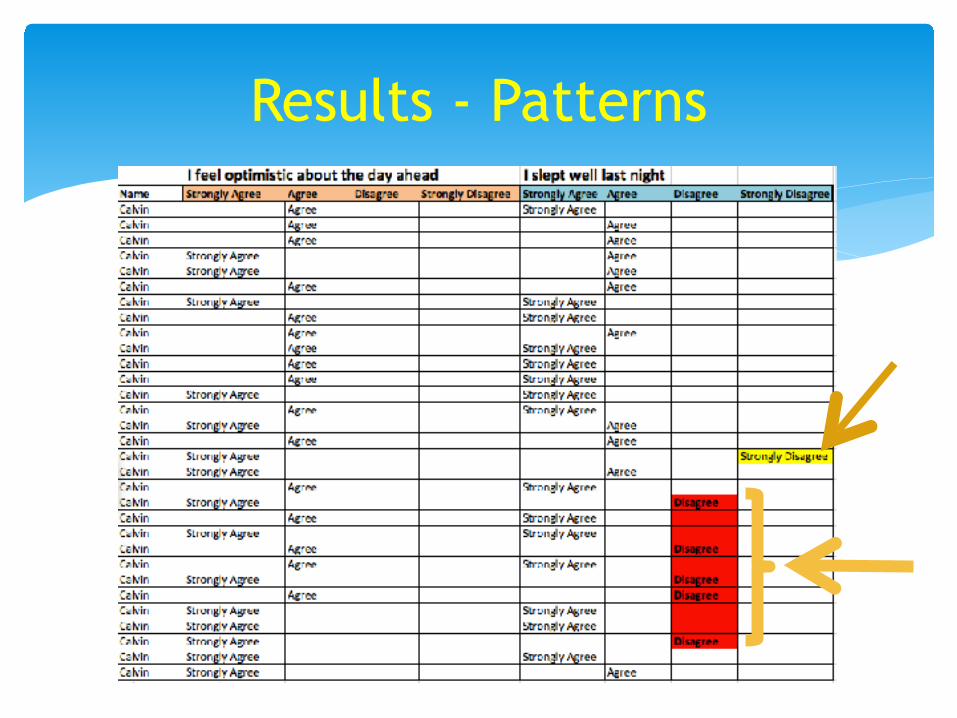
Results - Patterns

Individual Analysis
Sleep Results
Slee
p Re
spon
se
0
1
2
3
4
1 2 3 4 5 6 7 8 9 10 11 12 13 14 15 16 17 18 19 20 21 22 23 24 25 26 27 28 29 30 31 32 33 34
Group Results
Group Results

Group Results

Group Results
Group Results

Comparative Results
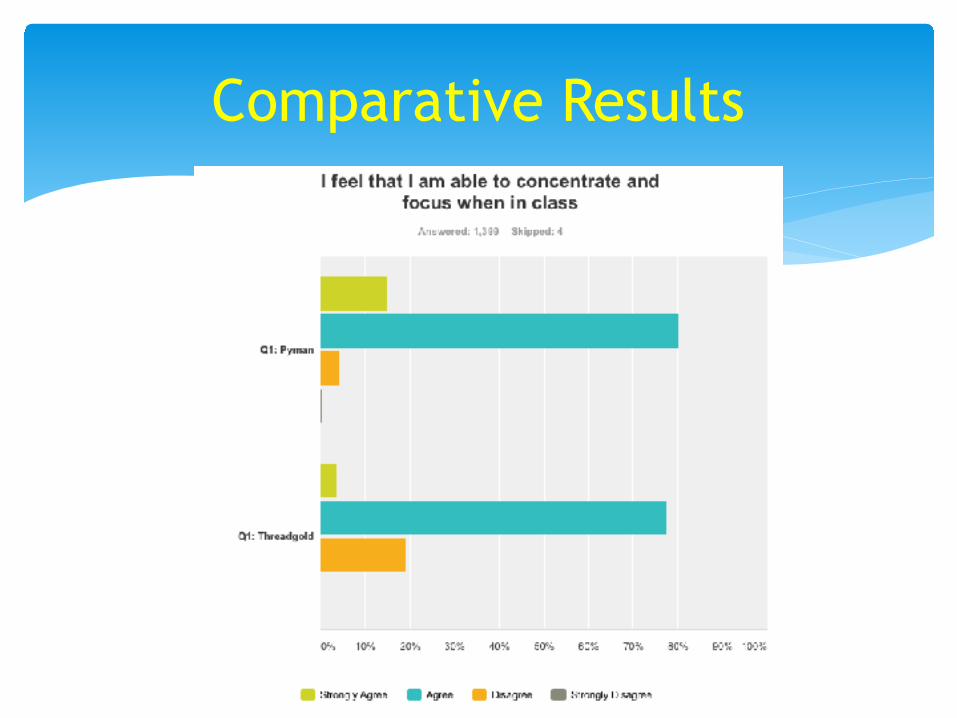
Comparative Results

Whole House Results

Whole House Results

∗ Do the students give rote answers? ∗ Are we asking the right questions? ∗ Who can see the data? ∗ What is the data used for? ∗ Scaled responses? Can we compare? ∗ Forced participation? ∗ Permissions?
The Questions

∗ Do the students give rote answers? ∗ Daily responses may increase likelihood of rote
answers. However, across a pattern of responses, changes to the rote answers are a strong indicator of change of feeling.
The Answers

∗ Are we asking the right questions? ∗ The 5 statements used were overseen by our
school Psychiatrist and are based on evidence as seen in Positive Psychology publications
The Answers
∗ Who can see the data? ∗ Our responses are available to be viewed by Head
of Boarding and the Teaching staff only. Boys are advised of this in advance.
The Answers

∗ What is the data used for? ∗ The student responses are used as a guide only. It
is a conversation starter and does not replace normal staff supervision of wellbeing.
∗ The data is not used to make judgments – i.e. House Leaders, awards etc…
The Answers

∗ Scaled Responses? Can we compare? ∗ The responses provided are not quantitative nor
standardised. We cannot reliably say what one students response indicates about their wellbeing. It is a guide only.
∗ Likewise we cannot compare responses between students. One students Strongly Disagree may be the same as another students Disagree. Knowing your students is critical.
The Answers

∗ Forced Participation? ∗ All responses have been voluntary. ∗ Pyman mentor group responded at a rate above
95% over 12 months. ∗ Wider boarding house has been approximately 55%.
The Answers

∗ Permissions? ∗ Collection of data of this kind requires clear
permissions. Must ensure permission from School and parents.
The Answers

∗ What if? ∗ Worse case scenario. ∗ Legal issues ∗ Evidence of action
The Big Issue