charlottesville city market district...
TRANSCRIPT

Charlottesville City Market District Study 3/12/2013
(c) Market Ventures, Inc. 1
Charlottesville City Market DistrictEconomic Feasibility Study
Public MeetingMarch 11, 2013
Agenda
1. Project Goals & Study Components
2. Comparable Markets & Key Elements of Success
3. Market Research
4. Site Analysis
5. Development Principles
6. Design Competition
7. Concept Scenarios
8. Next Steps

Charlottesville City Market District Study 3/12/2013
(c) Market Ventures, Inc. 2
Project Goals
1. Assess the viability of a “market district” on the blocks around City Market
2. Create an improved, permanent home for City Market
3. Create a realistic strategy for realizing the economic development potential of the Market’s current, city‐owned parking lot site and the adjacent privately‐owned parking lots
Study Components
Implementation Strategies
Roles and partnerships Operations pro forma Development cost estimate
Concept PlanDevelopment principles
and functionsTenant mix and sales
projections Operations model Co‐location plan and issues Public space standards
Market StudyComparable
markets researchExisting
competitionCustomer demand
analysis Supply analysis Impact on existing stores Economic impact

Charlottesville City Market District Study 3/12/2013
(c) Market Ventures, Inc. 3
Comparable Markets
• Task: “…identify successful markets and market districts in similarly‐sized communities and provide information about ownership, tenant mix, amenities, design guidelines, and key factors for success”
• Approach
– Define what is a “market district”
– Identify examples of successful market districts
– Determine if there are successful market districts in cities of similar size to Charlottesville (MSA pop. 204,000, MSA rank 208)
– Identify key factors for success for markets similar to City Market
Public Market Types
Num
ber
Complexity
Seasonal open-airOne day 3 day
Nearly 8,000 in USA
Wide range of sizes
Minimal or no infrastructure
City Market currently fits within this archetype

Charlottesville City Market District Study 3/12/2013
(c) Market Ventures, Inc. 4
Public Market TypesN
umbe
r
Complexity
Indoor winter market
Seasonal open-airOne day 3 day
Year-round open-air, multiple sites
One day 4 day
52% increase to nearly 1,900 (USDA)
Public Market Types
Num
ber
Complexity
Indoor winter market
Seasonal open-airOne day 3 day
Market shed
Market shed characteristics:
• Simple, permanent structure
• Simplify vendor set up and provide weather protection
• Often have electricity, water, and lighting
• A few have garage doors and heating

Charlottesville City Market District Study 3/12/2013
(c) Market Ventures, Inc. 5
Public Market TypesN
umbe
r
Complexity
Indoor winter market
Market hall
Seasonal open-airOne day 3 day
Market shed
Market hall characteristics:
• Permanent indoor facility regulated by health department
• 3‐7 day/wk operation
• Dedicated management
• Often food production within facility
Public Market Types
Num
ber
Complexity
Market district
Indoor winter market
Market hall
Seasonal open-airOne day 3 day
Market shed
Market District Characteristics:
• Multiple city blocks
• Multiple interconnected functions/types of businesses and programs
• Multiday (daily) operation
• Indoors and outdoors
• Branded place
• Dedicated, sophisticated management

Charlottesville City Market District Study 3/12/2013
(c) Market Ventures, Inc. 6
Successful market districts in smaller cities: Charleston City Market• Pop. 682,000 (3.3x > Charlottesville,
MSA rank 78)
• Market Street deeded to city in 1788 with stipulation that remain a public market indefinitely
• City leases historic market facilities (40,000 sf) to private real estate firm
• $5.5 m renovation in 2011
• Over 100 vendors, open daily
• Biggest tourist attraction in city
• Product mix mainly geared toward tourists – working to increase appeal for residents with fresh food
Successful market districts in smaller cities: Rochester Public Market
• Population 1.04 million (5x > Charlottesville, MSA rank 51)
• Established 1905
• Owned by City of Rochester, operated by Dept of Parks & Rec
• Year‐round operation; retail sheds open Tuesdays, Thursdays, Saturdays; Sunday and evening events
• ~1,000 parking spaces
• 40,000+ customers Saturday

Charlottesville City Market District Study 3/12/2013
(c) Market Ventures, Inc. 7
Successful market districts in smaller cities: Rochester Public Market• Designated district within Rochester’s zoning code
• Branded as Public Market District
• Gated boundary
• Mix of outdoor and indoor functions, wholesale and retail
• Private real estate on periphery
• Dedicated city management staff
Successful market districts: City Market, Kansas City
• Pop. 1.78 million (8.7x > Charlottesville, MSA rank 29)
• Established 1857
• Owned by City, operated by private real estate mgt firm
• 11 acres, 150,000 sf retail, 146 farmer stalls, 600 parking spaces
• 700,000 visitors per year

Charlottesville City Market District Study 3/12/2013
(c) Market Ventures, Inc. 8
City Market
15
City Market
16

Charlottesville City Market District Study 3/12/2013
(c) Market Ventures, Inc. 9
Smallest city with a “market district”: Ann Arbor, MI• Pop. 348,000 (1.5x > Charlottesville,
MSA rank 146)
• City‐run farmers’ market under sheds• Saturday operation year‐round• Wednesdays seasonal
• Kerrytown Shops (private indoor market similar to Main Street Market)• Seafood, meats & produce, spices, oils,
coffee• Crafts • Restaurants
• Zingerman’s Deli
• Branded as “market district” but not common management
Kerrytown Shops
What makes a public market successful?
1. A great site• Easily accessible to the entire region
(physically and psychologically)
• Visible from highways or major thoroughfares
• Easy circulation
• Lots of free at‐grade parking
• Pedestrian access/proximity to downtown
• Supportive context, particularly other food businesses
• Ease and cost of acquisition
Dane County Farmers’ Market
Granville Island Public Market, Vancouver

Charlottesville City Market District Study 3/12/2013
(c) Market Ventures, Inc. 10
What makes a public market successful?
2. Environment• A place people want to be
• Landmark structure
• A comfortable public space that welcomes all elements of the community
• Well designed stalls and infrastructure that support small food retailers
Boulder (CO) Farmers’ Market Bellingham (WA) Farmers’ Market
What makes a public market successful?
3. Engaged professional management• Property management
• Leasing
• Marketing
• Business assistance
• Community engagement/Partnerships

Charlottesville City Market District Study 3/12/2013
(c) Market Ventures, Inc. 11
What makes a public market successful?
4. Consumers who care about local, quality food; a “culture” of public market shopping
What makes a public market successful?
5. Great vendors with unique products and services who carve out their niche regardless of competition
• Product innovation
• Service innovation

Charlottesville City Market District Study 3/12/2013
(c) Market Ventures, Inc. 12
0
10
20
30
40
50
60
70
80
90
Grocery stores Specialty food stores Beer, wine liquor stores
Number of StoresCharlottesville MSA
2002 Economic Census 2007 Economic Census
Competitive Analysis: Existing Food Stores
Source: 2007 Economic Census, US Census Bureau
N/A N/A
$341,290
$451,822
$0
$50,000
$100,000
$150,000
$200,000
$250,000
$300,000
$350,000
$400,000
$450,000
$500,000
Grocery stores Specialty food stores Beer, wine liquor stores
Sales (000s)Charlottesville MSA
2002 Economic Census 2007 Economic Census
N/A N/A
• Charlottesville food sales dominated by large number of high and mid‐range quality supermarkets; several independent specialty food retailers
• Main Street Market has 12 vendors, sales and popularity are growing; customers come on Saturdays after visiting City Market
• Successful Whole Foods and Trade Joe’s; Wegman’s coming soon
Food & Beverage Store SalesCharlottesville and Albemarle County
Source: Weldon Cooper Center for Public Service
$80,000,000
$85,000,000
$90,000,000
$95,000,000
$100,000,000
$105,000,000
$110,000,000
20101
20102
20103
20104
20111
20112
20113
20114
20121
20122
20123
Total Taxable Sales

Charlottesville City Market District Study 3/12/2013
(c) Market Ventures, Inc. 13
Competitive Analysis: Farmers’ Markets within 50 miles
Customer Demand Analysis
Typical Higher Spending Public Market Shoppers• Families
• Higher income levels (household income $75,000 and above)
• Highest spending customer typically a 40 to 55 year old woman
• Educational attainment a key indicator
• Public markets can appeal to both the highest income shoppers and lower income shoppers, ethnically diverse
• SNAP (food stamps) and Farmers’ Market Nutrition Program coupons can supplement fresh food sales
• At some public markets, lower income consumers spend more than higher income ones

Charlottesville City Market District Study 3/12/2013
(c) Market Ventures, Inc. 14
Charlottesville City Market Customers
<$25k14%
$25‐$49k15%
$50‐74k14%
$75‐99k15%
$100‐149k23%
>$150k19%
Household IncomeCity Market Charlottesville
HS or below3%
Some college11%
Bachelor or
Associate39%
Graduate degree47%
EducationCity Market Charlottesville
Once/week31%
3x/month19%
2x/month21%
1x/month10%
1‐4x/season
19%
Visit FrequencyCity Market Charlottesville
0.0%10.0%20.0%30.0%40.0%50.0%60.0%70.0%80.0%90.0%100.0%
April May June July Aug Sept Oct Nov
Months VisitCity Market Charlottesville
Source: JPC 2011 Survey Data Randomized Summary
Charlottesville City Market Customer Visit Characteristics
Source: JPC 2011 Survey Data Randomized Summary
• Social experience— 70% come with someone else
— 54% often see friends or acquaintances at the Market (89% sometimes or often)
— 53% spend one hour or more
• Downtown connection– 75% sometimes or often combine visiting the Market with other activities in
downtown Charlottesville (shopping, restaurants, sightseeing)
• Why go to the Market? (4 or 5 on 5 point scale of importance)
― To support the local economy (94%)
― To purchase fresh food (93%)
― To know where their food comes from (77%)
― To enjoy the atmosphere (71%)

Charlottesville City Market District Study 3/12/2013
(c) Market Ventures, Inc. 15
Demand Analysis: Trade Areas
$0 $10,000 $20,000 $30,000 $40,000 $50,000 $60,000 $70,000 $80,000 $90,000 $100,000
2 mile ring 2‐5 m band
5‐20 mile band
USA
Ave household income
0.0%
10.0%
20.0%
30.0%
40.0%
50.0%
60.0%
2 mile ring 2‐5 m band 5‐20 mile band
USA
Educational Attainment
Bachelor's Degree Master's, Professional or Doctorate
0
20,000
40,000
60,000
80,000
100,000
120,000
140,000
2 mile ring 2‐5 m band 5‐20 mile band
Population
2010 2013 2018
Consumer Expenditures: Fresh Food
Source: Nielsen/Claritas, Inc., 2013
2 mile ring 2013 Estimate 2018 Projection Change $ Change %Market categories (000s) (000s) (000s)Baked goods $10,143 $11,068 $925 9.1%Dairy $11,294 $12,207 $913 8.1%Meat $15,171 $16,174 $1,003 6.6%Poultry $6,950 $7,374 $424 6.1%Prepared foods $5,275 $5,687 $412 7.8%Produce - fresh $10,462 $11,256 $794 7.6%Seafood - fresh $1,524 $1,641 $117 7.7%Specialty food $7,326 $7,943 $617 8.4%Sweets $4,269 $4,721 $452 10.6%Coffee/Tea $2,662 $2,898 $236 8.9%Wine/Beer $19,262 $20,660 $1,398 7.3%Total $94,338 $101,629 $7,291 7.7%
All Food/Alcohol at Home $135,566 $146,147 $10,581 7.8%
2-5 mile band 2013 Estimate 2018 Projection Change $ Change %Market categories (000s) (000s) (000s)Baked goods $9,495 $10,362 $867 9.1%Dairy $9,980 $10,725 $745 7.5%Meat $13,334 $14,366 $1,032 7.7%Poultry $5,757 $6,226 $469 8.1%Prepared foods $4,474 $4,838 $364 8.1%Produce - fresh $9,833 $10,613 $780 7.9%Seafood - fresh $1,410 $1,523 $113 8.0%Specialty food $6,475 $6,998 $523 8.1%Sweets $3,880 $4,259 $379 9.8%Coffee/Tea $2,515 $2,733 $218 8.7%Wine/Beer $14,720 $15,963 $1,243 8.4%Total $81,873 $88,606 $6,733 8.2%
All Food/Alcohol at Home $116,781 $125,873 $9,092 7.8%

Charlottesville City Market District Study 3/12/2013
(c) Market Ventures, Inc. 16
Supply Analysis
Sources: Google Map and US Census Bureau Quick Facts
County Sq. Miles Population
Albemarle 721 100,553 Augusta 967 73,549 Buckingham 580 17,278 Culpepper 379 47,476 Cumberland 297 9,969 Fluvanna 286 26,061 Goochland 281 21,883 Greene 156 18,660 Louisa 496 33,395 Madison 321 13,169 Nelson 471 15,097 Orange 341 33,938 Page 311 23,958 Rappahannock 266 7,444 Rockingham 849 76,589 Total 6,723 519,019
Radius if area a circle 46
Virginia 39,490 8,096,604 Radius if area a circle 112
Agricultural Data Findings
Year Farms ‐ VA
1964 80,354 1969 64,572 1974 52,699 1978 49,936 1982 51,859 1987 44,799 1992 42,230 1997 41,095 2002 47,606 2007 47,383 2012 54,946 2017 62,522 ∆ 2007‐2017 15,139 ∆% 1997‐2007 15.3%∆% 2007‐2017 32.0%∆% 2007‐2012 16.0%
y = 885.81x2 ‐ 12797x + 88531R² = 0.9294
‐
10,000
20,000
30,000
40,000
50,000
60,000
70,000
80,000
90,000
1964 1969 1974 1978 1982 1987 1992 1997 2002 2007 2012 2017
Number of Farms ‐ Virginia

Charlottesville City Market District Study 3/12/2013
(c) Market Ventures, Inc. 17
Farms Utilizing Direct Marketing
y = 80x + 160R² = 0.8685
‐
100
200
300
400
500
600
700
1992 1997 2002 2007 2012 2017
Direct Mktg ‐ # of Farms ‐ Region
Year Virginia Region
1992 1,789 278 1997 1,713 267 2002 2,513 392 2007 2,855 503 2012 3,383 560 2017 4,044 640
Change 2007‐2017 1,189 137 Change 2007‐2017 42% 27%
y = 1054.3x ‐ 153R² = 0.7935
$‐
$1,000
$2,000
$3,000
$4,000
$5,000
$6,000
$7,000
1992 1997 2002 2007 2012 2017
Direct Marketing Sales ($000s) Region
4.2%
3.3%
6.0%
5.1%
0.0%
1.0%
2.0%
3.0%
4.0%
5.0%
6.0%
7.0%
Virginia Region
Farms Engaged in Direct Marketing
1992
1997
2002
2007
Charlottesville City Market Number of Vendors
Source: City Market
• Management began reporting average numbers of vendors per week in 2007 (83); rose to 102 in 2012
• If trends continue, the Market will have about 123 vendors by 2014
Target: 50% farmer/30% food/20% crafts
y = 77.25e0.0578x
0
20
40
60
80
100
120
140
2007 2008 2009 2010 2011 2012 2013 2014
Ave # VendorsCharlottesville City Market # Vendors Reserved Non‐reserved Total
Farm 46 50 96
Food 24 46 70
Crafts 32 112 144
Total 102 208 310
# Vendors Reserved Non‐reserved Total
Farm 45% 24% 31%
Food 24% 22% 23%
Crafts 31% 54% 46%
Total 33% 67% 100%

Charlottesville City Market District Study 3/12/2013
(c) Market Ventures, Inc. 18
Charlottesville City Market Vendor Stalls and Sales
2010 Sales Reserved Non‐reserved Total
Farm $ 800,201
Food $ 396,268
Crafts $ 167,969
Total $ 1,364,438 $ 119,218 $ 1,483,656
2010 Sales Reserved Non‐reserved Total
Farm 59%
Food 29%
Crafts 12%
Total 92% 8% 100%
2012 Stalls Reserved Non‐reserved Total
Farm 65
Food 21
Crafts 22
Total 108 7 115
2012 Stalls Reserved Non‐reserved Total
Farm 60%
Food 19%
Crafts 20%
Total 94% 6% 100%
Target: 50% farmer/30% food/20% crafts
Charlottesville City Market: Gross Sales
Vendors required to report sales daily; pay 6% of gross sales for rent
$‐
$200,000
$400,000
$600,000
$800,000
$1,000,000
$1,200,000
$1,400,000
$1,600,000
$1,800,000
$2,000,000
2000 2001 2002 2003 2004 2005 2006 2007 2008 2009 2010 2011 2012
City Market Sales Charlottesville, VA
Gross sales reported City revenue
Charlottesville City Market District Study 3/12/2013
(c) Market Ventures, Inc. 19
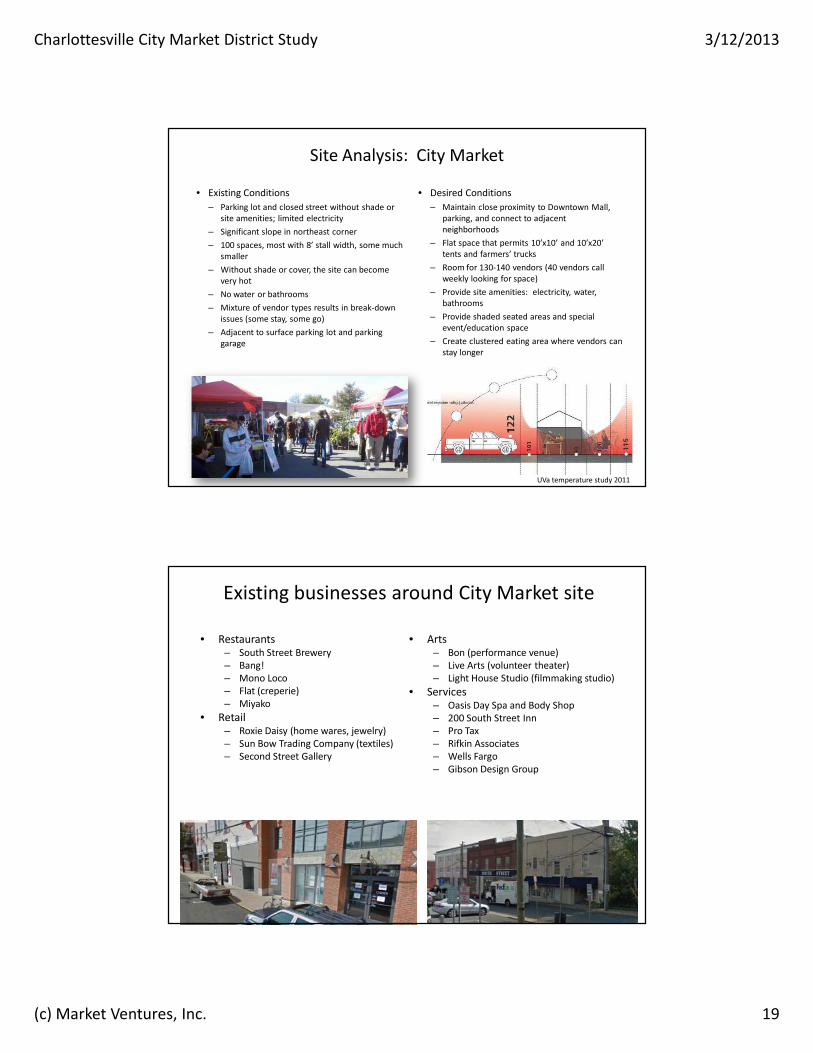
Site Analysis: City Market
• Existing Conditions– Parking lot and closed street without shade or
site amenities; limited electricity– Significant slope in northeast corner– 100 spaces, most with 8’ stall width, some much
smaller– Without shade or cover, the site can become
very hot– No water or bathrooms– Mixture of vendor types results in break‐down
issues (some stay, some go)– Adjacent to surface parking lot and parking
garage
• Desired Conditions– Maintain close proximity to Downtown Mall,
parking, and connect to adjacent neighborhoods
– Flat space that permits 10’x10’ and 10’x20’ tents and farmers’ trucks
– Room for 130‐140 vendors (40 vendors call weekly looking for space)
– Provide site amenities: electricity, water, bathrooms
– Provide shaded seated areas and special event/education space
– Create clustered eating area where vendors can stay longer
UVa temperature study 2011
Existing businesses around City Market site
• Restaurants– South Street Brewery– Bang!– Mono Loco– Flat (creperie)– Miyako
• Retail– Roxie Daisy (home wares, jewelry)– Sun Bow Trading Company (textiles)– Second Street Gallery
• Arts – Bon (performance venue)– Live Arts (volunteer theater)– Light House Studio (filmmaking studio)
• Services – Oasis Day Spa and Body Shop– 200 South Street Inn– Pro Tax– Rifkin Associates– Wells Fargo– Gibson Design Group

Charlottesville City Market District Study 3/12/2013
(c) Market Ventures, Inc. 20
Site Analysis: Connections to Downtown Mall
Site Analysis: Primary Undeveloped Areas

Charlottesville City Market District Study 3/12/2013
(c) Market Ventures, Inc. 21
Site Analysis: Undeveloped Areas‐ City Controlled
Design Competition
Groundworks Collaborative LLC
• Winning design entry creatively addressed maximizing development potential on both parking lots
• Unlikely to be constructed because underground parking too expensive and inadequate demand for that much square footage (needs to be phased)
• City Market too small and spread out

Charlottesville City Market District Study 3/12/2013
(c) Market Ventures, Inc. 22
Research Conclusions• Small but growing population
• High and increasing household income
• Very high educational attainment
• Very strong and growing competition from supermarkets
• Small number of specialty food stores
• Existing indoor market already (Main Street Market)
• Expanding number of restaurants
• Increasing farmer interest in direct marketing
• Proximity of proposed market district to downtown mall district would result in competing and confusing district themes
• Potential to expand and improve outdoor farmers’ market, add another outdoor farmers’ market day, and add indoor winter market but insufficient demand or supply for daily market activity
Development Principles1. Keep City Market in downtown Charlottesville
2. Build on the success of current weekly outdoor producer‐only market
3. Maintain an open‐air, distinctly different shopping experience from supermarkets
4. Accommodate phased growth of City Market
5. Create a dynamic downtown place that attracts the region’s residents and visitors
6. Promote healthy lifestyles and a sustainable community
7. Add site amenities: bathrooms, electricity, water, places to sit, shade
8. Maximize development potential of the city’s parking lot with a realistic development scenario that can move forward in the near term

Charlottesville City Market District Study 3/12/2013
(c) Market Ventures, Inc. 23
Site Options
0.48 acre lot, 1.3 acre project area
0.81 acre, 1.3 acre project area
Concept Scenario 1: Maintain City Market at current site and make improvements
• Concept– Remove city‐owned building that
houses the Market office and Parks’ materials
– Create a grassy plaza at the sloped corner of Water and 1st Streets to provide customer seating, public bathrooms, ADA accessibility, and performance space
– Grade, repave, and add trees to the parking lot while widening parking spaces to fit 10’ wide vendor tents
– Add electricity and water
– Potentially add shed structures
• Benefits– Consistency of operation
– Know this has been a successful location
– Maintains open‐air atmosphere
– Near parking garage and Downtown Mall
– Address site shortcomings: stall size, seating areas, electricity, water, bathrooms, ADA accessibility
• Challenges– No opportunity for development
– Minimal opportunity for expansion
– No new revenue source to pay for site improvements
– Topography – large grade changes
– Too close to Mall to make separate lybranded district

Charlottesville City Market District Study 3/12/2013
(c) Market Ventures, Inc. 24
Concept Scenario 1: Improve City Market at current site
Concept Scenario 1: Improve City Market at current site

Charlottesville City Market District Study 3/12/2013
(c) Market Ventures, Inc. 25
Concept Scenario 1: Improve City Market at current site
Concept Scenario 1: Improve City Market at current site

Charlottesville City Market District Study 3/12/2013
(c) Market Ventures, Inc. 26
Concept Scenario 1: Improve City Market at current site
Concept Scenario 1: Improve City Market at current site

Charlottesville City Market District Study 3/12/2013
(c) Market Ventures, Inc. 27
Concept Scenario 1: Improve City Market at current site
Concept Scenario 1: Improve City Market at current site

Charlottesville City Market District Study 3/12/2013
(c) Market Ventures, Inc. 28
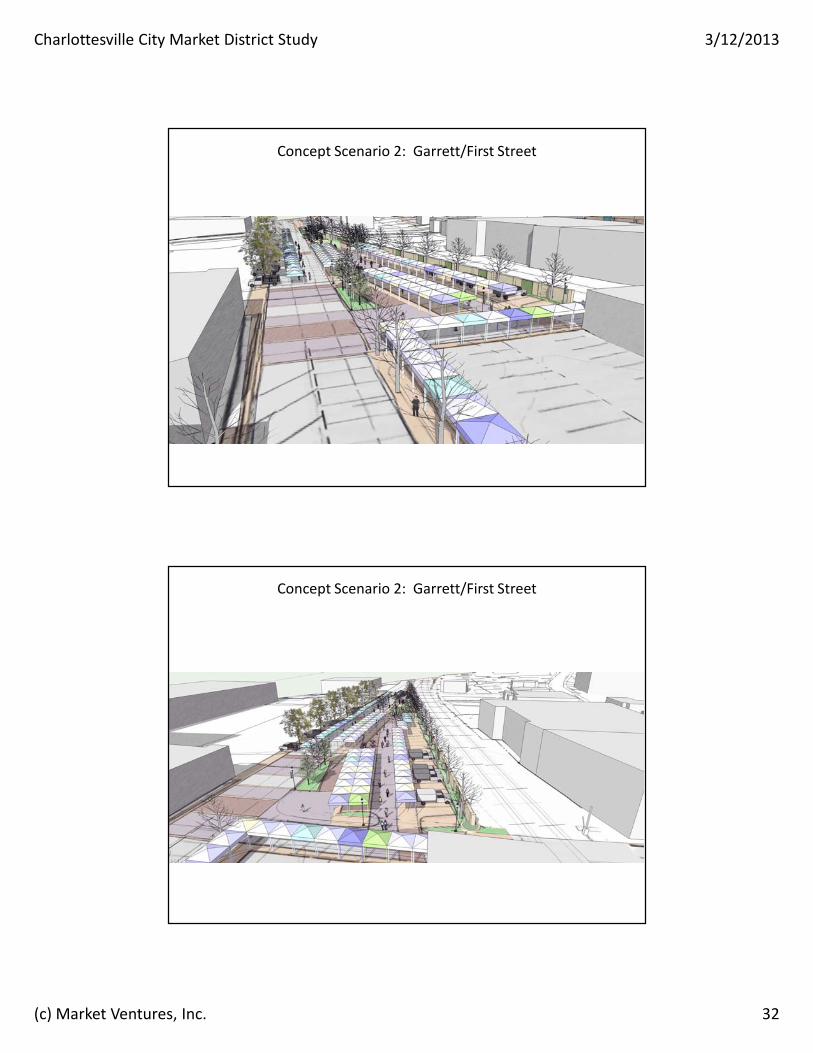
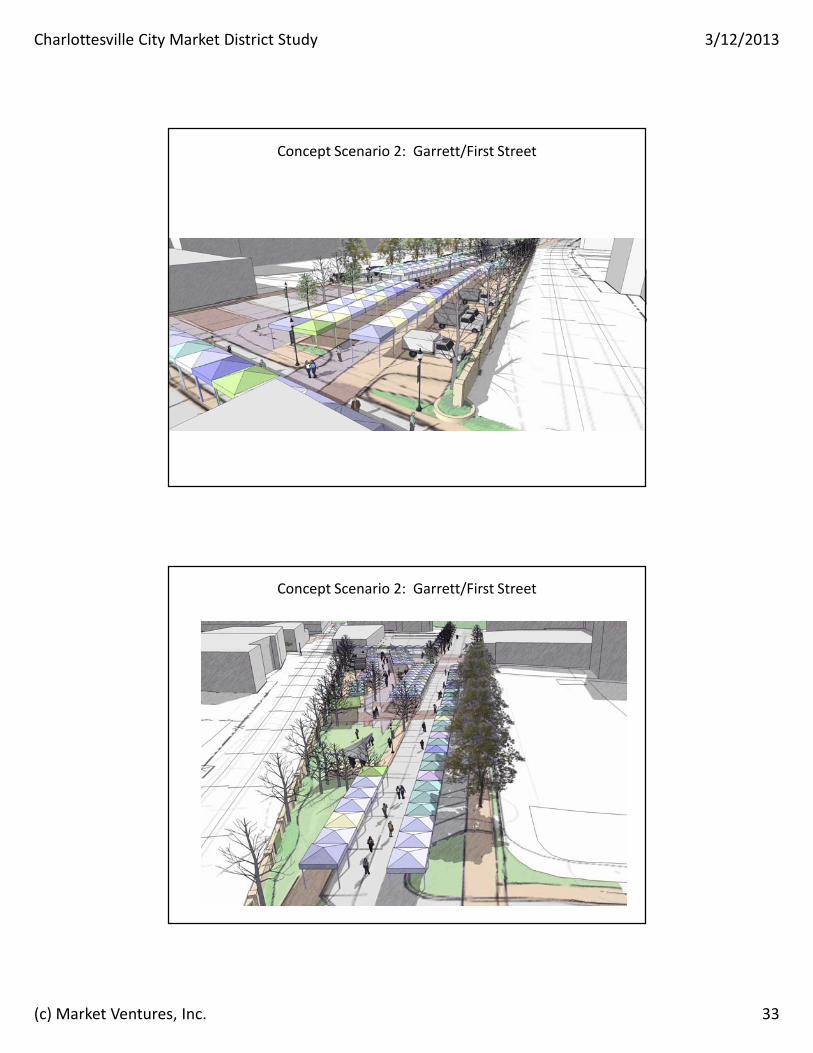
• Concept– Lease triangular lot at Garrett and First
(C. Lewis property) and create flat selling area and grassy seating area
– Utilize Garrett Street (between 2nd St and dead end) and 1st St. (between Garrett and RR tracks) for outdoor market on Saturday mornings
– Potentially lease edge of parking lot on Garrett between 1st and 2nd Streets
– Add electricity and water to streetscape
– Product pick‐up in 3 locations
– Parking at Water Street Garage, Monticello Avenue
– Could expand up 1st Street to Water
• Benefits– Allows development of City lot and
increased property tax; portion of sale proceeds could pay for City Market site lease and improvements
– Room for City Market to grow
– Flat
– Existing food businesses along Garrett Street creates market district opportunity,
Challenges– Requires market to move (although
minimal distance)
– Street closing (although one way, limited use)
– Cost of site improvements and leases
Concept Scenario 2: Shift City Market to Garrett Street, 1st Street, and adjacent property
Triangular Lot on Garrett Street (C. Lewis property)

Charlottesville City Market District Study 3/12/2013
(c) Market Ventures, Inc. 29
Garrett Street looking west from 1st Street
ACAC lot on Garrett Street
Standard Produce on Garrett St.
North side of Garrett Street between 1st and 2nd

Charlottesville City Market District Study 3/12/2013
(c) Market Ventures, Inc. 30
South side of Garrett Street (Gleason Building)
Glass Building on 2nd Street
Concept Scenario 2: Garrett/First Street (Option 1)

Charlottesville City Market District Study 3/12/2013
(c) Market Ventures, Inc. 31
Concept Scenario 2: Garrett/First Street (Option 2)
Concept Scenario 2: Garrett/First Street
Charlottesville City Market District Study 3/12/2013
(c) Market Ventures, Inc. 32
Concept Scenario 2: Garrett/First Street
Concept Scenario 2: Garrett/First Street
Charlottesville City Market District Study 3/12/2013
(c) Market Ventures, Inc. 33
Concept Scenario 2: Garrett/First Street
Concept Scenario 2: Garrett/First Street

Charlottesville City Market District Study 3/12/2013
(c) Market Ventures, Inc. 34
Concept Scenario 2: Garrett/First Street
Next Steps• Review of public input into draft concepts
• Vendor survey
• Cost estimating of site improvements
• Realistic scenario for private development on city‐owned lot (square feet, uses, parking requirements, property value, and real estate taxes)
• Public space standards
• Operations pro forma

Charlottesville City Market District Study 3/12/2013
(c) Market Ventures, Inc. 35
Charlottesville City Market DistrictEconomic Feasibility Study
Public MeetingMarch 11, 2013
118 William StreetPortland, ME 04103
(207) 321-2016www.marketventuresinc.com