characterizing the heavy metal chelator, tpen, as a ca2+ tool in
TRANSCRIPT

University of Massachusetts AmherstScholarWorks@UMass Amherst
Masters Theses 1911 - February 2014
2013
Characterizing the Heavy Metal Chelator, Tpen, asa Ca2+ Tool in the Mammalian OocyteRobert A. Agreda MccaughinUniversity of Massachusetts Amherst
Follow this and additional works at: https://scholarworks.umass.edu/theses
Part of the Cell Biology Commons, and the Developmental Biology Commons
This thesis is brought to you for free and open access by ScholarWorks@UMass Amherst. It has been accepted for inclusion in Masters Theses 1911 -February 2014 by an authorized administrator of ScholarWorks@UMass Amherst. For more information, please [email protected].
Agreda Mccaughin, Robert A., "Characterizing the Heavy Metal Chelator, Tpen, as a Ca2+ Tool in the Mammalian Oocyte" (2013).Masters Theses 1911 - February 2014. 1009.Retrieved from https://scholarworks.umass.edu/theses/1009

CHARACTERIZING THE HEAVY METAL CHELATOR, TPEN, AS A CA2+
TOOL
IN THE MAMMALIAN OOCYTE
A Thesis Presented
By
ROBERT A. AGREDA MCCAUGHIN
Submitted to the Graduate School of the
University of Massachusetts Amherst in partial fulfillment
Of the requirements for the degree of
MASTER OF SCIENCE
February 2013
Molecular and Cellular Biology

CHARACTERIZING THE HEAVY METAL CHELATOR, TPEN, AS A CA2+
TOOL
IN THE MAMMALIAN OOCYTE
A Thesis Presented
By
ROBERT A. AGREDA MCCAUGHIN
Approved as to style and content by:
___________________________________________
Rafael A. Fissore, Chair
___________________________________________
Dominique R. Alfandari, Member
___________________________________________
David J. Gross, Member
___________________________________________
Pablo E. Visconti, Member
___________________________________________
Barbara A. Osborne, Department Head
Molecular and Cellular Biology
DEDICATION
To my family and Caitlin Cotter for their never ending support

iv
ACKNOWLEDGMENTS
First and foremost I would like to thank Dr. Rafael Fissore for granting me the
opportunity to join his research lab and allow me to pursue my own research project.
Throughout the later years of my time at the University of Massachusetts Amherst he has
been an invaluable resource and mentor who helped me get to where I am today.
I would like to thank the “Fissore Lab” for the training they have bestowed upon
me as well as assisting me in my labratory projects: Banyoon Cheon, Hoi Chang Lee,
Changli, Nan Zhang, Changli He, Eufrocina Atabay and Takuya Wakai.
And to the faculty and staff of the Molecular and Cellular Biology Program who
have made my time at the University of Massachusetts Amherst a truly enlightening and
valuable experience

v
ABSTRACT
CHARACTERIZING THE HEAVY METAL CHELATOR, TPEN, AS A CA2+ TOOL
IN THE MAMMALIAN OOCYTE
February 2013
ROBERT A. AGREDA MCCAUGHIN
B.S. UNIVERSITY OF MASSACHUSETTS AMHERST
M.S. UNIVERSITY OF MASSACHUSETTS AMHERST
Directed by: Professor Rafael A. Fissore
N,N,N’,N’-tetrakis-(2-Pyridylmethyl) ethylenediamine (TPEN) is a heavy metal
chelator with high affinity for zinc. TPEN causes important responses in mammalian
eggs. For example, these eggs are arrested at the MII stage by the Endogenous Mitotic
Inhibitor 2 (Emi2), which prevents activation of the Anaphase Promoting Complex
(APC) and degradation of Cyclin B, a component of MPF, whose degradation is required
to exit meiosis and mitosis. By chelating zinc, TPEN inactivates Emi2 and eggs undergo
spontaneous exit of meiosis and egg activation. TPEN chelates Ca2+
with lower affinity,
although in the Endoplasmic Reticulum (ER), where Ca2+
concentrations are high, TPEN
may sequester Ca2+
preventing release into the cytoplasm. Upon dose titration studies,
we confirmed that TPEN does indeed cause activation of MII eggs. In addition, initial
exposure of TPEN to MII eggs failed to cause spontaneous intracellular Ca2+
release from
the ER. Interestingly, in the case of GV oocytes, addition of TPEN caused Ca2+
influx.
This influx could be blocked via the addition of 2-APB, a plasma membrane Ca2+
channel blocker. To determine the possible role of TPEN on chelation of ER Ca2+
, MII
and GV cells were incubated in TPEN and ER Ca2+
released was by exposure to
vi
Cyclopiazonic Acid (CPA), a sarco/endoplasmic reticulum (SERCA) pump inhibitor, or
Ionomycin (IO), a Ca2+
ionophore. In MII oocytes, the amplitude of the rises caused by
CPA and IO, in TPEN-treated oocytes, was smaller than controls and experienced a delay
in return to baseline. In GV oocytes, the responses were highly variable. TPEN
enhanced rather than reduced Ca2+
responses to CPA and IO. In all cases, TPEN reduced
the speed of Ca2+
release, time to peak. The presence of TPEN did not significantly
increase Ca2+ influx at either stage. Curiously, in the presence of TPEN, SrCl2 failed to
initiate oscillations in both GV and MII oocytes. Thus our results show that TPEN can
reduce available Ca2+
from internal stores, especially in MII eggs. However, given the
highly variable effects and its inability to fully chelate ER Ca2+
, the use of TPEN as a tool
to study Ca2+
homeostasis in mouse oocytes needs additional investigation.

vii
TABLE OF CONTENTS
Page
ACKNOWLEDGMENTS ………………………………………………………………. iv
ABSTRACT ………………………………………………………………………………v
LIST OF TABLES …………………………………………………………………..….viii
LIST OF FIGURES …………………………………………………………………….. .ix
CHAPTER
1. INTRODUCTION …………………………………………………………………… 1
2. MATERIALS AND METHODS ………………………………………….…………. 4
2.1. Egg Recovery and Culture …………………………………………….………… 4
2.2. TPEN Preparation ……………………………………………………….………. 5
2.3. Oocyte Activation …………………………………………………….…………. 5
2.4. Ca2+
Monitoring ………………………………………………………………..... 5
2.5. TPEN Exposure and effects of Ca2+
homeostasis ……………………………..… 7
2.6. Statistical Analysis ………………………………………………….……….…... 8
3. RESULTS ……………………………………………………………………………. 9
3.1. Parthenogenetic Activation by TPEN …………………………………….…....... 9
3.2. TPEN does not induce Ca2+
release …………………………………………….. 9
3.3. TPEN affects Ca2+
ER content ………………………………………..…..….…11
3.4. TPEN affects cell Ca2+
content in oocytes and eggs ……………………….…...12
3.5. TPEN and Ca2+
influx ……………………………….…………………….…… 12
3.6. SrCl2 induced oscillations are inhibited by incubation in TPEN ………………. 13
4. DISCUSSION ………………………………………………………………………. 14
5. FIGURE LEGENDS ………………………………………………………………... 19
6. TABLES & FIGURES …………………………………………………….………... 22
REFERENCES ……………………………………………………………...……… 29

viii
LIST OF TABLES
Table Page
1. TPEN induces activation of MII oocytes …………………………………………….. 22

ix
LIST OF FIGURES
Figure Page
1. TPEN induces activation of MII oocytes …………………………………………...... 23
2. Addition of TPEN to oocytes effects Ca2+
homeostasis ……………………………... 24
3. Effects of CPA-induced Ca2+
release in MII and GV oocytes ……………………….. 25
4. Effects of TPEN on IO-induced Ca2+
influx …………………………………………. 26
5. TPEN exposure does not induce Ca2+
influx …………………………………….…... 27
6. SrCl2-induced oscillations are blocked by incubation in TPEN …………………...… 28

1
CHAPTER 1
INTRODUCTION
Mammalian oocyte maturation consists of two primary checkpoints. The first is
at Prophase I, or more commonly known as germinal vesicle (GV) stage. This stage will
persist in the ovarian follicle until a surge of luteinizing hormone (LH) occurs, which
causes ovulation (Hartshorne et al., 1994; Fissore et al., 2002). At the conclusion of
maturation, the oocyte is arrested at the metaphase II (MII) stage of meiosis. The MII
arrest will persist until fertilization occurs (Ducibella and Fissore, 2008). The oocyte
maintains this physiological state due to the presence of a cytostatic factor (CSF)
(Madgwick and Jones, 2007). Recent publications have stated that one of the
components of this elusive factor is known as Early Mitotic Inhibitor 2 (Emi2). This
molecule inhibits the Anaphase Promoting Complex (APC; Thornton and Toczyski,
2006; Pesin and Orr-Weaver, 2008). The APC’s purpose is to make possible the
transition from the MII stage to the anaphase stage by regulating the stability of
Maturation Promoting Factor (MPF) components. The function of MPF is to drive fully
grown GV oocytes arrested at the first checkpoint of the first meiosis to the MII stage
(Taylor et al., 2004). This complex is made up of the CDK1 and cyclin B (Masui, 2001;
Dorée and Hunt, 2002; Jones, 2004). The activity of MPF fluctuates throughout the
various stages of meiosis and is at its highest point during MII arrest due to inhibition of
cyclin degradation by the CSF as well as new synthesis of this molecule. The release
from MII arrest is initiated either by fertilization or induction of artificial calcium (Ca2+
)
oscillations. Either instance makes possible the degradation of Emi2 molecules, thereby
lifting inhibition of the APC and permitting cyclin B degradation. The release of the MII
2
arrest allows the oocyte to complete meiosis and initiate embryo development if
fertilized. Further information can be found in the reviews of (Berridge et al., 2003;
Brunet and Maro, 2005).
Ca2+
oscillations are initiated by the sperm during fertilization. Upon interaction
and fusion of the sperm with the oocyte, a signaling cascade is initiated that leads to the
production of 1,4,5-Inositol Trisphosphate, also known as IP3. IP3 then binds its cognate
receptor in oocytes, mostly the IP3 receptor type 1 (IP3R1), which is predominantly
located on the surface of the endoplasmic reticulum (ER), the Ca2+
store of the cell. IP3
induces a conformational change in IP3R that causes the channel to open and release Ca2+
into the ooplasm. In the presence of IP3, low concentrations of Ca2+
activate the receptor,
while high concentrations of Ca2+
inhibit the conductivity of the receptor. In mammals,
the Ca2+
responses occur as repetitive oscillations (Kline et al., 1999), which are initiated
by the release into the ooplasm of the so called “Sperm Factor,” that is now known to be
a sperm-specific phospholipase C zeta (Saunders et al., 2002).
Ca2+
homeostasis is crucial for oocyte survival. Ca2+
enters the ER via the
Sarco/endoplasmic reticulum Ca2+
ATPase (SERCA) pump. Using ATP hydrolysis, Ca2+
ions are translocated from the cytosol, against the concentration gradient, into the ER.
How Ca2+
enters the cells to fill the ER has been a matter of speculation. A recently
discovered ER Ca2+
sensor is the stromal interaction molecule 1 (STIM1; Jonathan S.,
2005; Gill et al., 2006; Hogan et al., 2010), which may play a critical role in mediating
Ca2+
influx. It contains an EF hand domain on the interior of the ER that “senses” the
Ca2+
concentration. When the ER Ca2+
store is emptied, for instance due to IP3-mediated
Ca2+ release, STIM1 forms puncta with other STIM1 molecules near the plasma

3
membrane. This puncta formation interacts with the Ca2+
release activated channel
(CRAC) ORAI1, resulting in Ca2+
uptake into the cytosol from the extracellular space.
While progress has been made in the understanding of the molecules that regulate
MII arrest and those that are part of the Ca2+
homeostatic machinery of the mammalian
oocytes, much still remains to be learned. For example, we know little of the molecules
that regulate Ca2+
influx and that control the levels of Ca2+
in the ER. A drug that has
recently been used in oocytes and might be a useful tool to examine Ca2+
homeostasis is
N,N,N’,N’-tetrakis-(2-Pyridylmethyl) ethylenediamine, otherwise known as TPEN.
TPEN is a heavy metal chelator with a very strong affinity for zinc. When oocytes are
incubated in a solution containing TPEN, the MII arrest is relieved and oocytes initiate
parthenogenetic development (Kim et al., 2010). Subsequent research has shown that
TPEN inhibits Emi2 due to its Zn2+
chelating properties (Suzuki et al., 2010), which
makes possible cyclin B degradation and initiation of embryo development.
Interestingly, besides causing activation without inducing Ca2+
oscillations, TPEN,
reportedly affects ER Ca2+
levels in somatic cells, as it is able to chelate Ca2+
in the ER
lumen (Arnaudeau et al., 2002). Thus, given the absence of tools to evaluate the
regulation of ER Ca2+
levels, this study will focus on understanding whether TPEN
affects Ca2+
homeostasis in mouse oocytes
4
CHAPTER 2
MATERIALS AND METHODS
2.1 Egg Recovery and Culture
Both GV and MII oocytes were collected from female CD-1 mice ranging in age
from 5-8 weeks as described in prior publications from our laboratory (Wu et al., 1998).
For GV oocyte collection, mice were injected with 5 IU of pregnant mare serum
gonadotropin (PMSG; Sigma) 44-48 hours prior to collection. In the case of MII oocyte
collection, females were injected with 5 IU of PMSG 60 hours prior to collection
followed by 5 IU of human chorionic gonadotropin (HcG; Sigma, St Louis, MO; all
chemicals were purchased from Sigma unless otherwise specified) 48 hours later to
promote ovulation. Following the Institution of Animal Care and Use Committee
(IACUC) guidelines, female mice were euthanized via pressurized CO2 treatment.
Cervical dislocation was then performed to ensure euthanasia. Ovaries were harvested
into HEPES-buffered Tyrode-Lactate solution (TL-HEPES) supplemented with 5% heat
treated fetal calf serum (FCS). Cumulus enclosed GV oocytes were recovered directly
from the ovaries and denuded via repeated mechanical aspiration with a micro pipette
followed by culture in CZB media (Chatot et al., 1990). MII oocytes were collected from
the oviducts and exposed to 0.1% bovine testes hyaluronidase to remove cumulus cells
prior to culture in CZB media. In all cases, the CZB media had been pre-incubated under
paraffin oil at 37°C in an atmosphere of 5% CO2 for a minimum of 2 hours. The media
used to handle and culture GV oocytes was also supplemented with 100µM isobutyl-1-
methylxanthine (IBMX), a phosphodiesterase inhibitor (Essayan, 2001), unless stated
otherwise, so that the GV stage could be maintained.

5
2.2 TPEN preparation
N,N,N′,N′-Tetrakis(2-pyridylmethyl)-ethylenediamine (TPEN; Calbiochem,
Billerica, MA) was dissolved using dimethyl sulfoxide (DMSO) and aliquots were
diluted into Ca2+
containing CZB supplemented with 0.1% polyvinyl alcohol (PVA)
unless stated otherwise. The concentrations of TPEN and time of treatment were dictated
by the nature of the experimental conditions.
2.3 Oocyte Activation
Oocyte activation studies were performed using the following TPEN
concentrations (µM): 20, 50, 100, 200, and 500. All of the incubations were 60 minutes
long. Due to TPEN’s nature of being soluble in oil, exposure was carried out in ~1mL
wells (Nunc International, Rochester, NY). Prior to and after exposure, all MII oocytes
were incubated at 37°C supplemented with 5% CO2 in Ca2+
containing CZB. Oocytes
activated with 10mM strontium chloride (SrCl2) in Ca2+
free CZB media supplemented
with 0.1% PVA were utilized as positive controls. Treatment with DMSO was used as a
negative control. Activation success rates were scored based on the appearance of the
following activation events and embryo development: 2nd
polar body extrusion,
pronuclear (PN) formation, 2-Cell, Morula, and Blastocyst. Oocytes and zygotes were
observed under a Nikon Diaphot scope. Statistical comparisons were performed using
Chi-square analysis.
2.4 Ca2+
Monitoring

6
For Ca2+
visualization during monitoring, the Ca2+
sensitive Fura-2-
acetyoxymethyl (Fura 2AM) ester was utilized (Grynkiewicz et al., 1985). The dye was
loaded into oocytes by incubation with a mixture of 1.25µM Fura-2AM + 0.02% pluronic
acid (Molecular Probes, Eugene, OR) for 20 minutes at room temperature in a dark room
due to the photosensitivity of the dye. Recording of Ca2+
responses was performed as
previously described (Wu et al., 1998; Gordo et al., 2002). Oocytes were placed in drops
of TL-HEPES without fetal calf serum (FCS) to allow oocytes to adhere to the glass-
bottomed dish (MatTek Corp, Ashland, MA). Fluorescence ratios of 340/380nm were
obtained every 20 seconds. UV light was provided via a 75W Xenon arc lamp and
modulated by neutral density filters. The emitted light above 510nm was collected by a
cooled Photometrics SenSys CCD camera (Roper Scientific, Tucson, AZ). [Ca2+
]
changes and filter wheel changes were captured and controlled using NIS-Elements
software (Nikon Instruments Inc., Melville, NY) unless stated otherwise. The collected
wavelengths were compiled in a 340/380nm ratio sequence and plotted on a line graph
for further analysis.
[Ca2+
]ER content was estimated after addition of the sarco/endoplasmic reticulum
(SERCA) pump inhibitor, Cyclopiazonic Acid (CPA, Sigma; Lawrence and Cuthbertson,
1995). 20µM CPA was added to a 200µL dish of media containing the oocytes. The
oocytes rested on a glass-bottomed monitoring dish and CPA was added five minutes
after the initiation of monitoring. The monitoring media consisted of nominal Ca2+
free
TL-HEPES with 100µM IBMX and no FCS. Ca2+
responses were scored by comparing
the amplitude for each test group. Ca2+
influx after use of CPA was induced via the
addition of 5mM CaCl2 and after basal Ca2+
values had returned to normal after addition

7
of CPA. The monitoring media used was FCS free TL-HEPES supplemented with 1mM
EGTA and 100µM IBMX. The CaCl2 was added five minutes after the start of
monitoring. Ca2+
responses were tabulated via the quantity of oocytes responding to the
treatment as well as the magnitude of the response.
Total oocyte [Ca2+
] was visualized by the addition of Ionomycin, a Ca2+
ionophore. 2.5µM Ionomycin was added to oocytes five minutes after the start of
monitoring. The monitoring media consisted of FCS free TL-HEPES supplemented with
1mM EGTA and 100µM IBMX. Ca2+
responses were scored by comparing the
amplitude for each TPEN concentration group.
Ca2+
oscillations were induced via the addition SrCl2. The monitoring media,
containing nominal Ca2+
free TL-HEPES with IBMX and no FCS, was supplemented
with 10mM SrCl2 from the start. Ca2+
responses were tabulated via the quantity of
oocytes responding to the treatment as well as the magnitude of the responses.
2.5 TPEN Exposure and effects of Ca2+
homeostasis
GV and MII oocytes were exposed to either 100 or 500µM TPEN, depending on
experimental conditions. Oocytes were incubated in 1mL CZB containing 0.1% PVA,
1mM CaCl2, and then with the indicated TPEN concentration. The media was not
covered in oil due to TPEN’s ability to dissolve into the oil. Thus, a four well dish was
used to house the media and oocytes. The incubation lasted for a total of thirty minutes.
Ten minutes of the total time took place at 37°C with an environment of 5% CO2. The
remaining twenty minutes occurred while oocytes were being loaded with Fura 2AM in
Ca2+
containing TL-HEPES w/ 5% FCS at room temperature as mentioned above.

8
2.6 Statistical Analysis
Data were collected from two or more experiments performed on different days to
determine statistical significance. At least 20 eggs per treatment were used to perform
statistical analysis. The data were graphed and analyzed using Graphpad’s Prism
software (GraphPad Software, Inc. LA Jolla, CA). Depending on the experiment, either
the Student t-test or chi-square analysis was performed and values are shown as mean ±
SEM. Statistical significance was considered at P values <0.05.
9
CHAPTER 3
RESULTS
3.1 Parthenogenetic Activation by TPEN
The first step of this study was to determine the suitable concentrations of TPEN
that oocytes could tolerate. This allowed for maximum potential Ca2+
chelation via
TPEN, which was the original goal of this study, with as little side effects as possible.
Because TPEN exposure can activate eggs, something that is easily observable, we chose
to use this method to ascertain whether the concentrations that we used did not harm the
eggs. As it can be seen in Table 1, exposure to 100µM TPEN produced the highest
activation rates in regards to 2nd
Polar Body (93.5 ± 3.3) and PN (88.9 ± 5.6) formations.
The highest concentration tested was 500 µM, which while still caused egg activation, it
did so at lower rates. However, the morphology of the TPEN treated eggs at any of the
concentrations tested was similar to those treated with SrCl2 (Fig. 1), suggesting that they
could all be used to test the chelating capacity of TPEN on ER Ca2+
. The generated
zygotes cleaved to the 2-cell stage, although we did not evaluate for pre-implantation
development.
3.2 TPEN does not induce Ca2+
release
If TPEN were to be a suitable ER-Ca2+
chelating tool, it would be desirable that it
would not cause Ca2+
release upon exposure. As can be seen in Fig. 2A, addition of
TPEN (n=12) or DMSO (n=11) in Ca2+
containing media not only failed to increase Ca2+
baseline levels in MII eggs, but may even have caused a slight reduction in basal Ca2+
levels. Importantly, when the same procedure was performed in nominal Ca2+
free

10
conditions (Fig. 2B), the addition of TPEN (n=12) caused a marked decrease in basal
Ca2+
levels, which did not recover over time, while the control group (n=7) did not show
any changes in Ca2+
baseline levels upon addition of DMSO. Thus, the fall in baseline
levels when TPEN was added may indicate that TPEN is sequestering intracellular Ca2+
and that in the absence of Ca2+
influx, this causes a sustained drop in basal Ca2+
.
Following up the MII data above, the role of TPEN stimulation on Ca2+
changes
in GV oocytes was examined. In Ca2+
containing media (Fig. 2C), the addition of TPEN
(n=36) resulted in a brief Ca2+
spike of varying amplitude lasting only a couple of
minutes before returning to baseline levels for the remainder of the monitoring period,
while the addition of DMSO alone (n=16) failed to produce any changes in Ca2+
levels.
In nominal Ca2+
free media (Fig. 2D), as shown in MII eggs, the addition of TPEN
(n=13) caused a drop in basal Ca2+
, although DMSO (n=21) did not cause any changes in
basal Ca2+
levels.
To ascertain if the increase in basal Ca2+
caused in GV oocytes by addition of
TPEN in Ca2+
containing media was due to Ca2+
influx, the experimental conditions were
repeated but the media was supplemented with 100µM 2-APB. 2-APB is a plasma
membrane Ca2+
channel blocker (Bootman et al., 2002) and the expectation was that if
the Ca2+
rise is due to influx, the presence of the inhibitor will prevent the rise. In the
presence of 2-APB (Fig. 2E), addition of TPEN (n= 36) did not cause a Ca2+
spike and
further, following its addition, an immediate drop in baseline was observed, which was
similar to the effect caused by addition of TPEN to GV oocytes in nominal Ca2+
free
media (Fig. 2D). Together, these results show that TPEN has an effect on Ca2+
homeostasis and that the effects are very different between GV and MII oocytes.

11
3.3 TPEN affects Ca2+
ER content
The previous results suggested that TPEN had an effect on some aspect of Ca2+
homeostasis. To test whether TPEN was able to affect the Ca2+
content of the ER in both
MII (Fig. 3A,B) and GV (Fig. 3C,D) oocytes, oocytes at these stages were incubated in
TPEN for 30 minutes prior to being monitored for Ca2+
responses induced by 20µM
CPA, a SERCA inhibitor. Monitoring was performed in nominal Ca2+
free media to
prevent Ca2+
influx. TPEN treated MII oocytes (Fig. 3E) displayed lower Ca2+
amplitudes (p < 0.05) and longer Ca2+
release durations (p < 0.05) compared to controls.
Interestingly, the time from the baseline to the peak of the Ca2+
response was
significantly longer when the eggs were treated with TPEN. From these data it can be
concluded that while TPEN may not be chelating the ER Ca2+
, it does have an effect on
the speed at which the Ca2+
is released. This could occur from a possible interaction of
TPEN with the SERCA pump.
GV oocytes, on the other hand, show surprising results (Fig. 3F). The amplitude
of release was significantly higher in the 100µM TPEN group than in the control group
while the reverse was true for the 500µM TPEN group. Similarly to their MII
counterparts, TPEN caused significantly longer Ca2+
release events than DMSO. Unlike
its MII counterpart, 100µM TPEN treated GV oocytes yielded a slight increase in Ca2+
store content. This can further be explained via the direct result of a longer duration and
larger amplitude of Ca2+
response. Strangely, this trend was not seen in the 500µM
TPEN treated group as no significant distinction between TPEN and control was
observed. As seen in the MII group above, TPEN treatment appeared to result in a longer

12
time from baseline to peak of the Ca2+
response. This affect was not absolute as it was
significant for the 100µM TPEN group but not the 500µM TPEN group.
3.4 TPEN affects cell Ca2+
content in oocytes and eggs
As CPA induces release of Ca2+
from the ER, it was our interest to estimate the
impact on the whole Ca2+
content in the cell. To do this, we used Ionomycin (IO), a Ca2+
ionophore that in the absence of external Ca2+
causes a Ca2+
release from all internal
stores. Oocytes were incubated in TPEN as indicated before, and then exposed to 2.5µM
IO. The effects were most discernible in MII oocytes (Fig. 4A,C) where it caused a
release of smaller amplitude, shorter duration, and shorter time from baseline to peak
than DMSO groups. Together these data indicated that TPEN does in fact soak up Ca2+
from some location within the MII oocyte.
In GV oocytes (Fig. 4D), on the other hand, pre-treatment with TPEN seemed to
increase the response to IO, at least in amplitude.
3.5 TPEN and Ca2+
influx
We next examined whether incubation in the presence of TPEN promoted Ca2+
influx both in MII or GV oocytes following addition of CaCl2. The addition of CaCl2 to
DMSO (n = 13) treated MII oocytes did not promote Ca2+
influx, although a minor
increase was observed in TPEN-treated oocytes (n = 10) (Fig. 5A). In GV oocytes
however, the effect where not as clear, as in either group a few oocytes showed Ca2+
influx following addition of 5mM CaCl2 (Fig. 5B). Nevertheless, the proportion of

13
oocytes showing influx was similar and it is known that GV oocytes influx Ca2+
at higher
rates than in MII oocytes.
3.6 SrCl2 induced oscillations are inhibited by incubation in TPEN
GV and MII oocytes are known to display oscillations, stemming from the ER,
when exposed to SrCl2-containing media (Kline and Kline, 1992; Bos-Mikich et al.,
1995). SrCl2 induced oscillations also have the ability of inducing activation in MII
oocytes, thus lifting the meiotic arrest. To further characterize TPEN’s effect on Ca2+
,
the metal chelator was added while in the presence of SrCl2. In both GV (n = 45, Fig.
6A) and MII (n = 40, Fig. 6B) groups exposed to TPEN, oscillations were not observed.
The baseline for each group remained steady and did not deviate for the entirety of the
monitoring process. The DMSO groups on the other hand, displayed characteristic
oscillations, although not all oocytes at either of the stages showed oscillations, which is
expected (Fig. 6A, B). Further, the nature of the Ca2+
oscillations differed between the
two oocyte states, with GV oocytes consistently producing oscillations of smaller
amplitude and rapid start, while MII oocytes displayed delayed oscillations and of higher
amplitudes.

14
CHAPTER 4
DISCUSSION
Past research has identified TPEN as both a zinc chelating agent able to induce
parthenogenetic activation in MII eggs (Suzuki et al., 2010) as well as to chelate Ca2+
in
intracellular organelles in various cell types (Hofer et al., 1998; Arnaudeau et al., 2002).
In this current study, TPEN was assessed as a potential ER Ca2+
chelating candidate in
mouse oocytes. Due to the vast differences in Ca2+
homeostasis between eggs and
oocytes (Jones et al., 1995a; Kline, 2000), both MII and GV oocytes were utilized for this
study. Based on the resulting Ca2+
profiles from TPEN incubations and Ca2+
oscillations,
it appears that TPEN is not effective at completely chelating ER Ca2+
stores in MII and
GV oocytes. Thus, while some of the results from both groups reveal interesting effects
on Ca2+
homeostasis, the lack of consistency challenges the reliability of using TPEN as a
Ca2+
chelating tool.
While studies of Ca2+
homeostasis in mouse oocytes have relied on the use of
SERCA inhibitors such as thapsigargin and CPA to empty the Ca2+
content of the ER
(Jones et al., 1995b; Lawrence and Cuthbertson, 1995), these products in addition to
emptying [Ca2+
]ER also cause a Ca2+
rise. Thus, we became interested in looking for a
product that could chelate Ca2+
without increasing cytosolic Ca2+
. TPEN has been used
in mouse eggs and Xenopus oocytes to study effects on Ca2+
homeostasis (Lawrence et
al., 1998; Yao et al., 1999), altough the effects on [Ca2+
]ER in mouse oocytes were not
carefully examined. Therefore, before proceeding with ER Ca2+
chelation studies, we
performed parthenogenetic activation tests as recently carried out by Perry and colleagues
(Suzuki et al., 2010). In performing this, a wide range of TPEN concentrations were

15
tested for activation rates and developmental competency. While the resulting activation
rates were not as high as those reported by Suzuki et al. (2010), the data show that MII
eggs are both activated by TPEN and able to survive through the PN stage of
development. For the purpose of this study, development rates past the PN stage were
not of interest. From the resulting activation data, it was determined that both 100 and
500µM TPEN concentrations were suitable for use throughout the duration of the study,
as they both induced high activation rates, as measured by 2nd
PB extrusion and PN
formation and did not cause high rates of fragmentation or cell death.
Our TPEN studies reveal a broad spectrum of effects in oocytes and eggs that
complicates its use as a [Ca2+
]ER-chelating agent. Nonetheless, several interesting results
were observed that provide insight into some of the mechanisms involved in Ca2+
homeostasis in oocytes and eggs. The most striking early effect was the finding that
while in MII eggs addition of TPEN into Ca2+
containing media did not cause an obvious
change in baseline values, its addition into GV oocytes caused an immediate Ca2+
rise.
These results were unexpected and have not been reported in the literature thus far.
Further, we show that the increase is due to Ca2+
influx from the extracellular media, as it
was inhibited by addition of 2-APB or did not occur in the absence of external Ca2+
.
While the channels that mediate this influx were not determined here, APB has been
shown to inhibit the conductivity of TRP (Clapham et al., 2001) or ORAI 1 (DeHaven et
al., 2008; Schaff et al., 2010) channels, and it is therefore possible that one or both of
these channels is mediating the influx caused by TPEN. In this regard, it is possible that
the addition of TPEN may disturb, or reduce, intracellular levels of Mg2+
, an effect that
has been shown to activate TRPM7 channels, which can conduct Ca2+
(Nadler et al.,

16
2001; Schmitz et al., 2003). In support of this possibility, our unpublished studies found
that mouse oocytes express transcripts of this channel, although the presence of protein
has not been tested. It is also worth noting that in the absence of extracellular Ca2+
,
addition of TPEN induces a notable decrease in basal Ca2+
levels in both GV oocytes and
MII eggs, suggesting that indeed TPEN does affect Ca2+
homeostasis. Whether this is
due to directly chelating free Ca2+
in the cytosol, which seems unlikely due to the low
affinity of TPEN for Ca2+
, or due to the lowering of Ca2+
in the ER, which then draws
Ca2+
from the cytosol to the ER lowering the cytosolic concentration of Ca2+
is unknown.
Regardless, a very low but persistent Ca2+
influx associated with the addition of TPEN
may be offsetting this chelation, as Ca2+
basal levels are seemingly unaltered in MII eggs
cultured in Ca2+
-containing media and in the presence of TPEN.
The effects of TPEN on [Ca2+
]ER levels and intracellular cell Ca2+
were
unexpected and reflect the uniqueness of the mouse oocyte as a model. Addition of
TPEN either to GV or MII oocytes greatly decreased the amplitude of the Ca2+
rise
induced by addition of CPA, suggesting that TPEN may lower [Ca2+
]ER, which is
consistent with its possible role in chelating Ca2+
in this organelle; this was especially so
in MII eggs. Further, the findings that time to peak from baseline was significantly
longer in TPEN-treated oocytes also seems to support this notion. Nevertheless, these
results were obscured, at least in part, by the observation that the overall duration of the
rise in TPEN treated oocytes was longer. Nevertheless, TPEN has been suggested to
inhibit SERCA in some studies involving somatic cells (Sztretye et al., 2009) and activate
MAPK in others (Bernhardt et al., 2011; Kong et al., 2012), and these changes could alter
Ca2+
homeostasis masking some of the effects on TPEN on [Ca2+
]ER. Remarkably,
17
following the addition of IO, while in GV stage oocytes TPEN seemingly increased
[Ca2+
]ER, it decreased it dramatically in MII eggs. Therefore, these results reflect great
differences in the mechanisms of Ca2+
homeostasis between GV and MII eggs. Further,
the results demonstrate the likelihood of a certain degree of Ca2+
chelation capacity of
TPEN in MII eggs, although given that the chelation is not absolute its use in mouse
oocytes for Ca2+
studies seems limited.
Despite the ability to decrease [Ca2+
]ER in MII eggs, exposure to TPEN only
induced a minor Ca2+
influx following CaCl2 add back. In GV oocytes, while some
oocytes after TPEN exposure displayed a larger influx following CaCl2 add back in GV
oocytes, a similar influx was also observed in DMSO treated oocytes, and this influx is
most likely associated with the more permeable GV stage than due to the treatment.
Overall, these results support our findings that, at the concentrations used, TPEN is not
able to fully deplete [Ca2+
]ER, which might be required to induce substantial influx by
activating SOCE. Despite these mild effects on [Ca2+
]ER , exposure to TPEN both in GV
and MII oocytes consistently inhibited oscillations induced by SrCl2. In both stages,
none of the oocytes exposed to TPEN were able to mount Ca2+
responses. SrCl2 mediates
Ca2+
/SrCl2 elevations from the ER and via IP3R1. However, only optimal conditions
make possible oscillations by SrCl2, as for instance older oocytes fail to oscillate.
Therefore, it is possible that the mild sequestration of Ca2+
/SrCl2 in the ER disturbs IP3R1
sensitivity compromising the ability to mount oscillations. The other possibility is that
TPEN may be chelating SrCl2 as it enters the cell, effectively reducing cytoplasmic levels
of SrCl2, which then fail to notably induce Ca2+
responses. Additional studies are needed
18
to resolve this question. Additional studies should examine whether this effect of TPEN
is reversible and also if it blocks PLCzeta-initiated oscillations.
The goal of this study was to identify the heavy metal chelator, TPEN, as an ER
Ca2+
chelating tool in mouse/mammalian oocytes. Data collected from both GV and MII
oocytes matured in different degrees of TPEN resulted in only minor ER Ca2+
chelation,
as estimated by the Ca2+
release caused by addition of CPA; this effect was more
significant in MII eggs than in GV oocytes. However, at the concentrations required to
cause some of these effects, TPEN may be affecting the concentration of other ions and
different molecules that also impact Ca2+
homeostasis, complicating the interpretations of
its effects. Thus, while TPEN seems a useful tool to induce parthenogenetic development
in mammalian oocytes, it’s possible application as a Ca2+
chelating tool is not promising.

19
CHAPTER 5
FIGURE LEGENDS
Table 1. TPEN induces activation of MII oocytes
MII oocytes were exposed to TPEN for 60 minutes in Ca2+
-containing CZB media
supplemented with 0.1% PVA, after which, they were transferred to CZB media without
TPEN. Of all the TPEN concentrations tested, 100µM TPEN consistently resulted in the
highest development rates.
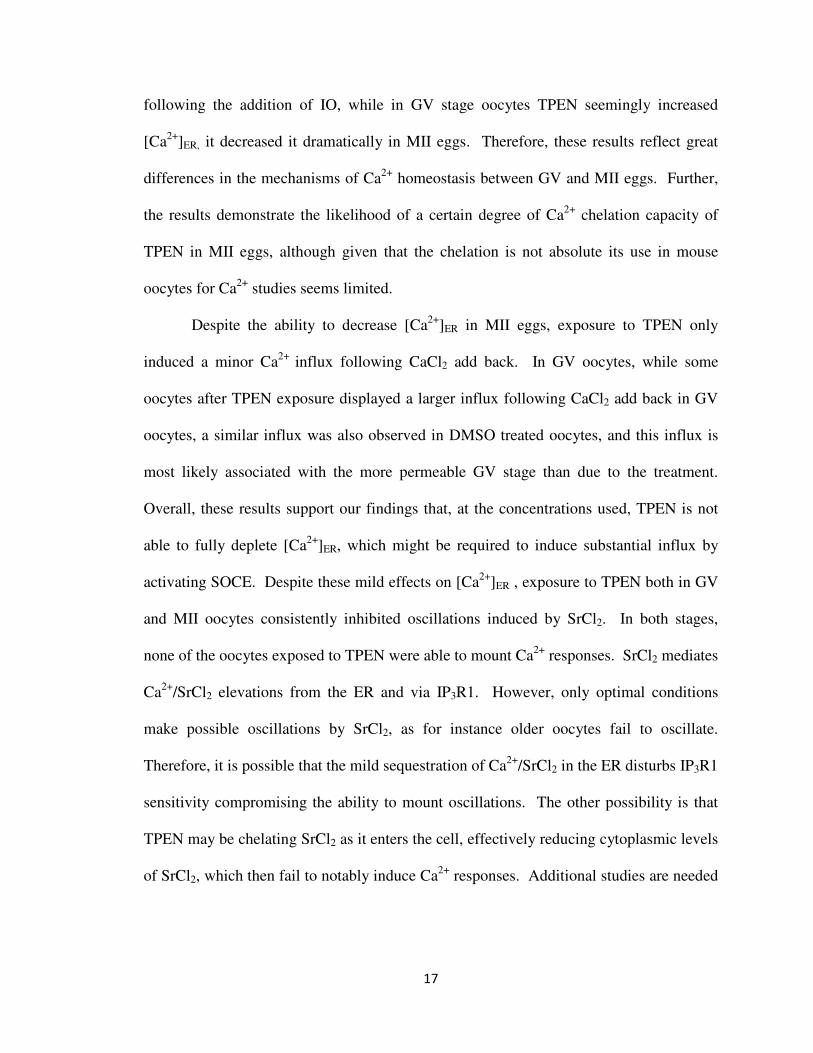
Figure 1. TPEN induces activation of MII oocytes
MII oocytes exposed to TPEN and SrCl2 through the PN stage underwent normal egg
activation events without obvious morphological abnormalities; exposure to DMSO
failed to induce egg activation. Both TPEN and SrCl2 treated oocytes displayed 2nd
Polar Bodies and PN formations clearly.
Figure 2. Addition of TPEN to oocytes effects Ca2+
homeostasis.
The Ca2+
profiles of both GV and MII oocytes were monitored during addition of 100µM
TPEN either in the presence or absence of Ca2+
. The response observed immediately
following the addition of TPEN and DMSO is enlarged in a panel to the right of each
figure for clearer viewing. (A) TPEN added to MII oocytes in Ca2+
-containing CZB
media and (B) to control MII oocytes in nominal Ca2+
free media. (C) TPEN added to
GV oocytes in Ca2+
-containing media and to (D) GV oocytes in nominal Ca2+
free CZB
media. (E) TPEN added to GV oocytes in Ca2+
-containing CZB media supplemented
with 100µM 2-APB to block potential Ca2+
influx. Titles with (*) indicate that the graph

20
was plotted using the software Simple PCI (C-Imaging System, Cranberry Township,
PA).
Figure 3. Effects of CPA-induced Ca2+
release in MII and GV oocytes.
MII and GV oocytes were pre-incubated for 30 minutes in Ca2+
containing CZB w/(0.1%
PVA) supplemented with either 100 or 500µM TPEN followed by Ca2+
monitoring with
the same TPEN concentration in nominal Ca2+
free TL-HEPES. A Ca2+
release was
induced via 20µM CPA. (A) Resulting Ca2+
profiles from MII oocytes incubated in
100µM TPEN. (B) Resulting Ca2+
profiles from MII oocytes incubated in 500µM TPEN.
(C) Graphical representation of the resulting Ca2+
profiles from GV oocytes incubated
and exposed to 100µM TPEN. (D) Graphical representation of the resulting Ca2+
profiles
from GV oocytes incubated and exposed to 5000µM TPEN. From the resulting calcium
profiles, the amplitude of the release, duration of release, and the time from baseline to
peak release were tabulated for both MII (E) and GV (F) oocytes. Bars with ** above
them are statistically significant from those without them.
Figure 4. Effects of TPEN on IO-induced Ca2+
release in MII and GV oocytes.
MII and GV oocytes were pre-incubated in Ca2+
containing CZB w/(0.1% PVA)
supplemented with 500µM TPEN for 30 minutes followed by Ca2+
monitoring with the
same TPEN concentration in nominal Ca2+
free TL-HEPES. A Ca2+
release profile was
induced via the addition of 2.5µM IO. (A) Resulting Ca2+
profile from MII oocytes
incubated in 500µM TPEN. (B) Resulting Ca2+
profiles from MII oocytes incubated in
500µM TPEN. From the resulting Ca2+
profiles, the amplitude of the release, duration of

21
release, and the time from baseline to peak release were tabulated for both MII (C) and
GV (D) oocytes. Bars with ** above them are statistically significant from those without
them.
Figure 5. TPEN exposure does not induce Ca2+
influx
Both GV and MII oocytes were pre-incubated in Ca2+ containing CZB w/(0.1% PVA)
supplemented with 500µM TPEN for 30 minutes followed by Ca2+
monitoring in the
same TPEN concentration and in the absence of CaCl2 supplementation. 5mM CaCl2 was
added to the oocytes with the intent of inducing a Ca2+
influx profile. (A) Resulting Ca2+
influx profile from GV oocytes incubated in 500µM TPEN. The response immediately
following the addition of 5mM CaCl2 is enlarged and projected into a right panel for
clearer viewing. (B) Resulting Ca2+
influx profile from MII oocytes incubated in 500µM
TPEN. A representative Ca2+
trace for both the TPEN and DMSO conditions is
extrapolated and displayed to the right for clearer viewing.
Figure 6. SrCl2-induced oscillations are blocked by incubation in TPEN
Both GV and MII oocytes were pre-incubated in Ca2+
containing CZB w/(0.1% PVA)
supplemented with 500µM TPEN for thirty minutes followed by Ca2+
monitoring in the
same TPEN concentration. The monitoring dish was supplemented with 10mM SrCl2 and
without the presence of CaCl2 from the start of monitoring with the intent of inducing
oscillations immediately after the exposure to SrCl2. (A) Resulting Sr2+
/Ca2+
profiles
from GV oocytes incubated in 500µM TPEN. (B) Resulting Sr2+
/Ca2+
profiles from MII
oocytes incubated in 500µM TPEN.

22
Table 1
Treatments # of
samples
2nd
PB
Formation
PN
Formation
2-Cell Morula Blastocyst
20 µM 22 86.4 72.7 36.4 18.2 0
50 µM 76 91.3 ± 4.8 79.9 ± 3.1 69.5 ± 8.6 13.6 ± 4.5 8.4 ± 3
100 µM 78 93.5 ± 3.3 88.9 ± 5.6 77.3 ± 4.1 21.8 ± 6.4 11.6 ± 3.2
200 µM 57 75.6 ±
11.9
72 ± 11.4 63.6 ± 3 7.2 ± 1.1 3.6 ± 0.6
500 µM 22 72.7 68.2 59.1 0 0
SrCl2 68 24 ± 5 86.9 ± 1.6 - - -
DMSO 58 0 1.7 ± 1.7 - - -
23
Figure 1
TPEN DMSO SrCl2
2nd
Polar Body 2nd
Polar Body
PN PN

24
Figure 2
MII 100µµµµM TPEN
0 10 20 30 400.0
0.2
0.4
0.6TPEN (n = 12)
DMSO (n = 11)
TPEN
Time (min)
F340 /
F380
1.7 mM Ca2+
4 6 8 10
0.35
0.40
0.45
0.50
TPEN
MII 100µµµµM TPEN w/o Ca2+ *
0 10 20 30 400.00
0.05
0.10
0.15 TPEN (n = 12)
DMSO (n = 7)
TPEN
0 mM Ca2+
Time (min) 5 10 15
0.08
0.10
0.12
0.14
0.16 TPEN
GV 100µµµµM TPEN
0 20 40 600.0
0.2
0.4
0.6
0.8
TPEN (n = 67)
DMSO (n = 22)
TPEN
1.7 mM Ca2+
Time (min)
Rati
o (
340/3
80)
30 35 400.2
0.3
0.4
0.5
0.6
GV 100µµµµM TPEN w/o Ca2+
0 20 40 600.0
0.2
0.4
0.6
0.8
TPEN(n=13)
DMSO(n=21)
TPEN
0 mM Ca2+
Time (min)
F340 /
F380
30 35 40
0.40
0.45
0.50
0.55
GV 100µµµµM TPEN
0 20 40 600.0
0.2
0.4
0.6
0.8
TPEN (n = 67)
TPEN-APB (n = 36)
TPEN
1.7 mM Ca2+
Time (min)
F340 /
F380
30 35 400.2
0.3
0.4
0.5
0.6
E
C
C B
A
D

25
Figure 3
MII
0 10 20 30 400.0
0.2
0.4
0.6
0.8
1.0TPEN(n = 19)
DMSO(n = 19)
100µM TPEN / DMSO
CPA
Time (min)
F340 /
F380
MII
0 10 20 30 400.0
0.2
0.4
0.6
0.8
1.0TPEN(n=15)
DMSO(n=14)
500µM TPEN / DMSO
CPA
Time (min)
F340 /
F380
GV
0 10 20 30 40 500.0
0.2
0.4
0.6
0.8100µM TPEN / DMSO
CPA TPEN(n = 23)
DMSO(n = 23)
Time (min)
F340 /
F380
GV
0 10 20 30 40 500.0
0.2
0.4
0.6
0.8
TPEN(n = 22)
DMSO(n = 27)
500µM TPEN / DMSO
CPA
Time (min)
F340 / F
380
Amplitude
100TPEN
500TPEN
0.0
0.1
0.2
0.3
0.4
0.5
(14)**
(15)
(19)**
(19)
F3
40
/ F
38
0
Duration
100TPEN
500TPEN
0
10
20
30
40
(14)**
(15)
(19)**
(19)
Tim
e (
min
)
Amplitude
100TPEN
500TPEN
0.0
0.1
0.2
0.3
(27)**
(33)
(23)**
(24)
F3
40
/ F
38
0
Duration
100TPEN
500TPEN
0
10
20
30
40
(27)**
(33)
(23)**
(24)
Tim
e (
min
)
Time to Peak
100TPEN
500TPEN
0
2
4
6
8
(19)
(19)**
(15)
(14)**
Tim
e (
min
)
Time to Peak
100TPEN
500TPEN
0
2
4
6
8
(27)(33)
(24)
(23)**
Tim
e (
min
)
F E
D C
B A
MII GV

26
Figure 4
MII
0 10 20 30 400.0
0.5
1.0
1.5TPEN(n=16)
DMSO(n=19)Ionomycin
500µM TPEN / DMSO
Time (min)
F340 /
F380
GV
0 10 20 30 400.0
0.5
1.0
1.5TPEN(n=28)
DMSO(n=27)
500µM TPEN / DMSO
Ionomycin
Time (min)
F340 /
F380
Amplitude
500TPEN
0.0
0.2
0.4
0.6
0.8
1.0
(33)
(20)**
(18)
F3
40
/ F
38
0
Duration
500TPEN
0
10
20
30
40
2018
(27)(33)
(20)**(18)
Tim
e (
min
)
Amplitude
500TPEN
0.0
0.1
0.2
0.3
0.4
0.5
(27)**
(33)
F3
40
/ F
38
0
Duration
500TPEN
0
5
10
15
20
25
(27)
(33)
Tim
e (
min
)
Time to Peak
500TPEN
0
5
10
15
20
(18)
(20)**
Tim
e (
min
)
Time to Peak
500TPEN
0
2
4
6
8
10
Tim
e (
min
)
(33)
(27)
D C
B A
MII GV

27
Figure 5
MII
0 10 20 30 400.0
0.5
1.0
1.5
TPEN (n = 10)
DMSO (n = 13)
500µM TPEN / DMSO
5mM Ca2+
Time (min)
F340 /
F380
4 6 8
0.3
0.4
0.5
GV
0 10 20 30 400.0
0.5
1.0
1.5
TPEN(n = 12/25)
DMSO(n = 14/23)
500µM TPEN / DMSO
5mM Ca2+
Time (min)
F340 /
F380
0 10 20 30 400.0
0.5
1.0
1.5
B
A

28
Figure 6
MII
0 20 40 60 800.0
0.2
0.4
0.6
0.8TPEN(n = 0/40)
DMSO(n = 17/34)
500µM TPEN / DMSO
10mM SrCl2
Time(min)
F340 /
F380
GV
0 20 40 60 800.0
0.2
0.4
0.6
0.8
1.0TPEN(n = 0/45)
DMSO(n = 28/52)
500µM TPEN / DMSO
10mM SrCl2
Time (min)
F340 /
F380
B
A

29
REFERENCES
Arnaudeau, S., Frieden, M., Nakamura, K., Castelbou, C., Michalak, M., and Demaurex,
N. (2002). Calreticulin Differentially Modulates Calcium Uptake and Release in the
Endoplasmic Reticulum and Mitochondria. Journal of Biological Chemistry 277, 46696 –
46705.
Bernhardt, M.L., Kim, A.M., O’Halloran, T.V., and Woodruff, T.K. (2011). Zinc
Requirement During Meiosis I–Meiosis II Transition in Mouse Oocytes Is Independent of
the MOS-MAPK Pathway. Biology of Reproduction 84, 526 –536.
Berridge, M.J., Bootman, M.D., and Roderick, H.L. (2003). Calcium signalling:
dynamics, homeostasis and remodelling. Nat Rev Mol Cell Biol 4, 517–529.
Bootman, M.D., Collins, T.J., Mackenzie, L., Roderick, H.L., Berridge, M.J., and
Peppiatt, C.M. (2002). 2-aminoethoxydiphenyl borate (2-APB) is a reliable blocker of
store-operated Ca2+ entry but an inconsistent inhibitor of InsP3-induced Ca2+ release.
FASEB J. 16, 1145–1150.
Bos-Mikich, A., Swann, K., and Whittingham, D.G. (1995). Calcium oscillations and
protein synthesis inhibition synergistically activate mouse oocytes. Mol. Reprod. Dev.
41, 84–90.
Brunet, S., and Maro, B. (2005). Cytoskeleton and cell cycle control during meiotic
maturation of the mouse oocyte: integrating time and space. Reproduction 130, 801 –811.
Chatot, C.L., Lewis, J.L., Torres, I., and Ziomek, C.A. (1990). Development of 1-cell
embryos from different strains of mice in CZB medium. Biol. Reprod. 42, 432–440.
Clapham, D.E., Runnels, L.W., and Strübing, C. (2001). The TRP ion channel family.
Nat. Rev. Neurosci. 2, 387–396.
DeHaven, W.I., Smyth, J.T., Boyles, R.R., Bird, G.S., and Putney, J.W., Jr (2008).
Complex actions of 2-aminoethyldiphenyl borate on store-operated calcium entry. J. Biol.
Chem. 283, 19265–19273.
Dorée, M., and Hunt, T. (2002). From Cdc2 to Cdk1: when did the cell cycle kinase join
its cyclin partner? Journal of Cell Science 115, 2461 –2464.
Ducibella, T., and Fissore, R. (2008). The roles of Ca2+, downstream protein kinases,
and oscillatory signaling in regulating fertilization and the activation of development.
Dev. Biol. 315, 257–279.
Essayan, D.M. (2001). Cyclic nucleotide phosphodiesterases. Journal of Allergy and
Clinical Immunology 108, 671–680.
Fissore, R.A., Kurokawa, M., Knott, J., Zhang, M., and Smyth, J. (2002). Mechanisms
underlying oocyte activation and postovulatory ageing. Reproduction 124, 745–754.

30
Gill, D.L., Spassova, M.A., and Soboloff, J. (2006). Calcium Entry Signals--Trickles and
Torrents. Science 313, 183 –184.
Gordo, A.C., Kurokawa, M., Wu, H., and Fissore, R.A. (2002). Modifications of the
Ca2+ release mechanisms of mouse oocytes by fertilization and by sperm factor. Mol.
Hum. Reprod. 8, 619–629.
Grynkiewicz, G., Poenie, M., and Tsien, R.Y. (1985). A new generation of Ca2+
indicators with greatly improved fluorescence properties. J. Biol. Chem. 260, 3440–3450.
Hartshorne, G.M., Sargent, I.L., and Barlow, D.H. (1994). Meiotic progression of mouse
oocytes throughout follicle growth and ovulation in vitro. Hum. Reprod. 9, 352–359.
Hofer, A.M., Fasolato, C., and Pozzan, T. (1998). Capacitative Ca2+ Entry Is Closely
Linked to the Filling State of Internal Ca2+ Stores: A Study Using Simultaneous
Measurements of ICRAC and Intraluminal [Ca2+]. The Journal of Cell Biology 140, 325
–334.
Hogan, P.G., Lewis, R.S., and Rao, A. (2010). Molecular Basis of Calcium Signaling in
Lymphocytes: STIM and ORAI. Annual Review of Immunology 28, 491–533.
Jonathan S., M. (2005). Cellular Signalling: STIMulating Calcium Entry. Current
Biology 15, R493–R495.
Jones, K.T. (2004). Turning it on and off: M‐phase promoting factor during meiotic
maturation and fertilization. Molecular Human Reproduction 10, 1 –5.
Jones, K.T., Carroll, J., and Whittingham, D.G. (1995a). Ionomycin, thapsigargin,
ryanodine, and sperm induced Ca2+ release increase during meiotic maturation of mouse
oocytes. J. Biol. Chem. 270, 6671–6677.
Jones, K.T., Carroll, J., and Whittingham, D.G. (1995b). Ionomycin, thapsigargin,
ryanodine, and sperm induced Ca2+ release increase during meiotic maturation of mouse
oocytes. J. Biol. Chem. 270, 6671–6677.
Kim, A.M., Vogt, S., O’Halloran, T.V., and Woodruff, T.K. (2010). Zinc Availability
Regulates Exit from Meiosis in Maturing Mammalian Oocytes. Nat Chem Biol 6, 674–
681.
Kline, D. (2000). Attributes and dynamics of the endoplasmic reticulum in mammalian
eggs. Curr. Top. Dev. Biol. 50, 125–154.
Kline, D., and Kline, J.T. (1992). Repetitive calcium transients and the role of calcium in
exocytosis and cell cycle activation in the mouse egg. Dev. Biol. 149, 80–89.
Kline, D., Mehlmann, L., Fox, C., and Terasaki, M. (1999). The Cortical Endoplasmic
Reticulum (ER) of the Mouse Egg: Localization of ER Clusters in Relation to the
Generation of Repetitive Calcium Waves. Developmental Biology 215, 431–442.

31
Kong, B.Y., Bernhardt, M.L., Kim, A.M., O’Halloran, T.V., and Woodruff, T.K. (2012).
Zinc Maintains Prophase I Arrest in Mouse Oocytes Through Regulation of the MOS-
MAPK Pathway. Biol. Reprod. 87, 11.
Lawrence, Y., Ozil, J.P., and Swann, K. (1998). The effects of a Ca2+ chelator and
heavy-metal-ion chelators upon Ca2+ oscillations and activation at fertilization in mouse
eggs suggest a role for repetitive Ca2+ increases. Biochem J 335, 335–342.
Lawrence, Y.M., and Cuthbertson, K.S. (1995). Thapsigargin induces cytoplasmic free
Ca2+ oscillations in mouse oocytes. Cell Calcium 17, 154–164.
Madgwick, S., and Jones, K.T. (2007). How eggs arrest at metaphase II: MPF
stabilisation plus APC/C inhibition equals Cytostatic Factor. Cell Div 2, 4.
Masui, Y. (2001). From oocyte maturation to the in vitro cell cycle: the history of
discoveries of Maturation-Promoting Factor (MPF) and Cytostatic Factor (CSF).
Differentiation 69, 1–17.
Nadler, M.J., Hermosura, M.C., Inabe, K., Perraud, A.L., Zhu, Q., Stokes, A.J., Kurosaki,
T., Kinet, J.P., Penner, R., Scharenberg, A.M., et al. (2001). LTRPC7 is a Mg.ATP-
regulated divalent cation channel required for cell viability. Nature 411, 590–595.
Pesin, J.A., and Orr-Weaver, T.L. (2008). Regulation of APC/C Activators in Mitosis and
Meiosis. Annual Review of Cell and Developmental Biology 24, 475–499.
Saunders, C.M., Larman, M.G., Parrington, J., Cox, L.J., Royse, J., Blayney, L.M.,
Swann, K., and Lai, F.A. (2002). PLCζ: a sperm-specific trigger of Ca2+ oscillations in
eggs and embryo development. Development 129, 3533 –3544.
Schaff, U.Y., Dixit, N., Procyk, E., Yamayoshi, I., Tse, T., and Simon, S.I. (2010). Orai1
regulates intracellular calcium, arrest, and shape polarization during neutrophil
recruitment in shear flow. Blood 115, 657–666.
Schmitz, C., Perraud, A.-L., Johnson, C.O., Inabe, K., Smith, M.K., Penner, R., Kurosaki,
T., Fleig, A., and Scharenberg, A.M. (2003). Regulation of Vertebrate Cellular Mg2+
Homeostasis by TRPM7. Cell 114, 191–200.
Suzuki, T., Yoshida, N., Suzuki, E., Okuda, E., and Perry, A.C.F. (2010). Full-term
mouse development by abolishing Zn2+-dependent metaphase II arrest without Ca2+
release. Development 137, 2659 –2669.
Sztretye, M., Almássy, J., Deli, T., Szentesi, P., Jung, C., Dienes, B., Simut, C.A., Niggli,
E., Jona, I., and Csernoch, L. (2009). Altered sarcoplasmic reticulum calcium transport in
the presence of the heavy metal chelator TPEN. Cell Calcium 46, 347–355.
Taylor, S.S., Scott, M.I.F., and Holland, A.J. (2004). The spindle checkpoint: a quality
control mechanism which ensures accurate chromosome segregation. Chromosome Res.
12, 599–616.

32
Thornton, B.R., and Toczyski, D.P. (2006). Precise destruction: an emerging picture of
the APC. Genes & Development 20, 3069 –3078.
Wu, H., He, C.L., Jehn, B., Black, S.J., and Fissore, R.A. (1998). Partial characterization
of the calcium-releasing activity of porcine sperm cytosolic extracts. Dev. Biol. 203,
369–381.
Yao, Y., Ferrer-Montiel, A.V., Montal, M., and Tsien, R.Y. (1999). Activation of store-
operated Ca2+ current in Xenopus oocytes requires SNAP-25 but not a diffusible
messenger. Cell 98, 475–485.