characterization of unbound materials (soils/aggregates
TRANSCRIPT

NDOT Research Report
Report No. 361-16-803
Characterization of Unbound Materials (Soils/Aggregates) Mechanistic-Empirical Pavement Design Guide (MEPDG)
January 2018
Nevada Department of Transportation
1263 South Stewart Street
Carson City, NV 89712

Disclaimer
This work was sponsored by the Nevada Department of Transportation. The contents of
this report reflect the views of the authors, who are responsible for the facts and the
accuracy of the data presented herein. The contents do not necessarily reflect the official
views or policies of the State of Nevada at the time of publication. This report does not
constitute a standard, specification, or regulation.

Characterization of Unbound Materials for Mechanistic-Empirical Pavement Design Guide (MEPDG)
iii
TECHNICAL REPORT DOCUMENTATION PAGE 1. Report No. P361-16-803
2. Government Accession No. N/A
3. Recipient’s Catalog No. N/A
4. Title and Subtitle Characterization of Unbound Materials (Soils/Aggregates) for Mechanistic-Empirical Pavement Design Guide (MEPDG)
5. Report Date January 2018 6. Performing Organization Code NONE
7. Author(s) Peter E. Sebaaly, Jeyakaran Thavathurairaja, and Elie Y. Hajj,
8. Performing Organization Report No. WRSC-UNR-20180101
9. Performing Organization Name and Address Pavement Engineering & Science Program Department of Civil & Environmental Engineering University of Nevada, Reno, Nevada 89557
10. Work Unit No. 11. Contract or Grant No.
12. Sponsoring Agency Name and Address Nevada Department of Transportation Research Division 1263 South Stewart Street Carson City, NV 89712
13. Type of Report and Period Covered Final Report 14. Sponsoring Agency Code
15. Supplementary Notes Charlie Pan, Project Manager, Materials Division, Nevada Department of Transportation 16. Abstract The resilient modulus is a critical engineering property used to characterize the unbound and subgrade materials in the AASHTO Mechanistic Empirical Pavement Design Guide (MEPDG) where a hierarchical approach is followed. Three levels of input are specified in the AASHTOWare® Pavement ME design software. This includes direct measurement from the laboratory testing offering the highest level of accuracy (i.e., Level 1), estimated values using correlations with materials properties (i.e., Level 2), and typical values offering the lowest level of accuracy (i.e., Level 3). The major objective of this study is to develop resilient modulus models for new design and rehabilitation projects for NDOT District 1 to be used in the MEPDG.
Unbound and subgrade materials were sampled from District 1 and various testing were conducted to determine numerous properties and characteristics including; materials classification (AASHTO and USCS), R-value, moisture-density relations, unconfined compressive strength, and resilient modulus. The resilient modulus test was conducted according to AASHTO T 307 procedure. The stress dependent resilient modulus models were developed for the unbound and subgrade materials. In summary, the stress dependent behavior of the resilient modulus for base and borrow materials in NDOT District I was found to fit very well the theta model. Meanwhile, the stress dependent behavior of the resilient modulus for the subgrade materials fitted very well both the universal model and Uzan model. The MEPDG procedure was used to determine the design resilient modulus for the new design projects. On the other hand, for the rehabilitation projects, a new approach based on the simulation of FWD testing was developed in this research and implemented to determine the design resilient modulus. It was observed that the design resilient modulus of the subgrade layer is independent of the pavement structure while the design resilient modulus of the borrow and base layers are dependent on the pavement structure.
Based on the analyses of the data generated from this research, two different resilient modulus models were developed; a) for new pavement design and b) for rehabilitation pavement design. The statistical analyses of the generated data indicated that the design resilient modulus of the subgrade layer for new and rehabilitation projects can be estimated based on the R-value or the unconfined compressive strength properties. However, the design resilient modulus of the borrow and base layers for new and rehabilitation projects can only be estimated based on the R-value. This leads to the conclusion that the unconfined compressive strength is not a good indicator of the strength properties of the borrow and base layers and a confined compressive strength must be measured. 17. Key Words Mechanistic-Empirical Pavement Design, Unbound Materials, Soils, Resilient Modulus, flexible Pavement
18. Distribution Statement No restrictions.
19. Security Classif. (of this report) Unclassified
20. Security Classif. (of this page) Unclassified
21. No. of Pages 128
22. Price Free
Form DOT F 1700.7 (8-72) Reproduction of completed page authorized

Characterization of Unbound Materials for Mechanistic-Empirical Pavement Design Guide (MEPDG)
iv
SI* (MODERN METRIC) CONVERSION FACTORS APPROXIMATE CONVERSIONS TO SI UNITS
Symbol When You Know Multiply By To Find Symbol LENGTH
in inches 25.4 millimeters mm ft feet 0.305 meters m yd yards 0.914 meters m mi miles 1.61 kilometers km
AREA in2 square inches 645.2 square millimeters mm2
ft2 square feet 0.093 square meters m2
yd2 square yard 0.836 square meters m2
ac acres 0.405 hectares ha mi2 square miles 2.59 square kilometers km2
VOLUME fl oz fluid ounces 29.57 milliliters mL gal gallons 3.785 liters L ft3 cubic feet 0.028 cubic meters m3
yd3 cubic yards 0.765 cubic meters m3
NOTE: volumes greater than 1000 L shall be shown in m3
MASS oz ounces 28.35 grams glb pounds 0.454 kilograms kgT short tons (2000 lb) 0.907 megagrams (or "metric ton") Mg (or "t")
TEMPERATURE (exact degrees) oF Fahrenheit 5 (F-32)/9 Celsius oC
or (F-32)/1.8 ILLUMINATION
fc foot-candles 10.76 lux lx fl foot-Lamberts 3.426 candela/m2 cd/m2
FORCE and PRESSURE or STRESS lbf poundforce 4.45 newtons N lbf/in2 poundforce per square inch 6.89 kilopascals kPa
APPROXIMATE CONVERSIONS FROM SI UNITS Symbol When You Know Multiply By To Find Symbol
LENGTHmm millimeters 0.039 inches in m meters 3.28 feet ft m meters 1.09 yards yd km kilometers 0.621 miles mi
AREA mm2 square millimeters 0.0016 square inches in2
m2 square meters 10.764 square feet ft2
m2 square meters 1.195 square yards yd2
ha hectares 2.47 acres ac km2 square kilometers 0.386 square miles mi2
VOLUME mL milliliters 0.034 fluid ounces fl oz L liters 0.264 gallons gal m3 cubic meters 35.314 cubic feet ft3
m3 cubic meters 1.307 cubic yards yd3
MASS g grams 0.035 ounces ozkg kilograms 2.202 pounds lbMg (or "t") megagrams (or "metric ton") 1.103 short tons (2000 lb) T
TEMPERATURE (exact degrees) oC Celsius 1.8C+32 Fahrenheit oF
ILLUMINATION lx lux 0.0929 foot-candles fc cd/m2 candela/m2 0.2919 foot-Lamberts fl
FORCE and PRESSURE or STRESS N newtons 0.225 poundforce lbf kPa kilopascals 0.145 poundforce per square inch lbf/in2
*SI is the symbol for th International System of Units. Appropriate rounding should be made to comply with Section 4 of ASTM E380. e(Revised March 2003)

Characterization of Unbound Materials for Mechanistic-Empirical Pavement Design Guide (MEPDG)
v
TABLE OF CONTENTS TECHNICAL REPORT DOCUMENTATION PAGE ..................................................... iii Table Of Contents ............................................................................................................... v List Of Tables .................................................................................................................... vi List of Figures ..................................................................................................................... x
Introduction ..................................................................................................... 13 1.1. Objective and Scope .............................................................................................. 14
Literature Review ............................................................................................ 15 2.1. Hierarchical Input Levels of the MEPDG ............................................................. 16
2.2. Overview of Resilient Modulus Test ..................................................................... 20
2.3. Correlations for Estimating Resilient Modulus ..................................................... 24
2.4. Implementation and Use of Resilient Modulus ..................................................... 27
Material Collection .......................................................................................... 35 Laboratory Testing .......................................................................................... 40
4.1. Soil Classification Testing ..................................................................................... 40
4.2. Moisture-Density Relationship (T 108B) .............................................................. 48
4.3. Resilient Modulus Testing ..................................................................................... 50
4.4. Unconfined Compressive Strength ........................................................................ 62
4.5. R-value Test (T 115D) ........................................................................................... 65
Design Resilient Modulus for New Projects ................................................... 71 5.1. Procedure for Identification of Resilient Modulus Design Value ......................... 71
5.2. Identification of Resilient Modulus Design Value for Typical NDOT Pavements 72
Design Resilient Modulus for Rehabilitation Projects .................................... 82 6.1. Procedure for Identification of Design Resilient Modulus for Rehabilitation Designs....................................................................................................................................... 82
6.2. Identification of Resilient Modulus for Rehabilitation Design .............................. 83
Resilient Modulus Prediction Model Development ........................................ 91 7.1. Statistical Analysis ................................................................................................. 92
7.2. Comparison of Resilient Modulus Prediction Models ........................................... 96
7.3. AASHTOWare® Pavement ME Comparison ..................................................... 100
Conclusions and Recommendations .............................................................. 101 References ..................................................................................................... 103
Appendix A ..................................................................................................................... 106

Characterization of Unbound Materials for Mechanistic-Empirical Pavement Design Guide (MEPDG)
vi
LIST OF TABLES Table 2.1. Unbound Aggregate Base, Subbase, Embankment, and Subgrade Soil Input Parameters and Test Protocols for New and Existing Materials....................................... 18
Table 2.2. Models Relating Material Index and Strength Properties to Mr (5). ............... 19
Table 2.3. Chronology of AASHTO Test Procedures for Mr Measurements (6)............. 22
Table 2.4. State DOT/Other Laboratories Conducting Resilient Modulus Testing. ......... 23
Table 2.5. Methods used to Estimate Design Resilient Modulus for Selected Agencies. 28
Table 3.1. Summary of Collected Base and Borrow Materials from NDOT District 1. .. 36
Table 3.2. Summary of Soil Types in the Selected Locations. ......................................... 38
Table 3.3. Collected Subgrade Materials. ......................................................................... 39
Table 4.1. Summary of Sieve Analysis for Base Materials. ............................................. 41
Table 4.2. Summary of Sieve Analysis for Borrow Materials. ......................................... 42
Table 4.3. Summary of Sieve Analysis for Subgrade Materials. ...................................... 43
Table 4.4. Summary of Atterberg Limits for Borrow Materials. ...................................... 45
Table 4.5. Summary of Atterberg Limits for Subgrade Materials. ................................... 45
Table 4.6. AASHTO Soil Classification Method. ........................................................... 46
Table 4.7. Classification of Subgrade Materials with AASHTO and UCS Methods. ...... 46
Table 4.8. Unified Soil Classification Method. ............................................................... 47
Table 4.9. Summary of Moisture-Density Test Results for Base Materials. .................... 50
Table 4.10 Summary of Moisture-Density Test Results for Borrow Materials. ............... 50
Table 4.11. Sumarry of Moisture-Density Test Results for Subgrade Materials. ............. 50
Table 4.12. Testing Sequence for Base and Subbase Materials. ...................................... 51
Table 4.13. Testing Sequence for Subgrade Materials. .................................................... 51
Table 4.14. Summary of Resilient Modulus Test Results for Base Material (Contract 3546)............................................................................................................................................ 56
Table 4.15. Regression Coefficients of Mr Model for Base Materials. ............................ 59

Characterization of Unbound Materials for Mechanistic-Empirical Pavement Design Guide (MEPDG)
vii
Table 4.16. Table 16. Regression Coefficients of Mr Model for Borrow Materials. ....... 59
Table 4.17 Regression Coefficients of Mr Model for Subgrade Materials....................... 59
Table 4.18. Summary of Unconfined Compressive Strength Test Results....................... 65
Table 4.19. Summary of R-value Test Results. ................................................................ 70
Table 5.1. Major Inputs for Pavexpress Software. ............................................................ 73
Table 5.2. Pavement Structures for Different Traffic Levels. .......................................... 73
Table 5.3. Pavement Structure with Borrow Materials..................................................... 73
Table 5.4. Mean Dynamic Modulus Values for District 1 PG76-22NV Mixture (2). ...... 74
Table 5.5. Summary of Sublayers for a 5-inch AC Layer. ............................................... 76
Table 5.6. Sate of Stress from Load-Induced Stress and Overburden Stress. .................. 78
Table 5.7. Predicted Resilient Modulus from the State of Stress. .................................... 78
Table 5.8. Summary of Resilient Modulus for Pavement Structure on Strong Subgrade. 79
Table 5.9. Summary of Resilient Modulus for Pavement Structure on Weak Subgrade.. 80
Table 5.10. Summary of Resilient Moduli values for Pavement Structures with Borrow Layer. ................................................................................................................................ 81
Table 6.1. Representative Mean Dynamic Shear Modulus and Phase angle for PG 76-22 NV. .................................................................................................................................... 84
Table 6.2. Damaged Dynamic Modulus Input Values at Different Temperatures and Frequencies. ...................................................................................................................... 84
Table 6.3. Cohesion and Friction Angle from the Laboratory Testing. ............................ 85
Table 6.4. Deflections at various Radial Distances generated by the ILLIPAVE Model. 86
Table 6.5. Deflection at Various Distances Backcalculated by the Modulus 6.1 Model. 86
Table 6.6. Backcalculated Modulus for Each Layer. ........................................................ 87
Table 6.7. Summary of Backcalculated Moduli values for Pavement Structures with Borrow Layer. ................................................................................................................... 88
Table 6.8. Summary of Backcalculated Moduli for Pavement Structures on Strong Subgrade. .......................................................................................................................... 89

Characterization of Unbound Materials for Mechanistic-Empirical Pavement Design Guide (MEPDG)
viii
Table 6.9. Summary of Backcalculated Moduli for Pavement Structures on Weak Subgrade. .......................................................................................................................... 90
Table 7.1. Range of Variables for the Design Mr Models Development. ........................ 92
Table 7.2. Summary of Design Resilient Modulus Models with UCS. ............................ 94
Table 7.3. Summary of Design Resilient Modulus Models with R-value. ....................... 94
Table 7.4. Resilient Modulus of Unbound materials (without Borrow Material). ......... 100
Table 7.5. Design Flexible Pavement Structure. ............................................................. 100
Table 7.6. Resilient Modulus of Unbound materials (with Borrow Material). ............... 100
Table 7.7. Design Pavement Structure (With Borrow Material). ................................... 100
Table A.1. Summary of Resilient Modulus Test Results for Base Material (Contract 3546).......................................................................................................................................... 114
Table A.2. Summary of Resilient Modulus Test Results for Base Material (Contract 3583).......................................................................................................................................... 115
Table A.3. Summary of Resilient Modulus Test Results for Base Material (Contract 3597).......................................................................................................................................... 116
Table A.4. Summary of Resilient Modulus Test Results for Base Material (Contract 3605).......................................................................................................................................... 117
Table A.5. Summary of Resilient Modulus Test Results for Base Material (Contract 3607).......................................................................................................................................... 118
Table A.6. Summary of Resilient Modulus Test Results for Base Material (Contract 3613).......................................................................................................................................... 119
Table A.7. Summary of Resilient Modulus Test Results for Borrow Material (Contract 3546). .............................................................................................................................. 120
Table A.8. Summary of Resilient Modulus Test Results for Borrow Material (Contract 3583). .............................................................................................................................. 121
Table A.9. Summary of Resilient Modulus Test Results for Borrow Material (Contract 3597). .............................................................................................................................. 122
Table A.10. Summary of Resilient Modulus Test Results for Borrow Material (Contract 3613). .............................................................................................................................. 123
Characterization of Unbound Materials for Mechanistic-Empirical Pavement Design Guide (MEPDG)
ix
Table A.11. Summary of Resilient Modulus Test Results for Subgrade Material (I-15/Goodsprings). ............................................................................................................. 124
Table A.12. Summary of Resilient Modulus Test Results for Subgrade Material (US-95/Searchlight). ............................................................................................................... 125
Table A.13. Summary of Resilient Modulus Test Results for Subgrade Material (NV-375/Rachel). .................................................................................................................... 126
Table A.14. Summary of Resilient Modulus Test Results for Subgrade Material (US-93/Crystal Spring MP62). ............................................................................................... 127
Table A.15. Summary of Resilient Modulus Test Results for Subgrade Material (US-93/Crystal Spring MP67). ............................................................................................... 128

Characterization of Unbound Materials for Mechanistic-Empirical Pavement Design Guide (MEPDG)
x
LIST OF FIGURES Figure 2.1. Definition of resilient modulus (6). ................................................................ 21
Figure 3.1. NDOT districts boundaries. ............................................................................ 35
Figure 3.2. Locations considered to identify the subgrade materials. .............................. 37
Figure 3.3. Subgrade sample locations. ............................................................................ 39
Figure 4.1. Gradation curves for base materials. .............................................................. 41
Figure 4.2. Gradation curves for borrow materials. .......................................................... 42
Figure 4.3. Gradation curves for subgrade materials. ....................................................... 43
Figure 4.4. Atterberg limits test apparatus and tools. ....................................................... 44
Figure 4.5. Liquid limit test results for subgrade (I-15/Goodsprings). ............................. 45
Figure 4.6. Moisture-density curve for base material (contract 3583). ............................ 48
Figure 4.7. Moisture-density curve for borrow materials (contract 3597). ...................... 49
Figure 4.8. Moisture-density curve for subgrade materials (US-93/Bonnie Claire)......... 49
Figure 4.9. Vibratory compactor and sample mold. ......................................................... 52
Figure 4.10. Extruded compacted sample. ........................................................................ 52
Figure 4.11. Compacted sample with membrane, porous stones and O-rings. ................. 53
Figure 4.12. Sample inside the triaxial chamber............................................................... 54
Figure 4.13. LVDT’s connected on the outside of the triaxial chamber. .......................... 54
Figure 4.14. Theta model for base material (contract 3546). ............................................ 57
Figure 4.15. Theta model for borrow material (contract 3546). ....................................... 57
Figure 4.16. Uzan model for subgrade (US-93/Crystal Spring MP62). ........................... 58
Figure 4.17. Universal model for subgrade (US-93/Crystal Spring MP62). .................... 58
Figure 4.18. Variation of resilient modulus of base materials with bulk stress. ............... 60
Figure 4.19. Variation of resilient modulus of borrow materials with bulk stress. .......... 60
Figure 4.20. Variation of resilient modulus of subgrade materials with bulk stress. ....... 61

Characterization of Unbound Materials for Mechanistic-Empirical Pavement Design Guide (MEPDG)
xi
Figure 4.21. Extruded UCS sample. ................................................................................. 62
Figure 4.22. Sample after the UCS test............................................................................. 63
Figure 4.23. UCS stress-strain curve for base materials (contract 3583). ........................ 63
Figure 4.24. UCS stress-strain curve for borrow material (contract 3613). ..................... 64
Figure 4.25. UCS stress-strain curve for subgrade material (I-15/Goodsprings). ............ 64
Figure 4.26. Kneading compactor. .................................................................................... 66
Figure 4.27. Exudation-indicator device. .......................................................................... 66
Figure 4.28. Expansion pressure device. .......................................................................... 67
Figure 4.29. R-value testing equipment. ........................................................................... 67
Figure 4.30. R-value test results for base material (contract 3546). ................................. 69
Figure 5.1. Sublayer thicknesses for the AC layer............................................................ 74
Figure 5.2. Dynamic modulus master curve for mixtures used in District 1. ................... 75
Figure 5.3. Equivalent thickness transformation using MET. .......................................... 75
Figure 5.4, Effective length computation for single axle load configuration. .................. 76
Figure 6.1. Damaged and undamaged dynamic modulus master curve. .......................... 85
Figure 6.2. Forward calculated and backcalculated deflections. ...................................... 87
Figure 7.1. Residual error plot for the prediction model. ................................................. 93
Figure 7.2. Normality plot for the prediction model. ........................................................ 93
Figure 7.3. Correlation between Heq and D for new design. ............................................ 95
Figure 7.4. Variation of design resilient modulus versus predicted resilient modulus of subgrade (using UCS) for new design. ............................................................................. 96
Figure 7.5. Variation of design resilient modulus versus predicted resilient modulus of subgrade (using UCS) for rehabilitation design................................................................ 97
Figure 7.6. Variation of design resilient modulus with predicted resilient modulus (using R-value) for new design. ................................................................................................... 97

Characterization of Unbound Materials for Mechanistic-Empirical Pavement Design Guide (MEPDG)
xii
Figure 7.7. Variation of rehabilitation design resilient modulus with predicted resilient modulus (using R-value) for rehabilitation design. .......................................................... 98
Figure 7.8. Comparison of predicted rehabilitation and new design Mr (R-value). ......... 99
Figure 7.9. Variation of NDOT predicted Mr and predicted Mr for new and rehabilitation design (R-value). ............................................................................................................... 99
Figure A.1. Moisture-density curve for base material (contract 3546). .......................... 106
Figure A.2. Moisture-density curve for base material (contract 3583). .......................... 107
Figure A.3. Moisture-density curve for base material (contract 3597). .......................... 107
Figure A.4. Moisture-density curve for base material (contract 3605). .......................... 107
Figure A.5. Moisture-density curve for base material (contract 3607). .......................... 108
Figure A.6. Moisture-density curve for base material (contract 3613). .......................... 108
Figure A.7. Moisture-density curve for borrow material (contract 3546). ..................... 109
Figure A.8. Moisture-density curve for borrow material (contract 3583). ..................... 109
Figure A.9. Moisture-density curve for borrow material (contract 3597). ..................... 110
Figure A.10. Moisture-density curve for borrow material (contract 3607). ................... 110
Figure A.11. Moisture-density curve for borrow material (contract 3613). ................... 111
Figure A.12. Moisture-density curve for subgrade material (US-95/Searchlight). ........ 111
Figure A.13. Moisture-density curve for subgrade material (US-95/Bonnie Claire). .... 112
Figure A.14. Moisture-density curve for subgrade material US-93/Crystal Spring MP67).......................................................................................................................................... 112
Figure A.15. Moisture-density curve for subgrade material (US-93/Crystal Spring MP62).......................................................................................................................................... 113

Characterization of Unbound Materials for Mechanistic-Empirical Pavement Design Guide (MEPDG)
13
INTRODUCTION
The American Association of State Highway and Transportation Officials (AASHTO) adopted the Mechanistic-Empirical Pavement Design Guide (MEPDG) as an interim pavement design standard in 2008 (1). The MEPDG is currently being implemented in the AASHTOWare®Pavement ME design software. The Nevada Department of Transportation (NDOT) already started the implementation of the MEPDG for the structural design of flexible pavements (2). The MEPDG conducts advanced mechanistic analysis of the pavement structure while taking into consideration the combined contributions of; traffic, climate, and materials properties. Currently, NDOT has a draft MEPDG Design Guide that covers the various parts of the design process including an extensive database on the properties and performance of asphalt concrete mixtures. The next logical step in the NDOT implementation process for MEPDG is to develop a database on the properties of unbound materials in the base, subbase (borrow), and subgrade layers. The MEPDG follows a hierarchical approach in defining the required engineering properties of the pavement structure. Three levels of input are specified: 1, 2, and 3. Level 1 offers the highest level of accuracy while level 3 offers the lowest level of accuracy. In the case of unbound materials in base, subbase, and subgrade layers, the required engineering properties include the resilient modulus (Mr) and Poisson’s ratio (μ). Additional unbound materials properties include Atterberg limits, gradation, conductivity, and coefficient of lateral pressure. Since the impact of Poisson’s ratio on the response of the pavement structure to climate and traffic loads is insignificant, this property is typically assumed with a reasonable accuracy. However, the impact of Mr on the response of the pavement structure to the combined actions of climate and traffic loads is highly significant, therefore, the Mr value of each pavement layer must be accurately specified. Level 1 requires the Mr property to be measured in the laboratory under repeated load triaxial (RLT) conditions, level 2 allows the determination of Mr through correlations with other empirical properties of the unbound materials such as the Resistance value (R-value) or the California Bearing Ratio (CBR), and basic properties of the unbound materials such as Atterberg limits, gradation, etc…, and level 3 allows the use of Mr default values. While the RLT provides a fundamental approach to characterize the nonlinear stress-dependent behavior of unbound materials, the test itself is time-consuming and costly. In light of these issues, most state highway agencies have elected to implement level 2 input for unbound materials. Therefore, a well-defined fundamental approach must be followed to establish a highly reliable relationship to determine the Mr property of unbound materials encountered throughout Nevada from other properties that can be practically and reliably measured. The Mr input parameter for unbound materials plays a major role in pavement designs and has a significant influence on the projected pavement performance. Hence, a proper estimation of the Mr value for locally available unbound materials used in base, subbase, and subgrade layers becomes critical for designing long-lasting flexible and rigid pavements in Nevada. Currently, NDOT estimates Mr from the R-value (Equation 1) using a correlation that was established for a specific group of soils obtained from specific geographic areas that might not be applicable for the type of unbound materials typically used in Nevada.

Characterization of Unbound Materials for Mechanistic-Empirical Pavement Design Guide (MEPDG)
14
𝑴𝑴𝑴𝑴 = 𝟏𝟏𝟏𝟏𝟏𝟏 ∗ 𝟏𝟏𝟏𝟏(𝟏𝟏.𝟏𝟏𝟏𝟏𝟏𝟏𝟎𝟎𝟎𝟎+𝟏𝟏.𝟐𝟐𝟐𝟐) (1)
Where; Mr: resilient modulus, psi R: R-value
1.1. Objective and Scope The objective of this research study is to develop a prediction model for the resilient modulus of the unbound materials to be used for new design and rehabilitation projects in NDOT District 1. In order to achieve this objective, the following tasks have been conducted:
• Collect base, subbase (borrow), and subgrade representative materials commonly used in NDOT District 1.
• Conduct laboratory testing of the collected materials to evaluate the following properties; sieve analysis, Atterberg limit, moisture density relationship, R-value, unconfined compressive strength, and resilient modulus.
• Develop models for the stress-dependent resilient modulus of unbound materials.
• Identify the design resilient modulus for new design and rehabilitation projects.
• Develop prediction models for estimating resilient modulus of unbound materials in Nevada for new design and rehabilitation projects.

Characterization of Unbound Materials for Mechanistic-Empirical Pavement Design Guide (MEPDG)
15
LITERATURE REVIEW Since the publication of the MEPDG Guide in 2008, some agencies have transitioned to this new method (for example: Arizona, Colorado, Georgia, Indiana, Missouri, Utah, Virginia, and Wyoming). Many other agencies are in the process of evaluating the procedure, creating input libraries to tailor the AASHTO MEPDG procedure to their local conditions, soils, and materials. NDOT is within the latter category of agencies and has started the implementation of the MEPDG for the structural design of flexible and rigid pavements. NDOT’s goal is to implement the MEPDG through a phased approach, similar to many other agencies. This phased approach includes building material libraries and tying some of the inputs to their day-to-day practices to minimize deviations from current practice and maximize the use of historical information and data. One of the input categories to the MEPDG is the characterization of all unbound layers and subgrades. The input parameters for the unbound layers include: resilient modulus, Poisson’s ratio, dry density, water content, gradation, Atterberg limits, etc. The resilient modulus is considered a key input parameter that has a significant impact on the structural responses of a pavement structure, and thus affects its performance and design. Multiple sensitivity analyses have been completed to identify input parameters that significantly affect the calculation or prediction of different pavement distresses. Results from these sensitivity analyses are used to determine where the agency should focus its resources to facilitate the implementation process; in other words, “getting the biggest outcome for the funds invested.” The review of published papers and reports indicate the resilient modulus of unbound materials and soils has an impact on pavement performance. The following is a general summary of the impact levels of the subgrade resilient modulus on pavement performance indicators (3):
• Flexible Pavements o Fatigue Longitudinal Cracking – Moderate to High Impact o Fatigue Alligator Cracking – Low to Moderate Impact o Transverse Cracking – None to Low Impact o Rutting – Low to Moderate Impact o IRI – Variable
• Rigid Pavements o Faulting – Low Impact o Transverse Cracking – Moderate to High Impact o IRI – None to Low Impact
Recognizing the role of Mr of unbound materials on the design and performance of flexible and rigid pavements, some questions that are typically asked by an agency prior to the full implementation of the MEPDG include: a) what test method should be used to measure resilient modulus, b) how is the design resilient modulus determined, and c) what is the “best” correlation (form and accuracy) between Mr and other unbound materials properties or test results? The literature review, conducted in this research, compiled information in specific areas related to the inputs to the MEPDG, including: a) the latest development and implementation of the MEPDG around the country, and b) summarize existing correlation equations to estimate the Mr from other physical properties of the unbound materials for base and subgrade layers. A similar literature

Characterization of Unbound Materials for Mechanistic-Empirical Pavement Design Guide (MEPDG)
16
review and summary was prepared by members of the research team for the FHWA under a project recently completed (under publication) entitled; “Precision and Bias of the Resilient Modulus Test” (4). In addition, selected agencies actively running the resilient modulus test were contacted to obtain any results from recently completed and/or on-going studies relating the resilient modulus to other soil properties for use in design and in building the agency’s materials library. The literature review is divided into several sections, including: 1) the hierarchical input structure of the MEPDG as related to unbound layers to facilitate implementation, 2) a review of laboratory Mr test methods, 3) reviewing Mr test data, 4) summarizing available correlations between Mr and other physical properties or tests, and 5) a brief overview of other agencies practices in establishing unbound materials libraries. 2.1. Hierarchical Input Levels of the MEPDG Table 2.1 summarizes the input parameters and how they are determined as recommended in the MEPDG Manual of Practice. Most of the input parameters are well defined and commonly measured by the agency on a day-to-day basis for various reasons. Performing the repeated load resilient modulus test, however, is expensive and time consuming. In addition, the process of determining the design resilient modulus has been widely debated. As such, many agencies have expended resources to determine an appropriate procedure to estimate the design Mr for specific site features and design strategy. The Mr is a required input for all unbound granular materials and subgrades. The Mr values are used in the structural response computation models and have a significant effect on the pavement responses and modulus of subgrade reaction (k-value) computed internally. The Mr can be measured directly from laboratory testing, or obtained through correlations with other material strength properties. There are three different levels of inputs for Mr and consist of the following:
• Input Level 1 – Project Specific Measured Values: The level 1 resilient modulus for unbound granular materials and subgrade are determined from repeated load triaxial tests. The test standards recommended for use are: AASHTO T 307 and NCHRP 1-28A. The Mr is estimated using a generalized constitutive model (Equation 2). The k coefficients are determined by using linear or nonlinear regression analyses to fit the model to the laboratory test results. The input level 1 procedure is applicable to new design, reconstruction and rehabilitation design (5).
𝑀𝑀𝑟𝑟 = 𝑘𝑘1𝑝𝑝𝑎𝑎 �𝜃𝜃𝑃𝑃𝑎𝑎�𝑘𝑘2�𝜏𝜏𝑜𝑜𝑜𝑜𝑜𝑜𝑃𝑃𝑎𝑎
+ 1�𝑘𝑘3
(2)
Where; Mr: resilient modulus, psi θ: bulk stress, psi σ1: major principal stress, psi σ2: intermediate principal stress, psi σ3: minor principal stress/confining pressure, psi τoct: octahedral shear stress, psi Pa: normalizing stress (atmospheric pressure), psi k1,k2,k3: regression constants (obtained by fitting resilient modulus test
data to equation)

Characterization of Unbound Materials for Mechanistic-Empirical Pavement Design Guide (MEPDG)
17
In earlier versions of Pavement ME Design, the regression coefficients (k1, k2, k3) could be entered directly into the software. The program used a finite element model for calculating pavement responses within the various unbound layers based on the nonlinear regression coefficient to determine the stress dependent resilient modulus appropriate for the in-place stress condition. Version 1.0 excluded the finite element model and a user could no longer enter the regression coefficients from a repeated load triaxial resilient modulus test. Thus, the design resilient modulus is entered directly in the program which is determined external to the software and only the linear response is considered in calculating the critical pavement responses. The in-place stress condition is determined by the user which should represent the value at the critical condition – higher damage rate.
• Input Level 2 – Correlations with Other Material Properties or Tests While the repeated load triaxial resilient modulus test provides a fundamental approach to characterize the nonlinear stress dependent behavior of unbound materials, the test itself is time-consuming and costly. In light of these issues, most state highway agencies have elected to implement level 2 input for unbound materials. Many existing correlations can be used to estimate the resilient modulus, and the correlations can be direct or indirect. Table 2.2 summarizes the correlations included in the Pavement ME design software. For input level 2 design, the user can input a representative Mr or use the enhance integrated climatic model to adjust the Mr for seasonal effects or input an Mr for each month of the year.
• Input Level 3 – Typical Values based on Soil Classification or Local Experience In level 3, typical Mr values are specified for different types of unbound materials or soils. These typical values can represent the global defaults or represent local experience. The global values are built into the software, are dependent on soil classification, and represent the Mr at the optimum water content and maximum dry unit weight. These values should be used with caution as they represent approximate values. Levels 1 and 2 input are recommended to achieve more representative materials behavior (5).

Characterization of Unbound Materials for Mechanistic-Empirical Pavement Design Guide (MEPDG)
18
Table 2.1. Unbound Aggregate Base, Subbase, Embankment, and Subgrade Soil Input Parameters and Test Protocols for New and Existing Materials.
Design Type Measured Property Source of Data Recommended Test Protocol
and/or Data Source Test Estimate
New (lab samples) and existing (extracted materials)
Determine the average design resilient modulus for the expected in-place stress state from laboratory resilient modulus tests.
X
The generalized model used in MEPDG design procedure – see equation 1; AASHTO T 307 or NCHRP 1-28A
At-Rest earth pressure coefficient X No national test standard; value
used external to the software.
Poisson’s ratio X No national test standard, use default values included in the MEPDG.
Maximum dry density X AASHTO T 180 Optimum moisture content X AASHTO T 180
Gradation X Gradation of the unbound aggregate or embankment soil measured in accordance with AASHTO T 88
Atterberg Limits X
Liquid limit measured in accordance with AASHTO T 89, and plastic limit and plasticity index determined in accordance with AASHTO T 90.
Specific gravity X AASHTO T 100 Saturated hydraulic conductivity X AASHTO T 215
Soil water characteristic curve parameters X
Pressure plate (AASHTO T 99), OR Filter paper (AASHTO T 180), OR Tempe cell (AASHTO T 100)
Existing material to be left in place
FWD backcalculated modulus X AASHTO T 256 and
ASTM D 5858
Poisson’s ratio X No national test standard, use default values included in the MEPDG.

Characterization of Unbound Materials for Mechanistic-Empirical Pavement Design Guide (MEPDG)
19
Table 2.2. Models Relating Material Index and Strength Properties to Mr (5).
The following summarizes the values and data sources for characterizing the unbound layers or materials used by most agencies that have completed or are in the process of implementing the Pavement M-E software. The default values used become important when completing the calibration and validation of the distress transfer functions to ensure consistency of use.
• Design Resilient Modulus: Many agencies have generated resilient modulus databases for the aggregate base materials commonly specified by the agency and soils that are predominantly encountered within the agency’s jurisdictions. Other agencies use correlations to CBR, R-value, materials physical properties, and dynamic cone penetrometer test results.
• Dry Density and Water Content: The software asks for the maximum dry unit weight and optimum water content but the values depend on how the test specimens were prepared and/or the condition of the test specimens for the correlations that the agency is using to estimate the Mr. For example, some agencies use the CBR to estimate the design Mr. A few of these agencies have run soaked CBR tests and measured the resilient modulus at the dry density and water content from the soaked CBR test, while other agencies have measured the resilient modulus at the dry density and water content before the specimen is subjected to water soaking during the CBR test. How the correlation was developed defines the input values. It is important that the dry density and water content entered into the software to be consistent with the method used to define the correlation regardless of what other test is used.
• Poisson’s Ratio: Poisson’s ratio is identified as an insignificant input parameter in terms of the predicted cracking and distortion type distresses, and is generally estimated. However, Poisson’s ratio does have an impact on the selection of the design resilient modulus of any unbound layer because it affects the vertical and horizontal stresses – this is called the Poisson’s ratio effect. Therefore, a reliable estimate of the Poisson’s ratio based on experience is desired.
• At-Rest Lateral Earth Pressure Coefficient: This input parameter is no longer needed since

Characterization of Unbound Materials for Mechanistic-Empirical Pavement Design Guide (MEPDG)
20
the selection of the design resilient modulus is not part of the input level 1 in the current version of the Pavement ME Design software. However, the at-rest earth pressure coefficient is important in defining the design resilient modulus. At-rest earth pressure coefficients can vary from 0.50 to well over 1.0 depending on the condition of the soil or aggregate base layers. The coefficient has an impact on the lateral stress condition, which in turn affects the design resilient modulus.
• Gradation and Atterberg Limits: Most agencies define the average gradation, plasticity limit, and liquid limit for the commonly used aggregate base layers and predominant soils found within the agency’s jurisdictions. The local default values are typically compared to the global default values included in the Pavement ME Design software to determine the difference between the two sets of values. Sometimes differences in the physical properties will explain some of the differences between the global and local design resilient moduli.
• Soil-Water Characteristic Curve Parameters: Just about all agencies have used the global default values which are soil classification dependent.
• Specific Gravity: All agencies have simply used the global default value of 2.7 included in the current version of the Pavement ME Design software for all soil classifications.
• Saturated Hydraulic Conductivity: All agencies have used the global default value in their implementation and local calibration studies, which are soil classification dependent.
2.2. Overview of Resilient Modulus Test The resilient modulus is similar to the elastic modulus of a material and is defined as a ratio of deviatoric stress to resilient or elastic strain experienced under repeated loading conditions that aims to simulate traffic loading. Figure 2.1 shows a representation of the resilient modulus. The main reason for using the resilient modulus as the parameter for unbound bases and subgrades is that it represents a basic material property and can be used in mechanistic analyses to calculate pavement responses used to predict different distresses (i.e. rutting, cracking, and roughness). Prior to 1980, an attempt was made to standardize the testing procedure. A standard test was not reached due to different philosophies on specimen preparation, on versus off specimen deformation measurements, stress states (vertical stress and confinement), as well as type of load application (haversine versus square load pulses). Several studies were performed in the process in attempts to standardize testing methods. Many of these studies are summarized in the precision and bias report (4). Some other factors that were studied include, drained versus undrained conditions, load cell location, and the number of conditioning cycles required for stable results. The NCHRP Synthesis 382 summarized Mr testing procedures and results from various sources. The summary is presented based on testing performed prior to 1986, between 1986 and 1996, and after 1996 (6). In summary, the research performed prior to 1986 mostly focused on three different criteria namely: (a) the development of test procedures and equipment modifications to test cohesive subgrades and granular base materials, (b) the development of appropriate models to represent the resilient behavior, and (c) the introduction of few correlations based on soil properties to predict resilient properties (6). The Mr research performed between 1986 and 1996 focused on the use of various laboratory and field equipment to determine the properties of both unbound bases and subgrades. Some studies were performed to develop a database of resilient properties which were then used to develop

Characterization of Unbound Materials for Mechanistic-Empirical Pavement Design Guide (MEPDG)
21
models to predict resilient properties of subgrades and aggregate bases. Considerable advances were made after 1996 which led to the development of a large Mr database for better interpretation of resilient properties for mechanistic pavement design. One of these studies tested the Mr values for LTPP sections across the United States (6). In other advancements, various studies determined parameters which affect the measurement of Mr. One such study determined that soil suction was an important factor in measuring the Mr. Soil suction is not measured as part of the AASHTO T 307 or NCHRP 1-28A testing procedures. Another study suggested that modifications should be made to the stress state conditions when measuring Mr on unsaturated unbound materials (4).
Figure 2.1. Definition of resilient modulus (6).
The resilient modulus test using the repeated load triaxial test simulates traffic wheel loading on in-situ soils by applying repeated or cyclic loads on compacted soil specimens. The stress levels applied to the soil specimens are dependent on the location of the material within the pavement structure. A confining pressure is also applied to the specimen that represents the overburden lateral pressure at a specific location in the subgrade. The axial deviatoric stress consists of two components, the cyclic stress, and a constant stress. The constant stress is typically equivalent to 10% of the total axial deviatoric stress. The test procedure requires a compacted soil specimen using impact compaction methods. The specimen is then transferred into the triaxial chamber and the confining pressure is applied. The test is initiated by applying various levels of deviatoric stresses. Multiple confining pressures and deviatoric stresses are used during the testing process. The resilient modulus values are determined at each combination of confining pressure and deviatoric stress. The design resilient modulus value is established by determining the Mr value at the appropriate confining pressure and deviatoric stress level corresponding to the location of the materials within the pavement structure. Various versions of the repeated load triaxial test have been used to measure the resilient modulus for mechanistic-empirical (ME) based pavement design procedures, including: AASHTO T 274, T 292, T 294, and T 307. All of these test methods differ from each other in one or more of the following aspects: specimen preparation, conditioning, seating stress, testing sequences, and deformation measurements inside/outside of the triaxial cell.

Characterization of Unbound Materials for Mechanistic-Empirical Pavement Design Guide (MEPDG)
22
Table 2.3 summarizes the chronology of the AASHTO resilient modulus test procedures. AASHTO adopted test procedure T307 which is similar to the test procedure used in the Long Term Pavement Performance (LTPP) program.
Table 2.3. Chronology of AASHTO Test Procedures for Mr Measurements (6).
Test Procedure Details
AASHTO T 274-1982
Earliest AASHTO test procedure; No details on the sensitivities of displacement measurement devices were given; Criticisms on test procedure, test duration (5 hours long test) and probable failures of soil sample during conditioning phase; testing stresses are too severe.
AASHTO T 292-1991
AASHTO procedure introduced in 1991; Internal measurement systems are recommended; Testing sequence is criticized owing to the possibility of stiffening effects of cohesive soils.
AASHTO T 294-1992
AASHTO modified the T 292 procedure with different sets of confining and deviatoric stresses and their sequence; Internal measurement system is followed; 2-parameter regression models (bulk stress for granular and deviatoric stress model for cohesive soils) to analyze test results; Criticism on the analyses models.
Strategic Highway Research Program P-46-1996
Procedural steps of P-46 are similar to T 294 procedure of 1992; External measurement system was allowed for displacement measurement; Soil specimen preparation methods are different from those used in T 292.
AASHTO T 307-1999
T 307-1999 was evolved from P-46 procedure; recommends the use of external displacement measurement system. Different procedures are followed for both cohesive and granular soil specimen preparation.
NCHRP 1-28 A: Harmonized Method-2004 (RRD 285)
This recent method recommends a different set of stresses for testing. Also, a new 3-parameter model is recommended for analyzing the resilient properties. The use of internal measurement system is recommended in this method.
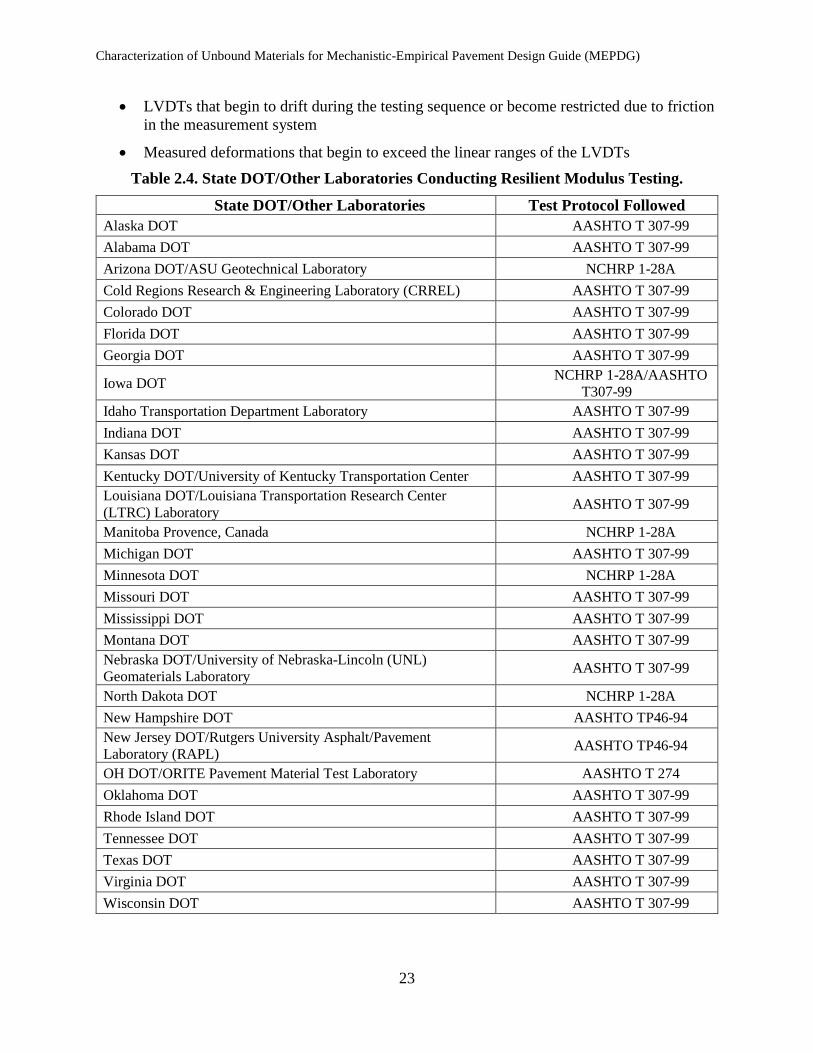
A recent review of 30 state DOTs and other agencies specifications indicated that 22 out the 30 are currently using AASHTO T 307 test method for measuring the Mr of unbound materials (4). Table 2.4 lists the resilient modulus test procedures being used by different agencies (4). The overall satisfaction of those agencies regarding the use of resilient modulus for ME-based pavement design was found to be low due to constant modifications of the test procedures, measurement difficulties, and design-related issues. The resilient modulus test data generated from the triaxial test should undergo data anomaly checks to identify if issues with the data exist. It is essential to ensure that the good quality data without errors are used before making any assessment on the Mr results. Possible problems that could affect the Mr test data are listed below (7):
• Different condition sequences or different stress application sequences used in the test program
• Leaks occurring in the membrane during the test
• Different stress states used in the test program than required by the test protocol
• Test specimens that begin to fail or exhibit disturbance at the higher stress states
• LVDT clamps that begin to move or move suddenly because of vibrations during the loading sequence
Characterization of Unbound Materials for Mechanistic-Empirical Pavement Design Guide (MEPDG)
23
• LVDTs that begin to drift during the testing sequence or become restricted due to friction in the measurement system
• Measured deformations that begin to exceed the linear ranges of the LVDTs Table 2.4. State DOT/Other Laboratories Conducting Resilient Modulus Testing.
State DOT/Other Laboratories Test Protocol Followed Alaska DOT AASHTO T 307-99 Alabama DOT AASHTO T 307-99 Arizona DOT/ASU Geotechnical Laboratory NCHRP 1-28A Cold Regions Research & Engineering Laboratory (CRREL) AASHTO T 307-99 Colorado DOT AASHTO T 307-99 Florida DOT AASHTO T 307-99 Georgia DOT AASHTO T 307-99
Iowa DOT NCHRP 1-28A/AASHTO T307-99
Idaho Transportation Department Laboratory AASHTO T 307-99 Indiana DOT AASHTO T 307-99 Kansas DOT AASHTO T 307-99 Kentucky DOT/University of Kentucky Transportation Center AASHTO T 307-99 Louisiana DOT/Louisiana Transportation Research Center (LTRC) Laboratory AASHTO T 307-99
Manitoba Provence, Canada NCHRP 1-28A Michigan DOT AASHTO T 307-99 Minnesota DOT NCHRP 1-28A Missouri DOT AASHTO T 307-99 Mississippi DOT AASHTO T 307-99 Montana DOT AASHTO T 307-99 Nebraska DOT/University of Nebraska-Lincoln (UNL) Geomaterials Laboratory AASHTO T 307-99
North Dakota DOT NCHRP 1-28A New Hampshire DOT AASHTO TP46-94 New Jersey DOT/Rutgers University Asphalt/Pavement Laboratory (RAPL) AASHTO TP46-94
OH DOT/ORITE Pavement Material Test Laboratory AASHTO T 274 Oklahoma DOT AASHTO T 307-99 Rhode Island DOT AASHTO T 307-99 Tennessee DOT AASHTO T 307-99 Texas DOT AASHTO T 307-99 Virginia DOT AASHTO T 307-99 Wisconsin DOT AASHTO T 307-99

Characterization of Unbound Materials for Mechanistic-Empirical Pavement Design Guide (MEPDG)
24
The following provides a summary of the more important findings relative to determining the precision and bias of the resilient modulus test methods. These findings were extracted from the FHWA report on the precision and bias of the resilient modulus test (4).
• There are several test systems available on the market today. The so-called high-end equipment (MTS, Interlaken and Instron) is about double the cost of the lower-end equipment (GCTS, GeoComp and IBC). This statement does not imply the high-end equipment is twice as accurate as the lower-end equipment. Few studies have focused on determining if there is a bias between these different systems, as well as defining the precision of the test system.
• The end effects for off-specimen LVDTs were obvious and significantly increased the variability in the test results of triplicate samples, in comparison to on-specimen LVDTs. Different studies, however, have reported opposite results in comparing the resilient modulus values between on-specimen and off-specimen displacement measurements for calculating resilient modulus.
• It was found that all soils exhibited a decrease in resilient modulus with an increase in saturation, but the magnitude of the decrease in resilient modulus was found to depend on the soil type. It was observed and reported a 3 to 5 percent increase in moisture content from optimum conditions can result in a 50 to 70 percent reduction in resilient modulus. The drying of the test specimens can also result in a significant increase in resilient modulus, in some cases ten-fold. Thus, moisture content and dry density are important in measuring the resilient modulus.
• The studies reviewed indicated that the resilient modulus values were impacted by moisture content, soil suction, Atterberg limits, gradation, source lithology, stress-strain levels, degree of saturation, seasonal variation, aggregate angularity, and surface texture.
2.3. Correlations for Estimating Resilient Modulus Numerous Mr correlation equations have been developed over the years (8). Most of these correlations are regression-based equations developed by comparing the Mr test results from the repeated load triaxial (RLT) to the less expensive and more routine test results such as R-value (R), CBR, unconfined compressive (UC) strength, dynamic cone penetrometer test, physical properties, etc. An extensive literature review was conducted and showed that most of the correlation equations were developed from relatively small sample sets and often for region-specific material types (9). Accordingly, it was recommended to further assess and verify the suitability and reliability of the regression analysis before the use of any of the correlation equations. Two different types of correlations have been developed: direct and indirect.
• Direct correlations consist of developing a relationship between the resilient modulus and various soil properties and in-situ related parameters. These correlations are usually developed by using some type of statistical regression between the test data and resilient modulus. Two types of direct correlations are typically developed. The first method develops a direct correlation between the resilient modulus and various soil properties. The second correlates the moduli with in-situ parameters.
• The indirect method develops correlations by formulating an equation that accounts for confining or deviatoric or both stress forms. Usually these correlations contain model constant parameters. Some of these models can have two, three, or four parameter correlations that account for the different stress states.

Characterization of Unbound Materials for Mechanistic-Empirical Pavement Design Guide (MEPDG)
25
Puppala presented a detailed summary of the different types of correlations that have been developed (6). The summary details various correlation equations developed for both direct and indirect correlations. The following lists some of the correlations that have been developed. Yau and Von Quintus, 2001; Crushed Stone Materials, LTPP Material Code 303:
(3)
Where; LL: liquid Limit
Wopt: optimum water content γopt: maximum dry unit weight at optimum water content
P3/8: percent passing the 3/8 inch sieve, percent P40: percent passing the #40 sieve, percent
Number of points: 853 Mean squared error: 1699.6 psi Se = 41.23; Sy = 87.42; Se/Sy = 0.4716 Yau and Von Quintus, 2001; Sand, LTPP Material Code 306:
(4)
Where; PI: plasticity Index
Number of Points: 2,323 Mean squared error: 1883.9 Se = 43.40; Sy = 80.19; Se/Sy = 0.5413
( ) ( ) ( ) ( )[ ]
( )optopt
optoptopt
WLL
a
oct
PxWLLP
a
aoptoptr
p
p
pWLLPM
γ
γγ
τ
θ
γ
0005.00014.000822.01720.1
104.20006.0038.00008.00016.02159.2
8/3
1
*
*0001.00371.00088.00084.07632.0
40
27
8/3
+−−−
+−−+−
+
−−++=
−
( ) ( ) ( )
( )PILLP
a
octP
xPILLP
a
aopt
r
pp
pP
xPILLPM
opt 0798.00185.00029.04508.0102.70325.00095.00053.01148.1
40
27
8/3
8/340
27
8/3
1*
*108.10737.00219.00097.02786.0
+−+−
++−−
−
+
+−++−=
−
τθ
γ
γ

Characterization of Unbound Materials for Mechanistic-Empirical Pavement Design Guide (MEPDG)
26
Yau and Von Quintus, 2001; Coarse-Grained Gravelly Soils:
(5)
Where; Ws: water content of test specimen %Clay: percentage clay or material passing the 0.0075 sieve
Number of Points: 957 Mean squared error: 301.3 Se = 17.36; Sy = 26.81; Se/Sy = 0.6474 Yau and Von Quintus, 2001; Fine-Grained Silty Soils:
(6)
Where; %Silt: percentage of silt fines
Number of Points: 464 Mean squared error: 193.0 Se = 13.89; Sy = 24.71; Se/Sy = 0.5622 Yau and Von Quintus, 2001; Fine-Grained Clayey Soils:
(7)
Where; P4: percentage of material passing the #4 sieve. P200: percentage of material passing the #200 sieve. γs: dry unit weight of test specimen.
Number of Points: 1,484 Mean squared error: 557.9 Se = 23.62; Sy = 29.22; Se/Sy = 0.8082
( ) ( )[ ]( )
( )
−+−−+++−
−−−+−
+
−+=
opt
ssoptopt
opt
WWWLLSiltPP
a
oct
WLLPPP
a
asr
p
p
pWClayM
6055.00025.00026.00672.00535.0%0251.00303.00288.04258.1
0049.00030.00027.00095.00073.05193.0
2004
200404
1
*
*0437.0%0106.03577.1
γγτ
θ
( ) ( ) ( ) ( )[ ]( )( )
( )( )s
s
WLLClayP
a
oct
WPILLClayP
a
asr
p
p
pWLLClayPM
2353.00626.0%0435.00302.05167.1
0093.00072.00050.0%0019.00010.03311.08/3
8/3
8/3
1
*
*0231.00053.0%0124.00051.03429.1
−++−
+−−−+
+
−++−=
τ
θ
( ) ( ) ( )[ ]( ) ( )( )sWPISilt
a
oct
PI
a
asr
pp
pWPIClayM1399.00849.0%0047.02218.00286.05097.0
1*
*37.00279.0%0177.00480.1−++−−
+
−++=
τθ

Characterization of Unbound Materials for Mechanistic-Empirical Pavement Design Guide (MEPDG)
27
Drum, et al., 2008:
(8)
Where; A: initial tangent modulus, psi UC: unconfined compressive strength, psi S: degree of saturation, percent Coefficient of Determination, R2 = 0.83. Lee, et al., 1997:
Mr = 695.4(S@1%) – 5.93(S@1%)2 (9)
Where; S@1%: stress at 1.0 percent strain in the unconfined compressive strength test. Coefficient of Determination, R2 = 0.97. Hossain and Kim, 2014, Static Compaction:
(10) Coefficient of Determination, R2 = 0.64.
(11) Coefficient of Determination, R2 = 0.86. Hossain and Kim, 2014, Impact Compaction (Proctor Hammer):
(12) Coefficient of Determination, R2 = 0.73.
(13) Coefficient of Determination, R2 = 0.91.
Mr = 657(S@1%) – 6.75(S@1%)2 (14) Coefficient of Determination, R2 = 0.97. 2.4. Implementation and Use of Resilient Modulus Several State Agencies have implemented or are in the process of implementing the MEPDG. This section presents the efforts related to developing Mr input databases for each State. Table 2.5 summarizes the outcome from selected agencies regarding resilient modulus and other properties of unbound layers. The important observation from Table 2.5 and from the design manual of selected agencies is that almost no agency performs repeated load triaxial resilient modulus tests for measuring Mr. The Mr is predominantly estimated using a library of values and/or through a regression equation related to other properties or test results.
( ) ( ) ( )
( ) ( )20015.025.0
216.045.0188.0100052.08.45
PS
PIUCa
M sr
−−
+++
+= γ
( )UCM r 1426082 +=
( ) ( ) ( )200(9.471.1937.992.7884 PPIUCM r −++=
( )UCM r 1434283+=
( ) ( ) ( )200(8.277.1731.956113 PPIUCM r −++=

Characterization of Unbound Materials for Mechanistic-Empirical Pavement Design Guide (MEPDG)
28
Most agencies east of the Mississippi River use CBR for estimating the design Mr, while agencies west of the Mississippi use R-value. The regression equations for estimating Mr from the R-value vary by agency, but only two regression equations are typically used for estimating Mr from CBR. The R-value regression equations are listed by agency in the following section, while the two regression equations based on CBR are; Mr =1500*CBR and Mr = 2555(CBR)0.64.
Table 2.5. Methods used to Estimate Design Resilient Modulus for Selected Agencies.
State DOT Test Procedure Mr Correlated with and/or Determined Arizona NCHRP 1-28A R-value and a library of Mr values. Colorado AASHTO T 307-99 R-value and a library of Mr values.
Florida AASHTO T 307-99 LBR-value, backcalculated from deflection basins, and a library of Mr Values.
Georgia AASHTO T 307-99 Soil Support, Physical properties, and a library of Mr values.
Idaho AASHTO T 307-99 R-value and a library of Mr values.
Michigan AASHTO T 307-99 Library of Mr values and backcalculated from deflection basins.
Missouri AASHTO T 307-99 Regression equations to calculate k1, k2, and
k3 from soil physical properties; similar to FHWA regression equations.
Mississippi AASHTO T 307-99 CBR and a library of Mr values.
Montana AASHTO T 307-99 Library of Mr values and backcalculated from deflection basins.
Pennsylvania AASHTO T 307-99 Unconfined compressive strength and a library of values
Tennessee AASHTO T 307-99 Index of soil properties. Texas AASHTO T 307-99 Texas Triaxial Classification Value Virginia AASHTO T 307-99 Unconfined compressive strength
Wisconsin AASHTO T 307-99 Regression equations to calculate k1, k2, and
k3 from soil physical properties; similar to FHWA regression equations.
Wyoming AASHTO T 307-99 R-value and a library of Mr values. 2.4.1. Federal Highway Administration (FHWA) Two FHWA sponsored studies were reviewed as part of this literature review and both are briefly discussed in the following paragraphs.
1. FHWA sponsored a study in 2001 to investigate the resilient modulus test results stored in the LTPP database. This study had two major goals: evaluate the accuracy of the test data and identify any anomalies and their possible causes, and to develop correlations between the regression coefficients of equation 2 and the materials physical properties that are stored in the LTPP database. A regression equation was derived for each major soil classification and the different aggregate base classification defined in the LTPP database (7). Equation 3 through equation 7 in the previous section are examples of the relationships generated from that study. An important observation made by Yau and Von Quintus from this work was that the standard error of the regression equations was high for many of the

Characterization of Unbound Materials for Mechanistic-Empirical Pavement Design Guide (MEPDG)
29
materials, so they recommended that laboratory repeated load triaxial resilient modulus tests be performed to actually measure the regression coefficients.
2. FHWA sponsored a more recent study related to resilient modulus and its use in the MEPDG procedure. This second study was focused on defining the precision and accuracy of the resilient modulus tests (4). One of the important outcomes from the second study was to recommend procedures to be used in accordance with the MEPDG to derive the design resilient modulus for a quasi-input level 1 value. The report documented the precision of the test and made recommendations for a specific test method to be followed. In addition, the procedure documented in the report for determining the design resilient modulus for aggregate base layers, as well as for subgrade soils will be addressed in Chapter 5.
2.4.2. Asphalt Institute The Asphalt Institute derived an equation to estimate Mr from the R-value test. The test data used in the derivation was from road tests conducted in San Diego, California (10). Equation 15 shows the original equation generated from that confined data set.
Mr = 772 + 369(R-value) (15) The Asphalt Institute used the same from of the regression equation but modified the coefficients from a larger data set, which is included in Table 2.2. That equation was included in as the regression equation based on R-value for input level 2. 2.4.3. Correlations Developed by State DOTs Colorado DOT The MEPDG implementation was completed in Colorado in 2013. The process included characterizing in service pavements and the needed properties in the MEPDG as well as the local calibration of the performance models. The unbound and subgrade Mr values were needed to characterize the in service pavements in the MEPDG. The Colorado DOT made a decision early on to use a strength test to estimate the resilient modulus in accordance with the MEPDG input level 2 approach. The strength test was the R-value for which the Colorado DOT had extensive experience and a historical database. The correlation developed by Colorado DOT for coarse and fine grained materials is shown below in Equation 16. Details of laboratory procedures for resilient modulus and R-values were not reported for this study (11).
Mr = 10 [((R-5)/11.29)+21.72]/6.24 (16) Yeh and Su (12) developed the following relationship for Colorado soils using resilient modulus data from testing conducted at confining pressure of 3 psi and deviator stress of 6 psi, as shown in equation 17. Analysis of the study results showed that the relationship needed to be further calibrated for soils having R values greater than 60.
Mr = 3500 + 125 (R) (17) FWD testing was performed to backcalculate layer moduli at in-situ moisture conditions. The backcalculated moduli was then transformed to an equivalent lab Mr at the optimum moisture content. The moduli at the optimum moisture content was determined using a multi-step process. The field measured Mr at in-situ moisture content was converted to a laboratory Mr at in-situ

Characterization of Unbound Materials for Mechanistic-Empirical Pavement Design Guide (MEPDG)
30
moisture conditions using C-factors. The in-situ laboratory Mr was then converted to a laboratory Mr at optimum moisture content using an iterative process (13). For flexible pavements, the equivalent lab Mr was determined using the following equation:
Mrequivalent = ESG x C x Mr/Mr-opt (18) In addition to the equivalent laboratory Mr, the backcalculated moduli, c-value, Mr/Mr-opt ratio, corrected lab Mr-opt and mean Mr by soil type was summarized. A similar iterative process was used for concrete pavements with a comparison to the modulus of subgrade reaction. The backcalculated modulus of subgrade reaction, elastic modulus and mean Mr at optimum moisture content was summarized for all pavement sections. The optimum Mr was determined using the following equation:
Mr-opt = 60.754 × k-value (19) Resilient modulus testing using the repeated load triaxial test was not performed in Colorado during their implementation of the MEPDG because of their historical database. Georgia DOT Field testing was performed in Georgia as part of their MEPDG implementation project. FWD, DCP and cores were taken at various pavement sites. The pavement sections included both local sites and LTPP sites. The DCP testing was only performed at Georgia pavement sections. The DCP penetration rates were used to determine an estimate of in-place resilient modulus. These values were compared to the backcalculated Mr from the FWD deflection basin. It was found that there’re is a correlation between the backcalculated and DCP Mr values. The backcalculated Mr showed greater resilient modulus values compared to the DCP values except for sections with coarser particles or rock fragments. AASHTO T 307 or NCHRP 1-28A resilient modulus tests were not performed for any of the pavement sites. Resilient modulus tests were available from the LTPP database and used to develop GDOT’s material library. In addition, GDOT had Georgia Tech perform resilient modulus tests on a range of soils. The c-factors were determined to correct for the difference between laboratory and field-derived Mr values. A large difference was exhibited between the default c-factors reported in the MEPDG Manual of Practice and the ones developed based on the Georgia pavement sites. The laboratory resilient modulus, backcalculated resilient modulus, c-factor, water content and dry density were presented for all LTPP and Georgia specific sites (14). Idaho DOT As part of the MEPDG implementation process, Idaho is using input level 2 to determine the Mr for their design procedures. The laboratory resilient modulus test procedure was not an option due to its complexity, time requirements and expensive equipment. Two models were developed for input level 2 in accordance with the MEPDG. The first model consisted of developing a multiple regression to predict the R-value as a function of soil plasticity index and percent passing of the #200 sieve. The second model was a Mr model based on the estimated R-value. The R-value prediction model was developed using 8,233 data records ranging from 1953-2008 and represents all 25 soil classes in the USC system. The model form developed is presented in

Characterization of Unbound Materials for Mechanistic-Empirical Pavement Design Guide (MEPDG)
31
equation 19. This model is recommended when direct measurements of the R-value for unbound granular materials and subgrade soils is unavailable.
R-value = 10 (1.893-0.00159xp200-0.022xPI) (20) The second model was developed to determine the resilient modulus based on the R-value. First, the current Asphalt Institute (AI) method for determining Mr from the R-value was validated. The R-value prediction model presented above was used. The AI method values were verified using laboratory measured Mr from Indiana, Mississippi, Louisiana, Arizona and Ohio and consisted mostly of fine grained soils. Verification results showed a significant over-prediction of Mr for the data used in this study. A new model was developed to reduce the bias of the AI method. The model forms for both the AI method and the new Idaho method is presented below:
• AI Method (current MEPDG Default; refer to Table 2.2)
𝑀𝑀𝑀𝑀 = 1155 + 555(𝑅𝑅) (21)
• Idaho
𝑀𝑀𝑀𝑀 = 1004.4(𝑅𝑅)0.6412 (22)
It is recommended that this model should only be used for similar soil types used in the study which consisted mostly of fine grained soils. In addition to the input level 2 model development, typical input level 3 R-values were summarized for each soil type as well as liquid and plastic limit values (15). Michigan DOT Two studies to characterize unbound material in Michigan were performed. The first study outlined the importance of the Mr of the roadbed soil and how it affects pavement systems, while the second study focused on the backcalculation of Mr for unbound base and subbase materials. Both studies focused on developing reliable methods to determine the Mr of the roadbed soil for inputs in the Pavement-ME. The state of Michigan was divided into fifteen clusters based on the similar soil characteristics. Laboratory tests were performed to determine moisture content, grain size distribution, and Atterberg limits. Another aspect of the study was to determine the differences between laboratory tested Mr values and back-calculated Mr. Based on the analysis, it was concluded that the values between laboratory Mr and back-calculated Mr are almost equal if the stress boundaries used in the laboratory matched those of the FWD tests (16). This observation conflicts with the results from other studies regarding the c-factor defined by AASHO: the ratio of the laboratory-derived and field-derived moduli. Mississippi DOT Mississippi DOT has developed several predictive models to estimate resilient modulus of typical Mississippi soils from their soil index properties (17). The study compared various prediction models from other State agencies to Mississippi soils from the LTPP database. A similar study investigated the viability of using FWD data for deriving resilient modulus through empirical correlations (18). Mississippi DOT tested 34 subgrade soils, 13 granular base/subbase materials, and 16 stabilized soils for developing their pavement materials library for the MEPDG. The NCHRP 1-28A test

Characterization of Unbound Materials for Mechanistic-Empirical Pavement Design Guide (MEPDG)
32
method was used for all Mr testing. The report documents the valuable practical experience, lessons and observations that were gained during the testing and review of the data (19). Missouri DOT Missouri DOT performed resilient modulus testing in conjunction with the MEPDG implementation process. The focus of the study was to perform Mr testing on common Missouri subgrade soils and typical unbound material using the AASHTO T307 test method. A library of resilient modulus values were developed for granular base materials and subgrade soils. The experimental plan included 27 subgrade soils and five granular base materials commonly found in Missouri. This study also developed regression models to estimate k1, k2 and k3 coefficients using basic soil properties (20). Montana DOT Montana DOT compared over thirty different resilient modulus prediction models available in the literature and evaluated those with laboratory data for two soils sampled in Montana (9). This study discouraged the general use of such models without prior testing and verifying the reliability of the model estimates until additional studies suggest otherwise. Pennsylvania DOT The implementation process is currently ongoing in Pennsylvania. The unbound and subgrade layers Mr values were evaluated for various pavement sections across the state using the AASHTO T 307 testing procedure. The optimum moisture content and maximum dry density measurements were determined using the Pennsylvania Test Method (PTM) 106-Method B, Modified Proctor compaction effort. Unconfined compressive strength tests are also being performed but have yet to be completed. PennDOT intends to complete a regression analysis between the design resilient modulus and unconfined compressive strength so that the unconfined compressive strength can be used to determine the design Mr value. The regression equation has yet to be completed. PennDOT also uses the dynamic cone penetrometer (DCP) for pavement evaluations and in estimating the Mr of the unbound materials and soils. Equation 22 is used to calculate the Mr from the penetration rate measured with the DCP.
(23)
Where; DPI: penetration rate or index, mm/blow CDCP: adjustment factor for converting the elastic modulus to a laboratory resilient modulus
which is soil type and water content dependent. Utah DOT The implementation of the MEPDG in Utah was performed in 2009. The resilient modulus values were not directly available for most of the pavement sites selected for local calibration. The LTPP database was used to populate the necessary fields without performing additional laboratory testing. No lab test data were available for the UDOT pavement sites.
( )( )DCPr C
DPIM
64.0
12.12926.17
=

Characterization of Unbound Materials for Mechanistic-Empirical Pavement Design Guide (MEPDG)
33
The subgrade type and other soil parameters were established using the Natural Resource Conservation Survey Soil Survey Geographic database. These inputs were used to characterize the subgrade layers as Level 3 inputs (21). In addition to the implementation study, another study was performed to investigate the correlations between lab measured resilient modulus and the California Bearing Ratio (CBR) test for aggregate base materials. The AASHTO T307 test was used to determine the Mr of two aggregate base materials. Based on the result, the author concluded that the existing models do not satisfactorily predict Mr for the two aggregates tested and attributes these differences to the variations in properties between the materials used to develop the model and the materials used in Utah. The author also concluded that there is no correlation between the Mr and the CBR for the materials tested in this study (22). Wisconsin DOT Wisconsin DOT (WisDOT) funded a laboratory testing program to evaluate the physical and compaction properties of commonly found subgrade soils (23). The resilient modulus was measured using the AASHTO T307 test procedure. Initially, the results were not good when using the NCHRP 1-37A constitutive model. The results were split between fine and coarse-grained soil, which improved the model accuracy. Statistical correlations were developed to estimate k1, k2 and k3 coefficients from basic soil properties such as; percent passing of the #4, 40, 200 sieves, moisture content, optimum moisture content, dry unit weight, and maximum dry unit weight. Another WisDOT study conducted an experimental program to develop a resilient modulus predictive model for typical crushed aggregate base materials encountered in Wisconsin (24). The plan included 37 aggregate sources and a wide range of influencing variables, such as physical characteristics, material type, source lithilogy and regional factors, were evaluated for their effect on resilient modulus. WisDOT developed the relationship shown in Equation 24 based on lab testing data conducted on soils ranging from coarse aggregates (A-1) to clays (A-7-6).
Mr = 0.72 (e0.0521 x R – 1) (24) Wyoming DOT A study was performed to characterize representative local materials for unbound base and subgrade layers in Wyoming. Local Wyoming pavement sections and LTPP sections were used to develop a materials database for use in the implementation of the MEPDG. The tests which were performed include:
• FWD testing to backcalculate pavement layer moduli
• Dynamic cone penetrometer testing for subgrade Mr value, and
• Field measured data The FWD testing was performed to backcalculate in-situ pavement layer moduli using two different backcalculation programs. The DCP test was performed to estimate the California Bearing Ratio (CBR) and the elastic modulus of the soil. For each selected pavement section, the following data were determined: moisture density relationship, Atterberg limits, in-situ moisture content and density, R-Value, lab and backcalculated Mr, and C-factor.

Characterization of Unbound Materials for Mechanistic-Empirical Pavement Design Guide (MEPDG)
34
The results were also summarized by soil type to determine Level 3 inputs which can be used if field and lab testing cannot be performed. Some additional findings from the study include (11):
• There was a consistent relationship between optimum water content and maximum dry unit weight.
• There is a significant bias between the Mr for LTTP and Wyoming pavement sections.
• C-factor was only calculated for the Wyoming pavement sections.
• The R-values were also different between the Wyoming and LTPP pavement sections.
• Two relationships between R-value and Mr were derived, as shown in Equation 25 and Equation 26. Both regression equations had similar statistics and the standard error of the estimate. Wyoming DOT made a preliminary decision to select the simpler of the two – Equation 25.
𝑀𝑀𝑟𝑟 = 9713.9 + 61.56(R-value) (25)
𝑀𝑀𝑟𝑟 = 6644(𝑅𝑅 − 𝑣𝑣𝑣𝑣𝑣𝑣𝑣𝑣𝑣𝑣)0.1748 (26)

Characterization of Unbound Materials for Mechanistic-Empirical Pavement Design Guide (MEPDG)
35
MATERIAL COLLECTION This research evaluated different types of base, borrow, and subgrade materials from NDOT District 1 shown in Figure 3.1. The most common base material used by NDOT is Type 1 Class B. Six base materials were collected from different projects in District 1. Samples of the borrow materials used on the same contracts were also collected. Table 3.1 summarizes the information on the collected base and borrow materials.
Figure 3.1. NDOT districts boundaries.
District 3
District 2
District 1

Characterization of Unbound Materials for Mechanistic-Empirical Pavement Design Guide (MEPDG)
36
Table 3.1. Summary of Collected Base and Borrow Materials from NDOT District 1.
Contract County Pit Location Borrow Base (Type 1B) (bags) (bags)
3605 CLARK Sloan Commercial Pit - 20 3607 Esmeralda Pit ES 03-08 10 20 3546 CLARK Apex Pit 10 20 3597 CLARK Lhoist Pit 10 20 3613 CLARK Material Pit 69-01 10 20 3583 CLARK LVP Lone Mountain Pit 10 20
Soils map developed by researchers at Arizona State University was used in to identify the various types of subgrade materials throughout District 1. The types of subgrade materials available under the most mileage of roads in District 1 were identified. Based on this approach, 12 locations were identified as shown in Figure 3.2. The type of existing subgrade with depth was identified at each location as summarized in Table 3.2. Based on the ASU map, the majority of possible subgrade types in NDOT District 1 are; A-1-a, A-1-b, A-2-4 and A-4. In order to cover all four subgrade types, six different locations were selected for sampling at the locations summarized in Table 3.2 and shown in Figure 3.3. The subgrade materials were labeled by the sample number as shown in Table 3.3 along with the amount of materials obtained from each location.

Characterization of Unbound Materials for Mechanistic-Empirical Pavement Design Guide (MEPDG)
37
Figure 3.2. Locations considered to identify the subgrade materials.

Characterization of Unbound Materials for Mechanistic-Empirical Pavement Design Guide (MEPDG)
38
Table 3.2. Summary of Soil Types in the Selected Locations.
Site Thickness (inch) Soil Classification Latitude (°) Longitude (°)
1 2.0 A-4 35.8256 115.2970 5.9 A-4
2 9.1 A-2-4 36.0657 115.1806 3 2.0 A-2-4 36.7653 114.3457
16.1 A-4 7.9 A-2-4
4 1.2 A-4 38.1917 116.3685 19.7 A-6 20.1 A-2-6 18.9 A-1-a
5 5.1 A-1-a 37.7967 117.2461 54.7 A-1-a
6 9.1 A-2-4 37.4604 115.5078 7 2.0 A-4 37.6185 114.8291
18.1 A-4 8 5.9 A-1-b 37.1625 116.9055
53.9 A-1-b 9 7.9 A-1-a 36.7103 116.6061
52.0 A-1-a 10 2.0 A-4 36.9587 114.9719
5.1 A-2-4 11 3.9 A-1-b 37.6653 115.1998
7.1 A-1-b 26.8 A-1-b
12 7.9 A-5 35.3294 114.8962 18.1 A-2-4 33.9 A-1-b
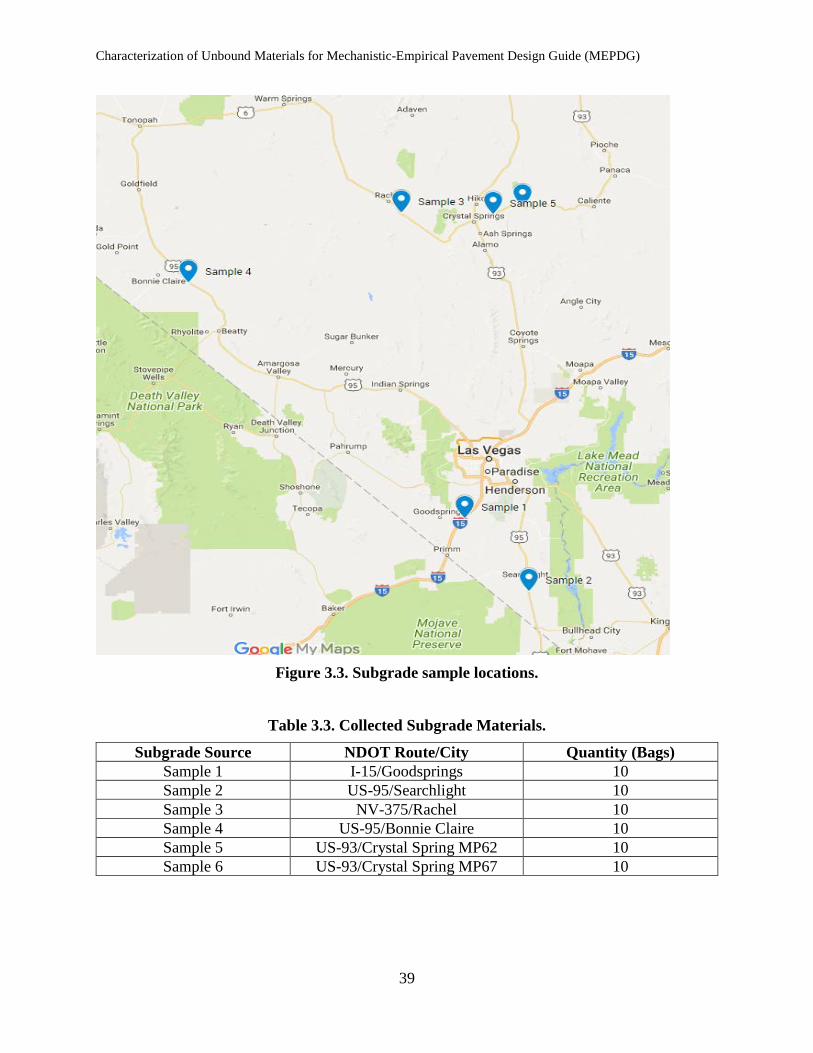
Characterization of Unbound Materials for Mechanistic-Empirical Pavement Design Guide (MEPDG)
39
Figure 3.3. Subgrade sample locations.
Table 3.3. Collected Subgrade Materials.
Subgrade Source NDOT Route/City Quantity (Bags) Sample 1 I-15/Goodsprings 10 Sample 2 US-95/Searchlight 10 Sample 3 NV-375/Rachel 10 Sample 4 US-95/Bonnie Claire 10 Sample 5 US-93/Crystal Spring MP62 10 Sample 6 US-93/Crystal Spring MP67 10

Characterization of Unbound Materials for Mechanistic-Empirical Pavement Design Guide (MEPDG)
40
LABORATORY TESTING This chapter presents the laboratory testing of the base, borrow, and subgrade materials that were sampled from NDOT District 1. The materials were subjected to five groups of laboratory testing: Soil Classification, Moisture-density Relationship, Repeated Load Triaxial Resilient Modulus, Unconfined Compressive Strength, and Resistance Value “R-value”. The following sections briefly describe the test methods and presents the data generated from each testing group. 4.1. Soil Classification Testing The selected materials were classified using particle size analysis and Atterberg limits following both AASHTO and USCS systems which are widely used in practice. The particle size analysis for the aggregate and soil materials was conducted in accordance with NDOT test method Nev.T206 and ASTM D421 and D422 respectively. NDOT test methods Nev. T 210J, T 211J, and T 212J were used to determine the Liquid Limit (LL), Plastic Limit (PL), and Plasticity Index (PI) of the selected materials, respectively. The Materials Division Testing Manual for the NDOT test methods can be found online at (last accessed on February 2018): https://www.nevadadot.com/doing-business/about-ndot/ndot-divisions/operations/materials-section/materials-test-manual. 4.1.1. Particle Size Analysis of Base, Borrow, and Subgrade Materials Aggregate from base and borrow materials were split into the sample size around 3000g and dried until to a constant weight at a temperature not exceeding 110°C. The dry aggregate was washed over sieve #10 and sieve #200. Retained materials on sieve #10, sieve #200, and washing vessel were transferred into a pan, dried at 110°C, and sieved through a set of sieves in a mechanical sieve shaker. Results of sieve analysis are summarized in Table 4.1 and Figure 4.1 for base materials and in Table 4.2 and Figure 4.2 for borrow materials. All base materials satisfied the NDOT specifications for Type 1 Class B aggregate type.
Materials from subgrade samples were split into the required sample size and dried at 60°C. The dry material was pulverized by using a rubber head hammer. Washing was performed on sieve #10 and poured through sieve #200 until clear water appears. Retained materials on sieve #10 and sieve #200 were carefully transferred in to a pan and dried at a temperature of 60°C. The dry material was pulverized again and sieve analysis was done in a mechanical sieve shaker. The sieve analysis results for the subgrade are summarized in Table 4.3 and Figure 4.3.

Characterization of Unbound Materials for Mechanistic-Empirical Pavement Design Guide (MEPDG)
41
Table 4.1. Summary of Sieve Analysis for Base Materials.
Size / mm % Passing
NDOT Spec Contract No. 3546 3583 3597 3605 3613 3607
25.0 mm (1'') 80-100 100 100 100 100 100 99.3 19.0 mm (3/4") 96.8 98.1 97.7 90.2 88.9 92.7 12.5 mm (1/2") 76.4 86.7 83.9 66.3 67.8 68.7 9.5 mm (3/8") 62.3 76.3 69.4 54.1 57.6 56.1
4.75 mm (No. 4) 30-65 40.8 45.6 43.4 35.3 38.6 45.4 2.36 mm (No. 8) 27.5 31.2 27.2 25.1 27.9 32.1 2.00 mm (No. 10) 25.2 29.1 24.7 23.3 26.1 28.9 1.18 mm (No. 16) 15-40 19.5 24.4 18.8 19.0 21.6 22.8 0.6 mm (No. 30) 14.9 20.4 14.1 15.0 18.3 17.8
0.425 mm (No. 40) 13.3 19.3 12.6 13.5 17.2 16.0 0.3 mm (No. 50) 12.0 17.0 11.4 12.1 15.8 14.5
0.15 mm (No. 100) 10.3 12.4 9.7 9.9 10.4 12.4 0.075 mm (No. 200) 2-12 8.8 8.7 8.3 7.7 5.3 10.0
Figure 4.1. Gradation curves for base materials.
0
10
20
30
40
50
60
70
80
90
100
0.01 0.1 1 10 100
Perc
enta
ge P
assi
ng (%
)
Particle Size (mm)
3546 3583 3597 3605 3613 3607

Characterization of Unbound Materials for Mechanistic-Empirical Pavement Design Guide (MEPDG)
42
Table 4.2. Summary of Sieve Analysis for Borrow Materials.
Size / mm % Passing
NDOT Spec Contract No. 3546 3583 3597 3613 3607
75 mm (3") 100 100 100 100 100 100 50 mm (2") 100 100 100 100 100
37.5 mm (1.5") 100 100 100 97.4 100 25.0 mm (1'') 100 99.1 97.7 89.9 98.0
19.0 mm (3/4") 100 95.5 96.0 85.3 94.5 12.5 mm (1/2") 100 92.9 90.2 76.8 89.9 9.5 mm (3/8") 99.9 91.1 85.6 69.8 86.2
4.75 mm (No. 4) 79.9 88.1 71.7 53.3 75.9 2.36 mm (No. 8) 48.6 86.7 56.7 40.8 65.3 2.00 mm (No. 10) 43.0 86.4 53.3 38.1 62.6 1.18 mm (No. 16) 28.6 85.6 42.1 32.4 54.0 0.6 mm (No. 30) 18.4 84.6 32.4 27.9 43.0
0.425 mm (No. 40) 15.4 84.2 28.7 26.3 37.6 0.3 mm (No. 50) 13.3 83.5 25.7 24.0 32.0
0.15 mm (No. 100) 11.4 80.6 20.9 14.3 23.7 0.075 mm (No. 200) 10.5 66.9 16.4 7.3 16.4
Figure 4.2. Gradation curves for borrow materials.
0
10
20
30
40
50
60
70
80
90
100
0.01 0.1 1 10 100
Perc
enta
ge P
assi
ng (%
)
Particle Size (mm)
3546 3583 3597 3607 3613

Characterization of Unbound Materials for Mechanistic-Empirical Pavement Design Guide (MEPDG)
43
Table 4.3. Summary of Sieve Analysis for Subgrade Materials.
Size / mm
% Passing Sample Source
I-15/ Goodspring
US-95/ Searchlight
NV-375/
Rachel
US-95/ Bonnie Claire
US-93/ Crystal Spring MP62
US-93/ Crystal Spring MP67
50.0 mm (2") 97.5 100 100 100 100 100 25.0 mm (1'') 83.5 96.7 87.5 98.8 100 100 9.5 mm (3/8") 57.2 92.7 52.2 95.4 99.3 97.2
4.75 mm (No. 4) 43.4 87.8 33.5 92 95.6 89.3 2.00 mm (No. 10) 34.4 68.7 23.2 84.3 81.4 77.2 0.425 mm (No. 40) 28 43.9 15.2 37.6 44.5 52.6 0.3 mm (No. 50) 26.6 39.3 13.4 25.2 37.1 46.7
0.15 mm (No. 100) 22.6 31.5 9.6 11.7 25.5 35.7 0.075 mm (No. 200) 14.6 23.9 5.4 5.5 18.1 26
Figure 4.3. Gradation curves for subgrade materials.
0
10
20
30
40
50
60
70
80
90
100
0.01 0.1 1 10 100
Perc
enta
ge P
assi
ng (%
)
Particle Size (mm)
I-15/Goodsprings US-95/Searchlight NV-375/Rachel
US-95/Bonnie Claire US-93/Crystal Spring MP62 US-93/Crystal Spring MP67

Characterization of Unbound Materials for Mechanistic-Empirical Pavement Design Guide (MEPDG)
44
4.1.2. Atterberg Limits Liquid limit and plastic limit are often referred to as “Atterberg Limits.” Based on its moisture content, soil can be in the state of liquid, plastic, semi-solid, or solid. Liquid limit is the moisture content at which the soil transforms from plastic to liquid. Plastic limit is the moisture content at which the soil transforms from semi-solid to plastic. Liquid limit and plastic limit tests were conducted according to NDOT test method Nev. T 210J and T 211J, respectively. The plasticity index was then calculated as the numerical difference between the liquid limit and the plastic limit of the soil following NDOT test method Nev. T 212J. A representative sample with minimum weight of 150g was obtained from passing sieve #40. Moisture was added and mixed until a uniform color is achieved. For the liquid limit test, the Casagrande apparatus was used to determine the number of blows to close the 13mm groove. The moisture content was changed in order to obtain three sets of number of blows in the range of; 25-35, 20-30, and 15-25. Around 8 grams of soil from the 25-35 was used for the plastic limit test. The sample was divided into 1.5-2 g portion and rolled on a glass plate until it forms a 3mm thread. This process was continued until the thread crumbles at which the moisture content was obtained. Figure 4.4 shows the apparatus and tools used for the liquid limit and plastic limit tests.
Figure 4.4. Atterberg limits test apparatus and tools. The moisture content of the sample which gives 25 blows to close the groove by 13 mm is considered as the liquid limit. All base materials were classified as non-plastic indicating that the plastic limit was not defined. Figure 4.5 shows at typical liquid limit plot for subgrade. The summary of the Atterberg limits for the borrow and subgrade materials are shown in Table 4.4 and Table 4.5, respectively.

Characterization of Unbound Materials for Mechanistic-Empirical Pavement Design Guide (MEPDG)
45
Figure 4.5. Liquid limit test results for subgrade (I-15/Goodsprings).
Table 4.4. Summary of Atterberg Limits for Borrow Materials.
Contract No. Liquid Limit Plastic Limit Plasticity Index 3546 16.5 14.5 2.0 3583 23.5 18.8 4.7 3597 22.2 18.9 3.3 3607 23.2 23.1 0.1 3613 N/A NP 0
Table 4.5. Summary of Atterberg Limits for Subgrade Materials.
Soil Source Liquid Limit (%)
Plastic Limit (%)
Plasticity Index
I-15/Goodsprings 18.4 16.9 1.5 US-95/Searchlight N/A NP 0
NV-375/Rachel 30.9 26.6 4.3 US-95/Bonnie Claire 21.1 20.1 1
US-93/Crystal Spring MP62 19.6 17.7 1.9 US-93/Crystal Spring MP67 22.2 17.8 4.5
4.1.3. Soil Classification The classifications of the subgrade materials were done according to AASHTO and USCS methods. Liquid limit, plasticity index, and particle size distribution were used for the classification process. The AASHTO classification method (AASHTO M 145) is presented in
y = -0.1477x + 22.154R² = 0.9992
17.80
18.00
18.20
18.40
18.60
18.80
19.00
19.20
19.40
19.60
19.80
10 100
Moi
stur
e C
onte
nt (%
)
Number of Blows

Characterization of Unbound Materials for Mechanistic-Empirical Pavement Design Guide (MEPDG)
46
Table 4.6 and Table 4.7 summarizes the AASHTO classification of the subgrade materials. The USCS classification method (ASTM -2487) is presented in Table 4.8 and Table 4.7 summarizes the UCS classification of the subgrade materials.
Table 4.6. AASHTO Soil Classification Method.
Table 4.7. Classification of Subgrade Materials with AASHTO and UCS Methods.
Classification Method
I-15/ Goodspring
US-95/ Searchlight
NV-375/ Rachel
US-95/ Bonnie Claire
US-93/ Crystal Spring MP62
US-93/ Crystal Spring MP67
AASTHO A-1-a A-1-b A-1-a A-1-b A-1-b A-2-4 USCS GM SM GP-GM SW-SM SM SC

Characterization of Unbound Materials for Mechanistic-Empirical Pavement Design Guide (MEPDG)
47
Table 4.8. Unified Soil Classification Method.
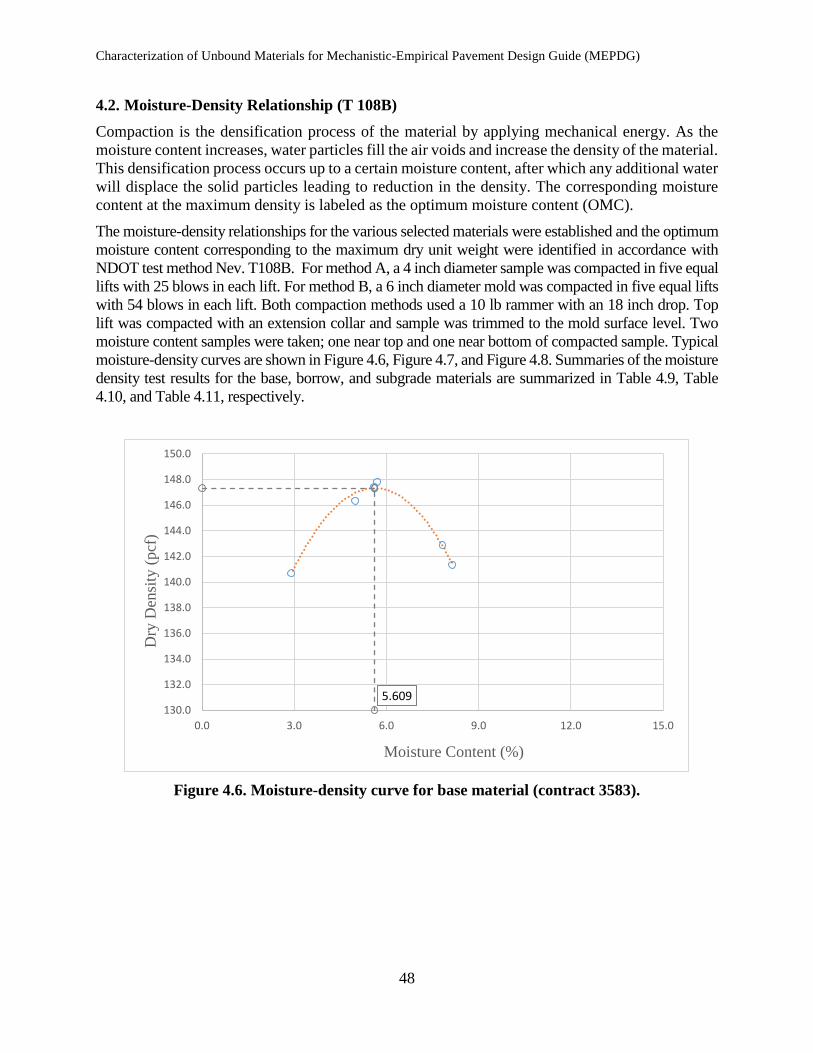
Characterization of Unbound Materials for Mechanistic-Empirical Pavement Design Guide (MEPDG)
48
4.2. Moisture-Density Relationship (T 108B) Compaction is the densification process of the material by applying mechanical energy. As the moisture content increases, water particles fill the air voids and increase the density of the material. This densification process occurs up to a certain moisture content, after which any additional water will displace the solid particles leading to reduction in the density. The corresponding moisture content at the maximum density is labeled as the optimum moisture content (OMC). The moisture-density relationships for the various selected materials were established and the optimum moisture content corresponding to the maximum dry unit weight were identified in accordance with NDOT test method Nev. T108B. For method A, a 4 inch diameter sample was compacted in five equal lifts with 25 blows in each lift. For method B, a 6 inch diameter mold was compacted in five equal lifts with 54 blows in each lift. Both compaction methods used a 10 lb rammer with an 18 inch drop. Top lift was compacted with an extension collar and sample was trimmed to the mold surface level. Two moisture content samples were taken; one near top and one near bottom of compacted sample. Typical moisture-density curves are shown in Figure 4.6, Figure 4.7, and Figure 4.8. Summaries of the moisture density test results for the base, borrow, and subgrade materials are summarized in Table 4.9, Table 4.10, and Table 4.11, respectively.
Figure 4.6. Moisture-density curve for base material (contract 3583).
5.609130.0
132.0
134.0
136.0
138.0
140.0
142.0
144.0
146.0
148.0
150.0
0.0 3.0 6.0 9.0 12.0 15.0
Dry
Den
sity
(pcf
)
Moisture Content (%)

Characterization of Unbound Materials for Mechanistic-Empirical Pavement Design Guide (MEPDG)
49
Figure 4.7. Moisture-density curve for borrow materials (contract 3597).
Figure 4.8. Moisture-density curve for subgrade materials (US-93/Bonnie Claire).
6.239120.0
122.0
124.0
126.0
128.0
130.0
132.0
134.0
136.0
138.0
140.0
0.0 3.0 6.0 9.0 12.0 15.0
Dry
Den
sity
(pcf
)
Moisture Content (%)
9.408115.0
117.0
119.0
121.0
123.0
125.0
127.0
129.0
131.0
133.0
135.0
0.0 3.0 6.0 9.0 12.0 15.0
Dry
Den
sity
(pcf
)
Moisture Content (%)

Characterization of Unbound Materials for Mechanistic-Empirical Pavement Design Guide (MEPDG)
50
Table 4.9. Summary of Moisture-Density Test Results for Base Materials. Contract No. Max Dry Density (pcf) OMC (%)
3546 144.7 5.0 3583 147.3 5.6 3597 143.0 3.9 3605 147.5 5.0 3607 135.8 6.7 3613 141.6 3.5
Table 4.10 Summary of Moisture-Density Test Results for Borrow Materials.
Contract No. Max Dry Density (pcf) OMC (%) 3546 136.9 7.2 3583 119.4 10.7 3597 133.8 6.2 3607 125.6 11.3 3613 143.2 5.4
Table 4.11. Sumarry of Moisture-Density Test Results for Subgrade Materials.
Subgrade Source Max Dry Density (pcf) OMC (%) I-15/Goodsprings 134.9 6.3 US-95/Searchlight 133.3 6.6
NV-375/Rachel 139.2 6.1 US-95/Bonnie Claire 126.9 9.4
US-93/Crystal Spring MP62 122.4 9.8 US-93/Crystal Spring MP67 123.8 9.3
4.3. Resilient Modulus Testing Resilient modulus is an important parameter in the pavement design which represents the stress-dependent stiffness of the base, borrow, and subgrade materials under a certain pattern of repeated loading and confinement stress level using a triaxial set-up. AASHTO T 307 is the most commonly used test for Mr of unbound materials (i.e. 22 out of 30 agencies/DOTs). Therefore, AASHTO T 307 standard procedure was followed for determining the Mr of the sampled materials. The loading pattern for the Mr test consists of a repeated axial cyclic stress of fixed amplitude with a loading duration of 0.1 second followed by a rest period of 0.9 second. The AASHTO standard stipulates detailed testing procedures for unbound materials, which include loading sequences, confining pressures, maximum axial stresses, cyclic stresses, constant stresses, and the number of loading applications. Overall, base materials are subjected to higher stresses during the testing than the subgrade soils despite the similarities in the testing sequences. The loading sequence for the base and borrow materials is presented in Table 4.12 and the loading sequence for the subgrade materials is summarized in Table 4.13.

Characterization of Unbound Materials for Mechanistic-Empirical Pavement Design Guide (MEPDG)
51
Table 4.12. Testing Sequence for Base and Subbase Materials.
Sequence No.
Confining Pressure (psi)
Max. Axial
Stress (psi)
Cyclic Stress (psi)
Contact Stress (psi)
No. of Load
Application 0 6 4 3.6 0.4 500-1000 1 6 2 1.8 0.2 100 2 6 4 3.6 0.4 100 3 6 6 5.4 0.6 100 4 6 8 7.2 0.8 100 5 6 10 9.0 1.0 100 6 4 2 1.8 0.2 100 7 4 4 3.6 0.4 100 8 4 6 5.4 0.6 100 9 4 8 7.2 0.8 100 10 4 10 9.0 1.0 100 11 2 2 1.8 0.2 100 12 2 4 3.6 0.4 100 13 2 6 5.4 0.6 100 14 2 8 7.2 0.8 100 15 2 10 9.0 1.0 100
Table 4.13. Testing Sequence for Subgrade Materials.
Sequence No.
Confining Pressure (psi)
Max. Axial
Stress (psi)
Cyclic Stress (psi)
Contact Stress (psi)
No. of Load
Application 0 15 15 13.5 1.5 500-1000 1 3 3 2.7 0.3 100 2 3 6 5.4 0.6 100 3 3 9 8.1 0.9 100 4 5 5 4.5 0.5 100 5 5 10 9.0 1.0 100 6 5 15 13.5 1.5 100 7 10 10 9.0 1.0 100 8 10 20 18.0 2.0 100 9 10 30 27.0 3.0 100 10 15 10 9.0 1.0 100 11 15 15 13.5 1.5 100 12 15 30 27.0 3.0 100 13 20 15 13.5 1.5 100 14 20 20 18.0 2.0 100 15 20 40 36.0 4.0 100
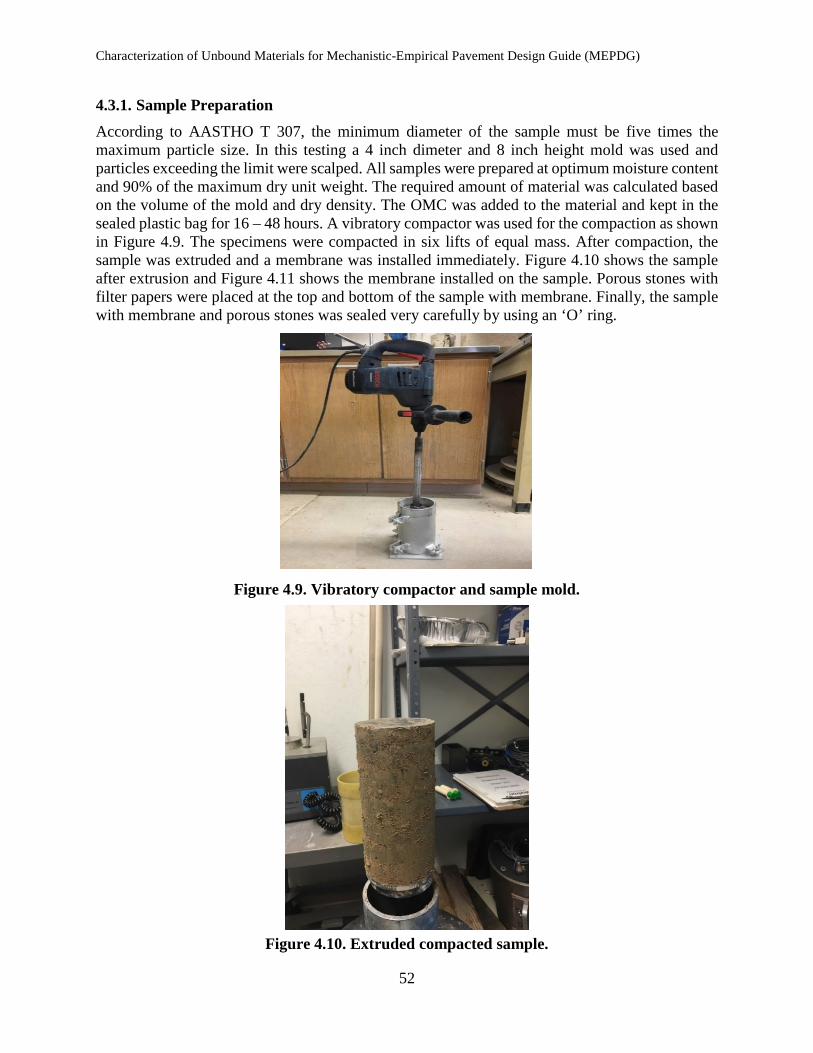
Characterization of Unbound Materials for Mechanistic-Empirical Pavement Design Guide (MEPDG)
52
4.3.1. Sample Preparation According to AASTHO T 307, the minimum diameter of the sample must be five times the maximum particle size. In this testing a 4 inch dimeter and 8 inch height mold was used and particles exceeding the limit were scalped. All samples were prepared at optimum moisture content and 90% of the maximum dry unit weight. The required amount of material was calculated based on the volume of the mold and dry density. The OMC was added to the material and kept in the sealed plastic bag for 16 – 48 hours. A vibratory compactor was used for the compaction as shown in Figure 4.9. The specimens were compacted in six lifts of equal mass. After compaction, the sample was extruded and a membrane was installed immediately. Figure 4.10 shows the sample after extrusion and Figure 4.11 shows the membrane installed on the sample. Porous stones with filter papers were placed at the top and bottom of the sample with membrane. Finally, the sample with membrane and porous stones was sealed very carefully by using an ‘O’ ring.
Figure 4.9. Vibratory compactor and sample mold.
Figure 4.10. Extruded compacted sample.

Characterization of Unbound Materials for Mechanistic-Empirical Pavement Design Guide (MEPDG)
53
Figure 4.11. Compacted sample with membrane, porous stones and O-rings.
4.3.2. Testing The prepared sample was carefully installed inside the triaxial chamber. The drainage valves connected to the top and bottom of the samples and a vacuum pressure was applied through the drainage vales to make sure there was no leakage. Figure 4.12 shows the sample inside the chamber after vacuum was applied. LVDT’s were mounted in the outside of the chamber and connected to the load cell to measure the axial deformation of the sample as shown in Figure 4.13. The loading protocol for the base, borrow and subgrade materials was controlled by the software. Frequent manual checks were made to confirm that the machine was applying the correct cyclic stress, confinement, and contact stress.

Characterization of Unbound Materials for Mechanistic-Empirical Pavement Design Guide (MEPDG)
54
Figure 4.12. Sample inside the triaxial chamber.
Figure 4.13. LVDT’s connected on the outside of the triaxial chamber.

Characterization of Unbound Materials for Mechanistic-Empirical Pavement Design Guide (MEPDG)
55
4.3.3. Development of Mr Models The results of the triaxial testing of the base, borrow, and subgrade materials were used to develop the non-linear models that relate the Mr to the stress conditions. For the base and borrow materials, the Theta model (25) was used to represent the stress-hardening behavior. For the subgrade material the Uzan and the Universal models (26) were used. The constitutive model equations are given below.
Theta Model: 𝑀𝑀𝑅𝑅 = 𝐾𝐾𝜃𝜃𝑛𝑛 (27) Where;
K and n: regression coefficients θ: bulk stress, psi
Uzan Model 𝑀𝑀𝑅𝑅 = 𝐾𝐾𝜃𝜃𝑛𝑛𝜎𝜎𝑑𝑑𝑚𝑚 (28)
Where; K, m: regression coefficients σd: deviator stress, psi
Universal Model 𝑀𝑀𝑟𝑟 = 𝑘𝑘1𝑝𝑝𝑎𝑎 �𝜃𝜃𝑝𝑝𝑎𝑎�𝑘𝑘2�𝜏𝜏𝑜𝑜𝑜𝑜𝑜𝑜𝑝𝑝𝑎𝑎
+ 1�𝑘𝑘3
(29)
Where; k1, k2, k3: regression coefficients Pa: atmospheric pressure, psi τoct: octahedral shear stress, psi
Resilient modulus value was obtained from the average value of the last five cycles for each sequence. The method of least squares in Microsoft Excel was used to develop the regression coefficients in the constitutive models. Table 4.14 presents typical data from the testing of a base sample and the necessary input parameters for the regression analysis. The Theta model showed good correlation for the base and borrow materials as shown in Figure 4.14 and Figure 4.15. Both the Universal and Uzan models showed good correlations for the subgrade materials as shown in Figure 4.16 and Figure 4.17, respectively. The constitutive model regression parameters for the base, borrow and subgrade materials are summarized in Table 4.15, Table 4.16, and Table 4.17, respectively. One of the borrow material’s (Contract 3583) constitutive model was similar to subgrade material. The variation of resilient modulus with different state of stress for the base, borrow, and subgrade materials are presented in Figure 4.18, Figure 4.19, and Figure 4.20, respectively.

Characterization of Unbound Materials for Mechanistic-Empirical Pavement Design Guide (MEPDG)
56
Table 4.14. Summary of Resilient Modulus Test Results for Base Material (Contract 3546).
Sequence
Cyclic Axial Stress (psi)
Contact Stress (psi)
Confine Stress (psi)
Axial Resilient Modulus
(psi)
Deviator Stress, σd
(psi)
Major Principal Stress, σ1
(psi)
Minor Principal
Stress, σ3 (psi)
Bulk Stress, θ (psi)
Octahedral Shear
Stress (psi)
1 13.5 1.5 14.8 46,385 15.0 29.8 14.8 59.5 7.1 2 2.7 0.3 2.8 22,854 3.0 5.8 2.8 11.4 1.4 3 5.3 0.6 2.8 23,661 5.9 8.8 2.8 14.4 2.8 4 8.1 0.9 2.8 25,371 9.0 11.8 2.8 17.5 4.2 5 4.5 0.5 4.8 25,231 5.0 9.9 4.8 19.5 2.4 6 9.0 1.0 4.8 28,698 10.0 14.8 4.8 24.4 4.7 7 13.5 1.5 4.8 30,357 15.0 19.9 4.8 29.5 7.1 8 9.0 1.0 9.8 35,372 10.0 19.8 9.8 39.4 4.7 9 18.0 2.0 9.8 41,542 20.0 29.8 9.8 49.5 9.4 10 26.8 3.0 9.8 43,812 29.8 39.7 9.8 59.3 14.1 11 9.0 1.0 14.8 39,750 10.0 24.8 14.8 54.5 4.7 12 13.5 1.5 14.8 43,625 15.0 29.8 14.8 59.4 7.1 13 26.8 3.0 14.8 49,674 29.8 44.6 14.8 74.3 14.0 14 13.7 1.5 19.8 49,374 15.2 35.0 19.8 74.6 7.1 15 18.1 2.0 19.8 53,101 20.1 39.9 19.8 79.6 9.5 16 34.6 4.0 19.8 59,304 38.6 58.4 19.8 98.0 18.2

Characterization of Unbound Materials for Mechanistic-Empirical Pavement Design Guide (MEPDG)
57
Figure 4.14. Theta model for base material (contract 3546).
Figure 4.15. Theta model for borrow material (contract 3546).
0
10,000
20,000
30,000
40,000
50,000
60,000
0 10,000 20,000 30,000 40,000 50,000 60,000
Pred
icte
d R
esili
ent M
odul
us (p
si)
Measured Resilient Modulus (psi)
0
10,000
20,000
30,000
40,000
50,000
60,000
0 10,000 20,000 30,000 40,000 50,000 60,000
Pred
icte
d R
esili
ent M
odul
us (p
si)
Measured Resilient Modulus (psi)

Characterization of Unbound Materials for Mechanistic-Empirical Pavement Design Guide (MEPDG)
58
Figure 4.16. Uzan model for subgrade (US-93/Crystal Spring MP62).
Figure 4.17. Universal model for subgrade (US-93/Crystal Spring MP62).
0
2,000
4,000
6,000
8,000
10,000
12,000
14,000
16,000
18,000
20,000
0 2,000 4,000 6,000 8,000 10,000 12,000 14,000 16,000 18,000 20,000
Pred
icte
d R
esili
ent M
odul
us (p
si)
Measured Resilient Modulus (psi)
0
2,000
4,000
6,000
8,000
10,000
12,000
14,000
16,000
18,000
20,000
0 2,000 4,000 6,000 8,000 10,000 12,000 14,000 16,000 18,000 20,000
Pred
icte
d R
esili
ent M
odul
us (p
si)
Measured Resilient Modulus (psi)
Universal Model
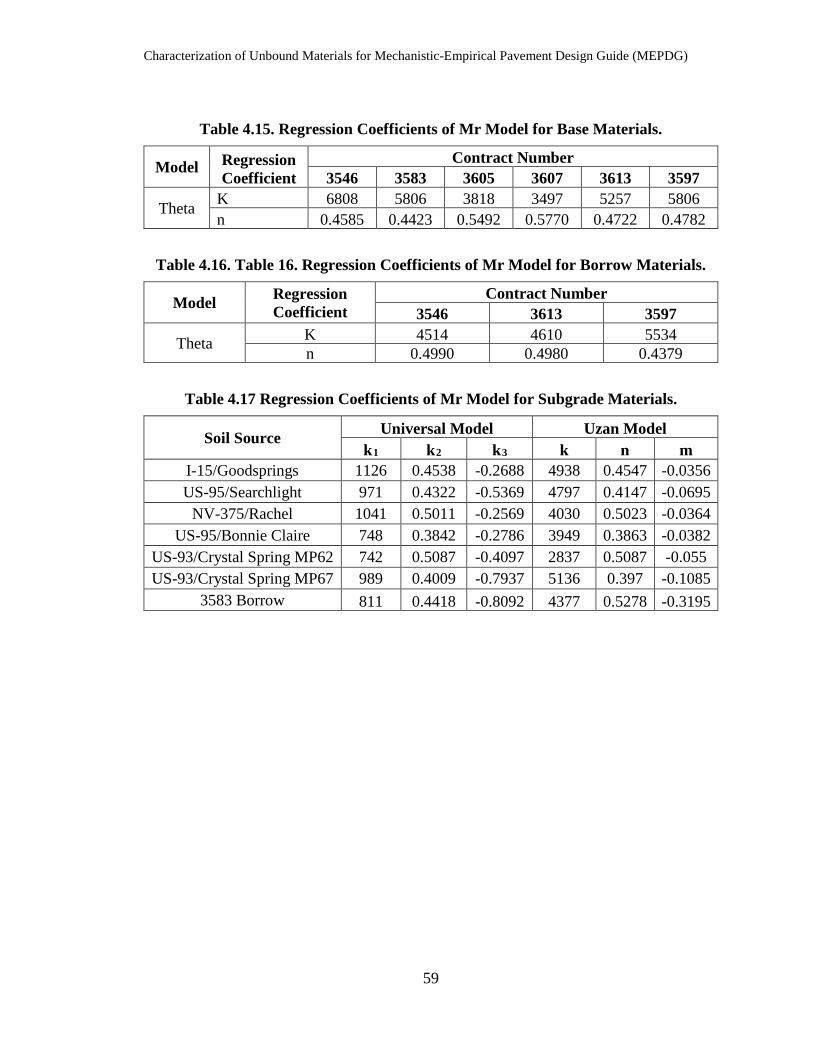
Characterization of Unbound Materials for Mechanistic-Empirical Pavement Design Guide (MEPDG)
59
Table 4.15. Regression Coefficients of Mr Model for Base Materials.
Model Regression Coefficient
Contract Number 3546 3583 3605 3607 3613 3597
Theta K 6808 5806 3818 3497 5257 5806 n 0.4585 0.4423 0.5492 0.5770 0.4722 0.4782
Table 4.16. Table 16. Regression Coefficients of Mr Model for Borrow Materials.
Model Regression Coefficient
Contract Number 3546 3613 3597
Theta K 4514 4610 5534 n 0.4990 0.4980 0.4379
Table 4.17 Regression Coefficients of Mr Model for Subgrade Materials.
Soil Source Universal Model Uzan Model k1 k2 k3 k n m
I-15/Goodsprings 1126 0.4538 -0.2688 4938 0.4547 -0.0356 US-95/Searchlight 971 0.4322 -0.5369 4797 0.4147 -0.0695
NV-375/Rachel 1041 0.5011 -0.2569 4030 0.5023 -0.0364 US-95/Bonnie Claire 748 0.3842 -0.2786 3949 0.3863 -0.0382
US-93/Crystal Spring MP62 742 0.5087 -0.4097 2837 0.5087 -0.055 US-93/Crystal Spring MP67 989 0.4009 -0.7937 5136 0.397 -0.1085
3583 Borrow 811 0.4418 -0.8092 4377 0.5278 -0.3195

Characterization of Unbound Materials for Mechanistic-Empirical Pavement Design Guide (MEPDG)
60
Figure 4.18. Variation of resilient modulus of base materials with bulk stress.
Figure 4.19. Variation of resilient modulus of borrow materials with bulk stress.
0
5,000
10,000
15,000
20,000
25,000
30,000
35,000
0 5 10 15 20 25 30
Res
ilien
t Mod
ulus
(psi
)
Bulk Stress,θ (psi)
3546 3583
3605 3607
3613 3597
0
5,000
10,000
15,000
20,000
25,000
0 5 10 15 20 25 30
Res
ilien
t Mod
ulus
(psi
)
Bulk Stress,θ (psi)
3546
3583
3605
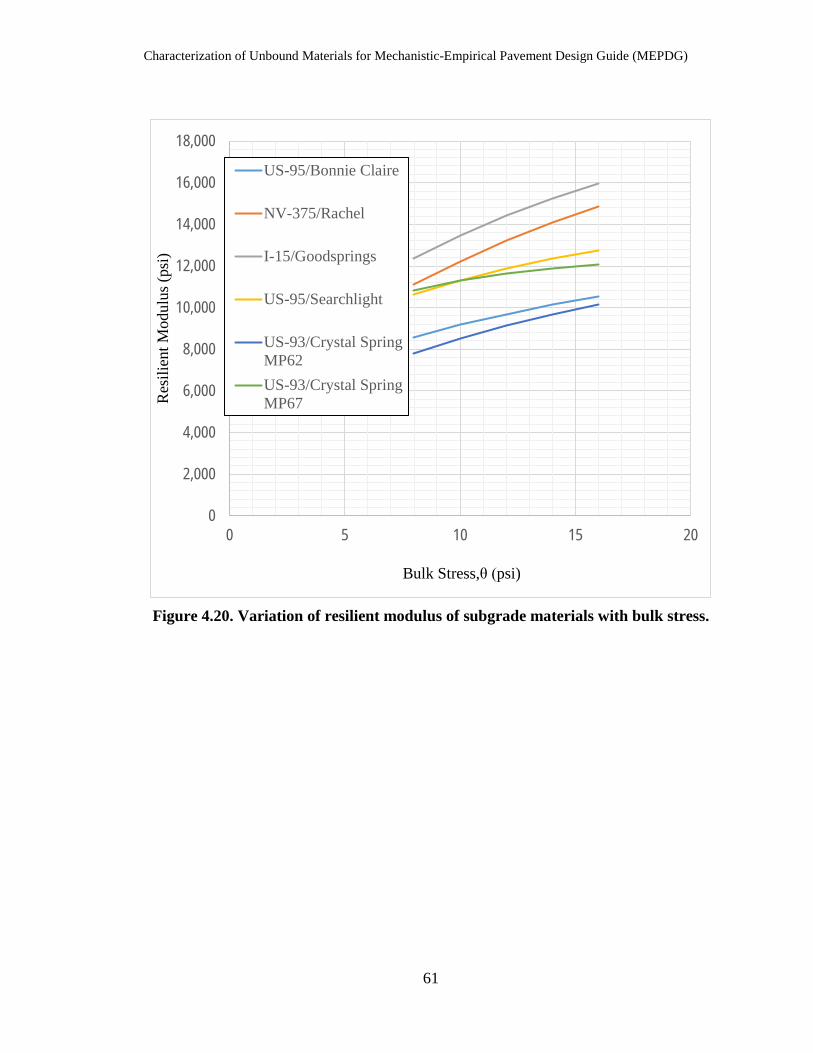
Characterization of Unbound Materials for Mechanistic-Empirical Pavement Design Guide (MEPDG)
61
Figure 4.20. Variation of resilient modulus of subgrade materials with bulk stress.
0
2,000
4,000
6,000
8,000
10,000
12,000
14,000
16,000
18,000
0 5 10 15 20
Res
ilien
t Mod
ulus
(psi
)
Bulk Stress,θ (psi)
US-95/Bonnie Claire
NV-375/Rachel
I-15/Goodsprings
US-95/Searchlight
US-93/Crystal SpringMP62US-93/Crystal SpringMP67

Characterization of Unbound Materials for Mechanistic-Empirical Pavement Design Guide (MEPDG)
62
4.4. Unconfined Compressive Strength the unconfined compressive strength (UCS) tests were conducted in accordance with AASHTO T 208. The continuous stress-strain responses were recorded to produce a complete stress-strain diagram. As was discovered in the literature review, the inclusion of the stress-strain parameters may significantly improve the correlation. Samples were prepared at the optimum moisture content and maximum dry density with the vibratory compactor. A 6 inch diameter and 12 inch height mold was used to meet the requirement of; maximum particles size has to be smaller than one-sixth of the specimen diameter. Tests were conducted at a strain rate between 0.2 and 2 percent per minute. Two replicates were tested for each source of material. Figure 4.21 shows and extruded sample and Figure 4.22 shows the sample after testing is completed. Typical UCS stress-strain curves are shown in Figure 4.23, Figure 4.24, and Figure 4.25 for base, borrow, and subgrade materials, respectively. Table 4.18 summarizes the unconfined compressive strength properties for the base, borrow, and subgrade materials.
Figure 4.21. Extruded UCS sample.

Characterization of Unbound Materials for Mechanistic-Empirical Pavement Design Guide (MEPDG)
63
Figure 4.22. Sample after the UCS test.
Figure 4.23. UCS stress-strain curve for base materials (contract 3583).
0
1
2
3
4
5
6
7
8
0 0.2 0.4 0.6 0.8 1 1.2 1.4
Stre
ss (p
si)
Strain (%)

Characterization of Unbound Materials for Mechanistic-Empirical Pavement Design Guide (MEPDG)
64
Figure 4.24. UCS stress-strain curve for borrow material (contract 3613).
Figure 4.25. UCS stress-strain curve for subgrade material (I-15/Goodsprings).
0
1
2
3
4
5
6
7
8
0 0.2 0.4 0.6 0.8 1 1.2 1.4
Stre
ss (p
si)
Strain (%)
Stress vs Strain
0
1
2
3
4
5
6
7
8
0 0.2 0.4 0.6 0.8 1 1.2 1.4
Stre
ss (p
si)
Strain (%)
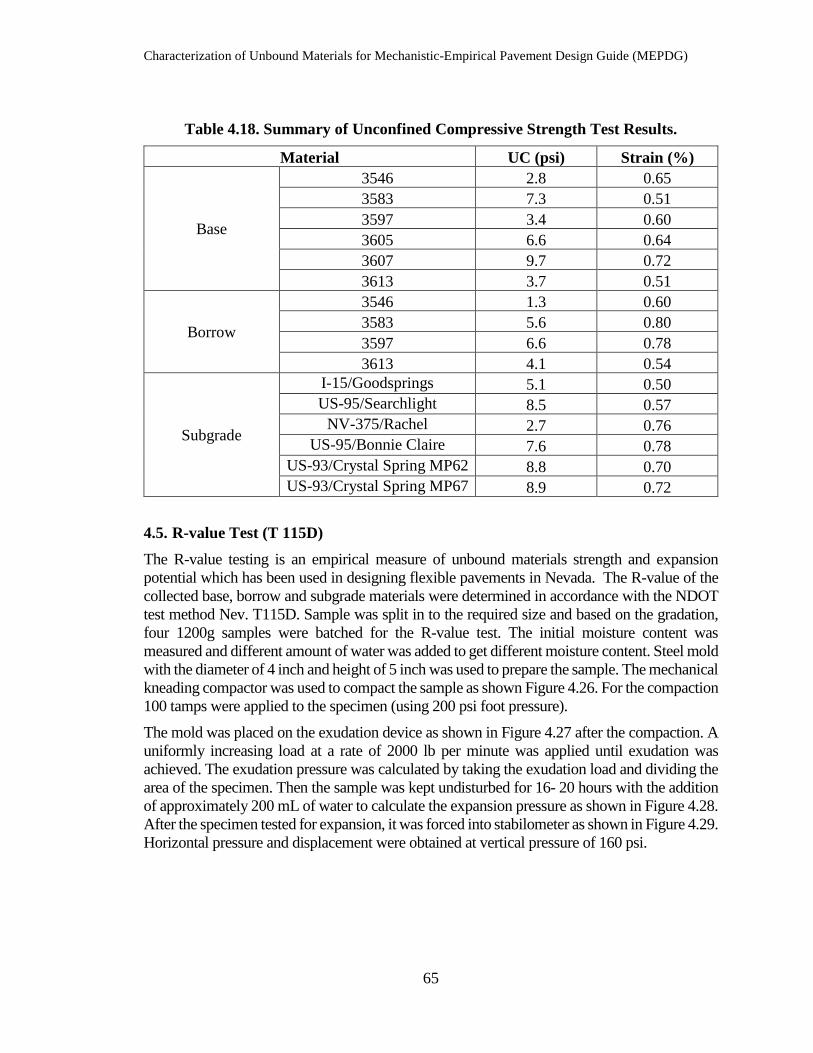
Characterization of Unbound Materials for Mechanistic-Empirical Pavement Design Guide (MEPDG)
65
Table 4.18. Summary of Unconfined Compressive Strength Test Results.
Material UC (psi) Strain (%)
Base
3546 2.8 0.65 3583 7.3 0.51 3597 3.4 0.60 3605 6.6 0.64 3607 9.7 0.72 3613 3.7 0.51
Borrow
3546 1.3 0.60 3583 5.6 0.80 3597 6.6 0.78 3613 4.1 0.54
Subgrade
I-15/Goodsprings 5.1 0.50 US-95/Searchlight 8.5 0.57
NV-375/Rachel 2.7 0.76 US-95/Bonnie Claire 7.6 0.78
US-93/Crystal Spring MP62 8.8 0.70 US-93/Crystal Spring MP67 8.9 0.72
4.5. R-value Test (T 115D) The R-value testing is an empirical measure of unbound materials strength and expansion potential which has been used in designing flexible pavements in Nevada. The R-value of the collected base, borrow and subgrade materials were determined in accordance with the NDOT test method Nev. T115D. Sample was split in to the required size and based on the gradation, four 1200g samples were batched for the R-value test. The initial moisture content was measured and different amount of water was added to get different moisture content. Steel mold with the diameter of 4 inch and height of 5 inch was used to prepare the sample. The mechanical kneading compactor was used to compact the sample as shown Figure 4.26. For the compaction 100 tamps were applied to the specimen (using 200 psi foot pressure). The mold was placed on the exudation device as shown in Figure 4.27 after the compaction. A uniformly increasing load at a rate of 2000 lb per minute was applied until exudation was achieved. The exudation pressure was calculated by taking the exudation load and dividing the area of the specimen. Then the sample was kept undisturbed for 16- 20 hours with the addition of approximately 200 mL of water to calculate the expansion pressure as shown in Figure 4.28. After the specimen tested for expansion, it was forced into stabilometer as shown in Figure 4.29. Horizontal pressure and displacement were obtained at vertical pressure of 160 psi.

Characterization of Unbound Materials for Mechanistic-Empirical Pavement Design Guide (MEPDG)
66
Figure 4.26. Kneading compactor.
Figure 4.27. Exudation-indicator device.

Characterization of Unbound Materials for Mechanistic-Empirical Pavement Design Guide (MEPDG)
67
Figure 4.28. Expansion pressure device.
Figure 4.29. R-value testing equipment.

Characterization of Unbound Materials for Mechanistic-Empirical Pavement Design Guide (MEPDG)
68
The R-value was calculated from the Equation 30. Plot the R-value against the exudation pressure and R-value was determined from the graph for the 300 psi exudation pressure. The R-value tests were conducted by Black Eagle Consulting Company. Figure 4.30 presents the R-value test results for base material. The summary of R-value test results is shown in Table 4.19. R-value correction was done for the specimens if the specimen heights were not in the range of 2.45 – 2.55 inch. According NDOT standard specifications, the Type 1 Class B aggregate base and borrow materials have to have a minimum R-Value of 70 and 45 respectively.
𝑅𝑅 = 100 − 100
�2.5∗(Pv−1)D∗Ph +1�
(30)
Where; R: R-value Pv: vertical pressure (160 psi) D: turns displacement reading Ph: horizontal pressure (Stabilometer gauge reading at 160 psi vertical pressure)

Characterization of Unbound Materials for Mechanistic-Empirical Pavement Design Guide (MEPDG)
69
Figure 4.30. R-value test results for base material (contract 3546).
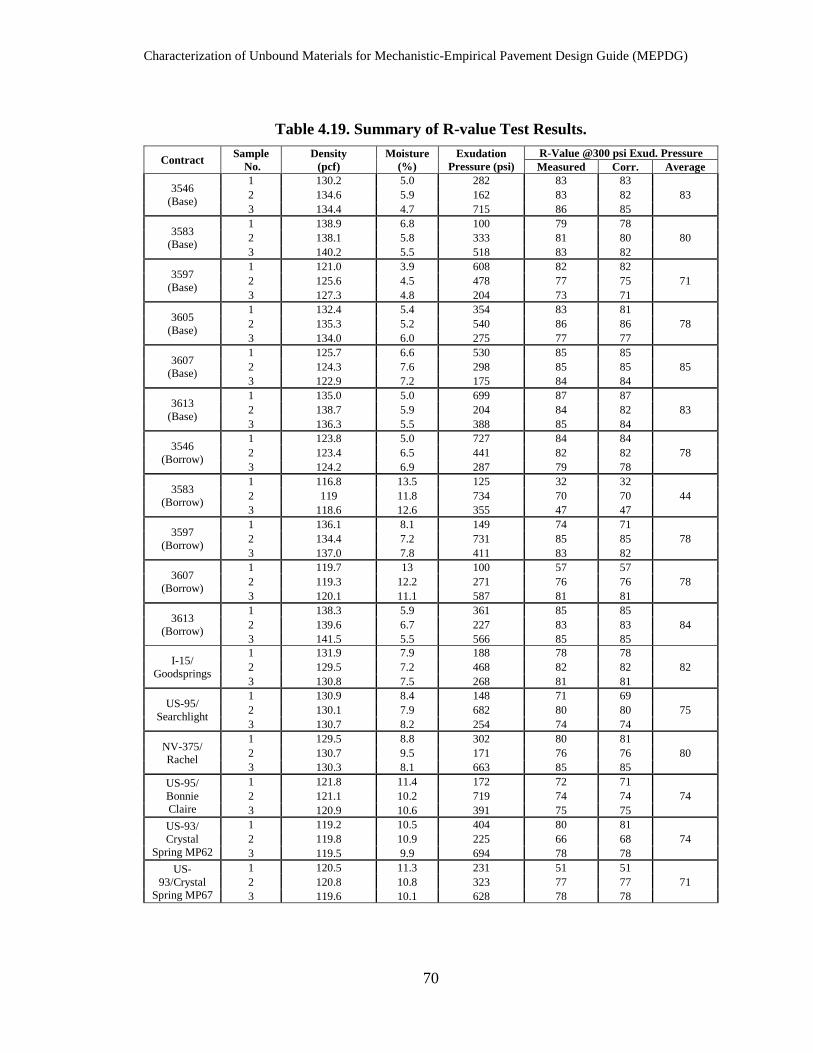
Characterization of Unbound Materials for Mechanistic-Empirical Pavement Design Guide (MEPDG)
70
Table 4.19. Summary of R-value Test Results.
Contract Sample No.
Density (pcf)
Moisture (%)
Exudation Pressure (psi)
R-Value @300 psi Exud. Pressure Measured Corr. Average
3546 (Base)
1 130.2 5.0 282 83 83 83 2 134.6 5.9 162 83 82
3 134.4 4.7 715 86 85
3583 (Base)
1 138.9 6.8 100 79 78 80 2 138.1 5.8 333 81 80
3 140.2 5.5 518 83 82
3597 (Base)
1 121.0 3.9 608 82 82 71 2 125.6 4.5 478 77 75
3 127.3 4.8 204 73 71
3605 (Base)
1 132.4 5.4 354 83 81 78 2 135.3 5.2 540 86 86
3 134.0 6.0 275 77 77
3607 (Base)
1 125.7 6.6 530 85 85 85 2 124.3 7.6 298 85 85
3 122.9 7.2 175 84 84
3613 (Base)
1 135.0 5.0 699 87 87 83 2 138.7 5.9 204 84 82
3 136.3 5.5 388 85 84
3546 (Borrow)
1 123.8 5.0 727 84 84 78 2 123.4 6.5 441 82 82
3 124.2 6.9 287 79 78
3583 (Borrow)
1 116.8 13.5 125 32 32 44 2 119 11.8 734 70 70
3 118.6 12.6 355 47 47
3597 (Borrow)
1 136.1 8.1 149 74 71 78 2 134.4 7.2 731 85 85
3 137.0 7.8 411 83 82
3607 (Borrow)
1 119.7 13 100 57 57 78 2 119.3 12.2 271 76 76
3 120.1 11.1 587 81 81
3613 (Borrow)
1 138.3 5.9 361 85 85 84 2 139.6 6.7 227 83 83
3 141.5 5.5 566 85 85
I-15/ Goodsprings
1 131.9 7.9 188 78 78 82 2 129.5 7.2 468 82 82
3 130.8 7.5 268 81 81
US-95/ Searchlight
1 130.9 8.4 148 71 69 75 2 130.1 7.9 682 80 80
3 130.7 8.2 254 74 74
NV-375/ Rachel
1 129.5 8.8 302 80 81 80 2 130.7 9.5 171 76 76
3 130.3 8.1 663 85 85 US-95/ Bonnie Claire
1 121.8 11.4 172 72 71 74 2 121.1 10.2 719 74 74
3 120.9 10.6 391 75 75 US-93/ Crystal
Spring MP62
1 119.2 10.5 404 80 81 74 2 119.8 10.9 225 66 68
3 119.5 9.9 694 78 78 US-
93/Crystal Spring MP67
1 120.5 11.3 231 51 51 71 2 120.8 10.8 323 77 77
3 119.6 10.1 628 78 78

Characterization of Unbound Materials for Mechanistic-Empirical Pavement Design Guide (MEPDG)
71
DESIGN RESILIENT MODULUS FOR NEW PROJECTS The subgrade and unbound layers have a definite effect on pavement performance and must be properly characterized for structural design (new and rehabilitation). Resilient modulus is the primary material property that is used to characterize the subgrade soil and other unbound structural layers for flexible pavement design in the AASHTO 1993 Design Guide (27) and in the new MEPDG developed under NCHRP project 1-37A (28) and currently being implemented as the AASHTOWare® Pavement ME design software (28). This Chapter focuses on the identification of the resilient modulus properties for subgrade and unbound layers for the design of new flexible pavements as recommended by the AASHTO MEPDG. In order to develop correlations between the Mr and other properties of the subgrade and unbound materials such as R-value, UCS, Atterberg limits, etc…, the design value of the Mr for each layer must be established. 5.1. Procedure for Identification of Resilient Modulus Design Value The steps to determine the design value for the unbound layers (aggregate base, borrow materials and subgrade soil) using repeated load triaxial resilient modulus tests are listed and defined below. These steps are in accordance with the MEPDG Manual of Practice (1) as well as in the final report for NCHRP project 1-37A (28) for both flexible and rigid pavements.
1. Based on previous experience, a trial flexible pavement structure is assumed that can satisfy the requirements of traffic loads and available materials.
2. Use the trial pavement structure to calculate the at-rest stress state from the overburden pressures for the aggregate base layer, embankment, and/or subgrade. The at-rest stress state for the aggregate base layer and embankment are determined at their quarter depth, while the at-rest stress state for the subgrade is determined 18 inches into the subgrade. These material characterization depths were established by comparing laboratory resilient modulus values to backcalculated elastic layer modulus values. These depths were selected for estimating the c-factor included in the 1993 AASHTO Design Guide, as well as in the MEPDG Manual of Practice.
3. Start with the subgrade or lowest unbound layer and move upward in the pavement structure to establish the design resilient modulus for all unbound material layers using a linear elastic layer program for calculating layer responses or stresses at the locations defined in step 1. Assume the resilient modulus for the unbound layers above which the design resilient modulus is being estimated.
4. For the design truck axle load and season, calculate the load-related vertical and horizontal stresses using a linear elastic layered program to be consistent with the Pavement ME Design pavement response program. The load-related stresses are calculated at the material/soil characterization depths listed above (see step #number 2).
5. Calculate the at-rest horizontal and vertical stresses from overburden at the same critical points or locations in the unbound layers used to calculate the load-related
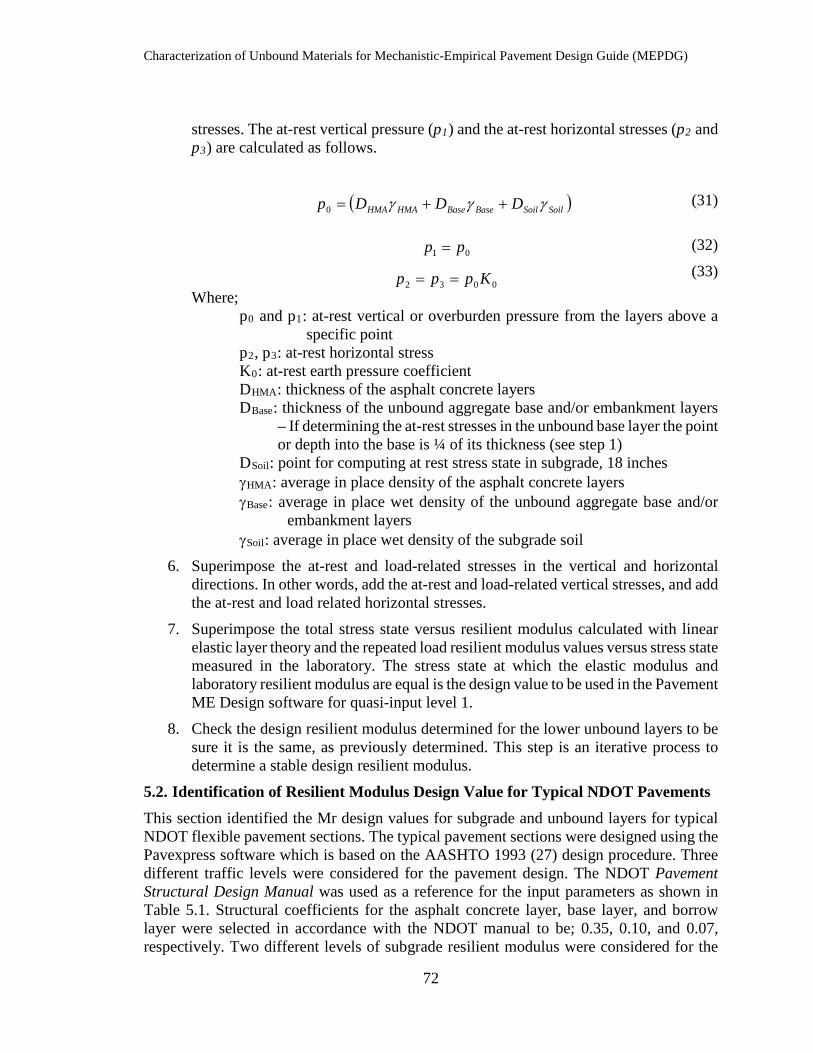
Characterization of Unbound Materials for Mechanistic-Empirical Pavement Design Guide (MEPDG)
72
stresses. The at-rest vertical pressure (p1) and the at-rest horizontal stresses (p2 and p3) are calculated as follows.
(31)
(32)
(33) Where;
p0 and p1: at-rest vertical or overburden pressure from the layers above a specific point
p2, p3: at-rest horizontal stress K0: at-rest earth pressure coefficient DHMA: thickness of the asphalt concrete layers DBase: thickness of the unbound aggregate base and/or embankment layers
– If determining the at-rest stresses in the unbound base layer the point or depth into the base is ¼ of its thickness (see step 1)
DSoil: point for computing at rest stress state in subgrade, 18 inches γHMA: average in place density of the asphalt concrete layers γBase: average in place wet density of the unbound aggregate base and/or
embankment layers γSoil: average in place wet density of the subgrade soil
6. Superimpose the at-rest and load-related stresses in the vertical and horizontal directions. In other words, add the at-rest and load-related vertical stresses, and add the at-rest and load related horizontal stresses.
7. Superimpose the total stress state versus resilient modulus calculated with linear elastic layer theory and the repeated load resilient modulus values versus stress state measured in the laboratory. The stress state at which the elastic modulus and laboratory resilient modulus are equal is the design value to be used in the Pavement ME Design software for quasi-input level 1.
8. Check the design resilient modulus determined for the lower unbound layers to be sure it is the same, as previously determined. This step is an iterative process to determine a stable design resilient modulus.
5.2. Identification of Resilient Modulus Design Value for Typical NDOT Pavements This section identified the Mr design values for subgrade and unbound layers for typical NDOT flexible pavement sections. The typical pavement sections were designed using the Pavexpress software which is based on the AASHTO 1993 (27) design procedure. Three different traffic levels were considered for the pavement design. The NDOT Pavement Structural Design Manual was used as a reference for the input parameters as shown in Table 5.1. Structural coefficients for the asphalt concrete layer, base layer, and borrow layer were selected in accordance with the NDOT manual to be; 0.35, 0.10, and 0.07, respectively. Two different levels of subgrade resilient modulus were considered for the
( )SoilSoilBaseBaseHMAHMA DDDp γγγ ++=0
01 pp =
0032 Kppp ==

Characterization of Unbound Materials for Mechanistic-Empirical Pavement Design Guide (MEPDG)
73
design; strong at 14,000 psi and weak at 8,000 psi. Resilient modulus of the base layer was kept constant at 26,000 psi. Table 5.2 presents the pavement structures for different traffic levels. For pavements on weak subgrade, borrow material was used as a subbase. For this case, the resilient modulus for the base, borrow, and subgrade were assumed to be; 26,000, 11,250, and 6,800 psi, respectively. The pavement structures with the borrow material are shown in Table 5.3.
Table 5.1. Major Inputs for Pavexpress Software.
Traffic Level
Design Traffic in Million ESALs
(MESALs)
Reliability Level (%)
Initial Serviceability
index
Terminal serviceability
index
Standard Deviation
(So) Low 5 85 4.2 2 0.45
Medium 15 90 4.2 2.5 0.45 High 30 95 4.2 2.5 0.45
Table 5.2. Pavement Structures for Different Traffic Levels.
Traffic Level Mr (Subgrade) (psi)
Thickness (inch) AC Base
Low
14,000 5 16 8,000 7 16
Medium
14,000 7 18 8,000 9.5 18
High
14,000 8 23 8,000 10.5 23
Table 5.3. Pavement Structure with Borrow Materials.
Traffic Level Thickness (inch) AC Base Borrow
Low 5.5 16 10 Medium 8.5 18 10
High 9.5 23 10 The load-induced principal stresses were calculated using the 3D-Move analysis software (30) for a single wheel load of 9,000 lb and tire pressure of 80 psi as recommended in previous studies (31). The asphalt concrete layer was divided into sublayers to capture the
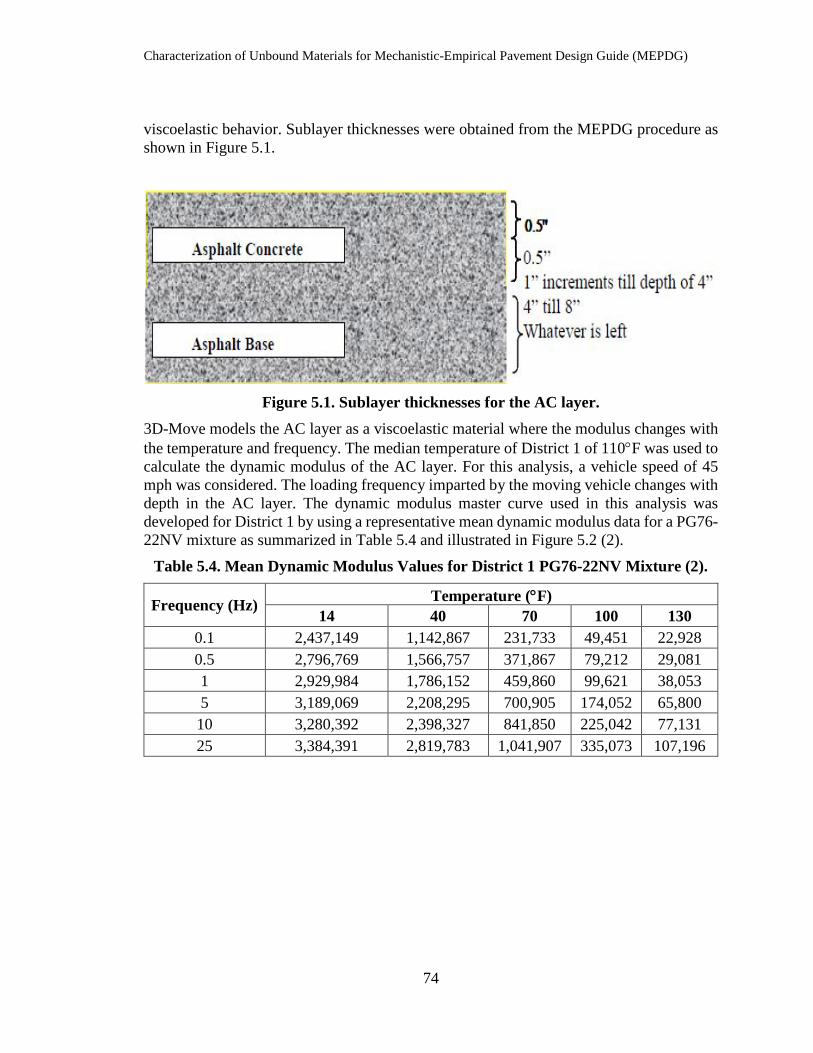
Characterization of Unbound Materials for Mechanistic-Empirical Pavement Design Guide (MEPDG)
74
viscoelastic behavior. Sublayer thicknesses were obtained from the MEPDG procedure as shown in Figure 5.1.
Figure 5.1. Sublayer thicknesses for the AC layer.
3D-Move models the AC layer as a viscoelastic material where the modulus changes with the temperature and frequency. The median temperature of District 1 of 110°F was used to calculate the dynamic modulus of the AC layer. For this analysis, a vehicle speed of 45 mph was considered. The loading frequency imparted by the moving vehicle changes with depth in the AC layer. The dynamic modulus master curve used in this analysis was developed for District 1 by using a representative mean dynamic modulus data for a PG76-22NV mixture as summarized in Table 5.4 and illustrated in Figure 5.2 (2).
Table 5.4. Mean Dynamic Modulus Values for District 1 PG76-22NV Mixture (2).
Frequency (Hz) Temperature (°F) 14 40 70 100 130
0.1 2,437,149 1,142,867 231,733 49,451 22,928 0.5 2,796,769 1,566,757 371,867 79,212 29,081 1 2,929,984 1,786,152 459,860 99,621 38,053 5 3,189,069 2,208,295 700,905 174,052 65,800 10 3,280,392 2,398,327 841,850 225,042 77,131 25 3,384,391 2,819,783 1,041,907 335,073 107,196

Characterization of Unbound Materials for Mechanistic-Empirical Pavement Design Guide (MEPDG)
75
Figure 5.2. Dynamic modulus master curve for mixtures used in District 1.
The thicknesses of the asphalt concrete sublayers were transformed into equivalent thicknesses by using the method of equivalent thickness (MET) as shown in Figure 5.3.
Figure 5.3. Equivalent thickness transformation using MET.
The pulse time was calculated using Equation 34. The calculation of effective length was done according to the MEPDG procedure as shown in Figure 5.4. The frequency for each sublayer was obtained from the pulse time. Dynamic modulus master curve was used to calculate the dynamic modulus for the corresponding frequencies for each sublayer. The calculated parameters and dynamic modulus values for each sublayer for a 5-inch AC layer are shown in Table 5.5.
1000
10000
100000
1000000
10000000
0.000001 0.0001 0.01 1 100 10000 1000000
Dyn
amic
Mod
ulus
at 7
0˚F
(psi
)
Reduced Frequency (Hz)14 F 40 F 70 F 100 F 130 F Master Curve

Characterization of Unbound Materials for Mechanistic-Empirical Pavement Design Guide (MEPDG)
76
𝑡𝑡 =
𝐿𝐿𝑒𝑒𝑒𝑒𝑒𝑒17.6𝑣𝑣𝑠𝑠
(34)
Where; t: time of load (sec) Leff : effective length (inch) Vs :velocity (mph)
Figure 5.4, Effective length computation for single axle load configuration.
Table 5.5. Summary of Sublayers for a 5-inch AC Layer.
Sublayer Thickness (inch) Zeff (in) Leff (in) Pulse time (sec) E* (psi) Sublayer 1 0.5 1.35 14.51 0.01832 277,310 Sublayer 2 0.5 2.68 17.17 0.02167 261,579 Sublayer 3 1.0 5.25 22.31 0.02817 238,711 Sublayer 4 1.0 7.77 27.34 0.03452 222,347 Sublayer 5 1.0 10.23 32.27 0.04075 209,822 Sublayer 6 1.0 12.66 37.12 0.04687 199,798
The AC layer was subdivided and used in the 3D-Move (30) analysis. The Poisson’s ratio for the AC, base, and subgrade was assumed to be 0.3, 0.35, and 0.45, respectively. The responses were obtained at the center and edge of the tire at the locations specified in step 1. Principal stresses were obtained from the software and converted into octahedral and shear stress (Equations 35 and 36).

Characterization of Unbound Materials for Mechanistic-Empirical Pavement Design Guide (MEPDG)
77
σoct= 13
(σ1+ σ2+ σ3) (35)
|τoct|= 13
�(𝜎𝜎1 − 𝜎𝜎2)2 + (𝜎𝜎2 − 𝜎𝜎3)2 + (𝜎𝜎1 − 𝜎𝜎3)2 (36)
Where; σ1: major principal stress σ2: minor principal stress σ3: intermediate principal stress
Triaxial state of stress can be obtained from the octahedral normal stress and shear stress. The deviator stress (σd) and confining stress (σc) are expressed in equations 37 and 38, respectively (32,33).
σd= 3√2
|τoct| (37)
σc= σoct- σd
3 (38)
Stresses from the overburden pressure were also converted into triaxial state of stress and superimposed on the load induced stresses. The theta model (25) and universal model (26) were used to calculate the resilient modulus for base and subgrade layers, respectively. Table 5.6 and Table 5.7 present the iterative process for a pavement structure with 5-inch AC layer and 16-inch base layer. The iterative process was continued until the error becomes less than one percent. In this case, the identified design resilient modulus for the base and subgrade layers are 27,250 and 12,500 psi, respectively under centerline of the tire.

Characterization of Unbound Materials for Mechanistic-Empirical Pavement Design Guide (MEPDG)
78
Table 5.6. Sate of Stress from Load-Induced Stress and Overburden Stress.
Trial Layer Location 3-D Move Stress (psi) Static (psi)
σ1 σ2 σ3 τoct σd σoct σc σd σc
Trial 1
CAB Center 19.42 -0.27 -0.29 9.28 19.69 6.29 -0.28 0.38 0.38 CAB Edge 15.90 -0.33 -0.73 7.75 16.43 4.95 -0.53 0.38 0.38 SG Center 1.94 0.05 0.04 0.89 1.90 0.68 0.04 1.59 1.59 SG Edge 1.89 0.05 0.04 0.87 1.85 0.66 0.04 1.59 1.59
Trial 2
CAB Center 19.42 -0.27 -0.29 9.28 19.69 6.29 -0.28 0.38 0.38 CAB Edge 15.90 -0.33 -0.73 7.75 16.43 4.95 -0.53 0.38 0.38 SG Center 1.94 0.05 0.04 0.89 1.90 0.68 0.04 1.59 1.59 SG Edge 1.89 0.05 0.04 0.87 1.85 0.66 0.04 1.59 1.59
Table 5.7. Predicted Resilient Modulus from the State of Stress.
Trial Layer Location Total (psi) Bulk Stress
θ (psi)
Octahedral Shear Stress
(psi)
Assumed MR (psi)
Predicted Mr (psi)
Error (%) σd σc
Trial 1
CAB Center 20.08 0.11 20.40 9.47 26,000 27,130 4.3 CAB Edge 16.81 -0.14 16.38 7.93 26,000 24,536 5.6 SG Center 3.49 1.63 8.38 1.64 13,000 12,469 4.1 SG Edge 3.44 1.63 8.34 1.62 13,000 12,441 4.3
Trial 2
CAB Center 20.08 0.11 20.40 9.47 27,250 27,130 0.4 CAB Edge 16.81 -0.14 16.38 7.93 27,250 24,536 10.0 SG Center 3.49 1.63 8.38 1.64 12,500 12,469 0.2 SG Edge 3.44 1.63 8.34 1.62 12,500 12,441 0.5

Characterization of Unbound Materials for Mechanistic-Empirical Pavement Design Guide (MEPDG)
79
The subgrade materials were divided into two categories based on the resilient modulus test results. The subgrade from I-15/Goodsprings and NV-375/Rachel were identified as strong while the rest of the subgrade materials were identified as weak. Summary of resilient modulus for the base, borrow, and subgrade materials are shown in Table 5.8, Table 5.9, and Table 5.10.
Table 5.8. Summary of Resilient Modulus for Pavement Structure on Strong Subgrade.
Material
Traffic Level / SG Strength Low/High
5 inch AC & 16 inch CAB Medium/High
7 inch AC & 18 inch CAB Mr (psi) Mr (psi)
Base Subgrade Base Subgrade Base Subgrade 3546 I-15/Goodsprings 27,250 12,500 22,000 12,750 3546 NV-375/Rachel 27,000 11,250 22,000 11,500 3583 I-15/Goodsprings 21,600 12,500 17,800 12,750 3583 NV-375/Rachel 21,600 11,250 17,800 11,500 3597 I-15/Goodsprings 24,300 12,500 19,500 12,750 3597 NV-375/Rachel 24,300 11,250 19,500 11,500 3605 I-15/Goodsprings 19,500 12,500 15,200 12,750 3605 NV-375/Rachel 19,300 11,300 15,200 11,550 3607 I-15/Goodsprings 19,300 12,500 14,900 12,750 3607 NV-375/Rachel 19,000 11,250 14,800 11,500 3613 I-15/Goodsprings 21,400 12,500 17,400 12,750 3613 NV-375/Rachel 21,400 11,250 17,400 11,500

Characterization of Unbound Materials for Mechanistic-Empirical Pavement Design Guide (MEPDG)
80
Table 5.9. Summary of Resilient Modulus for Pavement Structure on Weak Subgrade.
Material
Traffic Level / SG Strength Low/Low
7 inch AC & 16 inch CAB Medium/Low
9.5 inch AC & 18 inch CAB High/Low
10.5 inch AC&23 inch CAB Resilient Modulus (psi) Resilient Modulus (psi) Resilient Modulus (psi)
Base Subgrade CAB SG CAB SG CAB SG 3546 US-95/Bonnie Claire 21,200 8,600 18,000 8,700 17,400 9,000 3546 US-95/Searchlight 21,800 10,600 18,500 10,900 17,800 11,250 3546 US-93/Crystal Spring MP62 21,000 7,700 17,800 8,000 17,200 8,300 3546 US-93/Crystal Spring MP67 21,800 10,600 18,500 10,900 17,800 11,250 3546 Borrow 3583 21,200 8,500 18,000 8,700 17,400 9,000 3583 US-95/Bonnie Claire 17,200 8,600 14,800 8,700 14,300 9,000 3583 US-95/Searchlight 17,700 10,600 15,300 10,900 14,600 11,250 3583 US-93/Crystal Spring MP62 17,000 7,700 14,600 8,000 14,200 8,300 3583 US-93/Crystal Spring MP67 17,700 10,600 15,300 10,900 14,600 11,250 3583 Borrow 3583 17,200 8,500 14,800 8,700 14,300 9,000 3597 US-95/Bonnie Claire 19,000 8,600 16,000 8,700 15,300 9,000 3597 US-95/Searchlight 19,400 10,600 16,500 10,900 15,800 11,250 3597 US-93/Crystal Spring MP62 18,700 7,700 15,800 8,000 15,200 8,300 3597 US-93/Crystal Spring MP67 19,400 10,600 16,500 10,900 15,800 11,250 3597 Borrow 3583 19,000 8,500 16,000 8,700 15,300 9,000 3605 US-95/Bonnie Claire 14,600 8,600 12,200 8,700 11,600 9,000 3605 US-95/Searchlight 15,200 10,650 12,700 10,900 11,900 11,250 3605 US-93/Crystal Spring MP62 14,400 7,750 12,000 8,000 11,400 8,300 3605 US-93/Crystal Spring MP67 15,200 10,650 12,700 10,900 11,900 11,250 3605 Borrow 3583 14,600 8,500 12,200 8,700 11,600 9,000 3607 US-95/Bonnie Claire 14,300 8,600 11,800 8,700 11,200 9,000 3607 US-95/Searchlight 14,800 10,600 12,300 10,900 11,500 11,250 3607 US-93/Crystal Spring MP62 14,100 7,700 11,600 7,950 11,000 8,300 3607 US-93/Crystal Spring MP67 14,800 10,600 12,300 10,900 11,500 11,250 3607 Borrow 3583 14,300 8,500 11,800 8,700 11,200 9,000 3613 US-95/Bonnie Claire 16,700 8,600 14,200 8,700 13,700 9,000 3613 US-95/Searchlight 17,200 10,600 14,700 10,900 14,000 11,250 3613 US-93/Crystal Spring MP62 16,500 7,700 14,000 8,000 13,500 8,300 3613 US-93/Crystal Spring MP67 17,200 10,600 14,700 10,900 14,000 11,250 3613 Borrow 3583 16,700 8,500 14,200 8,700 13,700 9,000

Characterization of Unbound Materials for Mechanistic-Empirical Pavement Design Guide (MEPDG)
81
Table 5.10. Summary of Resilient Moduli values for Pavement Structures with Borrow Layer.
Material 5.5inch AC, 16 inch CAB
and 10 inch Borrow 8.5inch AC, 18 inch CAB
and 10 inch Borrow
Resilient Modulus (psi) Resilient Modulus (psi) Base Borrow Subgrade CAB Borrow SG CAB Borrow SG 3583 3546 US-93/Crystal Spring MP62 20,300 11,800 8,200 15,900 11,700 8,500 3583 3546 Borrow 3583 20,300 11,900 8,900 15,900 11,900 9,200 3583 3597 US-93/Crystal Spring MP62 20,300 12,700 8,200 16,000 12,600 8,500 3583 3597 Borrow 3583 20,400 12,900 8,900 16,000 12,800 9,200 3583 3613 US-93/Crystal Spring MP62 20,300 11,900 8,200 16,000 11,900 8,500 3583 3613 Borrow 3583 20,300 12,100 8,900 16,000 12,100 9,200

Characterization of Unbound Materials for Mechanistic-Empirical Pavement Design Guide (MEPDG)
82
DESIGN RESILIENT MODULUS FOR REHABILITATION PROJECTS The MEPDG approach described in Chapter 5 generated good results when applied on new pavement design projects. In the case of rehabilitation projects (i.e. overlay), which is the most common type of projects for NDOT, a relationship between the backcalculated and design resilient modulus is needed for the implementation of the AASHTOWare® Pavement ME Design software (29). This chapter focuses on the methodology to develop representative resilient modulus values for unbound materials for the pavement design of rehabilitation projects. The effort will examine correlations between Mr of unbound materials and the corresponding R-value, UCS, and other physical properties. A stepwise mechanistic analysis approach for determining a representative Mr value for the unbound materials in base, subbase, and subgrade layers was applied. The ILLI-PAVE 2005 finite element (FE) pavement analysis program (34) was employed as an advanced structural model for computing stresses as well as deflection basins in typical NDOT’s flexible pavement structures under standard traffic loading. The main unique features of ILLI-PAVE in comparison with other pavement analysis software are:
• Inclusion of constitutive models (a total of six different models are readily available) allowing for the characterization of the non-linear “stress-dependent” resilient behavior of granular materials and fine-grained soils under repetitive loading which is unavailable in Linear Elastic Programs (LEP).
• Implementation of Mohr-Coulomb failure criteria (c and ϕ) for unbound materials.
• Substantially lower computational effort because of the use of axi-symmetric FE formulation.
• Ability to handle a flexible pavement structure with up to ten different layers. It should be noted that the ILLI-PAVE is the only model that allows the use of the constitutive Mr equations developed from the AASHTO T 307 tests. 6.1. Procedure for Identification of Design Resilient Modulus for Rehabilitation Designs The stepwise mechanistic approach using ILLI-PAVE implemented for the determination of Mr values for rehabilitation designs is summarized as follows.
• Step 1- Select Representative Pavement Structures: The analysis is initiated by establishing representative NDOT’s flexible pavement structures.
• Step 2- Pavement Layer Properties: Asphalt Concrete (AC): in order to incorporate the viscoelastic behavior of the AC
mixture in the ILLI-PAVE model, the AC layer was divided into sublayers and the dynamic modulus master curve for the asphalt mixture commonly used in NDOT District 1 was utilized to properly assign an elastic modulus for each of the sublayers using the appropriate loading frequency and temperature.

Characterization of Unbound Materials for Mechanistic-Empirical Pavement Design Guide (MEPDG)
83
Crushed Aggregate Base (CAB), Borrow, and Subgrade (SG): The constitutive stress-dependent models developed from the T 307 Mr tests as well as the laboratory determined Mohr-Coulomb failure criteria (c and ϕ) were used in the ILLI-PAVE model.
• Step 3- Pavement Responses: When considering the non-linearity of the unbound materials, the Mr property varies at different locations within the respective layer. In other words, the state of stresses at each point in the layer results in a different Mr value caused by the stress-dependency of the unbound material. Hence, calculating the Mr from a determined state of stresses at a specific location within the layer under the center of load and assigning the Mr value to the entire layer might be questionable. In this study, surface deflection basins (i.e. vertical deflection at various radial distances from the applied load) were generated through the ILLI-PAVE model for the representative pavement structures under the allowable maximum tire load in Nevada on a circular plate. The generated surface deflection basins obtained are then employed in a backcalculation analysis to identify the Mr of each pavement layer including the base, borrow, and subgrade.
• Step 4- Establish the Mr Correlation Equations: Using the backcalculated moduli values for various types of unbound materials and pavement structures, correlations between Mr and R-value, UCS, or physical properties were developed and examined for their effectiveness.
6.2. Identification of Resilient Modulus for Rehabilitation Design Flexible pavement sections used for the new designs were also used for this analysis. The AC layer was divided into sublayers as explained earlier. In the case of modulus for the AC mix, the damaged dynamic modulus master curve was used in order to simulate the in-situ AC layer of the flexible pavement in need for rehabilitation. The following steps were completed to develop the damaged dynamic modulus master curve:
1. Use the dynamic shear modulus and phase angle properties for a typical District 1 asphalt binder of PG76-22NV (as shown in Table 6.1) to estimate the viscosity of the binder at different temperatures.
2. Determine the regression parameters for equation 39. 3. The damage factor for the AC layer, dAC, in Equation 40 can be determined based
on the condition of the Ac layer as follows: a) Excellent condition, dAC between 0.00 and 0.20, b) Good condition, dAC between 0.20 and 0.40, c) Fair condition dAC between 0.40 and 0.80, d) Poor condition dAC between 0.80 and 1.20, and e) Very Poor condition dAC greater than 1.20. in this research, a Fair condition was assumed for the existing AC layer and a damage value of 0.6 was selected for use in Equation 40.
4. Using Equation 40, determine the damaged dynamic modulus of the AC layer for different frequencies and temperatures as shown in Table 6.2.

Characterization of Unbound Materials for Mechanistic-Empirical Pavement Design Guide (MEPDG)
84
Table 6.1. Representative Mean Dynamic Shear Modulus and Phase angle for PG 76-22 NV.
Temperature (F) Binder G* (Pa) Phase angle (deg) 147 7355 58.9 158 4638 58.4 169 2873 60.0
log (E∗) = δ +α
1 + eβ+γlog (𝑡𝑡𝑟𝑟)
(39)
Where; E*: asphalt concrete moduli, psi Δ: regression parameter tr
: reduced time α, β and γ: regression parameters
E∗dam = 10δ +E∗ − 10δ
1 + e−0.3+5∗log (dAC) (40)
Figure 6.1 presents the master curves for the undamaged and damaged dynamic modulus of the AC layer for a typical District 1 asphalt binder of PG76-22NV. It should be noted that the scales in Figure 6.1 are logarithmic, therefore, any small changes in the master curves represents large differences in the actual values of the dynamic modulus. The AC layer was divided into sublayers and each sublayer was assigned an appropriate damaged dynamic modulus value using the damaged modulus master curve.
Table 6.2. Damaged Dynamic Modulus Input Values at Different Temperatures and
Frequencies.
Frequency (Hz) Temperature (F) 14 40 70 100 130
0.1 1,997,842 828,806 172,699 44,108 20,482 0.5 2,301,555 1,181,348 299,833 70,823 27,379 1 2,414,573 1,342,907 376,385 88,597 31,821 5 2,635,369 1,716,813 611,987 153,256 47,935 10 2,713,571 1,870,344 738,021 194,959 58,616 25 2,802,917 2,061,039 924,129 267,061 77,985

Characterization of Unbound Materials for Mechanistic-Empirical Pavement Design Guide (MEPDG)
85
Figure 6.1. Damaged and undamaged dynamic modulus master curve.
For the base and borrow materials, the theta model (25) was used as an input to the ILLIPAVE software whereas for the subgrade, the Uzan model (26) was used. The values of the Poisson’s ratios and the classification of subgrade quality were kept similar to the case of new designs. The Falling Weight Deflectometer (FWD) test was simulated in the ILLIPAVE model by applying a circular load of 9,000 lbs with a radius of 5.9 inch. The cohesion and friction angle properties for one base and one subgrade material were determined in the laboratory while the properties for the reaming materials were estimated based on their corresponding USCS classifications. The laboratory measured values as shown in Table 6.3 were close to the ones estimated based on the USCS classifications.
Table 6.3. Cohesion and Friction Angle from the Laboratory Testing.
Material Cohesion (psi) Friction angle (deg) Base (Contract 3583) 4.1 48.9
Subgrade (I-15/Goodsprings) 8.2 33.8 The computer software, Modulus-6.1, was used to backcalculate the modulus values of the various layers using the deflection basins obtained from the ILLIPAVE analysis. An apparent rigid layer was introduced in the Modulus-6.1 software to capture the nonlinearity of the unbound materials. The backcalculation process was considered complete when the deflections basins calculated by the Modulus-6.1 model closely matched the deflections generated by the ILLIPAVE model. At this stage, the identified modulus values were assigned for the corresponding layers.
1
10
100
1000
10000
1E-09 0.000001 0.001 1 1000 1000000
Dyn
amic
Mod
ulus
Mas
ter
Cur
ve a
t 70˚
F (k
si)
Reduced Frequency(Hz)
E*_Undamaged E*_Damaged

Characterization of Unbound Materials for Mechanistic-Empirical Pavement Design Guide (MEPDG)
86
A sample calculation for a flexible pavement structure with 5.0 inch AC and 16.0 inch base material from contract 3546 on top of the subgrade material from the US-95/Bonnie Claire location is presented in this section. The forward calculation of the deflections by the ILLIPAVE model are summarized in Table 6.4. These deflections were used as input in the Modulus-6.1 model and the resulted backcaluated deflections are summarized in Table 6.5. Figure 6.2 presents the comparison between forward calculated and backcalculated deflections. The backcalculated moduli of the various layers are summarized in Table 6.6. The absolute error was 0.97 and E4/stiffness ratio was 5.5. Summary of the results from this analysis are presented in Table 6.7, Table 6.8 and Table 6.9 for different pavement structures.
Table 6.4. Deflections at various Radial Distances generated by the ILLIPAVE Model.
Radial Distance (inch)
Vertical Defection
(mils) 0 23.08 8 16.39 12 12.68 18 8.73 24 6.28 36 3.63 48 1.99 60 1.04 72 0.55
Table 6.5. Deflection at Various Distances Backcalculated by the Modulus 6.1
Model.
Radial Distance (inch)
Defection (mils)
0 23.14 8 16.29 12 12.65 24 6.43 36 3.55 48 1.99 60 1.13
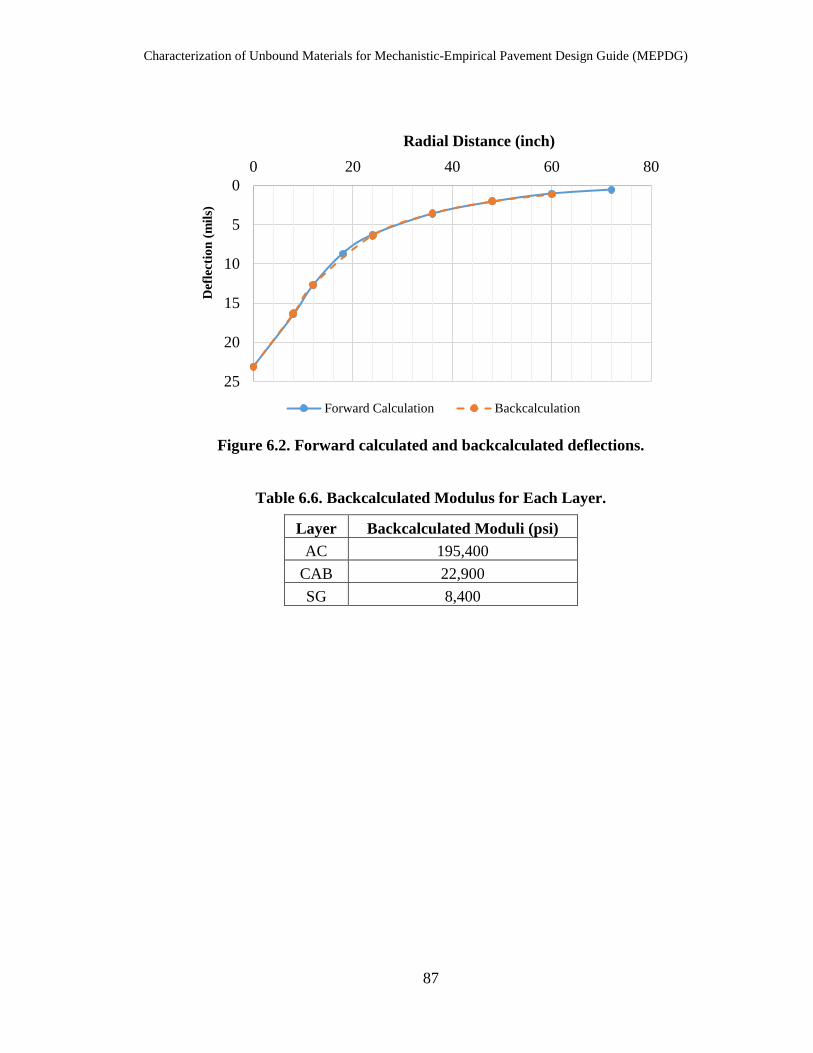
Characterization of Unbound Materials for Mechanistic-Empirical Pavement Design Guide (MEPDG)
87
Figure 6.2. Forward calculated and backcalculated deflections.
Table 6.6. Backcalculated Modulus for Each Layer.
Layer Backcalculated Moduli (psi) AC 195,400
CAB 22,900 SG 8,400
0
5
10
15
20
25
0 20 40 60 80
Def
lect
ion
(mils
)
Radial Distance (inch)
Forward Calculation Backcalculation

Characterization of Unbound Materials for Mechanistic-Empirical Pavement Design Guide (MEPDG)
88
Table 6.7. Summary of Backcalculated Moduli values for Pavement Structures with Borrow Layer.
Material Pavement Structure
7 inch AC & 18 inch CAB Backcalculated Moduli (psi)
CAB Borrow Subgrade SG Borrow CAB AC 3546 3546 US-95/Bonnie Claire 5,400 11,900 16,500 191,000 3546 3546 US-95/Searchlight 6,300 13,300 16,800 189,400 3546 3596 US-93/Crystal Spring MP62 5,400 13,900 16,300 192,900 3546 3596 US-93/Crystal Spring MP67 6,300 15,500 16,500 192,800 3546 3613 Borrow 3583 5,600 10,700 17,100 186,300 3583 3613 US-95/Bonnie Claire 7,000 10,600 17,700 183,500

Characterization of Unbound Materials for Mechanistic-Empirical Pavement Design Guide (MEPDG)
89
Table 6.8. Summary of Backcalculated Moduli for Pavement Structures on Strong Subgrade.
Material
Traffic Level / SG Strength Low/High
5 inch AC & 16 inch CAB Medium/High
7 inch AC & 18 inch CAB Backcalculated Moduli (psi) Backcalculated Moduli (psi)
CAB SG CAB SG AC CAB SG AC 3546 I-15/Goodsprings 22,900 8,400 195,400 22,300 8,200 176,700 3546 NV-375/Rachel 22,400 7,700 197,200 21,600 7,700 178,400 3586 I-15/Goodsprings 19,800 8,400 187,900 19,300 8,100 173,200 3583 NV-375/Rachel 19,700 7,600 185,900 19,100 7,400 172,800 3597 I-15/Goodsprings 21,300 8,200 191,700 20,600 8,000 174,700 3597 NV-375/Rachel 20,800 7,400 193,000 19,900 7,500 176,600 3605 I-15/Goodsprings 17,900 7,600 187,500 17,000 7,300 173,900 3605 NV-375/Rachel 17,600 6,900 187,800 16,700 6,900 173,100 3607 I-15/Goodsprings 17,800 7,200 186,700 16,500 7,200 174,700 3607 NV-375/Rachel 17,200 6,800 189,900 16,100 6,800 175,000 3613 I-15/Goodsprings 19,700 8,000 186,400 19,000 7,700 172,800 3613 NV-375/Rachel 19,100 7,500 187,800 18,500 7,300 172,500
`

Characterization of Unbound Materials for Mechanistic-Empirical Pavement Design Guide (MEPDG)
90
Table 6.9. Summary of Backcalculated Moduli for Pavement Structures on Weak Subgrade.
Material
Traffic Level / SG Strength Low/Low
7 inch AC & 16 inch CAB Medium/Low
9.5 inch AC & 18 inch CAB Backcalculated Moduli (psi) Backcalculated Moduli (psi)
CAB SG CAB SG AC CAB SG AC 3546 US-95/Bonnie Claire 20,500 6,600 170,300 19,800 6,800 158,000 3546 US-95/Searchlight 22,800 7,300 165,200 21,000 7,700 158,000 3546 US-93/Crystal Spring MP62 20,600 5,700 167,700 19,000 6,400 158,600 3546 US-93/Crystal Spring MP67 22,800 7,300 166,100 21,100 7,800 157,600 3546 Borrow 3583 22,300 6,900 164,600 20,500 7,500 158,100 3583 US-95/Bonnie Claire 17,900 6,600 167,900 17,400 6,500 157,100 3583 US-95/Searchlight 19,300 7,600 164,800 18,300 7,500 157,000 3583 US-93/Crystal Spring MP62 17,600 6,000 167,500 17,200 6,000 156,400 3583 US-93/Crystal Spring MP67 19,400 7,600 164,300 18,400 7,500 156,600 3583 Borrow 3583 18,900 7,100 164,300 18,100 7,200 156,500 3597 US-95/Bonnie Claire 18,500 6,700 170,800 18,200 6,600 157,500 3597 US-95/Searchlight 20,100 7,600 167,700 19,100 7,600 158,000 3597 US-93/Crystal Spring MP62 18,400 6,000 168,100 17,500 6,200 158,200 3597 US-93/Crystal Spring MP67 20,200 7,600 167,400 19,500 7,500 156,300 3597 Borrow 3583 19,800 7,200 165,700 19,100 7,200 155,900 3605 US-95/Bonnie Claire 16,100 6,000 165,000 15,100 6,100 156,700 3605 US-95/Searchlight 16,900 7,200 164,600 16,000 7,000 155,600 3605 US-93/Crystal Spring MP62 15,300 5,700 167,600 14,500 5,800 156,900 3605 US-93/Crystal Spring MP67 17,000 7,100 164,800 16,000 7,000 156,200 3605 Borrow 3583 16,700 6,700 162,900 15,600 6,700 155,900 3607 US-95/Bonnie Claire 15,600 5,900 166,200 14,800 5,900 155,300 3607 US-95/Searchlight 16,500 7,000 165,300 15,600 6,900 155,600 3607 US-93/Crystal Spring MP62 14,800 5,500 168,400 14,000 5,700 157,400 3607 US-93/Crystal Spring MP67 16,900 6,800 164,000 15,600 6,800 155,700 3607 Borrow 3583 16,200 6,600 164,000 15,300 6,500 155,200 3613 US-95/Bonnie Claire 17,400 6,500 166,700 17,000 6,400 155,900 3613 US-95/Searchlight 18,900 7,400 164,100 17,800 7,400 156,500 3613 US-93/Crystal Spring MP62 17,100 5,800 166,500 16,300 6,100 157,300 3613 US-93/Crystal Spring MP67 19,000 7,200 168,800 17,900 7,300 156,100 3613 Borrow 3583 18,400 7,000 164,000 17,500 7,000 155,900

Characterization of Unbound Materials for Mechanistic-Empirical Pavement Design Guide (MEPDG)
91
RESILIENT MODULUS PREDICTION MODEL DEVELOPMENT The goal of this analysis is to develop a prediction model for Mr value to be used in the design of flexible pavements as function of empirical and physical properties for the unbound materials. The properties considered in the development of the prediction model, included; R-value, unconfined compressive strength, materials passing sieves #200, #40, 3/8”, maximum dry density, optimum moisture content, and plasticity index. In addition, the pavement equivalent thickness in terms of the base, borrow, or the subgrade layer were identified as critical parameters in the determination of the design Mr for unbound layers. The layer thicknesses above the base, borrow, and subgrade used for the state of stress calculations were transformed into equivalent thickness of base, borrow, or subgrade using the method of equivalent thickness (MET) as presented in Equations 41, 42, and 43.
Heq, CAB = 𝐡𝐡𝐀𝐀𝐂𝐂 �
𝐄𝐄𝐀𝐀𝐂𝐂 ∗ (𝟏𝟏 − 𝛎𝛎𝐒𝐒𝐒𝐒𝟐𝟐)𝐄𝐄𝐒𝐒𝐒𝐒 ∗ (𝟏𝟏 − 𝛎𝛎𝐀𝐀𝐂𝐂𝟐𝟐)�
(𝟏𝟏/𝟐𝟐)
+𝐡𝐡𝐂𝐂𝐀𝐀𝐂𝐂𝟏𝟏
* �𝐄𝐄𝐂𝐂𝐀𝐀𝐂𝐂 ∗ (𝟏𝟏 − 𝛎𝛎𝐒𝐒𝐒𝐒𝟐𝟐)𝐄𝐄𝐒𝐒𝐒𝐒 ∗ (𝟏𝟏 − 𝛎𝛎𝐂𝐂𝐀𝐀𝐂𝐂𝟐𝟐)�
(𝟏𝟏/𝟐𝟐)
(41)
Heq, BOR= 𝒉𝒉𝑨𝑨𝑨𝑨 �
𝑬𝑬𝑨𝑨𝑨𝑨 ∗ (𝟏𝟏 − 𝝂𝝂𝑺𝑺𝑺𝑺𝟐𝟐)𝑬𝑬𝑺𝑺𝑺𝑺 ∗ (𝟏𝟏 − 𝝂𝝂𝐀𝐀𝐂𝐂𝟐𝟐)�
(𝟏𝟏/𝟐𝟐)
+ 𝒉𝒉𝑨𝑨𝑨𝑨𝑪𝑪* �𝑬𝑬𝑨𝑨𝑨𝑨𝑪𝑪 ∗ (𝟏𝟏 − 𝝂𝝂𝑺𝑺𝑺𝑺𝟐𝟐)𝑬𝑬𝑺𝑺𝑺𝑺 ∗ (𝟏𝟏 − 𝝂𝝂𝑺𝑺𝑺𝑺𝟐𝟐) �
(𝟏𝟏/𝟐𝟐)
+𝐡𝐡𝐂𝐂𝐁𝐁𝐁𝐁𝟏𝟏
* �𝐄𝐄𝐂𝐂𝐁𝐁𝐁𝐁 ∗ (𝟏𝟏 − 𝛎𝛎𝐒𝐒𝐒𝐒𝟐𝟐)𝐄𝐄𝐒𝐒𝐒𝐒 ∗ (𝟏𝟏 − 𝛎𝛎𝐂𝐂𝐁𝐁𝐁𝐁𝟐𝟐)�
(𝟏𝟏/𝟐𝟐)
(42)
Heq, SG= 𝒉𝒉𝑨𝑨𝑨𝑨 �𝑬𝑬𝑨𝑨𝑨𝑨 ∗ �𝟏𝟏 − 𝝂𝝂𝑺𝑺𝑺𝑺𝟐𝟐�𝑬𝑬𝑺𝑺𝑺𝑺 ∗ (𝟏𝟏 − 𝝂𝝂𝐀𝐀𝐂𝐂𝟐𝟐)�
�𝟏𝟏𝟐𝟐�
+ 𝒉𝒉𝑨𝑨𝑨𝑨𝑪𝑪* �𝑬𝑬𝑨𝑨𝑨𝑨𝑪𝑪 ∗ �𝟏𝟏 − 𝝂𝝂𝑺𝑺𝑺𝑺𝟐𝟐�𝑬𝑬𝑺𝑺𝑺𝑺 ∗ (𝟏𝟏 − 𝝂𝝂𝑺𝑺𝑺𝑺𝟐𝟐) �
�𝟏𝟏𝟐𝟐�
+ 𝟏𝟏𝟏𝟏
(43)
Where;
Heq, CAB: equivalent thickness of the base layer, inch Heq, BOR: equivalent thickness of the borrow layer, inch Heq, SG: equivalent thickness of the subgrade layer, inch EAC: modulus of AC layer, psi ECAB: resilient modulus of base layer, psi ECAB: resilient modulus of borrow layer, psi ESG: resilient modulus of subgrade layer, psi νAC: Poisson’s ratio of AC layer νCAB: Poisson’s ratio of base layer νBOR: Poisson’s ratio of borrow layer νSG: Poisson’s ratio of subgrade layer

Characterization of Unbound Materials for Mechanistic-Empirical Pavement Design Guide (MEPDG)
92
7.1. Statistical Analysis Multi linear regression analysis was conducted using the R software (35). The following assumptions were checked for each model:
• If errors are following a normal distribution • Multi-collinearity
Anderson-Darling normality test (36) and variance inflation factors (37) were used to check the normality and multi-collinearity respectively. A backward elimination method was used to identify the best fit model. First, all of the identified variables were included in the analysis and tested for statistical significance. Next, the non-significant variables (i.e., p-value greater than 0.05) were removed and the analysis was repeated until all the significant variables were identified. Based on the results of the statistical analysis, it is observed that the design resilient modulus of the subgrade does not change with the pavement structure. However, the design resilient modulus of base and borrow layers change significantly with the pavement structure. Accordingly, the data for the base and borrow layers were combined to develop a single prediction model while the prediction model for the subgrade layer was established separately. The ranges of data that were used for the model development are shown in Table 7.1.
Table 7.1. Range of Variables for the Design Mr Models Development.
Parameter Range of Data
Subgrade Base Borrow Min Max Min Max Min Max
R-value 44 82 71 85 78 83 P#200(%) 5.4 66.9 5.3 10 7.3 16.4 P#40(%) 15.2 84.2 12.6 19.3 15.4 28.7
P# 3/8(%) 52.2 99.3 54.1 76.3 69.8 99.9 Maximum dry density (pcf) 119.4 139.2 135.8 147.5 133.8 143.2
Optimum moisture content (%) 6.1 10.7 3.5 6.7 5.4 7.2 UCS (psi) 2.7 8.9 2.8 9.7 1.3 6.6
PI 1 4.7 0 0 0 3.3 Heq (inch) 48.5 80.8 17.1 35.3 38.3 54.4
Mr (new design) 7,700 13,200 11,000 27,250 11,700 20,400 Mr (rehabilitation) 5,400 8,400 14,000 22,900 10,600 15,500
Two sets of models were examined; a) a prediction model with the UCS and without the R-value and b) a prediction model without the UCS and with the R-value. The summary of the developed models for new design and rehabilitation projects with UCS and R-value are presented in Table 7.2 and Table 7.3, respectively. The typical residual plot and normality plot from the R software are shown in Figure 7.1 and Figure 7.2. The residual
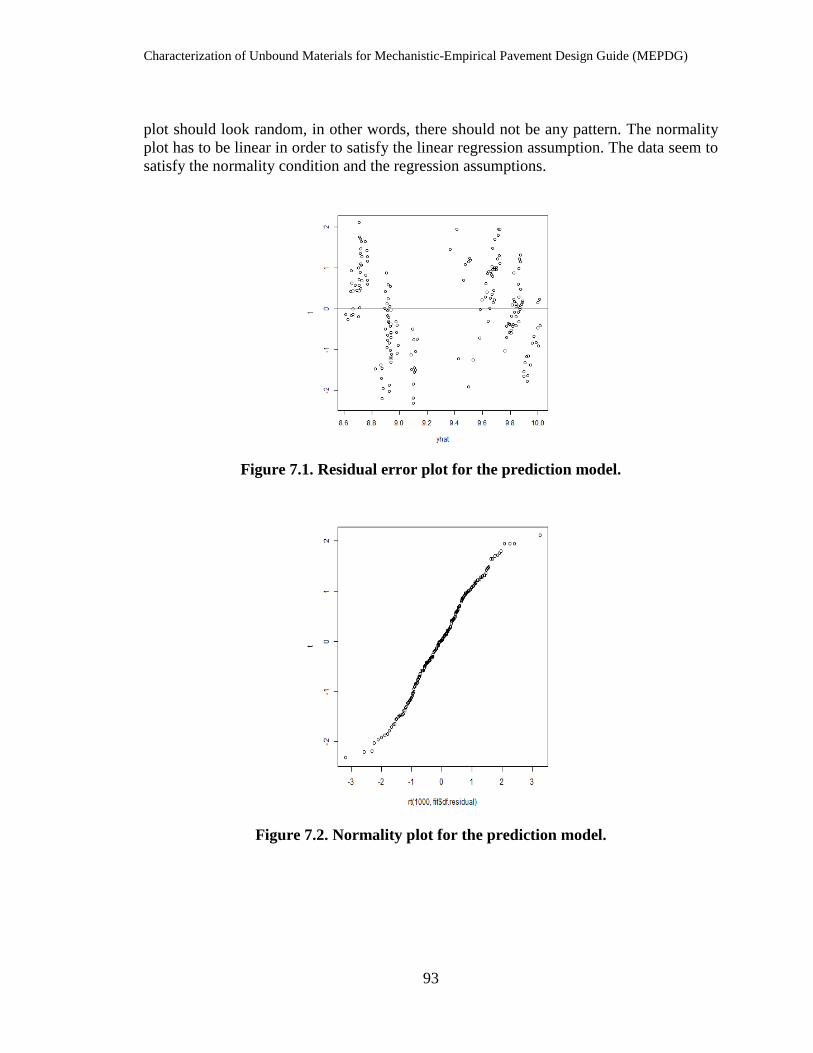
Characterization of Unbound Materials for Mechanistic-Empirical Pavement Design Guide (MEPDG)
93
plot should look random, in other words, there should not be any pattern. The normality plot has to be linear in order to satisfy the linear regression assumption. The data seem to satisfy the normality condition and the regression assumptions.
Figure 7.1. Residual error plot for the prediction model.
Figure 7.2. Normality plot for the prediction model.

Characterization of Unbound Materials for Mechanistic-Empirical Pavement Design Guide (MEPDG)
94
Table 7.2. Summary of Design Resilient Modulus Models with UCS.
Ln(Mr) Intercept P#200 (%)
P#40 (%)
P#3/8 (%)
ᵞd (pcf)
OMC (%)
UCS (psi) PI Heq
(inch) Norm* Mul. Col**
R-Square
Ln(MrSG-New) 7.4514 0.0036 -0.0129 0.0158 0.0973 0.0311 Fail Fail 0.8818
Ln(MrSG-Reh) 9.2335 0.0028 -0.0045 -0.0401 0.0318 0.0158 Pass Fail 0.6180 Ln(MrCAB-
New) 9.8294 0.0060 0.0066 0.1122 -0.0878 -0.0270 Pass Pass 0.9641
Ln(MrCAB-Reh) 9.8130 0.0031 0.0738 -0.0597 -0.0088 Fail Pass 0.8469 Ln(MrBOR-
New) 10.0307 0.0165 0.0245 0.0740 -0.0818 -0.0286 Fail Pass 0.8479
Ln(MrBOR-Reh) 10.3677 0.0160 -0.0087 -0.0234 -0.0165 Pass Pass 0.6339
Table 7.3. Summary of Design Resilient Modulus Models with R-value.
Ln(Mr) Intercept R- value
P#40 (%)
P#3/8 (%)
ᵞd (pcf)
OMC (%) PI Heq
(inch) Norm* Mul. Col**
R-Square
Ln(MrSG-New) 3.1784 0.0180 0.0136 0.0315 0.0433 Fail Fail 0.8272 Ln(MrSG-Reh) 5.3982 0.0134 0.0125 -0.0032 0.0168 0.0177 Pass Fail 0.7065 Ln(MrCAB-
New) 7.3224 0.0366 -0.0656 0.0256 -0.0893 -0.0270 Fail Pass 0.9644
Ln(MrCAB-
Reh) 8.0140 0.0261 -0.0485 0.0161 -0.0659 -0.0089 Fail Pass 0.8542
Ln(MrBOR-
New) 8.9671 0.0102 0.0123 -0.0743 -0.0189 Fail Pass 0.6000
Ln(MrBOR-
Reh) 9.2304 0.0136 -0.0229 0.0079 -0.0661 -0.0127 Fail Pass 0.6594
**Multi-collinearity, *Normality, ᵞd: Maximum dry unit weight, PI: Plasticity index

Characterization of Unbound Materials for Mechanistic-Empirical Pavement Design Guide (MEPDG)
95
Based on the analysis of the multiple models, the resilient modulus of the subgrade can be estimated from the R-value or the UCS. However, for the base and borrow materials, the R-value only should be used to predict the resilient modulus. The UCS of the base and borrow materials is not a good indicator of their Mr property. Within the pavement structure, base and borrow materials are subjected to confinement and deviator stresses. Therefore, the UCS test is not a representative strength test for the in-situ conditions of the base and borrow layers. However, in the case of subgrade, since the confinement and deviator stresses are relatively low, the UCS test values can be used as a strength property as was shown in several past studies. Based on the analysis of the data generated from this experiment, a correlation was found possible between the equivalent thickness and depth from pavement surface to the location where the state of stress was calculated (D) as shown in Figure 7.3. The depth of location for state of the stress calculation was defined in the MEPDG procedure (see step number 2 under Section 5.1 – for the aggregate base layer and embankment stresses are determined at their quarter depth, while for the subgrade, stresses are determined 18 inches into the subgrade). According to the MEPDG procedure, a trial pavement structure must be assumed in the design process. Therefore, using the assumed pavement structure, the depth to the state of stress calculation can be determined for each layer and used to calculate the equivalent thickness in terms of the layer being analyzed using Equations 44 to 47 (different equations for New and Rehabilitation designs and for CAB and Borrow materials). Once the equivalent thickness is computed, the resilient modulus of the layer being analyzed can be estimated from the models presented in Table 7.2 and Table 7.3 and can be used as a Level 2 input for the AASHTOWare® Pavement ME Design software (29).
Figure 7.3. Correlation between Heq and D for new design.
y = 2.2432x - 1.9263R² = 0.8901
0.0
5.0
10.0
15.0
20.0
25.0
30.0
35.0
40.0
6.0 8.0 10.0 12.0 14.0 16.0
Heq
(inc
h)
D (inch)

Characterization of Unbound Materials for Mechanistic-Empirical Pavement Design Guide (MEPDG)
96
𝑯𝑯𝒆𝒆𝒆𝒆𝒆𝒆𝒆𝒆𝒆𝒆−𝑨𝑨𝑨𝑨𝑪𝑪 = 𝟐𝟐.𝟐𝟐𝟏𝟏𝟐𝟐𝟐𝟐 ∗ 𝑫𝑫 − 𝟏𝟏.𝟗𝟗𝟐𝟐𝟗𝟗𝟐𝟐 (44) 𝑯𝑯𝒆𝒆𝒆𝒆𝒆𝒆𝒆𝒆𝒆𝒆−𝑪𝑪𝑩𝑩𝑴𝑴 = 𝟏𝟏.𝟐𝟐𝟐𝟐𝟏𝟏𝟏𝟏 ∗ 𝑫𝑫 + 𝟗𝟗.𝟗𝟗𝟏𝟏𝟏𝟏𝟗𝟗 (45) 𝑯𝑯𝒆𝒆𝒆𝒆𝟎𝟎𝒆𝒆𝒉𝒉−𝑨𝑨𝑨𝑨𝑪𝑪 = 𝟐𝟐.𝟐𝟐𝟗𝟗𝟗𝟗 ∗ 𝑫𝑫 − 𝟏𝟏.𝟎𝟎𝟏𝟏𝟗𝟗𝟏𝟏 (46) 𝑯𝑯𝒆𝒆𝒆𝒆𝟎𝟎𝒆𝒆𝒉𝒉−𝑪𝑪𝑩𝑩𝟎𝟎 = 𝟏𝟏.𝟏𝟏𝟏𝟏𝟐𝟐 ∗ 𝑫𝑫 + 𝟏𝟏.𝟏𝟏𝟏𝟏𝟏𝟏 (47)
Where; HeqNew-CAB: equivalent thickness of the base layer for new design, inch HeqNew-BOR: equivalent thickness of the borrow layer for new design, inch HeqReh-CAB: equivalent thickness of the base layer for rehabilitation design, inch HeqReh-BOR: equivalent thickness of the borrow layer for rehabilitation, inch D: depth of location for state of stress calculation (base, borrow, and subgrade), inch 7.2. Comparison of Resilient Modulus Prediction Models The comparison between the design resilient modulus and predicted resilient modulus of subgrade by using the UCS for the new design and rehabilitation projects is presented in Figure 7.4 and Figure 7.5, respectively. Figure 7.6 and Figure 7.7 presents the comparison of design resilient modulus and predicted resilient modulus for the new design and rehabilitation projects using the R-value, respectively. It can be easily observed that the prediction of the design resilient modulus for the borrow material can be improved with additional data points.
Figure 7.4. Variation of design resilient modulus versus predicted resilient modulus
of subgrade (using UCS) for new design.
0
10,000
20,000
0 10,000 20,000
Pred
icte
d M
r for
New
Des
ign
(psi
)
Design Mr for New Design (psi)

Characterization of Unbound Materials for Mechanistic-Empirical Pavement Design Guide (MEPDG)
97
Figure 7.5. Variation of design resilient modulus versus predicted resilient modulus
of subgrade (using UCS) for rehabilitation design.
Figure 7.6. Variation of design resilient modulus with predicted resilient modulus
(using R-value) for new design.
0
10,000
20,000
0 10,000 20,000
Pred
icte
d M
r for
Reh
abili
tatio
n (p
si)
Design Mr for Rehabilitation (psi)
0
10,000
20,000
30,000
0 10,000 20,000 30,000
Pred
icte
d M
r for
New
Des
ign
(psi
)
Design Mr for New Design (psi)
Base
Borrow
Subgrade

Characterization of Unbound Materials for Mechanistic-Empirical Pavement Design Guide (MEPDG)
98
Figure 7.7. Variation of rehabilitation design resilient modulus with predicted
resilient modulus (using R-value) for rehabilitation design. The comparison of resilient modulus prediction models for the new and rehabilitation designs based on R-value is presented in Figure 7.8. It can be seen that the predicted resilient modulus for the subgrade materials for new design is consistently higher than rehabilitation design while a better agreement is achieved for the base layer. A comparison between resilient modulus prediction from the current NDOT equation and the model for the design resilient modulus developed using R-value is presented in Figure 7.9. It can be seen that the current NDOT resilient modulus equation in terms of R-value consistently overestimates the resilient modulus for all layers and for both new and rehabilitation designs. This further supports the need to establish prediction models for the design resilient modulus of unbound and subgrade layers that are based on the strength and physical properties of locally available granular materials and in-place natural soils.
0
10,000
20,000
30,000
0 10,000 20,000 30,000
Pred
icte
d M
r For
Reh
abili
tatio
n (p
si)
Design Mr for Rehabilitation (psi)
Base
Borrow
Subgrade

Characterization of Unbound Materials for Mechanistic-Empirical Pavement Design Guide (MEPDG)
99
Figure 7.8. Comparison of predicted rehabilitation and new design Mr (R-value).
Figure 7.9. Variation of NDOT predicted Mr and predicted Mr for new and
rehabilitation design (R-value).
0
10,000
20,000
30,000
0 10,000 20,000 30,000
Pred
icte
d N
ew D
esig
n M
r (ps
i)
Predicted Rehabilitation Mr (psi)
Base
Borrow
Subgrade
0
10,000
20,000
30,000
40,000
50,000
0 10,000 20,000 30,000 40,000 50,000
New
and
Reh
abili
tatio
n Pr
edic
ted
Mr(p
si)
NDOT Predicted Resilient modulus (psi)
New Base Rehab Base
New Borrow Rehab Borrow
New Subgrade Rehab Subgrade

Characterization of Unbound Materials for Mechanistic-Empirical Pavement Design Guide (MEPDG)
100
7.3. AASHTOWare® Pavement ME Comparison The effect of the design resilient modulus models developed in this research on the design of typical flexible pavements was evaluated by using the AASHTOWare® Pavement ME design software. The design was done for 10 million design ESALs. The design inputs were obtained from the NDOT manual (2). The input resilient modulus and design pavement structure without borrow material is shown in Table 7.4 and Table 7.5, respectively. The current NDOT manual specifies a resilient modulus for the base layer of 26,000 psi regardless of the R-value. It can be observed that the design thickness of the asphalt concrete layer is increased by 0.5 – 1.0 inch when using the design resilient modulus model based on the R-value. Similar observation was found in the pavement structure with borrow materials as shown in Table 7.6 and Table 7.7.
Table 7.4. Resilient Modulus of Unbound materials (without Borrow Material).
Strength Properties Base Subgrade R-value 80 44
Resilient Modulus(psi) (NDOT) 36,929 10,918 Resilient Modulus(psi)(Developed model) 18,458 8,779
Table 7.5. Design Flexible Pavement Structure.
Mr Equation Pavement Thickness (inch) AC Base
Current NDOT 6 16 Developed Model 7 16
Developed Model with 26000 psi Base 6.5 16
Table 7.6. Resilient Modulus of Unbound materials (with Borrow Material).
Strength Properties Base Borrow Subgrade R-value 80 78 44
Resilient Modulus(psi) (NDOT) 36,929 34,511 10,918 Resilient Modulus(psi)(Developed model) 20,214 16,289 8,779
Table 7.7. Design Pavement Structure (With Borrow Material).
Mr Equation Pavement Thickness (inch) AC Base Borrow
Current NDOT 6 10 8 Developed Model 7 10 8
Developed Model with 26000 psi Base 6.5 10 8

Characterization of Unbound Materials for Mechanistic-Empirical Pavement Design Guide (MEPDG)
101
CONCLUSIONS AND RECOMMENDATIONS The major objective of this study is to develop a resilient modulus prediction model for unbound materials to be used for new design and rehabilitation projects in NDOT District 1. This objective was achieved by sampling and testing of different base, borrow, and subgrade materials from District 1. The classifications of materials were conducted according to AASHTO and UCSE systems. The maximum dry density and optimum moisture content relationships were obtained by conducting moisture-density tests for all materials. The resilient modulus and unconfined compressive strength tests were conducted on the evaluated materials at the optimum moisture content. Two different approaches were used to determine the design resilient modulus; a) for new design and b) for rehabilitation design. Based on the generated data conducted from the experiment and the statistical analyses, the following observations and conclusions can be made:
• The stress dependent behavior of the resilient modulus for the base and borrow material fits very well the Theta model.
• The stress dependent behavior of resilient modulus for the subgrade materials fits very well both the universal model and Uzan model.
• The resilient modulus of base and borrow materials is significantly influenced by the pavement structure.
• The design resilient modulus of the subgrade layer for new pavement designs can be predicted based on UCS or R-value from the following models.
ln(𝑴𝑴𝑴𝑴𝑺𝑺𝑺𝑺−𝒆𝒆𝒆𝒆𝒆𝒆)= 7.4514+0.0036*P#200 -0.0129*P#3/8+ 0.0158* 𝜸𝜸𝒅𝒅+ 𝟏𝟏.𝟏𝟏𝟗𝟗𝟎𝟎𝟐𝟐 ∗ 𝑼𝑼𝑨𝑨𝑺𝑺 + 𝟏𝟏.𝟏𝟏𝟐𝟐𝟏𝟏𝟏𝟏 ∗ 𝑷𝑷𝑷𝑷
(48)
ln (𝑴𝑴𝑴𝑴𝑺𝑺𝑺𝑺−𝒆𝒆𝒆𝒆𝒆𝒆)= 3.1784+0.018*R-value +0.0136*P#40+ 0.0315* 𝜸𝜸𝒅𝒅+ 𝟏𝟏.𝟏𝟏𝟏𝟏𝟐𝟐𝟐𝟐 ∗ 𝑷𝑷𝑷𝑷
(49)
• The design resilient modulus of the subgrade layer for rehabilitation pavement designs can be predicted based on UCS or R-value from the following models.
ln (𝑴𝑴𝑴𝑴𝑺𝑺𝑺𝑺−𝟎𝟎𝒆𝒆𝒉𝒉)= 9.2335+0.0028*P#200 -0.0045*P#3/8 - 0.0401*OMC+ 𝟏𝟏.𝟏𝟏𝟐𝟐𝟏𝟏𝟏𝟏 ∗ 𝑼𝑼𝑨𝑨𝑺𝑺 + 𝟏𝟏.𝟏𝟏𝟏𝟏𝟏𝟏𝟏𝟏 ∗ 𝑷𝑷𝑷𝑷
(50)
ln (𝑴𝑴𝑴𝑴𝑺𝑺𝑺𝑺−𝟎𝟎𝒆𝒆𝒉𝒉)= 5.3982+0.0134*R-value +0.0125*P#40-0.0032*P#3/8 + 0.0168* 𝜸𝜸𝒅𝒅 + 𝟏𝟏.𝟏𝟏𝟏𝟏𝟎𝟎𝟎𝟎 ∗ 𝑷𝑷𝑷𝑷
(51)
• The design resilient modulus of the base layer for new pavement and rehabilitation pavement designs can be predicted based on R-value from the following models.

Characterization of Unbound Materials for Mechanistic-Empirical Pavement Design Guide (MEPDG)
102
ln (𝑴𝑴𝑴𝑴𝑨𝑨𝑨𝑨𝑪𝑪−𝒆𝒆𝒆𝒆𝒆𝒆)=7.3224+0.0366*R-value -0.0656*P#40+0.0256*P#3/8 −𝟏𝟏.𝟏𝟏𝟏𝟏𝟗𝟗𝟐𝟐 ∗ 𝑩𝑩𝑴𝑴𝑨𝑨 − 𝟏𝟏.𝟏𝟏𝟐𝟐𝟎𝟎𝟏𝟏 ∗ 𝑯𝑯𝒆𝒆𝒆𝒆
(52)
ln (𝑴𝑴𝑴𝑴𝑨𝑨𝑨𝑨𝑪𝑪−𝟎𝟎𝒆𝒆𝒉𝒉)=8.0140+0.0261*R-value -0.0485*P#40+0.0161*P#3/8 −𝟏𝟏.𝟏𝟏𝟗𝟗𝟏𝟏𝟗𝟗 ∗ 𝑩𝑩𝑴𝑴𝑨𝑨 − 𝟏𝟏.𝟏𝟏𝟏𝟏𝟏𝟏𝟗𝟗 ∗ 𝑯𝑯𝒆𝒆𝒆𝒆
(53)
• The design resilient modulus of the borrow layer for new pavement and rehabilitation pavement designs can be predicted based on R-value from the following models.
ln (𝑴𝑴𝑴𝑴𝑪𝑪𝑩𝑩𝟎𝟎−𝒆𝒆𝒆𝒆𝒆𝒆)=8.9671+0.0102*R-value+0.0123*P#3/8 − 𝟏𝟏.𝟏𝟏𝟎𝟎𝟏𝟏𝟐𝟐∗ 𝑩𝑩𝑴𝑴𝑨𝑨 − 𝟏𝟏.𝟏𝟏𝟏𝟏𝟏𝟏𝟗𝟗 ∗ 𝑯𝑯𝒆𝒆𝒆𝒆
(54)
ln (𝑴𝑴𝑴𝑴𝑪𝑪𝑩𝑩𝟎𝟎−𝟎𝟎𝒆𝒆𝒉𝒉)=9.2304+0.0136*R-value-0.0229*P#40+0.0079*P#3/8 −𝟏𝟏.𝟏𝟏𝟗𝟗𝟗𝟗𝟏𝟏 ∗ 𝑩𝑩𝑴𝑴𝑨𝑨 − 𝟏𝟏.𝟏𝟏𝟏𝟏𝟐𝟐𝟎𝟎 ∗ 𝑯𝑯𝒆𝒆𝒆𝒆
(55)
• The equivalent thickness (Heq) is calculated for the layer being analyzed using Equations 56 to 59 based on the depth of location for state of stress calculation (base, borrow, and subgrade).
𝑯𝑯𝒆𝒆𝒆𝒆𝒆𝒆𝒆𝒆𝒆𝒆−𝑨𝑨𝑨𝑨𝑪𝑪 = 𝟐𝟐.𝟐𝟐𝟏𝟏𝟐𝟐𝟐𝟐 ∗ 𝑫𝑫 − 𝟏𝟏.𝟗𝟗𝟐𝟐𝟗𝟗𝟐𝟐 (56) 𝑯𝑯𝒆𝒆𝒆𝒆𝒆𝒆𝒆𝒆𝒆𝒆−𝑪𝑪𝑩𝑩𝑴𝑴 = 𝟏𝟏.𝟐𝟐𝟐𝟐𝟏𝟏𝟏𝟏 ∗ 𝑫𝑫 + 𝟗𝟗.𝟗𝟗𝟏𝟏𝟏𝟏𝟗𝟗 (57) 𝑯𝑯𝒆𝒆𝒆𝒆𝟎𝟎𝒆𝒆𝒉𝒉−𝑨𝑨𝑨𝑨𝑪𝑪 = 𝟐𝟐.𝟐𝟐𝟗𝟗𝟗𝟗 ∗ 𝑫𝑫 − 𝟏𝟏.𝟎𝟎𝟏𝟏𝟗𝟗𝟏𝟏 (58) 𝑯𝑯𝒆𝒆𝒆𝒆𝟎𝟎𝒆𝒆𝒉𝒉−𝑪𝑪𝑩𝑩𝟎𝟎 = 𝟏𝟏.𝟏𝟏𝟏𝟏𝟐𝟐 ∗ 𝑫𝑫 + 𝟏𝟏.𝟏𝟏𝟏𝟏𝟏𝟏 (59)
For example: o New Design:
5 inch of AC layer on top of 10 inch of CAB layer on top of SG. Depth of interest for the CAB layer is at its quarter depth, D = 5 +
10/4 = 7.5 inch. Using Equation 56 and D of 7.5 inch, the equivalent thickness is:
𝐻𝐻𝑒𝑒𝑒𝑒𝑒𝑒𝑒𝑒𝑒𝑒−𝐶𝐶𝐶𝐶𝐶𝐶 = 2.2432 ∗ 7.5 − 1.9263 = 14.90 𝑖𝑖𝑖𝑖𝑖𝑖ℎ o Rehabilitation Design:
5 inch of AC layer on top of 10 inch of CAB layer on top of SG. Depth of interest for the CAB layer is at its quarter depth, D = 5 +
10/4 = 7.5 inch. Using Equation 58 and D of 7.5 inch, the equivalent thickness is:
𝐻𝐻𝑒𝑒𝑒𝑒𝑅𝑅𝑒𝑒ℎ−𝐶𝐶𝐶𝐶𝐶𝐶 = 2.399 ∗ 7.5− 1.7468 = 16.25 𝑖𝑖𝑖𝑖𝑖𝑖ℎ
It should be noted that the recommended models are best applicable for the range of data used in the development efforts. Similar effort is highly recommended for unbound and subgrade materials encountered in NDOT Districts 2 and 3. As additional materials from Districts 2 and 3 are evaluated, more robust prediction models can be developed and extensive database can be developed for the implementation of the AASHTO MEPDG.

Characterization of Unbound Materials for Mechanistic-Empirical Pavement Design Guide (MEPDG)
103
REFERENCES 1. AASHTO. (2008). Mechanistic-Empirical Pavement Design Guide: A Manual of
Practice: Interim Edition. American Association of State Highway and Transportation Officials.
2. Hajj, E.Y., Sebaaly, P.E., and Nabhan, P. (2015). Manual for Designing Flexible Pavements in Nevada using the AASHTOWare Pavement ME, Western Regional Superpave Center, University of Nevada, Reno, Draft Final Report to Nevada DOT.
3. Schwartz, C. W., Li, R., Kim, S., Ceylan, H., and Gopalakrishnan, K. (2013). “Global Sensitivity Analysis of Mechanistic Empirical Pavement Design Guide for Flexible Pavements.” Transportation Research Record, 2368, 12–23.
4. Von Quintus, H. L., Boudreau, R., and Cooley, A. (2015). Precision and Bias of Resilient Modulus Test. Washington D.C.
5. ARA, and ERES Consultants (2004). Guide for Mechanistic-Emperical Design of New and Rehabilitated Pavement Structures - Final Report Chapter 2: Design Inputs- Material Characterizations. National Cooperative Highway Research Program, Washington D.C.
6. Puppala, A. J. (2008). Estimating Stiffness of Subgrades and Unbound Materials for Pavement Design. Transportation Research Board, Washington D.C.
7. Yau, A., and Von Quintus, H. (2002). Study of LTPP Laboratory Resilient Modulus Test Data and Response Characteristics. Federal Highway Administration, Washington, D.C.
8. Ceylan, H., Kim, S., Gopalakrishnan, K., and Smadi, O. G. (2009). MEPDG Work Plan Task No. 8 : Validation of Pavement Performance Curves for the Mechanistic-Empirical Pavement Design Guide MEPDG Work Plan Task No . 8 : Validation of Pavement Performance Curves for the Mechanistic-Empirical Pavement Design Guide Final R. Iowa Department of Transportation, Ames, IA.
9. Mokwa, R., and Akin, M. (2009). Measurement and Evaluation of Subgrade Soil Parameters: Phase I–Synthesis of Literature. Montana Department of Transportation, Helena, MT.
10. Asphalt Institute (1981). Thickness design--asphalt pavements for highways and streets (No. 1).
11. ARA (2015). Characterization of Material Properties for M-E Pavement Design in Wyoming - Draft Final Report. University of Wyoming.
12. Yeh, S.-T., and Su, C.-K. (1989). Resilient Properties of Colorado Soils. Colorado Department of Highways, Denver, CO.
13. Mallela, J., Titus-Glover, L., Sadasivam, S., Bhattacharya, B., Darter, M., and Von Quintus, H. (2013). Implementation of the AASHTO Mechanistic-Empirical Pavement Design Guide for Colorado. Colorado Department of Transportation.
14. Von Quintus, H. L., Darter, M. M., Mallela, J., Bhattacharya, B., and Sadasivam, S.

Characterization of Unbound Materials for Mechanistic-Empirical Pavement Design Guide (MEPDG)
104
(2013). Verification and Local Calibration/Validation of the MEPDG Performance Models for Use in Georgia: Validation of the MEPDG Transfer Functions Using the LTPP Test Sections in Georgia Task 2 Interim Report. Georgia Department of Transportation, Atlanta, GA.
15. Bayomy, F., El-Badawy, S., and Awed, A. (2011). Implementation of the MEPDG for Flexible Pavements in Idaho. Idaho Transportation Department, Boise, ID.
16. Baladi, G. Y., Dawson, T., and Sessions, C. (2009). Pavement Subgrade MR Design Values for Michigan’s Seasonal Changes, Final Report. Michigan Department of Transportation, Construction and Technology Division, P.O. Box 30049, Lansing, MI 48909, Lansing, .
17. George, K. P. (2004). Prediction of Resilient Modulus from Soils Index Proprieties. Mississippi Department of Transportation.
18. George, K. P. (2003). Falling Weight Deflectometer for Estimating Subgrade Moduli. Mississippi Department of Transportation.
19. James, R. S., Cooley, A., and Ahlrich, R. C. (2010). Summary of Lessons Learned from the MDOT MEPDG Materials Library Study. Mississippi Department of Transportation.
20. Richardson, D., Petry, T., Ge, L., Han, Y.-P., and Lusher, S. M. (2009). Resilient Moduli of Typical Missouri Soils and Unbound Granular Base Materials. Missouri Department of Transportation.
21. Darter, M. I., Titus-Glover, L., and Von Quintus, H. L. (2009). Mechanistic-Empirical Pavement Design Guide in Utah: Validation, Calibration, and Development of the UDOT MEPDG User’s Guide. Utah Department of Transportation, Salt Lake City.
22. Jackson, K. D. (2015). “Laboratory Resilient Modulus Measurements of Aggregate Base Materials in Utah.” Brigham Young University.
23. Titi, H., Elias, M., and Helwany, S. (2006). Determination of Typical Resilient Modulus Values for Selected Soils in Wisconsin. Wisconsin Department of Transportation, Wisconsin.
24. Eggen, P., and Brittnacher, D. (2004). Determination of Influences on Support Strength of Crushed Aggregate Base Course Due to Gradational , Regional and Source Variations. Wisconsin Department of Transportation, Wisconsin.
25. Hicks, R. G., & Monismith, C. L. (1971). Factors influencing the resilient response of granular materials. Highway research record, (345).
26. Uzan, J., Witczak, M. W., Scullion, T., & Lytton, R. L. (1992). Development and validation of realistic pavement response models. In International Conference on Asphalt Pavements, 7th, 1992, Nottingham, United Kingdom (Vol. 1).
27. AASHTO Design Guide (1993). Guide for Design of Pavement Structures. American Association of State Highway and Transportation Officials, p. 700.

Characterization of Unbound Materials for Mechanistic-Empirical Pavement Design Guide (MEPDG)
105
28. NCHRP 1-37A (2004). “Guide for Mechanistic-Empirical Design of New and Rehabilitated Pavement Structures.” Final Report for NCHRP 1-37A Project. Available online at: http://www.trb.org/mepdg/guide.htm
29. AASHTOWare Pavement ME Design software. American Association of State Highway and Transportation Officials (AASHTO), http://me-design.com/MEDesign/.
30. 3D-Move Analysis software® V2.1. (2013). Reno, NV. Available online at: http://www.arc.unr.edu/Software.html#3DMove, last accessed September 19, 2017.
31. Khazanovich, L., Celauro, C., Chadbourn, B., Zollars, J., & Dai, S. (2006). Evaluation of subgrade resilient modulus predictive model for use in mechanistic-empirical pavement design guide. Transportation Research Record: Journal of the Transportation Research Board, 1947, pp. 155-166.
32. Nabizadeh, H., Hajj, E. Y., Siddharthan, R., Elfass, S., Sebaaly, P. E. (2016). “Estimation of In-Situ Shear Strength Parameters for Subgrade Layer Using Non-destructive Testing.” The Roles of Accelerated Pavement Testing in Pavement Sustainability, pp. 525-538, Springer, Cham
33. Nabizadeh, H., Hajj, E. Y., Siddharthan, R., Elfass, S., Nimeri, N. (2017). “Application of Falling Weight Deflectometer for the Estimation of in-situ Shear Strength Parameters of Subgrade layer.” Bearing Capacity of Roads, Railways and Airfields, pp. 743-749, Taylor & Francis Group.
34. Thompson, M. R., & Elliot, R. P. (1985). ILLI-PAVE based response algorithms for design of conventional flexible pavements. Transportation Research Record: Journal of the Transportation Research Board, 1043, 50-57.
35. R Core Team (2017). R: A language and environment for statistical computing. R Foundation for Statistical Computing, Vienna, Austria.
36. D’Agostino, R. B. (1986). Tests for the normal distribution. Goodness-of-fit techniques, 68, p. 576.
37. Fox, J., & Monette, G. (1992). Generalized collinearity diagnostics. Journal of the American Statistical Association, 87(417), pp. 178-183.

Characterization of Unbound Materials for Mechanistic-Empirical Pavement Design Guide (MEPDG)
106
APPENDIX A Laboratory test results are shown in this appendix, including moisture density and resilient modulus test.
Figure A.1. Moisture-density curve for base material (contract 3546).
130.0
132.0
134.0
136.0
138.0
140.0
142.0
144.0
146.0
148.0
150.0
0.0 1.0 2.0 3.0 4.0 5.0 6.0 7.0 8.0 9.0
Dry
Den
sity
(pcf
)
Moisture Content (%)
130.0
132.0
134.0
136.0
138.0
140.0
142.0
144.0
146.0
148.0
150.0
0.0 1.0 2.0 3.0 4.0 5.0 6.0 7.0 8.0 9.0
Dry
Den
sity
(pcf
)
Moisture Content (%)
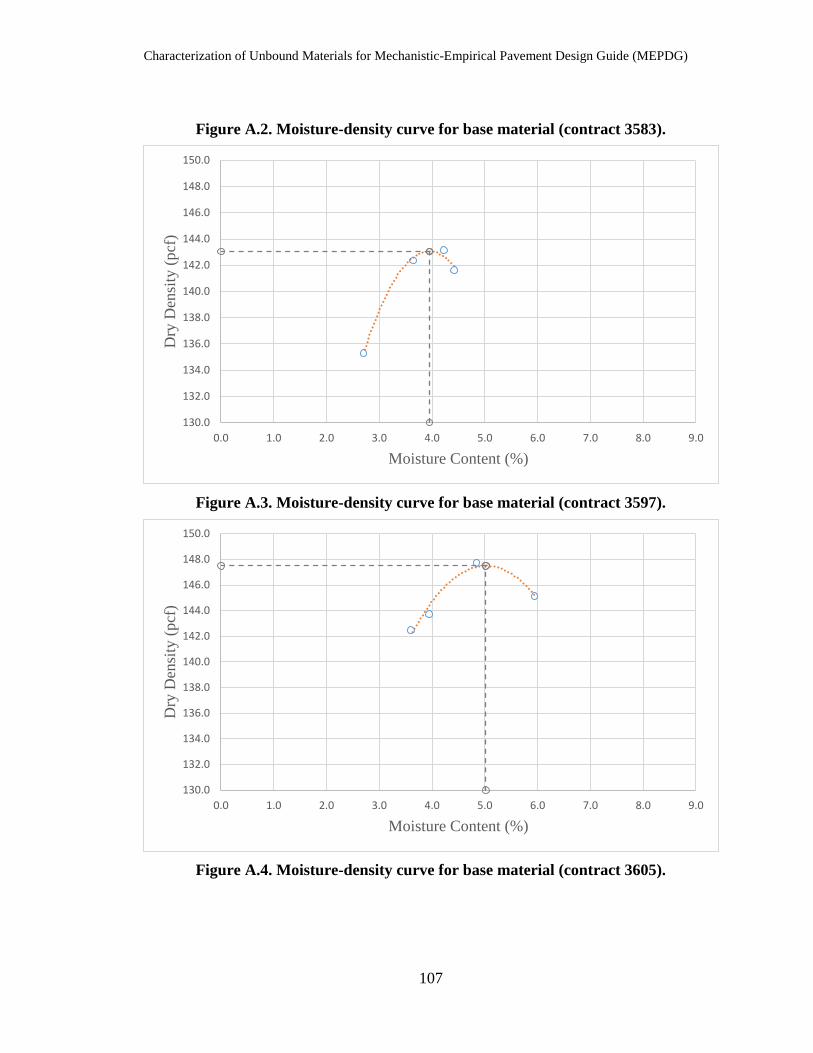
Characterization of Unbound Materials for Mechanistic-Empirical Pavement Design Guide (MEPDG)
107
Figure A.2. Moisture-density curve for base material (contract 3583).
Figure A.3. Moisture-density curve for base material (contract 3597).
Figure A.4. Moisture-density curve for base material (contract 3605).
130.0
132.0
134.0
136.0
138.0
140.0
142.0
144.0
146.0
148.0
150.0
0.0 1.0 2.0 3.0 4.0 5.0 6.0 7.0 8.0 9.0
Dry
Den
sity
(pcf
)
Moisture Content (%)
130.0
132.0
134.0
136.0
138.0
140.0
142.0
144.0
146.0
148.0
150.0
0.0 1.0 2.0 3.0 4.0 5.0 6.0 7.0 8.0 9.0
Dry
Den
sity
(pcf
)
Moisture Content (%)

Characterization of Unbound Materials for Mechanistic-Empirical Pavement Design Guide (MEPDG)
108
Figure A.5. Moisture-density curve for base material (contract 3607).
Figure A.6. Moisture-density curve for base material (contract 3613).
130.0
132.0
134.0
136.0
138.0
140.0
142.0
144.0
146.0
148.0
150.0
0.0 1.0 2.0 3.0 4.0 5.0 6.0 7.0 8.0 9.0
Dry
Den
sity
(pcf
)
Moisture Content (%)
130.0
132.0
134.0
136.0
138.0
140.0
142.0
144.0
146.0
148.0
150.0
0.0 1.0 2.0 3.0 4.0 5.0 6.0 7.0 8.0 9.0
Dry
Den
sity
(pcf
)
Moisture Content (%)

Characterization of Unbound Materials for Mechanistic-Empirical Pavement Design Guide (MEPDG)
109
Figure A.7. Moisture-density curve for borrow material (contract 3546).
Figure A.8. Moisture-density curve for borrow material (contract 3583).
120.0
122.0
124.0
126.0
128.0
130.0
132.0
134.0
136.0
138.0
140.0
0.0 2.0 4.0 6.0 8.0 10.0
Dry
Den
sity
, pcf
Moisture Content, %
100.0
105.0
110.0
115.0
120.0
125.0
130.0
135.0
140.0
0.0 2.0 4.0 6.0 8.0 10.0 12.0 14.0 16.0 18.0
Dry
Den
sity
, pcf
Moisture Content, %

Characterization of Unbound Materials for Mechanistic-Empirical Pavement Design Guide (MEPDG)
110
Figure A.9. Moisture-density curve for borrow material (contract 3597).
Figure A.10. Moisture-density curve for borrow material (contract 3607).
120.0
122.0
124.0
126.0
128.0
130.0
132.0
134.0
136.0
138.0
140.0
0.0 2.0 4.0 6.0 8.0 10.0 12.0
Dry
Den
sity
, pcf
Moisture Content, %
100.0
105.0
110.0
115.0
120.0
125.0
130.0
135.0
140.0
0.0 2.0 4.0 6.0 8.0 10.0 12.0 14.0 16.0
Dry
Den
sity
, pcf
Moisture Content, %
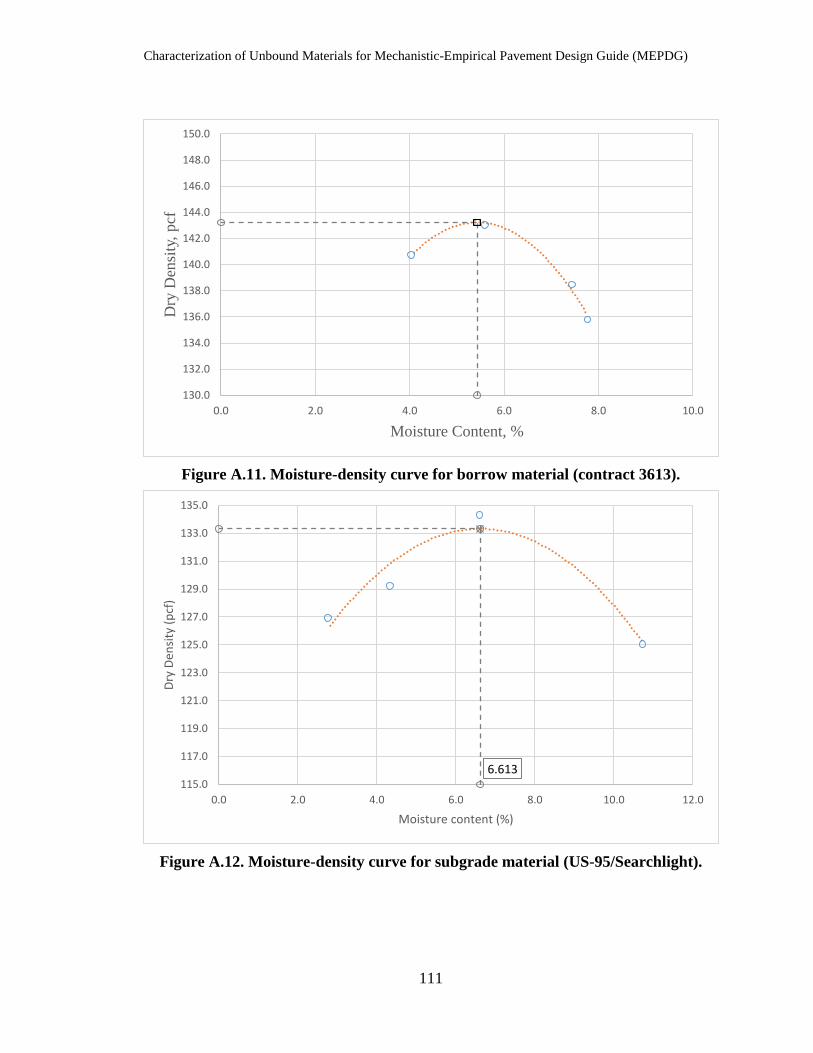
Characterization of Unbound Materials for Mechanistic-Empirical Pavement Design Guide (MEPDG)
111
Figure A.11. Moisture-density curve for borrow material (contract 3613).
Figure A.12. Moisture-density curve for subgrade material (US-95/Searchlight).
130.0
132.0
134.0
136.0
138.0
140.0
142.0
144.0
146.0
148.0
150.0
0.0 2.0 4.0 6.0 8.0 10.0
Dry
Den
sity
, pcf
Moisture Content, %
6.613115.0
117.0
119.0
121.0
123.0
125.0
127.0
129.0
131.0
133.0
135.0
0.0 2.0 4.0 6.0 8.0 10.0 12.0
Dry
Dens
ity (p
cf)
Moisture content (%)

Characterization of Unbound Materials for Mechanistic-Empirical Pavement Design Guide (MEPDG)
112
Figure A.13. Moisture-density curve for subgrade material (US-95/Bonnie Claire).
Figure A.14. Moisture-density curve for subgrade material US-93/Crystal Spring
MP67).
115.0
117.0
119.0
121.0
123.0
125.0
127.0
129.0
131.0
133.0
135.0
0.0 3.0 6.0 9.0 12.0 15.0
Dry
Den
sity
(pcf
)
Moisture Content (%)
110.0
115.0
120.0
125.0
130.0
135.0
0.0 2.0 4.0 6.0 8.0 10.0 12.0 14.0
Dry
Den
sity
(pcf
)
Moisture Content (%)

Characterization of Unbound Materials for Mechanistic-Empirical Pavement Design Guide (MEPDG)
113
Figure A.15. Moisture-density curve for subgrade material (US-93/Crystal Spring
MP62).
110.0
115.0
120.0
125.0
130.0
135.0
0.0 2.0 4.0 6.0 8.0 10.0 12.0 14.0
Dry
Den
sity
(pcf
)
Moisture Content (%)

Characterization of Unbound Materials for Mechanistic-Empirical Pavement Design Guide (MEPDG)
114
Table A.1. Summary of Resilient Modulus Test Results for Base Material (Contract 3546).
Sequence
Cyclic Axial Stress (psi)
Contact Stress (psi)
Confine Stress (psi)
Axial Resilient Modulus
(psi)
Deviator Stress, σd
(psi)
Sigma 1 (psi)
Sigma 3 (psi)
Bulk Stress,θ
(psi)
Octahedral Shear
Stress (psi)
1 13.5 1.5 14.8 46,385 15.0 29.8 14.8 59.5 7.1 2 2.7 0.3 2.8 22,854 3.0 5.8 2.8 11.4 1.4 3 5.3 0.6 2.8 23,661 5.9 8.8 2.8 14.4 2.8 4 8.1 0.9 2.8 25,371 9.0 11.8 2.8 17.5 4.2 5 4.5 0.5 4.8 25,231 5.0 9.9 4.8 19.5 2.4 6 9.0 1.0 4.8 28,698 10.0 14.8 4.8 24.4 4.7 7 13.5 1.5 4.8 30,357 15.0 19.9 4.8 29.5 7.1 8 9.0 1.0 9.8 35,372 10.0 19.8 9.8 39.4 4.7 9 18.0 2.0 9.8 41,542 20.0 29.8 9.8 49.5 9.4 10 26.8 3.0 9.8 43,812 29.8 39.7 9.8 59.3 14.1 11 9.0 1.0 14.8 39,750 10.0 24.8 14.8 54.5 4.7 12 13.5 1.5 14.8 43,625 15.0 29.8 14.8 59.4 7.1 13 26.8 3.0 14.8 49,674 29.8 44.6 14.8 74.3 14.0 14 13.7 1.5 19.8 49,374 15.2 35.0 19.8 74.6 7.1 15 18.1 2.0 19.8 53,101 20.1 39.9 19.8 79.6 9.5 16 34.6 4.0 19.8 59,304 38.6 58.4 19.8 98.0 18.2
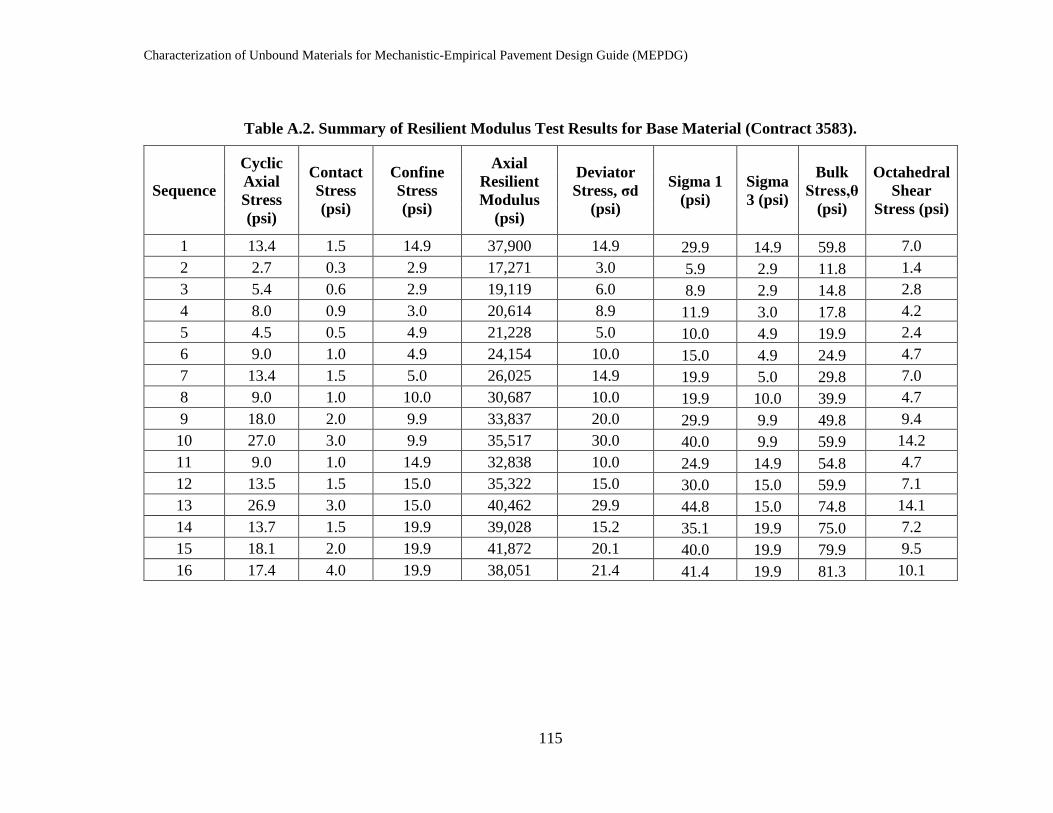
Characterization of Unbound Materials for Mechanistic-Empirical Pavement Design Guide (MEPDG)
115
Table A.2. Summary of Resilient Modulus Test Results for Base Material (Contract 3583).
Sequence
Cyclic Axial Stress (psi)
Contact Stress (psi)
Confine Stress (psi)
Axial Resilient Modulus
(psi)
Deviator Stress, σd
(psi)
Sigma 1 (psi)
Sigma 3 (psi)
Bulk Stress,θ
(psi)
Octahedral Shear
Stress (psi)
1 13.4 1.5 14.9 37,900 14.9 29.9 14.9 59.8 7.0 2 2.7 0.3 2.9 17,271 3.0 5.9 2.9 11.8 1.4 3 5.4 0.6 2.9 19,119 6.0 8.9 2.9 14.8 2.8 4 8.0 0.9 3.0 20,614 8.9 11.9 3.0 17.8 4.2 5 4.5 0.5 4.9 21,228 5.0 10.0 4.9 19.9 2.4 6 9.0 1.0 4.9 24,154 10.0 15.0 4.9 24.9 4.7 7 13.4 1.5 5.0 26,025 14.9 19.9 5.0 29.8 7.0 8 9.0 1.0 10.0 30,687 10.0 19.9 10.0 39.9 4.7 9 18.0 2.0 9.9 33,837 20.0 29.9 9.9 49.8 9.4 10 27.0 3.0 9.9 35,517 30.0 40.0 9.9 59.9 14.2 11 9.0 1.0 14.9 32,838 10.0 24.9 14.9 54.8 4.7 12 13.5 1.5 15.0 35,322 15.0 30.0 15.0 59.9 7.1 13 26.9 3.0 15.0 40,462 29.9 44.8 15.0 74.8 14.1 14 13.7 1.5 19.9 39,028 15.2 35.1 19.9 75.0 7.2 15 18.1 2.0 19.9 41,872 20.1 40.0 19.9 79.9 9.5 16 17.4 4.0 19.9 38,051 21.4 41.4 19.9 81.3 10.1

Characterization of Unbound Materials for Mechanistic-Empirical Pavement Design Guide (MEPDG)
116
Table A.3. Summary of Resilient Modulus Test Results for Base Material (Contract 3597).
Sequence
Cyclic Axial Stress (psi)
Contact Stress (psi)
Confine Stress (psi)
Axial Resilient Modulus
(psi)
Deviator Stress, σd
(psi)
Sigma 1 (psi)
Sigma 3 (psi)
Bulk Stress,θ
(psi)
Octahedral Shear
Stress (psi)
1 13.5 1.5 14.7 43,837 15.0 29.7 14.7 59.2 7.1 2 2.7 0.3 2.7 18,985 3.0 5.7 2.7 11.2 1.4 3 5.4 0.6 2.7 21,208 6.0 8.8 2.7 14.2 2.8 4 8.0 0.9 2.7 22,543 8.9 11.6 2.7 17.1 4.2 5 4.5 0.5 4.7 23,140 5.1 9.8 4.7 19.3 2.4 6 9.0 1.0 4.7 26,244 10.0 14.7 4.7 24.2 4.7 7 13.5 1.5 4.7 28,732 15.0 19.7 4.7 29.2 7.1 8 9.1 1.0 9.7 32,788 10.1 19.9 9.7 39.4 4.8 9 18.0 2.0 9.7 38,023 20.1 29.8 9.7 49.3 9.5 10 26.9 3.0 9.7 40,903 29.9 39.7 9.7 59.1 14.1 11 9.0 1.0 14.7 36,665 10.0 24.8 14.7 54.2 4.7 12 13.5 1.5 14.7 39,178 15.0 29.7 14.7 59.2 7.1 13 26.9 3.0 14.7 47,096 29.9 44.6 14.7 74.1 14.1 14 13.6 1.5 19.7 43,398 15.1 34.8 19.7 74.3 7.1 15 18.2 2.0 19.7 49,003 20.3 40.0 19.7 79.5 9.5 16 34.5 4.0 19.7 56,815 38.5 58.3 19.7 97.7 18.2

Characterization of Unbound Materials for Mechanistic-Empirical Pavement Design Guide (MEPDG)
117
Table A.4. Summary of Resilient Modulus Test Results for Base Material (Contract 3605).
Sequence
Cyclic Axial Stress (psi)
Contact Stress (psi)
Confine Stress (psi)
Axial Resilient Modulus
(psi)
Deviator Stress, σd
(psi)
Sigma 1 (psi)
Sigma 3 (psi)
Bulk Stress,θ
(psi)
Octahedral Shear
Stress (psi)
1 13.5 1.5 15.0 38,800 15.0 29.9 15.0 59.8 7.1 2 2.7 0.3 3.0 15,056 3.0 6.0 3.0 11.9 1.4 3 5.3 0.6 3.0 16,734 5.9 8.9 3.0 14.8 2.8 4 8.1 0.9 2.9 18,600 9.0 12.0 2.9 17.9 4.3 5 4.4 0.5 5.0 19,680 5.0 9.9 5.0 19.8 2.3 6 9.1 1.0 4.9 22,302 10.1 15.0 4.9 24.9 4.7 7 13.5 1.5 5.0 24,051 15.0 19.9 5.0 29.8 7.1 8 9.0 1.0 10.0 29,860 10.0 20.0 10.0 39.9 4.7 9 18.0 2.0 10.0 33,595 20.0 29.9 10.0 49.9 9.4 10 26.8 3.0 10.0 34,616 29.8 39.8 10.0 59.7 14.1 11 9.1 1.0 15.0 33,620 10.1 25.0 15.0 55.0 4.8 12 13.6 1.5 14.9 36,136 15.1 30.0 14.9 59.9 7.1 13 27.0 3.0 15.0 40,879 30.0 44.9 15.0 74.8 14.1 14 13.6 1.5 20.0 40,414 15.1 35.0 20.0 75.0 7.1 15 18.0 2.0 20.0 42,512 20.0 40.0 20.0 79.9 9.4 16 35.4 4.0 19.9 49,098 39.4 59.3 19.9 99.2 18.6

Characterization of Unbound Materials for Mechanistic-Empirical Pavement Design Guide (MEPDG)
118
Table A.5. Summary of Resilient Modulus Test Results for Base Material (Contract 3607).
Sequence
Cyclic Axial Stress (psi)
Contact Stress (psi)
Confine Stress (psi)
Axial Resilient Modulus
(psi)
Deviator Stress, σd
(psi)
Sigma 1 (psi)
Sigma 3 (psi)
Bulk Stress,θ
(psi)
Octahedral Shear
Stress (psi)
1 13.5 1.5 14.3 37,768 15.0 29.3 14.3 57.9 7.1 2 2.7 0.3 2.3 14,357 3.0 5.3 2.3 9.9 1.4 3 5.4 0.6 2.3 15,807 6.0 8.3 2.3 12.9 2.8 4 8.1 0.9 2.3 17,012 9.0 11.3 2.3 15.9 4.2 5 4.5 0.5 4.3 17,810 5.0 9.3 4.3 17.9 2.4 6 8.9 1.0 4.3 20,323 9.9 14.2 4.3 22.8 4.7 7 13.6 1.5 4.3 22,873 15.1 19.4 4.3 28.0 7.1 8 9.0 1.0 9.3 27,093 10.0 19.3 9.3 37.9 4.7 9 18.0 2.0 9.3 32,894 20.0 29.3 9.3 47.9 9.4 10 27.0 3.0 9.3 35,618 30.0 39.3 9.3 57.9 14.1 11 9.1 1.0 14.3 32,890 10.1 24.4 14.3 53.0 4.8 12 13.4 1.5 14.3 36,272 14.9 29.2 14.3 57.8 7.0 13 27.0 3.0 14.3 42,799 30.0 44.3 14.3 72.9 14.1 14 14.0 1.5 19.3 41,969 15.5 34.8 19.3 73.4 7.3 15 18.2 2.0 19.3 44,864 20.2 39.5 19.3 78.1 9.5 16 35.2 4.0 19.3 51,748 39.2 58.5 19.3 97.1 18.5

Characterization of Unbound Materials for Mechanistic-Empirical Pavement Design Guide (MEPDG)
119
Table A.6. Summary of Resilient Modulus Test Results for Base Material (Contract 3613).
Sequence
Cyclic Axial Stress (psi)
Contact Stress (psi)
Confine Stress (psi)
Axial Resilient Modulus
(psi)
Deviator Stress, σd
(psi)
Sigma 1 (psi)
Sigma 3 (psi)
Bulk Stress,θ
(psi)
Octahedral Shear
Stress (psi)
1 13.7 1.5 15.0 38,859 15.1 30.1 15.0 60.1 7.1 2 2.7 0.3 3.0 17,223 3.0 6.0 3.0 11.9 1.4 3 5.3 0.6 3.0 18,871 5.9 8.8 3.0 14.8 2.8 4 8.5 0.9 3.0 21,026 9.4 12.4 3.0 18.3 4.4 5 4.4 0.5 5.0 21,262 4.9 9.9 5.0 19.8 2.3 6 8.9 1.0 5.0 23,960 9.9 14.9 5.0 24.8 4.7 7 13.4 1.5 5.0 25,751 14.9 19.9 5.0 29.9 7.0 8 8.9 1.0 10.0 30,775 9.9 19.9 10.0 39.9 4.7 9 17.9 2.0 10.0 33,889 19.9 29.9 10.0 49.8 9.4 10 27.0 3.0 10.0 35,301 30.0 39.9 10.0 59.9 14.1 11 9.0 1.0 15.0 32,603 10.0 25.0 15.0 55.0 4.7 12 13.5 1.5 15.0 35,350 15.0 30.0 15.0 59.9 7.1 13 27.0 3.0 15.0 40,558 30.0 45.0 15.0 75.0 14.2 14 13.6 1.5 20.0 39,540 15.1 35.1 20.0 75.0 7.1 15 18.2 2.0 20.0 42,611 20.2 40.1 20.0 80.1 9.5 16 35.2 4.0 20.0 48,969 39.2 59.1 20.0 99.1 18.5

Characterization of Unbound Materials for Mechanistic-Empirical Pavement Design Guide (MEPDG)
120
Table A.7. Summary of Resilient Modulus Test Results for Borrow Material (Contract 3546).
Sequence
Cyclic Axial Stress (psi)
Contact Stress (psi)
Confine Stress (psi)
Axial Resilient Modulus
(psi)
Deviator Stress, σd
(psi)
Sigma 1 (psi)
Sigma 3 (psi)
Bulk Stress,θ
(psi)
Octahedral Shear
Stress (psi)
1 13.5 1.5 14.8 36,969 15.0 29.8 14.8 59.3 7.1 2 2.7 0.3 2.8 15,355 3.0 5.8 2.8 11.4 1.4 3 5.5 0.6 2.8 17,586 6.1 8.9 2.8 14.5 2.9 4 8.2 0.9 2.8 18,860 9.1 11.8 2.8 17.4 4.3 5 4.4 0.5 4.8 19,484 4.9 9.7 4.8 19.3 2.3 6 8.9 1.0 4.8 22,107 9.9 14.7 4.8 24.2 4.7 7 13.4 1.5 4.8 23,425 14.9 19.7 4.8 29.2 7.0 8 9.0 1.0 9.8 28,556 10.0 19.8 9.8 39.3 4.7 9 18.0 2.0 9.8 32,585 20.0 29.8 9.8 49.4 9.4 10 27.0 3.0 9.8 34,008 30.0 39.7 9.8 59.3 14.1 11 9.1 1.0 14.8 32,001 10.1 24.9 14.8 54.4 4.8 12 13.5 1.5 14.8 33,651 15.0 29.7 14.8 59.3 7.1 13 27.0 3.0 14.8 38,956 30.0 44.8 14.8 74.3 14.1 14 13.8 1.5 19.8 37,861 15.3 35.0 19.8 74.5 7.2 15 18.1 2.0 19.8 40,689 20.1 39.8 19.8 79.4 9.5 16 35.1 4.0 19.8 46,956 39.1 58.9 19.8 98.4 18.4

Characterization of Unbound Materials for Mechanistic-Empirical Pavement Design Guide (MEPDG)
121
Table A.8. Summary of Resilient Modulus Test Results for Borrow Material (Contract 3583).
Sequence
Cyclic Axial Stress (psi)
Contact Stress (psi)
Confine Stress (psi)
Axial Resilient Modulus
(psi)
Deviator Stress, σd
(psi)
Sigma 1 (psi)
Sigma 3 (psi)
Bulk Stress,θ
(psi)
Octahedral Shear
Stress (psi)
1 13.4 1.5 14.7 16,244 14.9 29.6 14.7 59.1 7.0 2 2.7 0.3 2.7 11,167 3.0 5.7 2.7 11.1 1.4 3 5.3 0.6 2.7 10,489 5.9 8.6 2.7 14.0 2.8 4 8.1 0.9 2.7 10,012 9.0 11.7 2.7 17.1 4.2 5 4.5 0.5 4.7 12,149 5.0 9.8 4.7 19.2 2.4 6 9.0 1.0 4.7 11,267 10.0 14.7 4.7 24.1 4.7 7 13.5 1.5 4.7 10,847 15.0 19.7 4.7 29.2 7.1 8 8.9 1.0 9.7 14,029 9.9 19.6 9.7 39.1 4.7 9 17.9 2.0 9.7 12,915 19.9 29.6 9.7 49.1 9.4 10 26.5 3.0 9.7 11,246 29.5 39.2 9.7 58.6 13.9 11 9.0 1.0 14.7 16,039 10.0 24.7 14.7 54.2 4.7 12 13.5 1.5 14.7 15,442 15.0 29.7 14.7 59.2 7.1 13 26.9 3.0 14.7 14,653 29.9 44.6 14.7 74.0 14.1 14 13.7 1.5 19.7 18,521 15.2 34.9 19.7 74.4 7.2 15 18.1 2.0 19.7 18,488 20.1 39.9 19.7 79.3 9.5 16 34.0 4.0 19.7 16,316 38.0 57.7 19.7 97.1 17.9

Characterization of Unbound Materials for Mechanistic-Empirical Pavement Design Guide (MEPDG)
122
Table A.9. Summary of Resilient Modulus Test Results for Borrow Material (Contract 3597).
Sequence
Cyclic Axial Stress (psi)
Contact Stress (psi)
Confine Stress (psi)
Axial Resilient Modulus
(psi)
Deviator Stress, σd
(psi)
Sigma 1 (psi)
Sigma 3 (psi)
Bulk Stress,θ
(psi)
Octahedral Shear
Stress (psi)
1 13.5 1.5 14.6 35,264 15.0 29.6 14.6 58.8 7.1 2 2.7 0.3 2.6 16,966 3.0 5.6 2.6 10.9 1.4 3 5.4 0.6 2.6 17,628 6.0 8.6 2.6 13.9 2.8 4 8.1 0.9 2.6 18,718 9.0 11.6 2.6 16.8 4.2 5 4.5 0.5 4.6 19,896 5.1 9.7 4.6 18.9 2.4 6 9.1 1.0 4.6 21,766 10.1 14.7 4.6 23.9 4.8 7 13.5 1.5 4.6 23,047 15.0 19.6 4.6 28.8 7.1 8 8.9 1.0 9.6 27,102 9.9 19.5 9.6 38.8 4.7 9 18.0 2.0 9.6 30,128 20.0 29.6 9.6 48.8 9.4 10 26.9 3.0 9.6 31,053 29.9 39.5 9.6 58.7 14.1 11 9.1 1.0 14.6 29,872 10.1 24.7 14.6 53.9 4.8 12 13.6 1.5 14.6 32,406 15.1 29.8 14.6 59.0 7.1 13 27.2 3.0 14.6 37,144 30.2 44.8 14.6 74.0 14.2 14 13.7 1.5 19.6 37,280 15.2 34.8 19.6 74.0 7.2 15 18.0 2.0 19.6 39,087 20.0 39.6 19.6 78.9 9.4 16 35.0 4.0 19.6 44,426 39.0 58.6 19.6 97.8 18.4
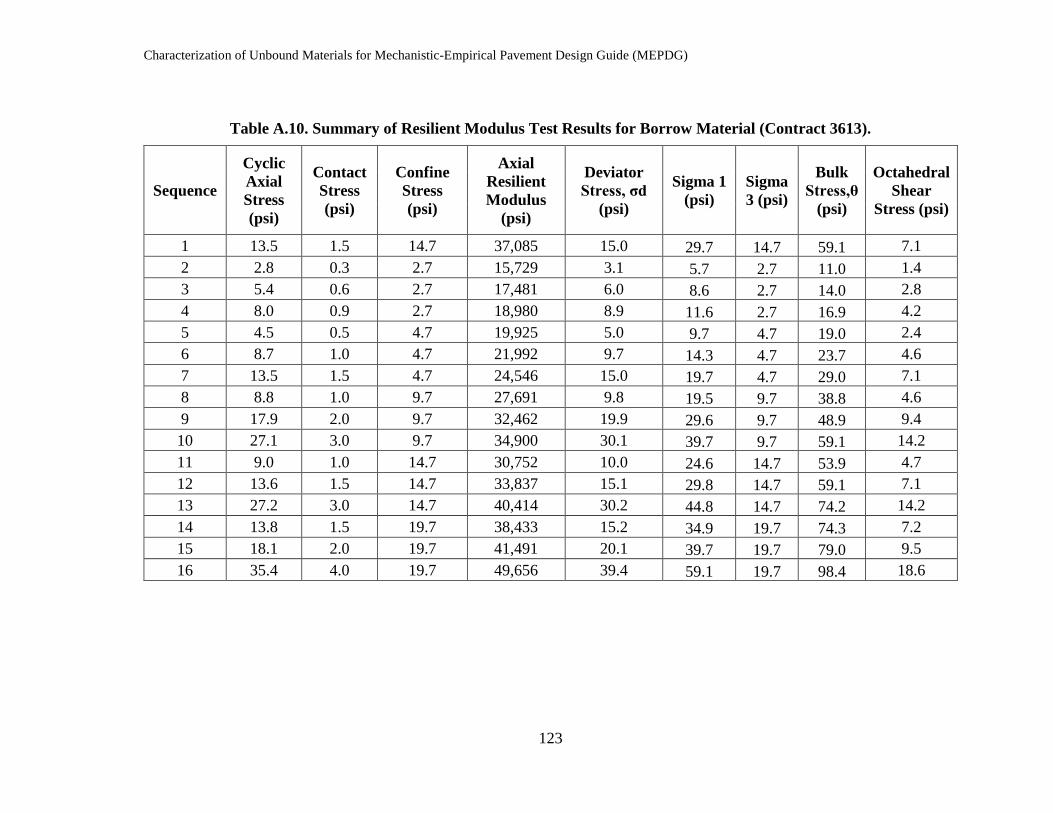
Characterization of Unbound Materials for Mechanistic-Empirical Pavement Design Guide (MEPDG)
123
Table A.10. Summary of Resilient Modulus Test Results for Borrow Material (Contract 3613).
Sequence
Cyclic Axial Stress (psi)
Contact Stress (psi)
Confine Stress (psi)
Axial Resilient Modulus
(psi)
Deviator Stress, σd
(psi)
Sigma 1 (psi)
Sigma 3 (psi)
Bulk Stress,θ
(psi)
Octahedral Shear
Stress (psi)
1 13.5 1.5 14.7 37,085 15.0 29.7 14.7 59.1 7.1 2 2.8 0.3 2.7 15,729 3.1 5.7 2.7 11.0 1.4 3 5.4 0.6 2.7 17,481 6.0 8.6 2.7 14.0 2.8 4 8.0 0.9 2.7 18,980 8.9 11.6 2.7 16.9 4.2 5 4.5 0.5 4.7 19,925 5.0 9.7 4.7 19.0 2.4 6 8.7 1.0 4.7 21,992 9.7 14.3 4.7 23.7 4.6 7 13.5 1.5 4.7 24,546 15.0 19.7 4.7 29.0 7.1 8 8.8 1.0 9.7 27,691 9.8 19.5 9.7 38.8 4.6 9 17.9 2.0 9.7 32,462 19.9 29.6 9.7 48.9 9.4 10 27.1 3.0 9.7 34,900 30.1 39.7 9.7 59.1 14.2 11 9.0 1.0 14.7 30,752 10.0 24.6 14.7 53.9 4.7 12 13.6 1.5 14.7 33,837 15.1 29.8 14.7 59.1 7.1 13 27.2 3.0 14.7 40,414 30.2 44.8 14.7 74.2 14.2 14 13.8 1.5 19.7 38,433 15.2 34.9 19.7 74.3 7.2 15 18.1 2.0 19.7 41,491 20.1 39.7 19.7 79.0 9.5 16 35.4 4.0 19.7 49,656 39.4 59.1 19.7 98.4 18.6

Characterization of Unbound Materials for Mechanistic-Empirical Pavement Design Guide (MEPDG)
124
Table A.11. Summary of Resilient Modulus Test Results for Subgrade Material (I-15/Goodsprings).
Sequence
Cyclic Axial Stress (psi)
Contact Stress (psi)
Confine Stress (psi)
Axial Resilient Modulus
(psi)
Deviator Stress, σd
(psi)
Sigma 1 (psi)
Sigma 3 (psi)
Bulk Stress,θ
(psi)
Octahedral Shear
Stress (psi)
1 3.5 0.4 5.9 19,538 3.9 9.8 5.9 21.5 1.8 2 1.8 0.2 5.9 18,343 2.0 7.8 5.9 19.6 0.9 3 3.5 0.4 5.9 19,916 3.9 9.8 5.9 21.5 1.8 4 5.4 0.6 5.9 20,171 6.0 11.8 5.9 23.6 2.8 5 7.1 0.8 4.9 18,746 7.9 12.7 4.9 22.5 3.7 6 8.8 1.0 5.9 20,838 9.8 15.7 5.9 27.4 4.6 7 1.8 0.2 3.9 15,251 2.0 5.8 3.9 13.5 0.9 8 3.7 0.4 3.9 15,923 4.1 7.9 3.9 15.7 1.9 9 5.3 0.6 3.9 16,591 5.9 9.7 3.9 17.5 2.8 10 7.1 0.8 3.9 17,308 7.9 11.7 3.9 19.4 3.7 11 8.8 1.0 3.9 18,277 9.8 13.6 3.9 21.4 4.6 12 1.8 0.2 1.9 12,573 2.0 3.8 1.9 7.6 0.9 13 3.4 0.4 1.9 13,075 3.8 5.7 1.9 9.4 1.8 14 5.4 0.6 1.9 14,149 5.9 7.8 1.9 11.5 2.8 15 7.1 0.8 1.9 14,944 7.8 9.7 1.9 13.5 3.7 16 8.9 1.0 1.9 15,758 9.9 11.8 1.9 15.5 4.7

Characterization of Unbound Materials for Mechanistic-Empirical Pavement Design Guide (MEPDG)
125
Table A.12. Summary of Resilient Modulus Test Results for Subgrade Material (US-95/Searchlight).
Sequence
Cyclic Axial Stress (psi)
Contact Stress (psi)
Confine Stress (psi)
Axial Resilient Modulus
(psi)
Deviator Stress, σd
(psi)
Sigma 1 (psi)
Sigma 3 (psi)
Bulk Stress,θ
(psi)
Octahedral Shear Stress
(psi)
1 3.6 0.4 5.7 16,049 4.0 9.7 5.7 21.1 1.9 2 1.8 0.2 5.7 15,139 2.0 7.7 5.7 19.2 0.9 3 3.6 0.4 5.7 16,294 4.0 9.7 5.7 21.1 1.9 4 5.4 0.6 5.7 16,243 6.0 11.7 5.7 23.2 2.8 5 7.2 0.8 4.7 15,076 8.0 12.7 4.7 22.2 3.8 6 8.9 1.0 5.7 16,137 9.8 15.6 5.7 27.0 4.6 7 1.8 0.2 3.7 12,999 2.0 5.7 3.7 13.1 0.9 8 3.6 0.4 3.7 13,178 4.0 7.7 3.7 15.1 1.9 9 5.4 0.6 3.7 13,627 5.9 9.7 3.7 17.1 2.8 10 7.1 0.8 3.7 13,972 7.9 11.6 3.7 19.0 3.7 11 8.9 1.0 3.7 14,418 9.9 13.7 3.7 21.1 4.7 12 1.8 0.2 1.7 10,602 2.0 3.7 1.7 7.2 0.9 13 3.6 0.4 1.7 10,766 4.0 5.7 1.7 9.2 1.9 14 5.3 0.6 1.7 11,301 5.9 7.6 1.7 11.1 2.8 15 7.2 0.8 1.7 11,938 8.0 9.7 1.7 13.1 3.8 16 8.9 1.0 1.7 12,583 9.8 11.6 1.7 15.0 4.6

Characterization of Unbound Materials for Mechanistic-Empirical Pavement Design Guide (MEPDG)
126
Table A.13. Summary of Resilient Modulus Test Results for Subgrade Material (NV-375/Rachel).
Sequence
Cyclic Axial Stress (psi)
Contact Stress (psi)
Confine Stress (psi)
Axial Resilient Modulus
(psi)
Deviator Stress, σd
(psi)
Sigma 1 (psi)
Sigma 3 (psi)
Bulk Stress,θ
(psi)
Octahedral Shear
Stress (psi)
1 3.6 0.4 5.7 18,563 4.0 9.7 5.7 21.1 1.9 2 1.8 0.2 5.7 16,968 2.0 7.7 5.7 19.1 0.9 3 3.6 0.4 5.7 18,824 4.0 9.7 5.7 21.1 1.9 4 5.4 0.6 5.7 18,731 6.0 11.7 5.7 23.1 2.8 5 7.2 0.8 4.7 17,317 8.0 12.7 4.7 22.1 3.8 6 9.0 1.0 5.7 19,475 10.0 15.7 5.7 27.1 4.7 7 1.8 0.2 3.7 14,184 2.0 5.7 3.7 13.1 0.9 8 3.6 0.4 3.7 14,300 4.0 7.7 3.7 15.1 1.9 9 5.4 0.6 3.7 15,270 6.0 9.7 3.7 17.1 2.8 10 7.2 0.8 3.7 16,435 8.0 11.7 3.7 19.1 3.8 11 9.0 1.0 3.7 17,200 10.0 13.7 3.7 21.1 4.7 12 1.8 0.2 1.7 10,946 2.0 3.7 1.7 7.2 0.9 13 3.6 0.4 1.7 11,363 4.0 5.7 1.7 9.1 1.9 14 5.4 0.6 1.7 12,765 6.0 7.7 1.7 11.1 2.8 15 7.2 0.8 1.7 13,752 8.0 9.7 1.7 13.1 3.8 16 9.0 1.0 1.7 14,622 10.0 11.7 1.7 15.1 4.7

Characterization of Unbound Materials for Mechanistic-Empirical Pavement Design Guide (MEPDG)
127
Table A.14. Summary of Resilient Modulus Test Results for Subgrade Material (US-93/Crystal Spring MP62).
Sequence
Cyclic Axial Stress (psi)
Contact Stress (psi)
Confine Stress (psi)
Axial Resilient Modulus
(psi)
Deviator Stress, σd
(psi)
Sigma 1 (psi)
Sigma 3 (psi)
Bulk Stress,θ
(psi)
Octahedral Shear
Stress (psi)
1 3.6 0.4 5.8 13,028 4.0 9.8 5.8 21.3 1.9 2 1.8 0.2 5.8 12,184 2.0 7.8 5.8 19.3 0.9 3 3.6 0.4 5.8 13,115 4.0 9.8 5.8 21.3 1.9 4 5.6 0.6 5.8 13,025 6.2 12.0 5.8 23.5 2.9 5 7.2 0.8 4.8 12,302 8.0 12.8 4.8 22.3 3.8 6 9.0 1.0 5.8 13,420 10.0 15.7 5.8 27.3 4.7 7 1.8 0.2 3.8 9,997 2.0 5.8 3.8 13.3 0.9 8 3.6 0.4 3.8 10,223 4.0 7.8 3.8 15.3 1.9 9 5.4 0.6 3.8 10,567 6.0 9.8 3.8 17.3 2.8 10 7.3 0.8 3.8 11,363 8.1 11.8 3.8 19.4 3.8 11 9.0 1.0 3.8 11,685 10.0 13.8 3.8 21.3 4.7 12 1.8 0.2 1.8 7,710 2.0 3.8 1.8 7.3 0.9 13 3.6 0.4 1.8 8,095 4.0 5.7 1.8 9.3 1.9 14 5.4 0.6 1.8 8,822 6.0 7.7 1.8 11.3 2.8 15 7.2 0.8 1.8 9,648 8.0 9.8 1.8 13.4 3.8 16 8.9 1.0 1.8 9,982 9.9 11.7 1.8 15.2 4.7
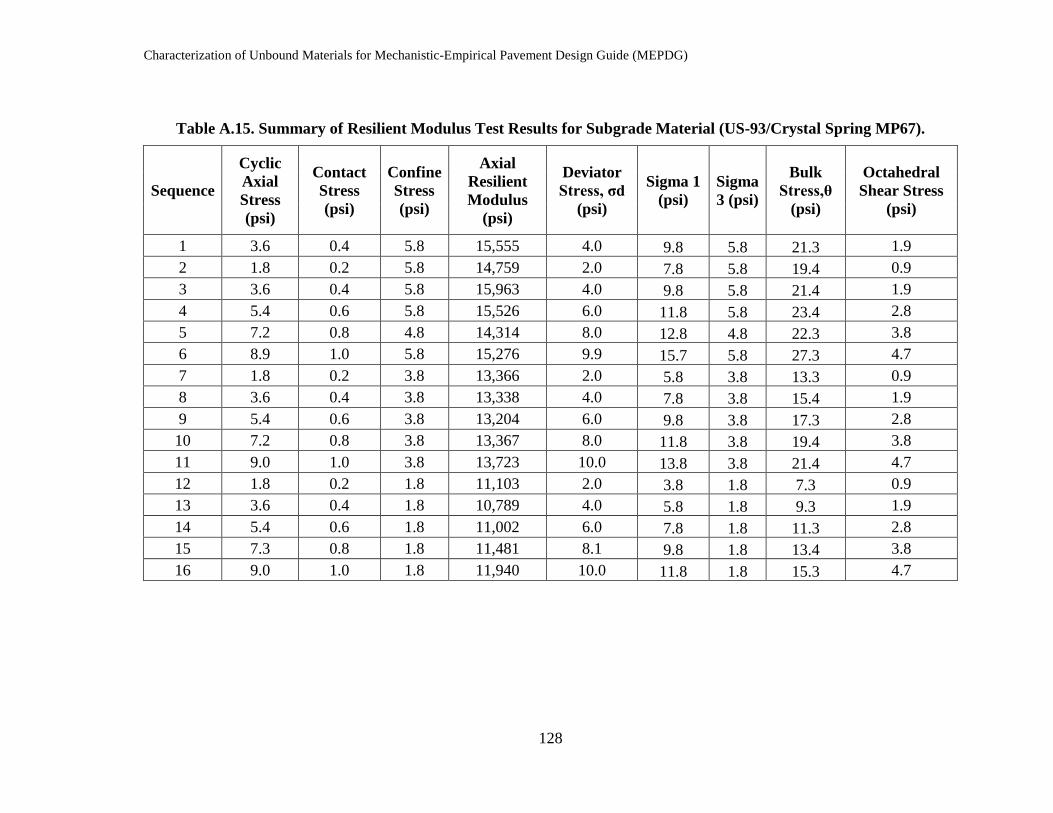
Characterization of Unbound Materials for Mechanistic-Empirical Pavement Design Guide (MEPDG)
128
Table A.15. Summary of Resilient Modulus Test Results for Subgrade Material (US-93/Crystal Spring MP67).
Sequence
Cyclic Axial Stress (psi)
Contact Stress (psi)
Confine Stress (psi)
Axial Resilient Modulus
(psi)
Deviator Stress, σd
(psi)
Sigma 1 (psi)
Sigma 3 (psi)
Bulk Stress,θ
(psi)
Octahedral Shear Stress
(psi)
1 3.6 0.4 5.8 15,555 4.0 9.8 5.8 21.3 1.9 2 1.8 0.2 5.8 14,759 2.0 7.8 5.8 19.4 0.9 3 3.6 0.4 5.8 15,963 4.0 9.8 5.8 21.4 1.9 4 5.4 0.6 5.8 15,526 6.0 11.8 5.8 23.4 2.8 5 7.2 0.8 4.8 14,314 8.0 12.8 4.8 22.3 3.8 6 8.9 1.0 5.8 15,276 9.9 15.7 5.8 27.3 4.7 7 1.8 0.2 3.8 13,366 2.0 5.8 3.8 13.3 0.9 8 3.6 0.4 3.8 13,338 4.0 7.8 3.8 15.4 1.9 9 5.4 0.6 3.8 13,204 6.0 9.8 3.8 17.3 2.8 10 7.2 0.8 3.8 13,367 8.0 11.8 3.8 19.4 3.8 11 9.0 1.0 3.8 13,723 10.0 13.8 3.8 21.4 4.7 12 1.8 0.2 1.8 11,103 2.0 3.8 1.8 7.3 0.9 13 3.6 0.4 1.8 10,789 4.0 5.8 1.8 9.3 1.9 14 5.4 0.6 1.8 11,002 6.0 7.8 1.8 11.3 2.8 15 7.3 0.8 1.8 11,481 8.1 9.8 1.8 13.4 3.8 16 9.0 1.0 1.8 11,940 10.0 11.8 1.8 15.3 4.7

Nevada Department of Transportation
Rudy Malfabon, P.E. Director
Ken Chambers, Research Division Chief
(775) 888-7220
1263 South Stewart Street
Carson City, Nevada 89712