characterization of structural rebuilding and shear
TRANSCRIPT

Characterization of Structural Rebuilding and Shear Migration
in Cementitious Materials in Consideration of Thixotropy
Ye Qian
Submitted in partial fulfillment of the
requirements for the degree of
Doctor of Philosophy
in the Graduate School of Arts and Sciences
COLUMBIA UNIVERSITY
2017

© 2016
Ye Qian
All Rights Reserved

ABSTRACT
Characterization of structural rebuilding and shear migration in cementitious
materials in consideration of thixotropy
Ye Qian
From initial contact with water until hardening, and deterioration, cement and concrete
materials are subjected to various chemical and physical transformations and environmental
impacts. This thesis focuses on the properties during the fresh state, shortly after mixing until the
induction period. During this period flow history, including shearing and resting, and hydration
both play big roles in determining the rheological properties. The rheological properties of cement
and concrete not only affect the casting and pumping process, but also very critical for harden
properties and durability properties.
Compared with conventional concrete, self-consolidating concrete (SCC) can introduce many
advantages in construction application. These include readiness to apply, decreasing labor
necessary for casting, and enhancing hardened properties. However, challenges still remain, such
as issues relating to formwork pressure [1-7] and multi-layer casting [8]. Each of these issues is
closely related to the property of thixotropy. From the microstructural point of view, thixotropy is
described as structural buildup (flocculation) under rest and breakdown (deflocculation) under
flow. For SCC, as well as other concrete systems, it is about balancing sufficient flowability during
casting and rate of structural buildup after placement for the application at hand. For instance,
relating to the issue of SCC formwork, it is ideal for the material to be highly flowable to achieve
rapid casting, but then exhibit high rate of structural buildup to reduce formwork pressure. This
can reduce the cost of formwork and reduce the risk of formwork failure. It is apparent that
accurately quantifying the two aspects of thixotropy, i.e. structuration and destructuration, is key
to tackling these challenges in field application. Thus, the overall objective of my doctoral study
is to improve quantification of key parameters tied to thixotropy that we have identified to be
important: static yield stress, cohesion and degree of shear-induced particle migration. The two
main contributions are as follows:
Firstly, I quantified structuration of fresh paste and mortar systems by measuring static yield
stress. After an extensive review of various rheological methods to probe viscoelastic properties

of yield stress fluids, I selected, developed, and implemented a creep recovery protocol. Creep
results were supplemented by low-amplitude oscillatory shear results, and supported that the
measured static yield stress corresponds to the solid-liquid transition. This improved quantification
of static yield stress can help better understand the effect of mix composition on SCC formwork
pressure development, as well as static segregation and stability [9]. Since the static yield stress is
measured before the structure is broken down, the effects of sand migration are eliminated. This
study also analyzed effects of other supplementary cementitous materials such as nanoclay and fly
ash. Results showed that nanoclay effectively increases static yield stress and structuration rate,
while fly ash decreases static yield stress. To complement this investigation, I studied cohesion
using the probe tack test, as cohesion is widely cited to be closely related to formwork pressure. I
verified that probe tack test is a quick and useful method to measure static cohesion. Results
showed that nanoclay increased cohesion dramatically while fly ash did not have an apparent effect
on cohesion.
Secondly, I developed an empirical model to fit the stress decay process under constant shear
rate, For mortar systems, the stress decay can be attributed to two mechanisms: colloidal
destructuration and sand migration. Such a model could be used to characterize particle migration
and dynamic segregation [10], a critical issue for casting applications. In addition, shear induced
particle migration is a widely recognized challenge in characterizing mortars and concretes
through shear rheological methods [11-13]. Therefore this model can help determine the range of
shear rates within which migration can be minimized to guide the design of protocols for dynamic
rheological characterization and to ultimately develop design strategies to minimize mitigation.
Compared with currently existing methods, this model provides a faster approach to quantify the
sand migration process, including kinetics.

i
Contents
List of Figures .......................................................................................................................... v
List of Tables .......................................................................................................................... ix
Acknowledgements .................................................................................................................. x
Chapter 1 Introduction ....................................................................................................... 1
1.1 Background ............................................................................................................... 1
1.2 Motivation ................................................................................................................. 2
1.2.1 Nanoclay ............................................................................................................ 3
1.2.2 Fly ash................................................................................................................ 4
1.3 Organization .............................................................................................................. 4
Chapter 2 Literature review ................................................................................................ 6
2.1 Rheology of cement-based materials ........................................................................ 6
2.1.1 Rheology of cementitious materials .................................................................. 6
2.1.2 Common field tests for workability ................................................................. 11
2.1.3 Concrete: multiphase material ......................................................................... 14
2.2 Thixotropy............................................................................................................... 19
2.2.1 Thixotropic behavior ....................................................................................... 19
2.2.2 Thixotropy and yield stress.............................................................................. 21
2.2.3 Importance to concrete applications ................................................................ 23
2.3 Viscoelastic properties of yield stress fluids ........................................................... 24
2.3.1 Oscillatory tests ............................................................................................... 24
2.3.2 Creep recovery test .......................................................................................... 27
2.3.3 Solid-liquid transition ...................................................................................... 29
2.3.4 Viscosity bifurcation........................................................................................ 30

ii
2.4 Particle shear migration .......................................................................................... 31
2.4.1 Particle shear migration in concretes and consequences ................................. 31
2.4.2 Challenges in measuring particle shear migration ........................................... 31
Chapter 3 Yield stress on fresh mortar systems – a preliminary study ............................ 34
3.1 Introduction ............................................................................................................. 34
3.2 Material and procedures .......................................................................................... 37
3.2.1 Materials .......................................................................................................... 37
3.2.2 Mix proportion ................................................................................................. 38
3.2.3 Mortar preparation ........................................................................................... 38
3.2.4 Rheometer and construction cell ..................................................................... 39
3.2.5 Protocol ............................................................................................................ 40
3.3 Test methods of shear rate control and results ........................................................ 42
3.3.1 Equilibrium flow curve: using constant angular velocity protocol ................. 42
3.3.2 Flow behaviour under intermediate shear rate ................................................ 44
3.3.3 Shear localization ............................................................................................ 46
3.3.4 Stick slip: flow behavior under low shear rate ................................................ 47
3.3.5 Theoretical discussion of material response under constant shear rate ........... 49
3.3.6 Other shear rate-controlled protcols to measure dynamic yield stress ............ 50
3.4 Test methods of shear stress control and results ..................................................... 54
3.4.1 Static yield stress: using creep recovery protocol ........................................... 55
3.4.2 Angular velocity bifurcation ............................................................................ 60
3.4.3 Thixotropy: connecting dynamic and static yield stress .................................. 64
3.4.4 Other protocols to measure static yield stress ................................................. 68
3.5 Conclusions: ............................................................................................................ 72
Chapter 4 Use creep recovery to measure static yield stress ............................................ 74

iii
4.1 Introduction ............................................................................................................. 74
4.2 Material and procedures .......................................................................................... 75
4.2.1 Materials .......................................................................................................... 75
4.2.2 Experimental setup and rheological protocols................................................. 76
4.3 Results and discussion ............................................................................................ 76
4.3.1 Creep-recovery - viscosity bifurcation ............................................................ 77
4.3.2 Solid-liquid transition ...................................................................................... 79
4.3.3 Effect of nanoclay ............................................................................................ 83
4.4 Conclusions ............................................................................................................. 87
Chapter 5 Tack test ........................................................................................................... 89
5.1 Introduction ............................................................................................................. 89
5.2 Material and procedures .......................................................................................... 90
5.2.1 Materials .......................................................................................................... 90
5.2.2 Shear rheological protocols ............................................................................. 92
5.3 Results and discussion ............................................................................................ 92
5.3.1 Normal force evolution at various plate velocities .......................................... 92
5.3.2 Effect of nanoclay on cohesive stress .............................................................. 97
5.3.3 Effect of fly ash ............................................................................................. 101
5.3.4 Effect of combination of nanoclay and fly ash .............................................. 102
5.4 Conclusions ........................................................................................................... 105
Chapter 6 Shear migration.............................................................................................. 107
6.1 Introduction and Background ............................................................................... 107
6.1.1 Thixotropy model: evolution of viscosity over time ..................................... 110
6.1.2 Roussel’s thixotropy model for concrete ....................................................... 111
6.1.3 Parameters affecting particle shear migration in fresh mortar ...................... 112

iv
6.2 Materials and procedures ...................................................................................... 114
6.3 Results and discussion .......................................................................................... 115
6.3.1 A modified thixotropy model for mortar ....................................................... 115
6.3.2 Effect of s/c ratio ........................................................................................... 116
6.3.3 Effect of clay addition ................................................................................... 120
6.3.4 Effect of angular velocity .............................................................................. 123
6.4 Conclusions ........................................................................................................... 126
Chapter 7 Conclusions and Future Work ....................................................................... 127
7.1 Thixotropy of mortar: difference between dynamic and static yield stress .......... 127
7.2 Static yield stress................................................................................................... 128
7.3 Cohesion ............................................................................................................... 129
7.4 Particle shear migration ........................................................................................ 129
7.5 Future work ........................................................................................................... 130
7.5.1 Effects of other supplementary cementitious materials (SCC) on dynamic, static
yield stress and cohesion ..................................................................................................... 130
7.5.2 Pumping pressure .......................................................................................... 131
7.5.3 SCC stability and segregation........................................................................ 131
Bibliography ........................................................................................................................ 132

v
List of Figures
Fig. 2-1 Laminar shear ............................................................................................................. 7
Fig. 2-2 Flow curve of fluids ................................................................................................... 9
Fig. 2-3 Bingham model and Herschel-Bulkley model ......................................................... 10
Fig. 2-4 Slump test: (a) cone filled with concrete; (b) measurement of slump ..................... 12
Fig. 2-5 Slump flow test ........................................................................................................ 13
Fig. 2-6 L-box test ................................................................................................................. 14
Fig. 2-7 Cement paste yield stress vs solid volume fraction [44] .......................................... 15
Fig. 2-8 Yield stress of cement paste as a function of hydration time [46] ........................... 16
Fig. 2-9 yield stress of (a) mortar and (b) concrete vs. solid volume fraction [44] ............... 17
Fig. 2-10 (a) applied shear stress and (b) shear stress development [51] .............................. 20
Fig. 2-11 Shearing a thixotropic liquid after short and long rest time [51] ........................... 21
Fig. 2-12 Strain sweep of cement paste with w/c at 0.36 ...................................................... 25
Fig. 2-13 Frequency sweep of cement paste with w/c at 0.36 ............................................... 25
Fig. 2-14 (a) creep recovery protocol and strain development of various samples: (b) solid; (c)
liquid; (d) viscoelastic solid and (e) viscoelastic liquid. ............................................................... 29
Fig. 2-15 Avalanche flow of a clay suspension on an inclined plane [76] ............................ 30
Fig. 3-1 Stress development under constant shear rate [96] .................................................. 36
Fig. 3-2 (a) HAAKE MARS III rheometer with construction cell and (b) dimensions of
construction cell ............................................................................................................................ 40
Fig. 3-3 (a) constant angular velocity protocol and (b) torque development between 7 rad/s
and 50 rad/s. .................................................................................................................................. 43
Fig. 3-4 The equilibrium flow curve of mortar ...................................................................... 44
Fig. 3-5 Torque development at constant angular velocity between 1 rad/s and 7 rad/s. ...... 45
Fig. 3-6 The complete equilibrium flow curve of mortar. ..................................................... 45

vi
Fig. 3-7 Tangential velocity diagram under steady state constant apparent shear rate [85] .. 46
Fig. 3-8 Under applied angular velocity at 0.1 rad/s, (a) angular velocity and torque
development; (b) angular velocity and angular deformation. ....................................................... 48
Fig. 3-9 Flow behavior under constant angular velocity [78]. .............................................. 50
Fig. 3-10 Step down protocol and torque development results ............................................. 51
Fig. 3-11 Step down results, compared with equilibrium flow curve in section 3.3.1 .......... 52
Fig. 3-12 (a) ramp up and down protocol and (b) results, compared with equilibrium flow
curve in section 3.3.1 .................................................................................................................... 54
Fig. 3-13 Creep recovery behavior of mortar under torque at (a) 50 mNm; (b) 67.3 mNm . 56
Fig. 3-14 a) Creep recovery behavior of mortar under torque at 67.5 mNm and b) creep
behavior at the beginning under torque at 67.5 mNm. ................................................................. 57
Fig. 3-15 (a) angular deformation v.s. torque and (b) recovery percentage v.s. torque ........ 59
Fig. 3-16 (a) angular velocity of mortar under creep at various torque values and (b) the
relationship between angular velocity at plateau and torque. ....................................................... 61
Fig. 3-17 angular deformation of mortar at 0.3 second under constant torque ..................... 62
Fig. 3-18 Compared to critical angular deformation, instantaneous deformation before
bifurcation, under low, intermediate or high torque, leads to different flow behavior. ................ 64
Fig. 3-19 (a) thixotropy twist protocol; (b) creep after sheared at 30 rad/s for 60 seconds and
(c) creep after sheared at 1 rad/s for 60 seconds. .......................................................................... 66
Fig. 3-20 Equilibrium flow curve twist: importance of thixotrpy and initial flocculation state
....................................................................................................................................................... 67
Fig. 3-21 Creep recovery steps: (a) angular deformation and (b) adjusted angular deformation
....................................................................................................................................................... 69
Fig. 3-22 (a) linearly increasing stress protocol; (b) angular deformation v.s. torque results 71
Fig. 4-1 Strain development of paste under (a) creep and (b) recovery ................................ 78
Fig. 4-2 Viscosity bifurcation of paste .................................................................................. 78
Fig. 4-3 Frequency sweep of cement paste with w/c at 0.36 ................................................. 79
Fig. 4-4 Strain sweep of cement paste with w/c at 0.36 ........................................................ 80

vii
Fig. 4-5 Transition strain vs applied creep stress, in comparison with critical stress and critical
strain – (a) Full and (b) partial plot. .............................................................................................. 81
Fig. 4-6 Comparison of transition strain to critical strain, under low and high stress, leads to
different flow behavior ................................................................................................................. 82
Fig. 4-7 Effect of nanoclay addition on static yield stress ..................................................... 84
Fig. 4-8 Effect of resting time on static yield stress with 0 and 0.5% of nanoclay ............... 85
Fig. 4-9 Effect of nanoclay addition on critical strain through low amplitude oscillatory sweep
....................................................................................................................................................... 87
Fig. 5-1 Partcile size distribution of cement and fly ash ....................................................... 91
Fig. 5-2 Normal force evolution curves for plain cement paste under various pulling velocity
....................................................................................................................................................... 93
Fig. 5-3 Peak force vs plate pulling velocity for plain cement paste ..................................... 94
Fig. 5-4 Failure surfaces of cement paste, including side face and failure face of each plate at
pulling velocities (a) 50 𝜇𝑚/𝑠 and (b) 1 𝜇𝑚/𝑠 ............................................................................ 97
Fig. 5-5 Cohesion of cement paste with nanoclay addition ................................................... 98
Fig. 5-6 Cohesion of cement paste with nanoclay addition measured by tack test and calculated
using static yield stress................................................................................................................ 100
Fig. 5-7 Comparison of normalized cohesion measured by tack test and static yield stress
measured by creep recovery of cement paste with nanoclay addition ........................................ 100
Fig. 5-8 Cohesion of cement paste with fly ash addition .................................................... 101
Fig. 5-9 Static yield stress of cement paste with FA addition ............................................. 102
Fig. 5-10 Cohesion of cement paste modified with nanoclay and fly ash ........................... 104
Fig. 5-11 Static yield stress of cement paste modified with nanoclay and fly ash .............. 105
Fig. 6-1 One versus two exponential model for capturing stress decay of fresh mortar (s/c = 2)
under constant angular velocity (10 rad/s). ................................................................................. 116
Fig. 6-2 Effect of s/c ratio on parameters 1 and 2. ........................................................... 118
Fig. 6-3 Effect of s/c ratio on (a) parameters M0, M1, and M2 and (b) normalized M0, M1, and
M2. ............................................................................................................................................... 119

viii
Fig. 6-4 Effect of nanoclay addition on parameters α1 and α2. ............................................ 121
Fig. 6-5 Effect of nanoclay addition on (a) parameters M0, M1, and M2 and (b) normalized M0,
M1, and M2. ................................................................................................................................. 123
Fig. 6-6 Effect of angular velocity on parameters α1γ and α2γ. ......................................... 124
Fig. 6-7 Effect of angular velocity on (a) parameters M0, M1, and M2 and (b) normalized M0,
M1, and M2. ................................................................................................................................. 125

ix
List of Tables
Table 3-1 Cement chemical constituents ............................................................................... 37
Table 6-1 Effects of nanoclay addition on critical strain ..................................................... 121

x
Acknowledgements
I would like to express my deepest gratitude to my supervisor Professor Shiho Kawashima for
her continuous guidance and encouragement throughout my graduate study. As a mentor and a
friend, she gave me the full freedom to explore research topics I like and great support and
guidance I need to further my work.
I wish to extend my gratitude to my Ph.D. defense committee, Dr. Nathan Tregger from GCP
Applied Technology, Professor Nicolas Roussel at IFSTTAR, East Paris University, and Professor
Huiming Yin and Professor Hoe I. Ling at Columbia University for taking their valuable time to
participate my defense and comments on this dissertation.
Over the years at Columbia, several udnergraduates, and one high school senior have helped
a lot running experiments. Thank you: Maika Abdallah, Jaclyn Fu, Jumari Robinson, Augusta C.
Uwamanzu-Nna, Fumin Li, Courtney Kim and Shuyin Hua. Big thanks to my fellow Ph.D. student
Siwei Ma for the cooperation and help in the lab. Hope you all keep doing great in your work and
further study.
Thanks to Christopher DiMarco in Mechanical Engineerin for his help in discussion of
nanomaterials and graphene oxide project, and Xiaozhou Zhou in Environmental and Earth
Engineering for his help in making SSS carbon sequestration byproduct to replace cement project.
I also appreciate solid work of staff in Carleton Laboratory at Columbia University. They
provides a comfortable home for my experiments. Thank you: Adrian Brugger, Eric Sporer and
Travis Simmons. Special thanks go to Dr. Liming Li for his unconditional caring and support in
the lab.
Staff in department of Civil Engineering and Engineering Mechanics also give me strong
support and friendly advices in school and in life. Thanks to Scott Kelly, Elaine M. McDonald,
Katherine K. Rosado, Nathalie Rodriguez, and Michael A. Smith.
Friends at Columbia and New York City also give support and company in my study and life.
Thank you: Dimitrios, Juan, Miguel, Luc, Kun, Audrey, Ketson, Jiayang, Nick, Jin, Weijiao, Nan
and Yang.

xi
To my parents

Introduction
1
Chapter 1
Introduction
This chapter introduces the background and motivation, and the outline of this dissertation.
1.1 Background
Concrete is the most widely used infrastructural material in the world. From the middle of the
18th century when Portland cement was development, cement and concrete has been constantly
revolutionized, continually driven by large applications.
As high-rise buildings are all reinforced concrete structures. Stronger concrete materials are
demanded. One effective way to increase mechanical strength of concrete is to decrease water
cement ratio. However, low water cement ratio induces poor workability. The concrete becomes
dense and sticky. It becomes hard to mix, to pump and to cast. Water reducing agents are largely
used to enhance good workability at low water cement ratio. In the meantime, to increase pumping
and casting speed, more flowable concrete than conventional concrete is demanded.
Self-consolidating concrete (SCC) is introduced and fabricated to meet the demands in
modern concrete and construction industry [14]. With addition of superplasticizer, which disperses
the cement particles, and low volume content of coarse aggregate, it is very flowable and could
consolidate under its own weight. So no vibration in construction field after casting is needed, thus
greatly reducing labor work, dust, noise, etc. Since no vibration work after casting is needed, the
requirement for construction skills becomes lower. So the quality of concrete is guaranteed. It is
suitable for high-rise buildings since it is flowable and thereby pumpable to significant heights. It
could also increase casting speed and thus construction speed.

Introduction
2
1.2 Motivation
From contact with water until hardening, and deterioration, cement and concrete are subjected
to various chemical and physical transformations and environmental impacts. This thesis focuses
on the properties during the fresh state, shortly after mixing until the induction period. During this
period, flow history, including shearing and resting, and hydration both play big roles in
determining the rheological properties. The rheological properties of cement and concrete not only
affect the casting and pumping process, but are also very critical for the eventual hardened and
durability properties. For example, poor flowability of concrete or passing ability through
reinforcements may result in big holes or cavities in the final material, which can compromise the
quality of the overall concrete structure.
Compared with conventional concrete, self-consolidating concrete (SCC) can introduce many
advantages in construction application. These include readiness to apply, decreasing labor
necessary for casting, and enhancing hardened properties. However, challenges still remain, such
as issues relating to formwork pressure [1-7], stability [9] and multi-layer casting [8]. For example,
highly flowable concretes are good for pumping and casting. However, they also tend to result in
high formwork pressure, which may result in high construction price or even formwork failure if
not well designed. In addition, if the yield stress and/or viscosity of the cement paste matrix of
SCC is too low, it will not be able to support the distribution of aggregates under gravity or under
shear, thus resulting in poor stability of coarse aggregate and particle shear migration.
Each of these issues is closely related to the property of thixotropy. From the microstructural
point of view, thixotropy is described as structural buildup (flocculation) under rest and breakdown
(deflocculation) under flow. For SCC, as well as other concrete systems, it is about balancing
sufficient flowability during casting and rate of structural buildup after placement for the
application at hand. Relating to the issue of SCC formwork, it is ideal for the material to be highly
flowable to achieve rapid casting, but then exhibit high rate of structural buildup to reduce
formwork pressure. This can reduce the cost of formwork and reduce the risk of formwork failure.
It is apparent that accurately quantifying the two aspects of thixotropy, i.e. structuration and

Introduction
3
destructuration, is key to tackling these challenges in field application. Thus, the overall objective
of my doctoral study is to improve quantification of key parameters tied to thixotropy that we have
identified to be important: static yield stress, cohesion and degree of shear-induced particle
migration. Meanwhile, I will explore protocols to measure these rheological properties and explore
effects of additive materials.
1.2.1 Nanoclay
Highly purified attapulgite clay is a highly purified magnesium alumino-silicate. It is a
commercially available clay that is chemically exfoliated from bulk attapulgite to remove all
impurities. When dispersed, it is needle-like with an average length of 1.75 µm and diameter of 3
nm, so it will be referred to as nanoclay herein.
Extensive studies have been done on nanoclay on rheological properties of cement paste and
concrete. Test results by Kim et al. [15] shows that addition of nanoclay, at small amounts up to
0.33% of cement by mass, greatly decreases formwork pressure of SCC as measured by a lab-scale
formwork pressure test. Nanoclays have been shown to increase yield stress [6, 16], apparent
viscosity [17] and cohesiveness [18] of cement paste at modest dosages. Studies also show that
nanoclay could stabilize the mortar and concrete mixes [19].
Treggger et al. [20] reasoned that with nanoclay addition, the bonds between the cement
particles are stronger. In addition, the compressive yield stresses are also higher for the clays than
the control cement paste. Using focused beam reflectance measurement (FBRM), Ferron et al. [21]
measured the chord length, which is a characteristic measurement of geometry and size of paste
agglomerates. They found out that clay increases mean chord length.
The exact mechanism(s) underlying the effect of clays on cement and concrete rheology is not
clear. However, a number of hypotheses exist. One possible mechanism is that the clays are
absorbing water that would normally help lubricate the microstructure and allow particles to easily
slide past each other during shear. Thus,without lubricating water, the paste has higher yield stress.
Kawashima et al. [6] found out that nanoclay has an immediate stiffening effect on fresh cement
paste due to flocculation, but not adsorption by nanoclays leading to loss of free water. Another

Introduction
4
possible mechanism is that the nanoscale clay particles are filling the gap between cement particles
or paste agglomerates larger than nanoclay in size. The increasing number of physical contact
points would lead to a larger yield stress. Lastly, a third mechanism is the house of cards structure
formed by nanoclay due to surface charges. It would increase the rate of aggregation and the
strength of paste agglomerates [21].
This study shows that the nanoclay increases the yield stress and cohesion of cement paste
and mortar stability.
1.2.2 Fly ash
As a mineral waste from steel factory, fly ash has been largely used as supplementary
cementitious material. The addition rate of fly ash over cement by mass could be as high as 50%
[22]. It is a great example of sustainability in concrete industry. Fly ash exhibits pozzolanic
reaction in later hydration ages, which effectively increases mechanical strength and enhances
durability properties of concrete materials. It is found that it reduced water demand while
maintaining workability. However, it shows low reaction rate during induction period, thus
resulting in low early strength and poor shape stability [6]. Studies [20, 23] shows that nanoclay
strengthens cement paste with fly ash addition.
1.3 Organization
This Chapter presents the background and motivation of the work. Chapter Two will be a
literature review of studies pertinent to this thesis. Chapter Three presents the preliminary work
on the rheological properties of fresh mortar. Methods to measure yield stress are presented and
discussed. The relationship between static and dynamic yield stress, and thixotropy are presented.
Chapter Four presents the results of the creep recovery study, which measures the effects of
nanoclay and fly ash on the static yield stress of cement paste. Chapter Five presents the results of
a tack test study, which measures the effects of nanoclay and fly ash on the cohesion of cement

Introduction
5
paste. Chapter Six proposes a thixotropy/migration model to quantify particle shear migration in
fresh mortar. Parameters affecting particle shear migration are discussed. Chapter Seven presents
a summary of the key conclusions and future work.

Literature review
6
Chapter 2
Literature review
This chapter we review theories of rheology theories and explore challenges in studying the
rheology of cement-based materials.
2.1 Rheology of cement-based materials
Rheology is the science of the deformation and flow of materials. Concrete in its fresh state
can be considered as a fluid, so the basic principles of rheology can be applied to concrete [24].
2.1.1 Rheology of cementitious materials
2.1.1.1 Viscosity
Viscosity of a fluid is a measurement of its resistance to deformation under stress. In Couette
flow a layer of fluid is trapped between two horizontal plates, one fixed and one moving
horizontally at constant speed μ, as shown in Fig. 2-1.

Literature review
7
Fig. 2-1 Laminar shear
The fluid particles will move parallel to the moving plate, and their velocity will vary linearly
from zero at the bottom to v at the top. Each layer of fluid will move faster than the one just below
it, and friction between them will give rise to a force resisting their relative motion. An external
force is therefore required to keep the top plate moving.
The magnitude of this force F is found to be proportional to the velocity of moving plate v
and the area A of each plate, and inversely proportional to the distance of parallel plates h:
F = μAv
h Eq. 2.1
It could be converted as
F
A= μ
v
h
Eq. 2.2
Shear rate is the rate at which the shear deformation progresses. The moving velocity of fluid
depends on the height relative to the stationary plate. As seen in Fig. 2-1, the moving speed of
fluid is assumed to be linearly increases from the stationary plate to the moving plate from 0 to v.
The shear rate of fluid is the deviation of shear velocity to distance, as Fig. 2-1 shows.

Literature review
8
γ̇ =γ
t=
vtht
=v
h
Eq. 2.3
Where γ̇ is the shear rate, v is the velocity of the moving plate, h is the distance between the
two parallel plates.
The shear stress is defined as
τ =
F
A
Eq. 2.4
So Eq. 2.2 becomes
τ = μγ̇ Eq. 2.5
The proportionality factor μ is the viscosity of the fluid. Thus Eq. 2.5 becomes a constitutive
law describing the properties of fluids.
2.1.1.2 Flow curve
The relationship between shear stress and shear rate is called flow curve, and is commonly
used to describe the flow properties of the fluids. For some materials like gas and water, the
viscosity is not dependent on shear rate, while for some materials like gels and cement pastes, the
viscosity changes with shear rate.
Depending on whether the viscosity changes with shear rate, the rheological behavior of fluids
can be classified as Newtonian and non-Newtonian fluids. A fluid, whose viscosity μ is
independent of the shear rate, is a Newtonian fluid. Gases, water, and many common liquids are
Newtonian fluids. Fluids, whose viscosity changes with the shear rate, are non-Newtonian fluids.
There are shear thickening liquids, whose viscosity increases with shear rate; shear thinning liquids,
whose viscosity decreases with shear rate; and yield stress fluids that behave as a solid at low
stresses but flow as a viscous fluid at high stresses. Cement paste and concrete are yield stress
fluids.

Literature review
9
Fig. 2-2 Flow curve of fluids
2.1.1.3 Yield stress
Yield stress is another parameter to characterize rheological properties. Cementitious
materials are yield stress fluids [25]. It was found that the measured flow curve is easily fitted into
Eq. 2.6, proposed by Bingham [26].
τ = 𝜏y + 𝜇plγ̇ Eq. 2.6
Where, τ is the shear stress, γ̇ is the shear rate, τy is the Bingham yield stress and μpl is the
plastic viscosity.
The yield stress is defined as the minimum applied shear stress for a fluid to flow. When the
applied shear stress is lower than the yield stress, the material exhibits solid-like behavior. Beyond
the yield stress, the fluid flows. The physical reason for this behavior is that the material contains
particles or large molecules that create a weak solid structure with non-contact and contact
interactions (e.g. attractive Van der Waals force and hydration product bridges). So a certain
amount of stress is required to break this structure to make the fluid flow.

Literature review
10
Besides the Bingham model, other models were also proposed to fit the flow curve and obtain
yield stress. For example, the Herschel-Bulkley model
σ = σy + k ∗ γ̇n Eq. 2.7
where, k and n are constants as material properties.
Modified Bingham models are also used to fit the flow curve of cement paste [6, 27].
τ = τy [1 − exp (
3γ̇
γ̇crit)] + μγ̇
Eq. 2.8
τ = τy + μγ̇ + cγ̇2 Eq. 2.9
where �̇�𝑐𝑟𝑖𝑡 is critical strain rate corresponding to 𝜏𝑦.
Mortar and SCC are usually regarded as Bingham materials, showing a linear relationship
between shear stress and shear rate [1, 28, 29] while, because of shear thinning of cement paste
[30] and shear thickening of normal concrete [31], cement paste and normal concrete are fitted
with the Herschel-Bulkley model, in which n<1 for shear thinning and n>1 for shear thickening.
The flow behavior are shown in Fig. 2-3.
Fig. 2-3 Bingham model and Herschel-Bulkley model

Literature review
11
2.1.1.4 Rheometers and measuring geometries
To measure these rheological parameters, such as shear rate and shear stress, rheometers are
used. It could measure angular velocity and torque at the same time. Depending on measuring
geometry, corresponding shear rate and shear stress could be obtained. Common measuring
geometries includes concentric cylinders, vane and cylinder, cone and plate, and parallel plates.
2.1.2 Common field tests for workability
In the field, several empirical test methods have been used and standardized to test rheological
properties of concrete [32]. These parameters measured through empirical tests, such as the slump
or slump flow test [33-36] and L-box test [37, 38], can be correlated to rheological parameters,
such as yield stress and viscosity measured by rotational rheometers.
2.1.1.1 Slump test
The slump test is commonly used to verify the consistency of and also the workability of fresh
concrete [32]. The test is carried out using a mold known as a slump cone. In the United States,
ASTM C 143 [39] defines the cone with a base diameter of 200 mm (8 inch), an upper diameter
of 100 mm (4 inch), and a height of 300 mm (12 inch). The cone is filled with fresh concrete in
three layers with equal volume. Each layer is tamped 25 times with a rod. The third layer is finished
off so it is level with the top of the cone. The mold is carefully lifted vertically upwards and the
change in height of the concrete is measured, as shown in Fig. 2-4. The decreased height of
concrete after lifting the mold is termed as slump. The top part of material in the slump experiences
stress smaller than yield stress. The bottom part experiences stress higher than the yield stress, thus
showing yielding and slump behavior until the stress is reduced to the yield stress value. Thus the
slump value and the yield stress has been correlated by many studies [33-35, 40].

Literature review
12
(a)
(b)
Fig. 2-4 Slump test: (a) cone filled with concrete; (b) measurement of slump
2.1.1.2 Slump flow
When the concrete is very flowable, the slump flow test is performed to measure workability.
Similar to the slump test, the concrete is filled in the cone and leveled off at the top of the cone.
Many technicians turn the cone upside down to make filling concrete easier. When the cone is
lifted, the flowable concrete spreads out like pancake batter, as shown in Fig. 2-5. The slump flow
is measured as the diameter of the spread concrete, as described in ASTM C 1611 [41]. Typical
SCC mixes have slump flow ranging from 457 to 762 mm (18 to 30 inches). The flow stops when
the stress is below the yield stress. The time required to reach the final diameter is also used to
correlate to the segregation and viscosity of SCC [40, 42].

Literature review
13
Fig. 2-5 Slump flow test
2.1.1.3 L-box test
The L-box test is used to test the yield stress and access the passing ability of self-compacting
concrete to flow through bars without segregation or blocking. Fresh SCC is filled into the vertical
hopper and the surface is finished off. After standing for 60 ± 10 seconds, the gate is lifted until
the concrete stops flowing. The passing ability ratio (PL) is the depth at the end of horizontal tube
divided by the depth at the hopper 𝐻2/𝐻1. If the SCC flows very uniformly the PL would be 1.
Therefore, the closer of PL to 1, the better the passing ability of fresh concrete [38]. Depending on
the shape of SCC at stoppage, Roussel also investigated the correlation between yield stress of
SCC and similar LCPC box test [37].

Literature review
14
Fig. 2-6 L-box test
2.1.3 Concrete: multiphase material
Cement paste is made of cement powder and water. Adding sand or fine aggregate in cement
paste, mortar is obtained. Adding gravel or coarse aggregate, concrete is obtained. From cement
paste to concrete, each suspension is considered as a rheological study scale.
2.1.3.1 Cement paste
Many studies focus on paste because it embodies the colloidal effects and hydration effects.
Thus, paste phase also is the origin of yield stress, age and shear history dependence, as well as
thixotropy.
Fresh cement paste could be viewed as suspensions of different sizes (from several nm to 100
𝜇𝑚) in a continuous fluid phase (water). Depending on water cement ratio and solid volume
fraction, the obtained cement suspension either behaves as Newtonian fluid (cement grout)
showing no yield stress at low solid volume fraction, or yield stress fluid (cement paste) at high

Literature review
15
solid volume fraction [43]. It has been studied [44] that the yield stress of cement paste increases
with increasing solid volume fraction, as shown in Fig. 2-7.
Fig. 2-7 Cement paste yield stress vs solid volume fraction [44]
The micromechanical state and physical interactions in cement paste has been studied by
Roussel et al. [25]. Depending on the size and volume fraction of the particles, and flow history of
the material, one or several of these interactions dominate [45]. Normal cement paste has water
cement ratio ranging from 0.20 to 0.60, making the solid volume fraction ranging from 0.35 to
0.60 [25]. In this range, several types of non-contact interactions occur: Van der Waals forces,
electrostatic forces, steric hindrance with polymer additives, and hydrodynamic forces. Van der
Waals forces dominate Brownian motion and hydrodynamic forces at low shear rates, and give
shear thinning properties. At intermediate shear rate, hydrodynamic force dominates. At high shear
rate, particle inertia dominates and leads to shear thickening. It was concluded that there was a

Literature review
16
transition volume fraction below which the yield stress is due to Van de Waals forces, and above
which the yield stress is due to direct contact of particles.
Hydration also changes the properties of cement paste. The hydration products (i.e. C-S-H,
ettringite, and calcium hydroxide) build up a stronger solid network and consume water. Though
creep recovery test, Struble [46] found that the yield stress increases slowly within the induction
period (around 2 hours), and then increases rapidly from initial setting time until final setting, as
shown in Fig. 2-8.
Fig. 2-8 Yield stress of cement paste as a function of hydration time [46]
2.1.3.2 Mortar and concrete
Both mortar and concrete are a combination of cement paste and aggregates. They are
considered as a suspension of aggregates of various sizes in a paste phase. Since fine and coarse
aggregates are mostly regarded as inert, the time dependent and flow history dependent properties
of mortar and concrete mostly originate from the physical properties of the paste phase. However,

Literature review
17
the particle volume fraction also plays a critical role in the flow behavior of mortar and concrete,
making them quite different from that of cement paste.
(a) (b)
Fig. 2-9 yield stress of (a) mortar and (b) concrete vs. solid volume fraction [44]
It has been studied [44] that the yield stress of mortar and concrete increase with increasing
particle volume fraction of aggregate, as shown in Fig. 2-9. What is interesting is that the yield
stress of mortar is smaller than that of cement paste at low sand volume fraction. It is assumed that
sand immersed in cement paste helps shear and break the colloidal structure of cement paste, thus
resulting in a weaker global structure of mortar. Another possible reason is particle shear migration.
Sand in mortar tends to migrate from the rotor to the wall, thus making viscosity and stress decrease
[19]. Part of the mission of this thesis is to study shear migration and exploring protocols to
quantify it.
The yield stress of concrete is much higher than that of mortar or cement paste, partly because
of the high volume fraction of gravel in concrete and high mechanical friction under flow. It has
been studied [47] that there is strong direct contact and high friction between particles in normal
concrete.

Literature review
18
2.1.3.3 Self-consolidating concrete (SCC)
To improve workability of fresh concrete, superplasticizers are added [48]. Superplasticizers
are organic polymers, which could be absorbed on the surface of cement powders and other fine
supplementary cement minerals (e.g. slag, fly ash, and silica). Either through electricstatic
repulsion or steric hindrance, superplasticizers disperse the powders and prevent them from
agglomerating, thus improving workability [45, 47].
SCC is a new type of concrete with excellent flowability and high performance, the
development of which was made possible by superplasticizers. SCC was conceptualized by
Professor Okamura at Ouchi University, Japan [14]. The self-compacting ability limits the work
load in construction by eliminating the need to apply external vibration and also makes casting of
stable, high performance concrete mixes easier. It shows great self-compactability through limited
aggregate content and the use of superplasticizers. The degree of packing of coarse aggregate in
SCC is around 50%, much lower than conventional concrete. With dispersing effects of
superplasticizers, the paste and mortar phase in SCC shows superior deformability and low
viscosity. Studies [47] show that from normal concrete to SCC, the rheological behavior of normal
concrete changed from being dominated by friction between aggregate particles to hydrodynamic
interactions. The yield stress was greatly decreased by around two orders, while the mechanical
strength only decreases a few percent. In the meantime, the mortar phase also shows moderate
viscosity and yield stress so that the coarse aggregates do not segregate in the mortar phase. The
cement paste phase also has low water cement ratio to ensure sufficient mechanical strength and
to prevent segregation of aggregates.
The flow behavior of SCC is close to that of mortar [44, 49, 50]. In addition, compared with
cement paste and concrete, mortar is much less studied and needs further solid exploration. So in
Chapter 3, as a preliminary study, we firstly study the flow properties of mortar.

Literature review
19
2.2 Thixotropy
2.2.1 Thixotropic behavior
Thixotropy is defined as a property of fluids where the structure breaks down under flow and
rebuilds at rest [51]. Pryce-Jones stated that the true meaning of thixotropy is, "an increase of
viscosity in a state of rest and a decrease of viscosity when submitted to a constant shearing stress".
Thixotropic behavior is not only time dependent, but also shear rate dependent.
2.2.1.1 Shear rate dependent
(a)

Literature review
20
(b)
Fig. 2-10 (a) applied shear stress and (b) shear stress development [51]
As shown in Fig. 2-10, when we apply a constant shear rate on thixotropic materials, the shear
stress will increase to a peak value and then decrease due to structure breaking down. It will
eventually reach a constant value, or equilibrium. After that, if the shear rate is instantaneously
decreased to a lower value, the measured shear stress drops instantaneously. With time, it will
slowly increase towards a new equilibrium value.
The reason for these lags of stress development is that it takes time for the structure of the
fluid to break down or rebuild. Under high shear rate, the shear stress progressively decreases with
time until reaching an equilibrium value. From high shear rate to low shear rate, the microstructure
is weaker than the steady state at low shear rate, so the instantaneous stress is lower than the
equilibrium value at low shear rate. It takes time for the structure to build up and for the shear
stress to increase to a new equilibrium value [52].
Through focused beam reflectance measurement (FBRM), the flocculated particle size (or floc
size) in cement pastes was measured at different shear rates [21]. The chord length is a
characteristic measurement of particle geometry and size. It was found that at low shear rate (40
rpm), the mean chord length increases with time; however, at high shear rate (400 rpm), the mean

Literature review
21
chord length decreases with time. In the mean time, the counts, which is related to the number of
flocs, decrease at 40 rpm and increase at 400 rpm. After 30 min, the percentage of large chord
length flocs increases under 40 rpm, while the percentage of small chord length flocs increases
under 400 rpm. It shows that at low shear rate, the flocs form and grow with time; while at high
shear rate, the flocculations are broken down with time.
2.2.1.2 Time dependent
Fig. 2-11 Shearing a thixotropic liquid after short and long rest time [51]
Applying constant shear rate after different resting time, the peak value of stress development
is different. After longer resting time, the microstructure is stronger, thus the peak value is higher
even though the shear rate is the same. But after continuous shearing, the shear stress of both
materials will eventually reach the same equilibrium value, corresponding to the same steady state
and microstructure related to applied shear rate.
2.2.2 Thixotropy and yield stress

Literature review
22
The yield stress of cement paste originates from the microstructure of attractive particle-
particle network through colloidal interaction or direct contact. The microstructure sustains a
certain amount of stress before it is broken down and starts to flow, which defines the yield stress.
At rest, the microstructure builds up due to Brownian motion, thermostatic effects, and cement
hydration bonding, such as CSH bridges [53], thus resulting in higher yield stress. Under shear
flow, the structure and bonding network is broken down, resulting in lower yield stress. This
property of fresh cementitious materials, before setting, where the microstructure and yield stress
changes with flow history is termed thixotropy.
Roussel [53] assumed that the hydration products, even at early ages, contributes to the
structuration of fresh cement paste. Early hydration products on the surface of cement particles
bridge these particles together to form a rigid network, which exhibits a relatively small critical
strain. In comparison, colloidal forces of cement powders contribute to a softer network with a
relatively higher critical strain. These two networks both act as the origin of thixotropy of cement
paste. They also play a big role in structuration and yield stress. Thus, yield stress and thixotropy
are closely related [54, 55].
It could be reasoned that because of thixotropy there should be more than one state of
flocculation state or microstructure when yield stress is defined, depending on the flow history of
the material.
As a common method to obtain yield stress, an equilibrium flow curve is plotted as the
equilibrium shear stress – shear rate relationships. Since generally the equilibrium shear stress
increases with shear rate, yield stress is regarded as the shear stress when shear rate is 0, so the
smallest stress to sustain the flow of the material. This is commonly termed dynamic yield stress.
Meanwhile, there exists a yield stress corresponding to a state before the structure is broken down,
so the stress necessary to initiate flow. This is termed the static yield stress. Because of shear
rejuvenation, or structural rebuilding, the static yield stress is expected to be higher than dynamic
yield stress. The existence of separate dynamic and static yield stresses in the same material is
known in bentonite [56], paints [57] and waxy crude and fuel oils [58].

Literature review
23
2.2.3 Importance to concrete applications
Numerous applications of thixotropy on SCC are listed as following:
FORMWORK PRESSURE: Due to its high fluidity and high casting rate, SCC results in
the higher pressure on formwork than normal concrete [59, 60]. Formwork for walls and columns
can contribute up to 40% of the overall cost of concrete construction projects [61]. Further,
continuous casting will make formwork pressure even higher. Meanwhile, controlling the static
yield stress and cohesion of SCC can help limit the transfer from vertical to lateral stress against
the formwork [7, 8]. Further, systematic works by Assaad, Khayat et al. [29, 62] show that the
formwork pressure is related to thixotropy. For high thixotropy materials, which corresponds to
faster increase of yield stress over time, the initial formwork pressure is lower and the rate of drop
after casting is higher. They reasoned that thixotropy makes the material regain green strength,
internal friction and cohesion at rest. They investigated many different admixtures to modify
thixotrop including set-accelerating agents, which were found to enhance the rate of decrease in
formwork pressure by increasing hydration rate of cement. Other separate studies [6, 15, 63] have
shown that the addition of nanoclay enhance the thixotropy of cement pastes and decrease the
formwork pressure of SCC.
STABILITY: During mixing and casting, the cement paste is deflocculated and the yield
stress and apparent viscosity decreases because of the high shear rate. This facilitates pumping and
placement of the material. However, as soon as casting is over, and before setting, gravity may
induce static segregation of the coarse particles. If the difference of gravity on the coarse aggregate
and the resistance of the constitutive cement paste is higher than the static yield stress of cement
paste, the coarse aggregate would start flowing to the bottom. If the cement paste has a high
thixotropic rebuilding rate at rest, its static yield stress will increase rapidly and will be sufficient
to prevent static segregation [9, 10]. It has been shown that the stability of SCC can be improved
when the constitutive cement paste of SCC is highly thixotropic, along with the addition of
viscosity enhancing admixture [64-66].
MULTI-LAYERS CASTING: SCC is cast layer by layer on site. After casting, a layer of
SCC would flocculate and build up microstructure in a short period of time before a second layer
of concrete is cast onto it. If it is highly thixotropic and flocculates too quickly, the yield stress

Literature review
24
increases above a critical value and the two layers will not mix well. As vibrating is prohibited for
SCC casting, it creates an interface between these two layers in the hardened structure, resulting
in weakened bonding and poor durability [67].
2.3 Viscoelastic properties of yield stress fluids
As argued by Barnes [68], fresh cementitious materials show elastic properties at very small
deformation. It could sustains a certain amount of stress or small amount of deformation. However,
it flows under high stress or large deformation. Fresh cementitous materials have viscoelastic
properties. Studies [16, 30] show that under creep it shows viscoelastic solid-like behavior under
low creep stress, while it shows viscoelastic liquid-like behavior under high creep stress.
2.3.1 Oscillatory tests
Oscillatory test has been largely applied to study the viscoelastic properties of cement paste.
The theory is briefly explained here.
An oscillatory strain is applied as a sine function:
γ = γ0 sin(ωt) = γ0 sin(2πft) Eq. 2.10
Where, 𝛾0is maximum strain amplitude, t is time, and 𝜔 is angular frequency in rad/s and f is
frequency in Hz. If the strain is sufficiently low so that the particles in the suspension remain close
to each other, the microstructure is not disturbed and the material can recover elastically. In this
case (linear regime), the measured response in terms of stress is as follows:
τ = γ0[G′ sin(ωt) + G"cos(ωt)] Eq. 2.11
where 𝐺′ is the storage modulus, and 𝐺" is the loss modulus.
Literature review
25
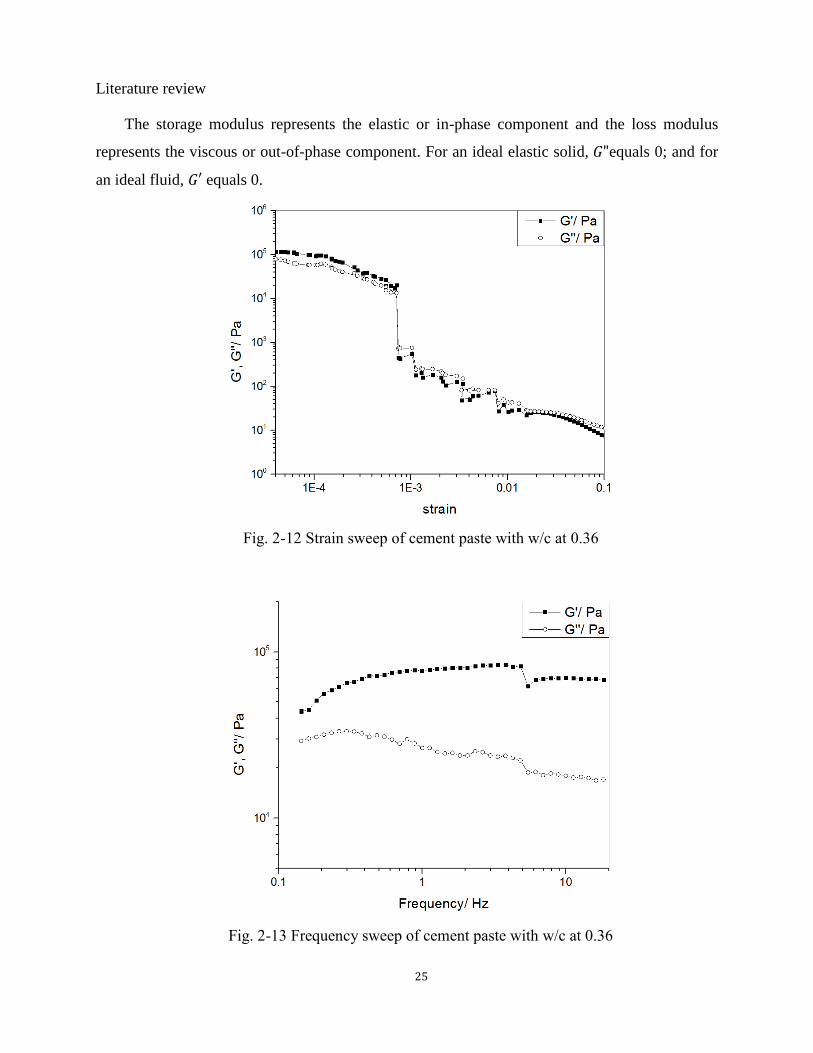
The storage modulus represents the elastic or in-phase component and the loss modulus
represents the viscous or out-of-phase component. For an ideal elastic solid, 𝐺"equals 0; and for
an ideal fluid, 𝐺′ equals 0.
Fig. 2-12 Strain sweep of cement paste with w/c at 0.36
Fig. 2-13 Frequency sweep of cement paste with w/c at 0.36

Literature review
26
The first step in performing oscillatory shear rheometery is to find the linear viscoelastic
region (LVR), where G’ (and also G”) is independent of applied frequency and strain. For a
flocculated suspension, particles are able to recover elastically as strain is oscillated until some
critical strain amplitude is reached. Within this critical strain, which is the LVR, strains are
sufficiently small so that the structural integrity of the flocculated network is maintained. Above
the critical strain, beyond the LVR, strains are sufficiently high so that particles are not able to
recover elastically, modulus decreases, and the material behaves as a viscoelastic liquid.
To find the LVR a strain sweep is performed on cement pastes, during which the sample is
subjected to an oscillatory strain of constant frequency and increasing amplitude, which may range
in the order of 5 or 6. For example, for cement paste with water cement ratio at 0.36, strain
amplitudes ranging from 10-5 to 0.1 are applied at a fixed frequency of 1 Hz. The amplitude sweep
results are reported in Fig. 2-12. The strain sweep curves exhibit two main branches: a plateau
region corresponding to the LVR and a decreasing branch indicating that the sample is
experiencing a shear-induced breakage. The strain at which there is an apparent drop of stiffness
marks the end of the LVR and is considered to be the critical strain. The LVR of the plain cement
paste ends at a critical strain of about 7 × 10⁻⁴, which corresponds to the same order of magnitude
as that reported by previous authors [18, 69].
Frequency must also be considered to find the LVR. If the frequency is too high, the structure
cannot recover and the measured LVR will be inaccurate. A frequency sweep experiment is
performed in which frequencies from 0.1 Hz to 20 Hz are applied at a fixed strain of 10-4. The
frequency sweep results are shown in Fig. 2-13. At frequency ranges around 1 Hz, both 𝐺′ and 𝐺"
are in plateau range. 𝐺′ remains higher than 𝐺" throughout the frequency range considered. It gives
support to the application of 1Hz in oscillatory strain sweep, which is also commonly applied in
other studies [69-71].
Low amplitude oscillatory sweep (LAOS) can be applied to measure critical strain [25].
Meanwhile, low amplitude oscillatory time sweep, where a certain small strain and frequency is
applied over a period of time, can be applied to obtain the evolution of storage and loss modulus
[69].

Literature review
27
2.3.2 Creep recovery test
(a)
(b)

Literature review
28
(c)
(d)
(e)

Literature review
29
Fig. 2-14 (a) creep recovery protocol and strain development of various samples: (b) solid;
(c) liquid; (d) viscoelastic solid and (e) viscoelastic liquid.
Creep and recovery method has long been applied to probe the viscoelastic properties of
materials [30, 72]. A shear stress is applied instantaneously to the material, maintained constant
for a period of time, and then suddenly removed to 0, as shown in Fig. 2-14 (a).
For an elastic solid, the strain changes instantaneously when the stress is applied and kept
constant until removal of stress. Upon removal of stress the strain drops to 0 instantaneously, as
shown in Fig. 2-14 (b).
For a viscous fluid, under constant shear stress the strain linearly increases with time from 0,
with no instantaneous strain. Upon removal of stress the strain remains constant, as shown in Fig.
2-14 (c).
For viscoelastic solid, the strain instantaneously jumps from 0 to a certain value then increases
until reaching an equilibrium value. Upon removal of stress, the strain drops instantaneously then
decreases with time, as shown in Fig. 2-14 (d).
For viscoelastic fluid, the strain is composed of an instantaneous strain, an elastic strain
reaching equilibrium eventually and a viscous strain increasing with time. Upon removal of stress,
the strain shows an instantaneous decrease followed by a continuous decrease. However, the strain
does decrease to 0, showing plastic strain due to viscous properties, as shown in Fig. 2-14 (e).
Many researchers have found that under different stress, cementitious materials show different
strain development. Strubble et al. [30] found that under low shear stress, the cement paste shows
creep recovery response similar to viscoelastic solid, with strain reaching equilibrium under creep
and partial recovery of strain under recovery. Under high shear stress, the strain shows similar
properties as viscoelastic fluid. The strain keeps increasing under creep, and exhibits little to no
recovery.
2.3.3 Solid-liquid transition

Literature review
30
Through particle imaging velocimetry, or light scattering techniques, which could capture the
deformation of material during the very first instant of flow in coaxial cylinder rheometer, Coussot
[73] shows the solid-liquid transition of jammed systems (Carbopol gels and forms) under creep.
Coussot [73-75] explained that under high stress creep, the material shows viscoelastic
properties in solid regime, and beyond a critical deformation, the solid-liquid transition happens
and the material flows continuously.
2.3.4 Viscosity bifurcation
Fig. 2-15 Avalanche flow of a clay suspension on an inclined plane [76]
Coussot et. al. [76] used the inclined plane test to study avalanche behavior: under small
incline angle (small stress) below a critical slope the material (an aqueous bentonite clay
suspension) stops rapidly; with slightly higher angle (slightly higher stress) beyond a critical slope
the clay suspension flow continues and accelerates. They also applied various constant stresses on
the material. It was found out that within a critical stress the viscosity increases till infinite; beyond
a stress only slightly higher than critical stress the viscosity decreases and reaches a low value [77].
This agrees well with the incline plane test results. When the applied stress is slightly higher than
the static yield stress the material is sheared and, due to shear rejuvenation, the viscosity decreases
as flow continues. This critical stress is identified as the yield stress.

Literature review
31
This bifurcation phenomena, either in the form of shear rate or viscosity, has been found and
studied in many fluids, including carbopol gel [78], clay suspension [76], polymer gel [79], crude
oil [80], granular materials [81], etc.
2.4 Particle shear migration
2.4.1 Particle shear migration in concretes and consequences
Aggregates tend to move from high shear rate regions to low shear rate regions, which is from
the inner rotor to the wall in coaxial cylinder rheometers. It makes the particle volume fraction
near the inner rotor decrease. Since the viscosity of the suspension is a rapidly increasing function
of volume fraction, the measured shear stress could be significantly smaller.
Wallevik [82] summarized three mechanisms of shear migration: collision effect where
particles are pushed away from high collision rate region to low collision rate region; dilatancy
effect where paste matrix is sucked from small deformation area to large deformation area [83];
and confinement effect at small gap where stronger collision effect happens.
Particle migration is not only governed by the gradient in shear rate but also by some internal
and external properties [13]. Test results by Ovarlez et al. [11] show that the higher the volume
fraction, the more severe the particle shear migration. There is no observable migration when the
concentration is below 20%, while significant shear induced migration from the inner cylinder to
outer cylinder is measured for volume fraction higher than 30%. However, addition of viscosity
modification agents (VMA), such as nanoclay, could stabilize fresh mortar and concrete and
decrease particle shear migration [19]. Good gradient of fine and coarse aggregates can also helps
decrease particle shear migration.
2.4.2 Challenges in measuring particle shear migration

Literature review
32
Conventionally, based on the Newtonian suspensions, shear migration is assumed to be slow,
diffusive behavior. However, it has recent been found and confirmed by MRI tests [84] that the
shear migration is instantaneous as cement paste is a non-Newtonian yield stress fluid. The critical
strain for migration to occur could be more than 500 times faster than expected [12]. This adds
difficulty to measure and prevent shear migration.
Currently there are two methods to study shear migration, as discussed below.
2.4.4.1 Image Analysis Method
Roussel [9] studied stability of fresh concrete by using image software to measure the volume
fraction of polystyrene sphere particles suspended in a cement paste matrix. After the composite
hardens, the sample is carefully cut in halves. Pictures of the cut sections are taken. Through image
analysis, the volume fraction of particles are calculated.
Although the results of this technique give good insight into the stability of fresh concretse,
limitations include that it is relatively labor intensive and that during the hardening process
segregation of aggregates may occur in the fresh mortar or concrete and affect measurements.
2.4.4.2 MRI studies on shear migration
Magnetic Resonance Imaging (MRI) is a nondestructive technique that can provide a
measurement of the local velocity and local bead concentration inside a sample [84]. It is a type of
the Nuclear Magnetic Resonance (NMR) technique and uses magnetic properties of hydrogen
nuclei (protons) to get spatially resolved range of samples. These protons are usually part of the
fluid itself, such as water. MRI-rheometer combines rheological measurements and velocity and
concentration profiles measurements [85]. MRI is used to measure the local velocity and
concentration profile of the material inside the gap of the geometry, while a rheometer coupled
with MRI is used to measure the angular velocity and torque [12].

Literature review
33
MRI-rheometer provides a promising method to measure shear migration directly. However,
it has two limitations for cementitious materials measurement. First, systems containing Fe
paramagnetic oxides can not be used, so typical Portland cement, because they enhance relaxation
kinetic and lead to poor signal. Therefore either emulsion [12, 86], silicone oil [87], bentonite
suspension [88], or white cement [85, 89] must be used as the suspending phase. Secondly, the
concentration profile is measured after the flow becomes steady. It is reported in [11] that a single
velocity measurement may take 1 second, and a concentration profile is obtained in 3 mins. So
kinetic migration processes can not be captured.

Yield stress on fresh mortar systems – a preliminary study
34
Chapter 3
Yield stress on fresh mortar systems – a preliminary study
The dynamic and static yield stress of fresh cement mortar were measured in a rotational
rheometer with a vane geometry using shear rate and shear stress-controlled protocols, respectively.
Through a shear rate-controlled steady-state protocol, the equilibrium flow curve is measured and
fitted with the Bingham model to obtain dynamic yield stress. Through a stress-controlled creep-
recovery protocol, viscosity bifurcation behavior is captured and static yield stress is marked as
the creep stress when the bifurcation occurs. Other protocols that were trialed will also be
discussed.
3.1 Introduction
Yield stress has been extensively studied in non-Newtonian fluids, including colloidal gel,
bentonite, polymer suspension, food, paints, waxy crude oil, pastes, and foams [68, 90-93].
Specifically in cementitious materials, yield stress is important in quantifying flowability [94] and
is correlated to conventional field-friendly measurement methods such as slump test and flow table
test, both experimentally and in simulation [95]. The large application and research on SCC has
aroused great interest and study on yield stress because it is closely related to the formwork
pressure [1-7], the stability of the coarsest particles in SCC [9] and multi-layer casting [8].
A steady-state flow curve can be obtained by plotting measured equilibrium shear stress
against applied shear rate. Since the publication of the Bingham model [26], many models have
been proposed to fit the equilibrium flow curve. The most common models in cementitious

Yield stress on fresh mortar systems – a preliminary study
35
materials are Bingham, 𝜎 = 𝜎𝑦 + 𝜂𝑝𝑙�̇�, where 𝜎 is the shear stress, �̇� is the shear rate, 𝜎𝑦 is the
Bingham yield stress and 𝜂𝑝𝑙 is the plastic viscosity; and Herschel-Bulkley, 𝜎 = 𝜎𝑦 + 𝑘�̇�𝑛 ,
where k and n are constants as material properties. Mortar and SCC are usually regarded as
Bingham materials, showing a linear relationship between shear stress and shear rate [1, 28, 29].
On the other hand, because of shear thinning of cement paste [30] and shear thickening of normal
concrete [31], cement paste and normal concrete are fitted with the Herschel-Bulkley model, in
which n<1 for shear thinning and n>1 for shear thickening. With these models, it can be seen that
the dynamic yield stress can be obtained. The equilibrium flow curve of mortar is usually fitted
with the Bingham model.
In contrast to the dynamic yield stress obtained from the steady-state flow curve, thixotropic
materials also exhibit a static yield stress [54, 96]. The static yield stress is the stress necessary to
initiate flow, corresponding to a well-connected undisturbed microstructure. A common protocol
to characterize static yield stress is to apply an intermediate constant shear rate and to record the
resultant shear stress, as shown in Fig. 3-1. The typical response of cement-based materials is an
initial increase to a peak and subsequent decrease to an equilibrium value over time. The increase
in stress is related to the gradual deformation of the material and the peak stress marks the static
yield stress of the suspension that must be overcome to initiate continuous flow. Another method
is to apply creep-recovery, which was implemented by Struble and Schultz [30]. This is a stress-
controlled test, where the material will not flow until the applied creep stress is higher than its
static yield stress.

Yield stress on fresh mortar systems – a preliminary study
36
Fig. 3-1 Stress development under constant shear rate [96]
It becomes apparent from the previous discussion of thixotropy, which describes structural
breakdown and rebuilding, that it is playing a big role in the discrepancy between dynamic and
static yield stress. Thixotropy itself has been extensively studied in cementitious materials for
different practical applications, such as the clogging of SCC in pipes, shotcrete, and aging of
normal concrete. From a microstructural perspective, thixotropy and yield stress are closely related
[55]. Yield stress originates from the flocculation of colloidal particles that effectively forms a
network. Under constant shear and flow, this network is progressively broken down, which is one
component of thixotropy called shear rejunevation [82, 97-99]. This translates to a decrease in the
apparent viscosity and the stress necessary to maintain the constant strain rate. Upon removal of
shear, particles and agglomerates can recoagulate to rebuild a network, which is the other
component of thixotropy called aging. This translates to an increase in the apparent viscosity and
yield stress over time.
Cementititious materials are composed of a paste phase, considered to be colloidal, and sand
and coarse aggregate, considered to be inert [96]. Most studies have focused on pastes and
concretes, while mortars have not been studied as extensively. Cement pastes are more like
colloidal gels and exhibit flow behavior very similar to yield stress fluids. On the other hand,

Yield stress on fresh mortar systems – a preliminary study
37
mortar and concrete are granular suspensions in colloidal gel and closer to jamming systems. Due
to the relatively large size of coarse aggregates in concrete, its precise flow behavior, especially
local, is not easy to capture. Like concretes, mortars exhibit both viscous and granular behavior
but can be probed with high precision rotational rheometers. Thereby we select mortar systems for
the present preliminary investigation to explore various protocols in characterizing dynamic and
static yield stress.
3.2 Material and procedures
3.2.1 Materials
Type I Portland cement is used. According to ASTM C150-12, its compressive strength at 28
days is 44.8 MPa, the Blaine fineness is 420 m2/kg and the chemical constituents are summarized
in Table 3-1. The sand used in this study is silica-quartz. It is oven-dried for 24 hours and sieved
between sieve #16 and #30, yielding diameters between 0.6 and 1.18 mm. Mixes are prepared with
city tap water.
To mitigate segregation, highly purified attapulgite clay is added to all mixes. They are
commercially available clays that are chemically exfoliated from bulk attapulgite to remove all
impurities. When dispersed, they are needle-like with an average length of 1.75 µm and diameter
of 3 nm. No chemical admixtures were used.
Table 3-1 Cement chemical constituents
Constituents % by mass
SiO2 19.22
Al2O3 4.98
Fe2O3 3.42

Yield stress on fresh mortar systems – a preliminary study
38
CaO 62.42
MgO 3.87
SO3 2.72
3.2.2 Mix proportion
Mixes have a water-to-cement ratio (W/C) of 0.5 by mass. The water absorption of the sand
is considered when proportioning to achieve the desired W/C. And the sand-to-cement ratio (S/C)
is set to 2:1 by mass, yielding a sand volume fraction of approximately 48%. Nanoclay is added at
0.5% by mass of cement, which is found to be sufficient in achieving stable mixes. The fresh mixes
exhibit no visible signs of bleeding over 20 min, nor sand sedimentation at applied angular
velocities up to 50 rad/s, the highest in this study. In this chapter, only one mix proportion is used.
3.2.3 Mortar preparation
Steps are taken to ensure that the cement paste phase is mixed at the same state for various s/c
ratios. First, only the fresh cement paste phase is prepared in a medium upright planetary mixer.
Then, to ensure that the sand is mixed evenly in the cement paste, sand is poured into the cement
paste and hand-mixed randomly at high intensity. The details of the mixing protocol are given here.
Nanoclay powder is combined with the mixing water and blended in a Waring blender for 2
minutes to produce a suspension, which remains stable for at least 6 hours. The clay suspension
and remaining mix water to reach the target w/c ratio is poured into the mixing bowl. Cement
powder is slowly poured into the solution and mixed at a speed of 136 rmp for 1 min, then at a
higher speed of 281 rpm for an additional 4 mins. We occasionally scrape the bowl to ensure the
cement paste is mixed evenly. Then, sand is slowly poured into the cement paste and hand-mixed
in a random manner for 4 mins. Finally the mortar is poured into the construction cell of the
rheometer for testing.

Yield stress on fresh mortar systems – a preliminary study
39
3.2.4 Rheometer and construction cell
The rheometer in this study is a HAAKE MARS III rheometer. The construction cell is a 74
mm diameter and 150 mm height cylinder, with 24 profiles of 2 mm evenly distributed at the wall
to prevent wall slip. The rotor has a diameter of 26 mm and height of 50 mm. The coaxial gap
between rotor and construction cell is 11 mm, which is much bigger than the size of sand. For all
the tests in this study, the rotor is placed at the height when the gap between the bottom of the rotor
and bottom of the construction cell is 20 mm.

Yield stress on fresh mortar systems – a preliminary study
40
(a)
Fig. 3-2 (a) HAAKE MARS III rheometer with construction cell and (b) dimensions of
construction cell
3.2.5 Protocol
As cementitious materials are thixotropic, the flow behavior is greatly dependent on the
flocculation state. It must be consistent before each test to guarantee repeatability. Since the
completely de-flocculated state is theoretically impossible to reach, Roussel [8] recommended
using the “most de-flocculated state” as the reference state in studying thixotropic materials. He

Yield stress on fresh mortar systems – a preliminary study
41
also stated that the most de-flocculated state is achieved right after mixing, since rheometers do
not reach the high mixing speed mixers do. Since this state can only be reached immediately after
mixing, we have adopted an alternative reference state based on the work of [96], which is to
introduce random mixing by hand after the mortar sample is loaded in the rheometer. The
advantage of random hand mixing over applying a preshear with the rotor is that it reduces sand
migration from high strain rate regions to low strain rate regions. Therefore in this study, the mortar
is strongly tampered by hand mixing in a random manner to bring the material to a destructed,
homogeneous state.
Another point that should be considered is cement hydration. Compared to thixotropy, the
characteristic time of hydration can be expected to be much longer. We conducted each test within
1 hour of initial water and cement contact. Test results of constant shear rate shows that the
difference in equilibrium torque is less than 3% within this time period. Therefore it is assumed
that the effect of hydration is negligible and random strong hand mixing could bring the mortar
into a replicate thixotropic state. Other studies [46, 100] also show that before initial setting
(around 1.5 hours after water addition), the effect of hydration is marginal and the yield stress
increases very slowly with resting time.
Immediately after mixing, the fresh mortar is poured into the construction cell. Before each
test, the mortar is hand tampered for 1 minute using a normal kitchen mixer. Then the rotor is
quickly put in position and lowered to the designated position. Then the shearing protocols are
started. Most of the constant shear rate test takes place in 1 minute, while at slow angular velocity,
the shearing period could be longer as much as 2 minutes, depending on when the resultant shear
torque become equilibrium. Ramp up and down test usually take 2 mins. Most of the creep test
finishes within 30 seconds, while at small torque, the creep behavior could continue up to 10
minutes to reach the equilibrium angular deformation.
In this chapter, since exact effective shear rate and shear stress is not easy to calculate, as will
be discussed later, angular velocity of rotor (rad/s) and shear torque (mNm) are used.

Yield stress on fresh mortar systems – a preliminary study
42
3.3 Test methods of shear rate control and results
3.3.1 Equilibrium flow curve: using constant angular velocity protocol
A conventional method to obtain a flow curve is to apply strain rate step-wise, where each
step is sufficiently long enough for the material to reach steady state. That steady-state shear stress
is plotted again the corresponding applied strain rate and the flow curve is obtained. From there, a
steady-state flow model is applied to obtain yield stress. For the mortar samples in this study, we
apply constant angular velocity at various magnitudes with 1 min hand mixing in between, as
explained in Section 3.2.5. The protocol and results are shown in Fig. 3-3. For each run, the torque
development with time is as follows: the torque increases from 0 to a peak value and then decreases
to an equilibrium value over time. The increase in torque is before the structure is broken down
and the latter phenomenon is shear rejuvenation, where the structure is sheared and broken down
until reaching steady-state. From 7 rad/s to 50 rad/s, the equilibrium torque increases with
increasing angular velocity.
(a)

Yield stress on fresh mortar systems – a preliminary study
43
(b)
Fig. 3-3 (a) constant angular velocity protocol and (b) torque development between 7 rad/s
and 50 rad/s.
The resultant equilibrium flow curve can be obtained from plotting the equilibrium torque and
corresponding applied angular velocity, and is presented in Fig. 3-4. It is depicted that from 7 rad/s
to 50 rad/s the torque to angular velocity relationship can be fitted with the Bingham model:
𝑇 = 0.5033 ∙ Ω + 41.72 Eq. 3.1
Where 𝑇 is torque, Ω is angular velocity.
According to the fitting, with a R2 of 0.9741, 41.72 mNm is the dynamic yield stress.

Yield stress on fresh mortar systems – a preliminary study
44
Fig. 3-4 The equilibrium flow curve of mortar
3.3.2 Flow behaviour under intermediate shear rate
Fig. 3-5 shows the torque development of mortar under constant angular velocity between 1
to 7 rad/s. It is seen that the torque decreases with increasing applied angular velocity within this
range. Combining the flow curve presented in section 3.3.1, the equilibrium flow curve of mortar
is shown in Fig. 3-6. Different from most literature, we observe a negative slope in the equilibrium
flow curve . Moller et al. [101] found this negative slope in soft glassy materials, such as forms,
emulsions, and colloidal gels. To the knowledge of the author, a discussion or experimental results
on a negative slope in the equilibrium flow curve of cement-based systems has not been published.
Further, Moller et al. [101] did not discuss the mechanisms underlying why shear stress is smaller
at higher applied strain rates.

Yield stress on fresh mortar systems – a preliminary study
45
Fig. 3-5 Torque development at constant angular velocity between 1 rad/s and 7 rad/s.
Fig. 3-6 The complete equilibrium flow curve of mortar.
The author reasons that there are two possible mechanisms contributing to the negative slope
in the equilibrium flow curve. In section 3.3.3, we will discuss one of the mechanisms, shear

Yield stress on fresh mortar systems – a preliminary study
46
localization. The other mechanism is shear-induced sand migration, which will be discussed in
Chapter 6.
3.3.3 Shear localization
It has been discussed and verified that for yield stress fluids (e.g. clay suspension and carbopol
gel), shear localization occurs [85, 87, 101]. When the applied shear rate is below a critical value,
only part of the material in the vicinity of the surface of the rotor is sheared while the rest remains
unsheared. There is a critical radius, 𝑟𝑐, distinguishing these two regions.
Fig. 3-7 Tangential velocity diagram under steady state constant apparent shear rate [85]
Through magnetic resonance imaging (MRI), Jarmy, Roussel et. al. [85] verified these
phenomena in cement paste. They measured the tangential speed of cement paste in a rheometer
with a couette geometry, as shown in Fig. 3-7. In steady state, the tangential speed of cement paste
linearly decreases from the surface of the inner rotor and reaches zero at 𝑟𝑐. Since the differential
of tangential speed over the radius is linear, the effective shear rate is uniform throughout the entire
sheared region. Furthermore, at various angular velocities, the tangential speed profiles exhibit the

Yield stress on fresh mortar systems – a preliminary study
47
same slope, which means that the effective shear rate remains unchanged. The difference is that
with increasing angular velocity of the rotor, 𝑟𝑐 increases, corresponding to larger sheared region.
It is reasoned that for the mortar in this study, 7 rad/s is the critical angular velocity. Below
the critical angular velocity, shear localization occurs: only part of the material in the vicinity of
the rotor is sheared and the rest remains unsheared. As discussed previously, the increase in the
apparent global shear rate does not increase the effective shear rate of the sheared region – it only
increases the critical radius.
Two mechanisms could be contributing to the lower torque measured at higher angular
velocity: particle shear migration and thixotropy. Firstly, under shear, sand particles in the paste
matrix migrate from regions of high shear rate to low shear rate. In this study, this translates to
sand particles migrating from the sheared region to the unsheared region, i.e. from the rotor to the
wall. With increasing angular velocity, increasingly more material is sheared and, subsequently,
more sand migrates to the unsheared region, effectively lowering the density and viscosity of the
sheared region. Secondly, due to shear rejuvenation, the microstructure becomes increasingly less
jammed and less flocculated under continuous flow. Under higher angular velocity within this
range, 1 to 7 rad/s, more of the region is sheared. So the viscosity of the sheared region becomes
smaller. Considering that the effective shear rate at various applied angular velocities are the same,
the decrease in viscosity of the sheared region leads to a decrease in torque.
3.3.4 Stick slip: flow behavior under low shear rate
At low applied angular velocity, 0.1 rad/s, the torque does not develop continuously with
shearing time, as shown in Fig. 3-8 (a). The torque increases linearly with time and then suddenly
drops incrementally. Concurrently, the rotational velocity of the rotor also jumps from near 0 to a
finite value and then back to 0 again. These observations indicate that stick slip is occurring.

Yield stress on fresh mortar systems – a preliminary study
48
(a)
(b)
Fig. 3-8 Under applied angular velocity at 0.1 rad/s, (a) angular velocity and torque
development; (b) angular velocity and angular deformation.
Additionally, it could be seen from Fig. 3-8 (b) that the angular deformation of the rotor does
not increase linearly with time. The angular deformation is step-wise, where it increases

Yield stress on fresh mortar systems – a preliminary study
49
incrementally, due to stick slip, then remains nearly constant. If deformation due to stick slip is
disregarded, the angular deformation throughout the shearing period is very low. The slight
increase in angular deformation before the first stick slip occurs is due to the viscoelastic
deformation of the material. The critical angular deformation before the first stick slip occurs can
be considered as the critical fracturing angular deformation, beyond which the microstructure
is broken and fracture occurs. It is averaged at 0.697 rad in this study, and will be tied to static
yield stress as measured by creep recovery protocol in section 3.4.2.
The material is solid-like and fractured in the local “weak” regions where the critical stress is
exceeded. During fracture, the alignment of material, especially granular particles in mortar, is
adjusted. So the sudden jump of angular velocity and torque is recorded. With further shearing,
stick slip occurs repeatedly because there are many local “weak” regions fracturing one after one.
So compared with the material before shearing, there are many fracture bands forming in the
material. This stick slip behavior could be related to the phenomenon theoretically described as
shear banding by Coussot et al. [78].
3.3.5 Theoretical discussion of material response under constant shear rate
To sum up, the stages of deformation and corresponding viscoelastic regimes (solid versus
flow) will be discussed, which is illustrated in Fig. 3-9. When subjected to shear, the material
initially deforms as a viscoelastic jamming solid, exhibiting only a finite shear deformation. Then,
beyond a critical deformation, shear behavior will differ depending on the magnitude of applied
angular velocity. At very low applied angular velocities, shear banding and stick slip occur. At
intermediate velocities, shear localization occurs, where part of the material near the rotor is
sheared at a critical effective shear rate while the rest remains non-sheared. Within this range, the
critical radius increases with increasing angular velocity, corresponding to a decrease in torque
(i.e. negative slope). It is to be noted that the sheared region is sheared at the critical effective shear
rate, which is independent of applied angular velocity and depends on material properties,
including thixotropic state. Finally, at sufficiently high velocities, once the critical radius reaches

Yield stress on fresh mortar systems – a preliminary study
50
the outer radius of the construction cell, the entire material is sheared. And the higher the applied
angular velocity, the higher the effective shear rate and torque. In other words, in this shear rate
regime, shear stress becomes a function of shear rate fitted with a Bingham model.
Fig. 3-9 Flow behavior under constant angular velocity [78].
3.3.6 Other shear rate-controlled protcols to measure dynamic yield stress
3.3.6.1 Step down protocols
A second method to obtain the equilibrium flow curve is the step down protocol, where the
sequence of applied shear rates is decreasing from high values to low values. The particular
protocol that was applied to the mortar systems in the present study, and corresponding response,
is shown in Fig. 3-10. The equilibrium shear stresses and applied shear rates of each step were
collected to plot the flow curve, as shown in Fig. 3-11.

Yield stress on fresh mortar systems – a preliminary study
51
In section 3.3.1, prior to the application of each constant shear rate, the sample was subjected
to the same preshear, via hand mixing, to guarantee the same structural state right before each step.
However, for the step down protocol, each step experienced a different shear history. It is seen in
Fig. 3-11 that at shear rates higher than 30 rad/s the shear stresses obtained by the step down
protocol are higher than those obtained in section 3.3.1, while at shear rates lower than 30 rad/s
the shear stress is lower. The latter can be attributed to the shear history experienced by the sample
over the step down protocol, which leads to increased deflocculation of the paste phase and shear-
induced sand migration, which will be discussed in depth in Chapter 6. By fitting the curve with
the Bingham model, it can be seen that the dynamic yield stress obtained by step down protocol is
much lower at 27.9 mNm, by fitting into Bingham model.
Fig. 3-10 Step down protocol and torque development results

Yield stress on fresh mortar systems – a preliminary study
52
Fig. 3-11 Step down results, compared with equilibrium flow curve in section 3.3.1
3.3.6.2 Linear ramp up-down protocol
A third method to obtain flow curve is to apply a linearly increasing shear rate followed by a
linearly decreasing shear rate (ramp up and ramp down protocol) and continuously record the shear
stress [102]. The flow curve may be fitted with a model to obtain dynamic yield stress [103]. The
ramp up and down protocol applied on mortar sample in this study is shown in Fig. 3-12 (a). The
results are presented in Fig. 3-12 (b) and compared with the equilibrium flow curve obtained in
section 3.3.1.
In this study, as could be seen in Fig. 3-12 (b), the ramp up curve is always higher than the
ramp down curve. Roussel [8] pointed out that during the ramp up, de-flocculation occurs but not
quickly enough to reach the steady state shear stress. The measured stress is thus always higher
than what would be obtained if steady state was reached. On the other hand, during the decreasing
shear rate ramp flocculation occurs but, again, not quickly enough for steady state to be reached
and, thus, the measured stress remains lower than steady state.

Yield stress on fresh mortar systems – a preliminary study
53
The ramp down curve is similar to the curve obtained from the step down protocol, Fig. 3-11.
At higher shear rates than 30 rad/s, the shear stress is higher than equilibrium flow curve in section
3.3.1, while at lower shear rate than 30 rad/s the shear stress is lower. The yield stress obtained by
fitting the ramp down curve with the Bingham model is 30.8 mNm, which is lower than 41.72
mNm in section 3.3.1. Similar to the step down protocol this can be attributed to the shear history,
which led to increased deflocculation of the paste phase and shear-induced sand migration. In
addition this ramp up and down protocol is sensitive to the ramping rate [51] [104].
(a)

Yield stress on fresh mortar systems – a preliminary study
54
(b)
Fig. 3-12 (a) ramp up and down protocol and (b) results, compared with equilibrium flow
curve in section 3.3.1
Each of these shear rate-controlled protocols generate different equilibrium flow curves and,
subsequently, different dynamic yield stresses. This can primarily be attributed to the change in
shear history, which is expected. Due to the thixotropic and hydrating nature of the material, the
flocculation state will differ and thereby so will the measured rheological properties. In addition,
as these tests were performed on fresh mortar systems, shear-induced sand migration is a
significant factor. It can be expected that migration is occurring in all the tested systems discussed
in this section. Therefore it is necessary to obtain a better understanding of the migration behavior
and how it is affected by the material constituents, i.e. sand volume fraction and paste viscosity,
and applied shear rate. This will be investigated and discussed in depth in Chapter 6.
3.4 Test methods of shear stress control and results

Yield stress on fresh mortar systems – a preliminary study
55
3.4.1 Static yield stress: using creep recovery protocol
To probe the viscoelastic properties, fresh cement-based mortars are tested using a creep-
recovery protocol. Constant shear stress is applied and held for a period of time, then completely
removed. The resulting strain and shear rate evolution are recorded. Fig. 3-13 and Fig. 3-14 show
the angular deformation measured at various applied torques. Within a certain range of applied
torques, angular deformation eventually ceases during the creep step and the material exhibits
some degree of recovery, as shown in Fig. 3-13. On the other hand, beyond a critical applied torque,
the material undergoes continuous deformation during creep and exhibits no recovery, as shown
in Fig. 3-14.
(a)

Yield stress on fresh mortar systems – a preliminary study
56
(b)
Fig. 3-13 Creep recovery behavior of mortar under torque at (a) 50 mNm; (b) 67.3 mNm
(a)

Yield stress on fresh mortar systems – a preliminary study
57
(b)
Fig. 3-14 a) Creep recovery behavior of mortar under torque at 67.5 mNm and b) creep
behavior at the beginning under torque at 67.5 mNm.
First, the creep portion of the protocol will be discussed. Comparing Fig. 3-13 (a) and (b), it
is apparent that the angular deformation reaches equilibrium at higher values when under higher
creep torque. Fig. 3-15 presents the equilibrium angular deformation measured during the creep
step at different applied torques, capturing the linear and nonlinear regimes of creep deformation.
When torque is low (below 50 mNm, in this study), the creep behavior is linear. As can be seen in
the inset of Fig. 3-15 (a), angular deformation is proportional to torque, which means the creep
compliance (the ratio of strain over the stress, here angular deformation over torque) is constant.
With increasing torque, the angular deformation increases dramatically and reaches equilibrium
more rapidly, thus the creep behavior becomes highly nonlinear, indicating yielding deformation.
It is noted that the angular deformation becomes constant in 350 seconds and 3 seconds at 50 mNm
and 67.3 mNm, respectively. It takes longer time to reach equilibrium at lower creep stress.
At a slightly higher applied torque of 67.5 mNm, the angular deformation becomes substantial.
As shown in Fig. 3-14, it reaches 1460 rad within 30 seconds. The seemingly linearly increase of
angular deformation shows that the material is flowing.

Yield stress on fresh mortar systems – a preliminary study
58
It is summarized that there are two critical torques during creep. One is the critical linear-
deformation torque, below which the creep compliance is constant and independent of the
applied torque – 50 mNm in this study. The other is the critical shearing torque, beyond which
the material shears at a constant angular velocity – 67.5 mNm.
In Fig. 3-14 (b), it could be seen that the angular deformation increases slowly at the beginning
and then accelerates to eventually increase linearly with time. In contrast, the increase in angular
deformation in Fig. 3-13 increases more rapidly at the beginning and then slows until it reaches a
plateau. This is analogous to a study by Coussot et. al. [76], where they used the inclined plane
test to capture avalanche behavior in yield stress fluids. There exists a critical slope, which
corresponds to a critical stress applied on fluid, below which the fluid does not flow much,
However, once the critical slope is exceeded even slightly, the fluid starts to flow longer and faster.
It is believed to be related to thixotropy. The material is jammed initially at rest and the structure
tends to rebuild due to Brownian movement, thermal agitation, etc, which is aging.. Under shear,
the structure is broken and the fluid tends to flow, which is shear rejuvenation, When the torque is
not sufficiently high, aging is dominant over shear rejuvenation and so the structure can rebuild
itself and resist the shear force, thus the flow stops eventually. On the other hand, with slightly
bigger torque shear rejuvenation is dominant over aging, the structure is broken progressively and
so the flow continues and accelerates. This is avalanche behavior, which could be seen in Fig. 3-14
(b) and will be discussed further in terms of angular velocity (strain rate) development in section
3.4.2.

Yield stress on fresh mortar systems – a preliminary study
59
(a)
(b)
Fig. 3-15 (a) angular deformation v.s. torque and (b) recovery percentage v.s. torque

Yield stress on fresh mortar systems – a preliminary study
60
As to recovery protocol, when the torque is released to 0, the angular deformation will
decrease, indicating recovery of structure. Due to the viscoelastic and thixotropic properties of the
material, the angular deformation or strain does not recover fully to 100%. Here the recovery
percentage is quantified as
𝑅𝑃 =
𝛿𝑐𝑟𝑒𝑒𝑝 − 𝛿𝑟𝑒𝑐𝑜𝑣𝑒𝑟𝑦
𝛿𝑐𝑟𝑒𝑒𝑝∗ 100
Eq. 3.2
Here, 𝛿𝑐𝑟𝑒𝑒𝑝 and 𝛿𝑟𝑒𝑐𝑜𝑣𝑒𝑟𝑦 are the equilibrium angular deformation at the end of creep
protocol and recovery protocol.
It could be seen in Fig. 3-15 (b) that within the critical linear-deformation torque, 50 mNm
in this study, the recovery percentage does not change much with increasing torque. Beyond that,
the recovery percentage decreases with increasing torque, indicating higher degree of structural
breakdown of the material during creep, until reaching 0 at the critical shearing torque, which is
67.5 mNm in this study. Beyond the critical shearing torque, the recovery rate is 0%, indicating
continuous flow of the material and no recovery after torque release.
3.4.2 Angular velocity bifurcation

Yield stress on fresh mortar systems – a preliminary study
61
(a)
(b)
Fig. 3-16 (a) angular velocity of mortar under creep at various torque values and (b) the
relationship between angular velocity at plateau and torque.
Fig. 3-16 (a) shows the development of angular velocities during creep. It is apparent that
bifurcation occurs, similar to the phenomena described as viscosity bifurcation, or “avalanche
behavior,” by Coussot et. al. [76]. At torques lower than 67.3 mNm, the angular velocity vanishes
to zero. In contrast, at a slightly higher torque, for instance 67.5 mNm, the angular velocity
increases to a constant elevated value. Angular velocity bifurcation occurs at the critical shearing
torque.
It is noted that under an applied torque of 67.5 mNm the angular velocity reaches an
equilibrium value averaged at 50.9 rad/s. Recalling the flow curve fitted with the Bingham model
(Fig. 3-4 in section 3.3.1) at 67.5 mNm the angular velocity is 51.2 rad/s, confirming this regime
is under steady-state flow and independent of shear rate or stress control.
Shortly after torque is applied, within around 0.3 second for mortar in this study, there is a
plateau. The higher the torque, the higher the angular velocity at the plateau, as shown in Fig. 3-16

Yield stress on fresh mortar systems – a preliminary study
62
(b). From the inset of Fig. 3-16 (b), it is also seen that for torques within the critical linear-
deformation torque, 50 mNm in this study, the angular velocity at plateau is linear with torque
while it becomes nonlinear at higher torques.
Beyond 0.3 second, an abrupt transition occurs: the material either jams or continues to flow
and liquefies. The angular velocity decreases continuously with time, by 3 orders of magnitude
within 1 second at torques smaller than 67.3 mNm, indicating that the system jams. With slightly
higher torque, higher than the critical shearing torque, the angular velocity increases to a constant,
elevated value, indicating that the system flows.
Here, the transitional angular deformation is recorded from Fig. 3-16 (a), considered to be
when angular velocity becomes 20% higher or lower than the initial plateau value at each creep
torque. The transitional angular deformations increase with increasing torque, as shown in Fig.
3-17. They remain within 0.6 rad at torques up to 67.3 mNm while they are 2.4, 2.65 and 3.58 rad
at torques 67.5, 69 and 70 mNm, respectively. Recalling that the critical fracturing angular
deformation is 0.697 rad, Fig. 3-17 depicts the comparison of the angular deformation under
various torques to the critical fracturing angular deformation measured in Fig. 3-8 in section
3.3.4.
Fig. 3-17 angular deformation of mortar at 0.3 second under constant torque

Yield stress on fresh mortar systems – a preliminary study
63
Baudez and Coussot [73] also found an abrupt transition occurs for hair gel and foam. Using
particle imaging velocimetry, or light scattering techniques, they showed that before the transition
time, 0.1 second in their tests, the material exhibited a linear rotational angle (rad) over its entire
radius. This provides support that before the transition the whole material is homogeneously
deformed. After the transition time, the materials in the region near the inner rotor is flowing,
indicating solid-liquid transition.
The author believes that before transition time, the angular velocity at the plateau is the
instantaneous response of the viscoelastic fluid. With higher torques, the instantaneous angular
velocity is higher. At this point, the transition has not occurred yet so the material is
homogeneously sheared and deformed. The difference in angular velocity at plateau witihin and
beyond the critical shearing torque is not significant, as shown in Fig. 3-16 (a). After transition,
bifurcation is determined by whether the instantaneous angular deformation at the time when the
abrupt transition occurs exceeds the critical fracturing angular deformation. As illustrated in
Fig. 3-18, the instantaneous deformation increases with increasing torque. For torques within the
critical shearing torque, the instantaneous deformation is smaller than the critical fracturing
angular deformation. The structure is not broken so the angular velocity approaches zero and
flow ceases. In contrast, for torques beyond the critical shearing torque, the instantaneous
deformation is higher than the critical fracturing angular deformation. Thus, the structure is
broken and solid-liquid transition occurs, transitioning from a viscoelastic solid-like material to
liquid-like. The flow continues and the angular velocity increases due to shear rejuvenation,
ultimately to steady-state flow.

Yield stress on fresh mortar systems – a preliminary study
64
Fig. 3-18 Compared to critical angular deformation, instantaneous deformation before
bifurcation, under low, intermediate or high torque, leads to different flow behavior.
As discussed, only when the applied stress or torque is higher than the critical shearing
torque can the instantaneous deformation become higher than the critical fracturing angular
deformation, thus leading to a solid-liquid transition. So only torques higher than the critical
shearing torque can initiate flow of a material from the solid state. Therefore it follows that the
critical shearing torque can be regarded as static yield stress, relating to the structure of the
material before it is broken down.
3.4.3 Thixotropy: connecting dynamic and static yield stress
For thixotropic systems like cement-based materials, creep behavior will depend on the initial
flocculation state. In section 3.3.1, we obtained dynamic yield stress by fitting the measured
equilibrium flow curve with the Bingham model – 41.72 mNm. Meanwhile, in section 3.4.1 and
3.4.2, we measured static yield stress through the creep recovery protocol – 67.5 mNm. The reason

Yield stress on fresh mortar systems – a preliminary study
65
why static yield stress is higher than dynamic yield stress is because static yield stress corresponds
to an undisturbed, well-connected microstructure, while dynamic yield stress corresponds to a
broken down microstructure. Thixotropy is assumed to play a big role in the discrepancy between
static and dynamic yield stress.
To investigate this assumption, we bring the material to an equilibrium steady state at high
and low angular velocities, 30 and 1 rad/s, respectively, and then apply creep under torques above
and below the static or dynamic yield stress, as shown in Fig. 3-19 (a).
(a)

Yield stress on fresh mortar systems – a preliminary study
66
(b)
(c)
Fig. 3-19 (a) thixotropy twist protocol; (b) creep after sheared at 30 rad/s for 60 seconds and
(c) creep after sheared at 1 rad/s for 60 seconds.
Fig. 3-19 (b) shows the results of creep when the material is initially brought to equilibrium
at 30 rad/s, which is higher than the critical angular velocity (7 rad/s in this study) in equilibrium
flow curve, as shown in Fig. 3-6 in section 3.3.2. The applied creep torques are higher and lower

Yield stress on fresh mortar systems – a preliminary study
67
than the dynamic yield stress. Recalling the dynamic yield stress was found to be 41.7 mNm based
on the Bingham model, applied torques were 50 and 40 mNm, respectively. When creep is applied
at 50 mNm, the mortar continues shearing and stabilizes at 27.3 rad/s. In contrast, at 40 mNm the
angular velocity decreases to zero within 10 seconds.
In contrast, the creep behavior of mortar when it is brought to equilibrium under lower angular
velocity than the critical value in equilibrium flow curve is shown in Fig. 3-19 (c). The applied
torques for creep are above and below the static yield stress, so 67.5 and 50, respectively. When
creep is applied at 67.5 mNm, the mortar continues to flow and the angular velocity increases to
50 rad/s. However, at 50 mNm the angular velocity decreases to zero, indicating he material stops
flowing. It should be noted that although 50 mNm is below the static yield stress, it is still above
the dynamic yield stress. In this case, 50 mNm is not strong enough to break the microstructure of
the material.
Fig. 3-20 Equilibrium flow curve twist: importance of thixotrpy and initial flocculation state
The equilibrium flow curve is a plot of equilibrium torques at different applied angular
velocities, thus each point represents a particular flocculation state of the material. Based on the

Yield stress on fresh mortar systems – a preliminary study
68
results of Fig. 3-19 (a) and (b), the creep behavior can be depicted in reference to the equilibrium
flow curve and is presented in Fig. 3-20. The solid lines represent the loading paths of the material
initially subjected to a high angular velocity, above the critical angular velocity in the equilibrium
flow curve. From the equilibrium torque, the material continues to flow if creep is performed at a
torque higher than the dynamic yield stress but ceases if it is below. On the other hand, at lower
angular velocity within the critical shear rate, the material flows if creep is performed at a torque
higher than the static yield stress but ceases if it is below, even if it is higher than the dynamic
yield stress. This is represented by the dotted lines. The apparent dependence of creep behavior on
the origin point on the flow curve underscores the importance of considering thixotropy and the
flocculation state in characterizing viscoelastic properties.
3.4.4 Other protocols to measure static yield stress
3.4.4.1 Creep recovery steps
(a)

Yield stress on fresh mortar systems – a preliminary study
69
(b)
Fig. 3-21 Creep recovery steps: (a) angular deformation and (b) adjusted angular
deformation
Before single creep recovery protocol was applied to mortar samples, we applied creep
recovery to the samples in steps. The applied creep stress increases step-wise, for instance, from
60 to 80 mNm, as shown in Fig. 3-21 (a).
Firstly, 30 seconds under creep is not enough for angular deformation to reach plateau values.
As shown in Fig. 3-13 of section 3.4.1, the angular deformation reaches plateau values in 350
seconds and 3 seconds at 50 mNm and 67.3 mNm, respectively. Here, at 60 mNm, 30 seconds is
not enough for angular deformation to reach plateau value. The problem of using longer creep time
is that it also induces stronger thixotropic effects on each step following the first step.
Secondly, with increasing creep stresses, the angular deformation at the end of each creep
decreases, instead of increasing. We also found out that for each step, the angular deformation
increases from 0. Considering that the angular deformation of the material should be continuous,
we adjusted the angular deformation of following steps to make it continuous, as shown in Fig.
3-21 (b). We see that the angular deformation increases slightly from 60 to 70 mNm but decreases
from 70 to 80 mNm. Also, as discussed earlier in section 3.4.1, the static yield stress is 67.5 mNm.
However, in this creep recovery step protocol, up until 80 mNm the sample is still not flowing. It

Yield stress on fresh mortar systems – a preliminary study
70
may be attributed to thixotropy and hydration, where during proceeding steps the materials has
been resting and builds up sufficient structure to resist the applied 80 mNm torque.
Due to the aforementioned reasons, the single creep recovery protocol is implemented for this
dissertation work, as described in section 3.4.1. In addition, to make sure the material experiences
the same structural state right before each creep recovery protocol, we strongly mix the sample
randomly for 1 minute to bring the structure back to a most de-flocculated state.
3.4.4.2 Linearly increasing shear stress protocol
(a)

Yield stress on fresh mortar systems – a preliminary study
71
(b)
Fig. 3-22 (a) linearly increasing stress protocol; (b) angular deformation v.s. torque results
A third method is the linearly increasing stress protocol, where linearly increasing stress is
applied and the strain is recorded. Once the structure is broken and solid-liquid transition occurs,
the strain dramatically increases. Thus the corresponding applied stress is the static yield stress.
The protocol is shown in Fig. 3-22 (a). Three increasing rates of stress are applied. From 0 to 200
mNm, it takes 10, 30 and 60 seconds, respectively. The results in Fig. 3-22 (b) show that the static
yield stress values measured are 85, 110 and 140 mNm, respectively.
Firstly, they are all bigger than the static yield stress measured by creep recovery protocol in
section 3.4.1, which is 67.5 mNm. Secondly, the yield stress measured by the linearly increasing
stress protocol is highly dependent on the increasing rate. The lower the loading rate is, the higher
the measured yield stress. This is believed to be attributed to thixtropy and hydration. The smaller
the increasing rate is, the more time the material has to rebuild its structure. This may also be the
reason why all the test results are higher than that measured by creep recovery protocol. Compared
with the creep recovery protocol, where the stress increases instantaneously from 0 to a certain
value, the linearly increasing stress protocol is always slower, thus the measured static yield stress
is higher.

Yield stress on fresh mortar systems – a preliminary study
72
3.4.4.3 Small constant shear rate protocol
A fourth method is applying small constant small shear rate. The corresponding shear stress
increases to a peak value, then decays to an equilibrium value. The peak value is regarded as the
static yield stress [96, 105]. One problem of using this protocol to obtain static yield stress is that
it is shear rate dependent, similar to the increasing shear stress protocol. In this study, as could be
seen in Fig. 3-5 of section 3.3.2, at small angular velocities between 1 and 7 rad/s the peak torque
value is different. Studying thixotropy, Khayat et al. [1, 28, 29] applied intermediate constant shear
rate on fresh mortar and SCC. They measured the peak stress value τi, and equilibrium stress value
τe. Their test results also showed that the peak value is shear rate dependent.
3.5 Conclusions:
Dynamic yield stress and static yield stress of mortar are measured through constant angular
velocity and creep recovery test, respectively. The negative slope of equilibrium flow curve of
cementitious material is tested for the first time. Further reasoning on the shear localization
behavior is reasoned and used to explain the negative slope. Also, shear banding and stick slip is
tested for the first time. It is assumed that the flow behavior under constant angular velocity varies
depending on angular velocity: at low angular velocities, shear banding and stick slip occur; at
medium angular velocities, shear localization occurs and the equilibrium torque decreases with
angular velocity; at high angular velocities, the entire material is sheared and the equilibrium
torque increases with angular velocity. Dynamic yield stress is obtained through fitting the flow
curve with the Bingham model. However, it is apparent that shear-induced sand migration is a
critical issue and motivated the investigation presented in Chapter 6.
Bifurcation behavior is recorded under creep recovery test. Under small torque, the angular
deformation becomes equilibrium after enough creep time, showing the flow stops eventually. The
equilibrium angular deformation increases with increasing creep torque. Until a point when only

Yield stress on fresh mortar systems – a preliminary study
73
slightly increase of torque make the angular velocity increases dramatically and no equilibrium
value could be reached, showing the flow continues. The slightly difference in torque is the range
where bifurcation happens. The analysis of angular velocity shows that for each creep behavior, at
the beginning of creep, the angular velocity show a plateau, which is reasoned to be the
instantaneous response of the whole material under creep torque. Then the transition happens: the
angular velocity either decreases to 0, or increases to a constant high value, depending on the
torque value. This critical shearing torque when bifurcation occurs is regarded as static yield
stress. The findings of the creep recovery test on mortar motivated a detailed investigation on
pastes modified with attapulgite clays to capture their effect on static yield stress and is presented
in Chapter 4. These findings on static yield stress are supplemented with measure of cohesion for
cement paste systems modified with fly ash and attapulgite clay and the investigation is presented
in Chapter 5.
The critical fracturing angular deformation is a parameter showing the structure of the
material is broken, which is measured when the first stick slip happens through shear banding
behavior. The criteria to determine bifurcation or static yield stress is whether the angular
deformation when transition happens is higher than the critical fracturing angular deformation.
When it is higher, the structure is broken and continues to be broken due to shear rejuvenation: the
flow continues. When it is lower, the structure is solid and not broken and the angular deformation
will keep increasing after transition time till an equilibrium value: the flow stops. This motivated
an investigation on connecting critical strain as measured by low-amplitude oscillatory shear with
critical strain as measured by the creep recovery protocol and is presented in Chapter 4.
The discrepancy in static and dynamic yield stress is reasoned to be related to thixotropy and
initial flocculation state. The apparent dependence of creep behavior on the origin point on the
flow curve underscores the importance of considering thixotropy and the flocculation state in
characterizing viscoelastic properties.

Use creep recovery to measure static yield stress
74
Chapter 4
Use creep recovery to measure static yield stress
Creep recovery protocol was applied to fresh cement pastes. A viscosity bifurcation behavior
was observed through applying a range of creep stresses. When applied stress is sufficiently low,
viscosity increases and the material yields, exhibiting viscoelastic solid-like behavior. Beyond a
critical stress, viscosity decreases and the material flows, exhibiting viscoelastic liquid-like
behavior. Through examining this bifurcation behavior we found that the transition of viscosity
occurs at very low strains. The strains at which this transition occurred were compared with critical
strains measured through low amplitude oscillatory shear. Results provided support that the solid-
liquid transition occurs beyond the critical stress measured through creep, thereby tying it to static
yield stress. The protocol was implemented to probe pastes modified with attapulgite clays, a
highly thixotropic system, and was found to be effective in characterizing static yield stress and
thixotropic rebuilding.
4.1 Introduction
For cementitious materials, static yield stresss is important because it is closely related to
formwork pressure. After casting, the materials is in rest. The faster it builds up strength, the lower
the formwork pressure is and the faster of pressure drop. The static yield stress of cement paste is
related to static segregation of self-compacting concrete (SCC). The coarse aggregate is suspended
in the matrix of cement paste. Under gravity, it is possible to segregate to the bottom and result in
inhomogeneous structure. The faster the cement paste builds up static yield stress, the less static
segregation.

Use creep recovery to measure static yield stress
75
Currently, there are two methods measuring the static yield stress of cement paste. One is
constant small shear rate. As discussed in section 3.4.4, the static yield stress measured by this
method is shear rate independent and not accurate. The other method is creep recovery protocol
[30].
In Chapter 3, we discussed yield stress measurement and discrepancy between static and
dynamic yield stress. For static yield stress measurement, creep recovery test seems to be
promising and accurate. In this chapter, we are going to apply creep recovery test on cement paste.
Also, to prove that the yield stress measured by creep recovery protocol is static yield stress, we
are going to compare the results with oscillatory sweep test.
Strain and viscosity development of cement paste under a creep recovery test will be presented
and discussed. Through incrementally increasing applied stress, a viscosity bifurcation is found to
occur beyond a critical stress. Through low amplitude oscillatory shear, the critical strain at which
the solid-liquid transition occurs is measured and is compared to the shear strains measured in the
creep recovery test. The strains at which the material transitions to either flow or no flow were
found to exceed the critical strain only once the critical stress had been exceeded. This supports
that the critical stress measured through the creep recovery test is static yield stress. The test is
extended to characterize thixotropic rebuilding of cement pastes modified with attapulgite clays
by measuring the development of static yield stress over time, up to 60 min. It helps to explain the
drop in formwork pressure with addition of nanoclay [15]. The effects of fly ash is also explored
and discussed.
4.2 Material and procedures
4.2.1 Materials
Type I Portland cement, highly purified attapulgite clay, and tap water are used in this study.
Details about cement and clay are described in section 3.2.1. No chemical admixtures are used.

Use creep recovery to measure static yield stress
76
Cement paste mixes have a water-to-cement ratio (W/C) of 0.36 by mass. At low water cement
ratio, there is no bleeding. As a parameter, the amount of nanoclay varies from 0, 0.1, 0.3 and 0.5%
by mass of cement.
Nanoclay powder is blended with the mixing water in a Waring blender for 2 minutes to
produce a clay suspension, which remains stable after 6 hours at rest. Immediately after preparing
the suspension, it is poured into a beaker. Cement powder or mix with fly ash powder is slowly
added to the suspension and mixed by hand for 1 min, then mixed with a hand mixer at a speed of
1100 rpm for 3 min. The fresh cement paste is loaded into the cup of the rheometer with a syringe
to ensure each sample is the same volume.
4.2.2 Experimental setup and rheological protocols
We perform all tests on a HAAKE MARS III rotational rheometer. We use a coaxial cylinder
geometer – the radius of the bob is 12.54 mm and the gap between the bob and cup is 1.06 mm.
For all protocols in this study, each sample is presheared at 600 s-1 for 4 min until the shear
stress reaches equilibrium, after which the material is allowed to rest for a period of time for stress
relaxation and to reach a stable state. Then, either the creep recovery test or oscillatory test is
applied. In the creep recovery protocol, we apply the creep step for 60 sec at each applied stress
level and monitor its recovery for up to 60 sec. In the strain amplitude sweep test, we apply strains
from 10-5 to 10-1 at a fixed frequency of 1 Hz, as conducted in many studies on cement paste [69,
71, 106].
A new sample is prepared for each test. At least three measurements are taken for each mix
for each testing protocol and the average is taken to be the representative measurement.
4.3 Results and discussion

Use creep recovery to measure static yield stress
77
4.3.1 Creep-recovery - viscosity bifurcation
We implement the creep-recovery protocol on neat cement pastes. Fig. 4-1 (a) and (b)shows
the strain development under creep and recovery process, respectively. As shown in Fig. 4-1 (a),
when creep stress is below 18.9 Pa the strain reaches a plateau and flow ceases. When creep stress
is higher than 19 Pa the strain increases and the material continues to flow until creep stress is
retrieved. Supplementing this with the recovery, Fig. 4-1 (b), it is observed that within 18.9 Pa the
material exhibits some recovery (viscoelastic solid) and beyond 19 Pa there is no recovery
(viscoelastic fluid).
(a)

Use creep recovery to measure static yield stress
78
(b)
Fig. 4-1 Strain development of paste under (a) creep and (b) recovery
Fig. 4-2 Viscosity bifurcation of paste

Use creep recovery to measure static yield stress
79
Fig. 4-2 shows the viscosity development under various creep stresses. The viscosity
bifurcation is shown. Under creep the viscosity exhibits an initial plateau and then either increases
or decreases. When creep stress is below 18.9 Pa the viscosity increases to infinite values; when
higher than 19 Pa the viscosity decreases to diminishingly small values. This resembles the
avalanche behavior of thixotropic materials [76], as discussed prior. Thus this bifurcation point
can be tied to the transition between viscoelastic solid to liquid, and the corresponding critical
stress may be considered to be the static yield stress. It can be seen that the transition occurs at the
beginning of creep protocol. Under stresses higher than the static yield stress, the material
transitions from a solid-like structure to a liquid-like structure. It is also assumed that this transition
is related to the microstructure of material. This is explored through low amplitude oscillatory
sweep (LAOS) and discussed in the next section.
4.3.2 Solid-liquid transition
4.3.2.1 Amplitude sweep - critical strain
Fig. 4-3 Frequency sweep of cement paste with w/c at 0.36

Use creep recovery to measure static yield stress
80
Fig. 4-4 Strain sweep of cement paste with w/c at 0.36
We implement amplitude and frequency sweeps on fresh cement pastes. Through monitoring
G’, we measure the LVR and corresponding critical strain. A frequency sweep experiment is
performed in which frequencies from 0.1 Hz to 20 Hz are applied at a fixed strain of 10-4. Results
of frequency sweep is shown in Fig. 4-3. It indicated that 1 Hz is within the LVR, which is also
commonly applied in other studies [69-71]. Therefore this fixed frequency at 1 Hz is used for all
amplitude sweeps. The results of an amplitude sweep on neat paste is shown in Fig. 4-4, where
strains ranging from 10-5 to 0.1 are applied. Beyond a critical strain, storage modulus G’ decreases
dramatically, showing that the structure is broken down. In addition, beyond this point G” becomes
greater than G’, indicating the transition from solid-like to liquid-like behavior. The average value
of the critical strain measured through low amplitude oscillatory sweep of neat paste is 7.69 x 10-
4, which corresponds to the same order of magnitude as those reported in other works [18, 69].
4.3.2.2 Solid-liquid transition

Use creep recovery to measure static yield stress
81
(a)
(b)
Fig. 4-5 Transition strain vs applied creep stress, in comparison with critical stress and
critical strain – (a) Full and (b) partial plot.
The transition strain is recorded from viscosity evolution plots (Fig. 4-2), considered to be
when the viscosity becomes 20% higher or lower than the initial plateau value (based on Fig. 4-2),
at each creep stress. Transition train is plotted against applied stress and presented in Fig. 4-5. In
addition, these values are compared against the critical strain as measured by LAOS and critical

Use creep recovery to measure static yield stress
82
stress measured by creep protocol, indicated by the dotted lines. With increasing creep stress, the
transition strain increases, as shown in Fig. 4-5 (a). It could be seen that under creep stresses lower
than the critical stress the transition strain remains within the critical strain, implying that the
microstructure remains intact, as shown in Fig. 4-5 (b). Further, under creep stresses higher than
the critical stress the transition strain exceeds the critical strain, indicating the microstructure is no
longer able to recovery elastically and the solid-liquid transition occurs. Only when applied creep
stress exceeds the critical stress could the material show solid-liquid transition. This will be
discussed further in the following subsection.
4.3.2.3 Schematic diagram of creep behavior
Fig. 4-6 Comparison of transition strain to critical strain, under low and high stress, leads to
different flow behavior

Use creep recovery to measure static yield stress
83
Fig. 4-6 shows the schematic plot of creep recovery protocol. Baudez and Coussot [73] found
that under creep in a couette geometry, typical yield stress materials (i.e. Carbopol gel and foam)
initially deformed homogeneously . Then beyond a critical deformation the inner rotor region
deformed much more quickly than the region near the wall, indicating solid-liquid transition
occurred near the rotor region. Although Carbopol gel and forms have much higher critical strains,
cement paste shows very similar yield stress and viscoelastic properties as Carbopol gels and
foams. The author thinks that before the transition between flow and no flow, the viscosity at the
plateau in Fig. 4-2 is the instantaneous response of the viscoelastic solid material. At this point,
the transition has not yet occurred, so the material is homogeneously deformed. And the higher
the creep stress, the higher the transition strain.
After the transition, the bifurcation behavior is determined by whether the strain exceeds the
critical strain. For creep stresses within the static yield stress, the transition strain is smaller than
the critical strain. The structure is not broken so viscosity approaches infinity and flow ceases. In
contrast, for creep stresses exceeding the static yield stress the transition strain is higher than the
critical strain. The structure is broken, the flow continues and the viscosity decreases due to shear
rejuvenation. The agreement between the oscillatory amplitude sweep and creep-recovery tests
provides support that the critical stress measured through the creep protocol is static yield stress.
4.3.3 Effect of nanoclay
4.3.3.1 Static yield stress

Use creep recovery to measure static yield stress
84
Fig. 4-7 Effect of nanoclay addition on static yield stress
As mentioned prior, due to the rate dependence of the stress growth protocol in measuring
static yield stress it is not a suitable approach for characterizing highly thixotropic mixes.
Therefore here we implement the creep-recovery protocol to measure the static yield stress of
cement pastes modified with highly purified attapulgite clays, which exhibit high rate of
thixotropic rebuilding at short time scales [17]. The results of static yield stress as measured by
the creep-recovery protocol on cement pastes with nanoclay addition are shown in Fig. 4-7. It is
shown that there is a linear increase of static yield stress with nanoclay addition. With 0.5% of
nanoclay addition over cement, the static yield stress increases 3 times. This is in good agreement
with the results found that measured the effect of these nanoclays on cohesive strength as measured
by the tack test [18].

Use creep recovery to measure static yield stress
85
Fig. 4-8 Effect of resting time on static yield stress with 0 and 0.5% of nanoclay
It is considered that [8] of the two components of thixotropy, i.e. de-flocculation under shear
and flocculation at rest, the latter is more important because most of the problems encountered in
SCC application (i.e. formwork pressure, multi-layer casting, and stability) are all related to resting.
The accurate quantification of static yield stress is the key to solving these problems. Athix
quantified as the increment of yield stress over resting time, shown in Eq. 4.1, has been proposed
as a useful parameter to describe the thixotropy of materials [8].
𝜏0(𝑡) = 𝜏0 + 𝐴𝑡ℎ𝑖𝑥𝑡 Eq. 4.1
Nanoclay has been found to effectively decrease formwork pressure in lab-scale studies [15].
And this has been attributed to its effect on thixotropic rebuilding over time. Therefore we
measured the effect of nanoclay on static yield stress over time. The results are shown in Fig. 4-8.
It is apparent that with increasing resting time, the static yield stress of both cement paste with and
without nanoclay increase. From 1 to 30 min, the thixotropic rate Athix of cement paste with 0 and
0.5% nanoclay are 2.35 Pa/min and 6.61 Pa/min, respectively. From 30 to 60 min, Athix of cement
paste with 0 and 0.5% nanoclay are 5.43 Pa/min and 11.25 Pa/min, respectively. With addition of

Use creep recovery to measure static yield stress
86
nanoclay, the cement paste exhibits higher rate of thixotropic rebuilding. As modeled by Ovarlez
and Roussel [4], the higher the Athix, the lower the formwork pressure. Thus, this effect on static
yield stress with resting time by the nanoclays can help partially explain the substantial decrease
in formwork pressure over time measured in previous studies [15].
Athix also increases with longer resting time. From the first 30 min to the second 30 min of
resting, the Athix of cement paste without nanoclay increases 2.31 times, while it increases 1.70
time with 0.5% of nanoclay. A potential explanation may be tied to cement hydration. Studies by
Kawashima [17] showed that after 30 min of resting, storage modulus of cement pastes without
nanoclay becomes higher than those with 0.5% nanoclay, implying that the effect of nanoclays on
thixotropic rebuilding may be hindered by the progression of hydration. This is currently under
investigation.
4.3.3.2 Critical strain
The yield stress of cement paste originates from the microstructure of an attractive particle-
particle network, connected through colloidal interaction or direct contact. The microstructure
sustains a certain amount of stress before it is broken and starts to flow, which defines the yield
stress. Other studies have measured the clay’s effect on floc size and strength. However,
characterization was limited to steady-state shear conditions [20, 21]. To gain insight into how the
attapulgite clays affect the undisturbed fresh-state microstructure at rest, we measure the critical
strain.

Use creep recovery to measure static yield stress
87
Fig. 4-9 Effect of nanoclay addition on critical strain through low amplitude oscillatory
sweep
Results of LAOS on nanoclay-modified cement pastes are shown in Fig. 4-9. They indicate
that critical shear strain decreases with nanoclay addition. Due to their fine size compared to
cement particles – nanoclays are 1.75 m in length, 3 nm in diameter while Ordinary Portland
cement has an average particle size of 15 m – we may attribute this to the clays filling the voids
between cement particles and connecting the bonds between cement particles; or due to surface
and edge charge effects nanoclay itself also forms card-house type structures, contributing to the
connectivity of the cement paste microstructure. In section 4.3.2 it was discussed how the critical
strain measured by LAOS agreed well with the solid-liquid transition measured by creep. The
authors would like to point out that similar behaviour was found for all pastes modified with
nanoclay addition, i.e. at 0.1, 0.3 and 0.5%, tested in this study. So the theory described by Fig.
4-6 also applies to pastes systems with nanoclay.
4.4 Conclusions

Use creep recovery to measure static yield stress
88
The creep recovery test is applied to probe the viscoelastic behavior of cement paste and a
viscosity bifurcation is observed. Within a critical stress the strain approaches equilibrium,
indicating no flow. Beyond a critical stress the strain increases dramatically and no equilibrium
value is reached, indicating flow is initiated and continues. The critical stress corresponding to this
viscosity bifurcation is considered to mark the solid-liquid transition of the material and so is
considered to be a measure of static yield stress. Measures of critical strain by LAOS are found to
support this. The methods are applied to characterize the thixotropic rebuilding of cement pastes
modified with nanoclays up to 0.5% by mass of cement. The creep protocol is found to effectively
capture the static yield stress of highly thixotropic systems. Further, the increase in static yield
stress over resting time is found to be higher for cement paste with 0.5% nanoclay over neat paste.
This helps to elucidate how nanoclays can reduce formwork pressure over time. Nanoclays are
also found to decrease critical strain measured by LAOS, which provides evidence that they are
increasing the interconnectivity of the fresh-state microstructure. Fly ash effectively decreases the
static yield stress of cement paste. The combined effect of nanoclay and fly ash is the superimposed
effect of each material: nanoclay increases while fly ash decreases static yield stress.

Tack test
89
Chapter 5
Tack test
Cohesion is often tied to formwork pressure and interlayer bonding, particularly for SCC.
However, cohesion of cementitious materials has not been extensively studied compared to other
rheological or fresh-state properties. In this study, the probe tack test was applied to fresh cement
pastes to measure cohesion, primarily to supplement the results of creep-recovery, as cohesion and
static yield stress are considered to be intimately related. The effect of nanoclay addition and
replacement of cement with fly ash on cohesion are explored. The relationship between cohesion
and static yield stress of cement paste with nanoclay and fly ash addition is also discussed.
5.1 Introduction
Cohesion is the bonding property of cementitous materials. Not only is it related to solid
properties to sustain a certain debonding stress, but also it is related to liquid properties resisting
flow during debonding. It is considered to be an important property for various casting applications,
including formwork pressure of SCC [18] and multi-layer casting [67]. Higher magnitude and rate
of increase of cohesion of SCC can lower exerted formwork pressure. During multi-layer casting
of SCC a weak interface between layers may form due to weak bonding and compromise the
performance of the overall structure. Additionally, in 3D concrete printing applications the shape
stability of the freshly printed layers will also depend on the cohesion of the material.
The probe tack test has been used to characterize debonding properties of different types of
soft materials. However, the cohesion of cementitious materials has not been extensively studied.
Theories have tried to relate cohesion with existing common rheological parameters, such as

Tack test
90
viscosity or yield stress. Meeten [107] studies the constant-force squeeze flow of soft solids and
derived a relationship between axial peak force and yield stress of materials, and squeeze velocity.
Kawashima et al. [18] and Kaci et al. [108, 109] implemented the probe tack test to measure
cohesion of cement paste systems - they investigated the relationship between material parameters
and pulling velocity in fresh cement mortars and pastes.
Here, the cohesion of cement pastes with partial fly ash replacement is investigated by
implementing the tack test. In addition, the coupled effect of fly ash and nanoclay is also studied.
Results of the tack test are compared to results of static yield stress as measured by the creep-
recovery protocol. It is found that the small additions of nanoclay have a governing effect on both
cohesion and static yield stress compared to high replacements of cement with fly ash. The
practical implications of this is discussed.
5.2 Material and procedures
5.2.1 Materials
Type I Portland cement, highly purified attapulgite clay, and tap water are used in this study.
Details about cement and clay are described in section 3.2.1. No chemical admixtures are used.
As a mineral waste from steel production, fly ash has been largely used as a supplementary
cementitious material. The addition rate of fly ash over cement by mass can be as high as 50%
[22]. Due to the pozzolanic properties of fly ash, where its reaction requires the presence of
sufficient calcium hydroxide produced through cement hydration, replacing high volumes of
cement with fly ash results in low early strength and poor shape stability [6]. Studies [20, 23] show
that nanoclay can help to enhance shape stability of fresh cement-based systems containing fly ash,
which is why these ternary systems will be investigated here. The mean diameter of class F fly ash
used in this study is 14.5 𝜇𝑚, and that of cement is 14.8 𝜇𝑚. Class F fly ash has a value D10 of 1.3
𝜇𝑚. The value of D10 is the size of the particle for which 10% of the sample by mass is below this
value. Comparatively, the D10 value of cement is 1.7 𝜇𝑚. The D90 of fly ash and cement are 122.3

Tack test
91
𝜇𝑚 and 36.1 𝜇𝑚, respectively. The particle size distribution of cement and fly ash is shown in Fig.
5-1.
Fig. 5-1 Partcile size distribution of cement and fly ash
Mixes have a water-to-cement ratio (W/C) of 0.36 by mass. At low water cement ratio, there
is no bleeding. As a parameter, the amount of nanoclay varies from 0, 0.1, 0.3 and 0.5% by mass
of cement. Fly ash content is as high as 40% of cement paste by mass.
Nanoclay powder is blended with the mixing water in a Waring blender for 2 minutes to
produce a clay suspension, which remains stable after 6 hours at rest. Immediately after preparing
the suspension, it is poured into a beaker. Cement powder or mix containing fly ash powder is
slowly added to the suspension and mixed by hand for 1 min, then mixed with a hand mixer at a
speed of 1100 rpm for 3 min. The fresh cement paste is loaded into the cup of the rheometer with
a syringe to ensure each sample is the same volume.

Tack test
92
5.2.2 Shear rheological protocols
We use a HAAKE MARS III rotational rheometer for all tests. For the tack test, a parallel
plate setup with a 60 mm diameter is used. The upper plate can rotate or displace vertically, while
the base plate remains fixed. The gap between the plates, and subsequently the initial sample height,
is set as 2 mm. After loading a certain volume of paste material onto the base plate, the upper plate
is lowered to the set gap. Once the top plate is in position, the sample is trimmed to match the
diameter of the plate. To prevent slippage, the plates are covered by sand paper with an average
particle diameter of 68 m.
For all protocols of the tack test, the sample is presheared at 50 s-1 for 60 seconds until the
shear stress reaches equilibrium, after which the material is allowed to rest for 60 seconds for stress
relaxation and to reach a stable state. During the test, the top plate moves up vertically at a constant
velocity, subjecting the sample to stretching. The normal force experienced by the top plate is
recorded over time. In this study, the pulling velocity is set between 1 and 500 𝜇𝑚/𝑠 based on
other studies [18].
For creep recovery protocol to measure static yield stress, we use a coaxial cylinder geometer
– the radius of the bob is 12.54 mm and the gap between the bob and cup is 1.06 mm. The shear
protocols is described in section 4.2.2.
A new sample is prepared for each test. At least three measurements are taken for each mix
for each testing protocol and the average is taken to be the representative value.
5.3 Results and discussion
5.3.1 Normal force evolution at various plate velocities
At the very beginning of loading, i.e. lifting the top plate vertically upward at a constant rate,
the sample deforms elastically and the normal force increases linearly with gap thickness. Beyond

Tack test
93
a critical tensile strain the normal force reaches a peak value and then starts to decrease, indicating
that the sample starts undergoing a failure process, as shown in Fig. 5-2. The value of the peak
force may comprise of at least two contributions: resistance to flow or viscous dissipation
(dynamic property) and resistance to elastic failure (static property) due to the intrinsic cohesion
of the material [109]. The higher the pulling velocity is, the higher the viscous dissipation is. To
eliminate the effect of dynamic hydraulic forces on peak force, cohesion is considered to
correspond to the value of the peak force for a vanishingly small pulling velocity.
Fig. 5-2 Normal force evolution curves for plain cement paste under various pulling velocity
We first study the effect of pulling velocity on the peak value 𝐹𝑚𝑎𝑥. The evolution of 𝐹𝑚𝑎𝑥 as
a function of the pulling velocity is shown in Fig. 5-3. At pulling velocities higher than 10 um/s,
the peak normal force increases with increasing pulling velocity. This can be explained by the
increase in viscous dissipation with velocity [108]. However, at pulling velocities within the range
of 10 um/s, the peak normal force decreases with increasing pulling velocity. This may be tied to
thixotropy. At sufficiently low pulling velocities, the structural rebuilding of the material during
the linear-elastic regime, before the peak normal force is reached, becomes increasingly more

Tack test
94
significant. Similar rate dependency of another measured parameter, static yield stress, is seen in
applying the stress growth protocol on cement-based materials, as discussed in section 3.4.4.
Fig. 5-3 Peak force vs plate pulling velocity for plain cement paste
The cement paste shows different failure modes under different pulling velocities. Fig. 5-4
shows the failure mode of materials under relatively high and low pulling velocities. At high
pulling velocity (50 𝜇𝑚/𝑠), during stress decay and failure there is a visible inward flow of the
material towards the center of the plates, as shown in Fig. 5-4 (a). At low pulling velocity (1 𝜇𝑚/𝑠),
it shows heterogeneous cavitation and fingering failure mode [110]. From Fig. 5-4 (b), several
inward flows, which is a combination of moderate inwards flow and internal growth of voids, can
be seen. It is reasoned that at low pulling velocities, it takes longer time for the material to fail and
separate completely. Concurrently with separation, the paste undergoes fresh-state stiffening due
to hydration and thixotropic structural rebuilding [16]. The material at the outer ring is too stiff to
flow to the center area. So the whole material breaks into several parts with several small inward
flows, as could be seen in Fig. 5-4 (b).

Tack test
95
In this study, as seen in Fig. 5-3, 𝐹𝑚𝑎𝑥 at 10 𝜇𝑚/𝑠 is the minimum value. This may be
considered to be the closest value to cohesion, as it minimizes both the contribution of dynamic
viscous flow during pulling and thixotropy. Therefore the moderate pulling velocity of 10 𝜇𝑚/𝑠
is taken to be the measure of cohesion and is used for the remainder of the tack test study. The
effects of nanoclay addition, replacement of cement with fly ash, and the combination of the two
on cohesion and static yield stress are measured and discussed.

Tack test
96
(a)

Tack test
97
(b)
Fig. 5-4 Failure surfaces of cement paste, including side face and failure face of each plate at
pulling velocities (a) 50 𝜇𝑚/𝑠 and (b) 1 𝜇𝑚/𝑠
5.3.2 Effect of nanoclay on cohesive stress

Tack test
98
5.3.2.1 Cohesion by tack test
The results of cohesion for cement pastes with nanoclay addition up to 0.5% by mass is
presented in Fig. 5-5. It is apparent that the cohesive strength increases with nanoclay addition,
which agrees with previous results of Kawashima et al. [18]. The mechanisms can be expected to
be very similar to those underlying the enhancing effect of the nanoclays on static yield stress. The
addition of nanoclay stiffens the microstructure of cement paste, as discussed in section 4.3.3
through the results of creep recovery and LAOS. It could result from the filling ability between
paste agglomerates or the house of cards structure formed by the nanoclays [6, 20, 21], which
exhibit significantly lower dimensions and higher aspect ratios than cement particles, along with
opposing surfaces charges along its length and ends.
Fig. 5-5 Cohesion of cement paste with nanoclay addition
To further explore the effect of nanoclay addition on the these parameters, we plot the
cohesive force calculated from the static yield stress measured by the creep-recovery protocol prior

Tack test
99
(Chapter 4). We can use one equation by Meeten [107] that provides a relationship between yield
stress and cohesion:
𝐹𝑚𝑎𝑥 =
2𝜋𝑅3𝜏0
3ℎ
Eq. 5.1
where 𝜏0 is the yield stress of the fluid, and ℎ is the gap between plates when maximum force
occures.
Then we can plot cohesion measured directly by the tack test against cohesion calculated from
static yield stress measured by the creep-recovery protocol and compare them. This is shown in
Fig. 5-6. It is apparent that although they both show a linear increase with clay adition, the cohesion
measured by the tack test is much higher than that calculated from static yield stress. This can be
attributed to several things. First, the pre-shear conditions are different – pastes are subjected to
600 s-1 for 4 min before the creep-recovery protocol while they are subjected to 50 s-1 for 1 min in
the tack test. Thus the pastes experience much less deflocculation before the tack test, which
explains the higher cohesion value measured. Second, the geometries are different – it is coaxial
cylinder for creep-recovery and parallel-plate for tack. This means they are experiencing different
shear conditions. Finally, the surface roughness differs – the coaxial cylinder setup is relatively
smooth while the parallel-plates are covered with sand paper. Therefore although it is not possible
to directly compare the two parameters, we can discuss how each of them are affected by the mix
design.

Tack test
100
Fig. 5-6 Cohesion of cement paste with nanoclay addition measured by tack test and
calculated using static yield stress
Fig. 5-7 Comparison of normalized cohesion measured by tack test and static yield stress

Tack test
101
measured by creep recovery of cement paste with nanoclay addition
5.3.3 Effect of fly ash
As shown in Fig. 5-8, fly ash addition does not show much apparent effect on cohesion of
cement paste as measured by the tack test. Replacing cement paste with 50% fly ash, Kawashima
et al. also found that the cohesion, which was measured at pulling velocity at 10 𝜇𝑚/𝑠, does not
change [63]. On the other hand, the static yield stress of cement paste measured through creep
recovery test decreases with fly ash addition, as shown in Fig. 5-9. With 40% of fly ash replacing
cement paste, the static yield stress decreases 26%.
Fig. 5-8 Cohesion of cement paste with fly ash addition

Tack test
102
One theory is that due to its spherical particle shape and “ball bearing” action [111, 112], the
interparticle friction is reduced. Fly ash addition in concrete could increase workability and lead
to a more flowable material [113], which corresponds to decreasing yield stress.
Meanwhile, Bentz et al. [114] also found out that fly ash replacement of cement paste reduced
yield stress measured through flow curve. Different from “ball bearing” effect, they tied yield
stress to the particle density of cement powders and argued that the decrease in yield stress by fly
ash addition is due to the dilution effect. Roussel et al. [53] reasoned early hydration products
especially CSH bridges as microstructural bonding for cement paste. Since fly ash does not have
early hydration, the dilution effect of fly ash in cement paste decreases CSH bridges and thus
decreases yield stress. They also found out that paste with only fly ash exhibited segregation and
bleeding, indicating a very low or zero yield stress value.
Fig. 5-9 Static yield stress of cement paste with FA addition
5.3.4 Effect of combination of nanoclay and fly ash

Tack test
103
The cohesion measured through tack test of cement paste modified with nanoclay and fly ash
is shown in Fig. 5-10. As could be seen, fly ash has no apparent effect on cohesion as measured
by the tack test. On the other hand, the nanoclay has a significant effect on cohesion, where it
increases almost linearly with nanoclay addition. Again, the coupled effect of nanoclay and fly ash
is the superimposed effect of each material.
(a)

Tack test
104
(b)
Fig. 5-10 Cohesion of cement paste modified with nanoclay and fly ash
The static yield stress of cement paste increases with nanoclay addition and decreases with fly
ash addition, as shown in Fig. 4-7 and Fig. 5-9. As could be seen in Fig. 5-11, the coupled effects
of nanoclay and fly ash is the superimposed effect of each material. Increase in fly ash replacement
level linearly decreases static yield stress and a 0.1% nanoclay addition imposes a consistent
increase in static yield stress at each fly ash replacement level tested. Again, small additions of
nanoclay has a governing effect on static yield stress over high replacements of cement with fly
ash.

Tack test
105
Fig. 5-11 Static yield stress of cement paste modified with nanoclay and fly ash
Practically speaking, the superimposed effect of nanoclay addition and fly ask replacement
can help us to easily control the mix proportions and design flow properties and cohesions. For
example, comparing cement paste with 40% fly ash and 0.1% addition with neat cement paste, we
found that the static yield stress is comparable, as shown in Fig. 5-11. However, the cohesion
increases 38%, as shown in Fig. 5-10.. It should be noted that the presence of chemical admixtures
can affect the relationship between the parameters, i.e. static yield stress and cohesive stress, and
mix constituents, i.e. fly ash and nanoclay. This should be investigated in the future.
5.4 Conclusions
This study investigated the effect of nanoclays and fly ash on cohesion and static yield stress.
Both cohesion and static yield stress increase linearly with nanoclay addition. The static yield
stress of cement paste decreases with fly ash addition, while cohesion is not affected by fly ash.
The coupled effect of both nanoclay and fly ash is equal to a simple superimposed effect. Overall,

Tack test
106
small additions of nanoclay have a governing effect on static yield stress and cohesion over high
replacements of cement with fly ash. Therefore, in mix design, nanoclay addition can be
considered to be the more effective means to control these parameters over binder composition.
Future work will include comparison between static yield stress measured by creep-recovery and
cohesive stress measured by the tack test on paste systems subjected to the same shear history to
further validate these characterization techniques.
The combination of nanoclay and fly ash enhances the cohesion and decreases formwork
pressure, while also maintain the workability. It is found that it is possible to develop a low static
yield stress and high cohesion cement paste system through the combined use of fly ash and
nanoclay, where fly ash can be used to decrease static yield stress and nanoclay can be used to
increase cohesion.

Shear migration
107
Chapter 6
Shear migration
Shear-induced particle migration is widely recognized to be a challenge in characterizing the
shear rheological properties of fresh cement-based mortar systems. In this study, we aim to
quantify shear-induced particle migration by characterizing the stress decay process during
constant shear flow with the aid of a modified thixotropy/migration model. It is found that a
conventionally used single exponential model is not sufficient to fit the stress decay and describe
the destructuration and sand migration of mortar under shear. Instead, a two exponential model is
needed to capture the interaction of sand particles and the suspending cement paste phase. Model
parameters are used to quantify the effect of sand volume fraction, clay addition, and applied shear
rate on the kinetics and intensity of colloidal deflocculation and sand migration. Results provide
evidence that the colloidal and granular contributions to the overall destructuration of mortars can
be represented by each of the two exponentials.
6.1 Introduction and Background
Most studies on the rheology of cement-based materials thus far have focused on the paste
phase and the concrete phase [115]. Paste is investigated because it is the phase that embodies the
colloidal and hydration effects. However, the rheology of concrete is heavily influenced by the
characteristics of the granular phase. Many experimental rheological studies investigate concrete

Shear migration
108
systems directly to capture the critical aspects of particle packing and grain-to-grain contact.
Sophisticated measurements are challenging, though, due to the limited sensitivity of large-scale
viscometers and increased likeliness of inhomogeneity within the suspension, although some
modified geometries have been proposed [115-117]. Mortar is an intermediate scale that exhibits
both colloidal and granular behaviour. They can be prepared in relatively small batches, and tested
on rotational rheometers with precise shear and measurement control, allowing for more complex
flow situations. Serving as the suspending phase for the coarse aggregates, the rheological
properties of the mortar are important in regards to the stability of fresh concrete systems [44].
Particularly for self-consolidating concrete (SCC), the mortar phase makes up a greater part of its
composition compared to conventional concrete. Thus testing the rheological properties of mortar
is an integral part of SCC design [118].
However, a widely recognized challenge in characterizing fresh cement mortar through shear
rheological methods is shear-induced particle migration [11-13]. This has invoked studies that
explore the influence of various parameters, e.g. setup geometries and solid inclusions, on
sedimentation and migration under rotational shear [10]. However, more investigation is needed.
In particular, it would be useful to develop a method to quantify sand particle migration in fresh
mortars to help guide the design of protocols for dynamic rheological characterization. Further, it
can help determine the range of shear rates within which migration can be minimized or held
constant. It can also be used to evaluate the effect of various mix parameters, e.g. mix
proportioning and use of mineral/chemical admixtures, on dynamic segregation. As part of a wider
investigation on the thixotropy of fresh mortar systems, in the present study we discuss the
potential of a thixotropy/migration model to quantify shear-induced particle migration in fresh
mortars.

Shear migration
109
The idealized shear stress response of a fresh cement-based suspension under a constant
intermediate shear rate can be described as follows: an initial increase to a peak value, considered
to be the static yield stress as measured by the stress growth protocol, followed by a decay until
steady-state is reached. The shear stress decay from the peak value to the equilibrium value
captures the process of structural breakdown and is related to the thixotropy of the material.
Thixotropy is defined as a decrease in viscosity under shear, followed by an increase upon removal
of shear. From a microstructural point of view, it can be described as paste deflocculation and
broken down of CSH bridges under flow, and reflocculation and formation of CSH bridges over
time at rest [53]. Meanwhile, sand migration induces structural heterogeneity. In investigating
stress decay, we focus on paste deflocculation and sand migration.
The stress decay curve of cement paste is found to be fitted well by an exponential curve.
Empirically, Tattersall [119], Papo [120] and Lapasin et al. [97] measured the difference between
the maximum shear stress, max, needed to initiate flow and the steady-state equilibrium value, e,
at constant shear rate, then proposed simple thixotropy models that predict an exponential decrease
of the shear stress. A logarithmic evolution of the shear stress was obtained, as follows:
τ = τe + (τmax − τe)exp(−Bt) Eq. 6.1
where B is a constant depending on the shear rate. The characteristic time of destructuration
is tc = 1/𝐵, i.e. when exp (−Bt) = e−1.
Several thixotropic models have been proposed to quantify the structural breakdown process
of cementitious materials. Roussel has proposed models for cement paste [121] and concrete [8].

Shear migration
110
6.1.1 Thixotropy model: evolution of viscosity over time
The apparent viscosity, which is the ratio between shear stress over shear rate, depends on
the extent of structure in the material, or more generally its “degree of jamming”, which is affected
by thixotropic behaivors [122, 123]. Cheng and Evans [124] suggested a general mathematical
form of the equation of state of a thixotropic material, which is written as:
𝜏 = 𝜂(𝜆, �̇�)�̇� Eq. 6.2
𝑑𝜆
𝑑𝑡= 𝑓(𝜆, �̇�)
Eq. 6.3
Where, 𝜆 is a structural parameter related to jamming or flocculation state of structure. In
addition, similar to the definition of thixotropy, the jamming or flocculation state is affected by
both the breakdown under flow and rebuilding under rest. It is proposed that the rate of change of
𝜆 is the sum of a term expressing the rebuilding rate and a rate of structural breakdown under flow.
Thus, Coussot et al. [125] proposed a model using these simple basic ideas as follwing:
𝜏 = 𝜇0(1 + 𝜆𝑛)�̇� Eq. 6.4
𝑑𝜆
𝑑𝑡=
1
𝑇− 𝛼𝜆�̇�
Eq. 6.5
Where, 𝜇0 is the viscosity at infinite shear rate (i.e. when 𝜆 tends toward zero), n is a constant
positive parameter related to the shear thinning and H-B model fitting, 1/𝑇 is the characteristic
time of structural build-up and 𝛼 is a dimensionless parameter. The second term in Eq. 6.5 can be
associated with the rate of structural breakdown. This model has been used to model bentonite
flows in a Couette viscometer with a large gap [126]. The local predictions of the model were in
good agreement with MRI measurements of the local flowing velocities. This model was also
applied to macroscopic rheological measurements of cement pastes [121] and, recently, a
derivative form of this model, including a yield stress depending on 𝜆, was also applied by Roussel
[8] to the steady and transient behavior of fresh concrete.

Shear migration
111
6.1.2 Roussel’s thixotropy model for concrete
A general form of the model could be written:
τ = (1 + λ)τ0 + kγ̇n Eq. 6.6
∂λ
∂t=
1
Tλm− αλγ̇
Eq. 6.7
Where, λ is the flocculation state of the material and T, m and α are thixotropy parameters.
The flocculation state depends on the flow history. Just after mixing, the material is regarded in
the most deflocculated state, so λ is equal to zero. This means that the thixotropic apparent yield
stress due to flocculation λτ0 is also equal to zero. In the casting process (including resting, re-
mixing, pumping, etc), λ will evolve from its initial zero value to a positive value according to the
evolution Eq. 6.7.
To simplifiy this model, firstly, it is assumed that a Bingham model τ = τy + μpγ̇ is sufficient
for the description of the steady state flow of fresh concrete: n = 1, K = μp (where μp is the
plastic viscosity in Bingham model of equilibrium flow curve).
Secondly, it is assumed that the yield stress at rest increases linearly with time, which means
m = 0. This is true for many cementitious materials, especlly before induction period [100].
The model then becomes:
τ = (1 + λ)τ0 + μpγ̇ Eq. 6.8
∂λ
∂t=
1
T− αλγ̇
Eq. 6.9
It is assumed here that the characteristic time of flocculation is long compared to the
characteristic time of de-flocculation. This was reported by Papo [120] in his work on cement
pastes and by Roussel on SCC [8]. So the term corresponding to flocculation 1/𝑇 is eliminated.
Thus, Eq. 6.9 simplifies to

Shear migration
112
∂λ
∂t= −αλγ̇
Eq. 6.10
After integration, it becomes
λ = λ0e−αγ̇t Eq. 6.11
Integrating Eq. 6.11 into Eq. 6.8, the shear stress becomes
τ = (1 + λ0e−αγ̇t)τ0 + μpγ̇ Eq. 6.12
This model predicts, just like empirical models, an exponential decay of the shear stress under
constant shear rate with a deflocculation characteristic time equal to 1/(αγ̇).
At rest, the shear rate �̇� = 0 and the yield stress is:
τ0(t) = (1 + λ)τ0 = τ0 + τ0
t
T= τ0 + Athixt
Eq. 6.13
Where
Athix =τ0
T Eq. 6.14
Athix is the rate of flocculation, or flocculation rate. It indicates the rate of yield stress increase
under rest. Roussel [8] classifies the thixotropy of SCC through distinguishing the Athix value. The
higher Athix is, more thixotropic the material is. Thixotropic SCC has Athix between 0.1 to 0.5 Pa/s;
that of highly thixotropic SCC is higher than 0.5 Pa/s, while that of non-thixotropic SCC is lower
than 0.1 Pa/s. In practice, Athix is a very important parameter for casting and pumping. It has been
calculated by Roussel [8] that highly thixotropic SCC has the least formwork pressure, while has
least resting period between each layer casting to prevent weak interfaces. So high thixotropic SCC
is appropriate for wall casting, while non-thixotropic SCC is more suitable for slab casting.
6.1.3 Parameters affecting particle shear migration in fresh mortar

Shear migration
113
For fresh mortar under shear, the measured decay can be expected to be a function of both
deflocculation of the colloidal suspension and sand particle migration. Concerning the latter, in a
rotational shear setup consisting of a concentrically oriented vane rotor and a cylindrical container,
sand particles will tend to migrate from the inner rotor to the wall of the cylinder. A void area with
a smaller volume fraction will form in the suspension near the inner rotor, thus making the apparent
viscosity and shear stress decrease. So modelling the shear stress decay provides a promising way
to quantify the sand migration process.
Particle shear migration has been explored in other system types, and the influence of different
parameters has been measured by direct methods. It has been observed through magnetic
resonance imaging (MRI) that particle shear migration of beads in yield stress fluids is not apparent
when the particle volume fraction is below 20%, while it becomes more apparent at higher particle
volume fractions [11].
Ovarlez et al. investigated the effect of shear rate on noncolloidal rigid particles suspended in
a Newtonian fluid [84]. They found very similar concentration profiles in a 58% suspension under
constant rotational velocities ranging from 0.06 to 25 rpm with preshears of 9-rpm and 100-rpm.
At all rotational velocities with each preshear, the concentration was found to be lower near the
inner cylinder where the shear rate is highest. This may be attributed to the concentration profile
that is irreversibly established by the preshear. Ovarlez et al. [11] also found that the ratio of normal
stress difference from the inner rotor to the wall, which is the force of particle shear migration, is
proportional to shear stress but not dependent on the shear rate.
In addition to particle volume fraction and shear rate, it is expected that mix constituents,
namely the presence of chemical and mineral admixtures, will change the rheological properties

Shear migration
114
of the suspending paste system and thereby change the kinetics of shear-induced sand particle
migration.
In this study, we propose a two exponential model to fit the torque/stress decay of fresh cement
mortar systems subjected to constant angular velocity in a rotational rheometer. Results provide
evidence that the colloidal and granular contributions to the overall destructuration and sand
migration of mortars can be represented by each of the two exponentials. Model parameters are
used to quantify the effect of sand volume fraction, clay addition, and applied shear rate on the
kinetics and intensity of thixotropic deflocculation and particle migration. We find the influence
of sand volume fraction and rotational velocity on shear-induced particle migration, as described
by the model parameters, agree well with the findings of other studies as presented in the literature
review above.
6.2 Materials and procedures
The materials, mixing protocols, rheometer and construction cell, shear rheological protocol
are described in section 3.2.
To explore the effect of sand volume, we test mortars with sand-to-cement (s/c) ratios of 1.5,
1.75, 2, and 2.25, yielding sand volume fractions of 41%, 45%, 48%, and 51%, respectively. In
this case, nanoclay addition is held constant at 0.5% by mass of cement, which is found to be
sufficient to achieve stable mixes that exhibit no visible signs of static bleeding or sand
sedimentation. To explore the effect of nanoclay, we test mortars with nanoclay additions of 0,
0.25 and 0.5% by mass of cement. In this case, s/c ratio is held constant at 2 by mass. Finally, to
explore the effect of angular velocity all mixes have s/c ratio of 2 and 0.5% nanoclay addition.

Shear migration
115
6.3 Results and discussion
6.3.1 A modified thixotropy model for mortar
It has been found that shear stress decay under shear of pastes and concretes can be described
by a single exponential [1, 8, 121]. However, we find that the stress decay of mortars cannot,
especially at the initial onset of shear. And given the rapid kinetics of shear-induced particle
migration, it is essential to capture the initial portion of the decay. Instead, it requires two
exponentials, as shown in Fig. 6-1. It is hypothesized that it has to do with the viscous and granular
contributions in mortar systems that is not as present in cement paste systems. Thus it is proposed
that the stress decay of mortars under shear be described by the following:
𝑀 = 𝑀0 + 𝑀1𝑒−𝛼1�̇�𝑡 + 𝑀2𝑒−𝛼2�̇�𝑡 Eq. 6.15
where the colloidal deflocculation of the paste phase and sand shear migration of the granular
phase (i.e. sand particles) are described by each exponential.
The characteristic time of each component is given by 1/(α1γ̇) and1/(α2γ̇). The shorter the
characteristic time, which corresponds to the bigger value at a given shear rate, the faster the
rate of destructuration. Of the three torque parameters, M0 corresponds to the steady state of the
mortar system under constant shear, while M1 and M2 correspond to the intensity of colloidal
deflocculation and sand migration phases for each phase. We observe the effect of s/c ratio,
nanoclay addition and angular velocity on the parameters to explore the suitability of the model
for distinguishing and characterizing colloidal deflocculation and sand shear migration during
transient flow of fresh mortar.

Shear migration
116
Fig. 6-1 One versus two exponential model for capturing stress decay of fresh mortar (s/c = 2)
under constant angular velocity (10 rad/s).
6.3.2 Effect of s/c ratio
We capture the stress decay of fresh mortars with s/c ratios ranging between 1.50 and 2.25 at
a constant applied rotational rate of 10 rad/s over 60 seconds. All the samples have 0.5% nanoclay
addition by mass of cement. The results of parameters and M are presented in Fig. 6-2 and Fig.
6-3, respectively. First, with increasing s/c ratio all and M parameters increase, indicating faster
and higher degree of stress decay overall. Second, comparing 1 and 2, 1 is about 20 times
greater than 2 throughout while the difference between M1 and M2 is much smaller. This indicates
there are two distinct stress decay mechanisms at different rates yet similar intensities. Third, it is
apparent that there is greater variability for 1, especially for s/c = 2.25. This variability can be
expected as it describes the instantaneous decay upon introduction of shear, which highly depends
on the initial flocculation state.
Focusing on rate of decay, we observe an increase in 1 and 2 with increase in s/c ratio,
which translates to decrease in characteristic times 1/𝛼1�̇� and 1/𝛼2�̇�. This can be attributed to

Shear migration
117
accelerated kinetics of both colloidal deflocculation of the paste phase and shear migration of the
sand. Increase in sand volume fraction will increase the local shear rate applied on the paste phase,
thus accelerating colloidal deflocculation and corresponding rate of decay. And as mentioned prior,
concentration profiles of particles measured through MRI showed shear-induced particle migration
increases with particle volume fraction [11]. Further, it could be reasoned that 1 and 2 correspond
to paste deflocculation and sand migration, respectively.
First, due to the fine size of cement particles compared with sands, the characteristic strain to
break down the paste colloidal structure is much smaller than that of sand migration. So at constant
shear rate, the characteristic time for colloidal deflocculation is much smaller than that of sand
migration. This means the parameter corresponding to colloidal deflocculation can be expected
to be much greater, which points to α1. Secondly, with increasing s/c from 1.5 to 2.25, 2 increases
more times than 1, indicating that 2 is more sensitive to sand volume fraction. Through MRI,
Ovarlez et al. [11] found that particle migration became more apparent as particle volume fractions
exceeded 30% and approached the maximum packing density (around 64% for monodisperse
spheres). In our present study, s/c ratios 1.5, 1.75, 2 and 2.25 correspond to sand volume fractions
41%, 45%, 48%, and 51%, respectively. Therefore in this range we can expect that sand volume
fraction will have a greater effect on sand migration over deflocculation of cement paste, thus tying
sand migration to 1.

Shear migration
118
Fig. 6-2 Effect of s/c ratio on parameters 1 and 2.
From Fig. 6-3 (a), all the torque M values increase with s/c ratios, indicating a denser steady-
state structure and higher degree of decay. To observe the effect of s/c ratio on the relative intensity
of paste deflocculation and sand migration, we compare the relative increase of each torque by
normalizing Mx, as follows:
𝑁𝑜𝑟𝑚𝑎𝑙𝑖𝑧𝑒𝑑 𝑀𝑥 = 𝑀𝑥/(𝑀0 + 𝑀1 + 𝑀2) Eq. 1
where 𝑀0 + 𝑀1 + 𝑀2 corresponds to the maximum value of stress under constant shear rate.
Normalized M0 corresponds to the ratio between viscosity after and before colloidal deflocculation
and sand migration, which translates to the ratio between dynamic yield stress and static yield
stress; normalized M1 and M2 correspond to the relative intensity of each component over the
maximum torque. From Fig. 6-3 (b), we observe that normalized M1 and M2 increase with sand
volume, indicating higher degree of colloidal deflocculation and sand migration during the
shearing period. This is, again, in agreement with the expected effect of increasing sand volume
fraction. However, normalized M0 decreases, indicating sand addition increases static yield stress
more than dynamic yield stress. Measuring static yield stress through the stress growth protocol,
Mahaut et al. [96] found that the static yield stress increases with particle volume fraction, where
the increment of increase is higher at higher particle volume fraction. However, Hu [127] found
that the dynamic yield stress of mortar increases less at higher sand volume fraction. These results
support that normalized M0, as the ratio between dynamic yield stress and static yield stress,
decreases with increasing sand volume fraction.

Shear migration
119
(a)
(b)
Fig. 6-3 Effect of s/c ratio on (a) parameters M0, M1, and M2 and (b) normalized M0, M1, and
M2.

Shear migration
120
6.3.3 Effect of clay addition
The effect of nanoclay addition was investigated on mortar systems with s/c ratio 2 subjected
to an angular velocity of 10 rad/s. The nanoclay addition varies from 0 to 0.5% by mass of cement.
The results of and M parameters are presented in Fig. 6-4 and Fig. 6-5, respectively.
Firstly looking at parameters (Fig. 6-4), at addition levels up to 0.5% nanoclay by mass of
cement there is an apparent increase in 1 and decrease in 2. In this model, 1/α1γ̇ corresponds to
the characteristic time of deflocculation of the paste phase - thus, 1/α1 corresponds to the
characteristic strain for deflocculation. Since �̇� here is constant, increase in 1 leads to decrease in
characteristic strain. Physically, this indicates that the nanoclays are stiffening the microstructure
of the cement paste. In a parallel investigation we implemented low amplitude oscillatory shear
(LAOS) to measure the critical strain at which the fresh-state structure of fresh cement pastes
modified with nanoclays is irreversibly broken, the results of which will be fully reported in
another paper [16]. Details of the method can be found elsewhere [69], although briefly explained
here. Within the linear viscoelastic region (LVR), the storage modulus G’ and loss modulus G”
are independent of the applied strain amplitude because the applied oscillatory strain is sufficiently
small and the suspension structure remains intact. Beyond a critical strain, which marks the end of
the LVR, the microstructure can no longer fully recover and G’ dramatically decreases. To measure
the critical strain, we apply a strain amplitude sweep from 10-5 to 10-1 at a frequency of 1 Hz, as
conducted in many studies on cement paste [69, 71, 106]. Critical strain values of clay-modified
cement pastes are reported in Table 2. It is apparent that critical strain decreases with nanoclay
addition, which supports that 1 corresponds to the paste phase.
The decrease in 2 indicates the rate of sand migration is slowed with nanoclay addition.
Viscosity modifiers are commonly used to improve suspension stability, particularly in SCC mixes.
For instance, a number of studies have demonstrated that viscosity modifying agents (VMAs) can
improve dynamic segregation resistance [42, 128, 129]. Clays can have a similar effect.
Metakaolin clay addition in cement has been found to stabilize pastes, especially at prolonged
mixing or higher w/b ratio [130]. And nanoclays have been shown to increase yield stress [6],
apparent viscosity [17] and cohesiveness [18] of cement paste at modest dosages. Based on the

Shear migration
121
results of the references studies it can be expected that nanoclays can slow particle migration,
which supports that 2 corresponds to the granular phase.
As for the intensity parameters, M0 and M1 increase with nanoclay addition, which can be
attributed to the increase in viscosity of the overall system and paste phase, respectively [6, 17,
18]. On the other hand, M2 remains relatively constant at all nanoclay addition levels. From Fig.
6-5 (b), we observe that normalized M0 increases with nanoclay addition while normalized M2
decreases. Increase in normalized M0 captures the significant flocculating effect of the clays, which
has been observed in other studies. Through focused beam reflectance measurement (FBRM),
Ferron et al. [21] found that various clay types increase average floc size. And through compressive
rheology, Tregger et al. [20] found that nanoclays increased floc strength. The decrease in
normalized M2 indicates that the flocculating effect of the clays on the pastes phase subsequently
leads to some alleviation of sand migration.
Fig. 6-4 Effect of nanoclay addition on parameters α1 and α2.
Table 6-1 Effects of nanoclay addition on critical strain
Nanoclay addition over
cement/ %
Average critical
strain
Standard
deviation

Shear migration
122
0 7.69E-4 5.1E-5
0.1 3.69E-4 3.2E-5
0.3 2.42E-4 1.9E-5
0.5 1.69E-4 5.6E-5
(a)

Shear migration
123
(b)
Fig. 6-5 Effect of nanoclay addition on (a) parameters M0, M1, and M2 and (b) normalized
M0, M1, and M2.
6.3.4 Effect of angular velocity
The effect of angular velocity on αγ̇ and M parameters are shown in Fig. 6-6 and Fig. 6-7,
respectively. Overall, changes in angular velocity in the range of 10 rad/s to 20 rad/s show less
influence on the parameters of the model compared to sand volume fraction and nanoclay addition.
Looking at αγ̇ parameters (Fig. 6-6), α1γ̇ remains relatively constant within 20 rad/s. This
supports that 10 rad/s is sufficiently high to break the colloidal structure, which is the applied
angular velocity implemented throughout the investigation. α2γ̇ shows slight increase with higher
angular velocity – this corresponds to lower characteristic time 1/𝛼2�̇�, indicating faster kinetics
of sand migration. From Fig. 6-7 (a), there is no apparent trend of the M parameters with angular
velocity. It is expected that increase in angular velocity will increase viscosity of the overall system.
Here, M0 shows a slight increase with angular velocity but it is not apparent. Looking at the effect
of angular velocity on normalized M (Fig. 6-7 (b)) provides more insight. All normalized M values
remain relatively constant with angular velocity. Specifically, normalized M2 does not change. M2

Shear migration
124
does not change either (Fig. 6-7 (a)). This shows that although angular velocity can accelerate
kinetics (i.e. increase in α2γ̇), there is no measurable increase in intensity of sand migration within
the total shearing period. This can at least partially explain why Mo does not show an apparent
increase with shear rate – degree of sand migration is similar at steady-state. This is in agreement
with the observations of Ovarlez et al. [11, 84], where similar concentration profiles were captured
at a range of pre-shear and applied constant shear rate conditions.
Fig. 6-6 Effect of angular velocity on parameters α1γ̇ and α2γ̇.

Shear migration
125
(a)
(b)
Fig. 6-7 Effect of angular velocity on (a) parameters M0, M1, and M2 and (b) normalized M0,
M1, and M2.

Shear migration
126
6.4 Conclusions
In this chapter, a modified two exponential thixotropy/migration model is proposed to
quantify the stress decay of fresh mortar under constant shear rate. Results support that
destructuration and sand migration are represented by the two exponentials. and characteristic
time 1/(αγ̇) are related to the rate of these two stress decay mechanisms, and torque M and
normalized M indicate the intensity of each phase. Test results indicate the following:
Increase of sand volume fraction increases all five parameters, along with normalized M1
and M2, indicating faster kinetics and increased intensity of both colloidal deflocculation
and sand migration. This is in agreement with observations of other studies.
Nanoclay addition increases 1 and decreases 2, indicating decrease in critical strain,
which agrees well with LAOS results, and slowed sand migration. Decrease of normalized
M2 supports the alleviation of sand migration with nanoclay addition.
Angular velocity in the range of 10 to 20 rad/s does not have a significant influence on the
model parameters. Increase in angular velocity increases 2 slightly, indicating slightly
accelerated shear migration kinetics. However, intensity of sand migration, M2 and
normalized M2, is not greatly affected by angular velocity, which agrees well with results
in literature.
The thixotropy/migration model provides a straightforward and promising way to measure the
sand migration behavior of mortar. Future work includes exploring other parameters (e.g.
rheometer geometry, mix design, increased range of angular velocities), as well as supporting flow
results with direct measurements of concentration profile to help validate the model.

Conclusions and Future Work
127
Chapter 7
Conclusions and Future Work
The overall objective of my doctoral study is to improve quantification of key parameters tied
to thixotropy that we have identified to be important: static yield stress, cohesion and shear-
induced particle migration.
7.1 Thixotropy of mortar: difference between dynamic and static yield stress
Through preliminary testing on mortar, we applied several methods to obtain the yield stress,
including dynamic and static yield stress. Steady-state constant shear rate-controlled protocols are
applied to mortar. The equilibrium shear stress and shear rate are plotted and fitted with the
Bingham model very well, from which the dynamic yield stress is obtained. And a creep recovery
test is applied to obtain static yield stress, where the mortar does not flow until a critical creep
stress is reached.
Test results show that static yield stress of mortar is 62% higher than dynamic yield stress.
The difference between dynamic and static yield stress is related to thixotropy. By applying
different preshear at 1 rad/s and 30 rad/s, we found that the stress needed to initiate flow after 30
rad/s is lower than after 1 rad/s. Higher preshear rate breaks the structure to a lower thixotropic
state, thus smaller stress is needed to initiate flow.
The contribution of this thesis is to tie thixotropy to the difference between dynamic and static
yield stress through exploring various testing protocols. The overall aim is to improve
understanding and quantification of thixotropy for improving concrete workability for various

Conclusions and Future Work
128
casting applications. For example, highly thixotropic SCC has lower formwork pressure after
casting and faster pressure drop over time.
7.2 Static yield stress
The static yield stress of cement paste was measured by a creep recovery test. Two responses
were observed. When the applied creep stress is lower than a critical stress, the strain under creep
increases until a plateau value and stays constant; under recovery, the strain decreases. When the
applied creep stress is higher than a critical stress, the strain under creep keeps increasing; under
recovery, the strain does not decrease.
The viscosity development of cement paste shows that at the beginning of the creep test, the
viscosity at each creep stress shows a plateau value. The higher the applied creep stress, the higher
the plateau viscosity. The viscosity transition occurs as follows: at creep stress lower than the
critical stress, the viscosity increases to infinite; at creep stress higher than the critical stress, the
viscosity decreases to a very small value. A viscosity bifurcation depending on the material system
is observed.
Under creep stress, when the change in viscosity exceeds 20% from the initial plateau
viscosity, the transition is considered to occur. For each creep test, the strain when transition of
viscosity occurs is recorded. Meanwhile, the critical strain, which is regarded as when the structure
of the cement paste is broken down, is measured by low-amplitude oscillatory shear. By comparing
the transitional strain and critical strain, we found that when creep stress is lower than the critical
stress, the transitional strain is lower than the critical strain; when creep stress is higher than the
critical stress, the transition strain is higher than the critical strain, thus the solid-liquid transition
occurs and the cement paste keeps flowing. So the critical stress is tied to the static yield stress.
Only when the applied creep stress is higher than the critical stress could the solid-liquid transition
occur and the flow be initiated.
This study also analyzed effects of nanoclay addition on static yield stress. Results showed
that nanoclay addition up to 0.5% of cement paste by mass linearly increases static yield stress.
The results of each nanoclay addition show small error bar. It is also found that nanoclay increases

Conclusions and Future Work
129
the thixotropic rate of cement paste over resting time, which helps to explain low formwork
pressure of SCC with nanoclay addition.
This improved quantification of static yield stress eliminates the rate-dependency of other
methods, i.e. stress growth protocol, thereby making it more suitable for highly-thixotropic mixes.
It can help to further understanding of the effect of mix composition on SCC formwork pressure
development, as well as static segregation and stability.
7.3 Cohesion
Cohesion of cement paste was measured using probe tack test. Results showed that nanoclay
increased cohesion dramatically, while fly ash did not have an obvious effect on cohesion.
Meanwhile, the static yield stress of cement paste with addition of fly ash or the combination of
fly ash and nanoclay is also measured by creep recovery test. Results show that the static yield
stress decreases with fly ash addition. The combination of fly ash and nanoclay is the superimposed
effect of either addition.
The superimposed effect of fly ash and nanoclay addition on both static yield stress and
cohesion makes it easy to design mix proportion to obtain certain rheological properties. For
example, compared with cement paste, addition of 40% of fly ash and 0.1% of nanoclay does not
affect static yield stress but the cohesion increases by 38%. It corresponds to lower formwork
pressure, but no compromise on flowability or workability.
As cohesion is tied to shape-keeping and interlayer bonding study, the tack test is suitable for
studies of 3D printing applications.
7.4 Particle shear migration
Particle shear migration is studied through stress decay under constant shear rate. An empirical
model was developed to fit the stress decay process. To mortar, the stress decay could be attributed

Conclusions and Future Work
130
to two mechanisms: colloidal destructuration and sand migration. Such a model could be used to
characterize particle migration and dynamic segregation, a critical issue for casting applications.
Parameters are developed to quantify each stress decay mechanism, in rate and intensity.
Test results showed that high sand volume fraction induced more severe sand migration, but
nanoclay addition mitigated sand migration. The shear rate in the range studied did not show any
apparent effect on sand migration. These observations are in agreement with results of other studies.
Compared with currently applied methods, this model provides a much faster approach to test
sand migration process, including kinetics. Therefore, this model can help determine the range of
shear rates within which migration can be minimized to guide the design of protocols for dynamic
rheological characterization and to ultimately develop design strategies to minimize mitigation.
7.5 Future work
7.5.1 Effects of other supplementary cementitious materials (SCC) on dynamic, static
yield stress and cohesion
This thesis found that nanoclay increases structural rebuilding of cement pastes. Methods and
organic or inorganic additives to increase or decrease thixotropy or static yield stress is also of
interest. More work should be done on these fields:
1) Since superplasticizer is an important component in SCC, the coupled effects of nanoclay
and superplasticizer is to be explored on static yield stress and cohesion of cement paste.
2) Hydration accelerator increases yield stress and decreases formwork pressure. The effects
of various types of accelerator is to be explored. Limestone addition has been found to
accelerate cement hydration and decrease setting time. Compared with chloride
accelerators (NaCl, CaCl2), limestone is more eco-friendly and shows less long term
damages. Effects of limestone addition on yield stress and formwork pressure is to be
explored.

Conclusions and Future Work
131
7.5.2 Pumping pressure
When concrete is flowing in pipes during pumping, aggregate particles migrate to the center
of the pipe, thus forming a lubrication layer with less aggregate volume fraction near the pipe wall.
The lubrication layer has been found to greatly affect pumping pressure. The thixotropy/ migration
model can be used to quantify the effects of viscosity modification agents and other SCM on sand
migration behavior of mortars and SCC, together with the effects on pumpability.
7.5.3 SCC stability and segregation
Besides sand shear migration, segregation is also very critical in making SCC stable. Because
after casting no vibration is allowed, SCC is not flowing and under rest. The proposed protocols
and methods of this dissertation can be implemented to quantify the segregation behavior of mortar
and concrete. Methods to decrease segregation are also of interest.

Bibliography
132
Bibliography
[1] J. Assaad, K.H. Khayat, H. Mesbah, Assessment of thixotropy of flowable and self-
consolidating concrete, ACI Materials Journal, 100 (2003).
[2] J. Assaad, K.H. Khayat, Variations of lateral and pore water pressure of self-consolidating
concrete at early age, ACI Materials Journal, 101 (2004).
[3] K. Khayat, J. Assaad, H. Mesbah, M. Lessard, Effect of section width and casting rate on
variations of formwork pressure of self-consolidating concrete, Mater Struct, 38 (2005) 73-78.
[4] G. Ovarlez, N. Roussel, A physical model for the prediction of lateral stress exerted by self-
compacting concrete on formwork, Mater Struct, 39 (2006) 269-279.
[5] J. Tchamba, S. Amziane, G. Ovarlez, N. Roussel, Lateral stress exerted by fresh cement paste
on formwork: laboratory experiments, Cement and Concrete Research, 38 (2008) 459-466.
[6] S. Kawashima, J.H. Kim, D.J. Corr, S.P. Shah, Study of the mechanisms underlying the fresh-
state response of cementitious materials modified with nanoclays, Construction and Building
Materials, 36 (2012) 749-757.
[7] P. Billberg, Form pressure generated by self-compacting concrete: influence of thixotropy and
structural behaviour at rest, (2006).
[8] N. Roussel, A thixotropy model for fresh fluid concretes: theory, validation and applications,
Cement and Concrete Research, 36 (2006) 1797-1806.
[9] N. Roussel, A theoretical frame to study stability of fresh concrete, Mater Struct, 39 (2006) 81-
91.
[10] J. Spangenberg, N. Roussel, J. Hattel, H. Stang, J. Skocek, M. Geiker, Flow induced particle
migration in fresh concrete: Theoretical frame, numerical simulations and experimental results on
model fluids, Cement and Concrete Research, 42 (2012) 633-641.
[11] G. Ovarlez, F. Mahaut, S. Deboeuf, N. Lenoir, S. Hormozi, X. Chateau, Flows of suspensions
of particles in yield stress fluids, Journal of Rheology (1978-present), 59 (2015) 1449-1486.

Bibliography
133
[12] H. Hafid, G. Ovarlez, F. Toussaint, P. Jezequel, N. Roussel, Assessment of potential concrete
and mortar rheometry artifacts using magnetic resonance imaging, Cement and Concrete Research,
71 (2015) 29-35.
[13] O.H. Wallevik, D. Feys, J.E. Wallevik, K.H. Khayat, Avoiding inaccurate interpretations of
rheological measurements for cement-based materials, Cement and Concrete Research, (2015).
[14] H. Okamura, M. Ouchi, Self-compacting concrete, J Adv Concr Technol, 1 (2003) 5-15.
[15] J.H. Kim, M. Beacraft, S.P. Shah, Effect of mineral admixtures on formwork pressure of self-
consolidating concrete, Cement and Concrete Composites, 32 (2010) 665-671.
[16] Y. Qian, S. Kawashima, Use of creep recovery protocol to measure static yield stress and
structural rebuilding of fresh cement pastes, Cement and Concrete Research, 90 (2016) 73-79.
[17] S. Kawashima, M. Chaouche, D.J. Corr, S.P. Shah, Rate of thixotropic rebuilding of cement
pastes modified with highly purified attapulgite clays, Cement and Concrete Research, 53 (2013)
112-118.
[18] S. Kawashima, M. Chaouche, D.J. Corr, S.P. Shah, Influence of purified attapulgite clays on
the adhesive properties of cement pastes as measured by the tack test, Cement and Concrete
Composites, (2014).
[19] Y. Qian, S. Kawashima, Flow onset of fresh mortars in rheometers: contribution of paste
deflocculation and sand particle migration, Cement and Concrete Research, 90 (2016) 97-103.
[20] N.A. Tregger, M.E. Pakula, S.P. Shah, Influence of clays on the rheology of cement pastes,
Cement and concrete research, 40 (2010) 384-391.
[21] R.D. Ferron, S. Shah, E. Fuente, C. Negro, Aggregation and breakage kinetics of fresh cement
paste, Cement and Concrete Research, 50 (2013) 1-10.
[22] R. Siddique, Performance characteristics of high-volume Class F fly ash concrete, Cement
and Concrete Research, 34 (2004) 487-493.
[23] S. Kawashima, P. Hou, D.J. Corr, S.P. Shah, Modification of cement-based materials with
nanoparticles, Cement and Concrete Composites, 36 (2013) 8-15.
[24] H.A. Barnes, J.F. Hutton, K. Walters, An introduction to rheology, Elsevier1989.

Bibliography
134
[25] N. Roussel, A. Lemaître, R.J. Flatt, P. Coussot, Steady state flow of cement suspensions: a
micromechanical state of the art, Cement and Concrete Research, 40 (2010) 77-84.
[26] E.C. Bingham, Fluidity and plasticity, McGraw-Hill Book Compny, Incorporated,1922.
[27] T.C. Papanastasiou, Flows of materials with yield, Journal of Rheology (1978-present), 31
(1987) 385-404.
[28] J. Assaad, K.H. Khayat, Assessment of Thixotropy of Self-Consolidating Concrete and
Concrete-Equivalent-Mortar- Effect of Binder Composition and Content, ACI Materials Journal,
101 (2004).
[29] J.J. Assaad, K.H. Khayat, Effect of viscosity-enhancing admixtures on formwork pressure
and thixotropy of self-consolidating concrete, ACI Materials Journal, 103 (2006).
[30] L.J. Struble, M.A. Schultz, Using creep and recovery to study flow behavior of fresh cement
paste, Cement and concrete research, 23 (1993) 1369-1379.
[31] F. De Larrard, C. Ferraris, T. Sedran, Fresh concrete: a Herschel-Bulkley material, Mater
Struct, 31 (1998) 494-498.
[32] M. Sonebi, Report on Measurements of Workability and Rheology of Fresh Concrete,
American Concrete Institute, 2010.
[33] N. Roussel, Correlation between yield stress and slump: comparison between numerical
simulations and concrete rheometers results, Mater Struct, 39 (2006) 501-509.
[34] N. Pashias, D. Boger, J. Summers, D. Glenister, A fifty cent rheometer for yield stress
measurement, Journal of Rheology (1978-present), 40 (1996) 1179-1189.
[35] N. Roussel, P. Coussot, “Fifty-cent rheometer” for yield stress measurements: from slump to
spreading flow, Journal of Rheology (1978-present), 49 (2005) 705-718.
[36] N. Roussel, C. Stefani, R. Leroy, From mini-cone test to Abrams cone test: measurement of
cement-based materials yield stress using slump tests, Cement and Concrete Research, 35 (2005)
817-822.
[37] N. Roussel, The LCPC BOX: a cheap and simple technique for yield stress measurements of
SCC, Mater Struct, 40 (2007) 889-896.

Bibliography
135
[38] T. Nguyen, N. Roussel, P. Coussot, Correlation between L-box test and rheological
parameters of a homogeneous yield stress fluid, Cement and Concrete Research, 36 (2006) 1789-
1796.
[39] ASTMC143, Standard Test Method for Slump of Hydraulic Cement Concrete, ASTM,
Philadelphia, PA, (2015).
[40] A.W. Saak, H.M. Jennings, S.P. Shah, A generalized approach for the determination of yield
stress by slump and slump flow, Cement and concrete research, 34 (2004) 363-371.
[41] A. C1611, standard test method for slump flow of self-consolidating concrete, ASTM
International, West Conshohocken, PA, 2014.
[42] N. Tregger, A. Gregori, L. Ferrara, S. Shah, Correlating dynamic segregation of self-
consolidating concrete to the slump-flow test, Construction and Building Materials, 28 (2012) 499-
505.
[43] L. Struble, G.-K. Sun, Viscosity of Portland cement paste as a function of concentration,
Advanced Cement Based Materials, 2 (1995) 62-69.
[44] Z. Toutou, N. Roussel, Multi scale experimental study of concrete rheology: from water scale
to gravel scale, Mater Struct, 39 (2006) 189-199.
[45] R. Flatt, Towards a prediction of superplasticized concrete rheology, Mater Struct, 37 (2004)
289-300.
[46] L.J. Struble, W.-G. Lei, Rheological changes associated with setting of cement paste,
Advanced Cement Based Materials, 2 (1995) 224-230.
[47] J. Yammine, M. Chaouche, M. Guerinet, M. Moranville, N. Roussel, From ordinary rhelogy
concrete to self compacting concrete: A transition between frictional and hydrodynamic
interactions, Cement and Concrete Research, 38 (2008) 890-896.
[48] L. Ferrari, J. Kaufmann, F. Winnefeld, J. Plank, Multi-method approach to study influence of
superplasticizers on cement suspensions, Cement and Concrete Research, 41 (2011) 1058-1066.
[49] N. Roussel, Rheology of fresh concrete: from measurements to predictions of casting
processes, Mater Struct, 40 (2007) 1001-1012.

Bibliography
136
[50] F. De Larrard, Concrete mixture proportioning: a scientific approach, CRC Press1999.
[51] H.A. Barnes, Thixotropy—a review, Journal of Non-Newtonian Fluid Mechanics, 70 (1997)
1-33.
[52] D.D. Joye, G.W. Poehlein, Characteristics of thixotropic behavior, Transactions of The
Society of Rheology (1957-1977), 15 (1971) 51-61.
[53] N. Roussel, G. Ovarlez, S. Garrault, C. Brumaud, The origins of thixotropy of fresh cement
pastes, Cement and Concrete Research, 42 (2012) 148-157.
[54] D.C. Cheng, Yield stress: a time-dependent property and how to measure it, Rheol Acta, 25
(1986) 542-554.
[55] P.C. Møller, J. Mewis, D. Bonn, Yield stress and thixotropy: on the difficulty of measuring
yield stresses in practice, Soft matter, 2 (2006) 274-283.
[56] D. Cheng, Measurement techniques for thixotropic properties, Paper to Joint British, Italian
and Netherlands, Society of Rheology, Amsterdam, British Society of Rheology, (1979).
[57] D.-H. Cheng, R. Richmond, Determination of the Thixotropic Property of an Emulsion Gel
Paint, Rheology, Springer1980, pp. 575-580.
[58] T. Davenport, R. Somper, The yield value and breakdown of crude oil gels, J. Inst. Pet, 57
(1971) 86-105.
[59] N. Gardner, The effect of superplasticizers and fly ash on formwork pressures, Forming
economical concrete buildings, (1982) 21.21-21.12.
[60] N. Gardner, Pressure of concrete on formwork-A review, ACI Journal Proceedings, ACI,
1985.
[61] S. Rodin, Pressure of Concrete on Formwork, Institution of Civil Engineering Proceedings,
Thomas Telford, 1952, pp. 709-746.
[62] J. Assaad, K.H. Khayat, H. Mesbah, Variation of formwork pressure with thixotropy of self-
consolidating concrete, ACI Materials Journal, 100 (2003).
[63] S. Kawashima, Nanomodification of cementitious materials: Fresh state and early age, (2013).

Bibliography
137
[64] K.H. Khayat, Z. Guizani, Use of viscosity-modifying admixture to enhance stability of fluid
concrete, ACI Materials Journal, 94 (1997).
[65] S. Rols, J. Ambroise, J. Pera, Effects of different viscosity agents on the properties of self-
leveling concrete, Cement and Concrete Research, 29 (1999) 261-266.
[66] M. Lachemi, K. Hossain, V. Lambros, P.-C. Nkinamubanzi, N. Bouzoubaâ, Self-
consolidating concrete incorporating new viscosity modifying admixtures, Cement and Concrete
Research, 34 (2004) 917-926.
[67] N. Roussel, F. Cussigh, Distinct-layer casting of SCC: The mechanical consequences of
thixotropy, Cement and Concrete Research, 38 (2008) 624-632.
[68] H. Barnes, K. Walters, The yield stress myth?, Rheol Acta, 24 (1985) 323-326.
[69] M.A. Schultz, L.J. Struble, Use of oscillatory shear to study flow behavior of fresh cement
paste, Cement and Concrete Research, 23 (1993) 273-282.
[70] Z. Sun, T. Voigt, S.P. Shah, Rheometric and ultrasonic investigations of viscoelastic
properties of fresh Portland cement pastes, Cement and Concrete Research, 36 (2006) 278-287.
[71] A. Betioli, P. Gleize, D. Silva, V. John, R. Pileggi, Effect of HMEC on the consolidation of
cement pastes: Isothermal calorimetry versus oscillatory rheometry, Cement and concrete
Research, 39 (2009) 440-445.
[72] A. Zosel, Rheological properties of disperse systems at low shear stresses, Rheol Acta, 21
(1982) 72-80.
[73] J. Baudez, P. Coussot, Abrupt transition from viscoelastic solidlike to liquidlike behavior in
jammed materials, Physical review letters, 93 (2004) 128302.
[74] P. Coussot, H. Tabuteau, X. Chateau, L. Tocquer, G. Ovarlez, Aging and solid or liquid
behavior in pastes, Journal of Rheology (1978-present), 50 (2006) 975-994.
[75] P. Coussot, Rheological aspects of the solid-liquid transition in jammed systems, Jamming,
Yielding, and Irreversible Deformation in Condensed Matter, Springer2006, pp. 69-90.
[76] P. Coussot, Q.D. Nguyen, H. Huynh, D. Bonn, Avalanche behavior in yield stress fluids,
Physical review letters, 88 (2002) 175501.

Bibliography
138
[77] P. Coussot, Q.D. Nguyen, H. Huynh, D. Bonn, Viscosity bifurcation in thixotropic, yielding
fluids, Journal of Rheology (1978-present), 46 (2002) 573-589.
[78] P. Coussot, L. Tocquer, C. Lanos, G. Ovarlez, Macroscopic vs. local rheology of yield stress
fluids, Journal of Non-Newtonian Fluid Mechanics, 158 (2009) 85-90.
[79] J. Baudez, S. Rodts, X. Chateau, P. Coussot, New technique for reconstructing instantaneous
velocity profiles from viscometric tests: Application to pasty materials, Journal of Rheology
(1978-present), 48 (2004) 69-82.
[80] R. Mendes, G. Vinay, G. Ovarlez, P. Coussot, Modeling the rheological behavior of waxy
crude oils as a function of flow and temperature history, Journal of Rheology (1978-present), 59
(2015) 703-732.
[81] F. Da Cruz, F. Chevoir, D. Bonn, P. Coussot, Viscosity bifurcation in granular materials,
foams, and emulsions, Physical Review E, 66 (2002) 051305.
[82] J.E. Wallevik, Rheology of particle suspensions: fresh concrete, mortar and cement paste with
various types of lignosulfonates, Fakultet for ingeniørvitenskap og teknologi2003.
[83] J. Mork, Rheology of fresh concrete: Its relationship to the relative content of cement, gypsum
and hemihydrate, Dr ing Thesis, NTNU Trondheim, (1994).
[84] G. Ovarlez, F. Bertrand, S. Rodts, Local determination of the constitutive law of a dense
suspension of noncolloidal particles through magnetic resonance imaging, Journal of Rheology
(1978-present), 50 (2006) 259-292.
[85] S. Jarny, N. Roussel, S. Rodts, F. Bertrand, R. Le Roy, P. Coussot, Rheological behavior of
cement pastes from MRI velocimetry, Cement and Concrete Research, 35 (2005) 1873-1881.
[86] G. Ovarlez, S. Rodts, A. Ragouilliaux, P. Coussot, J. Goyon, A. Colin, Wide-gap Couette
flows of dense emulsions: Local concentration measurements, and comparison between
macroscopic and local constitutive law measurements through magnetic resonance imaging,
Physical Review E, 78 (2008) 036307.
[87] N. Huang, G. Ovarlez, F. Bertrand, S. Rodts, P. Coussot, D. Bonn, Flow of wet granular
materials, Physical review letters, 94 (2005) 028301.

Bibliography
139
[88] J. Raynaud, P. Moucheront, J. Baudez, F. Bertrand, J. Guilbaud, P. Coussot, Direct
determination by nuclear magnetic resonance of the thixotropic and yielding behavior of
suspensions, Journal of Rheology (1978-present), 46 (2002) 709-732.
[89] S. Jarny, N. Roussel, R. Le Roy, P. Coussot, Modelling thixotropic behavior of fresh cement
pastes from MRI measurements, Cement and Concrete Research, 38 (2008) 616-623.
[90] H.A. Barnes, The'Yield Stress Myth?'Paper--21 Years On, Applied Rheology, 17 (2007)
43110-44250.
[91] H.A. Barnes, The yield stress—a review or ‘παντα ρει’—everything flows?, Journal of Non-
Newtonian Fluid Mechanics, 81 (1999) 133-178.
[92] J.P. Hartnett, R.Y. Hu, Technical note: the yield stress—an engineering reality, Journal of
Rheology (1978-present), 33 (1989) 671-679.
[93] P. Moller, A. Fall, V. Chikkadi, D. Derks, D. Bonn, An attempt to categorize yield stress fluid
behaviour, Philosophical Transactions of the Royal Society of London A: Mathematical, Physical
and Engineering Sciences, 367 (2009) 5139-5155.
[94] C.F. Ferraris, Measurement of the rheological properties of high performance concrete: state
of the art report, Journal of Research-National Institute of Standards and Technology, 104 (1999)
461-478.
[95] V. Mechtcherine, A. Gram, K. Krenzer, J.-H. Schwabe, C. Bellmann, S. Shyshko, Simulation
of fresh concrete flow using Discrete Element Method (DEM), Simulation of Fresh Concrete Flow,
Springer2014, pp. 65-98.
[96] F. Mahaut, S. Mokeddem, X. Chateau, N. Roussel, G. Ovarlez, Effect of coarse particle
volume fraction on the yield stress and thixotropy of cementitious materials, Cement and concrete
research, 38 (2008) 1276-1285.
[97] R. Lapasin, V. Longo, S. Rajgelj, Thixotropic behaviour of cement pastes, Cement and
Concrete Research, 9 (1979) 309-318.
[98] J.E. Wallevik, Rheological properties of cement paste: thixotropic behavior and structural
breakdown, Cement and concrete Research, 39 (2009) 14-29.

Bibliography
140
[99] J.E. Wallevik, Thixotropic investigation on cement paste: Experimental and numerical
approach, Journal of non-newtonian fluid mechanics, 132 (2005) 86-99.
[100] W.G. Lei, L.J. Struble, Microstructure and flow behavior of fresh cement paste, J Am Ceram
Soc, 80 (1997) 2021-2028.
[101] P. Møller, S. Rodts, M. Michels, D. Bonn, Shear banding and yield stress in soft glassy
materials, Physical Review E, 77 (2008) 041507.
[102] P. Banfill, The rheology of fresh mortar, Magazine of concrete research, 43 (1991) 13-21.
[103] M. Nehdi, S. Mindess, Applicability and significance of rheometric tests for rheology of
fluid and self-leveling high-strength concrete, Transportation Research Record: Journal of the
Transportation Research Board, 1574 (1997) 41-48.
[104] P.R. de Souza Mendes, R.L. Thompson, A critical overview of elasto-viscoplastic
thixotropic modeling, Journal of Non-Newtonian Fluid Mechanics, 187 (2012) 8-15.
[105] P. Billberg, Development of SCC static yield stress at rest and its effect on thelateral form
pressure, SCC 2005, Combining the Second North American Conference on the Design and Use
of Self-Consolidating Concrete and the Fourth International RILEM Symposium on Self-
Compacting Concrete, 2005, pp. 583-589.
[106] L. Nachbaur, J. Mutin, A. Nonat, L. Choplin, Dynamic mode rheology of cement and
tricalcium silicate pastes from mixing to setting, Cement and Concrete Research, 31 (2001) 183-
192.
[107] G. Meeten, Constant-force squeeze flow of soft solids, Rheol Acta, 41 (2002) 557-566.
[108] A. Kaci, R. Bouras, V. Phan, P. Andréani, M. Chaouche, H. Brossas, Adhesive and
rheological properties of fresh fibre-reinforced mortars, Cement and Concrete Composites, 33
(2011) 218-224.
[109] A. Kaci, R. Bouras, M. Chaouche, P. ani, H. Brossas, Adhesive and rheological properties
of mortar joints, Applied rheology, 19 (2009) 51970.

Bibliography
141
[110] Y.M. Abdelhaye, M. Chaouche, J. Chapuis, E. Charlaix, J. Hinch, S. Roux, H. Van Damme,
Tackiness and cohesive failure of granular pastes: Mechanistic aspects, The European Physical
Journal E, 35 (2012) 1-8.
[111] R. Siddique, Properties of concrete incorporating high volumes of class F fly ash and san
fibers, Cement and Concrete Research, 34 (2004) 37-42.
[112] R.K. Dhir, F.H. Hubbard, J.G. Munday, M.R. Jones, Characteristics of low-lime fly ashes
significant to their use in concrete, Special Publication, 91 (1986) 693-722.
[113] C.F. Ferraris, K.H. Obla, R. Hill, The influence of mineral admixtures on the rheology of
cement paste and concrete, Cement and concrete research, 31 (2001) 245-255.
[114] D.P. Bentz, C.F. Ferraris, M.A. Galler, A.S. Hansen, J.M. Guynn, Influence of particle size
distributions on yield stress and viscosity of cement–fly ash pastes, Cement and Concrete Research,
42 (2012) 404-409.
[115] E.P. Koehler, D.W. Fowler, C. Ferraris, Summary of concrete workability test methods,
2003.
[116] C.F. Ferraris, L.E. Brower, P. Banfill, Comparison of concrete rheometers: International
tests at LCPC (Nantes, France) in October, 2000, US Department of Commerce, National Institute
of Standards and Technology2001.
[117] D. Beaupré, F. Chapdelaine, P. Domone, E. Koehler, L. Shen, M. Sonebi, L. Struble, D.
Tepke, J. Wallevik, O. Wallevik, Comparison of concrete rheometers: International tests at MBT
(Cleveland OH, USA) in May 2003, (2004).
[118] EFNARC, Specification and guidelines for self-compacting concrete, Famham, Surrey GU9
7EN, UK, website: www.efnarc.org, ISBN 953973344, February 2002.
[119] G. Tattersall, The rheology of Portland cement pastes, British Journal of Applied Physics, 6
(1955) 165.
[120] A. Papo, The thixotropic behavior of white portland cement pastes, Cement and Concrete
Research, 18 (1988) 595-603.

Bibliography
142
[121] N. Roussel, Steady and transient flow behaviour of fresh cement pastes, Cement and concrete
research, 35 (2005) 1656-1664.
[122] P. Coussot, J. Raynaud, F. Bertrand, P. Moucheront, J. Guilbaud, H. Huynh, S. Jarny, D.
Lesueur, Coexistence of liquid and solid phases in flowing soft-glassy materials, Physical review
letters, 88 (2002) 218301.
[123] A.J. Liu, S.R. Nagel, Nonlinear dynamics: Jamming is not just cool any more, Nature, 396
(1998) 21-22.
[124] D.C. Cheng, F. Evans, Phenomenological characterization of the rheological behaviour of
inelastic reversible thixotropic and antithixotropic fluids, British Journal of Applied Physics, 16
(1965) 1599.
[125] P. Coussot, Q. Nguyen, H. Huynh, D. Bonn, Viscosity bifurcation in thixotropic, yielding
fluids, Journal of Rheology (1978-present), 46 (2002) 573-589.
[126] N. Roussel, R. Le Roy, P. Coussot, Thixotropy modelling at local and macroscopic scales,
Journal of non-newtonian fluid mechanics, 117 (2004) 85-95.
[127] J. Hu, A study of effects of aggregate on concrete rheology, PhD Thesis, Iowa State
University, Ames, Iowa, (2005).
[128] K. Khayat, Workability, testing, and performance of self-consolidating concrete, ACI
Materials Journal, 96 (1999).
[129] N.A. Libre, R. Khoshnazar, M. Shekarchi, Relationship between fluidity and stability of
self-consolidating mortar incorporating chemical and mineral admixtures, Construction and
Building Materials, 24 (2010) 1262-1271.
[130] I. Mehdipour, M.S. Razzaghi, K. Amini, M. Shekarchi, Effect of mineral admixtures on
fluidity and stability of self-consolidating mortar subjected to prolonged mixing time, Construction
and Building Materials, 40 (2013) 1029-1037.