characterization of low density glass filled epoxies - defense
TRANSCRIPT

See discussions, stats, and author profiles for this publication at: https://www.researchgate.net/publication/235210987
Characterization of Low Density Glass Filled Epoxies
Article · March 2003
CITATIONS
8READS
371
3 authors, including:
Rob Jensen
Johns Hopkins Medicine
77 PUBLICATIONS 6,838 CITATIONS
SEE PROFILE
All content following this page was uploaded by Rob Jensen on 02 June 2014.
The user has requested enhancement of the downloaded file.

ARMY RESEARCH LABORATORY
Characterization of Low Density Glass Filled Epoxies
by Matthew J. Quesenberry, Phillip H. Madison, and Robert E. Jensen
ARL-TR-2938 March 2003
Approved for public release; distribution is unlimited.
20030326 009

NOTICES
Disclaimers
The findings in this report are not to be construed as an official Department of the Army position unless so designated by other authorized documents.
Citation of manufacturer's or trade names does not constitute an official endorsement or approval of the use thereof.
Destroy this report when it is no longer needed. Do not return it to the originator.

Army Research Laboratory Aberdeen Proving Ground, MD 21005-5069
ARL-TR-2938 March 2003
Characterization of Low Density Glass Filled Epoxies
Matthew J. Quesenberry University of Delaware
Phillip H. Madison and Robert E. Jensen Weapons and Materials Research Directorate, ARL
Approved for public release; distribution is unlimited.

Acknowledgments
This research was supported in part by an appointment to the Research Participation Program at the U.S. Army Research Laboratory (ARL) administered by the Oak Ridge Institute for Science and Education through an interagency agreement between the U.S. Department of Energy and ARL. The authors also wish to acknowledge the ARL Composite Materials Research Materials Center of Excellence contract DAAD19-01-2-0001 to the University of Delaware Center for Composite Materials for partial funding of this project. Finally, the authors also would Uke to thank the late Professor Roy L. McCuUough for his support and advice during the project. He
will be missed.

Contents
Acknowledgments i
List of Figures iii
List of Tables iii
1. Introduction 1
2. Theory 3
2.1 Density 3
2.2 CTE 3
2.3 Composite Modulus 4 2.3.1 Hollow Glass Filler 7 2.3.2 Mixed Hollow and Solid Splieres 8
3. Experimental 9
3.1 Materials 9
3.2 Characterization 12
4. Results and Discussion 12
4.1 Solid vs. Hollow Glass Filler 12
4.1.1 Density 12 4.1.2 CTE 13 4.1.3 Young's Modulus 14
4.2 Combined Mixed Solid and Hollow Glass Filler 15
5. Conclusion 18
6. References 19
Report Documentation Page 21
11

List of Figures
Figure 1. A schematic of an encapsulating potting compound showing the coverage of a surface mounted device 1
Figure 2. Chemical structures of DGEBA epoxy, DICY curing agent, and 2-MI catalyst 9
Figure 3. Particle size distributions for the hollow (A) and solid (▼) glass fillers 10
Figure 4. SEM images of the (a) hollow and (b) solid glass fillers 11
Figure 5. Plots of composite density vs. volume fraction of filler for composites filled with hollow glass spheres (A) and soUd glass spheres (T). The ROM (equation 1) is used to predict the experimental densities. Density measurements were precise to ± 0.02 glcvc^ 13
Figure 6. Composite CTE vs. volume fraction of hollow glass filler (■). Composite CTE at Vf = 0.45 sohd glass filler (•) illustrated for comparative purposes. ROM and Schapery's lower bound fit to hollow glass filled composite data 14
Figure 7. Plot of experimental composite modulus vs. volume fraction of hollow glass filler along with theoretical predictions via the C-Combining Rule 15
Figure 8. Plot of experimental composite modulus vs. volume fraction of solid glass filler along with theoretical predictions via the S-Combining Rule, Voigt model, and Reuss model 16
Figure 9. Density, elastic modulus, and CTE, are plotted for the ternary composite of solid and hollow glass filler in epoxy. Overall Ff=0.45 16
List of Tables
Table 1. Summary of constitutive materials properties for the matrix epoxy, solid glass filler, and hollow glass filler 11
Table 2. Summary of experimental determinations of Vf, p, void content, CTE, and E 17
111

1. Introduction
Electronic devices are often encapsulated with a highly filled polymeric material, known as a potting compound, that primarily serves to protect the sensitive and conductive components from outside environmental effects (Figure 1) [1, 2]. The matrix polymer is typically composed of a thermosetting epoxy resin, which exhibits flow prior to cure and allows for continuous encapsulation of the electronic component. However, the use of a pure epoxy resin as an encapsulant material, or potting compound, alone is insufficient due to a relatively high coefficient of thermal expansion (CTE) (CTE > 60 x 10" ^/°C) [3]. The high values of CTE for the epoxy resins are inconsistent with those of the metallic electronic components and result in excessive residual stress and mechanical fatiguing of the electronic device during the cyclic heating and cooling encountered during normal operation [4]. Inclusion of particulate fillers has been used extensively to reinforce thermosetting epoxy resins to reduce cost, degree of shrinkage, CTE, and to raise the thermal conductivity and glass transition temperature [5]. In addition, particulate fillers also tend to increase stiffness relative to the bulk epoxy.
Device Potting compound
Circuit board
Figure 1. A schematic of an encapsulating potting compound showing the coverage of a surface mounted device.
Silica-based E-glass, which has a CTE of ~5 x 10" ^/°C, has been widely utiHzed as a particulate filler in epoxy-based resins to reduce the overall CTE of the potting compound, making it more suitable for electronics applications [2, 6]. These types of encapsulating compounds are inexpensive and commonly used in a wide range of commercial electronics products, from personal computers to cell phones [3]. However, silica based E-glass filler has a relatively high density (pf = 2.54 g/cm^) in comparison to the epoxy matrix (pn, -1.15 g/cm'^) and results in a substantial weight increase when the potting compound is heavily loaded [7]. Consequently, lower density filler that can also effectively reduce the CTE of the encapsulant system is desirable for mass-critical applications, such as those found in aerospace and aviation

electronics. Reduction in mass becomes an even more important issue for the high strain-rate applications of Army interest where there are critical momentum considerations.
While historically solid glass filler has been utiUzed in electronic potting compounds, recent studies have shown that hollow glass microspheres may be used as a lightweight alternative [1-3]. Such hollow glass fillers are readily available at low cost and are termed microspheres, hollow glass beads, hollow glass spheres, or microballoons. These microspheres, through variations in glass wall thickness and particle diameter, have low densities in the range of 0.1-1.0 g/cm^ [6]. Hollow glass microspheres have been widely employed as particulate filler in polymeric systems for over three decades [8]. Hollow glass microspheres have essentially the same CTE as their soUd counterparts, but have a much lower density [6]. Hollow glass microspheres were originally designed to decrease evaporation of oil and petroleum in large containers and as a means to increase buoyancy in ships and submarines. Hollow glass microspheres have more recently been exploited in the aeronautical, aerospace, automotive, civil and industrial engineering, and electronics industries as syntactic foams [9-12]. Incorporation of hollow glass microspheres as filler in polymeric matrixes to produce syntactic foams results in unique composite properties including good shear stiffness and strength, fatigue and impact resistance, low density, and high strength to weight ratio, which have largely facilitated their widespread application [13]. To obtain the low CTE and pc required, hollow glass filler may be substituted for the standard solid glass filler. However, one possible disadvantage of a hollow microsphere filled epoxy composite is a relatively low modulus and compressive strength when compared to traditional solid glass filler.
While epoxy-based potting compounds incorporating either pure solid glass filler or pure hollow microsphere filler have been studied extensively in the literature, little research has been performed involving mixed hollow microsphere/solid glass filler combinations. Potential electronic potting compound applications of U.S. Army interest may not necessarily be driven by the need to minimize the CTE or density at the cost of substantial loss in modulus, but rather may require a specific mixture of hollow and solid fillers to achieve a balance of these properties for optimum performance. This report will discuss the application of composite micromechanics in the analysis of pc, CTE, and Ec for a series of epoxy-based electionic potting compounds highly loaded with mixtures of hollow microspheres and solid glass filler. Knowledge of the fundamental thermal and mechanical properties of these systems will serve as a useful guide in the formulation of advanced electronic potting compounds suitable for the high strain-rate applications of U.S. Army interest.
2. Theory
2.1 Density
The density of a composite material (pc) can have dramatic effects on the global performance of the component during use. Addition of high-density filler will subsequently increase the overall composite density. Generally, aerospace applications require lightweight materials because they require less energy to propel. Typically, the overall density of a filled composite, regardless of whether the filler is hollow, solid, or a mixture of the two, can be accurately predicted by the Rule of Mixtures (ROM) in equation 1 [14]:
Pc=VfPf+V^P„, (1)
where
pf = filler density,
Pm = matrix density,
Ff = volume fraction of filler, and
Vra = volume fraction of matrix.
2.2 CTE
The coefficient of thermal expansion (a) is defined as the ratio of the change in length of a material per degree Celsius. Thermal expansion is of critical importance in design considerations, as it can dictate important parameters such as the composite filler size and shape [13]. Utilizing the CTE of the pure component matrix (am) and filler (af), several mathematical models will be applied to predict the composite CTE (ac) of the three filled epoxy systems, including the standard ROM, Schapery's upper and lower bounds, as well as the methodology of Dzenis and Maksimov [15, 16].
As a first order approximation to ac the standard ROM serves as an adequate model [1]. The ROM as apphed to CTE is described in equation 2:
cCc=Vfa^+V^a„. (2)
Schapery derived an exact relationship between composite bulk modulus (kc) and ac, which is based upon thermoelastic energy principles and complementary energy functions [15]. Since exact measurements of Kc are difficult to obtain, Schapery incorporated upper and lower bounds solutions to ttc as described by equations 3 and 4, respectively.

K,(K„-K:)(a,-aJ, ,,
where K" and K|. are calculated using Hashin's and Shtrikman's bounding solutions for bulk
modulus as described by equations 5 and 6:
V^ 3V,
K:=K,+-^--^^^—; (5)
K^-K/(3K,+4G,)
K' =K + ^ . (6) ^ I -^ *m
K,-K„ (3K„+4GJ
For predictive approaches in the determination of composite CTE the pure component CTE for a single hollow sphere (an) must first be estimated. Dzenis and Maksimov derived the following expression to approximate ah [16]:
a,, =a,+- "■h K:'-K:'
(7)
where K^ is the bulk modulus of hollow sphere, and c, s, and n again refer to the composite, shell, and nucleus properties, respectively. K^ is determined via an analogous modulus analysis by Dzenis and Maksimov, which will be described in a later section.
2.3 Composite Modulus
The Voigt and Reuss models are the two most basic models used to describe the properties of a two-phase composite system consisting of a spherical filler inclusion embedded in a continuous matrix material. The Voigt model, which is described by equations 8 and 9, assumes that the particulate inclusions and matrix material are subjected to constant strain. This model typically acts as an upper bound to experimental data for composite samples where the filler compliance is stiff in comparison to the matrix. Young's modulus is easily determined once v, G, and K are known, as described by equations 10-12. For each of these equations, the subscript c refers to the composite property.

K,=V„K„+V,K,; (8)
G.=V„0„+V,G,; (9)
E = ^!^, (.2) 3K + G
where
K = bulk modulus,
G = shear modulus,
V[ - volume fraction of filler,
Vm - volume fraction of matrix, and
V = Poisson's ratio.
The Reuss model (equation 13) assumes constant stress and typically acts as a lower bound for experimental data:
i:=i:^i7- <"' The estimates of the effective composite moduli determined from the Voigt and Reuss models represent extremes in behavior. The Voigt model attributes more significance to the "rigid" phase, whereas the Reuss model emphasizes the "compliant" phase. If the properties of the constituent components differ by an order of magnitude, the results obtained from these models will differ by an order of magnitude [17].
The conditions of constant stress or strain across the filler-matrix boundaries are thermodynamically impossible; therefore, more rigorous models have been proposed in an effort to increase the predictive accuracy of the Voigt and the Reuss models using bounding relationships or self-consistent field theories [18]. The modulus properties of the glass filled composites to be studied for this research will be modeled using the S-Combining Rule (equations 14-16), which was developed by McGee and McCullough in an effort to enhance the high-volume fraction accuracy of the thermodynamically derived Hashin and Shtrikman rigorous upper bound [19].

j_-ym.+:^+,vv(i-^)- (14) -"I '-'u
s =s,
s,=s„
/ 1 +
V„,(S™-Sf)
1-
,S,+V,(S„-S,)(l-Ti3,)
Vf(Sn,-Sf)
(15)
(16)
where the parameters Sf and Sm (i.e., Kf, Km, Gf, and Gm) are defined by
n 1 + Dj
'''"3(1-Dj)'
2(4-5T>.)
IGJ 15(l-Dj)
(17)
(18)
where
j = matrix (m) or the filler (f).
The S-Combining Rule is derived from a series expansion of the compliance matrix, thus the
parameter Sc refers to the composite bulk modulus (^c) or composite shear modulus (Gc).
Similar to the Voigt model, Ec is determined with appropriate substitution into equation 12. The
upper and lower bounds, Su and .Si, respectively, are modified forms of the Hashin-Shtrikman
upper and lower bounds for the bulk and shear modulus (i.e., Ku, Gu, K\, and Gi). Hashin and Shtrikman developed their models based on the assumptions of macroscopic isotropy and quasi-
homogeneity of the composite, where the shape of the filler is not a limiting factor [19]. These
conditions are generally applicable in the case of a spherical filler uniformly dispersed in a polymeric matrix [16]. The enhancement in the high volume fraction accuracy of the
S-Combining Rule is the result of an added phase continuity parameter (y), as defined by
equation 19:
^0
(19)
where
y = phase continuity parameter, and
(|)c = critical volume fraction.

Simply stated, these considerations imply that at some critical volume fraction of filler ((])c = 2/3 for the case of spherical filler) a transition in phase contiguity must occur so that in the neighborhood of Vf = ^c, the composite system will become more homogeneous with filler [18].
If the filler modulus is stiffer in comparison to the matrix modulus, then the S-Combining Rule compensates by shifting the predicted solution to the upper bound at higher volume loadings.
2.3.1 Hollow Glass Filler
The C-Combining Rule, shown in equation 20, is based upon the series expansion of the elastic constant matrix for property predictions [18]. This rule is appHcable for the case of a matrix filled with a more compliant filler, such as a matrix epoxy loaded with hollow glass spheres (i.e.,
Ei <£m).
P,=V„P„+V,P,+XpV,VJP,-P,), (20)
where
Xp = phase continuity parameter, and
P = bulk modulus (K) or shear modulus (G).
The upper and lower bounds, Pu and Pi, respectively, are determined using equations 21 and 22, where rjpf and rjpmare equivalent to equations 17 and 18 as shown previously.
1- Vf(P.-Pf)
P =P
P.-V,„(P„-Pf)ilp„ yJ
1 + P,-V,(P„-P,)ii
(21)
(22)
Similar to the y-term in the S-Combining Rule, the phase continuity parameter (kp) is utilized in the C-Combining Rule and calculated using equation 23 with a critical packing factor (^c) of 2/3.
I. 2^c-l
^,[1-20,(1-^JT1PJ (23)
All parameters used in the C-Combining Rule are well known and easily found in the literature, except for the pure component elastic modulus of the hollow glass filler (E[) and the pure component Poisson's ratio of the hollow glass filler (ttf). Thus, an accurate method for determining these values is needed.
Dzenis and Maksimov [16] postulated that the ratio between the hollow volume and the shell volume was equivalent to volume fraction (Vs), which is defined by equation 24:

V f r ^'
yR-rj (24)
where
r = inside shell diameter, and
R = outside shell diameter.
Values of Vs are then substituted into equations 25 and 26, which results in the pure component bulk (Kh) and shear moduli (Gh) of the hollow glass filler. Simply stated, this technique is treating the hollow glass filler as a "composite material" in itself. Once the "composite" properties of the hollow glass filler are known, traditional micromechanics for the global
properties of the particulate filled composite can then be determined.
^-=^-" 1 , 3(i-Tv:r^ ^''^ K„-K3 ^(3X3+463)
^'-^^-^~~i ^6(l\)(K3+2Gj- ^^^^ G^-G^"" 5G,(3K3+4GJ
The subscripts s and n refer to the shell and nucleus properties, respectively. For the case of the hollow glass spheres, the bulk and shear moduli of the nucleus, Kn and Gn, are both 0.0 GPa.
The pure component Young's modulus (E[) and Poisson's Ratio ("Uf) for the hollow glass filler
can now be calculated by substituting these predetermined values for the bulk and shear moduli into equations 11 and 12, respectively.
2.3.2 Mixed Hollow and Solid Spheres
A two-step algorithm, proposed by Jancar and DiBenedetto [20], was used to describe the elastic modulus of the ternary composite system, consisting of a mixture of solid and hollow glass spheres in an epoxy matrix. Assuming a completely homogeneous ternary mixture with perfect bonding, the modulus of the compliant hollow spherical glass filler in the epoxy matrix should first be determined. This is based on the similarity in modulus properties hollow glass spheres and the matrix epoxy. The resulring epoxy-hollow glass filler system will, in turn, assume the form of a new pseudo matrix and subsequently be filled with the more rigid solid glass filler inclusions. The C-Combining Rule, which is valid for a composite consisting of an epoxy matrix with hollow glass filler, will be used first, and then, the S-Combining Rule will be used to model the solid glass spheres within this system.

3. Experimental
3.1 Materials
The composite samples used in this project consisted of an epoxy matrix loaded with varying amounts of solid and hollow glass filler. The epoxy utilized was based upon diglycidyl ether of bisphenol A (DGEBA).* The curing agent dicyanodiamide (DICY)+ and the catalyst 2-methyl imidazole (2-MI) * were also used in this epoxy resin system. The DICY and 2-MI were added to the DGEBA epoxy resin in concentrations of 6 and 1 parts per hundred (phr) resin by weight, respectively. Differential scanning calorimetry (DCS)^ (heating rate =10 °C/min) was performed on a neat sample of the cured matrix epoxy system, which yielded a glass transition temperature (Tg) of 118 °C, which was determined at the inflection point of the heat flow vs. temperature plot. Figure 2 depicts the chemical structures for the epoxy, curing agent, and catalyst used.
H I
NH
DICY
DGEBA
QH3
\=J
2-MI
Figure 2. Chemical structures of DGEBA epoxy, DICY curing agent, and 2-MI catalyst.
The solid glass spheres were obtained from Potters Industries Inc. under their registered trade name Spheriglass. The modulus, Poisson's ratio, and CTE of these spheres are reported in Hterature to have values of 72 GPa, 0.23, and 0.5 x 10 V°C, respectively [6]. The hollow glass spheres** had a density of 0.37 g/cm^, as reported by the manufacturer. The modulus and Poisson's ratio for the hollow glass spheres were calculated to be 1.99 GPa and 0.21, respectively, via the theoretical procedures previously described by equations 24-26. Although gas is present within the cavity of the hollow glass spheres, for simplification purposes the center
DER 332, Dow Chemical Co. t Dyhard lOOS, SKW Chemicals.
* Avocado Research Chemicals, Ltd.
^ DSC 2980, TA Instruments.
K37 hoUow microspheres, 3M Corp.

volume was assumed to be a vacuum. The outer shell properties were assumed as those of standard E-glass, thus a CTE for the hollow microspheres of 3.25 x 10^^/°C can then be calculated using equation 7. Figure 3 provides a representation of the difference in particle size between the two types of glass filler. The particle size distributions were obtained using a Horiba Instruments LA 900 Ught scattering particle size analyzer. Lx)w concentrations of filler were dispersed in water with the aid of a high molecular weight block copolymer surfactant* with the use of an ultrasonicator. The particle size distributions were measured immediately after dispersion to ensure that negligible setding or floating of the particles occurred due to mismatch in density when compared to the aqueous dispersing medium. Both the solid and hollow glass spheres displayed bimodal particle size distributions, with the soUd spheres biased towards slightly smaller diameters than the hollow spheres. Scanning electron microscopy (SEM) was also used to examine the particle size and shape of the hollow and soUd spheres, as
seen in Figure 4.
o c CD 3 CT CD
12
10
6-
-A— hollow glass spheres ■^— solid glass spheres
A
/ V h
\\ \ ̂ t»»MMI
0.1 r-ny-
1 —I 1 I I I I J
10 ■'^T—
100
Diameter (^.m)
Figure 3. Particle size distributions for the hollow (A) and solid (▼) glass fillers.
Table 1 summarizes the pure component properties for each of the materials used in the analysis of composite properties, DGEB A-based matrix epoxy, solid glass spheres, and hollow glass spheres.
Solid or hollow glass spheres were added in varying volume fractions to this initial epoxy mixture. For the solid/hollow filler blends, the solid and hollow glass fillers were added to the matrix epoxy at volume ratios of 0:100, 25:75, 50:50, 75:25, and 100:0, respectively, while
■piuronicF-108, BASF Corp.
10

Figure 4. SEM images of the (a) hollow and (b) solid glass fillers.
Table 1. Summary of constitutive materials properties for the matrix epoxy, solid glass filler, and hollow glass filler.
Property Matrix Solid Glass Filler Hollow Glass Filler CTE(xlO'*/°C) 70.7' 0.5" 3.25' E (GPa) 2.45" 76" 1.99' V 0.33" 0.23" 0.21' G (GPa) 0.92' 30.9" 0.82' K (GPa) 2.47' 46.9" 1.15' P (g/cm^) 1.19" 2.54" 0.37" " Experimental value as described in section 3.2. "Literature value [6]. 'Calculated value [16]. '' As reported by manufacturer.
maintaining an overall constant volume fraction of filler equal to 0.45. Additionally, 3 phr of treated fumed silica* was added to the epoxy system to prevent settling or floating of the solid or hollow glass spheres during cure of the matrix system. All samples were mixed thoroughly using a Ross double planetary mixer and subsequently degassed at 50 °C under vacuum until no visible air bubbles could be observed. Tensile specimens [21] were cured in silicon molds between polytetrafluoroethylene sheets at 80 °C for 2 hr and further postcured at 160 °C for 1 hr. The samples were allowed to slow cool in the powered-off oven to minimize residual stresses after completion of the cure cycle. The samples were carefully removed from the molds and polished to remove any rough edges and then stored in a desiccator at room
temperature.
■ TS-720, Cabot Corp.
11

3.2 Characterization
The densities and void contents of all of the samples were determined using buoyancy techniques according to American Society for Testing and Materials (ASTM) standard test methods [22, 23]. Water was used as the submersion hquid for samples where Pc > 1. For the samples where Pc < 1, hexane was used as the immersion liquid. A minimum of five replicates were
performed for each density and void content measurement.
A Perkin Elmer thermal mechanical analyzer (TMA-7) was used to determine the CTE for each sample according to ASTM E831-00 [24]. The samples were tested using an expansion probe from room temperature to 250 °C at 10 °C/min. The CTE values were determined from the slope of the expansion vs. temperature curve. The CTE values reported were calculated by averaging the results from two samples at each particular filler volume fraction.
An Instron 4505 equipped with a 1000-lb load cell was used to determine the Young's modulus of the samples according to ASTM method D638-01 [21]. The samples were pulled at a strain rate of 0.05 in/min at room temperature until either a load of 100 lb was reached or the sample failed. Stress and strain data were collected, and E was calculated by determining the slope of the elastic region of the stress vs. strain curve. Five samples were run at each particular filler volume fraction to obtain the average reported E values.
4. Results and Discussion
4.1 Solid vs. Hollow Glass Filler
4.1.1 Density
The first stage of composite analysis was the determination of the effect of volume fraction of filler to the density of the composite. The results of the density analysis, including both the experimental data and the ROM predictive model, are shown in Figure 5. The standard deviation associated with each data point at each particular volume fraction was negligible (<0.02 g/cm for all samples studied). As can be seen in Figure 5, the standard ROM for density provides an accurate prediction of composite density. As expected, the density of the composites containing solid glass increased with increasing volume fraction of filler, while the density of the composites containing hollow glass filler showed the opposite trend. This opposite trend in density becomes more critical at higher volume fractions. For example, it has been shown here that at Vi - 0.45, the hollow glass sphere filled resins had a considerably lower density (0.83 g/cm^) when compared to the solid glass filled resins (1.79 g/cm^). This is significant as potting compounds are typically loaded with filler at concentrations greater than this point.
12

2.5- A hollow glass filler ▼ solid glass filler
2.0- ..---""
§ 1.5-
o =^ 1.0-
0.5-
1 ■ 1 ' 1 • 1 ' 1 • 1
3.0 0.2 0.4 0.6 0.8 1.0
^ Filler
Figure 5. Plots of composite density vs. volume fraction of filler for composites filled with hollow glass spheres (A) and solid glass spheres (T). The ROM (equation 1) is used to predict the experimental densities. Density measurements were precise to ± 0.02 g/cm^
4.1.2 CTE
The CTE of the composites was also examined as a function of the volume fraction of filler loaded into the system. Figure 6 displays a plot of CTE vs. volume fraction for composite samples filled with hollow glass microspheres, along with ROM (equation 2) and Schapery's lower bound (equation 4) predictive models. The results for the hollow glass filler indicate that the composite CTE decreases in a similar manner in comparison to reported results for encapsulants loaded with solid glass fillers. Figure 6 shows a single data point for a composite loaded with solid glass filler at Vf = 0.45, which lies within experimental error of the CTE values measured for the hollow glass filler (37.3 x 10^^/°C vs. 39.1 x 10~V°C, respectively). These values correspond well with a value of -35 x 10"^/°C as reported in the literature [1].
The model predictions by the ROM and Schapery's bounding relationships also proved interesting. The simple ROM provides a reasonable approximation of the experimental results. As a more thermodynamically correct rigorous approximation, Schapery's bounding relationships failed to describe the composite CTE when hollow filler was incorporated into the matrix phase. Schapery's lower bound predicts CTE values greater than the ROM expression. Additionally, the predicted CTE values calculated from both Schapery's upper bound (not shown in Figure 6) and lower bound expressions for composites containing hollow glass overlay each
13

1 ' I ' 1 • 1 • 1 '. 70- K. -
60- rx\ -
O 50- 0
CD 40- o
s 3°"
-
LU H 20-
10-
0-
■ •
hollow glass filler solid glass filler
■ ROM (hollow) - Shapery's lower bound (hollow)
I.I.I
( D.O 1 ' 1 ' 1 ' 1 ■ 1
0.2 0.4 0.6 0.8 1.C
U, Filler
Figure 6. Composite CTE vs. volume fraction of hollow glass filler (■). Composite CTE at Vf = 0.45 solid glass filler (») illustrated for comparative purposes. ROM and Schapery's lower bound fit to hollow glass filled composite data.
Other. The breakdown of Schapery's bounding methods for CTE in the case of a hollow filler are not surprising considering that these relationships are dependent upon Gf and K{, which in the case of the hollow glass filler are lower values than the matrix phase. As will be seen in section 4.1.3, bounding methods for response prediction are more accurate when the properties of the phases differ by a large extent. Despite the difficulty in applying the bounding relationships to the experimental data, these results indicate that there is no significant difference in composite CTE when either hollow or solid glass filler is used.
4.1.3 Young's Modulus
The experimental and predicted Young's modulus values were determined for both solid and hollow glass filled composites. Figure 7 shows a plot of Ec vs. volume fraction of hollow glass filler and values calculated utilizing the C-Combining Rule. This plot clearly shows that the experimentally determined elastic modulus values do not correlate well with those calculated using the C-Combining Rule. The predictive model indicates that the composite elastic modulus should decrease with increasing volume fraction of hollow glass filler; however, the experimental data shows little to no change with increasing volume fraction of filler. The breakdown of the bounding relationship to accurately predict Ec arises from the negligible difference in magnitude between modulus of the epoxy matrix and hollow glass filler.
14

3.2- 1 ' 1 ' 1 ' 1 ' 1 ' 1
A hollow glass filler " C-Combining rule ■
3.0- 1
2.8-
1 T [ 1 1
1? & 2.6-
^" 2.4^
1 >.
2.2-
2.0-
C 1 1 1
).0 0.2 0.4 0.6 0.8 1.C
l^, Hollow Glass Filler
Figure 7. Plot of experimental composite modulus vs. volume fraction of hollow glass filler along with theoretical predictions via the C-Combining Rule.
Figure 8 shows the plot of experimentally determined elastic composite modulus vs. volume fraction of solid glass filler and calculated values determined using the S-Combining Rule, the Voigt model, and the Reuss model. This plot shows the superior accuracy of the S-Combining Rule in comparison to the Voigt and Reuss models when the high modulus solid glass filler is incorporated into the matrix epoxy phase. Unlike the hollow glass filler, the composite modulus is increased significantly for the case of solid glass filler. For example, at 0.45 volume fraction of filler, the modulus of the hollow glass sphere composite and the solid glass sphere composite were experimentally determined to be -2.7 and 10.1 GPa, respectively.
4.2 Combined Mixed Solid and Hollow Glass Filler
Binary filler combinations of solid and hollow glass were added to the matrix epoxy to yield ternary composite systems. For these mixed filler systems, the volume fraction of filler was held constant at 0.45 and the ratio of solid to hollow glass filler was varied. As mentioned in section 3, the solid and hollow glass fillers were added to the matrix epoxy at volume ratios of 0:100, 25:75, 50:50, 75:25, and 100:0, respectively. Each of the three material properties previously discussed, Pc, CTE, and Ec, for the single filler systems were determined for the ternary
composites and are shown in Figure 9 and summarized in Table 2.
15

15
12-
CO 9 a. CD
1 ■"?—1"
T solid glass filler Voigt model
Reuss model S-Combining rule
—1 1 1 1 1 1 1 1 1 1 1—
0.0 0.1 0.2 0.3 0.4 0.5
1/ Solid Glass Filler
Figure 8. Plot of experimental composite modulus vs. volume fraction of solid glass filler along with theoretical predictions via the S-Combining Rule, Voigt model, and Reuss model.
I/, Hollow Glass Spheres 0.0 0.2 0.4 0.6 0.8
CO CL o
V Solid Glass Spheres
Figure 9. Density, elastic modulus, and CTE, are plotted for the ternary composite of solid and hollow glass filler in epoxy. Overall V{ = 0.45.
16

Table 2. Summary of experimental determinations of Vf, p, void content, CTE, and E.
Filler Vf
(g/cm^) Void Content
(%) CTE
(X 10"V°C) (GPa) Neat — 1.19 0.002 70.7 2.45 Hollow 0.15 1.08 1.02 57.2 2.70 Hollow 0.25 1.01 2.43 48.6 3.07 Hollow 0.35 0.94 3.65 42.2 2.61 Hollow 0.45 0.83 1.18 39.1 2.67 Hollow 0.55 0.75 1.13 34.7 2.80 Solid 0.05 1.21 0.24 — 3.13 Solid 0.15 1.34 1.16 — 3.90 Solid 0.25 1.49 0.50 — 4.99 Solid 0.29 1.55 0.14 — 5.70 Solid 0.45 1.79 0.51 37.3 10.1 Solid 0.50 1.84 1.12 — 12.9 Hollow/solid (25;75) 0.46 1.62 0.76 36.9 7.97 Hollow/solid (50:50) 0.43 1.31 0.49 37.1 4.83 Hollow/solid (75:25) 0.46 1.01 1.17 39.0 3.66
Note: Error values are not tabulated, but are illustrated in all relative plots.
The overall composite CTE for the ternary mixtures remained constant at -38.3 x 10 Vc across
the entire range of filler combinations. This result is as expected as the CTE of the hollow and glass filler are nearly identical. Also as expected, Pc decreases significantly as the relative volume fraction of hollow glass within the binary filler mixtures increases. The experimental composite density at a soUd to hollow filler ratio of 50:50 is 1.31 g/cm , which is 0.48 g/cm lower than the case of pure solid filler added to the matrix system at the identical volume fraction. The ROM (equation 1) was determined for the ternary mixtures and provided an excellent fit of pc.
Due to the breakdown of the C-Combining Rule to accurately model the composite modulus when hollow glass filler was incorporated into the matrix epoxy, the matrix epoxy and hollow glass filler were assumed to have the same modulus (2.45 GPa). Thus, in fitting the S-Combining Rule to the ternary composite system, the methodology proposed by Jancar and DiBenedetto [20] is simpUfied by adjusting the matrix volume fraction to reflect the combined volume of epoxy resin and hollow glass filler while the filler volume fraction is composed solely of soHd glass. After the adjustments in volume fraction are made, the S-Combining Rule provided an excellent prediction of the ternary composite modulus. As expected, the modulus decreases as the relative volume fraction of hollow glass filler increases.
17

5. Conclusion
The purpose of this work was to predict and determine the thermal and mechanical properties of a glass-epoxy composite to be used for electronic potting compounds. Through material characterization, key mechanical and thermal properties were determined, including composite density, modulus, and coefficient of thermal expansion.
The density of the composites containing hollow glass spheres decreased with increasing filler volume fraction, which is opposite for the case of solid glass filler. This characteristic is highly desirable for electronic potting compounds, because decreasing the mass of the system reduces the inertial forces exerted during high-stress applications. The overall weight of the electronic device will also be reduced, therefore reducing the energy needed to propel the device. At a volume fraction of filler of 0.45, the density of the composites incorporating hollow glass spheres was one-half that observed for the composites loaded with solid glass filler.
Composite CTE was not compromised by incorporation of hollow glass filler when compared to solid glass filled counterparts. At a volume fraction of 0.45, the CTE was determined to be -38.3 X 10 V°C for both the composites filled with soUd and hollow glass.
Analysis of the mechanical properties of the systems indicated that the composites loaded with hollow glass spheres showed an elastic modulus that was approximately three times lower than those filled with the solid glass. The high strain-rate properties of the potting compounds were not determined at this time, and modulus may or may not be a critical factor to device survivability. However, as the study of the ternary composite indicated, there could possibly be a combination of hollow and solid glass filler that strikes a balance between decreased density and adequate modulus properties.
18

6. References
1. Wong, C. P., and R. S. Bollampally. "Thermal Conductivity, Elastic Modulus, and Coefficient of Thermal Expansion of Polymer Composites Filled With Ceramic Particles for Electronic Packaging." Journal of Applied Polymer Science, vol. 74, pp. 3396-3403, 1999.
2. Harper, C. A. (ed.) Electronic Packaging and Interconnection Handbook, 3rd Ed. New York: McGraw-Hill, 2000.
3. Zweben, C. "Metal-Matrix Composites for Electronic Packaging." Journal of Electronics Materials, vol. 44, pp. 15-23, 1992.
4. Shen, Y. L., A. Needleman, and S. Suresh. "Coefficients of Thermal Expansion of Metal- Matrix Composites for Electronic Packaging." Metallurgical and Materials Transactions A, vol. 25A, pp. 839-849, 1994.
5. Garg, A. C, and Y. W. Mai. "Failure Mechanisms in Toughened Epoxy Resins—A Review." Composites Science and Technology, vol. 31, pp. 179-223, 1988.
6. Smith, J. C. "Experimental Values for the Elastic Constants of a Particulate-Filled Glassy Polymer." Journal of Applied Physics and Chemistry, vol. 80A, pp. 45-49, 1976.
7. Kim, H. S., and M. A. Khamis. "Fracture and Impact Behaviours of the Hollow Micro- sphere/Epoxy Resin Composites." Composites: Part A, vol. 32, pp. 1311-1317, 2001.
8. Volk, M. C. "Syntactic Foams." Encyclopedia of Polymer Science and Technology, Ntw York: Reinhold, vol. 8, pp. 752-757, 1969.
9. Hutov, F. A. "Syntactic Polymer Foams." Advances in Polymer Science, vol. 73, pp. 63-123,1986.
10. DeRuntz, J. A., and O. Hoffman. "The Static Strength of Syntactic Foams." Journal of Applied Mechanics, Transactions of the ASME, pp. 551-557, 1969.
11. Rizzi, E., E. Papa, and A. Corigliano. "Mechanical Behavior of a Syntactic Foam: Experiments and Modeling." International Journal of Solids and Structures, vol. 37, pp. 5773-5794, 2000.
12. Lee, H., and K. Neville. "Epoxy-Resin Foams." Plastic Foams, edited by K. C. Frisch and J. H. Saunders, New York: Marcel Dekker, pp. 701-733, 1973.
13. Stemfield, A. "New Types of Sources of Micro-Spheres Can Help Widen RP Markets." Modem Plastics International, vol. 12, pp. 43^5, 1982.
14. Peters, S. T. (ed.) Handbook of Composites. New York: Chapman & Hall, 1998.
19

15. Schapery, R. A. "Thermal Expansion Coefficients of Composite Materials Based on Energy Principles." Journal of Composite Materials, vol. 2, pp. 380, 1968.
16. Dzenis, Yu. A., and R. D. Maksimov. "Prediction of the Physical-Mechanical Properties of Hollow-Sphere Reinforced Plastics." Mec/?fl«/c.s of Composite Materials, vol. 27, pp. 263-
270, 1991.
17. McGee, S., and R. L. McCullough. "Combining Rules for Predicting the Thermoelastic Properties of Particulate Filled Polymers, Polyblends, and Foams." Polymer Composites,
vol. 2, pp. 149-161,1981.
18. Hill, R. "Continuum Micro-Mechanics of Elastoplastic Polycrystals." Journal of the
Mechanics and Physics of Solids, vol. 13, pp. 89, 1965.
19. Hashin, Z., and S. Shtrikman. "A Variational Approach to the Theory of the Elastic Behaviour of Multiphase Materials." Journal of the Mechanics and Physics of Solid,
vol. 11, pp. 127-140, 1963.
20. Jancar, J., and A. T. DiBenedetto. "The Mechanical Properties of Ternary Composites of Polypropylene With Inorganic Fillers and Elastomer Inclusion." Journal of Materials
Science, vol. 29, pp. 4651^658, 1994.
21. American Society for Testing and Materials. "Standard Test Method for Tensile Properties of Plastics." ASTM D638-01, West Conshohoken, PA, 2001.
22. American Society for Testing and Materials. "Standard Test Methods for Density and Specific Gravity (Relative Density) of Plastics by Displacement." ASTM D792-00, West
Conshohoken, PA, 2001.
23. American Society for Testing and Materials. "Standard Test Methods for Void Content of Reinforced Plastics." ASTM D2734-94, West Conshohoken, PA, 1994.
24. American Society for Testing and Materials. "Standard Test Method for Linear Thermal Expansion of Solid Materials by Thermomechanical Analysis." ASTM E831-00, West
Conshohoken, PA, 2001.
20
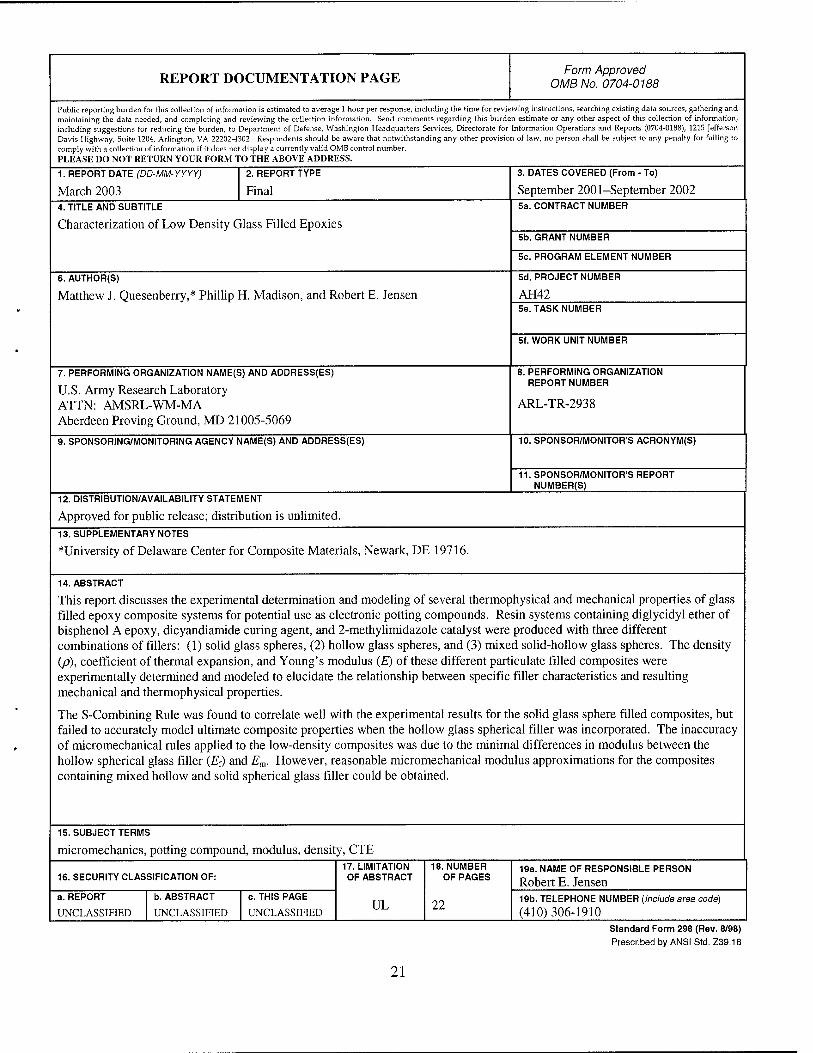
REPORT DOCUMENTATION PAGE Form Approved
0MB No. 0704-0188
Public reporting burden for this collection of information is estimated to average 1 hour per response, including the time for reviewing instructions, searching existing data sources, gathering and maintaining the data needed, and completing and reviewing the collection information. Send comments regarding this burden estimate or any other aspect of this collection of information, including suggestions for reducing the burden, to Department of Defense, Washington Headquarters Ser\'ices, Directorate for Information Operations and Reports (0704-0188), 1215 Jefferson Davis Highway, Suite 1204, Arlington, VA 22202-4302, Respondents should be aware that notwithstanding any other provision of law, no person shall be subject to any penalty for failing to comply with a collection of information if it does not display a currently valid OMB control number. PLEASE DO NOT RETURN YOUR FORM TO THE ABOVE ADDRESS.
1. REPORT DATE (DD-MM-YYYY)
March 2003
2. REPORT TYPE
Final
3. DATES COVERED (From - To)
September 2001-September 2002 4. TITLE AND SUBTITLE 5a. CONTRACT NUMBER
Characterization of Low Density Glass Filled Epoxies 5b. GRANT NUMBER
5c. PROGRAM ELEMENT NUMBER
6. AUTHOR(S)
Matthew J. Quesenberry,* Phillip H. Madison, and Robert E. Jensen
5d. PROJECT NUMBER
AH42 5e. TASK NUMBER
5f. WORK UNIT NUMBER
7. PERFORMING ORGANIZATION NAME(S) AND ADDRESS(ES)
U.S. Army Research Laboratory ATTN: AMSRL-WM-MA Aberdeen Proving Ground, MD 21005-5069
8. PERFORMING ORGANIZATION REPORT NUMBER
ARL-TR-2938
9. SPONSORING/MONITORING AGENCY NAME(S) AND ADDRESS(ES) 10. SPONSOR/MONITOR'S ACRONYM(S)
11. SPONSOR/MONITOR'S REPORT NUMBER(S)
12. DISTRIBUTION/AVAILABILITY STATEMENT
Approved for public release; distribution is unlimited. 13. SUPPLEMENTARY NOTES
*University of Delaware Center for Composite Materials, Newark, DE 19716.
14. ABSTRACT
This report discusses the experimental determination and modeling of several thermophysical and mechanical properties of glass filled epoxy composite systems for potential use as electronic potting compounds. Resin systems containing diglycidyl ether of bisphenol A epoxy, dicyandiamide curing agent, and 2-methylimidazole catalyst were produced with three different combinations of fillers: (1) solid glass spheres, (2) hollow glass spheres, and (3) mixed solid-hollow glass spheres. The density (/)), coefficient of thermal expansion, and Young's modulus (£) of these different particulate filled composites were experimentally determined and modeled to elucidate the relafionship between specific filler characteristics and resulting mechanical and thermophysical properties.
The S-Combining Rule was found to correlate well with the experimental results for the solid glass sphere filled composites, but failed to accurately model ultimate composite properties when the hollow glass spherical filler was incorporated. The inaccuracy of micromechanical rules applied to the low-density composites was due to the minimal differences in modulus between the hollow spherical glass filler (E[) and E^. However, reasonable micromechanical modulus approximations for the composites containing mixed hollow and solid spherical glass filler could be obtained.
15. SUBJECT TERMS
micromechanics, potting compound, modulus, density, CTE
16. SECURITY CLASSIFICATION OF:
a. REPORT
UNCLASSIFIED
b. ABSTRACT
UNCLASSIFIED
c. THIS PAGE
UNCLASSIFIED
17. LIMITATION OF ABSTRACT
UL
18. NUMBER OF PAGES
22
19a. NAME OF RESPONSIBLE PERSON
Robert E. Jensen 19b. TELEPHONE NUMBER [Include area code)
(410) 306-1910 standard Form 298 (Rev. 8/98) Prescribed by ANSI Std. Z39.18
21

INTENTIONALLY LEFT BLANK.
22
View publication statsView publication stats