characterization of gas station emissions - acpd - · pdf fileacpd 11, 14719–14746, 2011...
TRANSCRIPT

ACPD11, 14719–14746, 2011
Characterization ofgas stationemissions
J. Zheng et al.
Title Page
Abstract Introduction
Conclusions References
Tables Figures
J I
J I
Back Close
Full Screen / Esc
Printer-friendly Version
Interactive Discussion
Discussion
Paper
|D
iscussionP
aper|
Discussion
Paper
|D
iscussionP
aper|
Atmos. Chem. Phys. Discuss., 11, 14719–14746, 2011www.atmos-chem-phys-discuss.net/11/14719/2011/doi:10.5194/acpd-11-14719-2011© Author(s) 2011. CC Attribution 3.0 License.
AtmosphericChemistry
and PhysicsDiscussions
This discussion paper is/has been under review for the journal Atmospheric Chemistryand Physics (ACP). Please refer to the corresponding final paper in ACP if available.
Characterization of gas station emissionsduring the CAREBeijing 2008 field study
J. Zheng1, T. Zhu2, R. Zhang1,2, M. Wang2, C.-C. Chang3, M. Shao2, and M. Hu2
1Department of Atmospheric Sciences, Texas A&M University, Texas 77843, USA2State Key Laboratory of Environmental Simulation and Pollution Control, College ofEnvironmental Sciences and Engineering, Peking University, Beijing, 100871, China3Research Center for Environmental Changes, Academia Sinica, Taipei 11529, Taiwan
Received: 22 April 2011 – Accepted: 1 May 2011 – Published: 13 May 2011
Correspondence to: T. Zhu ([email protected])
Published by Copernicus Publications on behalf of the European Geosciences Union.
14719

ACPD11, 14719–14746, 2011
Characterization ofgas stationemissions
J. Zheng et al.
Title Page
Abstract Introduction
Conclusions References
Tables Figures
J I
J I
Back Close
Full Screen / Esc
Printer-friendly Version
Interactive Discussion
Discussion
Paper
|D
iscussionP
aper|
Discussion
Paper
|D
iscussionP
aper|
Abstract
A proton transfer-reaction mass spectrometer (PTR-MS) onboard a mobile laboratorywas used to conduct emission measurements at eight gas stations in Beijing duringthe CAREBeijing 2008 campaign. Benzene, toluene, C8-, C9-aromatics, methanol,MTBE, butenes and pentenes were the major volatile organic compounds (VOCs) de-5
tected during the measurements. An inter-comparison between the PTR-MS and anon-line GC/MS/FID system was also conducted and the result showed good agree-ment between the two instruments (Interception <0.08 ppbv, 0.72<Slope<0.95, andR2 > 0.92). A Gaussian point source plume model was applied to evaluate the VOCsemission rates. The results showed that on average about 4.5 mt of gasoline were10
emitted from gas stations in Beijing per day. The estimated emission factor (EF) forgas stations due to refueling processes was about 0.5 kg t−1, which was significantlylower than a value of 2.49 kg t−1 obtained in 2002, indicating a successful implementa-tion of vapor recovery system in the gas stations of Beijing. On average, about 18 ppbvof benzene has been detected at one gas station, twice as much as the US Envi-15
ronmental Protection Agency (EPA) recommended safe chronic exposure level andimplying a potential public health concern. MTBE and aromatics were found to be themajor antiknocking additives used in gasoline supplied in Beijing. Our results revealthat emissions from gas stations represent an important source for VOCs in megacityBeijing and need to be properly included in emission inventories to assess their roles20
in photochemical ozone production and secondary organic aerosol formation. Further-more, promoting methanol-blended fuel in Beijing can be an effective way to reducetoxic air pollutants emission.
1 Introduction
Rapid urbanization in the Beijing area leads to a fast growth in automobile population.25
At an annual rate of 14.5 % (Hao et al., 2006), it is projected that the number of vehicles
14720

ACPD11, 14719–14746, 2011
Characterization ofgas stationemissions
J. Zheng et al.
Title Page
Abstract Introduction
Conclusions References
Tables Figures
J I
J I
Back Close
Full Screen / Esc
Printer-friendly Version
Interactive Discussion
Discussion
Paper
|D
iscussionP
aper|
Discussion
Paper
|D
iscussionP
aper|
in Beijing will reach five million (Han and Hayashi, 2008) by 2020. Automobile-relatedair pollutants emissions account for more than 70 % of volatile organic compounds(VOCs) and 40 % of nitrogen oxides (NOx) emissions in the Beijing metropolitan area(Liu et al., 2005; Hao et al., 2006), which trigger rapid ozone photochemical production(Finlayson-Pitts and Pitts, 1999; Zhang et al., 2004a) and lead to secondary organic5
aerosol formation (Zhao et al., 2009; Yue et al., 2010; Zhang, 2010). Consequently,severe air pollution episodes characterized by high O3 concentration and particulatematter are often encountered in Beijing summertime (Tang, 2004), with the potential toimpact regional and global climate (Zhang et al., 2007).
Gasoline emission due to fuel handing and storage at gas stations represents a ma-10
jor component of the VOC inventory in China. It was estimated that near 187.6 kt ofVOCs were emitted into the atmosphere from gas stations allover China in 2002 (Shenet al., 2006). As the host of the 2008 Summer Olympic Games and due to internationalconcerns on athletes’ health during competition, the Beijing municipal administrationpledged to improve Beijing’s air quality and present a “Green Olympic Games”. Since15
2002, a series of emission control measures have been implemented in the BeijingCity area, especially targeting at VOCs. By May 2008, the Beijing Environmental Pro-tection Bureau (BEPB) has shut down 144 gas stations and storage facilities for failureto comply with the vapor recovery rule that requires all the gas pumps install speciallydesigned nozzle to collect vapors from the vehicle’s gas tank and return these collected20
vapors to the service station’s underground storage tank.Despite different refinery techniques and crude oil origins, typical gasoline mainly
consists of C4–C12 hydrocarbons (i.e., paraffins, naphthenes, and olefins) and substan-tial amount of antiknocking additives, which prevent gasoline from autoignition undera high compression ratio to improve engine performance and achieve a higher fuel ef-25
ficiency. Gasoline is typically classified by an octane number, a measure of resistanceof gasoline to autoignition with references to iso-octane as No. 100 and n-heptaneas No. 0. In this work, we consider the research octane numbers, i.e., RON. Cur-rently, aromatics (i.e., benzene, toluene, xylenes, and ethylbenzene) and oxygenate
14721
ACPD11, 14719–14746, 2011
Characterization ofgas stationemissions
J. Zheng et al.
Title Page
Abstract Introduction
Conclusions References
Tables Figures
J I
J I
Back Close
Full Screen / Esc
Printer-friendly Version
Interactive Discussion
Discussion
Paper
|D
iscussionP
aper|
Discussion
Paper
|D
iscussionP
aper|
compounds, such as methyl tertiary butyl ether (MTBE), methanol and ethanol, are themost widely used antiknocking additives. Most of the aromatics have adverse effectson human health after either chronic or acute exposure. Particularly, benzene is clas-sified as a carcinogen by the world health organization (WHO) and is primary releasedinto the atmosphere through fugitive emission due to its use in gasoline and industrial5
solvent. Moreover, aromatics are also considered as highly reactive VOCs (Suh et al.,2002, 2003; Atkinson and Arey, 2003; Zhao et al., 2005) and oxidation of aromatic hy-drocarbons plays an important role in the nucleation and growth of secondary organicaerosols (Zhang et al., 2004b; Zhao et al., 2006; Wang et al., 2010). Thus, fugitivegasoline emission from gas stations can contribute significantly to O3 production po-10
tential. Oxygenate additives can add “oxygen” into the fuel and help gasoline burn morecompletely, reducing toxic exhaust emissions. For example, methanol has been sug-gested to be a promising alternative fuel for gasoline (Reed and Lerner, 1973). Sincemethanol has only one carbon atom, it can burn much cleanly and exhaust nearly onlycarbon dioxide and water. Methanol blended gasoline can significantly reduce carbon15
monoxide (CO), NOx, and aldehyde emissions. Despite the environmental benefits,oxygenate gasoline additives also cause health concerns. For instance, inhalation ofMTBE vapor can cause damage to human organs and it is also considered as a possi-ble carcinogen (US EPA report 600/R-94/217). Because methanol is practically odor-less and has a high toxicity in human, people may be unaware of exposure to high20
level of methanol vapor and suffer metabolic acidosis and ocular toxicity (Tephly, 1991).Hence, speciation and quantification of VOCs in the gasoline plume from gas stationsare of importance to establish accurate VOC emission inventories, to assess its impacton O3 production potential, and to evaluate its effects on public health, especially forresidents in the immediate vicinity of the gas stations.25
As part of the 2008 Campaign of Air Quality Research in Beijing and Surrounding Re-gions (CAREBeijing 2008), measurements of VOC plumes originating from eight gasstations were conducted using a PTR-MS onboard a mobile laboratory to characterizeemissions from gas stations. The performance of the PTR-MS has been validated by
14722

ACPD11, 14719–14746, 2011
Characterization ofgas stationemissions
J. Zheng et al.
Title Page
Abstract Introduction
Conclusions References
Tables Figures
J I
J I
Back Close
Full Screen / Esc
Printer-friendly Version
Interactive Discussion
Discussion
Paper
|D
iscussionP
aper|
Discussion
Paper
|D
iscussionP
aper|
inter-comparison with an on-line GC system. The advantage of this work lies in thecombination of the mobility of the mobile laboratory and the high sensitivity and fasttime-response instrumentation. Aromatics and oxygenated additives in these gasolineplumes are the focus, because of their significant contribution to photochemical O3production, secondary organic aerosol formation, and public health concerns.5
2 Experimental
2.1 Mobile Laboratory and PTR-MS
The PTR-MS was onboard a mobile laboratory (ML), which was modified from anIVECO Turin V diesel vehicle. A detailed description of the ML and the onboard in-strumentation has been provided by Wang et al. (2009). Only information relevant to10
the present work is briefly introduced here. The ML was 6.6 m long, 2.4 m wide, and2.8 m high, with a total payload of about 2.7 metric ton. Besides PTR-MS, the MLwas equipped with a suite of research grade commercial instruments for both aerosoland gaseous species measurements. The NOx data used in this work was measuredby an ECOTECH 9841A chemiluminescence NOx analyzer with a 0.4 ppbv detection15
limit at 1 s response time. To prevent self-contamination, the ML was powered by twosets of 12 V/110 Ah lead rechargeable batteries during on-road measurements, whichlasted up to about four hours. All sampling inlets were mounted on the front top of theML, about 3.2 m above the ground. The VOC inlet was made of a 1.5 m long 1.6 mmID PFA tubing and the sampling rate was about 350 standard cubic centimeters per20
minute (sccm) to achieve a residence time less than 1 s.The PTR-MS (Hansel et al., 1995) was a commercial instrument manufactured by
Ionicon Analytik. In operation, water molecules were first ionized by a hollow cath-ode discharge ion source into hydronium ions (H3O+), which then reacted with VOCmolecules through proton-transfer reactions inside a drift-tube under a well-defined25
electric field. The protonated VOC species (R+) were further analyzed by a quadrupole
14723

ACPD11, 14719–14746, 2011
Characterization ofgas stationemissions
J. Zheng et al.
Title Page
Abstract Introduction
Conclusions References
Tables Figures
J I
J I
Back Close
Full Screen / Esc
Printer-friendly Version
Interactive Discussion
Discussion
Paper
|D
iscussionP
aper|
Discussion
Paper
|D
iscussionP
aper|
mass spectrometer. The detailed PTR-MS operating conditions have been introducedby Fortner et al. (2009). Quantification of the VOC analytes was based on kinetic-limited calculations (Lindinger et al., 1998; Zhao and Zhang, 2004) and calibrationswith commercial standard mixtures (Spectra Gases Inc.) from the USEPA TO-15 tar-get compounds list. A custom made catalytic converter (Fortner et al., 2009) was used5
for both background checks and calibration, which was typically before or after eachmeasurement trip.
In this work, pentenes, benzene, toluene, C8-aromatics, C9-aromatics, and methanolwere identified and quantified at m/e 71, 79, 93, 107, 121, and 33, respectively (deGouw and Warneke, 2007). Although the molecular weight of MTBE is 88, it exclu-10
sively fragments into m/e 57 after protonation, as confirmed by calibrations with com-mercial MTBE standards (Apel-Riemer Environmental Inc.). In addition, butenes werealso detected at m/e 57 with a similar calibration factor. Based on the analysis of can-ister samples taken in Beijing during August 2005, Song et al. (2008) identified thegasoline emission profile, which contained about 4.1 % butenes and 4.7 % MTBE by15
volume. Accordingly, we attributed 47 % of the m/e 57 signal intensity to butenes andthe other 53 % to MTBE. The detection limit (defined as 3σ of the background noise)of each VOC was less than 0.5 ppbv except for methanol, with a value of 2 ppbv dueto its higher background level. Although gasoline contained significant portion of otherhydrocarbons, most of them were alkane species and can not be detected by PTR-MS20
effectively (Arnold et al., 1998).
2.2 GC/MS/FID VOC measurement
An on-line automated gas chromatography system with mass spectrometry and flameionization dual-detectors (GC/MS/FID, Varian CP-3800 and Saturn 2200 MS) was de-ployed to measure C1-C11 VOCs on the campus of Peking University during the cam-25
paign. The inlet of the system was set up on the roof of a six-story building (∼25 mabove ground). The on-line GC/MS system used here is a modification described byChang et al. (2010). A built-in cryo-trap packed with fine glass beads was cooled with
14724
ACPD11, 14719–14746, 2011
Characterization ofgas stationemissions
J. Zheng et al.
Title Page
Abstract Introduction
Conclusions References
Tables Figures
J I
J I
Back Close
Full Screen / Esc
Printer-friendly Version
Interactive Discussion
Discussion
Paper
|D
iscussionP
aper|
Discussion
Paper
|D
iscussionP
aper|
liquid nitrogen to −170 ◦C for trapping. Air sample was drawn from the sample inletthrough the cryo-trap at a rate of 12 ml min−1 for 20 min, which provided an aliquot of240 ml air sample for each analysis. Desorption was made by flash heating of the trapto 85 ◦C, and a stream of ultra-high purity helium (99.9999 %) was used to flush thetrapped hydrocarbons onto the columns. A glass Y-splitter separated the flow to two5
columns, i.e., a PLOT column (Chrompack; 30 m×0.32 mm; df=5.0 µm) connected toFID for separation and detection of C2-C4 hydrocarbons, and a DB-1 column (J&W;60 m×0.32 mm; df=1.0 µm) connected to MS for the separation and detection of C5-C11 hydrocarbons, C1-C3 halogenated hydrocarbons, ethers, esters, and other VOCs.The GC oven started at −15 ◦C for 1.5 min, ramped to 0 ◦C at 10 ◦C min−1, to 140 ◦C at10
5 ◦C min−1, to 180 ◦C at 20 ◦C min−1, and ended at 180 ◦C for 9.5 min. The mass spec-trometer detector was operated in the total ion current (TIC) mode, but only one or fewions (usually the primary ion or ions with less interference in chromatogram) for eachtarget compound was used for quantitative analysis in order to reduce interference.Four internal standards (bromochloromethane, 1,4-difluorobenzene, chlorobenzene-15
d5, and 1-bromo-4-fluorobenzene) were blended in for each injection aliquot to confirmthe stability of MS and to ensure data quality. Precision for measured species was eval-uated by repeated 7 analyses of a standard mixture at around 1 ppbv. The precisions(one standard deviation) and detection limits of the upgraded method for most specieswere 0.5–2 % and 5–20 pptv, and the time resolution for the NMHC dataset was 1 h.20
2.3 Gas station plume measurement
Eight gas stations, located around the northwest corner of the 4th and 5th ring loopsof the Beijing City (denoted as G1 to G8 in Fig. 2), were sampled by the ML on 6and 10 August 2008. These gas stations were chosen since the traffic conditionswere fairly smooth and plumes due to traffic jam could be avoided. The measurement25
time was between 8 a.m. and 12 p.m., when morning rush hours had passed and gasstations were engaged in typical business activity. Neither strong precipitation nor highwind speed (∼0.3 to 0.6 m s−1) were encountered during the measurements. Ambient
14725

ACPD11, 14719–14746, 2011
Characterization ofgas stationemissions
J. Zheng et al.
Title Page
Abstract Introduction
Conclusions References
Tables Figures
J I
J I
Back Close
Full Screen / Esc
Printer-friendly Version
Interactive Discussion
Discussion
Paper
|D
iscussionP
aper|
Discussion
Paper
|D
iscussionP
aper|
temperature and relative humidity (RH) remained steady. The location, time of eachmeasurement, and detailed meteorological conditions were summarized in Tables 1and 2. Typically, the ML was selectively parked at the downwind side of the gas station,about 15 m from the fueling islands. Self-contamination was avoided by using therechargeable battery sets. The PTR-MS was set in selective ion monitor mode (SIM)5
and scanned methanol, MTBE, benzene, toluene, C8- and C9- aromatic compounds,and twenty masses for 1 s each consecutively thus to achieve a time resolution of∼25 s. Other trace gases, including NOx and meteorological parameters were alsocontinuously monitored at 1 Hz. The detailed operating procedure of the ML has beenprovided by Wang et al. (2009).10
2.4 Gaussian plume model
We considered a gas station as a point source emitter due to both refueling operationsand evaporations from storage facility. As the plume travels downwind, it diffuses bothvertically and horizontally and consequently its concentration is normally distributed ineither direction. Therefore, a Gaussian plume model can be used to simulate the atmo-15
spheric diffusion process and to evaluate fugitive gasoline emission rate from the gasstations. Specifically, the model is based on the following assumptions: (1) the VOCconcentrations in the plume are under steady state; (2) the mass within the plume isconserved; (3) wind and eddy diffusivities are constant as the plume traveled down-wind. The Gaussian plume model is expressed as (Seinfeld and Pandis, 1998):20
C(x,y,z)=Q
2πuσyσz
{exp
(−(z−h)2
2σ2z
)+exp
(−(z+h)2
2σ2z
)}{exp
(−(y)2
2σ2y
)}(1)
where C is the concentration of the VOC species at the point of observation denotedby coordinates (x, y , z), Q is the source emission rate in g s−1, u is the wind speedin m s−1, and h is the height of the point source (taken as 1 m here). σz and σy arevertical and cross-wind plume distribution, respectively and are defined according to25
14726

ACPD11, 14719–14746, 2011
Characterization ofgas stationemissions
J. Zheng et al.
Title Page
Abstract Introduction
Conclusions References
Tables Figures
J I
J I
Back Close
Full Screen / Esc
Printer-friendly Version
Interactive Discussion
Discussion
Paper
|D
iscussionP
aper|
Discussion
Paper
|D
iscussionP
aper|
the Pasquill stability classifications (Gifford, 1976). In this work, considering the urbanenvironment and the weather conditions (i.e., cloudy and low wind speed, less than1 m s−1), σz and σy are evaluated as σz=0.24x · (1.0+0.001x)0.5 and σy=0.32x · (1.0+0.0004x)−0.5, respectively. Since the ML is directly parked downwind side of the gasstations, its location is virtually estimated as (x≈15 to 20 m, y ≈0 m, z≈3.0 m). Hence,5
from measured VOC concentrations (C(x,y,z)), the emission rates (Q) of each VOCspecies can be calculated accordingly.
The accuracy of the Gaussian model was determined by the precision of all the pa-rameters used in the calculation, among which the precise location of the ML relativeto the fueling stations corresponded to the largest uncertainty. Both x and y were esti-10
mated with an uncertainty of ±1 m, leading to −26 % to 28 % uncertainty in the results.The uncertainty of the PTR-MS measurements were less than 20 % determined as twostandard deviations of all calibrations conducted during the CAREBeijing campaign(Wang et al., 2009).
3 Results and discussion15
3.1 Inter-comparison between PTR-MS and GC/MS/FID
Inter-comparisons between PTR-MS and other well-developed methods, such as GCbased technique, have been routinely conducted during field measurements to eval-uate the performance of both instrumentations (de Gouw et al., 2003; Kuster et al.,2004; Fortner et al., 2009). During the CAREBeijing 2008 campaign, an on-line auto-20
mated GC/MS/FID system was also used to measure VOCs at the Peking University(PKU) site. From 24 to 25 August, the ML was parked immediately next to a six-storybuilding, on the roof-top of which was the observatory that housed the GC/MS/FIDat the PKU site. The vertical distance between the two instruments was about 30 m.Because automobile traffic was limited on the campus, a local highway to the north of25
the site (about 200 m away) was the dominant source of traffic emission. Pine trees
14727

ACPD11, 14719–14746, 2011
Characterization ofgas stationemissions
J. Zheng et al.
Title Page
Abstract Introduction
Conclusions References
Tables Figures
J I
J I
Back Close
Full Screen / Esc
Printer-friendly Version
Interactive Discussion
Discussion
Paper
|D
iscussionP
aper|
Discussion
Paper
|D
iscussionP
aper|
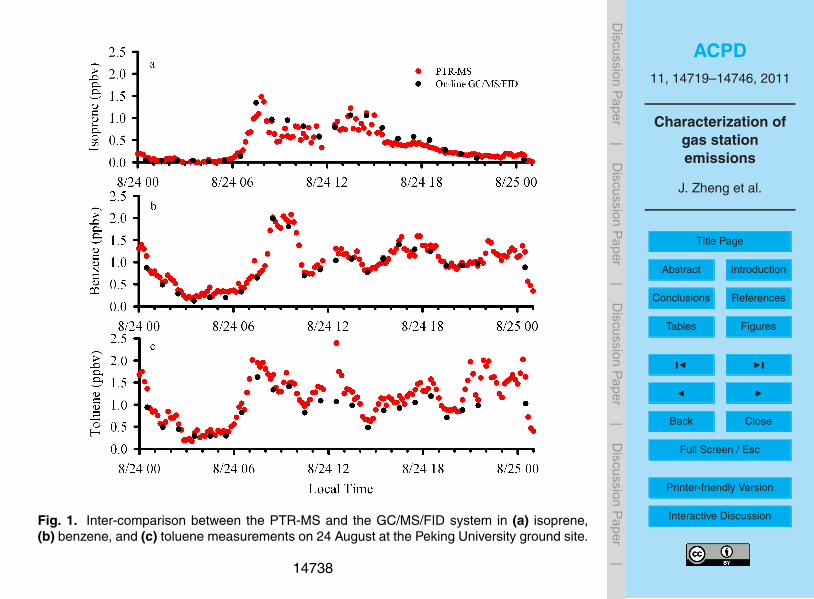
and shrubs were present along the building sidewall. Both instrument inlets were atleast 10 m away from the tree crowns. Figure 1 shows the plots of isoprene, ben-zene, and toluene observed on 24 August by both the PTR-MS and the GC/MS/FID.The PTR-MS data is 10 min averaged to match the lower sampling frequency, ∼1 h,of the GC/MS/FID system. Overall, the agreement between the two systems is ex-5
cellent. The slopes, interceptions and correlation coefficients (R2) of least square fitsare 0.88, 0.08 ppbv and 0.92 for isoprene, 0.95, −0.06 ppbv and 0.98 for benzene, and0.72, 0.06 ppbv and 0.97 for toluene, respectively. Since isoprene is produced duringphotosynthesis and is predominantly lost due to reactions with hydroxyl radical (Zhanget al., 2000, 2002), isoprene shows a typical diurnal pattern that highly correlates with10
the solar radiation, as shown in Fig. 1a. No clear diurnal patterns are present in bothbenzene and toluene time series, although a good correlation between them is found(R2 = 0.84) with a toluene/benzene (T/B) ratio of 1.78 determined by orthogonal dis-tance regression (ODR), indicating a common source of fresh traffic emission (McKeenand Liu, 1993).15
3.2 Gasoline emissions from gas stations
Tables 1 and 2 summarize gas station measurements on 6 and 10 August 2008, con-taining the location, time, local meteorological conditions, and number of gasolineplumes intercepted at each site. Figures 3 and 4 display the time series of butenes,pentenes, methanol, MTBE, benzene, toluene, C8- and C9-aromatics measured on20
6 and 10 August, respectively. Also shown in the figures is concurrently measuredNOx, which is only present in automobile exhaust and is used to distinguish the fugitivegasoline plumes from automobile emissions. Evidently, on-road NOx plumes of morethan 200 ppbv are frequently observed between gas station stops, but no significantaromatics, MTBE, and methanol are simultaneously found within the NOx plumes. Oc-25
casionally, spikes of NOx from refueling vehicles are also captured. However, theseexhaust plumes typically appear slightly earlier than the gasoline plumes and are ex-cluded from emission rate calculation.
14728
ACPD11, 14719–14746, 2011
Characterization ofgas stationemissions
J. Zheng et al.
Title Page
Abstract Introduction
Conclusions References
Tables Figures
J I
J I
Back Close
Full Screen / Esc
Printer-friendly Version
Interactive Discussion
Discussion
Paper
|D
iscussionP
aper|
Discussion
Paper
|D
iscussionP
aper|
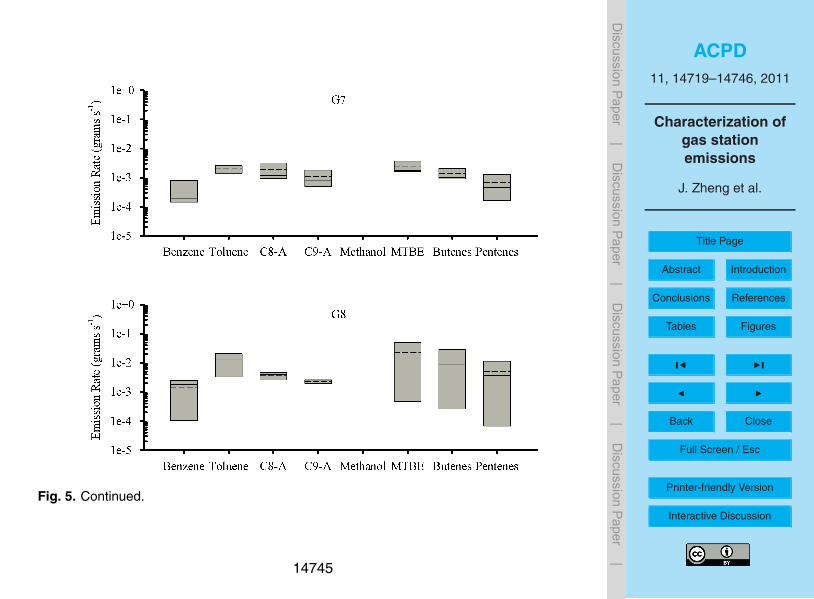
Figure 5 displays the box plots of the emission rates of VOCs in the plumes detectedat the eight gas stations and Fig. 6 presents the corresponding bar plots of averagedVOC emissions at each gas station. Since alkanes cannot be detected by the PTR-MS,only eight VOC species are reported here, which account for about 34 % of the totalgasoline emission (Song et al., 2008). It is shown that gasoline emissions from the gas5
stations vary significantly in terms of the emission rate and chemical composition. Theobserved highest and lowest emission rates are found at G3 and G6, respectively, withthe values of 1.1×10⁻¹ and 1.4× 10⁻³ g s−1. From our observations at all the gas sta-tions, one refueling process typically takes about 77 s and 16 vehicles are refueled perhour. Assuming all 1442 gas stations in Beijing (BEPB) are operated 24 h a day with10
the averaged work load, we estimate that about 4.5 mt of gasoline are emitted from gasstations per day or 1.6 kt yr−1. Since about 3409 kt of gasoline have been consumedin Beijing during 2008 (National Bureau of Statistics of China, 2010), the VOC EF forgas stations in Beijing is evaluated as about 0.5 kg t−1, i.e., 0.5 kg of every ton of gaso-line supplied in Beijing are emitted into the atmosphere., Shen et al. (2006) reported15
a gasoline EF of 2.49 kg t−1 before the vapor recovery systems were mandatorily in-stalled in all gas stations of Beijing. Hence, our measurements indicate that gasolineemission due to refueling process was significantly reduced during the Olympics pe-riod.
The aromatics and oxygenated hydrocarbons can significantly increase gasoline20
octane rating. The RON rating of MTBE, methanol, benzene, toluene, C8- and C9-aromatics (both are treated as xylene) are 116, 133, 101, 111, 117, and 117, respec-tively. In this work, the mass-weighted octane rating of the six detected VOCs is about114, indicating that they are the major anti-knocking additives. In all cases a sub-stantial amount of MTBE is found, accounting for 19 % to 36 % of the detected VOCs.25
Although MTBE does not participate in ozone production, its health risks are activelyunder debate. Currently, MTBE is not classified as a human carcinogen, but it hasbeen suggested that MTBE can be a potential human carcinogen after high dose ex-posure, especially due to contamination of ground water by leakage from under-ground
14729

ACPD11, 14719–14746, 2011
Characterization ofgas stationemissions
J. Zheng et al.
Title Page
Abstract Introduction
Conclusions References
Tables Figures
J I
J I
Back Close
Full Screen / Esc
Printer-friendly Version
Interactive Discussion
Discussion
Paper
|D
iscussionP
aper|
Discussion
Paper
|D
iscussionP
aper|
gasoline storage (US EPA, 2011).Because benzene is a known carcinogen, its content in gasoline is regulated below
2.5 % by volume in China (GB17930-2006). At five gas stations, benzene is found tobe more than 4.1 % of the detected VOCs, i.e., about 3 % of the total gasoline vapors,indicating that most gasoline supplied in China contains elevated benzene. Particularly,5
at G3, a maximum value of 164 ppbv or an average value of 18 ppbv for benzene isobserved. In comparison, an average gasoline benzene content is about 1 % by volumein the US and the US EPA’s inhalation reference concentration (RfC, i.e., an estimateof a continuous inhalation exposure concentration to people that is likely to be withoutrisk of deleterious effects during a lifetime) for benzene is 3×10⁻⁵ g m−3 or ∼9 ppbv10
under standard atmospheric conditions. Averaged benzene concentrations at most ofthe gas stations appear to cause no serious health concern, except that at G3 benzeneconcentration is twice as much as the RfC value.
In general, all aforementioned VOCs are detected in all gasoline vapor plumes withnoticeable concentrations, except that a substantial amount of methanol is exclusively15
found in gasoline sold at G3 and G5. However, ethanol, a common additive used inthe US, is not present in any brands of gasoline in Beijing and not detected by on-roadPTR-MS measurements. Like other oxygenate gasoline additives, methanol has highoctane number rating (RON=133) and combusts at a lower temperature than gaso-line, and addition of methanol into traditional gasoline can significantly lower exhaust20
emission. It is found that 76 % of antiknocking additives in gasoline sold at G3 and G5are oxygenated in nature, while only 35 % of antiknocking additives are oxygenated inthe other cases. Currently, the supplier of G3 and G5 is operating 10 gas stations inthe Beijing region, accounting for less than 1 % of the Beijing region gasoline market.Potentially, promoting methanol-containing gasoline in Beijing area can significantly re-25
duce emission inventory in the automobile sector, which contributes to more than halfthe VOC emission in Beijing (Liu et al., 2005).
Currently, VOC emissions from gas stations have not been properly included in theemission inventory (Streets et al., 2003). Although our results reveal that VOC emission
14730

ACPD11, 14719–14746, 2011
Characterization ofgas stationemissions
J. Zheng et al.
Title Page
Abstract Introduction
Conclusions References
Tables Figures
J I
J I
Back Close
Full Screen / Esc
Printer-friendly Version
Interactive Discussion
Discussion
Paper
|D
iscussionP
aper|
Discussion
Paper
|D
iscussionP
aper|
from gas stations have been significantly reduced in Beijing due to the implementationof more strict regulations and the improvement in vapor recovery technologies, a sub-stantial amount of gasoline is still emitted into the atmosphere. Therefore, an omissionof emissions from gas stations may lead to a significant underestimate in VOC emis-sions in the Beijing megacity and consequently impacts simulations of photochemical5
ozone production and nucleation and growth of secondary organic aerosol in atmo-spheric models (Lei et al., 2004; Fan et al., 2006).
4 Conclusions
On 6 and 10 August 2008, eight gas stations in Beijing were sampled to characterizeVOC emissions. This work represents the first in-situ measurements of gas station10
VOC emissions using a PTR-MS onboard a mobile laboratory. Aromatics, includingbenzene, toluene, C8-, and C9- aromatics, methanol, MTBE, butenes, and penteneswere the major VOCs observed by the PTR-MS. The emission rate of each VOC wascalculated using a Gaussian point source plume model. On the basis of measurementsat the eight gas stations, we estimated that about 4.5 mt d−1 or 1.6 kt yr−1 of gasoline15
were emitted from the gas stations in Beijing. The corresponding gasoline vapor emis-sion factor was estimated as about 0.5 kg t−1, showing that gasoline emissions duringrefueling processes have been decreased substantially since 2002. In addition, theresults showed that, on average, the G2 and G6 gas stations were the most effectivein fugitive gasoline vapor recovery while the others emitted about 10 times of gasoline20
as that of G2 and G6, indicating that further reduction of considerable gasoline vaporemissions can be achieved by improving the gasoline vapor recovery efficiency. Theaverage benzene concentration at G3 was twice as much as the US EPA suggestedRfC level. The type of octane rating enhancers was significantly different among all gasstations. G3 and G5 had the highest level of the oxygenated blend, about 112 % higher25
than the others. A noteworthy air pollution control strategy is to enforce methanol-blended fuel to reduce CO and other toxic automobile emissions. Our results indicate
14731
ACPD11, 14719–14746, 2011
Characterization ofgas stationemissions
J. Zheng et al.
Title Page
Abstract Introduction
Conclusions References
Tables Figures
J I
J I
Back Close
Full Screen / Esc
Printer-friendly Version
Interactive Discussion
Discussion
Paper
|D
iscussionP
aper|
Discussion
Paper
|D
iscussionP
aper|
that emissions from gas stations represent an important source for VOCs in megacityBeijing and need to be properly included in emission inventory to assess their roles inphotochemical ozone production and secondary organic aerosol formation.
Acknowledgements. This work is part of the Campaign of Atmospheric Research in Beijing andsurrounding areas supported by Beijing Environment Protection Bureau (OITC-G08026056)5
and Beijing Council of Science and Technology (HB200504-6, HB200504-2). This work is alsosupported by the Robert A. Welch Foundation (Grant A-1417). R. Z. acknowledges furthersupport from the National Natural Science Foundation of China Grant (40728006).
References
Arnold, S. T., Viggiano, A. A., and Morris, R. A.: Rate constants and product branching fractions10
for the reactions of H3O+ and NO+ with C2-C12 alkanes, J. Phys. Chem. A, 102, 8881–8887,1998.
Atkinson, R. and Arey, J.: Atmospheric degradation of volatile organic compounds, Chem. Rev.,103, 4605–4638, doi:10.1021/cr0206420, 2003.
Chang, C. C., OuYang, C. F., Wang, C. H., Chiang, S. W., and Wang, J. L.: Vali-15
dation of in-situ measurements of volatile organic compounds through flask samplingand gas chromatography/mass spectrometry analysis, Atmos. Environ., 44, 1301–1307,doi:10.1016/j.atmosenv.2009.12.016, 2010.
de Gouw, J. and Warneke, C.: Measurements of volatile organic compounds in the Earth’satmosphere using proton-transfer-reaction mass spectrometry, Mass Spectrom. Rev., 26,20
223–257, 2007.de Gouw, J. A., Goldan, P. D., Warneke, C., Kuster, W. C., Roberts, J. M., Marchewka, M., Bert-
man, S. B., Pszenny, A. A. P., and Keene, W. C.: Validation of proton transfer reaction-massspectrometry (PTR-MS) measurements of gas-phase organic compounds in the atmosphereduring the New England Air Quality Study (NEAQS) in 2002, J. Geophys. Res., 108, 4682,25
doi:10.1029/2003jd003863, 2003.Fan, J. W., Zhang, R. Y., Collins, D., and Li, G. H.: Contribution of secondary condensable
organics to new particle formation: a case study in Houston, Texas, Geophys. Res. Lett., 33,L15802, doi:10.1029/2006gl026295, 2006.
14732

ACPD11, 14719–14746, 2011
Characterization ofgas stationemissions
J. Zheng et al.
Title Page
Abstract Introduction
Conclusions References
Tables Figures
J I
J I
Back Close
Full Screen / Esc
Printer-friendly Version
Interactive Discussion
Discussion
Paper
|D
iscussionP
aper|
Discussion
Paper
|D
iscussionP
aper|
Finlayson-Pitts, B. J. and Pitts, J. N.: Chemistry of the Upper and Lower Atmosphere: Theory,Experiments and Applications, Academic Press, San Diego, Calif., xxii, 969 pp., 1999.
Fortner, E. C., Zheng, J., Zhang, R., Berk Knighton, W., Volkamer, R. M., Sheehy, P., Molina, L.,and Andre, M.: Measurements of Volatile Organic Compounds Using Proton Transfer Re-action – Mass Spectrometry during the MILAGRO 2006 Campaign, Atmos. Chem. Phys., 9,5
467–481, doi:10.5194/acp-9-467-2009, 2009.Gifford, F. A.: Turbulent diffusion-typing schemes – review, Nucl. Safety, 17, 68–86, 1976.Han, J. and Hayashi, Y.: Assessment of private car stock and its environmental impacts in China
from 2000 to 2020, Transport. Res. D-Tr. E., 13, 471–478, doi:10.1016/j.trd.2008.09.007,2008.10
Hansel, A., Jordan, A., Holzinger, R., Prazeller, P., Vogel, W., and Lindinger, W.: Proton-transferreaction mass-spectrometry – online trace gas-analysis at the PPB level, Int. J. Mass Spec-trom., 149, 609–619, 1995.
Hao, J. M., Hu, J. N., and Fu, L. X.: Controlling vehicular emissions in Beijing during the lastdecade, Transp. Res. A-Pol., 40, 639–651, doi:10.1016/j.tra.2005.11.005, 2006.15
Kuster, W. C., Jobson, B. T., Karl, T., Riemer, D., Apel, E., Goldan, P. D., and Fehsen-feld, F. C.: Intercomparison of volatile organic carbon measurement techniques and dataat la porte during the TexAQS2000 Air Quality Study, Environ. Sci. Technol., 38, 221–228,doi:10.1021/es034710r, 2004.
Lei, W. F., Zhang, R. Y., Tie, X. X., and Hess, P.: Chemical characterization of ozone formation20
in the Houston-Galveston area: a chemical transport model study, J. Geophys. Res., 109,D12301, doi:10.1029/2003jd004219, 2004.
Lindinger, W., Hansel, A., and Jordan, A.: On-line monitoring of volatile organic compoundsat pptv levels by means of proton-transfer-reaction mass spectrometry (PTR-MS) – medicalapplications, food control and environmental research, Int. J. Mass Spectrom., 173, 191–241,25
1998.Liu, Y., Shao, M., Zhang, J., Fu, L. L., and Lu, S. H.: Distributions and source apportionment
of ambient volatile organic compounds in Beijing city, China, J. Environ. Sci. Health PartA-Toxic/Hazard. Subst. Environ. Eng., 40, 1843–1860, doi:10.1080/10934520500182842,2005.30
McKeen, S. A. and Liu, S. C.: Hydrocarbon ratios and photochemical history of air masses,Geophys. Res. Lett., 20, 2363–2366, 1993.
National Bureau of Statistics of China: China Energy Statistical Yearbook 2009, edited by:
14733
ACPD11, 14719–14746, 2011
Characterization ofgas stationemissions
J. Zheng et al.
Title Page
Abstract Introduction
Conclusions References
Tables Figures
J I
J I
Back Close
Full Screen / Esc
Printer-friendly Version
Interactive Discussion
Discussion
Paper
|D
iscussionP
aper|
Discussion
Paper
|D
iscussionP
aper|
Geng, Q., China Statistics Press, Beijing, 2010.Reed, T. B. and Lerner, R. M.: Methanol – versatile fuel for immediate use, Science, 182,
1299–1304, 1973.Seinfeld, J. H. and Pandis, S. N.: Atmospheric Chemistry and Physics: from Air Pollution to
Climate Change, Wiley, New York, xxvii, 1326 pp., 1998.5
Shen, M. J., Hao, J. M., and Wang, L. T.: VOC emission situation and control measures of gasstation in China, Huan Jing Ke Xue/Chinese J. Environ. Sci., 27, 1473–1478, 2006.
Song, Y., Dai, W., Shao, M., Liu, Y., Lu, S. H., Kuster, W., and Goldan, P.: Comparison ofreceptor models for source apportionment of volatile organic compounds in Beijing, China,Environ. Pollut., 156, 174–183, doi:10.1016/j.envpol.2007.12.014, 2008.10
Streets, D. G., Bond, T. C., Carmichael, G. R., Fernandes, S. D., Fu, Q., He, D., Klimont, Z.,Nelson, S. M., Tsai, N. Y., Wang, M. Q., Woo, J. H., and Yarber, K. F.: An inventory ofgaseous and primary aerosol emissions in Asia in the year 2000, J. Geophys. Res., 108,8809, doi:10.1029/2002jd003093, 2003.
Suh, I., Zhang, D., Zhang, R. Y., Molina, L. T., and Molina, M. J.: Theoretical study of15
OH addition reaction to toluene, Chem. Phys. Lett., 364, 454–462, doi:10.1016/S0009-2614(02)01364-7, 2002.
Suh, I., Zhang, R. Y., Molina, L. T., and Molina, M. J.: Oxidation mechanism of aromatic peroxyand bicyclic radicals from OH-toluene reactions, J. Am. Chem. Soc., 125, 12655–12665,doi:10.1021/Ja0350280, 2003.20
Tang, X.: The characteristics of urban air pollution in China, in: Urbanization, Energy, and AirPollution in China, edited by: Fritz, J. J., The National Academies Press, Washington, DC,47–54, 2004.
Tephly, T. R.: The toxicity of methanol, Life Sci., 48, 1031–1041, 1991.US EPA: Methyl Tertiary Butyl Ether (MTBE) – Drinking Water, available at: http://www.epa.25
gov/mtbe/water.htm, last access: May, 2011.Wang, L., Khalizov, A. F., Zheng, J., Xu, W., Ma, Y., Lal, V., and Zhang, R.: Atmospheric
nanoparticles formed from heterogeneous reactions of organics, Nat. Geosci., 3, 238–242,doi:10.1038/ngeo778, 2010.
Wang, M., Zhu, T., Zheng, J., Zhang, R. Y., Zhang, S. Q., Xie, X. X., Han, Y. Q., and Li, Y.:30
Use of a mobile laboratory to evaluate changes in on-road air pollutants during the Beijing2008 Summer Olympics, Atmos. Chem. Phys., 9, 8247–8263, doi:10.5194/acp-9-8247-2009,2009.
14734
ACPD11, 14719–14746, 2011
Characterization ofgas stationemissions
J. Zheng et al.
Title Page
Abstract Introduction
Conclusions References
Tables Figures
J I
J I
Back Close
Full Screen / Esc
Printer-friendly Version
Interactive Discussion
Discussion
Paper
|D
iscussionP
aper|
Discussion
Paper
|D
iscussionP
aper|
Yue, D. L., Hu, M., Zhang, R. Y., Wang, Z. B., Zheng, J., Wu, Z. J., Wiedensohler, A., He, L. Y.,Huang, X. F., and Zhu, T.: The roles of sulfuric acid in new particle formation and growthin the mega-city of Beijing, Atmos. Chem. Phys., 10, 4953–4960, doi:10.5194/acp-10-4953-2010, 2010.
Zhang, D., Zhang, R. Y., Park, J., and North, S. W.: Hydroxy peroxy nitrites and nitrates from OH5
initiated reactions of isoprene, J. Am. Chem. Soc., 124, 9600–9605, doi:10.1021/ja0255195,2002.
Zhang, R. Y.: Getting to the critical nucleus of aerosol formation, Science, 328, 1366–1367,doi:10.1126/science.1189732, 2010.
Zhang, R. Y., Suh, I., Lei, W., Clinkenbeard, A. D., and North, S. W.: Kinetic studies of OH-10
initiated reactions of isoprene, J. Geophys. Res., 105, 24627–24635, 2000.Zhang, R. Y., Lei, W. F., Tie, X. X., and Hess, P.: Industrial emissions cause extreme urban
ozone diurnal variability, P. Natl. Acad. Sci. USA, 101, 6346–6350, 2004a.Zhang, R. Y., Suh, I., Zhao, J., Zhang, D., Fortner, E. C., Tie, X. X., Molina, L. T., and
Molina, M. J.: Atmospheric new particle formation enhanced by organic acids, Science, 304,15
1487–1490, 2004b.Zhang, R. Y., Li, G. H., Fan, J. W., Wu, D. L., and Molina, M. J.: Intensification of Pa-
cific storm track linked to Asian pollution, P. Natl. Acad. Sci. USA, 104, 5295–5299,doi:10.1073/pnas.0700618104, 2007.
Zhao, J. and Zhang, R. Y.: Proton transfer reaction rate constants between hydro-20
nium ion (H3O+) and volatile organic compounds, Atmos. Environ., 38, 2177–2185,doi:10.1016/j.atmosenv.2004.01.019, 2004.
Zhao, J., Zhang, R. Y., Misawa, K., and Shibuya, K.: Experimental product studyof the OH-initiated oxidation of m-xylene, J. Photoch. Photobio. A, 176, 199–207,doi:10.1016/j.jphotochem.2005.07.013, 2005.25
Zhao, J., Levitt, N. P., Zhang, R. Y., and Chen, J. M.: Heterogeneous reactions of methylglyoxalin acidic media: implications for secondary organic aerosol formation, Environ. Sci. Technol.,40, 7682–7687, doi:10.1021/es060610k, 2006.
Zhao, J., Khalizov, A., Zhang, R. Y., and McGraw, R.: Hydrogen-bonding interaction in molec-ular complexes and clusters of aerosol nucleation precursors, J. Phys. Chem. A, 113, 680–30
689, doi:10.1021/jp806693r, 2009.
14735
ACPD11, 14719–14746, 2011
Characterization ofgas stationemissions
J. Zheng et al.
Title Page
Abstract Introduction
Conclusions References
Tables Figures
J I
J I
Back Close
Full Screen / Esc
Printer-friendly Version
Interactive Discussion
Discussion
Paper
|D
iscussionP
aper|
Discussion
Paper
|D
iscussionP
aper|
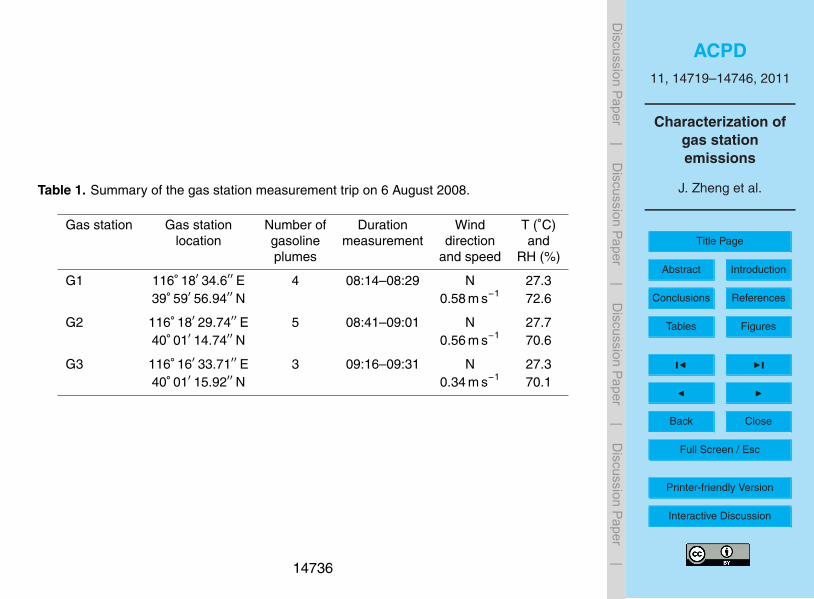
Table 1. Summary of the gas station measurement trip on 6 August 2008.
Gas station Gas station Number of Duration Wind T (◦C)location gasoline measurement direction and
plumes and speed RH (%)
G1 116◦ 18′ 34.6′′ E 4 08:14–08:29 N 27.339◦ 59′ 56.94′′ N 0.58 m s−1 72.6
G2 116◦ 18′ 29.74′′ E 5 08:41–09:01 N 27.740◦ 01′ 14.74′′ N 0.56 m s−1 70.6
G3 116◦ 16′ 33.71′′ E 3 09:16–09:31 N 27.340◦ 01′ 15.92′′ N 0.34 m s−1 70.1
14736
ACPD11, 14719–14746, 2011
Characterization ofgas stationemissions
J. Zheng et al.
Title Page
Abstract Introduction
Conclusions References
Tables Figures
J I
J I
Back Close
Full Screen / Esc
Printer-friendly Version
Interactive Discussion
Discussion
Paper
|D
iscussionP
aper|
Discussion
Paper
|D
iscussionP
aper|
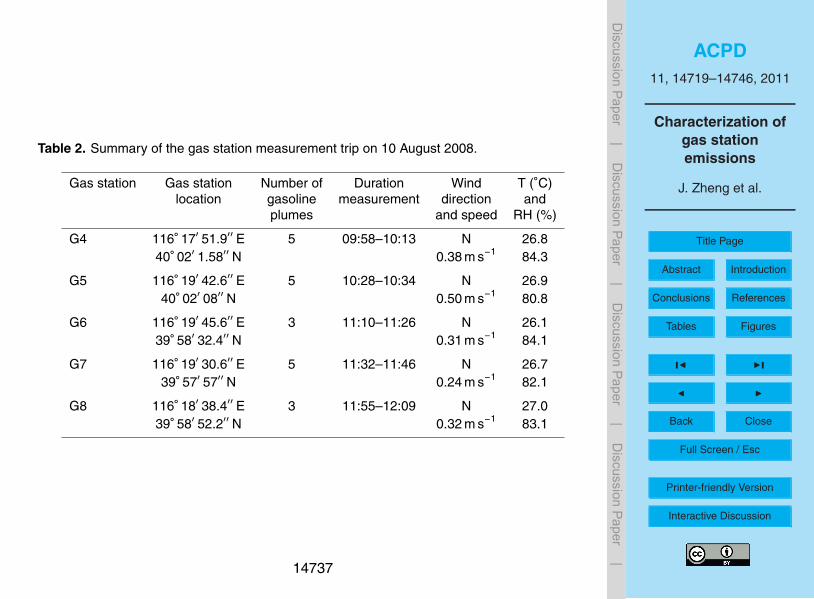
Table 2. Summary of the gas station measurement trip on 10 August 2008.
Gas station Gas station Number of Duration Wind T (◦C)location gasoline measurement direction and
plumes and speed RH (%)
G4 116◦ 17′ 51.9′′ E 5 09:58–10:13 N 26.840◦ 02′ 1.58′′ N 0.38 m s−1 84.3
G5 116◦ 19′ 42.6′′ E 5 10:28–10:34 N 26.940◦ 02′ 08′′ N 0.50 m s−1 80.8
G6 116◦ 19′ 45.6′′ E 3 11:10–11:26 N 26.139◦ 58′ 32.4′′ N 0.31 m s−1 84.1
G7 116◦ 19′ 30.6′′ E 5 11:32–11:46 N 26.739◦ 57′ 57′′ N 0.24 m s−1 82.1
G8 116◦ 18′ 38.4′′ E 3 11:55–12:09 N 27.039◦ 58′ 52.2′′ N 0.32 m s−1 83.1
14737
ACPD11, 14719–14746, 2011
Characterization ofgas stationemissions
J. Zheng et al.
Title Page
Abstract Introduction
Conclusions References
Tables Figures
J I
J I
Back Close
Full Screen / Esc
Printer-friendly Version
Interactive Discussion
Discussion
Paper
|D
iscussionP
aper|
Discussion
Paper
|D
iscussionP
aper|
18
435
436
Figure 1. 437
438
Fig. 1. Inter-comparison between the PTR-MS and the GC/MS/FID system in (a) isoprene,(b) benzene, and (c) toluene measurements on 24 August at the Peking University ground site.
14738

ACPD11, 14719–14746, 2011
Characterization ofgas stationemissions
J. Zheng et al.
Title Page
Abstract Introduction
Conclusions References
Tables Figures
J I
J I
Back Close
Full Screen / Esc
Printer-friendly Version
Interactive Discussion
Discussion
Paper
|D
iscussionP
aper|
Discussion
Paper
|D
iscussionP
aper|
19
438
Figure 2. 439
440
Fig. 2. Locations of the eight gas stations visited by the ML on 6 (yellow marker) and 10 August(green marker).
14739

ACPD11, 14719–14746, 2011
Characterization ofgas stationemissions
J. Zheng et al.
Title Page
Abstract Introduction
Conclusions References
Tables Figures
J I
J I
Back Close
Full Screen / Esc
Printer-friendly Version
Interactive Discussion
Discussion
Paper
|D
iscussionP
aper|
Discussion
Paper
|D
iscussionP
aper|
20
440
441
442
Figure 3. 443
250
200
150
100
50
0Aro
mat
ic V
OC
s (pp
bv)
8:00 AMAug/6/2008
8:05 AM 8:10 AM 8:15 AM 8:20 AM 8:25 AM 8:30 AM
Local Time
100
80
60
40
20
Methanol and M
TBE (ppbv)
600
400
200NO
x (p
pbv)
100
80
60
40
20
0
Alkenes (ppbv)
BenzeneToluene C8-Aromatics C9-Aromatics Methanol MTBE
NOx Pentenes Butenes
a
15
10
5
0Aro
mat
ic V
OC
s (pp
bv)
8:40 AMAug/6/2008
8:45 AM 8:50 AM 8:55 AM 9:00 AM 9:05 AM
Local Time
80
60
40
20
0
Methanol and M
TBE (ppbv)
600500400300200100
NO
x (p
pbv)
40
30
20
10
0
Alkenes (ppbv)
b
160
120
80
40
0Aro
mat
ic V
OC
s (pp
bv)
9:10 AMAug/6/2008
9:15 AM 9:20 AM 9:25 AM 9:30 AM 9:35 AM
Local Time
1200
800
400
Methanol and M
TBE (ppbv)
300
200
100NO
x (p
pbv)
600
400
200
0
Alkenes (ppbv)
c
Fig. 3. Aromatics, methanol, MTBE, butenes, pentenes and NOx observed at (a) G1, (b) G2and (c) G3. Transient high levels of NOx are due to fresh on-road emissions.
14740

ACPD11, 14719–14746, 2011
Characterization ofgas stationemissions
J. Zheng et al.
Title Page
Abstract Introduction
Conclusions References
Tables Figures
J I
J I
Back Close
Full Screen / Esc
Printer-friendly Version
Interactive Discussion
Discussion
Paper
|D
iscussionP
aper|
Discussion
Paper
|D
iscussionP
aper|
21
444
445
446
30
20
10
0Aro
mat
ic V
OC
s (pp
bv)
9:56 AMAug/10/2008
10:00 AM 10:04 AM 10:08 AM 10:12 AM 10:16 AMLocal Time
120
80
40
0
Methanol and M
TBE (ppbv)
1200
800
400
0
NO
x (p
pbv)
100806040200
Alkenes (ppbv)
a
Benzene Toluene C8-Aromatics C9-Aromatics Methanol MTBE
NOx Pentenes Butenes
40
30
20
10
0Aro
mat
ic V
OC
s (pp
bv)
10:20 AMAug/10/2008
10:24 AM 10:28 AM 10:32 AM 10:36 AMLocal Time
1000
800
600
400
200
0
Methanol and M
TBE (ppbv)
400
300
200
100
0
NO
x (p
pbv)
200150100500
Alkenes (ppbv)
b
10
8
6
4
2
0Aro
mat
ic V
OC
s (pp
bv)
11:08 AMAug/10/2008
11:12 AM 11:16 AM 11:20 AM 11:24 AMLocal Time
30
20
10
0
Methanol and M
TBE (ppbv)
80
70
60
50
40
30
NO
x (p
pbv)
1086420
Alkenes (ppbv)
c
Fig. 4. Aromatics, methanol, MTBE, butenes, pentenes and NOx observed at (a) G4, (b) G5,(c) G6, (d) G7, and (e) G8. Transient high levels of NOx are due to fresh on-road emissions.
14741

ACPD11, 14719–14746, 2011
Characterization ofgas stationemissions
J. Zheng et al.
Title Page
Abstract Introduction
Conclusions References
Tables Figures
J I
J I
Back Close
Full Screen / Esc
Printer-friendly Version
Interactive Discussion
Discussion
Paper
|D
iscussionP
aper|
Discussion
Paper
|D
iscussionP
aper|
22
447
448
Figure 4. 449
450
60
40
20
0Aro
mat
ic V
OC
s (pp
bv)
11:32 AMAug/10/2008
11:36 AM 11:40 AM 11:44 AM 11:48 AMLocal Time
100
80
60
40
20
0
Methanol and M
TBE (ppbv)
400
300
200
100
0
NO
x (p
pbv)
100806040200
Alkenes (ppbv)
d
200
150
100
50
0Aro
mat
ic V
OC
s (pp
bv)
11:56 AMAug/10/2008
12:00 PM 12:04 PM 12:08 PMLocal Time
600
400
200
0
Methanol and M
TBE (ppbv)
800
600
400
200
0
NO
x (p
pbv)
5004003002001000
Alkenes (ppbv)
e
Fig. 4. Continued.
14742

ACPD11, 14719–14746, 2011
Characterization ofgas stationemissions
J. Zheng et al.
Title Page
Abstract Introduction
Conclusions References
Tables Figures
J I
J I
Back Close
Full Screen / Esc
Printer-friendly Version
Interactive Discussion
Discussion
Paper
|D
iscussionP
aper|
Discussion
Paper
|D
iscussionP
aper|
23
450
451
452
Fig. 5. Box plots of calculated emission rates (g s−1) of benzene, toluene, C8-aromatics (C8-A),C9-aromatics (C9-A), methanol, MTBE, butenes and pentenes at all eight gas stations. Eachbox shows the minimum and maximum emission rates of the species and the dash and solidlines indicate the mean and median values, respectively.
14743

ACPD11, 14719–14746, 2011
Characterization ofgas stationemissions
J. Zheng et al.
Title Page
Abstract Introduction
Conclusions References
Tables Figures
J I
J I
Back Close
Full Screen / Esc
Printer-friendly Version
Interactive Discussion
Discussion
Paper
|D
iscussionP
aper|
Discussion
Paper
|D
iscussionP
aper|
24
453
454
455
Fig. 5. Continued.
14744
ACPD11, 14719–14746, 2011
Characterization ofgas stationemissions
J. Zheng et al.
Title Page
Abstract Introduction
Conclusions References
Tables Figures
J I
J I
Back Close
Full Screen / Esc
Printer-friendly Version
Interactive Discussion
Discussion
Paper
|D
iscussionP
aper|
Discussion
Paper
|D
iscussionP
aper|
25
456
457
Figure 5. 458
459
Fig. 5. Continued.
14745

ACPD11, 14719–14746, 2011
Characterization ofgas stationemissions
J. Zheng et al.
Title Page
Abstract Introduction
Conclusions References
Tables Figures
J I
J I
Back Close
Full Screen / Esc
Printer-friendly Version
Interactive Discussion
Discussion
Paper
|D
iscussionP
aper|
Discussion
Paper
|D
iscussionP
aper|
26
459
460
Figure 6. 461 Fig. 6. Averaged total observed VOC emissions from the eight gas stations.
14746