characterization of emissions from spray polyurethane foam
TRANSCRIPT

Characterization of Emissions from Spray Polyurethane Foam
Letter Report to U.S. Consumer Product Safety Commission Interagency Agreement CPSC-I-13-0016
February 2014
Dustin Poppendieck
Matt Schlegel Andrew K. Persily
Steve Nabinger
Indoor Air Quality and Ventilation Group Energy and Environment Division
Engineering Laboratory National Institute of Standards and Technology
Gaithersburg, Maryland This letter report provides a project update reflecting the activities to date under the FY2013 interagency agreement between CPSC and NIST. The objective of that agreement is to develop testing and measurement protocols for determining the quantities and properties of compounds released from spray polyurethane foam (SPF) as it is applied in residential settings. This document focuses specifically on the project task b, titled Experimental Testing – Phase I, which involved chamber testing of SPF samples to identify amine catalysts and aldehydes emissions after at least 24 hours of aging. Background Many homeowners and governments (state and local) are using insulating products at a growing grate, such as SPF, to increase the energy efficiency of their residences and other constructed buildings. Retrofitting or addition of foam insulation in new construction is supported in the United States by Federal efforts, such as tax incentives, and programs like EPA Energy Star and Design for the Environment. Because of these programs and other drivers for more efficient buildings, the foam insulation industry expects to see significant growth in the use of their products over the next few years. Homes can be insulated with SPF by a contractor hired by the homeowner or by using a do-it-yourself (DIY) kit. SPF is an insulation or sealant product, which is formed via an exothermic chemical reaction between A-side and B-side chemicals. The A-side consists of chemicals, such as methylene diphenyl diisocyanate or toluene diissocyante. Polyols are part of the B-side chemicals, which also include amine and/or metal catalysts, blowing agents, surfactants, and flame retardants. Amine and/or metal catalysts are used to promote the reaction between polyols and A-side
1

chemicals, which help polyurethane foam cells develop sufficient strength to maintain their structure and resist collapsing. Having SPF installed professionally or through DIY, along with use in arts and craft projects, leads to opportunities for the consumer to be exposed to the chemicals found in the SPF. In 2009, the Environmental Protection Agency (EPA) contacted CPSC, along with other federal agencies including the Occupational Safety and Health Administration (OSHA) and the National Institute for Occupational Safety and Health (NIOSH), to establish a working group to address potential hazards from the chemicals in SPF during its use. EPA staff became aware of potential hazards from some of the compounds in SPF from a clinical report of a death that occurred from exposure and sensitization to isocyanates released during the application of a polyurethane paint to motor vehicles in an auto shop. Isocyanates are very reactive compounds; thus, exposure to isocyanates is believed to be of greatest concern during and immediately after the application or installation of products containing isocyanates, such as SPF, before they can polymerize or react with other compounds found in the indoor environment. The CPSC staff, along with EPA and other federal agencies, has received a number of complaints regarding health effects resulting from the installation of SPF in homes. Residents complain of a multitude of effects including severe respiratory irritation, breathing difficulties, dizziness and nausea. In some cases, the effects are so severe that consumers can no longer live in their homes. Because these health effects occur several days to months following the SPF installation in the home, it is unlikely that isocyanates are causing these effects. To try to better understand these health effects, EPA is developing action plans associated with isocyanates, specifically a plan to measuring isocyanates from SPF12. To determine what other compounds could be causing these health effects from SPF, CPSC contracted with Versar, Inc to produce a toxicological profile of select amine catalysts found in SPF. Information from this report suggests that amine emissions may be the cause of these long term health effects. Also, anecdotal information suggests that aldehyde emissions may also add to these described health effects. CPSC staff and its federal partners met with members from the Center for the Polyurethanes Industry (CPI) of the American Chemistry Council (ACC). who provided exposure data on some high-pressure and low-pressure SPF systems. As a result of these exposure studies, the CPI recommends that homeowners leave the premise during SPF installation and not return until 24 hours after the installation. However, CPSC Staff is not satisfied with the robustness of the data that was provided and questions the sufficiency of the 24-hour re-entry time. CPSC, along with its federal partners, needs to perform exposure studies that include measuring exposure levels (1) at different distances from the spray source, (2) on a time course, (3) under varied air change rates, and (4) from SPF that is not mixed correctly. The results of these studies will allow staff to make
1http://www.epa.gov/oppt/existingchemicals/pubs/actionplans/tdi.html 2 http://www.epa.gov/dfe/pubs/projects/spf/spray_polyurethane_foam.html
2

adequate determinations of the potential health impacts of SPF insulation products and provide guidance to consumers on their safe use. The results of these studies may also contribute to the development of voluntary standards. There are work items under the ASTM Indoor Air Quality (D22.05) subcommittee to standardize test methods for spraying, sampling, and packaging SPF insulation products and to measure emissions from these products. ASTM WK30960 is entitled: New Practice for Spraying, Sampling, and Packaging Spray Polyurethane Foam (SPF) Insulation Samples for Environmental Chamber Emissions Testing. Two new work items (WK 40292 and 40293) were just begun concerning SPF and testing methods. Currently, there are no standardized test methods that adequately address measuring the chemical emissions of SPF insulation products. These standards will help address that need. Research Efforts To Date Initial efforts involved equipping the NIST Indoor Air Quality and Ventilation Group laboratories with the ability to analyze amines using GC/MS. A detailed Standard Operating Procedure was developed (Appendix B). A cutting tool was also machined to precisely cut SPF to fit tightly within existing Markes 250 micro-chambers (Figure 1) according to ASTM D7859-e13. The chambers were operated at a temperature of 40 ˚C with a 100 mL/min airflow of ultra-high purity air humidified to 38 % at 25 ˚C. Emissions were captured on two types of sorption tubes. Tenax TA® sorption tubes were used to capture amine catalysts, flame retardants and other volatile organic compounds, and were subsequently analyzed by GC/MS. Aldehydes were sampled with DNPH cartridges and the extracted derivatives analyzed using LC/UV. Prior to sampling the Tenax TA® tubes were cleaned with ultra high purity nitrogen at 330 °C with a Markes TC-20 tube cleaner. The tubes were spiked with 1.24 ng toluene D8 using a liquid solution injection into a TALBOYS® Standard Heatblock (details in the Appendix). Tenax TA® tubes were attached to the effluent flow of each chamber for 2 to 15 minutes (0.2 to 1.5 L of sample) depending on the concentration of the flame retardant. The Tenax TA® tubes were thermally desorbed using a Markes Unity thermal desorbing system. The setpoints used for the thermal desorption system are highlighted in Appendix A: Analysis Methods. A non-activated guard column was used in the transfer line to the GC/MS. An Rtx-5 Amine column (30.0m x 250µm x 0.50µm) was used for compound separation in the GC/MS (method details in Table 4 in Appendix A). DNPH tubes were attached to the microchamber outlets to capture aldehyde and ketones in roughly 18 L of the effluent gas, which corresponded to 3 hours of sampling. DNPH tubes were extracted with acetonitrile. Verification of the presence of these chemicals was done using HPLC-UV retention time analysis. Standards (Table 1) were purchased for target compounds based on chemicals studied by previous researchers (e.g., Sebroski et. al. 2012). Neat chemical standards were prepared by dilution in methanol. Standards were spiked onto Tenax TA® tubes as described in detail in the appendix.
3

Linear standard curves were created for each chemical (RSQ values for each linear curve are shown in Table 1). Isocynates were not analyzed as part of during this research effort as EPA and others are studying SPF isocynate emissions.
Table 1. Chemicals Analyzed
Name Acronym Linear RSQ Tris-(1-chloro-2-propyl) phosphate TCPP 0.999 Bis (2-Dimethylaminoethyl) ether BDMAEE 0.986 Tetramethyliminobispropylamine TMAEEA 0.905 Pentamethyldiethylene triamine PMDTA 0.995 Bis (dimethylaminopropyl) methylamine DAPA 0.953
Spray foam is typically only applied when wall temperatures exceed 20 °C. Hence, most local sprayers have not been spraying since initiation of this project. Efforts were made to collect new SPF sprayed by local sprayers in a SPF test facility. Discussions have occurred with the Spray Polyurethane Foam Alliance (SPFA) and American Chemistry Council (ACC) to allow sampling during spray events in January. However, concerns about confidential business information being associated with the sample results have resulted in delays in this sampling. .
Table 2. Organizations contacted in efforts to obtain freshly sprayed foam:
Organization Name American Chemistry Council Chris Braddock American Chemistry Council Heather Palfrey American Chemistry Council Lee Salamone Spray Polyurethane Foam Alliance Rick Duncan Spray Polyurethane Foam Alliance Kurt P. Riesenberg Bayer Material Science John Sebroski EPA Mark Mason OSHA Kathleen Fagan NIOSH Bob Stryker Environmental Health Watch Matt Berges Pure Seal Torsten Hansen Center for Construction Research and Training Jim Planter AC &R Insulation Scott Cameron
Given the challenges in acquiring freshly sprayed samples, aged SPF was also investigated. Open cell, low density SPF was applied to the National Institute of Standards and Technology (NIST) Net Zero Energy Residential Test Facility (NZERTF) in the summer of 2012. In January of 2014, three ~0.8 g samples were cored from overspray in the basement rafters of the NZERTF (Figure 1). Since the foam was in the basement, it is unlikely that the temperature of the foam ever exceeded 25 ˚C after application. Triplicate SPF samples were placed in micro-chambers at 40 ˚C with a 100 mL/min airflow of ultra-high purity air humidified to 38 % at 25 ˚C.
4

Figure 1. Sampling of foam (left). Sample in micro chamber (right).
Despite aging over 1.5 years, the flame retardant tris (1-chloro-2-propyl) phosphate (TCPP) was emitted at measurable concentrations. Over a period of two weeks the average TCPP concentration chamber concentration was 324 ± 96 µg /m3 air (the number following the symbol ± is the numerical value of an expanded uncertainty U = k uc, with U determined from a combination of the estimated standard deviation (uc) and a coverage factor k = 2, with parameters assumed to be approximately normally distributed and the unknown value assumed to lie in the interval defined by U with a level of confidence of approximately 95 %). Figure 2 shows the TCPP concentrations normalized by the mass of SPF in each chamber. These results show that when wall temperatures are elevated SPF flame retardants can be emitted into indoor air at significant concentrations at time frames greater than 18 months after application. No amine catalysts were detected, indicating that no significant exposure to amines may be occurring 1.5 years after application of this insulation. Based on these preliminary results, reported health impacts after this time frame may not be the result of amine emissions or may be from foam applied in a manner that is not represented by the tested foam. Preliminary studies showed foam less than three months old can emit an order of magnitude higher concentration of TCPP and at least one amine at similar concentrations.
A wide range of aldehydes (hexanal, heptanal, octanal, and nononal) were detected from the NZERTF sample. However, given the fact the samples were aged in a house for 1.5 years, it is impossible to determine from these measurements alone whether the aldehydes were primary emissions or the desorption of compounds that had been emitted by other building products that had sorbed to the SPF. Note that the concentrations of these compounds have been measured in the indoor of the house on a monthly basis since mid-2013. This research is still ongoing. The sample used in Figure 1 will be monitored for at least 250 total hours to determine if the TCPP emissions decrease with time.
5

Figure 2: TCPP air concentrations in microchamber per gram of SPF in chamber.
This data is the first data that examines emissions from SPF after prolonged curing (1.5 years). TCPP was emitted at measurable levels while amine catalysts were not detected. These results suggest that occupant exposures 1.5 years after application may be associated with the flame retardant and not amine emissions. Note that these conclusions would not necessarily apply to foam with different constituents or applied in a different manner.
Next Steps in Research Effort The existing study on the NZERTF samples will continue until newer samples become available. Two more foams will be investigated once they are acquired to evaluate amine and aldehyde emissions in the microchambers per ASTM. Disclaimer Certain trade names or company products are mentioned in the text to specify adequately the experimental procedure and equipment used. In no case does such identification imply recommendation or endorsement by the National Institute of Standards and Technology, nor does it imply that the equipment is the best available for the purpose.
6
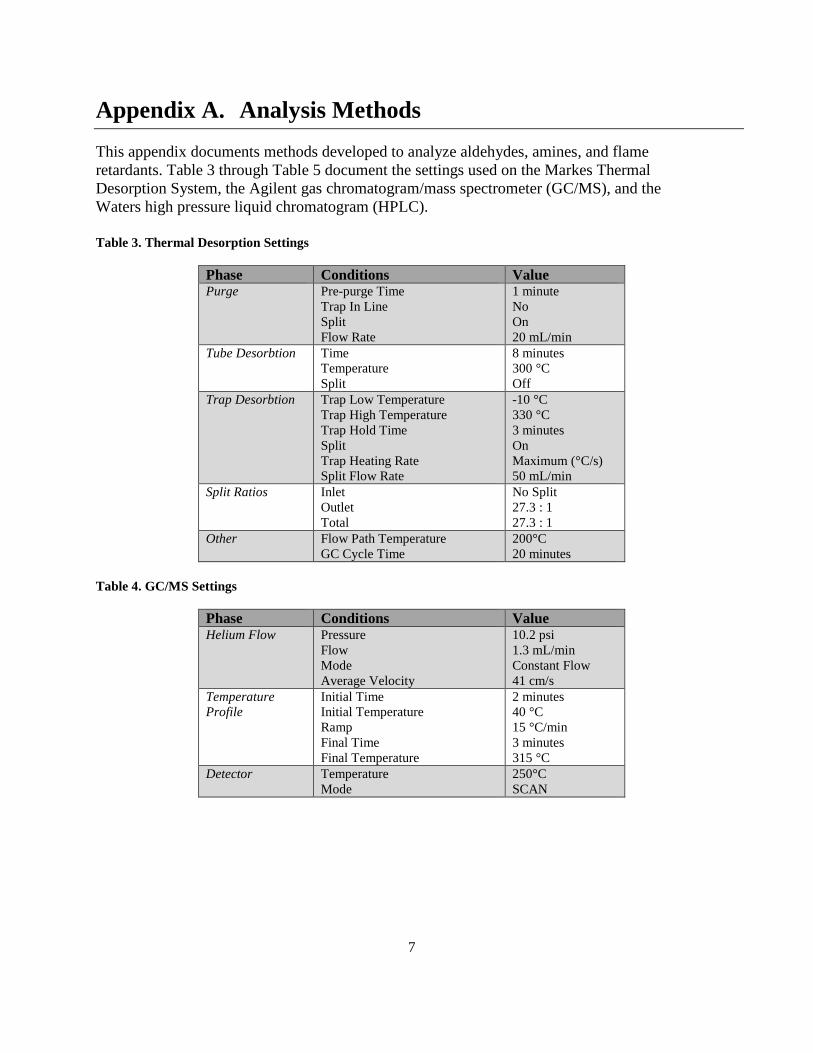
Appendix A. Analysis Methods This appendix documents methods developed to analyze aldehydes, amines, and flame retardants. Table 3 through Table 5 document the settings used on the Markes Thermal Desorption System, the Agilent gas chromatogram/mass spectrometer (GC/MS), and the Waters high pressure liquid chromatogram (HPLC).
Table 3. Thermal Desorption Settings
Phase Conditions Value Purge Pre-purge Time
Trap In Line Split Flow Rate
1 minute No On 20 mL/min
Tube Desorbtion Time Temperature Split
8 minutes 300 °C Off
Trap Desorbtion Trap Low Temperature Trap High Temperature Trap Hold Time Split Trap Heating Rate Split Flow Rate
-10 °C 330 °C 3 minutes On Maximum (°C/s) 50 mL/min
Split Ratios Inlet Outlet Total
No Split 27.3 : 1 27.3 : 1
Other Flow Path Temperature GC Cycle Time
200°C 20 minutes
Table 4. GC/MS Settings
Phase Conditions Value Helium Flow Pressure
Flow Mode Average Velocity
10.2 psi 1.3 mL/min Constant Flow 41 cm/s
Temperature Profile
Initial Time Initial Temperature Ramp Final Time Final Temperature
2 minutes 40 °C 15 °C/min 3 minutes 315 °C
Detector Temperature Mode
250°C SCAN
7

Table 5. HPLC Settings
Phase Conditions Value Column Type
Average Pore Diameter Particle Diameter Ratio Pore Volume Surface Area Phase Ratio
XBridge™ C18 3.5 mm, 4.6 x 150 mm 141 Å 1.44 0.72 cm3/g 184 m2/g 120 m2/cm3
Detector Ultra Violet (UV) 360 nm Eluents A
B Water Acetonitrile
Flow Initial Pressure Constant Flow Rate
3350 psi 1.5 mL/min
Gradient Time Initial 32 34 34.1 36
% A 60 36 36 60 60
% B 40 64 64 40 40
Curve -- 6 6 6 6
Appendix B. Standard Operating Procedure: Sampling
Procedure for Spray Polyurethane Foam The appendix contains the standard operating procedure (SOP) for collecting and analyzing samples of spray polyurethane insulation foam (SPF). It contains the processes used for preparation, sampling, and analyzing multiple samples of SPF in order to determine what chemicals are emitted over the course of a multi-week period.
B.1. Pre-experiment Steps The following tasks must be completed prior to starting the experiment. Turning on machines and warming chemicals must be completed the same day as the experiment. Cleaning equipment and setting up a system can be completed in the days prior.
8

B.1.1. Putting on Gloves • Put on a pair of latex gloves to avoid contaminating samples. • Gloves can be found in the drawer labeled: GLOVES as shown in Figure B.1.
Figure B.1: The latex gloves that must be worn so
that the samples are not contaminated.
9

B.1.2. Preparing Heatblock • Set the TALBOYS® Standard Heatblock to high as shown in Figure B.2 . This is used
along with a Single Absorbent Tube Injector System. The warm-up time is ~1 hour.
The Thermistor Thermometer should read: “OFLO” when the heatblock has
finished warming up (Figure B.3).
Figure B.2: Set heatblock to high. Figure B.3: Thermistor Thermometer used to measure the temperature of the heatblock. It currently reads: OFLO, which signifies that it has reached at least 110 °C.
Set to high
10

B.1.3. Turning on Gas for Heatblock and Markes TC-20® • Locate the high-pressurized, helium gas cylinder used for the heatblock and Markes TC-
20® (Figure B. 4). • Rotate the nozzle counterclockwise until it can’t be turned any further. • The psi for the canister should be within the range of 100 to 2000 psi. If it is lower than
100, the cylinder must be changed before starting the experiment.
Figure B.4: High-pressurized gas cylinder
containing compressed helium is used with the heatblock and tube conditioner.
Gas Identifier
PSI reading
Nozzle
11

B.1.4. Warming Chemicals • Remove Toluene D8, TCPP, PMDTA, DAPA, BDMAEE, and, TMAEEA from the
Thermo Scientific refrigerator (Figure B.6) and place them on the counter.
Figure B.6: The Thermo Scientific
refrigerator used to store the Toluene and Toluene D8.
• Close the refrigerator so that it makes an air-locking sound. • Allow the chemicals to reach room temperature. Since the temperature of the room is held
relatively constant, this will ensure consistency throughout testing that spans the course of multiple days. Move onto the next steps while chemicals are warming.
B.1.5. Cleaning Tenax® tubes • Tenax tubes must be cleaned with the Markes TC-20 tube conditioner to insure that any
residue from a previous sample is removed. • Turn on the Markes TC-20 by flipping the switch on the back of the machine. • Press the “U” button in order to start the heating process. The red number on the top
display will start to increase to the value of the green number. The red number on the bottom display is a timer. The timer reads in hours and minutes. The timer will increase to 2 hours before the machine starts to cool down (Figure B.7).
• Detach the Tygon® tubing from the top of the machine by pulling down on the metal release and pulling upward on the tubing.
• Grab the black handle, remove the tube holder from the machine, and place it on the counter.
• Acquire up to 20 Tenax® tubes that need to be cleaned. Remove the end caps from the tubes. Slide the end of each tube without an engraved circle into the holes located on the opposite side of the black handle (Figure B.8).
Figure B.5: The chemicals used to make Standard
Curves.
12

Figure B.8: The Tenax® tubes must be oriented so that the engraved circle is on the opposite side of the holes.
• Grab the black handle and insert the tubes
into the Markes TC-20®. Reattach the tygon tubing. • Wait for the timer to reach 2 hours (when it starts to cool down). Detach the Tygon® tubing
again and remove the container holding the Tenax® tubes. Place the container sideways on the metal tray located on the side of the Markes TC-20®. Allow the tubes to cool. Other steps can be completed while waiting for cleaning and cooling to complete.
B.1.6. Baking Septa • The SUPELCO® Thermogreen LB-1 Septa, Half Hole Types emit chemicals that taint the
experiment’s results. They must be baked to ensure insignificant emissions. • Open the GCMS and place at least three septa inside. Close the door and set the oven
temperature to 250 °C. Allow them to bake for at least 1.5 hours. • Once the baking time has finished, set the oven temperature to 40 °C. When it reaches this
temperature, remove the Septas and place them into an aluminum tray so that they are not mixed with unbaked Septas.
• This step does not have to be completed each day.
B.1.7. Acquiring Syringes • Retrieve a 1.0 μL syringe for Toluene D8. • Retrieve a 2.0 μL syringe for the other chemicals.
B.1.8. Cleaning Syringes • Before a syringe is used for a chemical, flush out any residue from a pre-existing chemical.
Figure B.7: The Markes TC-20® tube
conditioner used to clean Tenax tubes.
13

• All equipment must be set up inside the fume hood. • Obtain two clean beakers. Designate one as the “Clean” beaker and the other as the “Dirty”
beaker. Pour methanol into the “Clean” beaker. • Rinse the needle of the syringe with methanol from the “Clean” beaker while holding it
above the “Dirty” beaker. • Withdraw methanol from the “Clean” beaker into the syringe. Place the tip of the syringe
against the inside edge of the “Dirty” beaker and dispense the methanol. Repeat this step at least six times.
• Rinse the needle of the syringe again with methanol and wipe it with a Kimwipe.
B.1.9. Replacing Septa • Remove the Septa located in the injector system at the top of the heatblock and throw it
away. • Retrieve a baked Septa from the aluminum tray and fit it into the opening where the other
was previously located. The end with the hole must be facing upwards.
B.1.10. Preparing the Record Book • Acquire a record book for the experimental data. Open the book to the next available page.
At the top of the page, record the date and the chemicals used for the experiment. • Create a table with columns named: Position, Tube, Sample, Flow, and Time. The Position
column is used to mark the tube position in the tray(s). The Tube column represents the number on the tube used in the position. The Sample column has the name of the sample injected into each tube. The Flow column is a record of the flow rate of the Thermal Extractor Chamber. The Time column is the time frame in which the sample was taken.
B.1.11. Cleaning Thermal Extractor Chambers • Set the thermal extractor being used inside a fume hood. • Remove the chambers from the thermal extractor. • Clean the chambers thoroughly with methanol and a Kimwipe. • If the O-Rings for the chambers are brown, then remove them and set them down next to
the thermal extractor. If they are black (UHP), leave them on the chambers. • Return the chamber to its corresponding location in the thermal extractor and close it. • Set the thermal extractor to 250 °C for at least 2 hours to remove any possible residue.
When finished, return the brown O-Rings to the chambers.
14

B.1.12. Cleaning Foam Cutter • Rinse the inside and outside edges of the foam cutter with methanol and clean it using a
Kimwipe.
Figure B.9: The foam cutter used to collect
samples of spray foam.
B.1.13. Increasing the Air Humidity • Fill the case to approximately 90 % of its capacity with deionized water. • To prevent leakage wrap Teflon® tape on the threads of each section before attaching them
together after filling. • Set the case vertically and place a container underneath to catch any possible leakage.
15

Figure B.10: The case used to increase the
humidity of the air used for the thermal extractor.
B.1.14. Checking Thermal Extractor Temperatures • Fill the chambers in the thermal extractors 75 % full with deionized water. • Set the thermal extractor to 40 °C. • Once it has been at the selected temperature for at least an hour, insert a calibrated
thermocouple into each chamber and record the temperature readings. • Verify the temperatures between all the chambers have a negligible difference.
B.2. Initial Experiment Steps These steps must be completed in order to prepare for the experiment. They do not have to be done the same day as the experiment.
B.2.1. Preparing Chemicals • Acquire the following equipment: 5 0 mL volumetric flask, 5 mL vial, 2.0 µL syringe, 1
mL glass syringe, two beakers, chemical labels, balance, methyl alcohol (assay by GC analysis 99.8% min), and neat chemicals.
16

• Rinse the 5.0 mL volumetric flask, the 5mL vial, and one of the beakers at least seven times with methanol. Clean the syringes as described in section A.1.8.
• Place the 5.0 mL volumetric flask and 5mL vial in the oven (Figure B. 11) to volatize any leftover methanol.
Figure B.11: The oven used to bake
out any leftover methanol from cleaned equipment.
• Recalibrate the balance so that it adjusts to the current room temperature. • Remove the empty 5.0 mL volumetric flask and vial from the oven and place them in the
Thermo Scientific Refrigerator. Once the flask has cooled, remove it and place it on the balance. Zero the balance.
• Using the 2.0 µL syringe, measure out 1.0 µL of neat chemical and dispense it into the flask. Observe the mass of the chemical added. Add more neat chemical until the desired mass is obtained.
• Cover the top of the flask and record the mass of the neat chemical. Move to the fume hood.
• Using the 1 mL glass syringe, retrieve methanol from the cleaned beaker and dispense it into the flask until the meniscus is level with the line located in the middle of the flask’s neck.
• Close the flask, hold the top in place, and turn the flask upside down at least seven times. • Remove the 5 mL vial from the refrigerator and pour the newly made mixture into it. Close
the vial. • Determine the concentration of the mixture by using the recorded mass and the current
volume (5 mL). Record the concentration.
17

• Write the concentration of the chemical and the chemical’s name on a label. Record the name of the person who made the mixture and the date it was made. Attach the label to the 5 mL vial.
B.2.2. Diluting chemicals • If the original chemical concentration is too high to be accurately determined by the
GCMS, the chemical should be diluted. • Acquire the following equipment: 5.0 mL volumetric flask, 5 mL vial, 500 µL syringe, 1
mL glass syringe, two beakers, chemical labels, balance, methyl alcohol (assay by GC analysis 99.8 % min), and previous chemical mixture.
• Follow all the same steps for cleaning equipment as described in Section A.2.1. • Determine the new, desired chemical concentration. Calculate the required volume needed. • Using the 500 µL syringe, measure the required volume and insert it into the 5.0 mL
volumetric flask. • Using the 1mL glass syringe, retrieve methanol from the cleaned beaker and dispense it
into the flask until the meniscus is level with the line located in the middle of the flask’s neck.
• Follow the same steps in Section A.2.1 for mixing and labeling the new chemical mixture.
B.2.3. Organizing tubes • Tenax® tubes must always be organized so that the blue cap is on the right side of the tray,
and the silver cap is on the left. • The engraved circle on the tube must always be on the side with the blue cap. • Order the Tenax® tubes into an every-other pattern. Odd position tubes will receive a
sample while even tubes will be blanks. • Orient the odd position tubes so that the blue cap is caught on the divider located in the
center-right position. • Orient the even position tubes so that the blue cap is hanging over the right side of the tray. • If standard curves have already been created, move onto Section A.2.6; otherwise, proceed
to Section A.2.4.
B.2.4. Determining mass range for GCMS analysis • This process only has to be done once for each chemical. • Obtain the first tube in the odd position. Remove the end caps and place them next to the
heatblock. • Obtain the desired chemical dilution. Using a clean 2.0 µL syringe measure out volumes of
the chemical in 0. 1 µL increments starting with 0.1 µL. • Inject the chemical directly into the Tenax®tube. Keep the tube at an incline for as long as
possible before quickly inserting it into the injector system.
18

• Inject 1. 0µL of Toluene D8 into the injector system via the green Septa at the top. • Allow the chemicals 4 minutes to volatize. • Remove the tube and reattach the end caps. Place the tube flat in the tray. Inject the even
tubes with just Toluene D8. • Run the tubes in the GCMS. Conduct data analysis and determine the points where the
mass of the chemical is too high or too low for the GCMS to accurately determine it. This process has to be repeated with a higher or lower concentration of the chemical if the maximum and minimum ranges were not found.
• Once found, record the maximum and minimum masses of the selected chemical that can be accurately determined by the GCMS.
• Clean the Tenax® tubes as described in (Section A.1.5).
B.2.5. Creating Standard Curves • Using the maximum and minimum mass range determined in Section A.2.4, organize a
layout that will include both of these points as well as six to eight points between them. Record the order in the record book.
• Use the same process as Section A.2.4 to inject and run the tubes. • Conduct GCMS data analysis and create a standard curve from these points. The R2 value
must be at least 0.99 in order for the curve to be used. • Clean the Tenax® tubes as described in Section A.1.5.
B.2.6. Spiking Tenax® tubes • Obtain the first tube in the odd position. Remove the end caps and place them next to the
heatblock. Loosen the white, plastic circle on the single tube injector system and insert the engraved side of the Tenax into the opening. Tighten the white, plastic circle.
• Withdraw one microliter of Toluene D8 using a 1.0 µL syringe. Insert the needle into the single tube injector system via the Septa. Dispense the Toluene D8 into the system and hold for three seconds.
• Remove the needle and wait for 4 minutes. • Remove the Tenax tube from the injector system and attached the caps to the ends. • Place it back in the tray so that the blue end is caught on the divider located in the center
position. • Repeat this process for any remaining tubes that will receive samples.
B.2.7. Creating Blanks • Once all of the tubes receiving a sample have been spiked, start creating blanks. • Repeat Section A.2.6. When finished, place the tube flat in the tray.
19

B.3. Experimental Steps These steps include the collecting and sampling of the spray foam.
B.3.1. Collecting a Fresh Sample of Spray Foam • Take the foam cutter that had previously been cleaned and use it to carve a circular sample
of foam out of a pre-existing sprayed site (Figure B.12).
Figure B.12: The foam cutter being used to cut a circular
sample from the spray site. • Alternate rotating directions while pushing the cutter forward into the foam. Once the
sample has been cut, place it in a plastic bag and bring it to the lab. Collect three samples and place them into three separate bags before proceeding to the lab.
• If the sample is too high to fit in the thermal extractor chambers, use a clean knife to remove foam from the bottom of the sample.
• Mass each sample and write them down in a record book. • Place a sample into each of the chambers. The surface of the foam that was exposed to the
air in its previous condition should be oriented to the top position. • Place the chambers into the thermal extractor.
20
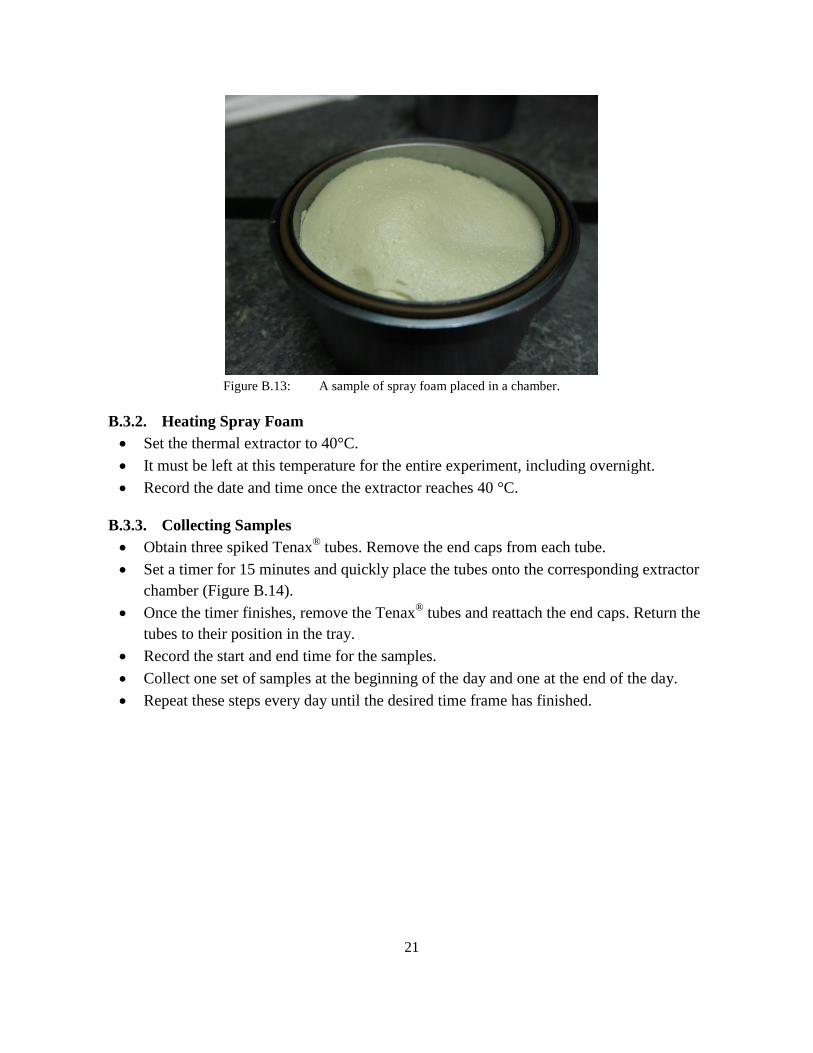
Figure B.13: A sample of spray foam placed in a chamber.
B.3.2. Heating Spray Foam • Set the thermal extractor to 40°C. • It must be left at this temperature for the entire experiment, including overnight. • Record the date and time once the extractor reaches 40 °C.
B.3.3. Collecting Samples • Obtain three spiked Tenax® tubes. Remove the end caps from each tube. • Set a timer for 15 minutes and quickly place the tubes onto the corresponding extractor
chamber (Figure B.14). • Once the timer finishes, remove the Tenax® tubes and reattach the end caps. Return the
tubes to their position in the tray. • Record the start and end time for the samples. • Collect one set of samples at the beginning of the day and one at the end of the day. • Repeat these steps every day until the desired time frame has finished.
21

Figure B.14: A Tenax® tube placed to collect the emissions
from each sample of spray foam.
B.3.4. Measuring the Flow Rates • While the sample is being collected, measure the air flow rates for each chamber using the
Buck Calibrator® (Figure B.15). • Take the average of three consecutive measurements and record the average result for each
chamber.
22

Figure B.15: Measure the airflow rates for each
chamber while the samples are being collected.
B.4. Post Experiment Steps These steps are completed after all the samples are collected for the day.
B.4.1. Preparing for Analysis • Place the trays inside the Markes UltrA TD® and close the door. • Create a GCMS and Markes Unity® sequence for the samples and run both of them.
B.4.2. Turning off Equipment • Turn off the heatblock, the thermal extractors, the tube conditioner, and the gas used for
each of them.
B.4.3. Cleaning Equipment • If there is time left in the current day, clean all of the equipment used for the experiment. If
not, clean the equipment the following day. B.5. Data Analysis The machines used for data analysis are the Markes Air Server®, UltrA TD®, thermal desorber and the Agilent Technologies GCMS.
23
B.5.1. Running the Sequences • Load the appropriate method and sequence in the GCMS Analysis software. It must
contain the correct number of tubes, and the labels in the software should correspond exactly with the labels written in the book.
• Choose a Unity Controlling Sequence that runs the desired number of tubes. • Run the sequence in the GCMS Analysis software. • Wait for the appropriate messages to appear on the screen that signifies the GCMS is ready
and then run the Unity sequence. • The Unity and GCMS Enhanced Data Analysis Sequence step-by-step guides can be used
to set up this process. • The first tray should be placed into the machine. • Check the Unity Sequence Reporter 30 minutes later to make sure the sequence started to
execute properly.
B.5.2. GCMS Enhanced Data Analysis • Update the standard curves in the software and record the Area and Internal Standard Area
in excel. • Use the new standard curve to calculate the mass of the targeted chemical based on the
Area and Internal Standard Area gathered from the sample. • The GCMS Enhanced Data Analysis step-by-step guide can be used to help conduct this
process.
24