characterization of chemical composition, milling properties - ideals
TRANSCRIPT
CHARACTERIZATION OF CHEMICAL COMPOSITION,
MILLING PROPERTIES AND CARBON DIOXIDE
DIFFUSIVITY RESULTING FROM EARLY HARVEST CORN
AND CORN STOVER
BY
HAIBO HUANG
DISSERTATION
Submitted in partial fulfillment of the requirements
for the degree of Doctor of Philosophy in Agricultural and Biological Engineering
in the Graduate College of the
University of Illinois at Urbana-Champaign, 2013
Urbana, Illinois
Doctoral Committee:
Assistant Professor Mary-Grace Danao, Chair
Associate Professor Vijay Singh
Associate Professor Kent Rausch
Professor Fred Below
ii
Abstract
The increasing demand of corn as food and fuel sources has increased the competition
for feedstock between livestock and ethanol industries. Developing an effective corn
harvesting, storage and utilization system can help reduce the competition for the limited
corn supply in the current period. The overall goal of this study was to examine the
feasibility of early harvest of corn and corn stover and determine the implications of this
proposed practice on corn processing characteristics, chemical composition and nutritive
values. Effective diffusion coefficient of CO2 through bulk corn at different moisture
contents and temperatures were measured to a better understand CO2 movement during
corn storage, which could help develop a CO2 monitoring system for corn storage.
Corn plants were harvested at different maturity stages in 2009 and 2010 and were
quantitatively evaluated in terms of moisture contents, dry matter yields, compositions
and processing characteristics of corn and corn stover. The dry matter yield of corn
increased rapidly until reaching corn maturity and remained stable after maturity, with an
average yield of 11.1 t/ha over the two year study. For corn stover, the two year average
dry matter yield was 14.8 t/ha at the beginning of the study (filling stage) and decreased
to 13.2 t/ha at corn physiological maturity and further decreased throughout corn dry
down. Effects of corn harvest moisture content on dry grind ethanol processes were
observed on fermentation characteristics. The final ethanol concentration from corn with
harvest moisture content of 54% (110 days after corn planting, kernel dent stage) was 0.5
to 1.2 percentage points higher than that from mature corn with lower harvest moisture
contents. Corn harvest moisture content affected compositions and nutritive values of
corn, corn stover and dried distiller grain solubles (DDGS). As corn harvest moisture
content decreased, neutral detergent fiber, acid detergent fiber and lignin concentrations
in corn stover increased while crude protein concentrations decreased. These results
showed that the whole corn plant could be most efficiently used if the corn and corn
stover were harvested as soon as corn reached physiological maturity.
Early harvested corn poses a problem of storability due to its high moisture content.
Effective CO2 diffusion coefficients in bulk corn at various temperatures (10, 20 and
30°C) and corn moisture contents (14.0, 18.8 and 22.2% w.b.) were determined to help
iii
develop a CO2 monitoring system for corn storage. The diffusion coefficient
measurements were conducted using a diffusion cell surrounded by a water jacket, which
was used to control the temperature of the bulk corn in the diffusion cell. A source term
(CO2 respiration rate) was introduced in the diffusion equation to account for the CO2
production by corn during the diffusion process. The corn respiration rate increased
when temperature and corn moisture content increased. As respiration rate increased, it
had a larger effect on the diffusion pattern when measuring the effective diffusion
coefficient. The effective diffusion coefficients of CO2 through bulk corn ranged
between 3.10 × 10⁻⁶
and 3.93 × 10⁻⁶
m2/s, depending on temperature and moisture
contents. As temperature increased from 10 to 30°C, the diffusion coefficient of CO2
through bulk corn increased from 3.21 × 10⁻⁶
to 3.76 × 10⁻⁶
m2/s, respectively. As corn
moisture content increased from 14.0 to 18.8%, the effective diffusion coefficient through
bulk corn decreased from 3.59 × 10⁻⁶
to 3.39 × 10⁻⁶
m2/s, respectively. There was no
difference observed in the effective CO2 diffusion coefficient when corn moisture content
increased from 18.8 to 22.2%.
Keywords: Corn, harvest moisture, corn processing, carbon dioxide, effective diffusion
coefficient

iv
To my parents and wife

v
Acknowledgements
My sincerely thanks go to many people who have helped to and supported me
through my entire PhD study. This dissertation would not have been possible without the
tremendous help from them.
I would like to express my deepest gratitude to my advisor, Dr. Mary-Grace Danao. I
really appreciate her for bringing me to her lab at my most difficult time, and spending
tremendous time on my PhD study. Without her guidance, support and patience, my PhD
study would not have been done smoothly as planned. I would like to thank Dr. Vijay
Singh, Dr. Kent Rausch and Dr. Fred Below for their generous advice as committee
members in my Doctoral Committee. I especially thank Dr. Vijay Singh and Dr. Kent
Rausch for letting me conduct dry grind fermentation and wet milling process in their
labs.
I am grateful to my previous advisor, Dr. Steven Eckhoff for his guidance and caring
for the previous four years. I really appreciate him for leading me to the world of grain
processing and storage, preparing me well as a professional researcher. His critical
thinking, brilliant ideas and enthusiasm for the research have been inspiring me in my
whole PhD study.
Dr. Yanbin Li, my M.S. advisor, also deserves a lot of thanks. He showed me how a
real scientist works and trained me well for my PhD program. I thank him for his
encouragement and his guidance throughout the years when I was in Fayetteville,
Arkansas and the time beyond. I will never forget that he told me to work hard and work
smart.
I would like to thank Mrs. Li Xu for her great help. She was always available when I
needed a hand. I really appreciate her help on corn harvesting, wet milling experiment
and storage bin setup. Many thanks go to Mrs. Wei Liu for her help on dry grind
fermentation, HPLC analysis as well as discussion on the experimental results. I thank
my lab mates Dr. Shaochun Ma, Ning Wang, Dr. Shih-Fang Chen, Dr. Yigang Sun,
Benjamin Plumier, Daniel Williams, Dr. Junhui Li and Christopher Wilhelmi for the
great time working together and supporting each other. My deep appreciation also go to

vi
everyone in the Food and Bioprocessing Division for their assistance and stimulating
discussion, especially Dr. Esha Khullar, Dr. Bernardo Vidal Jr., Song Li, Ming-Hsu Chen,
Ravi Challa, Yingying Zhen and Yizhe Zhang.
I also would like to sincerely thank other faculty members and staffs who have
contributed to my PhD study. I would like to thank Dr. Richard Gates for providing me
the high quality Vaisala CO2 sensors, which played a key role in my corn respiration and
effective diffusivity tests. Also, I thank him for providing valuable advice on the sensor
calibrations. I would like to thank Steven Ford for helping me build the storage bin,
Jingwei Su for teaching me how to use the wireless sensors as well as the Labview
software.
Also, I would like to thank both CFAR and the ADM Institute for the Prevention of
Postharvest Loss for funding my research.
Finally, a special thank you goes to my family from my deep heart. My dad and mom,
who live far away from here in China, have always been supporting and loving me.
Without them, I would never have achieved what I have now. My wife, Yun Yin, my
spiritual support in my life, has been providing me all support she could have. Her joyful
personality and positive attitude have been making my life colorful and meaningful.
Thank you, Yun.
Thank you all.
vii
Table of Contents
Chapter 1. Introduction ............................................................................... 1
Chapter 2. Literature review ....................................................................... 4
2.1 Dry matter yield and moisture contents of corn and corn stover at harvest ........................... 4
2.1.1 Dry matter yield of corn and corn stover at harvest time ................................................ 4
2.1.2 Moisture contents of corn and corn stover at harvest time ............................................. 5
2.2 Composition of corn and corn stover at harvest .................................................................... 6
2.2.1 Structure and composition of corn .................................................................................. 6
2.2.2 Composition of corn stover at harvest ............................................................................ 8
2.3 CO2 coefficient measurement through bulk corn ................................................................... 9
2.3.1 Apparatus to measure effective diffusivity of CO2 through bulk grain .......................... 9
2.3.2 Other diffusion apparatus to measure gas diffusivity through porous media................ 12
Chapter 3. Effect of harvest date on dry matter yield and moisture
content of corn and corn stover ................................................................. 15
3.1 Introduction .......................................................................................................................... 15
3.2 Materials and methods ......................................................................................................... 15
3.2.1 Test site and material .................................................................................................... 15
3.2.2 Weather conditions ....................................................................................................... 16
3.2.3 Sample collection .......................................................................................................... 16
3.2.4 Moisture, dry matter yield, lodging percentage and moldy kernel percentage
determination ......................................................................................................................... 18
3.3 Results and discussion ......................................................................................................... 18
3.3.1 Weather conditions ....................................................................................................... 18
3.3.2 Corn and stover dry matter yield and distribution ........................................................ 19
3.3.3 Corn and corn stover moistures and field drying rates ................................................. 22
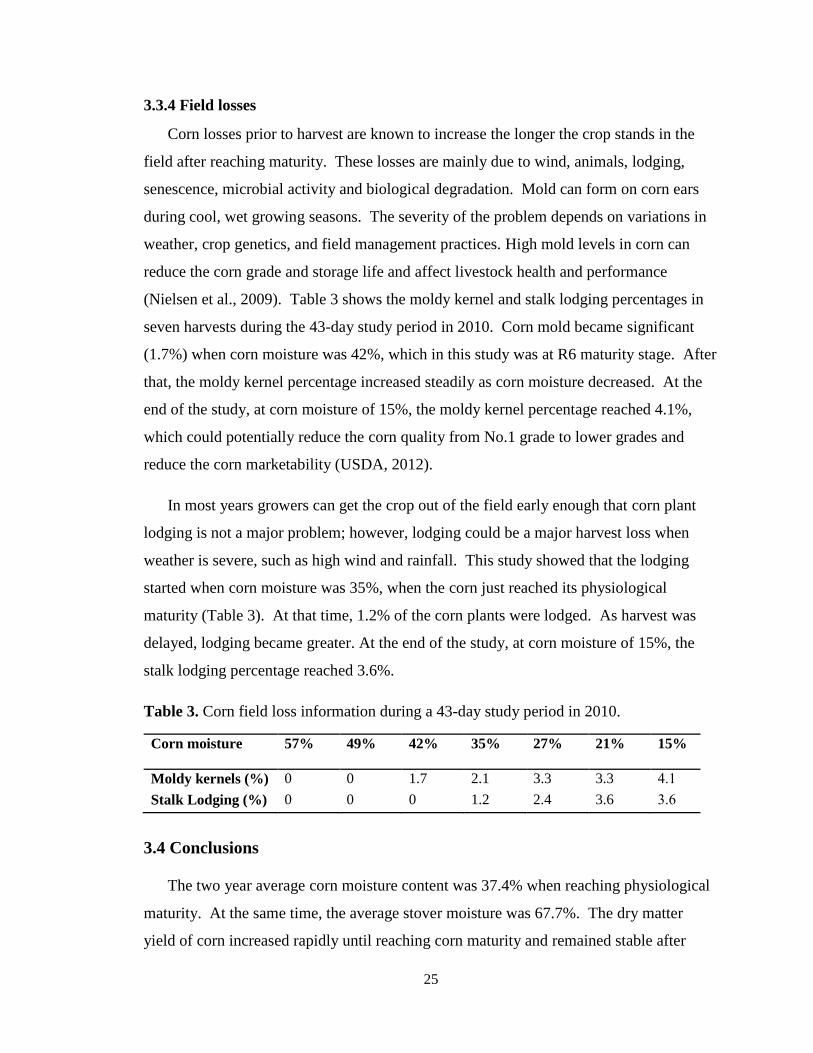
3.3.4 Field losses .................................................................................................................... 25
3.4 Conclusions .......................................................................................................................... 25
Chapter 4. Effect of corn harvest moisture on dry grind
fermentation characteristics and DDGS composition ............................. 27
4.1 Introduction .......................................................................................................................... 27
4.2 Materials and methods ......................................................................................................... 27
viii
4.2.1 Experimental materials ................................................................................................. 27
4.2.2 Enzymes and yeast ........................................................................................................ 28
4.2.3 Dry grind laboratory process......................................................................................... 28
4.2.4 Compositional analysis ................................................................................................. 30
4.3 Results and discussion ......................................................................................................... 30
4.3.1 Corn composition .......................................................................................................... 30
4.3.2 Fermentation results ...................................................................................................... 32
4.3.3 DDGS composition ....................................................................................................... 37
4.3.4 Ethanol yield per land use ............................................................................................. 38
4.4 Conclusions .......................................................................................................................... 38
Chapter 5. Effect of corn harvest moisture on wet milling yields
and starch pasting properties .................................................................... 40
5.1 Introduction .......................................................................................................................... 40
5.2 Materials and methods ......................................................................................................... 41
5.2.1 Experimental materials and chemical composition analyses ........................................ 41
5.2.2 Wet milling laboratory process ..................................................................................... 41
5.2.3 Starch pasting properties ............................................................................................... 43
5.3 Results and discussion ......................................................................................................... 44
5.3.1 Corn composition .......................................................................................................... 44
5.3.2 Yield of wet milled products ......................................................................................... 44
5.3.3 Starch pasting properties ............................................................................................... 48
5.4 Conclusions .......................................................................................................................... 51
Chapter 6. Effect of harvest moisture on composition and nutritive
value of corn stover and DDGS ................................................................. 52
6.1 Introduction .......................................................................................................................... 52
6.2 Materials and methods ......................................................................................................... 52
6.2.1 Experimental materials ................................................................................................. 52
6.2.2 Compositional and nutritive analyses ........................................................................... 53
6.3 Results and discussion ......................................................................................................... 54
6.3.1 Chemical composition of corn stover ........................................................................... 54
6.3.2 Feed value enhanced stover .......................................................................................... 56
6.4 Conclusions .......................................................................................................................... 59
ix
Chapter 7. Determination of the respiration and effective diffusion
coefficient of carbon dioxide through bulk corn ..................................... 60
7.1 Introduction .......................................................................................................................... 60
7.2 Materials and methods ......................................................................................................... 62
7.2.1 Sample preparation ....................................................................................................... 62
7.2.2 Diffusion measurement ................................................................................................. 62
7.2.3 Corn respiration measurement ...................................................................................... 67
7.2.4 Mathematical model and effective diffusion coefficient determination ....................... 68
7.2.5 Assumptions and limitations of the measurement model ............................................. 71
7.2.6 Experimental design and statistical analysis ................................................................. 72
7.3 Results and discussion ......................................................................................................... 72
7.3.1 Corn respiration rate ..................................................................................................... 72
7.3.2 Effective diffusion coefficient of CO2 through bulk corn ............................................. 74
7.4 Conclusions .......................................................................................................................... 78
Chapter 8. Conclusions and recommendations ....................................... 79
8.1 Conclusions .......................................................................................................................... 79
8.2 Recommendations for future work ...................................................................................... 80
References .................................................................................................... 82
Appendix A. Matlab code for calculating effective diffusivity .............. 94
Appendix B. Finite element modeling of carbon dioxide and
temperature distributions in stored corn ............................................... 100
1
Chapter 1. Introduction
The increasing demand of corn as food and fuel sources has intensified the
competition between livestock and ethanol industry. Developing an effective corn
harvesting, storage and utilization system can help reduce the competition for the limited
corn supply in the current period. In 2011-2012, the ethanol industry produced more than
53.2 billion liters of ethanol with 5011 million bushels of corn, which accounted for
40.3% of the total corn production (USDA, 2012). The rising price of gasoline will
stimulate the ethanol industry to increase productivity. Livestock (ruminants and non-
ruminants) are expected to consume about 50% of corn production each year (USDA,
2012). Unless there is a sharp increase in production or decreases in exports and other
uses of corn, the severe completion between these two industries would remain. Because
ruminants consume 35.6% of the 4,548 million bushels of corn fed to livestock in the
United States each year (Sewell et al., 2009), efficient utilization of the non-grain portion
of the corn plants as ruminant feed and grain for ethanol will allow the optimization of
both food and fuel production. On the other hand, postharvest losses due to spoilage
during corn storage remain a major problem in the world, developing of an effective corn
storage monitoring system would increase the end-use of corn.
Traditionally corn and corn stover were harvested after corn reached physiological
maturity and was dry (18-25% w.b.) (Unless noted otherwise, all the moisture content
values are reported on a wet basis.). The cost of drying makes harvesting corn early not
economically feasible. However there are several reasons why higher moisture, or early,
harvest of corn and corn stover would be advantageous. If the corn and corn stover were
harvested as soon as the corn reached physiological maturity, the stover would be less
lignified and more responsive to chemical treatment to enhance digestibility (Weaver et
al., 1978; Russell, 1986; Cone and Engels, 1993). With early harvest, corn stover yield
would be higher (Pordesimo et al., 2004a, 2004b; Shinners and Binversie, 2007); the
weather losses (early frost, storm etc.) of corn would be lower; and corn quality losses
due to mold and insect invasion would be reduced. Early harvest of corn and corn stover
also has advantages including better weather early in the harvest season, longer daylight
length (so work can be done more efficiently and safely) and longer harvest window.
2
Furthermore, early removal of corn from the field may allow the production of a second
crop that is nitrogen fixing. For example, hairy vetch has been shown to fix nitrogen over
winter, producing about 50-200 kg of nitrogen per hectare (Smith et al., 1987; Dabney et
al., 2011). This cover crop would also reduce soil erosion and increase soil organic
matter, which would allow a higher fraction of corn stover to be removed from the field.
Harvesting corn at or before physiological maturity may be advantageous to the
processing of the corn if it can be stored wet. First, the amylose/amylopectin ratio in corn
starch increases as corn matures (Shannon and Garwood, 1984; Li et al., 2007). Resistant
starch levels in corn starch are highly correlated with amylose levels (Berry, 1986). For
the corn ethanol industry, higher resistant starch in corn leads to decreased ethanol yields.
Second, with corn maturation, the starch granules in the endosperm are increasingly
surrounded by protein bodies and embedded in a dense protein matrix (Philippeau and
Michalet-Doreau, 1997), which would limit the action of starch hydrolytic enzymes
during liquefaction. Therefore, starch in corn harvested at or before maturity is easier to
hydrolyze into sugars by enzymes, thereby causing higher ethanol conversion efficiency
in the dry grind process.
Early harvested corn poses a problem of storability due to its high moisture content,
which needs strong postharvest management to reduce the loss during handling,
transportation, and storage. Postharvest losses due to spoilage during storage remain a
major problem around the world. Early detection of corn spoilage will reduce corn losses,
help prevent production of noxious mycotoxins in the food chain, and avoid financial loss
by applying timely management (e.g. stirring, aeration, etc.) (Ileleji et al., 2006).
Utilizing thermal cables in storage structures for temperature monitoring has been the
traditional method for detecting heat in bulk grain; however, because of the low thermal
diffusivity of bulk grain, a single temperature measurement is usually not sensitive
enough (Singh et al., 1983). Measured temperature cannot be easily interpreted due to
the influence of the ambient air fluctuation. For example, temperature of 25°C of bulk
grain may mean there is a possible spoilage spot in winter, or it may mean the bulk grain
is heated by the ambient air in the summer. Previous work (Maier et al., 2006) has shown
that monitoring of the head space of a bin with a carbon dioxide (CO2) sensor can lead to
3
earlier detection of microbial degradation of grain than temperature measurement alone.
As diffusion is expected to be one of the major factors in gas movement through bulk
grain, it is important to determine the effective diffusion coefficient of CO2 through bulk
grain.
The overall goal of this study was to examine the feasibility of early harvest of corn
and corn stover and determine the implications of this proposed practice on corn
processing characteristics; chemical composition and nutritive values of the corn and its
stover; and storability of high moisture corn. The specific objectives of the project were
to
1. determine the harvest date influence on dry matter yields and moisture contents of
corn and corn stover in the U.S. Midwest Corn Belt;
2. investigate the effect of corn harvest moisture on corn processing characteristics,
including wet milling and dry grind fermentation processes;
3. determine the chemical compositions and nutritive values of corn, corn stover and
dried distillers grain solubles (DDGS) at various corn harvest moisture contents
and determine the harvest time to maximize corn plant utilization; and
4. determine the respiration rate and the effective diffusivity of CO2 through bulk
corn as a function of temperature and moisture content for developing corn
storage monitoring system based on CO2 measurements.
4
Chapter 2. Literature review
2.1 Dry matter yield and moisture contents of corn and corn stover at harvest
Corn is a tall, annual plant from the grass family. It has a fibrous root system and an
erect stalk with a single leaf at each node and leaf in two opposite ranks. Each leaf
consists of a sheath surrounding the stalk and an expanded leaf blade connected to the
sheath by a blade joint. Normally, the tassel is located at the top of the main stalk and the
ears are located at the end of short branches. The ears, surrounded by husks, grow to
contain 500-1,200 developed kernels arranged in rows along a cob (Farnham et al., 2003).
The corn plant biomass mainly contains five parts: roots, stalks, leaves, husks, cob and
corn. Corn stover is defined as the above-ground portions of the corn plant, including
stalks, leaves, husks and cob, but excluding corn (Wyman, 2003).
2.1.1 Dry matter yield of corn and corn stover at harvest time
After fertilization is complete, the main function of the plant is to develop corn ears.
Nutrients are translocated from corn stover to corn kernels before kernels reach their
physiological maturity. Corn kernels stop taking nourishment from the plant and
generally complete the yield-making process about the same time a “black layer”
develops at the tip of the kernel, where the kernel attaches to the cob (Erickson and
Valentin, 2008). As harvest time delays, corn stover loses biomass primarily due to the
nutrient translocation from stover to kernel before kernel physiological maturity (Center
et al., 1970) and physical loss of leaf and husk as they become dry and brittle after kernel
physiological maturity (Liu et al., 2009).
The effect of harvest time on dry matter yield of the corn stover has been widely
studied. Cummins (1970) in Georgia stated the total dry matter yield of corn stover
declined by 19% from 4 September to 26 September. Russell (1986) in Iowa collected
corn stover samples at varying intervals from three weeks before to five weeks after corn
physiological maturity and found that dry matter yield of stover decreased at 0.16 g per
day for each corn plant. Studies in Tennessee reported that the dry matter yield of the
corn stover peaked at the time of kernel physiological maturity, and decreased by almost
40% when harvest was delayed 90 days after kernel maturity (Pordesimo et al., 2004a,
5
2004b). Shinners and Binversie (2007) found the dry matter yield of corn stover
decreased by around 20% between August and October over a three-year period study in
Wisconsin. In China, Liu et al. (2009) reported corn stover yield reduced by 48% when
harvest time was delayed from kernel filling stage to the following spring. There is
strong evidence from previous studies that dry matter yield of corn stover decreased at
various levels as harvest time delayed.
2.1.2 Moisture contents of corn and corn stover at harvest time
Moisture is a critical factor for efficient and safe collection, processing, drying and
storage of both corn and corn stover. High moisture corn and corn stover are expensive
to dry and spoil readily. High moisture biomaterials are also prone to spontaneous
combustion and fires (Jenkins and Sumner, 1986). For an individual field, the optimum
time to harvest is largely a balance of drying expenses from an early harvest and of
usually greater field losses if waiting for the corn to dry. Understanding the effects of
harvest time on the moistures of corn and corn stover would help corn producers to
manage the optimum time to harvest and minimize field loss.
Corn kernel moisture content decreases as the kernel develops through the blister
stage (~85% M.C.), milk stage (~80% M.C.), dough stage (~70% M.C.), dent stage
(~55% M.C.), and physiological maturity (~30-40% M.C.). Prior to physiological
maturity, decreases in kernel moisture occur from a combination of the accumulation of
dry matter (such as starch) plus the actual water loss via evaporation. After physiological
maturity (kernel moisture at 30-40%), decreases in kernel moisture are primarily due to
water loss via evaporation (Nielsen, 2009).
The average kernel drying rate largely depends on weather and varies considerably
from year to year. Corn kernel in the field would dry very little when weather conditions
are cool and wet, but can lose more than one percentage point of moisture in a warm and
dry day. Studies in recent years showed that the average corn kernel drying rate ranges
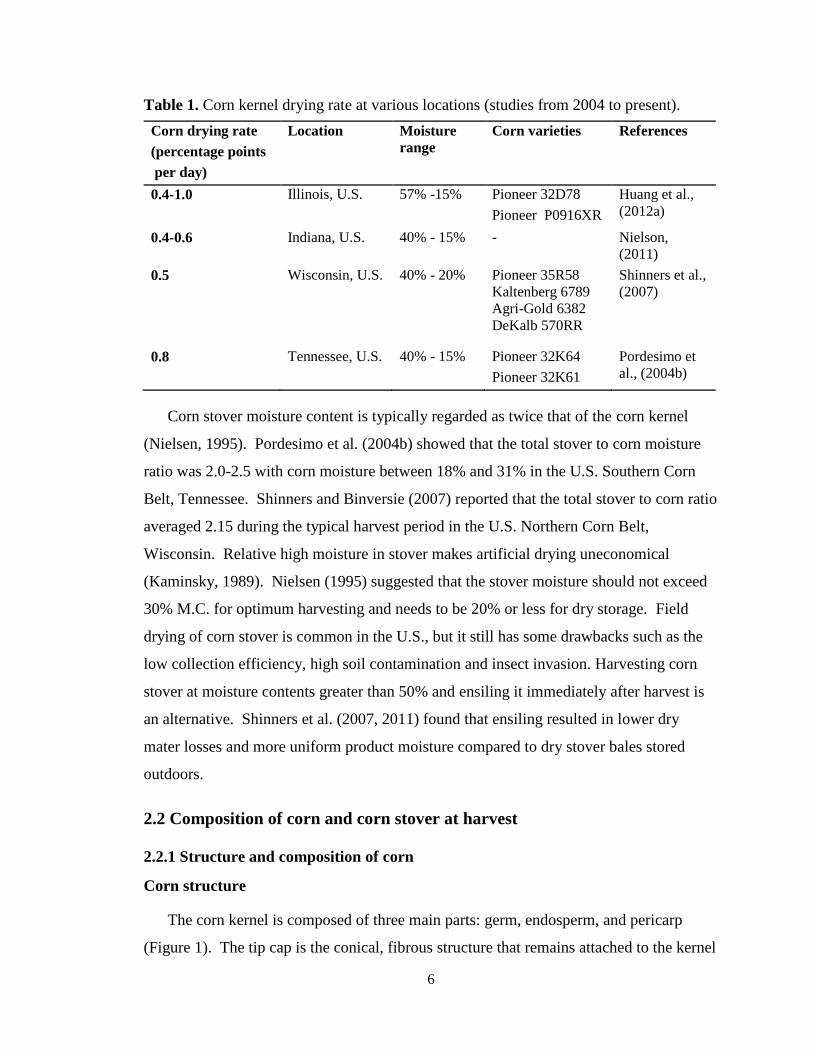
between 0.4-1.0 percentage points per day in the U.S. Corn Belt (Table 1). Corn kernel
dying rate in the U.S. Southern Corn Belt (Tennessee) is higher than that in the U.S.
Northern Corn Belt (Wisconsin), which was probably due to the higher temperature and
lower humidity weather in the U.S. Southern Corn Belt.
6
Table 1. Corn kernel drying rate at various locations (studies from 2004 to present).
Corn drying rate
(percentage points
per day)
Location Moisture
range
Corn varieties References
0.4-1.0 Illinois, U.S. 57% -15% Pioneer 32D78
Pioneer P0916XR
Huang et al.,
(2012a)
0.4-0.6 Indiana, U.S. 40% - 15% - Nielson,
(2011)
0.5 Wisconsin, U.S. 40% - 20% Pioneer 35R58
Kaltenberg 6789
Agri-Gold 6382
DeKalb 570RR
Shinners et al.,
(2007)
0.8 Tennessee, U.S. 40% - 15% Pioneer 32K64
Pioneer 32K61
Pordesimo et
al., (2004b)
Corn stover moisture content is typically regarded as twice that of the corn kernel
(Nielsen, 1995). Pordesimo et al. (2004b) showed that the total stover to corn moisture
ratio was 2.0-2.5 with corn moisture between 18% and 31% in the U.S. Southern Corn
Belt, Tennessee. Shinners and Binversie (2007) reported that the total stover to corn ratio
averaged 2.15 during the typical harvest period in the U.S. Northern Corn Belt,
Wisconsin. Relative high moisture in stover makes artificial drying uneconomical
(Kaminsky, 1989). Nielsen (1995) suggested that the stover moisture should not exceed
30% M.C. for optimum harvesting and needs to be 20% or less for dry storage. Field
drying of corn stover is common in the U.S., but it still has some drawbacks such as the
low collection efficiency, high soil contamination and insect invasion. Harvesting corn
stover at moisture contents greater than 50% and ensiling it immediately after harvest is
an alternative. Shinners et al. (2007, 2011) found that ensiling resulted in lower dry
mater losses and more uniform product moisture compared to dry stover bales stored
outdoors.
2.2 Composition of corn and corn stover at harvest
2.2.1 Structure and composition of corn
Corn structure
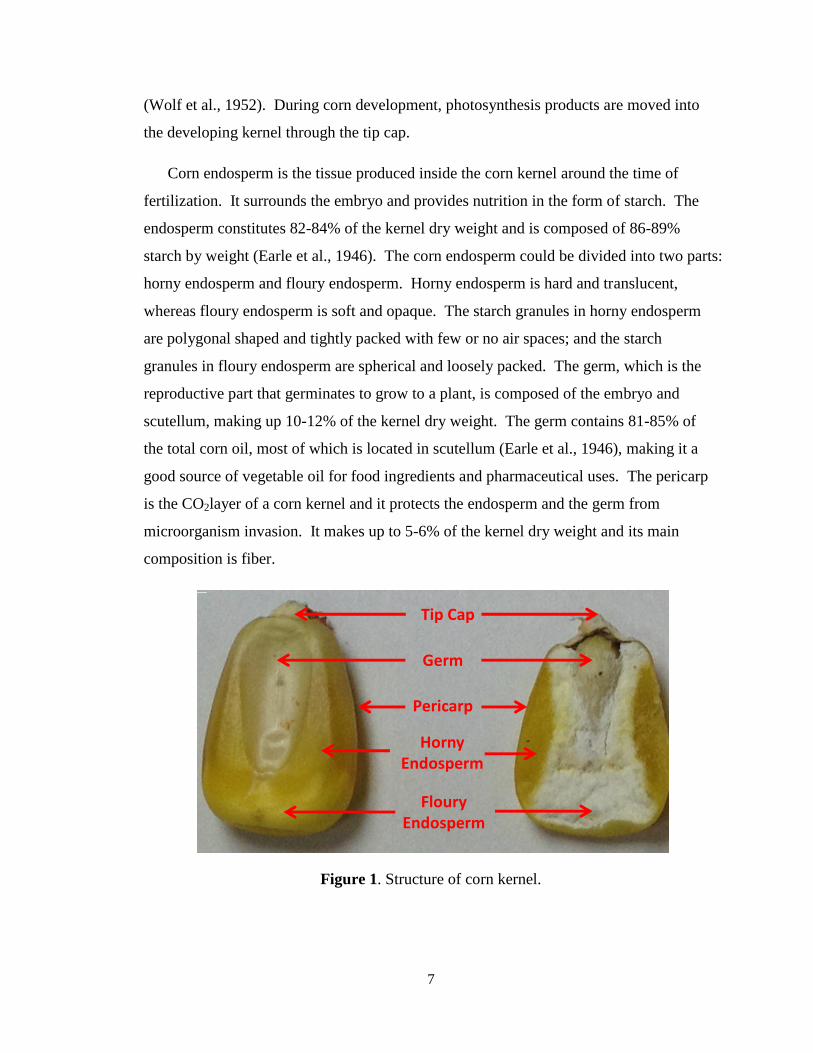
The corn kernel is composed of three main parts: germ, endosperm, and pericarp
(Figure 1). The tip cap is the conical, fibrous structure that remains attached to the kernel
7
(Wolf et al., 1952). During corn development, photosynthesis products are moved into
the developing kernel through the tip cap.
Corn endosperm is the tissue produced inside the corn kernel around the time of
fertilization. It surrounds the embryo and provides nutrition in the form of starch. The
endosperm constitutes 82-84% of the kernel dry weight and is composed of 86-89%
starch by weight (Earle et al., 1946). The corn endosperm could be divided into two parts:
horny endosperm and floury endosperm. Horny endosperm is hard and translucent,
whereas floury endosperm is soft and opaque. The starch granules in horny endosperm
are polygonal shaped and tightly packed with few or no air spaces; and the starch
granules in floury endosperm are spherical and loosely packed. The germ, which is the
reproductive part that germinates to grow to a plant, is composed of the embryo and
scutellum, making up 10-12% of the kernel dry weight. The germ contains 81-85% of
the total corn oil, most of which is located in scutellum (Earle et al., 1946), making it a
good source of vegetable oil for food ingredients and pharmaceutical uses. The pericarp
is the CO2layer of a corn kernel and it protects the endosperm and the germ from
microorganism invasion. It makes up to 5-6% of the kernel dry weight and its main
composition is fiber.
Figure 1. Structure of corn kernel.
Tip Cap
Pericarp
Germ
HornyEndosperm
FlouryEndosperm
8
Corn composition
The composition of the whole kernel is of utmost importance in both the corn
processing plants and animal feed industry. The main composition of the mature kernel
includes starch, fat, protein, fiber, sugar and ash (Earle et al., 1946).
Starch, which accounts for approximately 68-74% of a mature kernel by weight, is
the primary source of stored energy in corn (Earle et al., 1946). It is synthesized in
special organelles called amyloplasts (Badenhuizen, 1965). The starch consists of two
types of molecules: the linear and helical amylose and the branched amylopectin. Yellow
dent corn starch generally contains 23-25% amylose and 75-77% amylopectin. The
amylose/amylopectin ratio in corn starch varies during kernel development. The amylose
content of corn starch increased from 9.2% on 14 days after pollination (DAP) to 24.4%
on 45 DAP (mature and dried) (Shannon and Garwood, 1984; Li et al., 2007).
Ingle et al. (1965) determined changes in dry matter and composition of corn kernel
during development. The development of the embryo was found to be slower than the
development of the endosperm, beginning at 15 DAP and proceeding at a linear fashion.
The sugar content in the kernel peaked at 18 DAP and decreased thereafter. The decrease
in soluble sugar content was a result of conversions from sugar to starch during kernel
development. The protein content deposition began at the beginning of kernel maturing,
accelerated at 15 DAP, and leveled off at 30 DAP. The second increase in protein
content of the kernel, occurring at 40 DAP, was indicative of the production of
specialized storage protein (McKee, 1958). The decrease in amino acid content after 28
DAP indicated these components are utilized for the protein production.
2.2.2 Composition of corn stover at harvest
In the animal feed industry, neutral detergent fiber (NDF), acid detergent fiber (ADF),
acid detergent lignin (ADL) and crude protein (CP) are measures of the nutritive value of
forage. NDF is the percentage of fiber in a forage sample which is not soluble in a
neutral detergent solution and it is a good indicator to predict intake by animals
consuming the feedstuff. ADF is the percentage of fiber in a forage sample which is
insoluble in a weak acid and it is a very important value for forages because it closely
9
relates to the ability of animals to digest the forage. ADL is a polymer of phenyl propane
units, which is the indigestible part of the forage. Crude protein, measured by
multiplying total nitrogen by 6.25, is another measure of the forage nutritive value.
Crude protein includes both the true protein and non-protein nitrogen. Because of the
low crude protein content (3.5-8.7%) (Darby and Lauer, 2002; Lewis et al., 2004; Lee et
al., 2007), corn stover is usually supplemented with protein or mixed with other high
protein products (e.g., DDGS, soybean meal) to increase its nutritive value (Sewell et al.,
2009).
The corn stover composition changes during corn kernel development and dry down.
Weaver et al. (1978) reported that NDF concentrations in corn stover increased with
kernel maturity. Irlbeck et al. (1993) found that corn stover harvested 28 days post-
physiological maturity had higher concentrations of NDF and ADF but lower
concentrations of crude protein than stover harvested at its physiological maturity. The
decrease in crude protein concentration was also reported by other studies (Lewis, et al.,
2004; Darby and Lauer, 2002). The decrease in crude protein concentration appears to be
the result of continued carbon assimilation during corn kernel maturing, even though
nitrogen uptake was probably completed, thereby diluting plant nitrogen concentration
(Wiersma et al., 1993). Several studies reported lignin concentration in corn stover
increased with kernel development and dry down (Cone and Engels, 1993; Pordesimo et
al., 2005; Liu et al., 2009).
2.3 CO2 coefficient measurement through bulk corn
2.3.1 Apparatus to measure effective diffusivity of CO2 through bulk grain
High respiration of bulk corn in the spoilage spot increases CO2 concentration locally
and CO2 tends to diffuse through the interstitial air to the rest of the storage bin under the
influence of the concentration gradient. Due to its simplicity, Fick’s Law is the most
popular approach to describe the diffusion process:
(1)
10
where is the diffusion flux,
is the species concentration gradient and is the
diffusion coefficient or diffusivity. The effective diffusion coefficient ( ) describes
diffusion through the pore spaces of porous media. In porous media, part of the total
volume is occupied by a solid phase. The diffusion gas molecules have to follow a
tortuous path in the porous matrix, which provides extra resistance to the gas movement
and slows the gas diffusion rate. The effective diffusion coefficient through porous
media can be estimated as follows:
(2)
where is the porosity of the porous media, is the tortuosity of the porous media, and
is the constrictivity. Since it is difficult to precisely measure the tortuosity of the porous
media, the effective diffusion coefficient is often measured directly through the
experiments for practical applications.
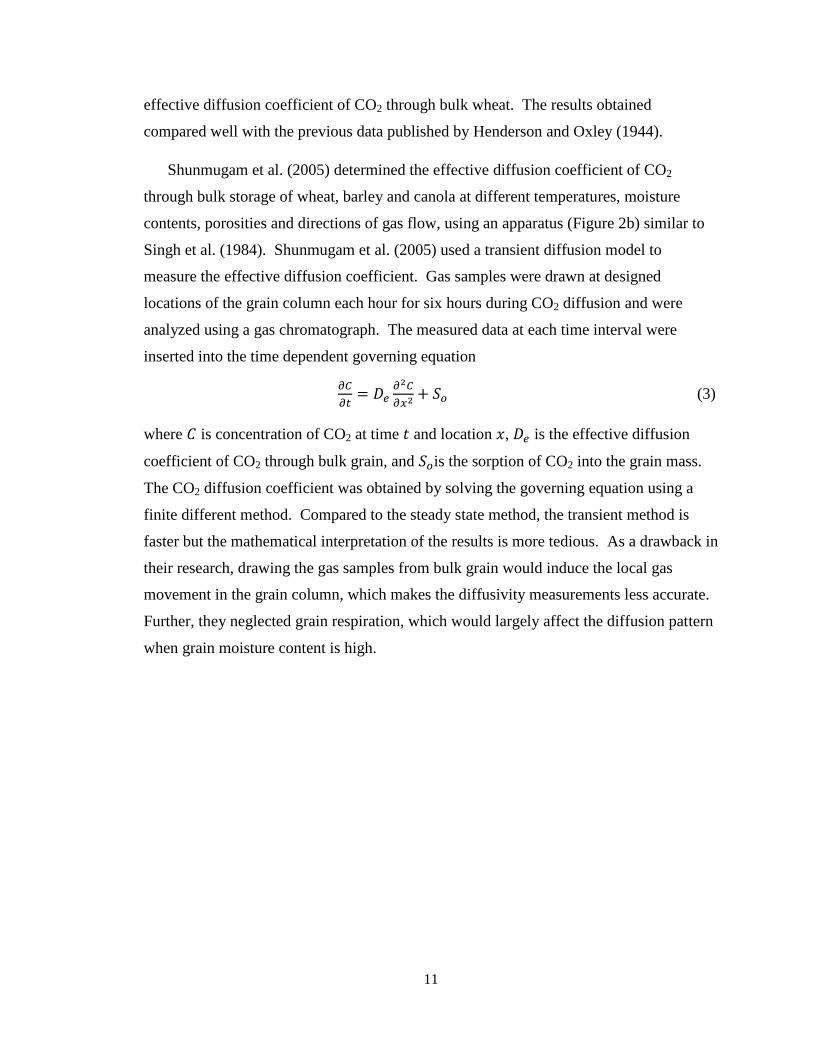
Singh et al. (1984) determined the effective diffusion coefficient of CO2 through
wheat, rapeseed, oats and corn by a steady state method. In Singh et al.’s study, effective
diffusivity of CO2 though bulk corn was measured only at 20% corn moisture content and
10 °C. The apparatus used by Singh et al. (1984) for measuring CO2 diffusivity consisted
of a gas chamber and a cylindrical grain column (Figure 2a). One end of the grain
column was connected to the gas chamber and the other end of the grain column was
connected to the atmosphere. It was also assumed that the concentration at the outer end
of the grain column is equal to the atmospheric CO2 concentration. The CO2 was injected
into the gas chamber, and diffused through the cylindrical column filled with grain. By
measuring the CO2 concentrations along the cylindrical column when the CO2 diffusion
reached its equilibrium state, the diffusion coefficient of CO2 in bulk grain could be
calculated. The main advantage of the steady state method is that it can provide the
direct measurement of the effective diffusion coefficient. However, since measurements
are possible only after equilibrium is reached, steady state methods are usually slow;
several days often being required for one measurement (Flegg, 1953). During such long
tests, pressure inside the chamber may change, which would affect the diffusion
coefficient. Thereafter, Singh et al. (1985) developed a transient method to determine the
11
effective diffusion coefficient of CO2 through bulk wheat. The results obtained
compared well with the previous data published by Henderson and Oxley (1944).
Shunmugam et al. (2005) determined the effective diffusion coefficient of CO2
through bulk storage of wheat, barley and canola at different temperatures, moisture
contents, porosities and directions of gas flow, using an apparatus (Figure 2b) similar to
Singh et al. (1984). Shunmugam et al. (2005) used a transient diffusion model to
measure the effective diffusion coefficient. Gas samples were drawn at designed
locations of the grain column each hour for six hours during CO2 diffusion and were
analyzed using a gas chromatograph. The measured data at each time interval were
inserted into the time dependent governing equation
(3)
where is concentration of CO2 at time and location , is the effective diffusion
coefficient of CO2 through bulk grain, and is the sorption of CO2 into the grain mass.
The CO2 diffusion coefficient was obtained by solving the governing equation using a
finite different method. Compared to the steady state method, the transient method is
faster but the mathematical interpretation of the results is more tedious. As a drawback in
their research, drawing the gas samples from bulk grain would induce the local gas
movement in the grain column, which makes the diffusivity measurements less accurate.
Further, they neglected grain respiration, which would largely affect the diffusion pattern
when grain moisture content is high.
12
Figure 2. Schematic of the apparatuses used to measure the rate of diffusion of carbon
dioxide through grains and oilseeds (adapted from Singh et al., 1984 (Figure a) and
Shunmugam et al., 2005 (Figure b)). Each of the apparatus consisted of a gas chamber
and a grain column. For the apparatus a, one end of the grain column was connected to
the gas chamber and the other end of the grain column was connected to the atmosphere.
And it was assumed that the concentration at the inner end of the grain column is equal to
the gas chamber CO2 concentration and the concentration at the outer end of the grain
column is equal to the atmospheric CO2 concentration. For the apparatus b, the outer end
of the grain column was insulated from the atmosphere, therefore, CO2 flux between
atmosphere and grain column was zero (
).
2.3.2 Other diffusion apparatus to measure gas diffusivity through porous media
Several other diffusion apparatuses have been used to measure the effective gas
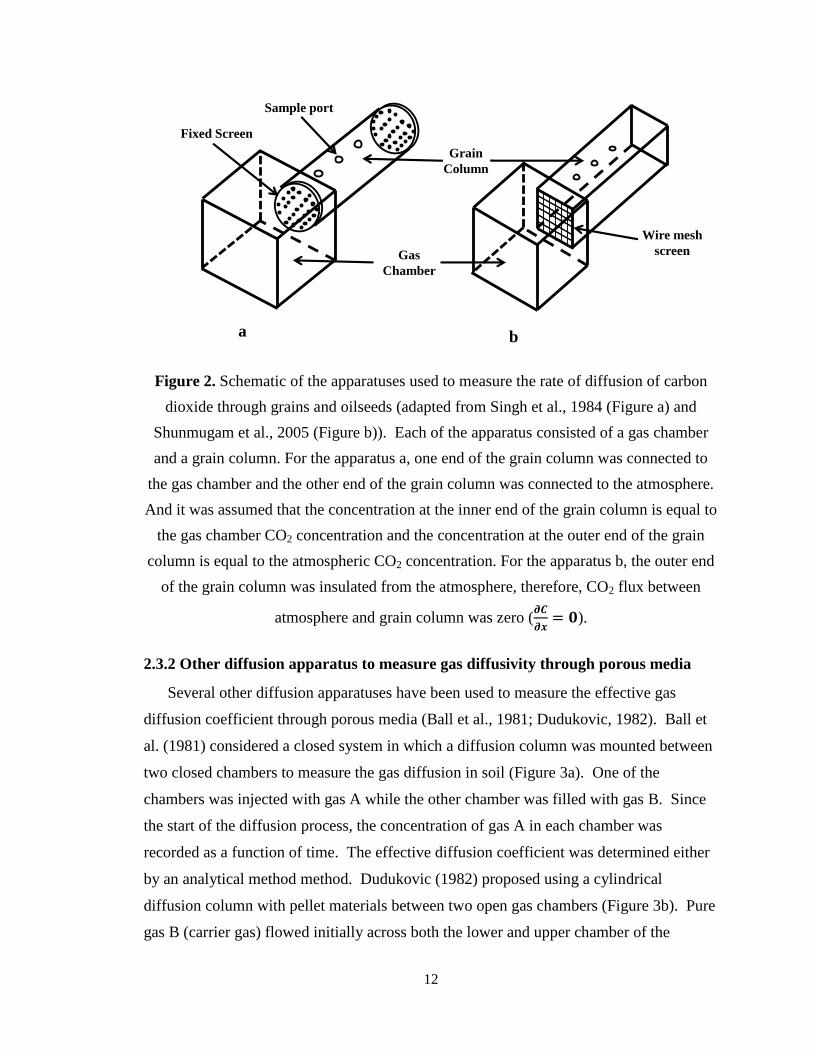
diffusion coefficient through porous media (Ball et al., 1981; Dudukovic, 1982). Ball et
al. (1981) considered a closed system in which a diffusion column was mounted between
two closed chambers to measure the gas diffusion in soil (Figure 3a). One of the
chambers was injected with gas A while the other chamber was filled with gas B. Since
the start of the diffusion process, the concentration of gas A in each chamber was
recorded as a function of time. The effective diffusion coefficient was determined either
by an analytical method method. Dudukovic (1982) proposed using a cylindrical
diffusion column with pellet materials between two open gas chambers (Figure 3b). Pure
gas B (carrier gas) flowed initially across both the lower and upper chamber of the
Gas
Chamber
Grain
Column
Sample port
Fixed Screen
Wire mesh
screen
a b
13
apparatus. Gas A was introduced into the lower gas chamber, and the concentration of
the gas A was measured as a function of time at the exit of the upper gas chamber (or
sometimes at exits of both chambers). The effective diffusivity was then determined by
matching a suitable mathematical model with observed concentrations. The first
measurement method (Figure 3a) required the target gas to be well mixed in the chambers
at all times. The second measurement method (Figure 3b) solved the mixing problem in
the gas chamber and allowed greater flexibility in operation. However, extra care was
needed for the pressure balance between two chambers. In order to accurately measure
the effective diffusivity, pressures on both sides of the chambers should be maintained
equal so that transfer through the columns is by diffusion alone. The moving gas in the
chambers could produce pressure difference between the chambers, thereby causing
convective movement of gas through porous media. The summary of the diffusion cells
used to measure gas diffusivity are listed in Table 2.
Figure 3. Schematic of the diffusion apparatuses to measure gas diffusivity through
porous media. a) apparatus used by Ball et al. (1981) and b) apparatus used by
Dudukovic (1982). Both of apparatuses were designed based on the transient diffusion
methods.
gas
gas
gas
gas gas
gas
a b
14
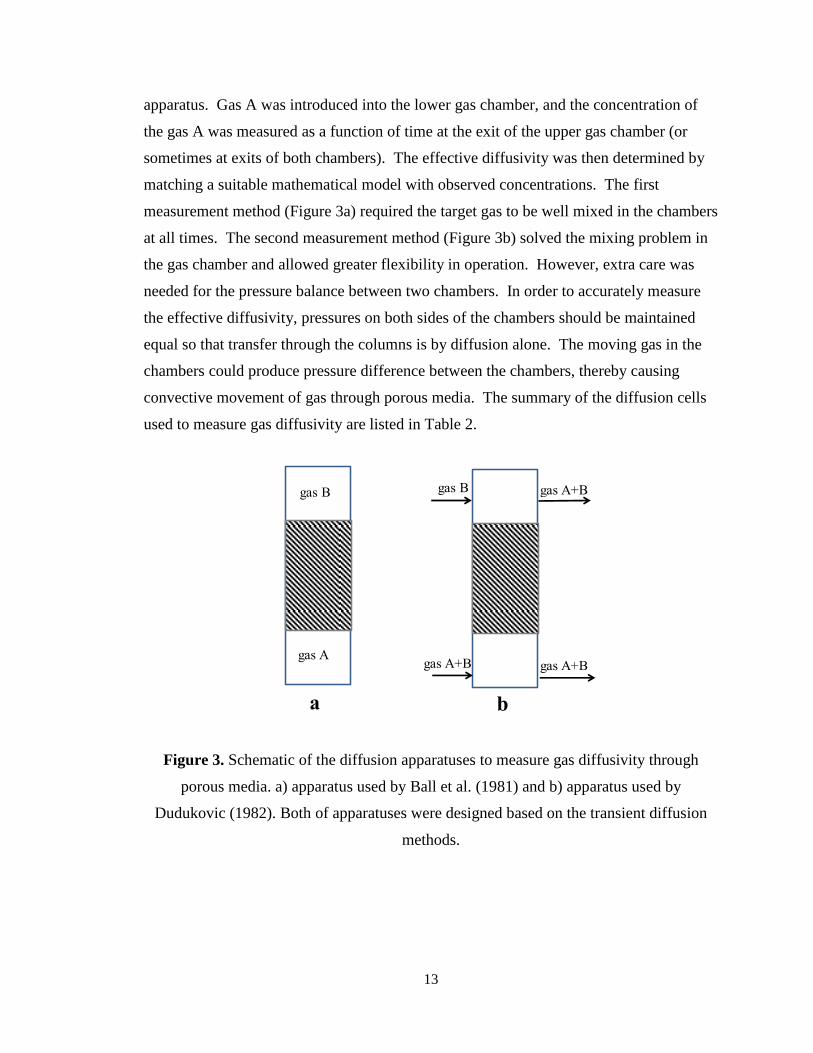
Table 2. Description of selected apparatus for measuring gas diffusion coefficient in porous mediaa.
Methods Mathematical model Media Advantages Disadvantages References
One gas
chamber-with
other end open
(Figure 2a)
wheat,
rapeseed,
oats, corn
Direct measurement
of diffusion
coefficient
Time consuming;
Easily affected by
atmospheric pressure
fluctuations
Singh et al.
(1984);
One chamber –
with other end
sealed
(Figure 2b)
Boundary and initial conditions 1. ( ) ( )
2.
3. ( ) ( )
wheat,
barley,
canola
Faster than the steady
state method;
Closed system
immune to
atmospheric
fluctuations;
More complex
mathematical model;
Need to measure gas
concentration along
the diffusion cell
Shunmugam et
al. (2005); Paes
et al. (2011)
Two closed
chambers
(Figure 3a)
Boundary and initial conditions
1.
2.
3. ( ) ( )
soil, sand,
steel wool,
glass beads
Only few
measurements
required;
Easy to operate;
Closed system
immune to
atmosphere
fluctuation
More complex
mathematical model
than the one chamber
method;
Require evenly
distribution of the
target gas in the
chambers
Dye &
Dallavalle
(1958); Ball et
al. (1981); Jones
et al. (2003);
Reible and Shair
(1982); Allaire
et al. (2008)
Two open
chambers
(Figure 3b)
( )
(
)
( )
(
)
soil Do not require
evenly distribution of
the target gas in the
chamber;
Greater flexibility;
Difficult to balance
the pressure between
the two chambers
Dudukovic
(1982)
a C(x, t): CO2 concentration at distance x and time t; L: length of the diffusion column; S: area of the cross section of the diffusion column;
Vi: volume of the gas injection chamber; Ci (t): CO2 concentration in the injection chamber at time t; Vr: volume of the gas receiving
chamber; Cr (t): CO2 concentration in the gas receiving chamber.
15
Chapter 3. Effect of harvest date on dry matter yield and
moisture content of corn and corn stover
3.1 Introduction
Traditionally, corn and corn stover were harvested after corn physiological maturity
and at low moisture content levels due to high cost of drying. However, if corn and corn
stover were harvested at high moisture contents before dry down, the stover would be
less lignified and more responsive to chemical treatment to enhance digestibility (Cone
and Engels, 1993). Also with early harvest of corn stover, corn stover yield would be
higher due to the reduced physical loss of leaf and husk as they became dry and brittle
after corn maturity (Shinners and Binversie, 2007). Harvesting corn at or before
physiological maturity may be advantageous to corn processing if it can be stored wet,
because starch in early harvested corn is more digestible by enzymes (Shannon and
Garwood,1984; Hane and Robyt, 1984; Philippeau and Michalet-Doreau, 1997).
Furthermore, early removal of corn from the field may allow the production of a second
crop that is nitrogen fixing. High moisture is the main problem for early harvesting corn
and corn stover. High moisture corn and corn stover spoil readily, and it is a safety
hazard when they are moldy.
In order to systematically evaluate the feasibility of early harvest corn and corn stover,
the first step is to characterize dry matter yield and moisture contents of corn and corn
stover at different maturity stages. Therefore, the specific objectives were 1) to
determine dry matter yields and moisture contents of corn and corn stover before, during
and after corn maturity; 2) to ascertain effect of mold on corn quality after corn kernel
physiological maturity and effect of corn plant lodging.
3.2 Materials and methods
3.2.1 Test site and material
Corn was grown at the University of Illinois at Urbana-Champaign, Agricultural and
Biological Engineering Farm, located in Urbana, Illinois, USA, with a geographical
coordinate at 40.07044 N, 88.21034 W. In 2009, a regular dent hybrid 32D78 (Pioneer
Hi-Bred International, Johnston, Iowa) was chosen due to its high potential yield and
16
high total fermentables for dry grind ethanol. In 2010, another dent hybrid P0916XR was
chosen for its high potential yield. These hybrids had approximately similar RM (relative
maturity) that was recommended for Central Illinois by the seed company (Pioneer Hi-
Bred International, Johnson, Iowa). The relative maturity (RM) for 32D78 and P0916XR
were 116 and 109, respectively. The growing degree days (GDDs) required for these two
hybrids to reach physiological maturity were1572 and 1461, respectively.
The corn crops were planted on 22 May 2009, which was deemed late for the central
Illinois area and due to the frequent rainfalls and low temperature in April and May.
Delayed planting postponed the corn maturity and cool weather in the fall affected the
corn in-field drying rate. In 2010 the corn crops were planted on 21 April. In both years,
the corn crops were planted on 76 cm (30 inch) row spacing and 15.6 cm (6 1/8 inch)
rank spacing in a field with a size of 0.4 ha (1 acre). The target plant population for both
years was 75,680 plants per hectare.
3.2.2 Weather conditions
Corn plant growth, yield and drying rate are largely dependent on accumulated heat
input and precipitation during the growing and harvest season (Pordesimo et al, 2004a;
Shinners and Binversie). Ambient air temperature and precipitation at the experimental
location were obtained from National Oceanic and Atmospheric Administration (NOAA)
(http://www.noaa.gov/ ). Growing-degree days were calculated using the following
equation:
[
] (4)
where is the daily maximum temperature (with an upper limit of 30°C) and is
the daily minimum temperature (with a lower limit of 10°C) (McMaster and Wilhem,
1997; Darby and Lauer, 2002).
3.2.3 Sample collection
In 2009, delayed planting date and lower heat input (compared with an average year)
postponed the corn maturity date to September. Corn plants were harvested bi-weekly
between August and November, representing corn kernel filling, mature and dry down
17
stages. In 2010, corn reached its maturity in August and was harvested weekly between
29 July and 10 September. The frequency of sampling was due to the higher in-field
drying rate of corn in 2010.
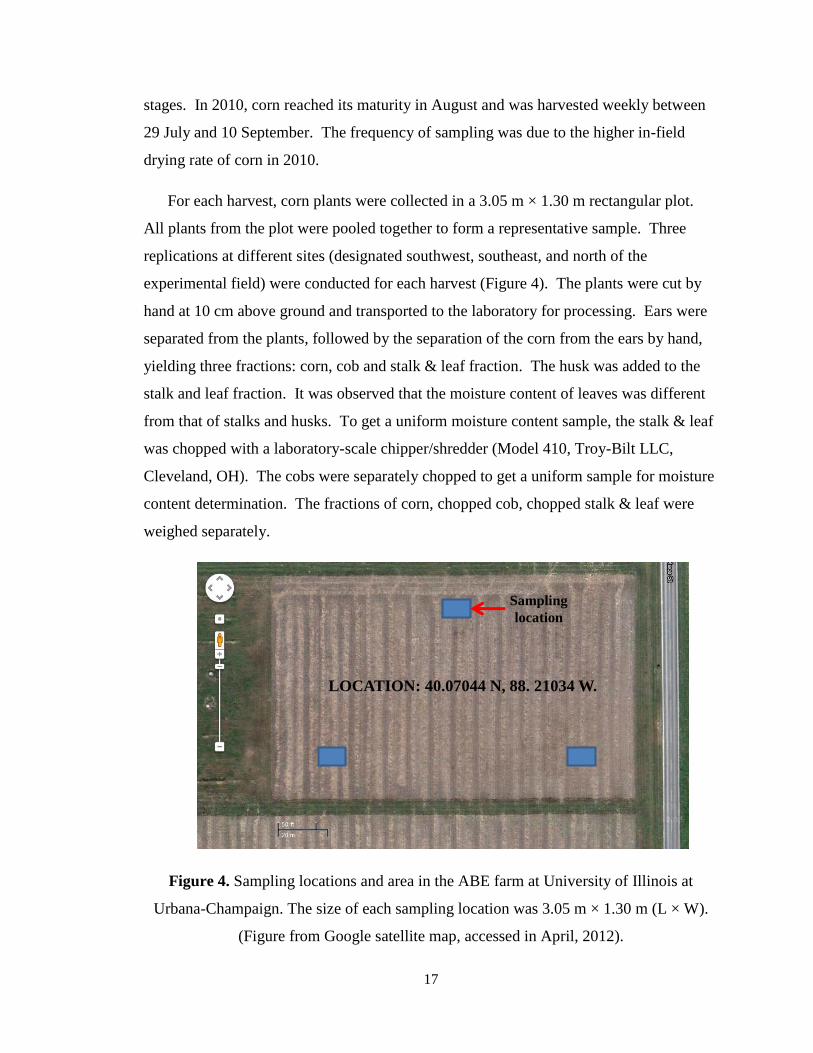
For each harvest, corn plants were collected in a 3.05 m × 1.30 m rectangular plot.
All plants from the plot were pooled together to form a representative sample. Three
replications at different sites (designated southwest, southeast, and north of the
experimental field) were conducted for each harvest (Figure 4). The plants were cut by
hand at 10 cm above ground and transported to the laboratory for processing. Ears were
separated from the plants, followed by the separation of the corn from the ears by hand,
yielding three fractions: corn, cob and stalk & leaf fraction. The husk was added to the
stalk and leaf fraction. It was observed that the moisture content of leaves was different
from that of stalks and husks. To get a uniform moisture content sample, the stalk & leaf
was chopped with a laboratory-scale chipper/shredder (Model 410, Troy-Bilt LLC,
Cleveland, OH). The cobs were separately chopped to get a uniform sample for moisture
content determination. The fractions of corn, chopped cob, chopped stalk & leaf were
weighed separately.
Figure 4. Sampling locations and area in the ABE farm at University of Illinois at
Urbana-Champaign. The size of each sampling location was 3.05 m × 1.30 m (L × W).
(Figure from Google satellite map, accessed in April, 2012).
Sampling
location
LOCATION: 40.07044 N, 88. 21034 W.
18
3.2.4 Moisture, dry matter yield, lodging percentage and moldy kernel percentage
determination
The moisture content of corn kernels was measured at 103°C for 72 h using a
convection oven (AACC International, 2000a). The chopped cob and chopped corn
stover were first dried at 49 °C for 24 h followed by 135 °C for 2 h (AACC International,
2000b). The wet basis moisture contents and dry matter content of all sub-fractions were
then calculated. The number of corn plant falling on ground in each harvest plot was
recorded. The corn plant lodging percentage was determined as a fraction of the number
of falling down corn plants in the total number of corn plants in each harvest plot. In our
study, the corn plant lodging included both stalk lodging and root lodging. Corn kernels
which had visible mold were separated by hand and weighed. The fraction of corn with
mold (moldy kernel percentage) was calculated as a percent of total corn dry mass
(Anderson et al., 1972).
3.3 Results and discussion
3.3.1 Weather conditions
Accumulative growing degree days (AGDDs) and precipitation information in 2009,
2010 and 10-year average during corn kernel filling, mature, and dry down stages are
shown in Figure 5a and 5b. These weather parameters would affect not only stover and
corn dry matter yield, but also in-field drying rates. The AGDDs in 2009 were lower
than that in 10-year average; while the AGDDs in 2010 were higher than that in 10-year
average (Figure 5a). The inadequate accumulative heat input in 2009 postponed the corn
mature date and reduced the in-field drying rate of corn. The accumulated precipitation
in 2009 was above the 10-year average; while in 2010, the accumulated precipitation was
below the 10-year average before mid-June, and went above the 10-year average after
mid-June, due to the frequent rainfalls in June (Figure 5b).
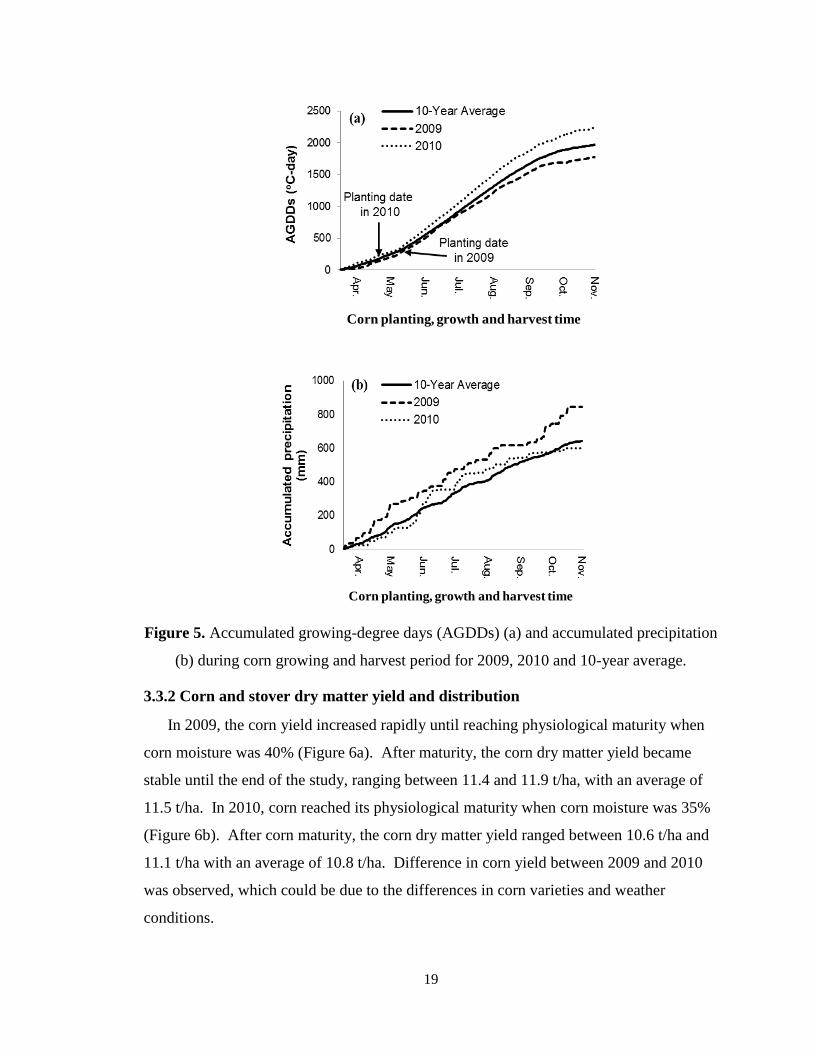
19
Figure 5. Accumulated growing-degree days (AGDDs) (a) and accumulated precipitation
(b) during corn growing and harvest period for 2009, 2010 and 10-year average.
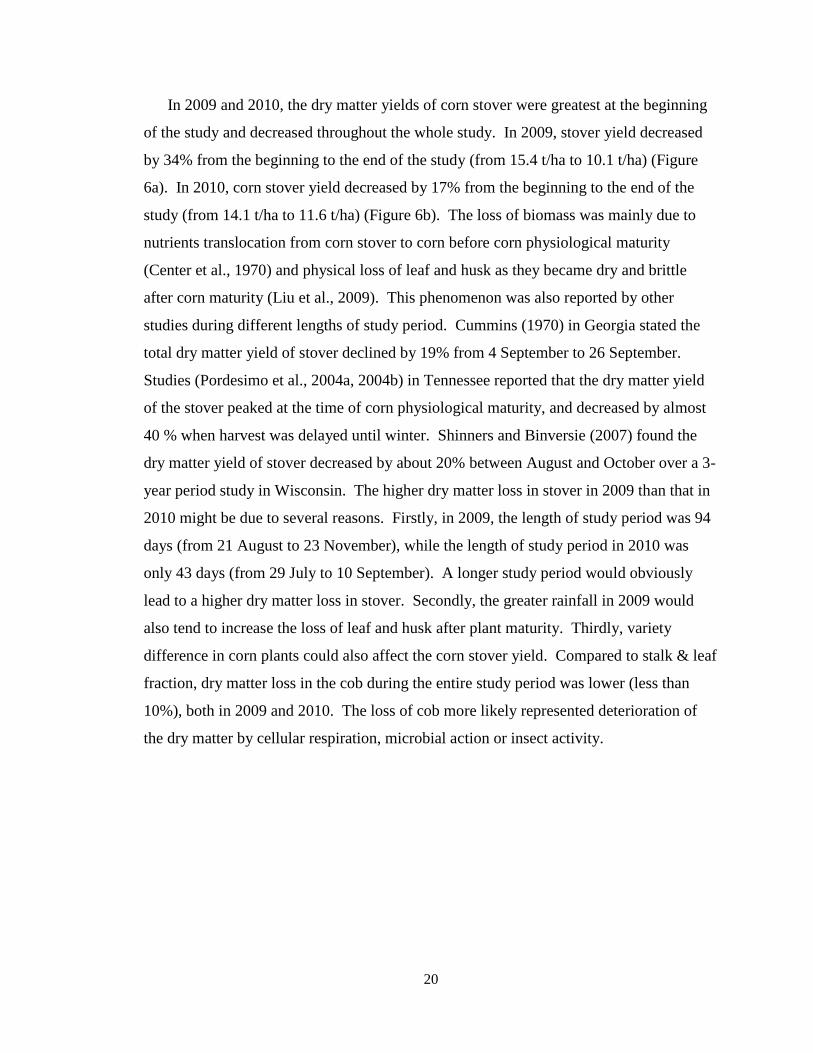
3.3.2 Corn and stover dry matter yield and distribution
In 2009, the corn yield increased rapidly until reaching physiological maturity when
corn moisture was 40% (Figure 6a). After maturity, the corn dry matter yield became
stable until the end of the study, ranging between 11.4 and 11.9 t/ha, with an average of
11.5 t/ha. In 2010, corn reached its physiological maturity when corn moisture was 35%
(Figure 6b). After corn maturity, the corn dry matter yield ranged between 10.6 t/ha and
11.1 t/ha with an average of 10.8 t/ha. Difference in corn yield between 2009 and 2010
was observed, which could be due to the differences in corn varieties and weather
conditions.
Corn planting, growth and harvest time
Corn planting, growth and harvest time
20
In 2009 and 2010, the dry matter yields of corn stover were greatest at the beginning
of the study and decreased throughout the whole study. In 2009, stover yield decreased
by 34% from the beginning to the end of the study (from 15.4 t/ha to 10.1 t/ha) (Figure
6a). In 2010, corn stover yield decreased by 17% from the beginning to the end of the
study (from 14.1 t/ha to 11.6 t/ha) (Figure 6b). The loss of biomass was mainly due to
nutrients translocation from corn stover to corn before corn physiological maturity
(Center et al., 1970) and physical loss of leaf and husk as they became dry and brittle
after corn maturity (Liu et al., 2009). This phenomenon was also reported by other
studies during different lengths of study period. Cummins (1970) in Georgia stated the
total dry matter yield of stover declined by 19% from 4 September to 26 September.
Studies (Pordesimo et al., 2004a, 2004b) in Tennessee reported that the dry matter yield
of the stover peaked at the time of corn physiological maturity, and decreased by almost
40 % when harvest was delayed until winter. Shinners and Binversie (2007) found the
dry matter yield of stover decreased by about 20% between August and October over a 3-
year period study in Wisconsin. The higher dry matter loss in stover in 2009 than that in
2010 might be due to several reasons. Firstly, in 2009, the length of study period was 94
days (from 21 August to 23 November), while the length of study period in 2010 was
only 43 days (from 29 July to 10 September). A longer study period would obviously
lead to a higher dry matter loss in stover. Secondly, the greater rainfall in 2009 would
also tend to increase the loss of leaf and husk after plant maturity. Thirdly, variety
difference in corn plants could also affect the corn stover yield. Compared to stalk & leaf
fraction, dry matter loss in the cob during the entire study period was lower (less than
10%), both in 2009 and 2010. The loss of cob more likely represented deterioration of
the dry matter by cellular respiration, microbial action or insect activity.
21
Figure 6. Dry matter yield of corn plant fractions in seven harvests in 2009 (a) and 2010
(b). The husk was added to the faction of stalk & leaf fraction.
Corn harvest moisture
73% 54% 40% 37% 30% 24% 21%
Dry
ma
tte
r yie
ld (
t/h
a)
0
2
4
6
8
10
12
14
16
18
20
Accumulated growing degree days(oC-day)
1062 1260 1416 1445 1480 1527 1548
Corn
Cob
Stalk & leaf
Stover
a
Corn harvest moisture
57% 49% 42% 35% 27% 21% 15%
Dry
ma
tte
r yie
ld (
t/h
a)
0
2
4
6
8
10
12
14
16
18
20
Accumulated growing degree days(oC-day)
1109 1209 1310 1408 1499 1602 1659
Corn
Cob
Stalk & leaf
Stover
b
22
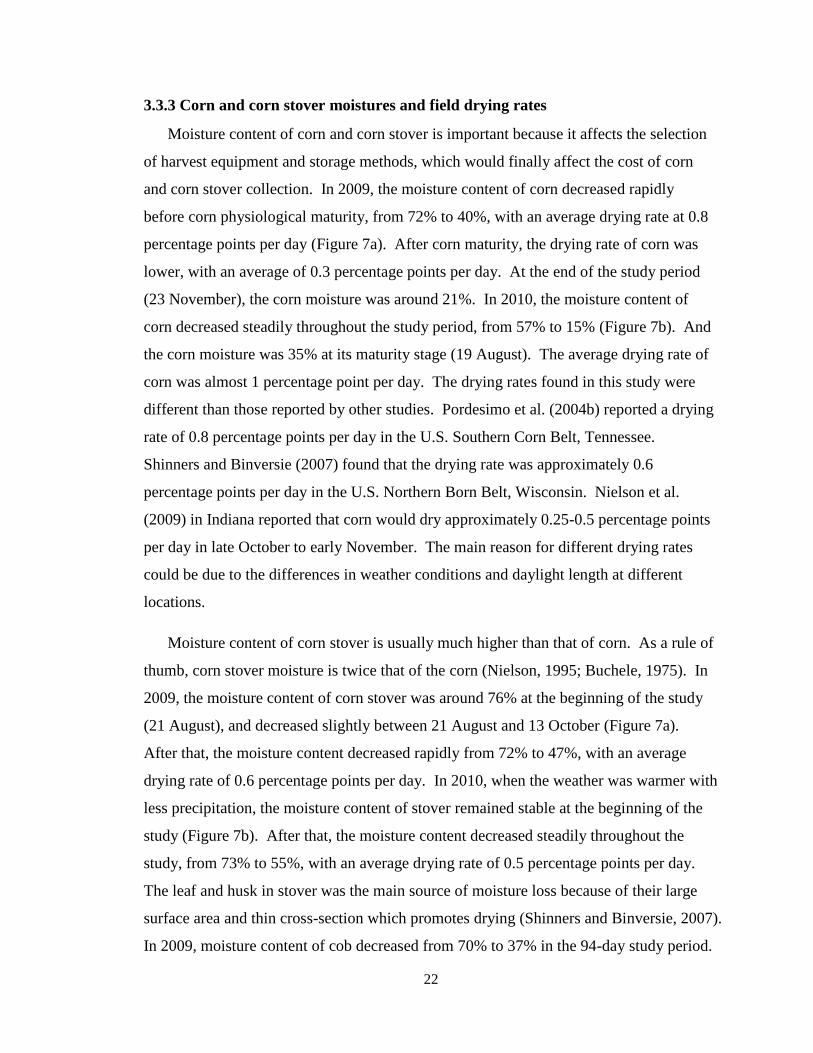
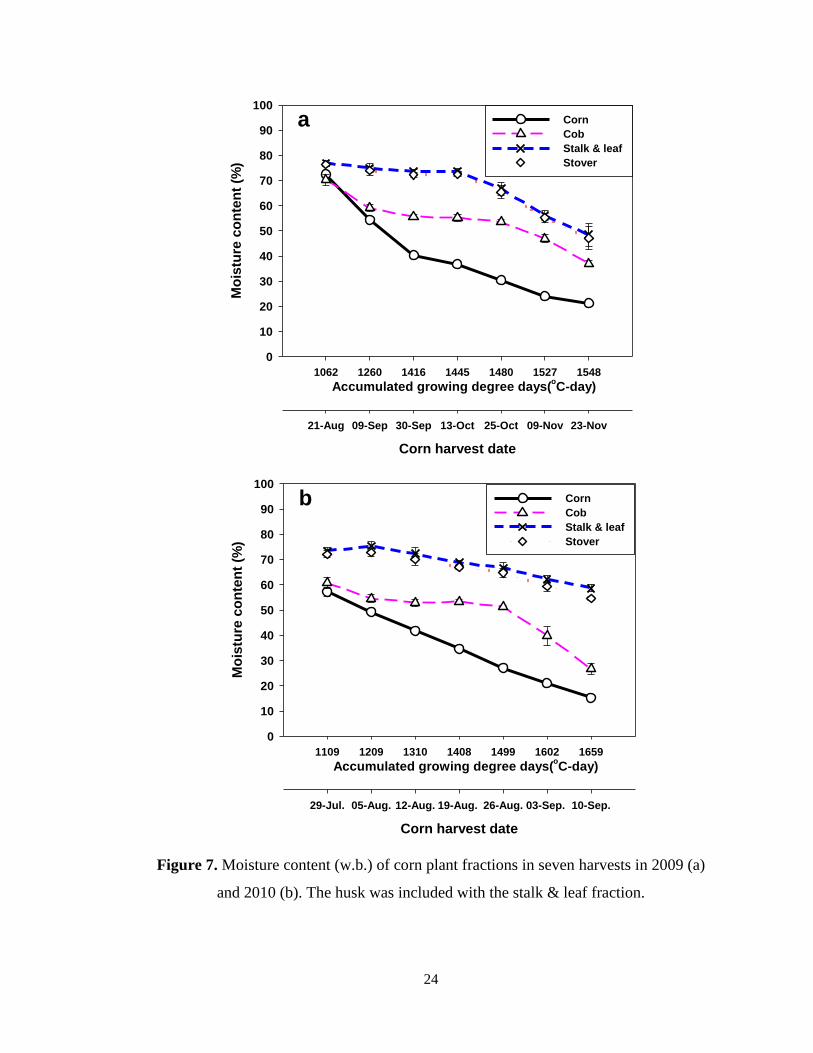
3.3.3 Corn and corn stover moistures and field drying rates
Moisture content of corn and corn stover is important because it affects the selection
of harvest equipment and storage methods, which would finally affect the cost of corn
and corn stover collection. In 2009, the moisture content of corn decreased rapidly
before corn physiological maturity, from 72% to 40%, with an average drying rate at 0.8
percentage points per day (Figure 7a). After corn maturity, the drying rate of corn was
lower, with an average of 0.3 percentage points per day. At the end of the study period
(23 November), the corn moisture was around 21%. In 2010, the moisture content of
corn decreased steadily throughout the study period, from 57% to 15% (Figure 7b). And
the corn moisture was 35% at its maturity stage (19 August). The average drying rate of
corn was almost 1 percentage point per day. The drying rates found in this study were
different than those reported by other studies. Pordesimo et al. (2004b) reported a drying
rate of 0.8 percentage points per day in the U.S. Southern Corn Belt, Tennessee.
Shinners and Binversie (2007) found that the drying rate was approximately 0.6
percentage points per day in the U.S. Northern Born Belt, Wisconsin. Nielson et al.
(2009) in Indiana reported that corn would dry approximately 0.25-0.5 percentage points
per day in late October to early November. The main reason for different drying rates
could be due to the differences in weather conditions and daylight length at different
locations.
Moisture content of corn stover is usually much higher than that of corn. As a rule of
thumb, corn stover moisture is twice that of the corn (Nielson, 1995; Buchele, 1975). In
2009, the moisture content of corn stover was around 76% at the beginning of the study
(21 August), and decreased slightly between 21 August and 13 October (Figure 7a).
After that, the moisture content decreased rapidly from 72% to 47%, with an average
drying rate of 0.6 percentage points per day. In 2010, when the weather was warmer with
less precipitation, the moisture content of stover remained stable at the beginning of the
study (Figure 7b). After that, the moisture content decreased steadily throughout the
study, from 73% to 55%, with an average drying rate of 0.5 percentage points per day.
The leaf and husk in stover was the main source of moisture loss because of their large
surface area and thin cross-section which promotes drying (Shinners and Binversie, 2007).
In 2009, moisture content of cob decreased from 70% to 37% in the 94-day study period.

23
In 2010, moisture content of cob decreased from 61% to 27% in the 43-day study period.
One interesting observation both in 2009 and 2010 is that moisture content of cob started
to decrease rapidly when moisture content of corn was below 30%. This phenomenon
might be due to the high moisture gradient between cob and corn when the moisture
content of corn is low. The 2-year average results showed that when corn was at its
maturity stage, the moisture contents of corn, stover and cob were 37.7, 71.1 and 54.5%
respectively. The high moisture content in corn stover indicated that ensiling could be an
effective storage option when the stover is harvested in a single-pass.
24
Figure 7. Moisture content (w.b.) of corn plant fractions in seven harvests in 2009 (a)
and 2010 (b). The husk was included with the stalk & leaf fraction.
Corn harvest date
21-Aug 09-Sep 30-Sep 13-Oct 25-Oct 09-Nov 23-Nov
Mo
istu
re c
on
ten
t (%
)
0
10
20
30
40
50
60
70
80
90
100
Accumulated growing degree days(oC-day)
1062 1260 1416 1445 1480 1527 1548
Corn
Cob
Stalk & leaf
Stover
a
Corn harvest date
29-Jul. 05-Aug. 12-Aug. 19-Aug. 26-Aug. 03-Sep. 10-Sep.
Mo
istu
re c
on
ten
t (%
)
0
10
20
30
40
50
60
70
80
90
100
Accumulated growing degree days(oC-day)
1109 1209 1310 1408 1499 1602 1659
Corn
Cob
Stalk & leaf
Stover
b
25
3.3.4 Field losses
Corn losses prior to harvest are known to increase the longer the crop stands in the
field after reaching maturity. These losses are mainly due to wind, animals, lodging,
senescence, microbial activity and biological degradation. Mold can form on corn ears
during cool, wet growing seasons. The severity of the problem depends on variations in
weather, crop genetics, and field management practices. High mold levels in corn can
reduce the corn grade and storage life and affect livestock health and performance
(Nielsen et al., 2009). Table 3 shows the moldy kernel and stalk lodging percentages in
seven harvests during the 43-day study period in 2010. Corn mold became significant
(1.7%) when corn moisture was 42%, which in this study was at R6 maturity stage. After
that, the moldy kernel percentage increased steadily as corn moisture decreased. At the
end of the study, at corn moisture of 15%, the moldy kernel percentage reached 4.1%,
which could potentially reduce the corn quality from No.1 grade to lower grades and
reduce the corn marketability (USDA, 2012).
In most years growers can get the crop out of the field early enough that corn plant
lodging is not a major problem; however, lodging could be a major harvest loss when
weather is severe, such as high wind and rainfall. This study showed that the lodging
started when corn moisture was 35%, when the corn just reached its physiological
maturity (Table 3). At that time, 1.2% of the corn plants were lodged. As harvest was
delayed, lodging became greater. At the end of the study, at corn moisture of 15%, the
stalk lodging percentage reached 3.6%.
Table 3. Corn field loss information during a 43-day study period in 2010.
Corn moisture 57% 49% 42% 35% 27% 21% 15%
Moldy kernels (%) 0 0 1.7 2.1 3.3 3.3 4.1
Stalk Lodging (%) 0 0 0 1.2 2.4 3.6 3.6
3.4 Conclusions
The two year average corn moisture content was 37.4% when reaching physiological
maturity. At the same time, the average stover moisture was 67.7%. The dry matter
yield of corn increased rapidly until reaching corn maturity and remained stable after

26
corn maturity, with an average yield of 11.1 t/ha over the two year study. For corn stover,
the two-year average dry matter yield was 14.8 t/ha at the beginning of the study (filling
stage) and it decreased to 13.2 t/ha at corn physiological maturity and decreased
throughout corn dry down. During corn dry down period, moldy kernel percentage
increased from 2.1 to 4.1%, and plant lodging percentage increased from 1.2 to 3.6%.
27
Chapter 4. Effect of corn harvest moisture on dry grind
fermentation characteristics and DDGS composition
4.1 Introduction
Corn harvested at different moisture contents may exhibit different processing
characteristics for ethanol industry, due to their differences in physical and chemical
properties. Wolf et al. (1948) compared corn starch at different maturity stages from
three corn cultivars, and found lower starch content in immature corn. Li et al. (2007)
reported that the amylose content of endosperm starch increased from 9.2% on 14 days
after pollination (DAP) to 24.4% on 45 DAP (mature and dried). Shannon and Garwood
(1984) also reported that the level of amylose present in a developing kernel increases as
the kernel matured. The resistant starch levels in corn starch is highly correlated with
amylose levels (Berry 1986), because amylose forms a thermally stable starch resistant to
enzymatic reactions to break down starch to glucose (Jane and Robyt 1984). Resistant
starch present corn starch has been reported to have many health benefits, including
prevention of colon cancer, type II diabetes, obesity and cardiovascular disease (Englyst
et al., 1986; Robertson et al., 2005; Jiang et al., 2010). However, for corn-ethanol
industry, higher resistant starch could lead to a decreased ethanol yield. Sharma et al.
(2010) reported that 30%-amylose starch had higher resistant starch content at initial,
after liquefaction and simultaneous saccharification and fermentation (SSF) than 0%
amylose starch in dry grind process. Sharma et al. (2010) also found that higher resistant
starch resulted in lower conversion of starch into sugars and hence to lower final ethanol
yield. All of the above information lead to the hypothesis that corn harvested at early
stage before corn dry down may have higher fermentability for ethanol. The objective of
this study was to investigate the effect of corn harvest moisture content on dry grind
fermentation characteristics and DDGS composition.
4.2 Materials and methods
4.2.1 Experimental materials
The corn hybrid 32D78 harvested at seven moisture contents in 2009 was used as the
experimental material for dry grind fermentation. Corn samples were collected on 21
28
August, 09 September, 30 September, 13 October, 25 October, 09 November, and 23
November, at moisture contents of 73, 54, 40, 37, 30, 24 and 21% respectively. The corn
kernels reached their physiological maturity at the moisture content of 40%.
4.2.2 Enzymes and yeast
MaxaliqTM
ONE (Genencor, Palo lto, C ) is a formation of α–amylase (E.C. 3.2.1.1)
derived from Bacillus licheniformis and phytase (E.C. 3.1.3.26) derived from
Trichoderma reesei. The density of the MaxaliqTM
ONE enzyme is 1.15 g/ml. The
optimum pH for this enzyme formulation is 5.4-6.0. The recommended temperature for
the enzyme is 82-88°C. GC147 enzyme (Genencor, Palo Alto, CA) contains gluco-
amylase (E.C. 3.2.1.3) and bacterial pullulanase (3.2.1.41). The density of the GC147
enzyme is 1.07 g/ml, with declared activity of 580 GTU/g (1 GTU = enzyme to liberate 1
g of reducing sugars, calculated as glucose/h from soluble starch substrate). The
optimum pH and temperature for GC147 were 4.0-4.5 and 58-65°C, respectively. Yeast
culture was prepared by dispersing 5 g of active dry yeast (Fleischmann’s, Fenton, MO)
and 25 g of deionized water, and agitated at 90 rpm at 30°C for 20 min in an incubator
shaker (Model C24, New Brunswick, NJ).
4.2.3 Dry grind laboratory process
A conventional dry grind process was conducted following a modified version
reported by Wang et al. (2005) (Figure 8). Triplicate cleaned corn samples were ground
finely using a Quaker City plate mill (Model 4-E, The Straub Co., Hatboro, PA). Ground
corn moisture content was measured at 135°C for 2 h (AACC International 2000b).
Ground corn weight 100 g (dry matter) was mixed with deionized water to obtain mash
with a 30% dry solid content. The mash was adjusted to pH 5.7 using 10 N sulfuric acid
solution. All experiments were performed in a 500 ml flask for agitation. Mash was
incubated with 26 µL α–amylase (MaxaliqTM
ONE) at 82°C for 90 min with agitation at
30 rpm. After 90 min, slurry temperature was decreased to 30°C and the pH was
adjusted to 4.0 using 10 N sulfuric acid solution. An aliquot of 2 ml yeast culture, 50 µl
gluco-amylase (GC147) and 0.5 ml urea were added to the mash prior to a simultaneous
saccharification and fermentation (SSF) to convert the starch to ethanol.
29
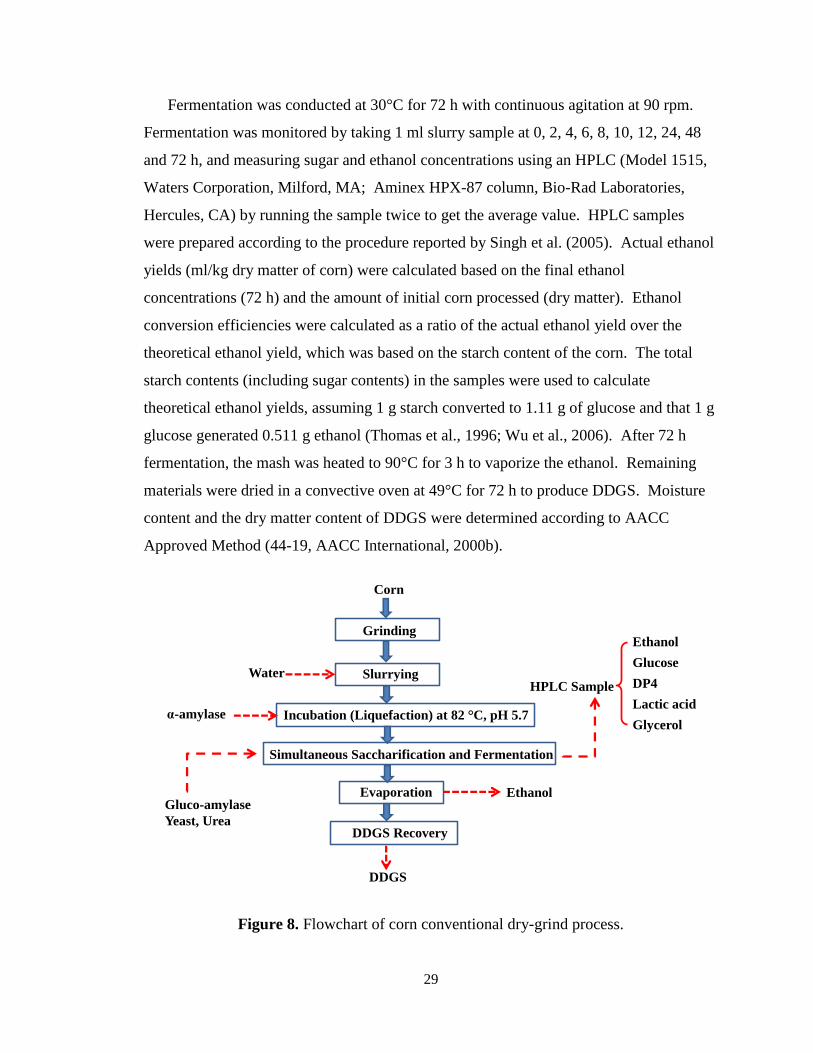
Fermentation was conducted at 30°C for 72 h with continuous agitation at 90 rpm.
Fermentation was monitored by taking 1 ml slurry sample at 0, 2, 4, 6, 8, 10, 12, 24, 48
and 72 h, and measuring sugar and ethanol concentrations using an HPLC (Model 1515,
Waters Corporation, Milford, MA; Aminex HPX-87 column, Bio-Rad Laboratories,
Hercules, CA) by running the sample twice to get the average value. HPLC samples
were prepared according to the procedure reported by Singh et al. (2005). Actual ethanol
yields (ml/kg dry matter of corn) were calculated based on the final ethanol
concentrations (72 h) and the amount of initial corn processed (dry matter). Ethanol
conversion efficiencies were calculated as a ratio of the actual ethanol yield over the
theoretical ethanol yield, which was based on the starch content of the corn. The total
starch contents (including sugar contents) in the samples were used to calculate
theoretical ethanol yields, assuming 1 g starch converted to 1.11 g of glucose and that 1 g
glucose generated 0.511 g ethanol (Thomas et al., 1996; Wu et al., 2006). After 72 h
fermentation, the mash was heated to 90°C for 3 h to vaporize the ethanol. Remaining
materials were dried in a convective oven at 49°C for 72 h to produce DDGS. Moisture
content and the dry matter content of DDGS were determined according to AACC
Approved Method (44-19, AACC International, 2000b).
Figure 8. Flowchart of corn conventional dry-grind process.
Corn
Grinding
SlurryingWater
Incubation (Liquefaction) at 82 C, pH 5.7
Simultaneous Saccharification and Fermentation
DDGS Recovery
DDGS
Evaporation Ethanol
α-amylase
Gluco-amylase
Yeast, Urea
HPLC Sample
Ethanol
Glucose
DP4
Lactic acid
Glycerol
30
4.2.4 Compositional analysis
Corn samples were sent to a commercial laboratory (Rock River Laboratory Inc.,
Watertown, WI) for compositional analysis, including crude protein (AOAC, 2003a),
crude fat (AOAC, 2003b), neutral detergent fiber (National Forage Testing Association,
2002), and ash (AOAC, 2003c). Starch content was determined using a glucose analyzer
(Model 2000, Yellow Spring Instrument, Yellow Springs, Ohio) and using an enzymatic
external hydrolysis. Three replications were conducted for each composition analysis.
The Duncan’s multiple range test was used for data analysis (SPSS 17.0, Somers, NY).
The level selected to show statistical significance was 5% (p < 0.05).
4.3 Results and discussion
4.3.1 Corn composition
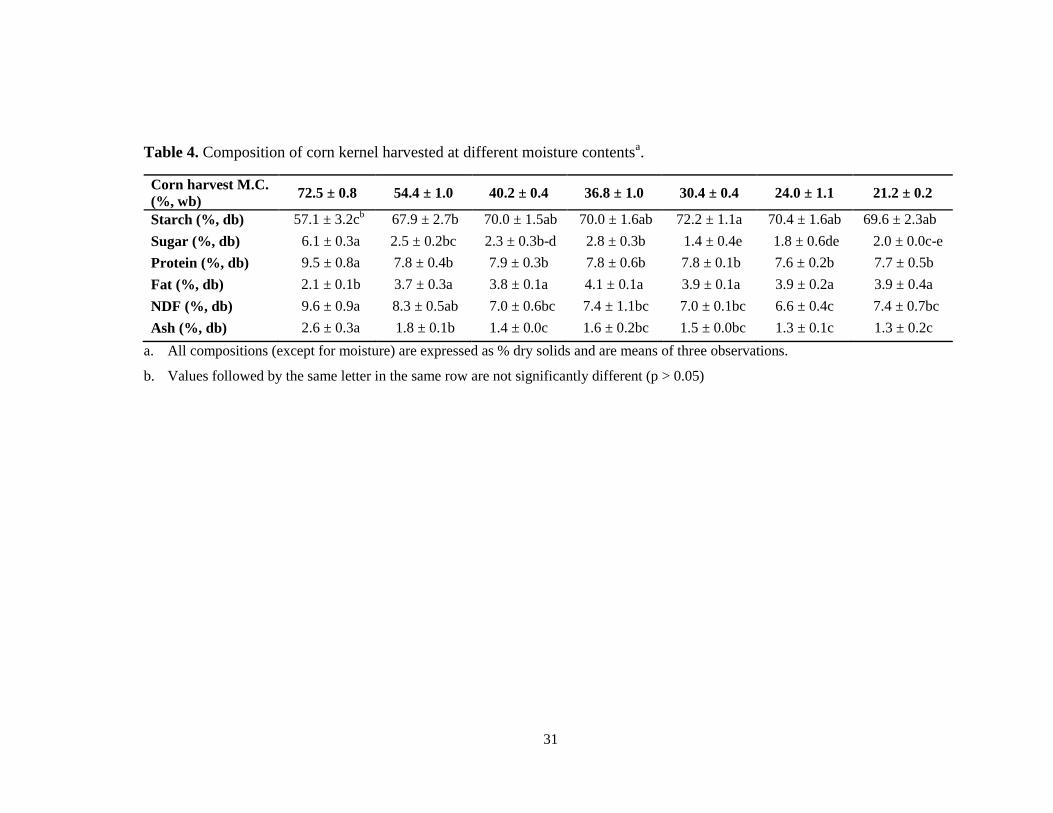
Corn harvested at moisture contents of 73% and 54% had lower starch concentrations
than corn harvested at lower moisture contents (Table 4), indicating the starch
accumulation was not completed. Glucose concentration was highest (6.1%) when corn
was harvested at moisture content of 73% and decreased to 2.5% when corn was
harvested at moisture content of 54%, because some glucose was converted to starch
during corn maturation (Ingle et al., 1965). Total protein concentration decreased from
9.5 to 7.8% when corn moisture dropped from 73% to 54%, due to the faster synthesis of
starch than protein (Bressani & Conde, 1961). During the same time period, fat
concentration in corn increased from 2.1% to 3.7%. The increase in fat concentration
during kernel maturation was also reported by Ingle et al. (1965). After corn reached
physiological maturity at moisture content of 40%, no changes in composition were
observed.
31
Table 4. Composition of corn kernel harvested at different moisture contentsa.
Corn harvest M.C.
(%, wb) 72.5 ± 0.8 54.4 ± 1.0 40.2 ± 0.4 36.8 ± 1.0 30.4 ± 0.4 24.0 ± 1.1 21.2 ± 0.2
Starch (%, db) 57.1 ± 3.2cb 67.9 ± 2.7b 70.0 ± 1.5ab 70.0 ± 1.6ab 72.2 ± 1.1a 70.4 ± 1.6ab 69.6 ± 2.3ab
Sugar (%, db) 6.1 ± 0.3a 2.5 ± 0.2bc 2.3 ± 0.3b-d 2.8 ± 0.3b 1.4 ± 0.4e 1.8 ± 0.6de 2.0 ± 0.0c-e
Protein (%, db) 9.5 ± 0.8a 7.8 ± 0.4b 7.9 ± 0.3b 7.8 ± 0.6b 7.8 ± 0.1b 7.6 ± 0.2b 7.7 ± 0.5b
Fat (%, db) 2.1 ± 0.1b 3.7 ± 0.3a 3.8 ± 0.1a 4.1 ± 0.1a 3.9 ± 0.1a 3.9 ± 0.2a 3.9 ± 0.4a
NDF (%, db) 9.6 ± 0.9a 8.3 ± 0.5ab 7.0 ± 0.6bc 7.4 ± 1.1bc 7.0 ± 0.1bc 6.6 ± 0.4c 7.4 ± 0.7bc
Ash (%, db) 2.6 ± 0.3a 1.8 ± 0.1b 1.4 ± 0.0c 1.6 ± 0.2bc 1.5 ± 0.0bc 1.3 ± 0.1c 1.3 ± 0.2c
a. All compositions (except for moisture) are expressed as % dry solids and are means of three observations.
b. Values followed by the same letter in the same row are not significantly different (p > 0.05)
32
4.3.2 Fermentation results
Ethanol profile and yields
For the first 8 h of fermentation, ethanol profiles were comparable (Figure 9 a, b).
After 8 h, corn harvested with 73% M.C. had a visible lower ethanol concentration
compared to corn harvested with any other moisture contents (Figure 9 a, b), which was
likely due to the lower starch concentration (57.1%) and higher fiber concentration
(9.6%) in corn with 73% harvest M.C. (Table 4). This is similar to the results previously
reported by Jennings et al. (2002a) and Huang et al. (2012b), who found the starch yield
in wet-milling process from pre-matured corn was lower than that from matured corn.
Although corn harvested with 54% M.C. had a lower starch content (67.9%) compared to
matured corn (69.6 to 72.2% starch content), the final ethanol concentrations for the corn
with 54% harvest M.C. was 0.5 to 1.2 percentage points higher (Table 5). The result
indicated that starch in corn with 54% harvest M.C. had higher fermentability than that in
matured corn with lower harvest moistures. This was also verified by the residual starch
content in DDGS, where the residual starch in DDGS for pre-maturity corn (harvest M.C.
of 73 and 54%) was lower than that for matured corn (Figure 11). Lower residual starch
content in DDGS indicated a higher starch to sugar conversion during liquefaction, and
thereby leading to a higher ethanol yield. Lately, profit margins in dry grind ethanol
production are shrinking due to the high corn price. Increasing ethanol yield for each
kilogram of corn, even if only one percent, would have a great impact in a commercial
ethanol plant.
The highest ethanol conversion efficiency (98.5%) was achieved when corn was
harvested with 73% M.C., followed by corn harvested with 54% M.C., whose conversion
efficiency was 93.2%. The ethanol conversion efficiencies for matured corn (harvest
M.C. of 40 to 21%) were lower, between 83.2 and 88.3% (Table 5). Higher ethanol
conversion efficiency for pre-maturity corn (harvest M.C. of 73 and 54%) could be due
to several reasons: first, pre-matured corn had lower amylose/amylopectin ratios in corn
starch (Shannon and Garwood, 1984; Li et al., 2007), which lead to lower resistant starch
after liquefaction and fermentation (Sharma et al., 2010). Second, with corn maturation
starch granules in endosperm are increasingly surrounded by protein bodies and
embedded in a dense protein matrix (Khoo and Wolf, 1970; Philippeau and Michalet-
Doreau, 1997), which would limit the action of starch hydrolytic enzymes during
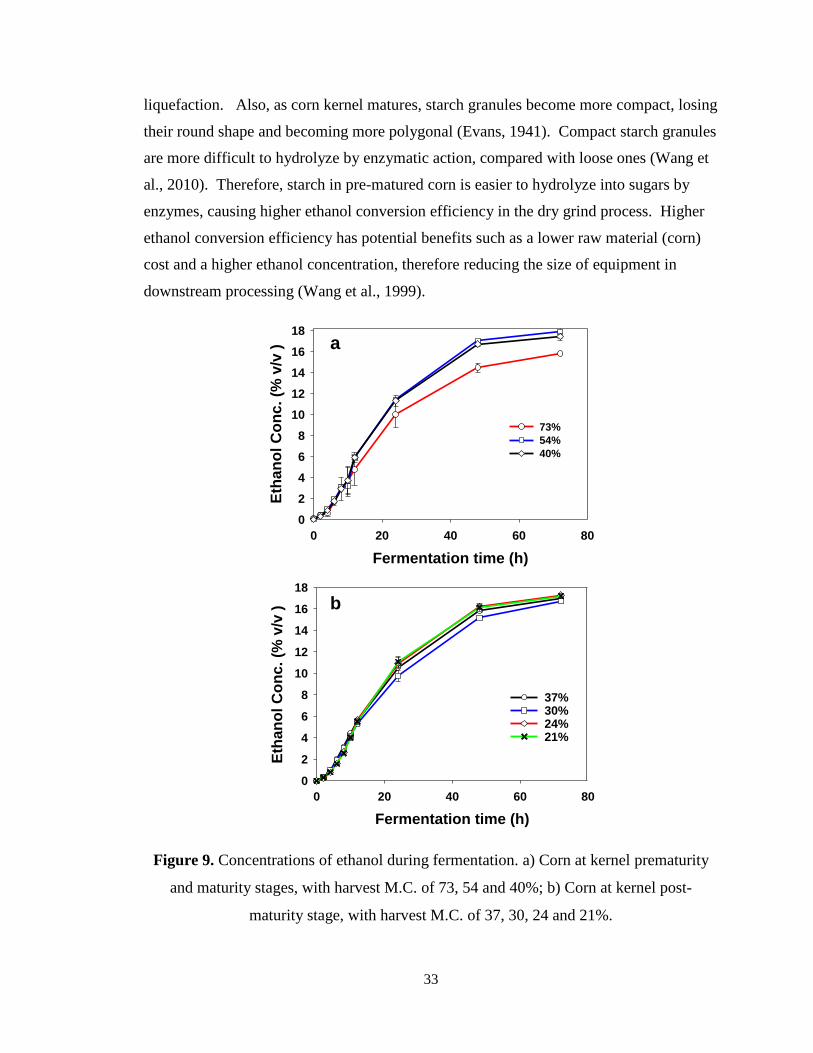
33
liquefaction. Also, as corn kernel matures, starch granules become more compact, losing
their round shape and becoming more polygonal (Evans, 1941). Compact starch granules
are more difficult to hydrolyze by enzymatic action, compared with loose ones (Wang et
al., 2010). Therefore, starch in pre-matured corn is easier to hydrolyze into sugars by
enzymes, causing higher ethanol conversion efficiency in the dry grind process. Higher
ethanol conversion efficiency has potential benefits such as a lower raw material (corn)
cost and a higher ethanol concentration, therefore reducing the size of equipment in
downstream processing (Wang et al., 1999).
Figure 9. Concentrations of ethanol during fermentation. a) Corn at kernel prematurity
and maturity stages, with harvest M.C. of 73, 54 and 40%; b) Corn at kernel post-
maturity stage, with harvest M.C. of 37, 30, 24 and 21%.
Fermentation time (h)
0 20 40 60 80
Eth
an
ol
Co
nc
. (%
v/v
)
0
2
4
6
8
10
12
14
16
18a
73%
54%
40%
Fermentation time (h)
0 20 40 60 80
Eth
an
ol
Co
nc
. (%
v/v
)
0
2
4
6
8
10
12
14
16
18
b
37%30%24%21%
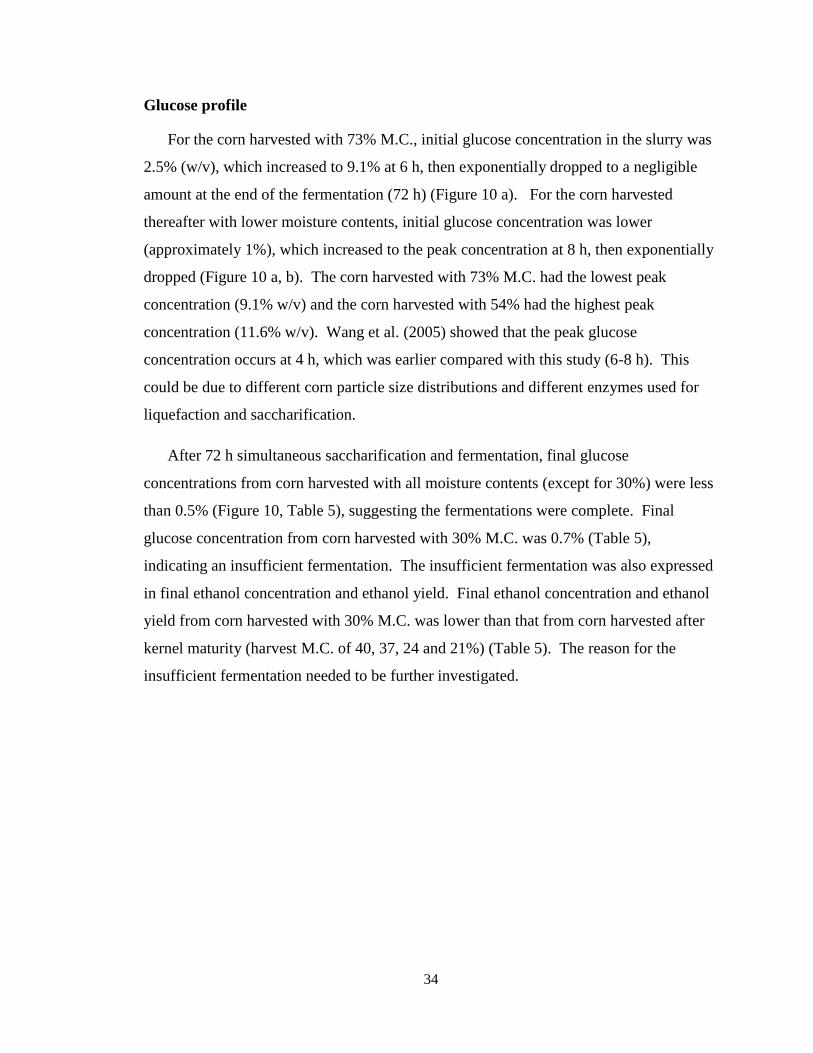
34
Glucose profile
For the corn harvested with 73% M.C., initial glucose concentration in the slurry was
2.5% (w/v), which increased to 9.1% at 6 h, then exponentially dropped to a negligible
amount at the end of the fermentation (72 h) (Figure 10 a). For the corn harvested
thereafter with lower moisture contents, initial glucose concentration was lower
(approximately 1%), which increased to the peak concentration at 8 h, then exponentially
dropped (Figure 10 a, b). The corn harvested with 73% M.C. had the lowest peak
concentration (9.1% w/v) and the corn harvested with 54% had the highest peak
concentration (11.6% w/v). Wang et al. (2005) showed that the peak glucose
concentration occurs at 4 h, which was earlier compared with this study (6-8 h). This
could be due to different corn particle size distributions and different enzymes used for
liquefaction and saccharification.
After 72 h simultaneous saccharification and fermentation, final glucose
concentrations from corn harvested with all moisture contents (except for 30%) were less
than 0.5% (Figure 10, Table 5), suggesting the fermentations were complete. Final
glucose concentration from corn harvested with 30% M.C. was 0.7% (Table 5),
indicating an insufficient fermentation. The insufficient fermentation was also expressed
in final ethanol concentration and ethanol yield. Final ethanol concentration and ethanol
yield from corn harvested with 30% M.C. was lower than that from corn harvested after
kernel maturity (harvest M.C. of 40, 37, 24 and 21%) (Table 5). The reason for the
insufficient fermentation needed to be further investigated.
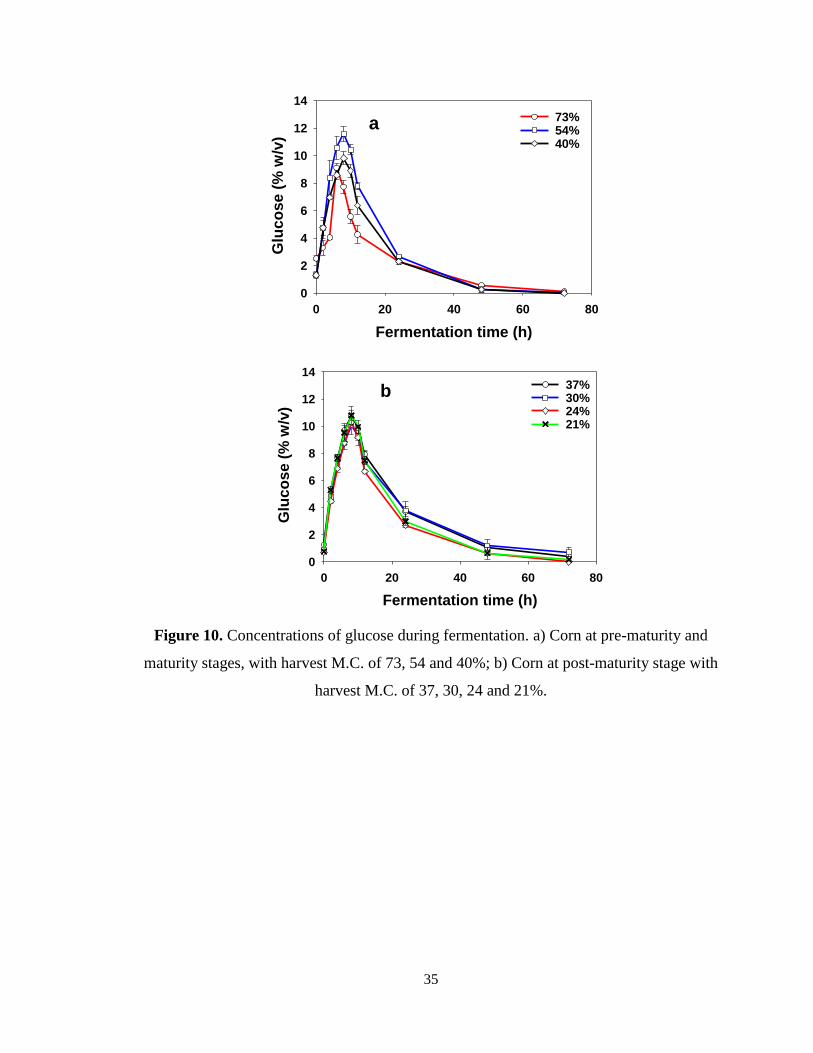
35
Figure 10. Concentrations of glucose during fermentation. a) Corn at pre-maturity and
maturity stages, with harvest M.C. of 73, 54 and 40%; b) Corn at post-maturity stage with
harvest M.C. of 37, 30, 24 and 21%.
Fermentation time (h)
0 20 40 60 80
Glu
co
se (
% w
/v)
0
2
4
6
8
10
12
14
a 73%54%40%
Fermentation time (h)
0 20 40 60 80
Glu
co
se
(%
w/v
)
0
2
4
6
8
10
12
14
b 37%30% 24%21%
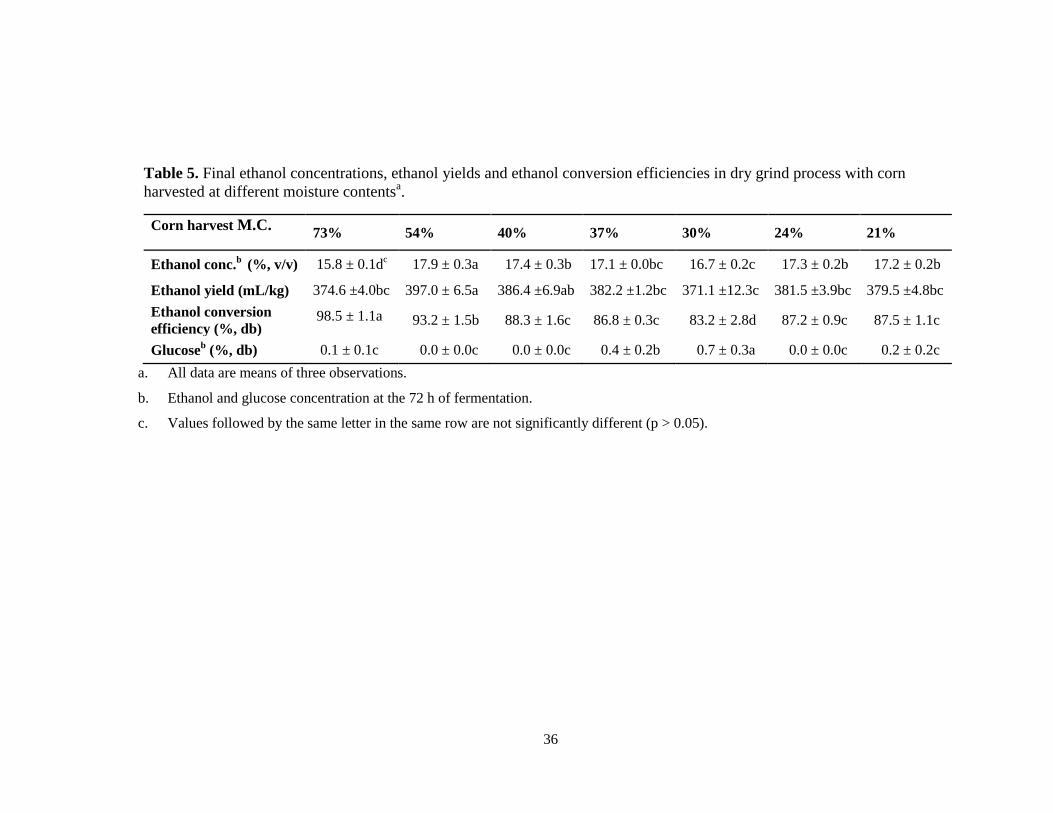
36
Table 5. Final ethanol concentrations, ethanol yields and ethanol conversion efficiencies in dry grind process with corn
harvested at different moisture contentsa.
Corn harvest M.C. 73% 54% 40% 37% 30% 24% 21%
Ethanol conc.b
(%, v/v) 15.8 ± 0.1dc 17.9 ± 0.3a 17.4 ± 0.3b 17.1 ± 0.0bc 16.7 ± 0.2c 17.3 ± 0.2b 17.2 ± 0.2b
Ethanol yield (mL/kg) 374.6 ±4.0bc 397.0 ± 6.5a 386.4 ±6.9ab 382.2 ±1.2bc 371.1 ±12.3c 381.5 ±3.9bc 379.5 ±4.8bc
Ethanol conversion
efficiency (%, db) 98.5 ± 1.1a 93.2 ± 1.5b 88.3 ± 1.6c 86.8 ± 0.3c 83.2 ± 2.8d 87.2 ± 0.9c 87.5 ± 1.1c
Glucoseb (%, db) 0.1 ± 0.1c 0.0 ± 0.0c 0.0 ± 0.0c 0.4 ± 0.2b 0.7 ± 0.3a 0.0 ± 0.0c 0.2 ± 0.2c
a. All data are means of three observations.
b. Ethanol and glucose concentration at the 72 h of fermentation.
c. Values followed by the same letter in the same row are not significantly different (p > 0.05).
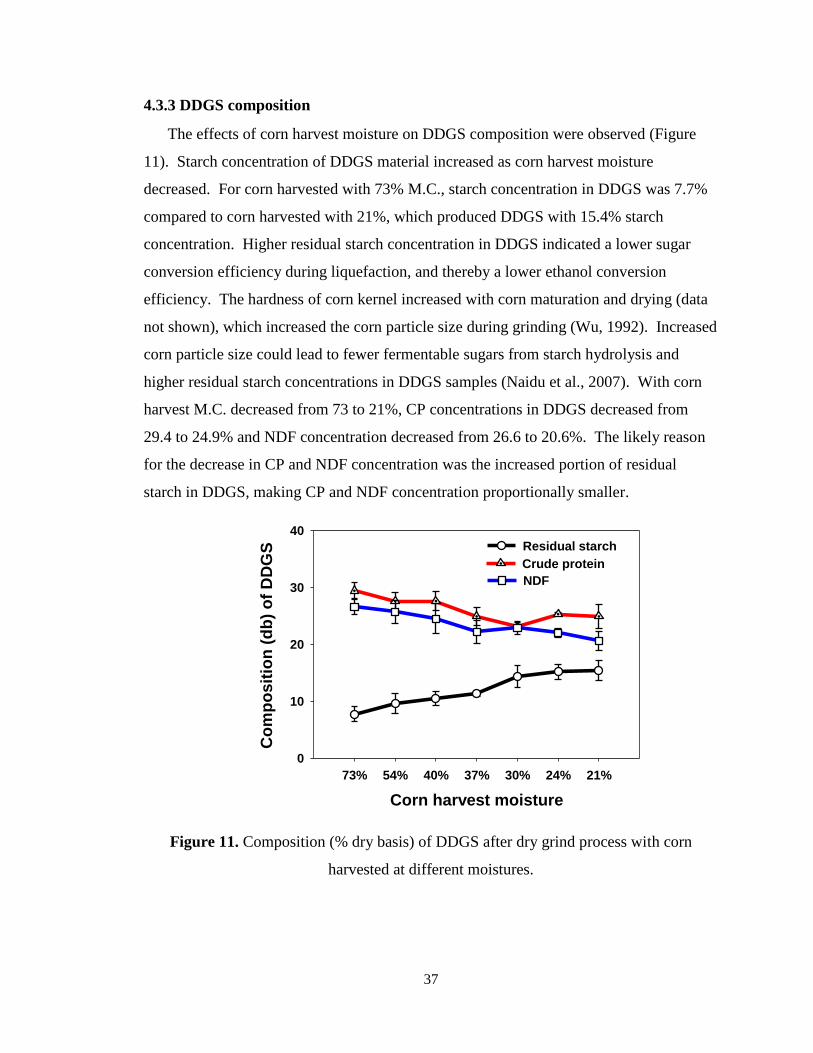
37
4.3.3 DDGS composition
The effects of corn harvest moisture on DDGS composition were observed (Figure
11). Starch concentration of DDGS material increased as corn harvest moisture
decreased. For corn harvested with 73% M.C., starch concentration in DDGS was 7.7%
compared to corn harvested with 21%, which produced DDGS with 15.4% starch
concentration. Higher residual starch concentration in DDGS indicated a lower sugar
conversion efficiency during liquefaction, and thereby a lower ethanol conversion
efficiency. The hardness of corn kernel increased with corn maturation and drying (data
not shown), which increased the corn particle size during grinding (Wu, 1992). Increased
corn particle size could lead to fewer fermentable sugars from starch hydrolysis and
higher residual starch concentrations in DDGS samples (Naidu et al., 2007). With corn
harvest M.C. decreased from 73 to 21%, CP concentrations in DDGS decreased from
29.4 to 24.9% and NDF concentration decreased from 26.6 to 20.6%. The likely reason
for the decrease in CP and NDF concentration was the increased portion of residual
starch in DDGS, making CP and NDF concentration proportionally smaller.
Figure 11. Composition (% dry basis) of DDGS after dry grind process with corn
harvested at different moistures.
Corn harvest moisture
73% 54% 40% 37% 30% 24% 21%
Co
mp
osit
ion
(d
b)
of
DD
GS
0
10
20
30
40
Residual starch
Crude protein
NDF
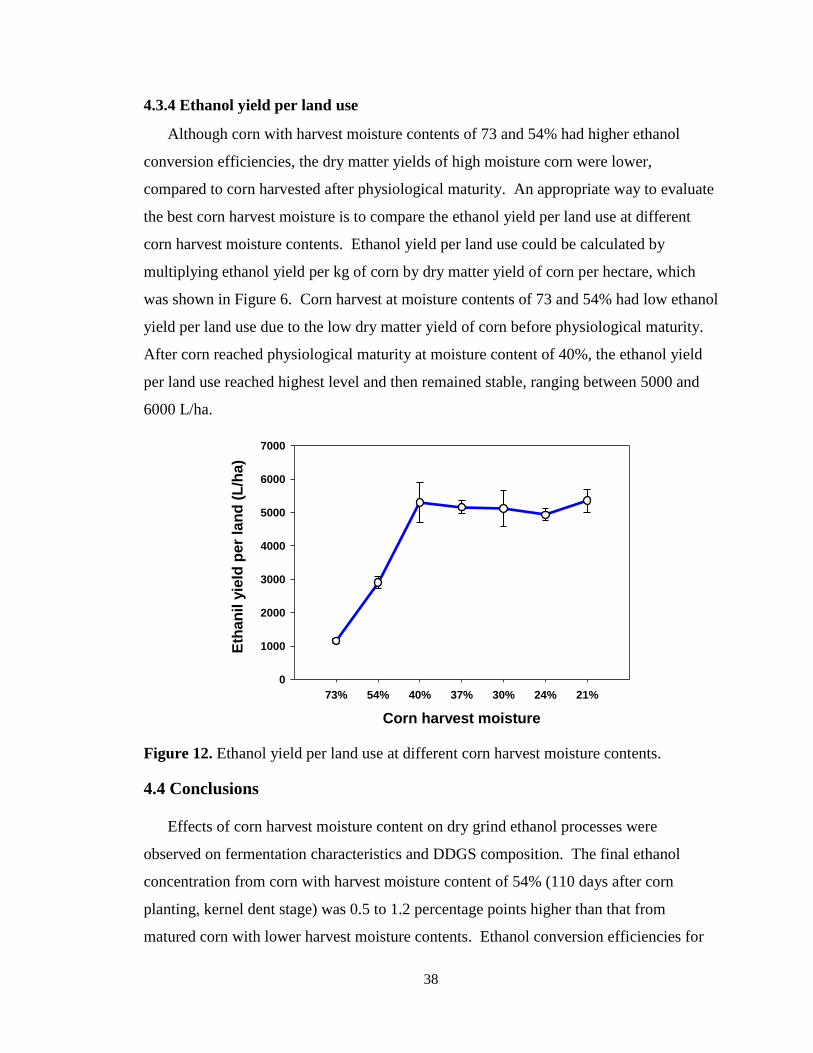
38
4.3.4 Ethanol yield per land use
Although corn with harvest moisture contents of 73 and 54% had higher ethanol
conversion efficiencies, the dry matter yields of high moisture corn were lower,
compared to corn harvested after physiological maturity. An appropriate way to evaluate
the best corn harvest moisture is to compare the ethanol yield per land use at different
corn harvest moisture contents. Ethanol yield per land use could be calculated by
multiplying ethanol yield per kg of corn by dry matter yield of corn per hectare, which
was shown in Figure 6. Corn harvest at moisture contents of 73 and 54% had low ethanol
yield per land use due to the low dry matter yield of corn before physiological maturity.
After corn reached physiological maturity at moisture content of 40%, the ethanol yield
per land use reached highest level and then remained stable, ranging between 5000 and
6000 L/ha.
Figure 12. Ethanol yield per land use at different corn harvest moisture contents.
4.4 Conclusions
Effects of corn harvest moisture content on dry grind ethanol processes were
observed on fermentation characteristics and DDGS composition. The final ethanol
concentration from corn with harvest moisture content of 54% (110 days after corn
planting, kernel dent stage) was 0.5 to 1.2 percentage points higher than that from
matured corn with lower harvest moisture contents. Ethanol conversion efficiencies for
Corn harvest moisture
73% 54% 40% 37% 30% 24% 21%
Eth
an
il y
ield
per
lan
d (
L/h
a)
0
1000
2000
3000
4000
5000
6000
7000

39
the corn with harvest moisture contents of 73 and 54% were higher than that for the corn
with lower harvest moisture contents, however, ethanol yield per land use were lower due
to the low dry mater yield of corn before physiological maturity. With the corn harvest
moisture drying down from 73 to 21%, the residual starch concentration in DDGS
increased while the CP and NDF concentrations in DDGS decreased.
40
Chapter 5. Effect of corn harvest moisture on wet milling
yields and starch pasting properties
5.1 Introduction
Early harvest corn and corn stover has benefits in terms of high quality of corn, high
dry matter yield of corn stover and long harvest time window. However, early harvested
corn poses a problem of storability due to its high moisture content. High moisture corn
spoils readily, and it is a safety hazard when moldy. Most corn drying systems today are
designed to dry corn from the mid-twenty percent moisture range to 15%. Increasing
average initial moisture content from 20-25% to 35-40 means more than doubles the
amount of moisture needed to be removed, which leads to longer drying time and higher
energy cost. To solve this problem, Eckhoff (2010) suggested freezing instead of drying
corn for storage. The latent heat of fusion for water is 334 kJ/kg, and the latent heat of
vaporization for water is 2260 kJ/kg. Therefore, there is an opportunity to save energy by
freezing, if corn could be flash frozen and insulated well in a large building. Simulation
results (data not shown) indicated that 10 to 15 centimeters of polyurethane foam wall
would be good for frozen corn insulation. The frozen corn can be delivered to the wet
milling plant or ethanol plant for further processing. The benefits of using freezing are
skewed to greater production for the farmer but also have some advantages for the
ethanol processor. Where water is scare, freezing 40% moisture content corn provides
input water equal to 2.9 gallons of water per bushel, compared to dried corn (14.5%
M.C.). This would cut process water usage in half or better. The frozen corn can also be
used as a heat sink for the fermenter, reducing the cooling water load. In wet milling, 8
to 10 gallons of water are typically used in processing a bushel of corn. The addition of
40% moisture corn would reduce the amount of water needed in steeping to 5.1 to 7.1
gallons per bushel.
Jennings et al. (2002a, 2002b) harvested corn at different maturity stages with
different moisture contents between 25% and 56%, and evaluated the effects of maturity
on corn quality and wet milling properties of two selected corn hybrids. They found that
maturity affected the starch yield and some of the starch pasting properties. The effect of
frozen storage of corn on starch yields and quality from wet milling process is unknown.
41
The objective of this study was to evaluate the effect of harvest moisture content and
frozen storage time on corn wet-milling yields and the pasting properties of the resulting
starch.
5.2 Materials and methods
5.2.1 Experimental materials and chemical composition analyses
Triplicate samples of corn from the southwest, southeast and north regions of testing
field in the ABE farm were collected on 05 August, 19 August, and 03 September 2010,
which corresponded to 1233, 1432, and 1626 AGDDs after planting, representing corn
pre-mature, mature and drying down stages. The moisture contents collected at these
three stages were 49, 35 and 21%, respectively. Determining the chemical composition,
moisture content, and starch content of the samples was carried out in the same way for
samples used for the dry grind ethanol experiments.
5.2.2 Wet milling laboratory process
The corn samples were evaluated in triplicate using the 100 g wet milling procedure
described by Eckhoff et al. (1996) (Figure 13). Samples for milling were steeped at 52°C
for 24 h in 180 ml steep water, containing 2,000 ppm sulfur dioxide and 0.5% (w/w)
lactic acid. At the completion of steeping, steepwater was drained into a 250 ml
graduated cylinder, and unabsorbed steepwater volume was measured and dried to
determine total steepwater solids (SWS) using a two-stage drying procedure (AACC
International, 2000b). The steeped corn was milled in an equal volume of water (v/v)
using a Waring type blender (Dynamic Corp. of America, New Hartford City, CT). The
ground slurry was transferred along with 500 ml water to a tarred standard testing sieve
(U.S. NO.7, 2.80 mm openings) placed at the bottom of a 10 L bucket. The bucket and
sieve arrangement was shaken (Model RX-86, W.S. Tyler Co., Cleveland, OH) for 5 min.
The material retained on the sieve contained whole and large broken germ pieces and
large pieces of pericarp. The slurry that passed through the sieve was then finely ground
in a Quaker City plate mill (Model No. 4-E, The Straub Co., Warminster, PA). After
second grind, the slurry was allowed to settle for 45 min and approximately 750 ml water
was decanted. The decanted slurry was sieved with a standard testing sieve (U.S. NO.
200, 75 µm openings) on the Ro-Tap testing sieve shaker for 5 min. The material
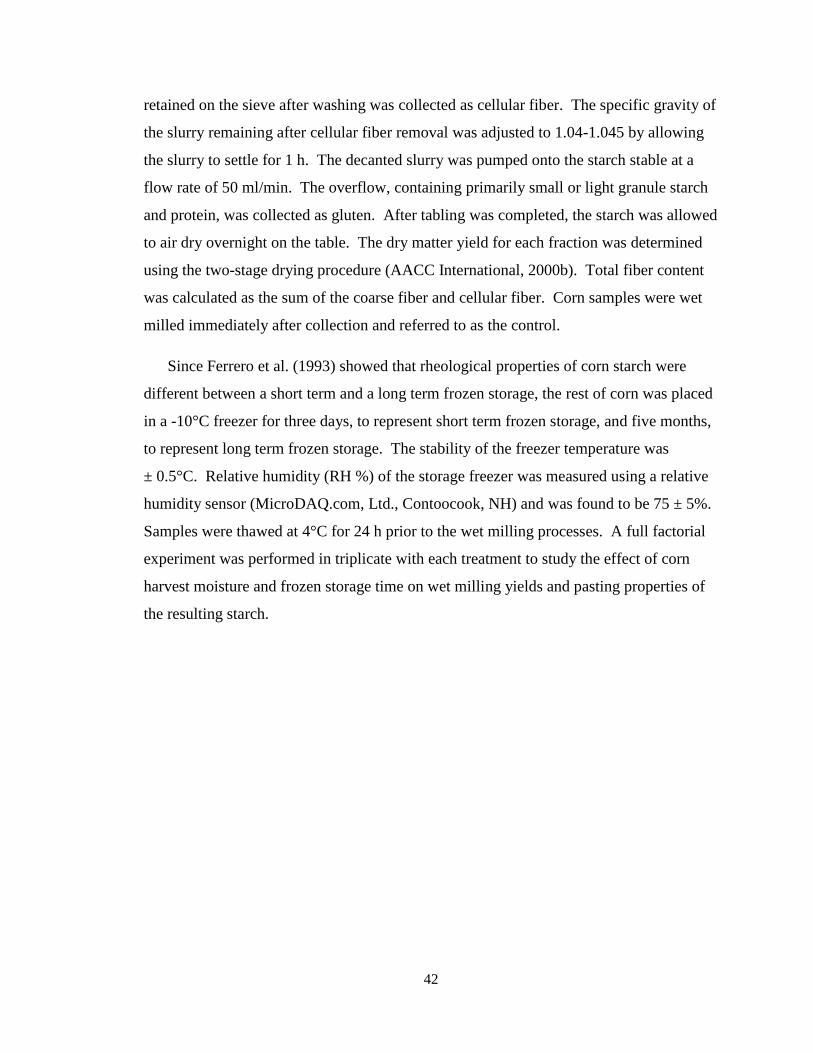
42
retained on the sieve after washing was collected as cellular fiber. The specific gravity of
the slurry remaining after cellular fiber removal was adjusted to 1.04-1.045 by allowing
the slurry to settle for 1 h. The decanted slurry was pumped onto the starch stable at a
flow rate of 50 ml/min. The overflow, containing primarily small or light granule starch
and protein, was collected as gluten. After tabling was completed, the starch was allowed
to air dry overnight on the table. The dry matter yield for each fraction was determined
using the two-stage drying procedure (AACC International, 2000b). Total fiber content
was calculated as the sum of the coarse fiber and cellular fiber. Corn samples were wet
milled immediately after collection and referred to as the control.
Since Ferrero et al. (1993) showed that rheological properties of corn starch were
different between a short term and a long term frozen storage, the rest of corn was placed
in a -10°C freezer for three days, to represent short term frozen storage, and five months,
to represent long term frozen storage. The stability of the freezer temperature was
± 0.5°C. Relative humidity (RH %) of the storage freezer was measured using a relative
humidity sensor (MicroDAQ.com, Ltd., Contoocook, NH) and was found to be 75 ± 5%.
Samples were thawed at 4°C for 24 h prior to the wet milling processes. A full factorial
experiment was performed in triplicate with each treatment to study the effect of corn
harvest moisture and frozen storage time on wet milling yields and pasting properties of
the resulting starch.
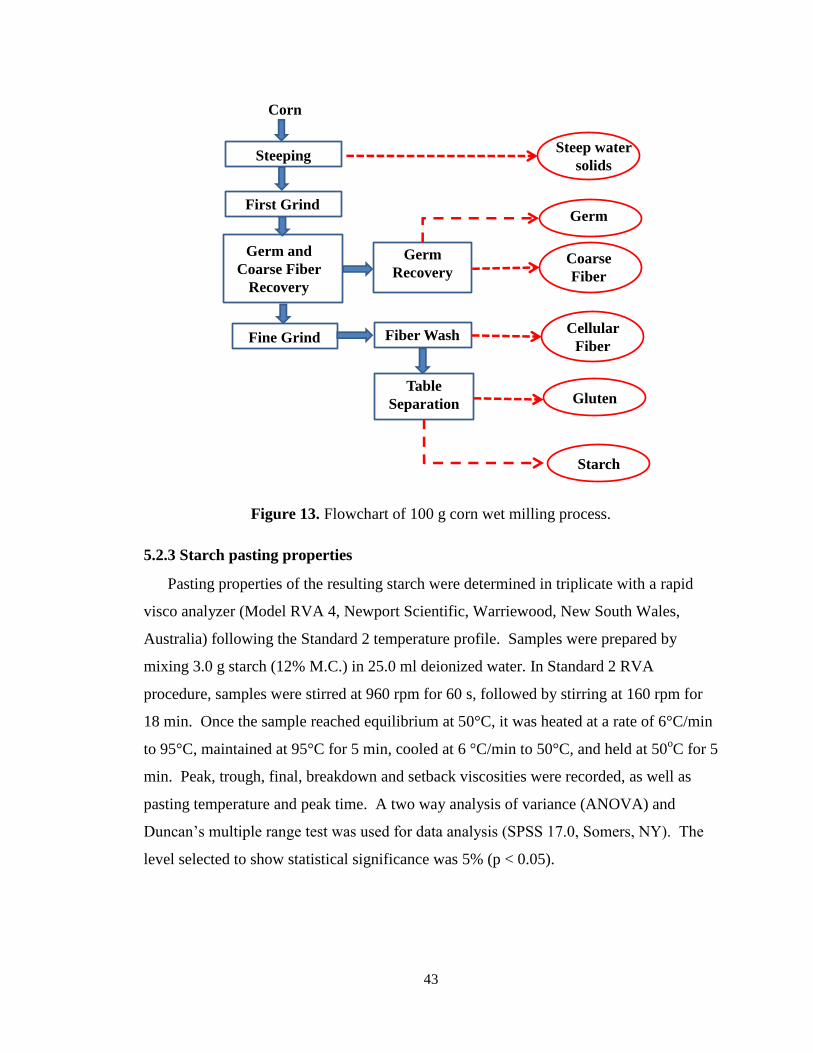
43
Figure 13. Flowchart of 100 g corn wet milling process.
5.2.3 Starch pasting properties
Pasting properties of the resulting starch were determined in triplicate with a rapid
visco analyzer (Model RVA 4, Newport Scientific, Warriewood, New South Wales,
Australia) following the Standard 2 temperature profile. Samples were prepared by
mixing 3.0 g starch (12% M.C.) in 25.0 ml deionized water. In Standard 2 RVA
procedure, samples were stirred at 960 rpm for 60 s, followed by stirring at 160 rpm for
18 min. Once the sample reached equilibrium at 50°C, it was heated at a rate of 6°C/min
to 95°C, maintained at 95°C for 5 min, cooled at 6 °C/min to 50°C, and held at 50oC for 5
min. Peak, trough, final, breakdown and setback viscosities were recorded, as well as
pasting temperature and peak time. A two way analysis of variance (ANOVA) and
Duncan’s multiple range test was used for data analysis (SPSS 17.0, Somers, NY). The
level selected to show statistical significance was 5% (p < 0.05).
Corn
Steeping
First Grind
Germ and
Coarse Fiber
Recovery
Fine Grind Fiber Wash
Table
Separation
Germ
Recovery
Steep water
solids
Gluten
Coarse
Fiber
Cellular
Fiber
Germ
Starch
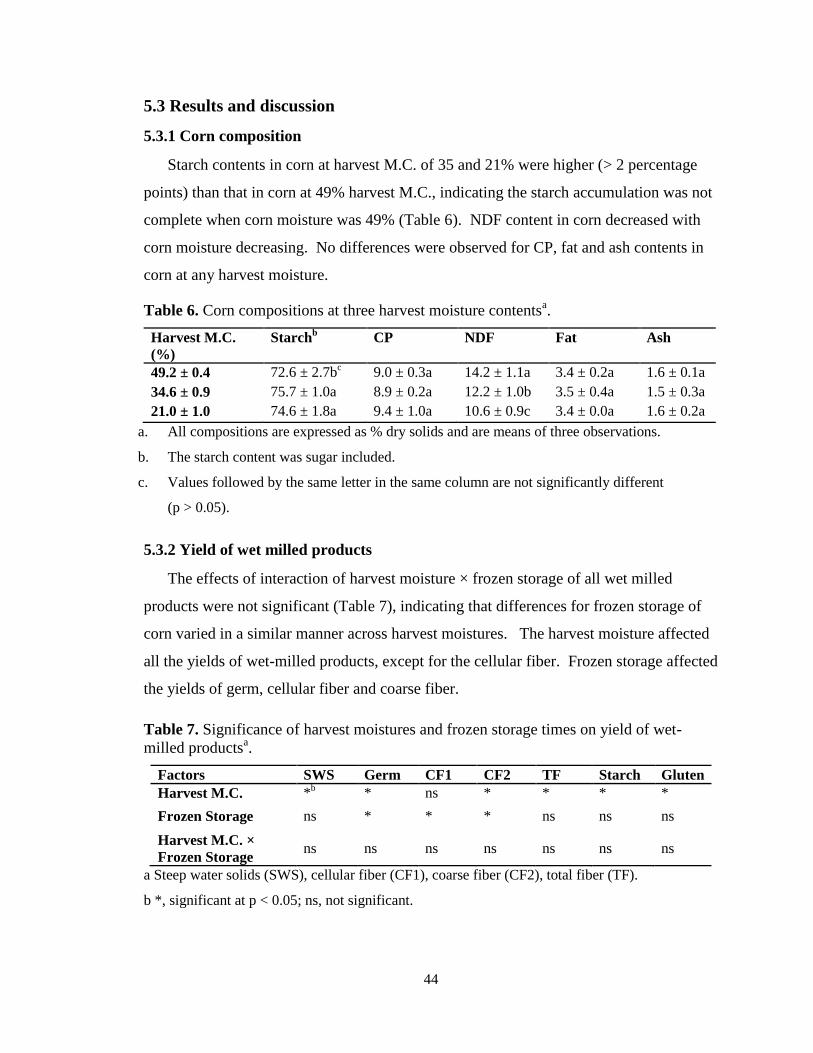
44
5.3 Results and discussion
5.3.1 Corn composition
Starch contents in corn at harvest M.C. of 35 and 21% were higher (> 2 percentage
points) than that in corn at 49% harvest M.C., indicating the starch accumulation was not
complete when corn moisture was 49% (Table 6). NDF content in corn decreased with
corn moisture decreasing. No differences were observed for CP, fat and ash contents in
corn at any harvest moisture.
Table 6. Corn compositions at three harvest moisture contentsa.
Harvest M.C.
(%)
Starchb CP NDF Fat Ash
49.2 ± 0.4 72.6 ± 2.7bc 9.0 ± 0.3a 14.2 ± 1.1a 3.4 ± 0.2a 1.6 ± 0.1a
34.6 ± 0.9 75.7 ± 1.0a 8.9 ± 0.2a 12.2 ± 1.0b 3.5 ± 0.4a 1.5 ± 0.3a
21.0 ± 1.0 74.6 ± 1.8a 9.4 ± 1.0a 10.6 ± 0.9c 3.4 ± 0.0a 1.6 ± 0.2a
a. All compositions are expressed as % dry solids and are means of three observations.
b. The starch content was sugar included.
c. Values followed by the same letter in the same column are not significantly different
(p > 0.05).
5.3.2 Yield of wet milled products
The effects of interaction of harvest moisture × frozen storage of all wet milled
products were not significant (Table 7), indicating that differences for frozen storage of
corn varied in a similar manner across harvest moistures. The harvest moisture affected
all the yields of wet-milled products, except for the cellular fiber. Frozen storage affected
the yields of germ, cellular fiber and coarse fiber.
Table 7. Significance of harvest moistures and frozen storage times on yield of wet-
milled productsa.
Factors SWS Germ CF1 CF2 TF Starch Gluten
Harvest M.C. *b * ns * * * *
Frozen Storage ns * * * ns ns ns
Harvest M.C. ×
Frozen Storage ns ns ns ns ns ns ns
a Steep water solids (SWS), cellular fiber (CF1), coarse fiber (CF2), total fiber (TF).
b *, significant at p < 0.05; ns, not significant.
45
The starch yield from corn at 21% harvest M.C. was 1.2 percentage point higher than
that from corn at 49% harvest M.C. (65.3 ± 0.4 vs. 64.1 ± 0.5) (Table 8), which was
likely due to the lower starch content in corn at 49% harvest M.C.. This is similar to the
result reported by Jennings et al. (2002a), who found the starch yield increased by 2.9
percentage points during corn maturity. Based on the corn composition analysis (Table
6), 85-88% of the total starch was extracted by wet-milling processes, depending on the
corn harvest moisture. The unrecoverable starch was lost to germ, fiber and gluten
fractions (Eckhoff et al., 1999). Statistical analysis based on ANOVA test showed no
significant effects of frozen storage on starch yield in wet-milling process (Table 8).
During steeping, soluble protein and sugars leach out, primarily from the germ. The
yield of steep water solids decreased with corn harvest moisture decreasing (Table 8).
The yield of steep water solids from corn at 49% harvest M.C. was 2.1 percentage points
higher than that from corn at 21% harvest M.C. (5.8 ± 0.1 vs. 3.7 ± 0.2). The decreased
yield of steep water solids could be attributed to the transformations of soluble protein
and sugars into storage protein and starch during corn maturity (Ingle et al., 1965). No
significant effect of frozen storage on yield of steep water solids was observed in this
study (Table 7).
The germ yield increased by 1.9 percentage points when corn harvest moisture
decreased from 49% to 21% (5.3 ± 0.1 vs 7.2 ± 0.2) (Table 8). This result would be
expected because the corn embryo is much slower to develop than the endosperm
(Kiesselbach and Walker, 1952; Schel et al., 1984; Watson, 2003), and the embryo was
not fully developed at the pre-maturity stage, when the corn moisture was 49%. Lower
yield of germ from pre-mature corn was also reported by Jennings et al. (2002a), who
found the yield of germ from pre-mature corn was 0.8 percentage points lower, compared
with matured corn.
For corn harvested at 49% M.C., the coarse fiber yields from 3-day and 5-month
frozen storage were 0.8 and 0.7 percentage points lower, respectively, than the coarse
fiber yield from control (unfrozen corn) (Table 8). We hypothesized that the frozen
storage made the pericarp fragile, and the fragile pericarp was easily broken during the
first grind with a blender. All the broken pericarp flowed into the cellular fiber fraction,
causing a higher yield of cellular fiber from the frozen storage corn. The total fiber

46
content decreased by 0.7 percentage points as corn harvest moisture decreased. This is
similar to the results previously reported by Jennings et al. (2002a), who proposed the
main reason was that the surface area of fiber becomes proportionately smaller as the
other components of the maturing corn are deposited.
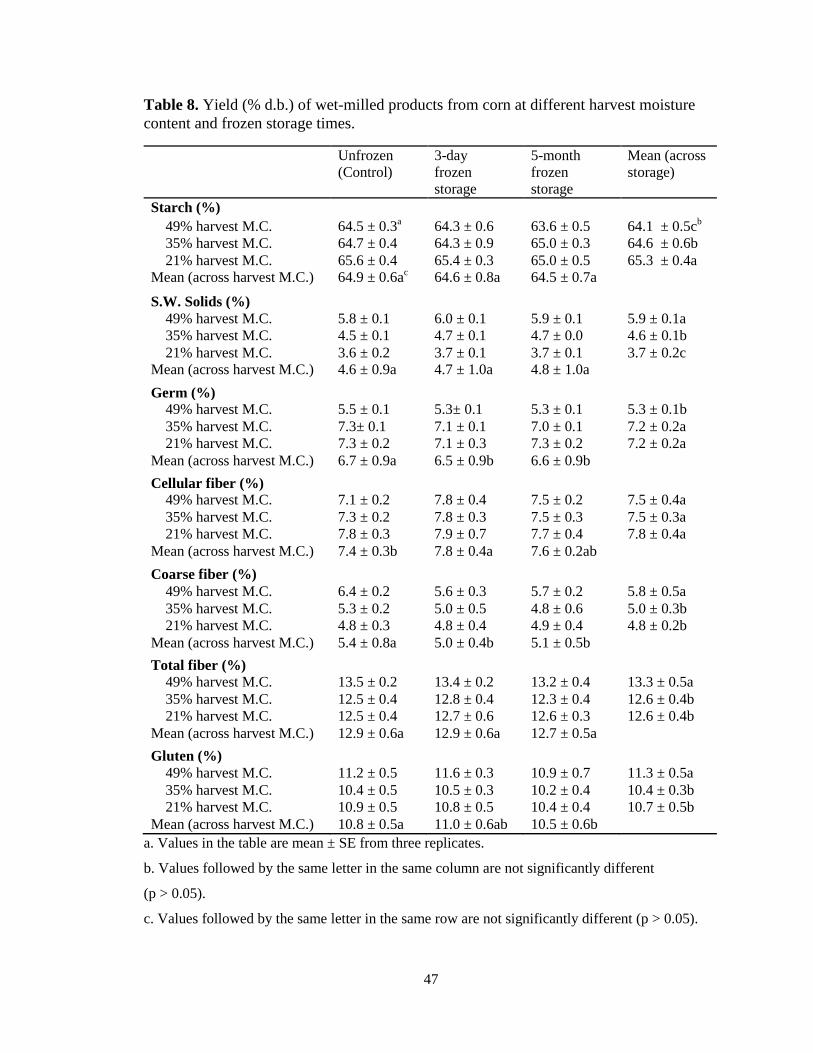
47
Table 8. Yield (% d.b.) of wet-milled products from corn at different harvest moisture
content and frozen storage times.
Unfrozen
(Control)
3-day
frozen
storage
5-month
frozen
storage
Mean (across
storage)
Starch (%)
49% harvest M.C. 64.5 ± 0.3a 64.3 ± 0.6 63.6 ± 0.5 64.1 ± 0.5c
b
35% harvest M.C. 64.7 ± 0.4 64.3 ± 0.9 65.0 ± 0.3 64.6 ± 0.6b
21% harvest M.C. 65.6 ± 0.4 65.4 ± 0.3 65.0 ± 0.5 65.3 ± 0.4a
Mean (across harvest M.C.) 64.9 ± 0.6ac
64.6 ± 0.8a 64.5 ± 0.7a
S.W. Solids (%)
49% harvest M.C. 5.8 ± 0.1 6.0 ± 0.1 5.9 ± 0.1 5.9 ± 0.1a
35% harvest M.C. 4.5 ± 0.1 4.7 ± 0.1 4.7 ± 0.0 4.6 ± 0.1b
21% harvest M.C. 3.6 ± 0.2 3.7 ± 0.1 3.7 ± 0.1 3.7 ± 0.2c
Mean (across harvest M.C.) 4.6 ± 0.9a
4.7 ± 1.0a 4.8 ± 1.0a
Germ (%)
49% harvest M.C. 5.5 ± 0.1 5.3± 0.1 5.3 ± 0.1 5.3 ± 0.1b
35% harvest M.C. 7.3± 0.1 7.1 ± 0.1 7.0 ± 0.1 7.2 ± 0.2a
21% harvest M.C. 7.3 ± 0.2 7.1 ± 0.3 7.3 ± 0.2 7.2 ± 0.2a
Mean (across harvest M.C.) 6.7 ± 0.9a 6.5 ± 0.9b 6.6 ± 0.9b
Cellular fiber (%)
49% harvest M.C. 7.1 ± 0.2 7.8 ± 0.4 7.5 ± 0.2 7.5 ± 0.4a
35% harvest M.C. 7.3 ± 0.2 7.8 ± 0.3 7.5 ± 0.3 7.5 ± 0.3a
21% harvest M.C. 7.8 ± 0.3 7.9 ± 0.7 7.7 ± 0.4 7.8 ± 0.4a
Mean (across harvest M.C.) 7.4 ± 0.3b 7.8 ± 0.4a 7.6 ± 0.2ab
Coarse fiber (%)
49% harvest M.C. 6.4 ± 0.2 5.6 ± 0.3 5.7 ± 0.2 5.8 ± 0.5a
35% harvest M.C. 5.3 ± 0.2 5.0 ± 0.5 4.8 ± 0.6 5.0 ± 0.3b
21% harvest M.C. 4.8 ± 0.3 4.8 ± 0.4 4.9 ± 0.4 4.8 ± 0.2b
Mean (across harvest M.C.) 5.4 ± 0.8a 5.0 ± 0.4b 5.1 ± 0.5b
Total fiber (%)
49% harvest M.C. 13.5 ± 0.2 13.4 ± 0.2 13.2 ± 0.4 13.3 ± 0.5a
35% harvest M.C. 12.5 ± 0.4 12.8 ± 0.4 12.3 ± 0.4 12.6 ± 0.4b
21% harvest M.C. 12.5 ± 0.4 12.7 ± 0.6 12.6 ± 0.3 12.6 ± 0.4b
Mean (across harvest M.C.) 12.9 ± 0.6a 12.9 ± 0.6a 12.7 ± 0.5a
Gluten (%)
49% harvest M.C. 11.2 ± 0.5 11.6 ± 0.3 10.9 ± 0.7 11.3 ± 0.5a
35% harvest M.C. 10.4 ± 0.5 10.5 ± 0.3 10.2 ± 0.4 10.4 ± 0.3b
21% harvest M.C. 10.9 ± 0.5 10.8 ± 0.5 10.4 ± 0.4 10.7 ± 0.5b
Mean (across harvest M.C.) 10.8 ± 0.5a 11.0 ± 0.6ab 10.5 ± 0.6b
a. Values in the table are mean ± SE from three replicates.
b. Values followed by the same letter in the same column are not significantly different
(p > 0.05).
c. Values followed by the same letter in the same row are not significantly different (p > 0.05).
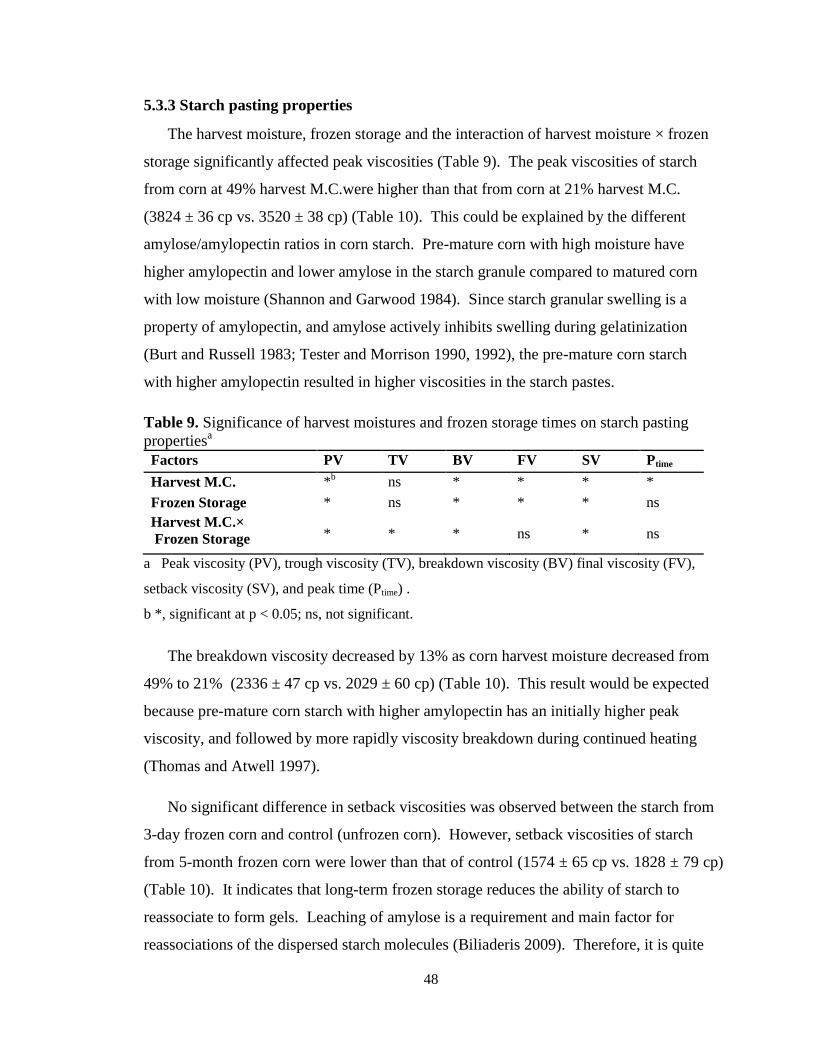
48
5.3.3 Starch pasting properties
The harvest moisture, frozen storage and the interaction of harvest moisture × frozen
storage significantly affected peak viscosities (Table 9). The peak viscosities of starch
from corn at 49% harvest M.C.were higher than that from corn at 21% harvest M.C.
(3824 ± 36 cp vs. 3520 ± 38 cp) (Table 10). This could be explained by the different
amylose/amylopectin ratios in corn starch. Pre-mature corn with high moisture have
higher amylopectin and lower amylose in the starch granule compared to matured corn
with low moisture (Shannon and Garwood 1984). Since starch granular swelling is a
property of amylopectin, and amylose actively inhibits swelling during gelatinization
(Burt and Russell 1983; Tester and Morrison 1990, 1992), the pre-mature corn starch
with higher amylopectin resulted in higher viscosities in the starch pastes.
Table 9. Significance of harvest moistures and frozen storage times on starch pasting
propertiesa
Factors PV TV BV FV SV Ptime
Harvest M.C. *b ns * * * *
Frozen Storage * ns * * * ns
Harvest M.C.×
Frozen Storage * * * ns * ns
a Peak viscosity (PV), trough viscosity (TV), breakdown viscosity (BV) final viscosity (FV),
setback viscosity (SV), and peak time (Ptime) .
b *, significant at p < 0.05; ns, not significant.
The breakdown viscosity decreased by 13% as corn harvest moisture decreased from
49% to 21% (2336 ± 47 cp vs. 2029 ± 60 cp) (Table 10). This result would be expected
because pre-mature corn starch with higher amylopectin has an initially higher peak
viscosity, and followed by more rapidly viscosity breakdown during continued heating
(Thomas and Atwell 1997).
No significant difference in setback viscosities was observed between the starch from
3-day frozen corn and control (unfrozen corn). However, setback viscosities of starch
from 5-month frozen corn were lower than that of control (1574 ± 65 cp vs. 1828 ± 79 cp)
(Table 10). It indicates that long-term frozen storage reduces the ability of starch to
reassociate to form gels. Leaching of amylose is a requirement and main factor for
reassociations of the dispersed starch molecules (Biliaderis 2009). Therefore, it is quite
49
possible that long-term frozen storage of corn inhibits the amylose leaching from starch
granule during gelatinization and breaking down process. Jeong and Lim (2003) found
that the freeze-thawed starch powders had higher setback viscosities. Jeong and Lim
(2003) froze corn starch after wet-milling, while in this study, the corn kernel was frozen
before wet-milling and therefore, their results cannot directly be compared with this study.
Setback viscosities were also affected by interaction of harvest moisture × frozen storage
(Table 9), indicating that frozen storage affects setback viscosities differently, depending
on corn harvest moisture. For corn at 21% harvest M.C., the setback viscosity for 5-
month frozen storage was 8% lower than that for the control, while the setback viscosities
for 5-month frozen storage were 19% and 22% lower for corn at 35% and 49% harvest
M.C., respectively. Long term (5-month) frozen storage also decreased the final viscosity
of the resulting starch by 8%, compared to control (3063 ± 27 cp vs. 3317 ± 101 cp)
(Table 10).
There was no effect of frozen storage on peak time during corn starch heating, while
harvest moisture affected the peak time (Table 9). The peak time increased as corn
harvest moisture decreased (Table 10). As the corn kernel matures and drying, the starch
granules become more compact (Jennings et al., 2002b), thereby requiring more heat and
time to gelatinize, and delaying the peak viscosity occurring time. The effects of harvest
moisture and frozen storage were not significant for trough viscosity (Table 9),
suggesting that it was the pasting property that was least affected.
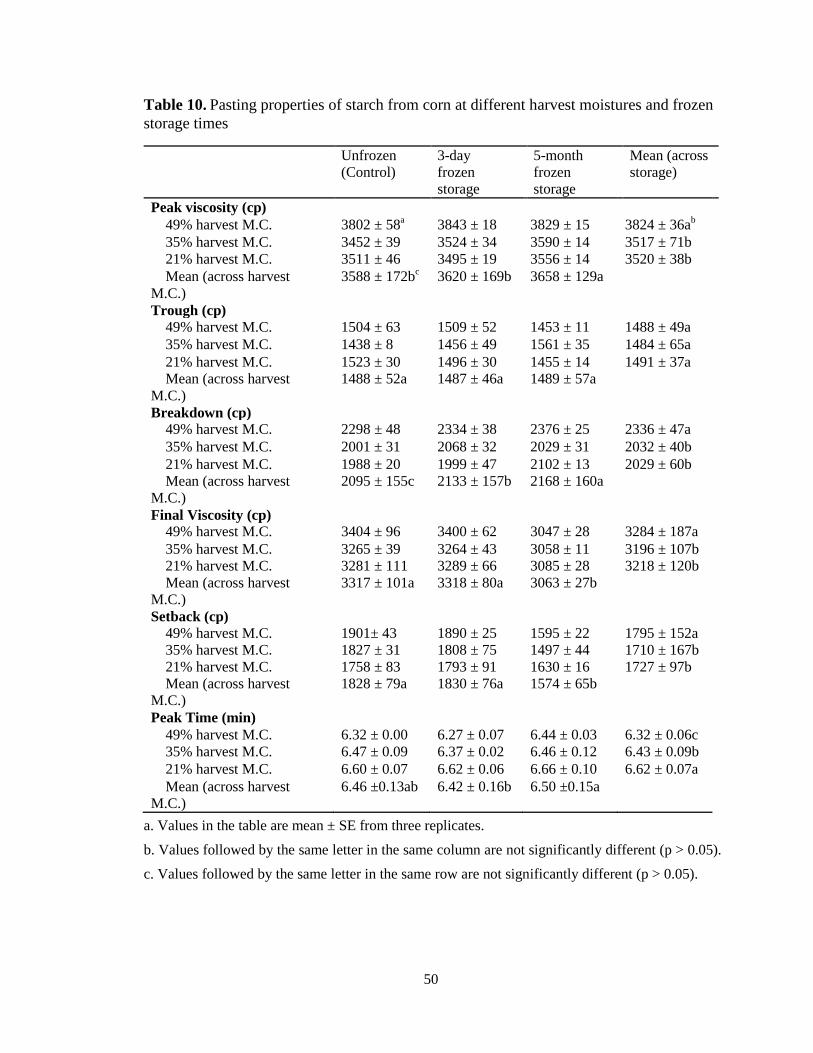
50
Table 10. Pasting properties of starch from corn at different harvest moistures and frozen
storage times
Unfrozen
(Control)
3-day
frozen
storage
5-month
frozen
storage
Mean (across
storage)
Peak viscosity (cp)
49% harvest M.C. 3802 ± 58a 3843 ± 18 3829 ± 15 3824 ± 36a
b
35% harvest M.C. 3452 ± 39 3524 ± 34 3590 ± 14 3517 ± 71b
21% harvest M.C. 3511 ± 46 3495 ± 19 3556 ± 14 3520 ± 38b
Mean (across harvest
M.C.)
3588 ± 172bc 3620 ± 169b 3658 ± 129a
Trough (cp)
49% harvest M.C. 1504 ± 63 1509 ± 52 1453 ± 11 1488 ± 49a
35% harvest M.C. 1438 ± 8 1456 ± 49 1561 ± 35 1484 ± 65a
21% harvest M.C. 1523 ± 30 1496 ± 30 1455 ± 14 1491 ± 37a
Mean (across harvest
M.C.)
1488 ± 52a 1487 ± 46a 1489 ± 57a
Breakdown (cp)
49% harvest M.C. 2298 ± 48 2334 ± 38 2376 ± 25 2336 ± 47a
35% harvest M.C. 2001 ± 31 2068 ± 32 2029 ± 31 2032 ± 40b
21% harvest M.C. 1988 ± 20 1999 ± 47 2102 ± 13 2029 ± 60b
Mean (across harvest
M.C.)
2095 ± 155c 2133 ± 157b 2168 ± 160a
Final Viscosity (cp)
49% harvest M.C. 3404 ± 96 3400 ± 62 3047 ± 28 3284 ± 187a
35% harvest M.C. 3265 ± 39 3264 ± 43 3058 ± 11 3196 ± 107b
21% harvest M.C. 3281 ± 111 3289 ± 66 3085 ± 28 3218 ± 120b
Mean (across harvest
M.C.)
3317 ± 101a 3318 ± 80a 3063 ± 27b
Setback (cp)
49% harvest M.C. 1901± 43 1890 ± 25 1595 ± 22 1795 ± 152a
35% harvest M.C. 1827 ± 31 1808 ± 75 1497 ± 44 1710 ± 167b
21% harvest M.C. 1758 ± 83 1793 ± 91 1630 ± 16 1727 ± 97b
Mean (across harvest
M.C.)
1828 ± 79a 1830 ± 76a 1574 ± 65b
Peak Time (min)
49% harvest M.C. 6.32 ± 0.00 6.27 ± 0.07 6.44 ± 0.03 6.32 ± 0.06c
35% harvest M.C. 6.47 ± 0.09 6.37 ± 0.02 6.46 ± 0.12 6.43 ± 0.09b
21% harvest M.C. 6.60 ± 0.07 6.62 ± 0.06 6.66 ± 0.10 6.62 ± 0.07a
Mean (across harvest
M.C.)
6.46 ±0.13ab 6.42 ± 0.16b 6.50 ±0.15a
a. Values in the table are mean ± SE from three replicates.
b. Values followed by the same letter in the same column are not significantly different (p > 0.05).
c. Values followed by the same letter in the same row are not significantly different (p > 0.05).
51
5.4 Conclusions
As corn harvest moisture decreased from 49 to 21%, the yields of starch and germ
increased by 1.2 and 1.9 percentage points respectively, while the yields of steep water
solids, total fiber and gluten decreased at different levels. The frozen corn had lower
coarse fiber yield but higher cellular fiber yields compared with control (unfrozen corn).
For pasting properties of starch, the peak viscosity and breakdown viscosity decreased,
while peak time increased as corn harvest moisture decreased. The setback and final
viscosities of starch from long term frozen corn were lower than that from control
(unfrozen corn).
52
Chapter 6. Effect of harvest moisture on composition and
nutritive value of corn stover and DDGS
6.1 Introduction
The increasing use of corn for ethanol would intensify the competition for feedstock
between ethanol plants and livestock feed industry. Because ruminants consume 35.6%
of the 135 million tonnes of corn fed to livestock in the United States each year (Sewell
et al., 2009), efficient utilization of the non-grain portion of the corn plant as ruminant
food will allow the optimization of both food and fuel production. Sewell et al. (2009)
found that when the thermochemically treated corn stover was with DDGS, the feed
value enhanced stover (FVES) could be as nutritious as corn in ruminant diets.
Traditionally corn and corn stover were harvested after the corn is dry in field. However,
if the corn and corn stover were harvested earlier before dry down, the corn stover would
have less acid detergent fiber (ADF) and lignin and higher in vitro dry matter digestibility
(IVDMD) (Russell, 1986).
Previous studies have been reported the relationships between plant maturity and its
nutritive values as animal food (Leask and Daynard, 1973; Russell, 1986; Irlbeck et al.,
1993; Johnson et al., 1999; Lewis et al., 2004). This study linked the corn residues from
the field with DDGS from the corn-ethanol production, and systematically evaluated the
yield and nutritive values of the products. The objectives of this study were to determine
the yields, compositions and nutritive values of corn stover, DDGS and FVES at different
corn harvest moisture contents and to determine the harvest time to maximize the corn
plant utilization.
6.2 Materials and methods
6.2.1 Experimental materials
The corn hybrid 32D78 (Pioneer Hi-Bred International, Johnson, IA) was planted on
22 May 2009. The corn and corn stover were harvested on 21 August, 09 September, 30
September, 13 October, 25 October, 09 November, and 23 November, which
corresponded to 1049, 1217, 1402, 1432, 1467, 1514, and 1534 AGDDs after planting,
53
respectively. DDGS samples were collected from conventional dry grind process, which
is described in section 4.2.
6.2.2 Compositional and nutritive analyses
Corn and corn stover samples were sent to a commercial laboratory (Rock River
Laboratory Inc., Watertown, WI) for compositional analysis including acid detergent
fiber (Method 973.18, AOAC, 2003), lignin (Method 973.18C, AOAC, 2003), crude
protein (Method 990.03, AOAC, 2003), minerals (Method 985.01, AOAC, 2003) and
neutral detergent fiber (National Forage Testing Association, 2002). Starch content was
determined according to Yellow Spring Instrument glucose analyzer procedure (YSI
2000) and using an enzymatic external hydrolysis. The feed value enhanced stover
(FVES) is a mixture of corn stover and DDGS, which could be as nutritious as corn in
ruminant diets (Sewell et al., 2009). The dry matter yield of FVES was the sum of the
dry matter yield of corn stover and DDGS. Chemical compositions of FVES were
calculated based on the proportional composition in the stover and leaf, cob and DDGS
samples. The energy and nutritive values were determined using the following equations
(Undersander et al., 1993)
( ) (5)
( ) – (6)
(7)
( ) ( ) ( ) ( ) (8)
( ) ( ) ( ) ( ) (9)
where TDN is the total digestible nutrients, NEL is the net energy of lactation, ME is the
metabolizable energy, NEM is the net energy of maintenance, NEG is the net energy of
gain. Dry matter yield of TDN per hectare (t/ha) was determined by the product of total
digestible nutrients (% DM) and dry matter yield of biomass in each hectare using the
following equation
( ⁄ ) ( ) (10)
54
Ducan’s multiple range test (SPSS 17.0, Somers, NY) were used to determine significant
differences, if any, in chemical and nutritive values. The level selected to show statistical
significance was 5% (p < 0.05).
6.3 Results and discussion
6.3.1 Chemical composition of corn stover
NDF concentrations in both corn stover and cob increased with corn harvest moisture
decreasing (Table 11). The increase in NDF concentrations in corn stover was also
reported by Weaver et al. (1978), who found that NDF concentrations in all plant parts
increased with maturity except for corn which remained highly stable after maturity.
During the same time period, ADF concentrations in corn stover and cob increased by
12.7 percentage points and 9.6 percentage points, respectively. The lignin concentrations
in corn stover and cob increased by 1 percentage point and 2.2 percentage points when
corn moisture decreased from 73 to 21%. The increase in lignin during and after corn
maturity was also reported by Cone and Engels (1993) and Pordesimo et al. (2005). The
increases in NDF, ADF and lignin concentrations indicated a decreasing digestibility of
corn stover as animal food.
Crude protein (CP) concentrations in corn stover decreased from 7.4 to 3.3% as corn
moisture decreased from 73 to 21%, and CP concentration in cob decreased from 3.7 to
1.6% (Table 11). The decrease in CP concentration was in consistent with previous
studies (Lewis, et al., 2004, Darby and Lauer, 2002) and it appeared to result from
continued carbon assimilation during corn maturing, even though nitrogen uptake
probably was completed, thereby diluting plant nitrogen concentration (Wiersma et al.,
1993). Average stover CP concentration in our study was lower than those reported by
Lewis et al. (2004) and Darby and Lauer (2002), which could be attributed to different
corn varieties and different amounts of nitrogen in the field. The composition of DDGS
was shown in Figure 11, section 4.3.3.
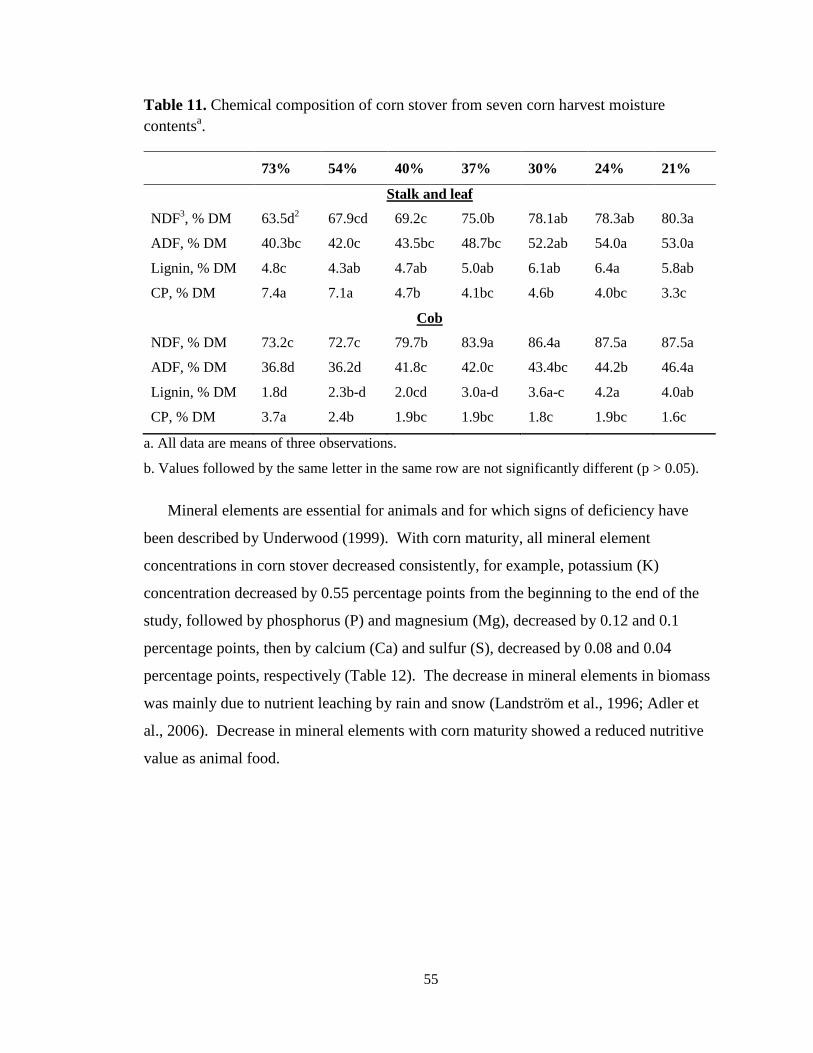
55
Table 11. Chemical composition of corn stover from seven corn harvest moisture
contentsa.
73% 54% 40% 37% 30% 24% 21%
Stalk and leaf
NDF3, % DM 63.5d
2 67.9cd 69.2c 75.0b 78.1ab 78.3ab 80.3a
ADF, % DM 40.3bc 42.0c 43.5bc 48.7bc 52.2ab 54.0a 53.0a
Lignin, % DM 4.8c 4.3ab 4.7ab 5.0ab 6.1ab 6.4a 5.8ab
CP, % DM 7.4a 7.1a 4.7b 4.1bc 4.6b 4.0bc 3.3c
Cob
NDF, % DM 73.2c 72.7c 79.7b 83.9a 86.4a 87.5a 87.5a
ADF, % DM 36.8d 36.2d 41.8c 42.0c 43.4bc 44.2b 46.4a
Lignin, % DM 1.8d 2.3b-d 2.0cd 3.0a-d 3.6a-c 4.2a 4.0ab
CP, % DM 3.7a 2.4b 1.9bc 1.9bc 1.8c 1.9bc 1.6c
a. All data are means of three observations.
b. Values followed by the same letter in the same row are not significantly different (p > 0.05).
Mineral elements are essential for animals and for which signs of deficiency have
been described by Underwood (1999). With corn maturity, all mineral element
concentrations in corn stover decreased consistently, for example, potassium (K)
concentration decreased by 0.55 percentage points from the beginning to the end of the
study, followed by phosphorus (P) and magnesium (Mg), decreased by 0.12 and 0.1
percentage points, then by calcium (Ca) and sulfur (S), decreased by 0.08 and 0.04
percentage points, respectively (Table 12). The decrease in mineral elements in biomass
was mainly due to nutrient leaching by rain and snow (Landström et al., 1996; Adler et
al., 2006). Decrease in mineral elements with corn maturity showed a reduced nutritive
value as animal food.
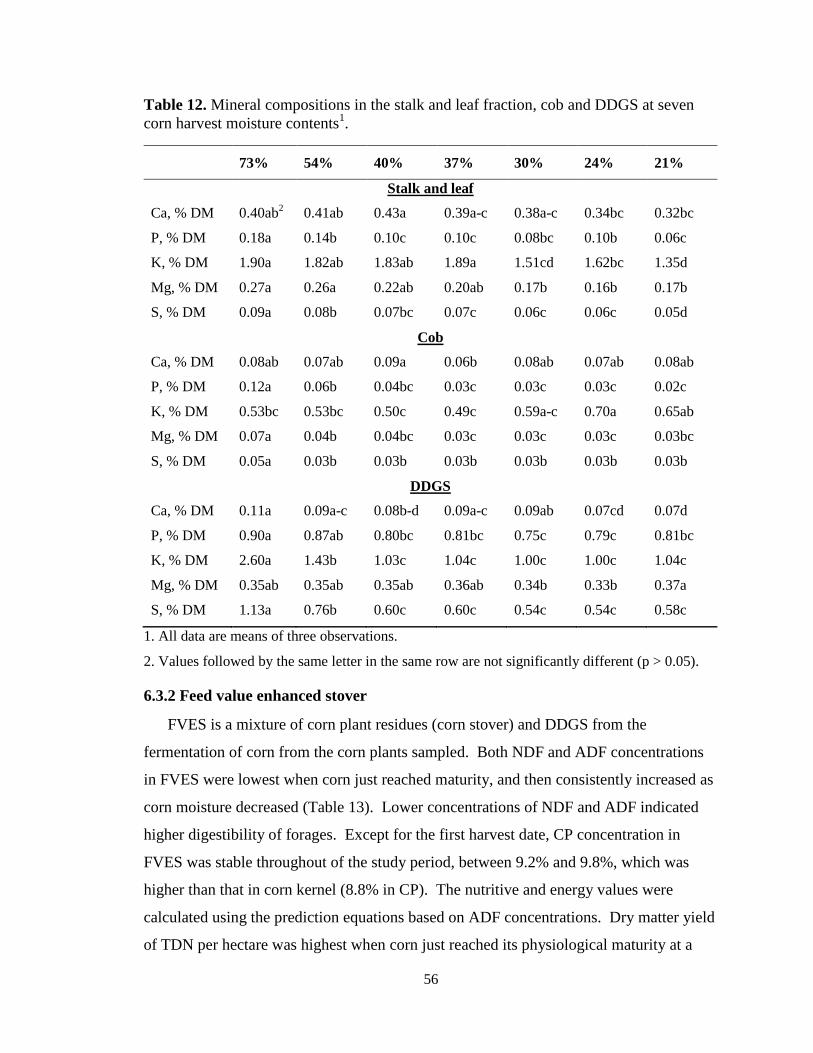
56
Table 12. Mineral compositions in the stalk and leaf fraction, cob and DDGS at seven
corn harvest moisture contents1.
73% 54% 40% 37% 30% 24% 21%
Stalk and leaf
Ca, % DM 0.40ab2 0.41ab 0.43a 0.39a-c 0.38a-c 0.34bc 0.32bc
P, % DM 0.18a 0.14b 0.10c 0.10c 0.08bc 0.10b 0.06c
K, % DM 1.90a 1.82ab 1.83ab 1.89a 1.51cd 1.62bc 1.35d
Mg, % DM 0.27a 0.26a 0.22ab 0.20ab 0.17b 0.16b 0.17b
S, % DM 0.09a 0.08b 0.07bc 0.07c 0.06c 0.06c 0.05d
Cob
Ca, % DM 0.08ab 0.07ab 0.09a 0.06b 0.08ab 0.07ab 0.08ab
P, % DM 0.12a 0.06b 0.04bc 0.03c 0.03c 0.03c 0.02c
K, % DM 0.53bc 0.53bc 0.50c 0.49c 0.59a-c 0.70a 0.65ab
Mg, % DM 0.07a 0.04b 0.04bc 0.03c 0.03c 0.03c 0.03bc
S, % DM 0.05a 0.03b 0.03b 0.03b 0.03b 0.03b 0.03b
DDGS
Ca, % DM 0.11a 0.09a-c 0.08b-d 0.09a-c 0.09ab 0.07cd 0.07d
P, % DM 0.90a 0.87ab 0.80bc 0.81bc 0.75c 0.79c 0.81bc
K, % DM 2.60a 1.43b 1.03c 1.04c 1.00c 1.00c 1.04c
Mg, % DM 0.35ab 0.35ab 0.35ab 0.36ab 0.34b 0.33b 0.37a
S, % DM 1.13a 0.76b 0.60c 0.60c 0.54c 0.54c 0.58c
1. All data are means of three observations.
2. Values followed by the same letter in the same row are not significantly different (p > 0.05).
6.3.2 Feed value enhanced stover
FVES is a mixture of corn plant residues (corn stover) and DDGS from the
fermentation of corn from the corn plants sampled. Both NDF and ADF concentrations
in FVES were lowest when corn just reached maturity, and then consistently increased as
corn moisture decreased (Table 13). Lower concentrations of NDF and ADF indicated
higher digestibility of forages. Except for the first harvest date, CP concentration in
FVES was stable throughout of the study period, between 9.2% and 9.8%, which was
higher than that in corn kernel (8.8% in CP). The nutritive and energy values were
calculated using the prediction equations based on ADF concentrations. Dry matter yield
of TDN per hectare was highest when corn just reached its physiological maturity at a
57
corn moisture content of 40%. It was attributed to the fact that both the highest TDN
concentration (% DM) and highest dry matter yield of FVES happened at corn
physiological maturity stage. TDN yield in FVES decreased by 2.6 t/ha when corn
moisture decreased from 40% (maturity stage) to 21%, which was due to the increase in
ADF concentration and decrease in dry matter yield with delay in harvest. Furthermore,
the highest NEL, NEM, NEG happened when corn and stover harvested when corn just
reached its maturity (Table 13). The results in Table 13 indicated that if the corn and
stover were harvested as soon as the corn reached maturity, the TDN value in FVES
(11.2 t/ha) was 72% of that in the whole plant harvested at the corn moisture of 21.2%
(w.b.) (15.6 t/ha). The corn portion of the corn plants could be used for the ethanol
production.
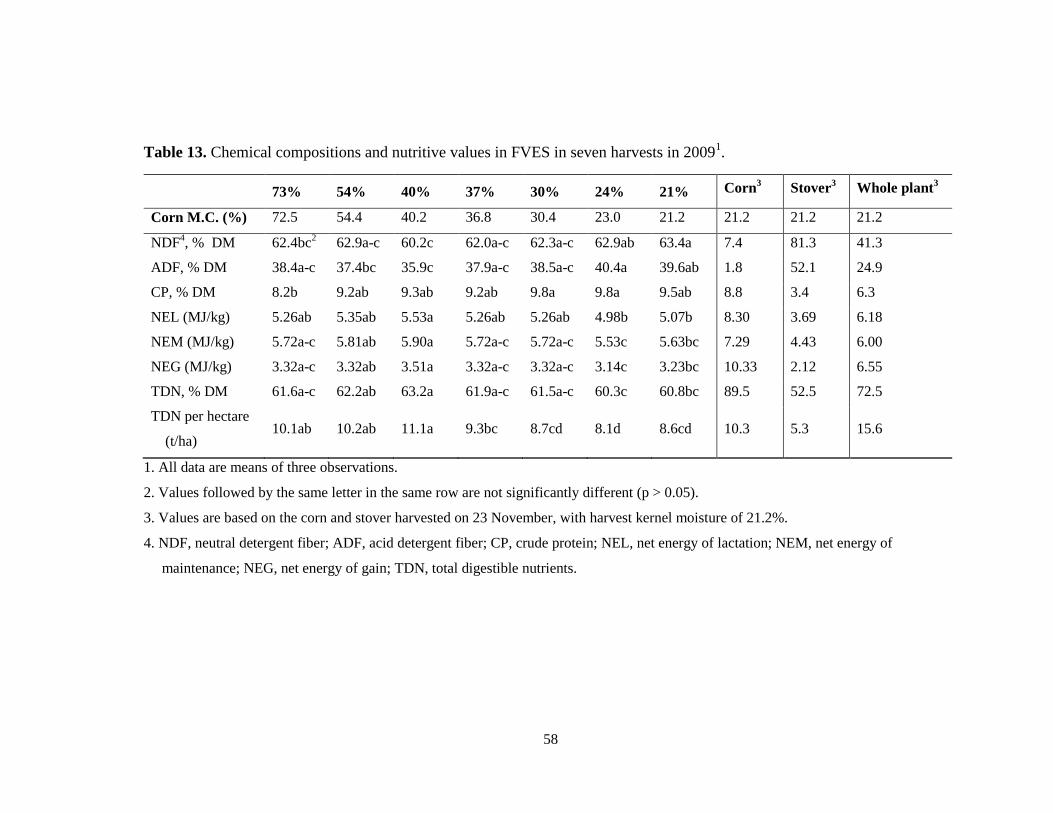
58
Table 13. Chemical compositions and nutritive values in FVES in seven harvests in 20091.
73% 54% 40% 37% 30% 24% 21% Corn
3 Stover
3 Whole plant
3
Corn M.C. (%) 72.5 54.4 40.2 36.8 30.4 23.0 21.2 21.2 21.2 21.2
NDF4, % DM 62.4bc
2 62.9a-c 60.2c 62.0a-c 62.3a-c 62.9ab 63.4a 7.4 81.3 41.3
ADF, % DM 38.4a-c 37.4bc 35.9c 37.9a-c 38.5a-c 40.4a 39.6ab 1.8 52.1 24.9
CP, % DM 8.2b 9.2ab 9.3ab 9.2ab 9.8a 9.8a 9.5ab 8.8 3.4 6.3
NEL (MJ/kg) 5.26ab 5.35ab 5.53a 5.26ab 5.26ab 4.98b 5.07b 8.30 3.69 6.18
NEM (MJ/kg) 5.72a-c 5.81ab 5.90a 5.72a-c 5.72a-c 5.53c 5.63bc 7.29 4.43 6.00
NEG (MJ/kg) 3.32a-c 3.32ab 3.51a 3.32a-c 3.32a-c 3.14c 3.23bc 10.33 2.12 6.55
TDN, % DM 61.6a-c 62.2ab 63.2a 61.9a-c 61.5a-c 60.3c 60.8bc 89.5 52.5 72.5
TDN per hectare
(t/ha) 10.1ab 10.2ab 11.1a 9.3bc 8.7cd 8.1d 8.6cd 10.3 5.3 15.6
1. All data are means of three observations.
2. Values followed by the same letter in the same row are not significantly different (p > 0.05).
3. Values are based on the corn and stover harvested on 23 November, with harvest kernel moisture of 21.2%.
4. NDF, neutral detergent fiber; ADF, acid detergent fiber; CP, crude protein; NEL, net energy of lactation; NEM, net energy of
maintenance; NEG, net energy of gain; TDN, total digestible nutrients.

59
6.4 Conclusions
Corn harvest moisture content affected chemical compositions and nutritive values
of corn stover, DDGS and feed value enhanced stover. Neutral detergent fiber, acid
detergent fiber and lignin concentrations in corn stover consistently increased with corn
harvest moisture content decreasing. Crude protein concentrations decreased in both corn
stover and DDGS with corn harvest moisture content decreasing. For feed value
enhanced stover, both the highest dry matter yield and the highest total digestible nutrient
concentration happened when the corn just reached physiological maturity. The study
showed that the whole corn plant could be most efficiently used if the corn and corn
stover were harvested as soon as corn reached physiological maturity.
60
Chapter 7. Determination of the respiration and effective
diffusion coefficient of carbon dioxide through bulk corn
7.1 Introduction
Postharvest losses due to spoilage during grain storage remain a major problem
around the world. Early detection of grain spoilage will reduce grain quantity and quality
losses, decrease mycotoxin production in food chain, and avoid financial loss by applying
timely management (Ileleji et al., 2006). Utilizing thermal cables in storage bin for
temperature monitoring has been a traditional method for detecting grain spoilage, since
microorganisms produce a large amount of heat in the spoilage location. However,
temperature monitoring is usually not sensitive enough due to its low thermal diffusivities
in bulk grain (Singh, 1983; Gonzales et al., 2009). Furthermore, measured temperature
cannot be easily interpreted due to the influence of the ambient air fluctuation. For
example, temperature of 25°C of bulk grain may mean there is a possible spoilage spot
during storage in the winter months, or it may mean the bulk grain is heated by the
ambient air in the summer. In addition to the temperature monitoring, studies reported
that increases in carbon dioxide (CO2) concentration in bulk grain is another indicator of
grain deterioration (Steele et al., 1969; Seitz et al., 1982; Fernandez et al., 1985; Pronyk
et al., 2004; Moog et al., 2010). The CO2 concentration measured in a stored bulk can be
compared to the CO2 concentration of the ambient air (around 400 ppm) as a standard to
interpret the readings (Singh et al., 1984). Muir et al. (1985) measured concentrations of
CO2 in interstitial air in 39 farm-stored bulks of wheat, rapeseed, barley and corn.
Spoilage was confirmed by analyses of grain samples in 97% of the 34 bins having CO2
concentrations greater than ambient air. More recently, studies reported that monitoring
CO2 concentration in the headspace of the storage bin with a CO2 sensor can lead to
earlier detections of grain spoilage compared to the temperature monitoring (Maier et al.,
2006; Ileleji et al., 2006). CO2 monitoring in bulk grain in silo bags is even more
important since it is an indicator of whether hermetic conditions are being maintained.
61
In order to further develop effective and commercially feasible techniques for
utilizing CO2 sensors for grain quality monitoring in storage bins and silo bags,
knowledge of movement of CO2 in bulk grain is necessary. Since diffusion is one of the
most important factors in gas movement in bulk grain, the effective diffusion coefficient
( ) of CO2 through bulk grain must be determined. Singh et al. (1984) determined the
effective diffusion coefficient of CO2 through wheat, rapeseed, oats and corn by a steady
state method and reported the dependence of the diffusion rate on temperature, moisture
content and porosity. The main advantage of the steady state method is that it can
provide the direct measurement of the effective diffusion coefficient. However, since
measurements are possible only after equilibrium is reached, steady state methods are
usually slow; several days are often being required for one measurement (Flegg, 1953).
Thereafter, Singh et al. (1985) developed a transient method to determine the effective
diffusion coefficient of CO2 through bulk wheat. Recently, Shunmugam et al. (2005)
determined the effective diffusion coefficient of CO2 through bulk wheat, barley and
canola by using a transient diffusion model.
All of the previous studies on measuring the effective diffusivity of CO2 through bulk
grain did not consider the CO2 produced by grain respiration. The CO2 flux through bulk
grain can be influenced by the CO2 production during the diffusion process, especially
when the grain respiration rate was high at elevated temperatures and high grain moisture
content. In these conditions, the CO2 production must be taken into consideration when
measuring the effective diffusivity through bulk grain. Furthermore, to date, the effective
diffusion coefficient of CO2 through bulk corn has been only reported by Singh et al.
(1984) at only one temperature (10°C) and one moisture content (14.0%). Moisture
content and temperature of the bulk corn varies during corn storage period, especially
when corn spoils. Hence, it is necessary to measure the CO2 diffusivity through bulk corn
at different temperatures and grain moisture content. Therefore, the objective of this
paper was to measure effective diffusion coefficient of CO2 through bulk corn at different
temperatures and grain moisture content, with considerations of CO2 production by corn
respiration during diffusion process.
62
7.2 Materials and methods
7.2.1 Sample preparation
Corn (P1395R, Pioneer Hi-Bred International, Johnston, IA) harvested at 22.2%
moisture content in October 2012 was used for the experiment. The wet corn was dried
at 49°C in a convection oven to 18.8 and 14.0% moisture content. The moisture content
of corn was determined according to the ASAE Standard S352.2 (1988) based on the
mass difference before and after oven drying. Prepared samples were transferred to a
plastic bag, sealed and placed in a -10°C freezer. Prior to each test, the samples were
warmed to the designated temperature in an incubator. Because porosity has a close
relationship with the gas diffusivity (Shunmugam et al., 2005), the porosity of the bulk
corn was determined using the following equation:
( ) (
) (11)
where bulk density of the corn was determined by the volume of the grain column and the
mass of corn placed into the grain column; unit density was determined according to the
methodology of volume complementation. The differences of the unit densities and
porosities among corn with three moisture content were within ± 2% (Table 14).
Table 14. Unit densities and porosities of corn with different moisture content.
Corn moisture content 14.0% 18.8% 22.2%
Unit density (kg/m3) 1235.5 ± 5.8 1224.0 ± 5.4 1229.9 ± 7.1
Porosity (%) 35.1 ± 0.3 34.5 ± 0.3 34.8 ± 0.4
7.2.2 Diffusion measurement
Diffusion apparatus
A diffusion apparatus (Figure 14) was designed and fabricated to measure the
effective CO2 diffusion coefficient through bulk corn based on the concept by Reible and
Shair (1982). The apparatus consisted of two cylindrical gas chambers connected by a
63
cylindrical grain column. Cumberland and Crawford (1987) reported that the diameter of
the chamber should be at least 10 times larger than the size of the granular media to
provide a representative volume. Since a corn kernel is approximately 0.5 cm in
volumetric equivalent diameter, a 10.2 cm diameter and 20 cm length grain column was
designed in order to minimize the kernel size and column edge effects. The two identical
cylindrical gas chambers measuring 19.1 cm diameter and 15 cm length were made of
acrylic tubes with 6.4 mm wall thickness. Bulk corn was placed within the grain column.
To hold the bulk corn in place, wire mesh was fixed on both ends of the grain tube. A
retractable seal (11 cm diameter) was made from soft rubber to block gas diffusion
between gas chamber A and grain chamber before the diffusion test. Two 0.5 cm
diameter holes were drilled in gas chamber A, one for gas injection and one for gas vent.
A 2 cm diameter hole was drilled in chamber A &B and in the grain column for installing
CO2 gas probes. A digital manometer (Extech HD755, Extech Instruments, Nashua, NH)
connected between the gas chamber A and gas chamber B was used to monitor any
pressure difference across both chambers during testing. A low speed motor fan (ebm-
papst Inc., Farmington, CT) was installed in gas chamber A & B to mix gas. The
temperature of the apparatus was controlled by putting a cooling/heating water jacket
(plastic tubing) around the gas chambers and the grain column using a circulating water
bath with chiller. The seals of the apparatus were tested by injecting a high CO2
concentration (10,000 ppm) gas and continuously measuring CO2 concentration for 12 h.
Seal tests showed that the leakage of CO2 from the apparatus was less than 0.2% CO2 per
hour. Since each diffusion test was 4 h, the gas leakage was less than 0.8% during the
whole test and was deemed acceptable.
The CO2 sensors (GMT220 CO2 transmitters and GMT 221 CO2 probes, Vaisala Inc.,
Helsinki, Finland) used consisted of three parts, a detection probe, a transmitter and a
cable (Figure 15). The sensor had an accuracy of ± 1.5 % of range + 2% of reading and it
has been used to measure the CO2 concentrations by other studies (Tang et al., 2003;
Sydney et al., 2010). The detection probe was a silicon based, non-dispersive infrared
(NDIR) sensor, with 1.85 cm diameter and 10.9 cm length. The measurement range of
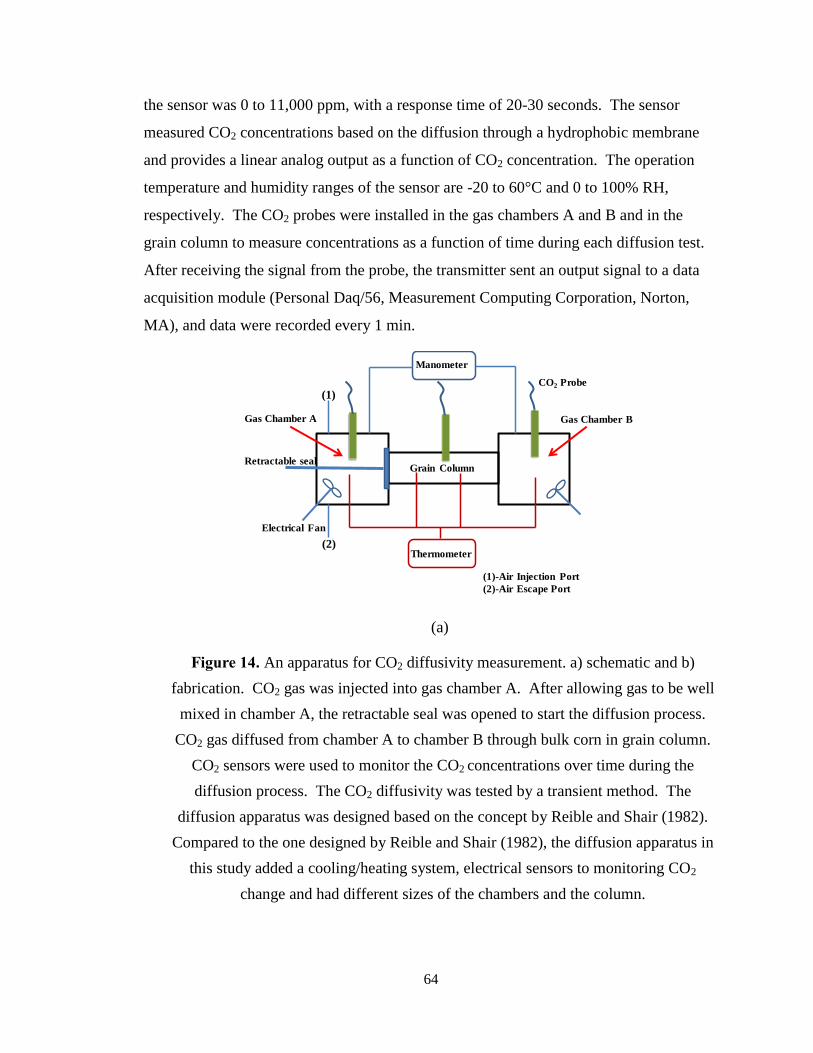
64
the sensor was 0 to 11,000 ppm, with a response time of 20-30 seconds. The sensor
measured CO2 concentrations based on the diffusion through a hydrophobic membrane
and provides a linear analog output as a function of CO2 concentration. The operation
temperature and humidity ranges of the sensor are -20 to 60°C and 0 to 100% RH,
respectively. The CO2 probes were installed in the gas chambers A and B and in the
grain column to measure concentrations as a function of time during each diffusion test.
After receiving the signal from the probe, the transmitter sent an output signal to a data
acquisition module (Personal Daq/56, Measurement Computing Corporation, Norton,
MA), and data were recorded every 1 min.
(a)
Figure 14. An apparatus for CO2 diffusivity measurement. a) schematic and b)
fabrication. CO2 gas was injected into gas chamber A. After allowing gas to be well
mixed in chamber A, the retractable seal was opened to start the diffusion process.
CO2 gas diffused from chamber A to chamber B through bulk corn in grain column.
CO2 sensors were used to monitor the CO2 concentrations over time during the
diffusion process. The CO2 diffusivity was tested by a transient method. The
diffusion apparatus was designed based on the concept by Reible and Shair (1982).
Compared to the one designed by Reible and Shair (1982), the diffusion apparatus in
this study added a cooling/heating system, electrical sensors to monitoring CO2
change and had different sizes of the chambers and the column.
Manometer
Thermometer
(1)
(2)
Electrical Fan
Retractable seal
CO2 Probe
Grain Column
(1)-Air Injection Port
(2)-Air Escape Port
Gas Chamber A Gas Chamber B
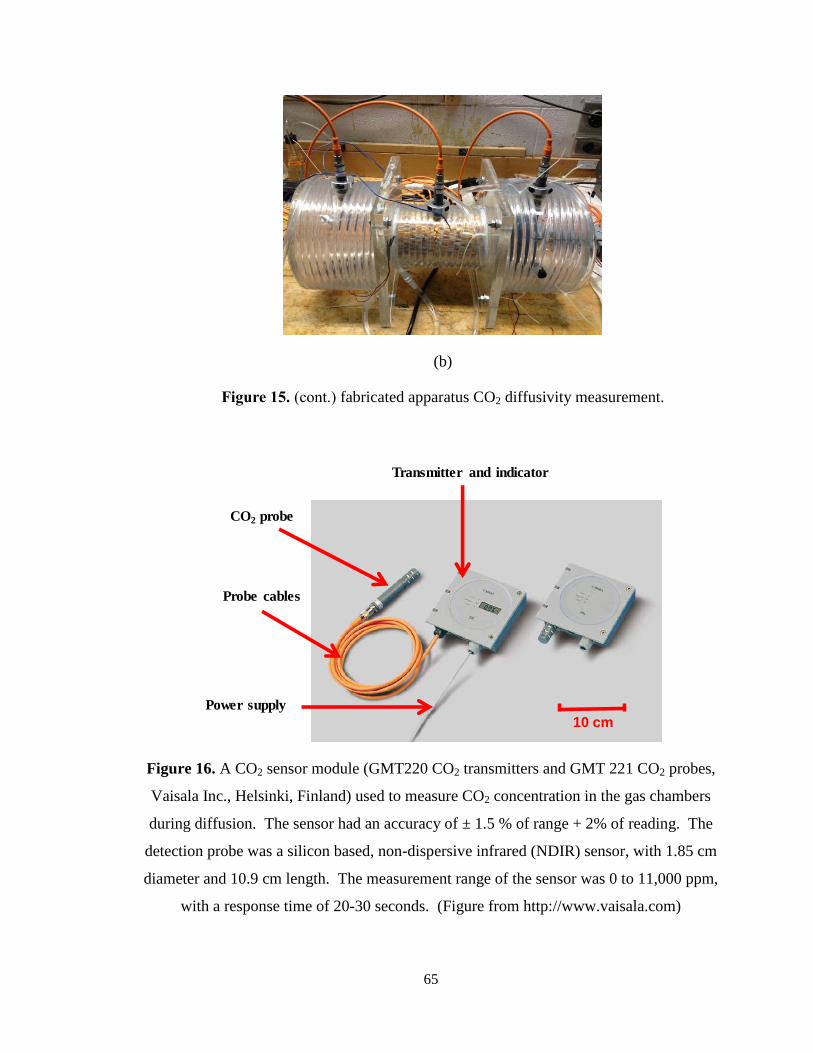
65
(b)
Figure 15. (cont.) fabricated apparatus CO2 diffusivity measurement.
Figure 16. A CO2 sensor module (GMT220 CO2 transmitters and GMT 221 CO2 probes,
Vaisala Inc., Helsinki, Finland) used to measure CO2 concentration in the gas chambers
during diffusion. The sensor had an accuracy of ± 1.5 % of range + 2% of reading. The
detection probe was a silicon based, non-dispersive infrared (NDIR) sensor, with 1.85 cm
diameter and 10.9 cm length. The measurement range of the sensor was 0 to 11,000 ppm,
with a response time of 20-30 seconds. (Figure from http://www.vaisala.com)
CO2 probe
Transmitter and indicator
Probe cables
Power supply
10 cm
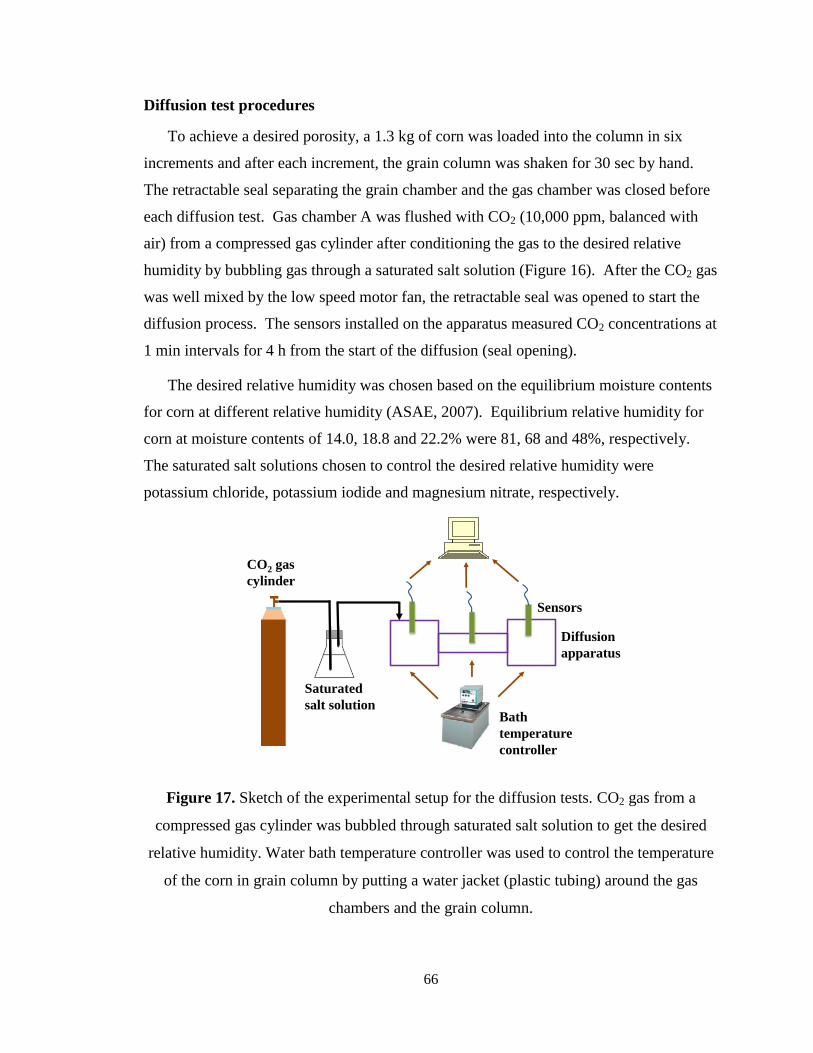
66
Diffusion test procedures
To achieve a desired porosity, a 1.3 kg of corn was loaded into the column in six
increments and after each increment, the grain column was shaken for 30 sec by hand.
The retractable seal separating the grain chamber and the gas chamber was closed before
each diffusion test. Gas chamber A was flushed with CO2 (10,000 ppm, balanced with
air) from a compressed gas cylinder after conditioning the gas to the desired relative
humidity by bubbling gas through a saturated salt solution (Figure 16). After the CO2 gas
was well mixed by the low speed motor fan, the retractable seal was opened to start the
diffusion process. The sensors installed on the apparatus measured CO2 concentrations at
1 min intervals for 4 h from the start of the diffusion (seal opening).
The desired relative humidity was chosen based on the equilibrium moisture contents
for corn at different relative humidity (ASAE, 2007). Equilibrium relative humidity for
corn at moisture contents of 14.0, 18.8 and 22.2% were 81, 68 and 48%, respectively.
The saturated salt solutions chosen to control the desired relative humidity were
potassium chloride, potassium iodide and magnesium nitrate, respectively.
Figure 17. Sketch of the experimental setup for the diffusion tests. CO2 gas from a
compressed gas cylinder was bubbled through saturated salt solution to get the desired
relative humidity. Water bath temperature controller was used to control the temperature
of the corn in grain column by putting a water jacket (plastic tubing) around the gas
chambers and the grain column.
CO2 gas
cylinder
Saturated
salt solutionBath
temperature
controller
Diffusion
apparatus
Sensors
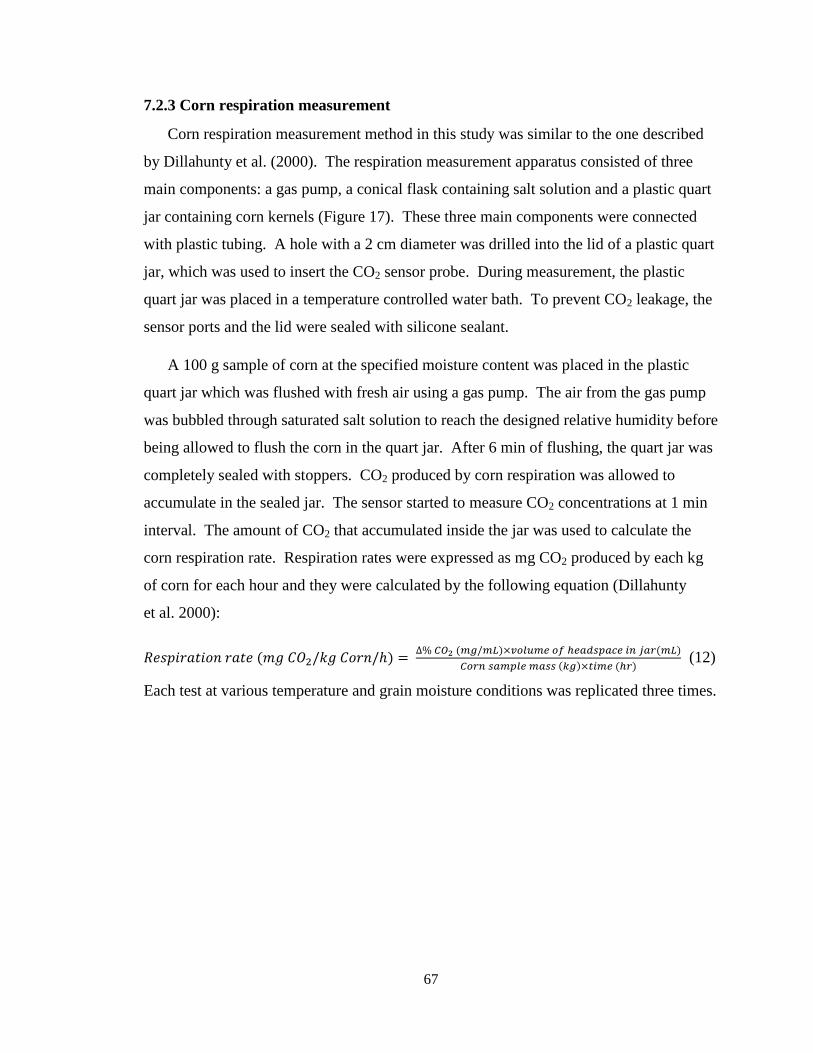
67
7.2.3 Corn respiration measurement
Corn respiration measurement method in this study was similar to the one described
by Dillahunty et al. (2000). The respiration measurement apparatus consisted of three
main components: a gas pump, a conical flask containing salt solution and a plastic quart
jar containing corn kernels (Figure 17). These three main components were connected
with plastic tubing. A hole with a 2 cm diameter was drilled into the lid of a plastic quart
jar, which was used to insert the CO2 sensor probe. During measurement, the plastic
quart jar was placed in a temperature controlled water bath. To prevent CO2 leakage, the
sensor ports and the lid were sealed with silicone sealant.
A 100 g sample of corn at the specified moisture content was placed in the plastic
quart jar which was flushed with fresh air using a gas pump. The air from the gas pump
was bubbled through saturated salt solution to reach the designed relative humidity before
being allowed to flush the corn in the quart jar. After 6 min of flushing, the quart jar was
completely sealed with stoppers. CO2 produced by corn respiration was allowed to
accumulate in the sealed jar. The sensor started to measure CO2 concentrations at 1 min
interval. The amount of CO2 that accumulated inside the jar was used to calculate the
corn respiration rate. Respiration rates were expressed as mg CO2 produced by each kg
of corn for each hour and they were calculated by the following equation (Dillahunty
et al. 2000):
( ) ( ) ( )
( ) ( ) (12)
Each test at various temperature and grain moisture conditions was replicated three times.
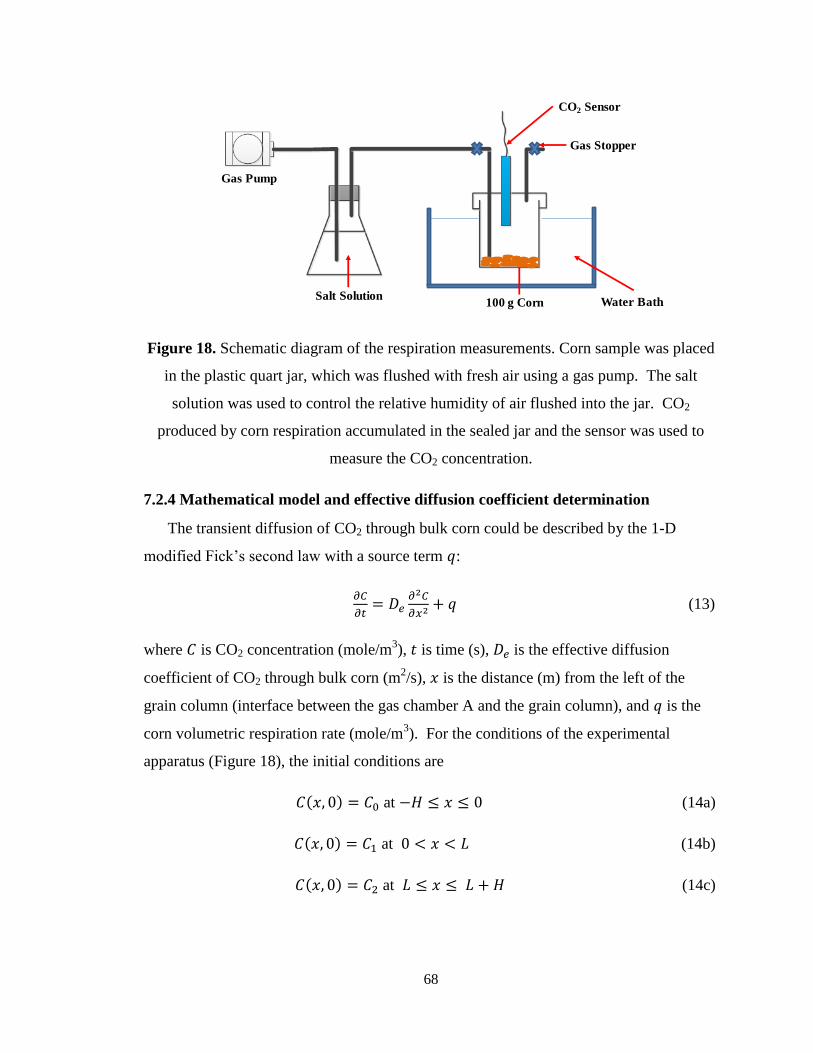
68
Figure 18. Schematic diagram of the respiration measurements. Corn sample was placed
in the plastic quart jar, which was flushed with fresh air using a gas pump. The salt
solution was used to control the relative humidity of air flushed into the jar. CO2
produced by corn respiration accumulated in the sealed jar and the sensor was used to
measure the CO2 concentration.
7.2.4 Mathematical model and effective diffusion coefficient determination
The transient diffusion of CO2 through bulk corn could be described by the 1-D
modified Fick’s second law with a source term :
(13)
where is CO2 concentration (mole/m3), is time (s), is the effective diffusion
coefficient of CO2 through bulk corn (m2/s), is the distance (m) from the left of the
grain column (interface between the gas chamber A and the grain column), and is the
corn volumetric respiration rate (mole/m3). For the conditions of the experimental
apparatus (Figure 18), the initial conditions are
( ) at (14a)
( ) at (14b)
( ) at (14c)
Gas Pump
Salt SolutionWater Bath100 g Corn
Gas Stopper
CO2 Sensor
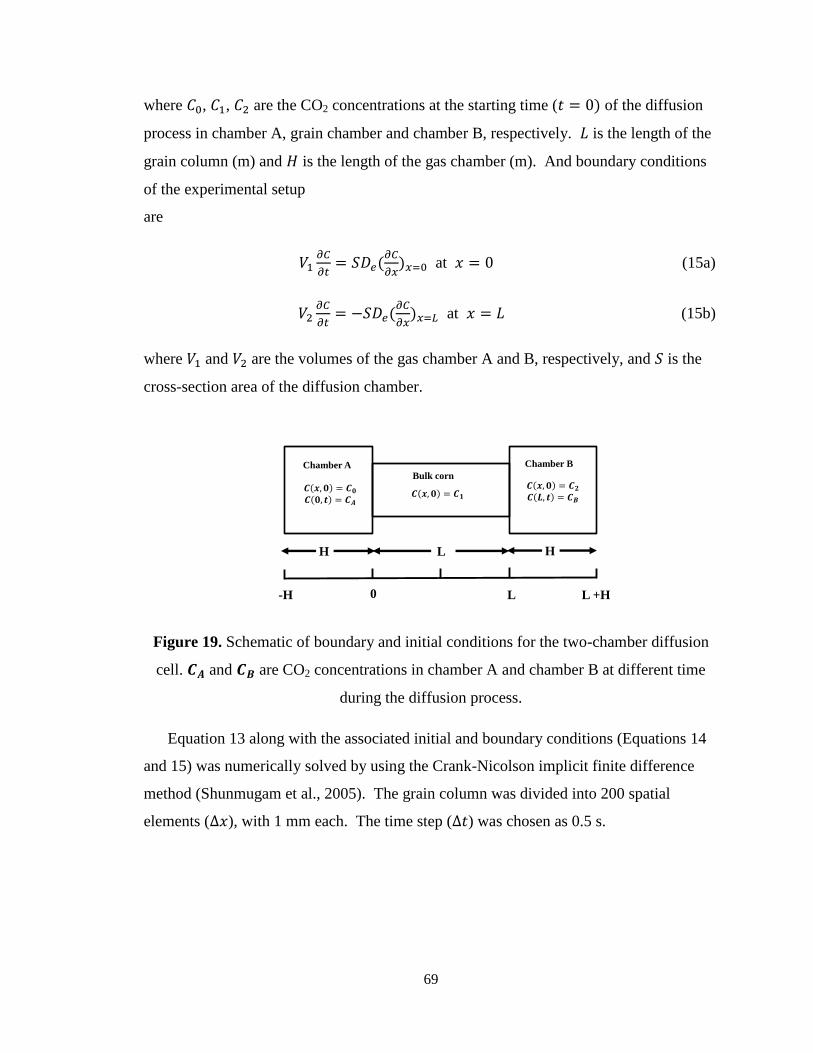
69
where , , are the CO2 concentrations at the starting time ( ) of the diffusion
process in chamber A, grain chamber and chamber B, respectively. is the length of the
grain column (m) and is the length of the gas chamber (m). And boundary conditions
of the experimental setup
are
(
) at (15a)
(
) at (15b)
where and are the volumes of the gas chamber A and B, respectively, and is the
cross-section area of the diffusion chamber.
Figure 19. Schematic of boundary and initial conditions for the two-chamber diffusion
cell. and are CO2 concentrations in chamber A and chamber B at different time
during the diffusion process.
Equation 13 along with the associated initial and boundary conditions (Equations 14
and 15) was numerically solved by using the Crank-Nicolson implicit finite difference
method (Shunmugam et al., 2005). The grain column was divided into 200 spatial
elements ( ), with 1 mm each. The time step ( ) was chosen as 0.5 s.
LH H
-H 0 L L +H
Chamber A Chamber B
Bulk corn
70
The discretization of the partial differential equation was shown as:
[
] (16)
where and are the spatial and time index, respectively.
Let
, and rearrange the equation:
( )
( )
(17)
The discretization of the boundary equation at was shown as:
[
] (18)
Let
, and rearrange the equation:
(19)
The discretization of the boundary equation at was shown as:
[
] (20)
Let
, and rearrange the equation:
(21)
The effective diffusion coefficient of CO2 through bulk corn was determined by
minimizing the average percent error between the predicted CO2 concentrations by
solving the PDE equation and the measured CO2 concentrations by installed CO2 sensors
in both gas chamber A and gas chamber B at time from 1 min to 240 min. The measured
CO2 concentration in grain chamber was not used in determining the diffusion coefficient,
since the CO2 concentration in grain chamber exceeded the sensor detection limit during
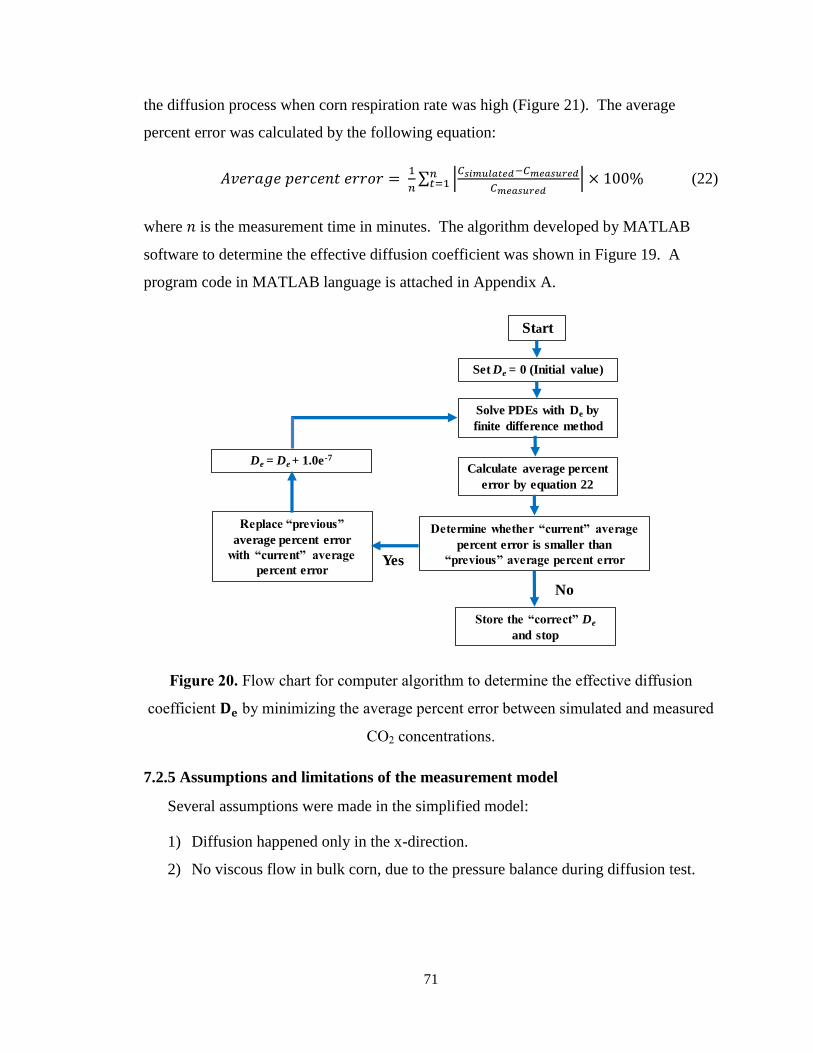
71
the diffusion process when corn respiration rate was high (Figure 21). The average
percent error was calculated by the following equation:
∑ |
|
(22)
where is the measurement time in minutes. The algorithm developed by MATLAB
software to determine the effective diffusion coefficient was shown in Figure 19. A
program code in MATLAB language is attached in Appendix A.
Figure 20. Flow chart for computer algorithm to determine the effective diffusion
coefficient 𝐃𝐞 by minimizing the average percent error between simulated and measured
CO2 concentrations.
7.2.5 Assumptions and limitations of the measurement model
Several assumptions were made in the simplified model:
1) Diffusion happened only in the x-direction.
2) No viscous flow in bulk corn, due to the pressure balance during diffusion test.
Start
Set De = 0 (Initial value)
Solve PDEs with De by
finite difference method
Calculate average percent
error by equation 22
Determine whether “current” average
percent error is smaller than
“previous” average percent error
Store the “correct” De
and stop
No
Replace “previous”
average percent error
with “current” average
percent error
De = De + 1.0e-7
Yes
72
3) Ideal mixing both in the gas chamber A and B was achieved, so that the
concentration in the chambers is uniform.
4) The CO2 adsorption by corn was negligible.
The first assumption was used and validated by other studies (Ball et al., 1981; Singh
et al., 1984; Jones et al., 2003; Shumugam et al., 2005). The second assumption was
validated experimentally by monitoring the pressure difference across the two gas
chambers using a digital manometer. The higher the pressure difference between the two
ends of the diffusion column, the greater chances for viscous flow in the column. The
pressure difference during the experiment was maintained at a negligible value (pressure
< 1Pa) during the diffusion process. The third assumption is critical and has been
discussed by Ball et al. (1981), Reible and Shair (1982), Singh et al. (1984) and Jones et
al. (2003). Since diffusion of CO2 in air is much larger than that in the porous media, this
assumption is usually valid. Reible and Shair (1982) applied a small hand-driven fan to
help keep the gas well mixed. In our experiment, a low speed fan was used to mix the
gas in both gas chambers. The fourth assumption is based on the work done by Singh et
al. (1984), who reported that the CO2 adsorbed by wheat and rapeseed during 45 h was
less than 5% of the amount of CO2 diffused during the same period. In our experiment, it
was assumed that the adsorption was negligible during a 4 h diffusion test.
7.2.6 Experimental design and statistical analysis
The variables studied were temperature (10, 20 and 30°C) and corn moisture content
(14.0, 18.8 and 22.2%). A full factorial completely randomized design (3 temperature ×
3 moisture content × 3 replicates) was used in this experiment. Tukey multiple range test
was used for data analysis (SAS 9.2, SAS Institute Inc., Cary, NC). The level selected to
show statistical significance was 5% (p < 0.05).
7.3 Results and discussion
7.3.1 Corn respiration rate
Differences were found in the respiration rates of corn at different moisture content
and temperatures (Figure 20). Respiration of corn increased as moisture content
73
increased, which is in general agreement with published results with various grains
(Bailey, 1940, Ragai and Loomis, 1953; Fernandez et al., 1982 and Dillahunty et al.,
2000). The respiration rates of corn with moisture content of 14.0% were low, between
0.16 and 0.54 mg CO2/kg corn/h and rose exponentially as moisture content increased.
For example, at 20°C, the respiration rate of corn increased approximately 100 times
from 0.31 mg CO2/kg corn/h at 14.0% moisture content to more than 30 mg CO2/kg
corn/h at 22.2% moisture content. Corn at 14.0% moisture content is considered safe for
bulk storage while corn containing 22.2% moisture is too wet for safe storage and
favorable for deterioration. According to Shelled Corn Storage Time Table made by
Bern et al. (2002), corn containing 22.2% moisture could be safely stored for only 10-13
days at 20°C. As would be expected, respiration of corn increased with temperature at
each moisture level (Figure 20). The rise in respiration nearly doubled with each 10°C
temperature increase. The respiration rates in this experiment were lower than those from
Bailey (1940), who reported that corn respiration rates were between 0.3 and 9.1 mg
CO2/kg corn/h when corn moisture content was between 11 and 17%. This could
possibly be due to the corn variety differences during a 70-year time span. The
difference could be also due to the sample treatments. Bailey used dried corn samples
and re-wetted them to the desired moisture, while we used freshly harvested corn in our
experiment. Previous studies reported that freshly harvested corn had lower respiration
rates than re-wetted corn (Ragai and Loomis, 1953; Fernandez et al., 1982).
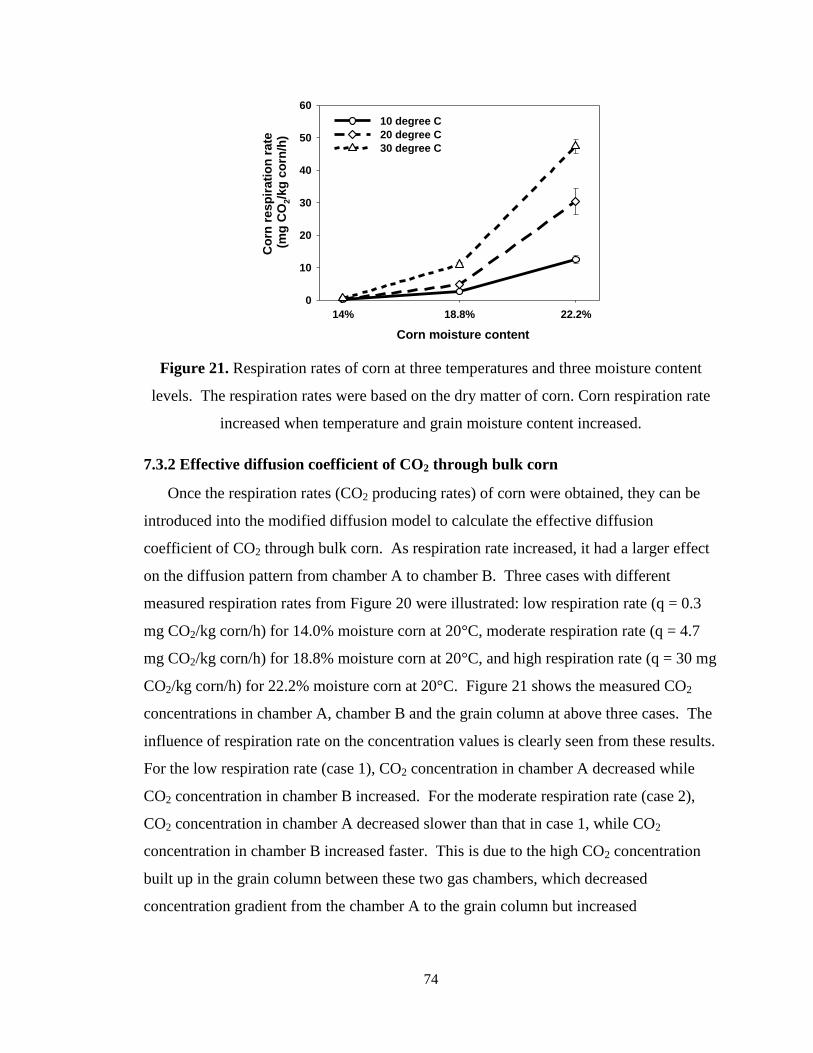
74
Figure 21. Respiration rates of corn at three temperatures and three moisture content
levels. The respiration rates were based on the dry matter of corn. Corn respiration rate
increased when temperature and grain moisture content increased.
7.3.2 Effective diffusion coefficient of CO2 through bulk corn
Once the respiration rates (CO2 producing rates) of corn were obtained, they can be
introduced into the modified diffusion model to calculate the effective diffusion
coefficient of CO2 through bulk corn. As respiration rate increased, it had a larger effect
on the diffusion pattern from chamber A to chamber B. Three cases with different
measured respiration rates from Figure 20 were illustrated: low respiration rate (q = 0.3
mg CO2/kg corn/h) for 14.0% moisture corn at 20°C, moderate respiration rate (q = 4.7
mg CO2/kg corn/h) for 18.8% moisture corn at 20°C, and high respiration rate (q = 30 mg
CO2/kg corn/h) for 22.2% moisture corn at 20°C. Figure 21 shows the measured CO2
concentrations in chamber A, chamber B and the grain column at above three cases. The
influence of respiration rate on the concentration values is clearly seen from these results.
For the low respiration rate (case 1), CO2 concentration in chamber A decreased while
CO2 concentration in chamber B increased. For the moderate respiration rate (case 2),
CO2 concentration in chamber A decreased slower than that in case 1, while CO2
concentration in chamber B increased faster. This is due to the high CO2 concentration
built up in the grain column between these two gas chambers, which decreased
concentration gradient from the chamber A to the grain column but increased
Corn moisture content
14% 18.8% 22.2%
Co
rn r
esp
irati
on
rate
(m
g C
O2/k
g c
orn
/h)
0
10
20
30
40
50
60
10 degree C
20 degree C
30 degree C
75
concentration gradient from the grain column to the chamber B. For the high respiration
rate (case 3), the influence of respiration becomes more significant. CO2 concentration in
chamber A decreased in the first 15 min and then turned to increase due to the high CO2
concentration built up in the grain column. CO2 concentration in chamber B increased
much faster than that in case 1 and case 2. Therefore, with only considering the
respiration effect in the model, one can get an accurate prediction of the CO2 diffusion in
bulk grain.
Dry matter loss of corn during 4 h diffusion test can be calculated based on the corn
respiration rate. In case 1, when corn moisture content and temperature were 14.0% and
20°C respectively, corn respiration rate was 0.3 mg CO2/kg corn/h. According to the
simple aerobic respiration equation
C6H12O6 + 6O2 6CO2 + 6H2O + 2816 kJ (23)
the dry mater loss was 0.8 mg/ kg corn during 4 h diffusion test, which was less than
1 × 10⁻⁴
% of the total corn placed in the grain column. When corn moisture content was
high at 22.2% and at 20°C temperature, corn respiration rate was 30 mg CO2/kg corn/h.
The dry matter loss was 82 mg/kg corn during 4 h diffusion test, which was less than
0.01% of the total corn placed in the grain column. Therefore, the dry matter loss during
the 4 h diffusion test was in a negligible level. In case 3, the CO2 concentration in grain
column was estimated between 1-2% (since it reached sensor’s detection limit), and the
O2 concentration decreased from 19-20% according to the aerobic respiration equation.
Whether corn aerobic respiration would be depressed at this high CO2 concentration and
low O2 concentration remains unknown and needs further experiment to answer it.
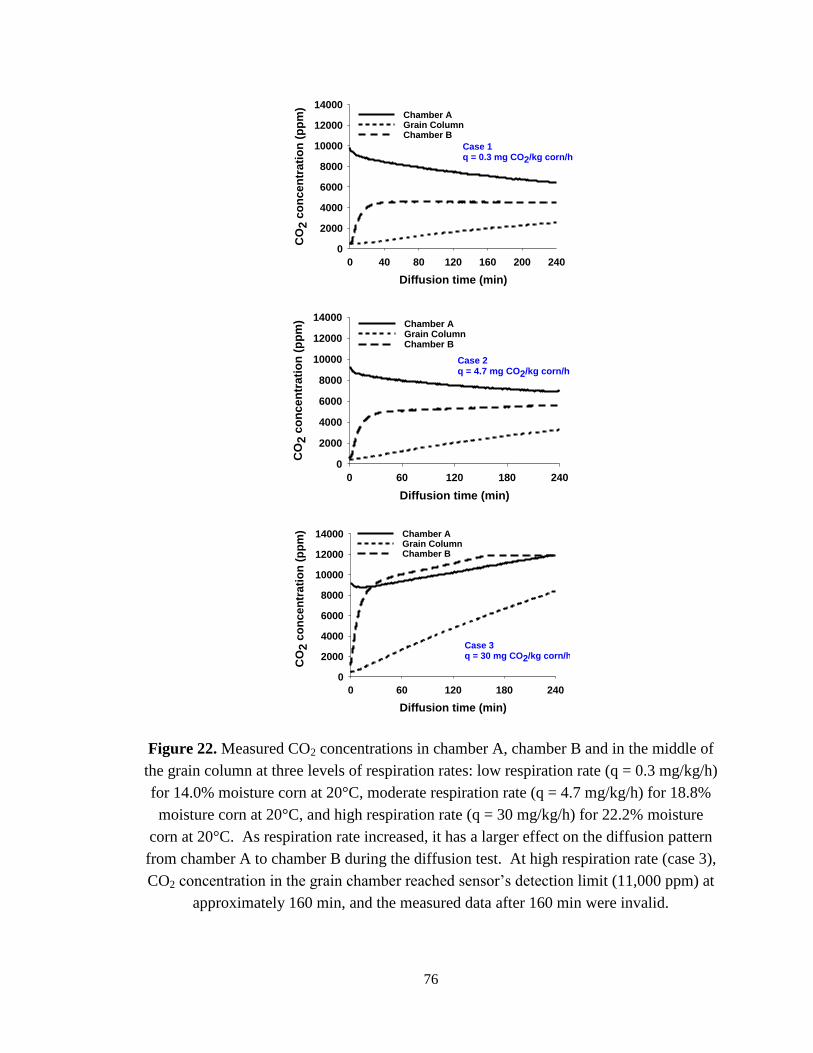
76
Figure 22. Measured CO2 concentrations in chamber A, chamber B and in the middle of
the grain column at three levels of respiration rates: low respiration rate (q = 0.3 mg/kg/h)
for 14.0% moisture corn at 20°C, moderate respiration rate (q = 4.7 mg/kg/h) for 18.8%
moisture corn at 20°C, and high respiration rate (q = 30 mg/kg/h) for 22.2% moisture
corn at 20°C. As respiration rate increased, it has a larger effect on the diffusion pattern
from chamber A to chamber B during the diffusion test. At high respiration rate (case 3),
CO2 concentration in the grain chamber reached sensor’s detection limit (11,000 ppm) at
approximately 160 min, and the measured data after 160 min were invalid.
Diffusion time (min)
0 40 80 120 160 200 240
CO
2 c
on
cen
trati
on
(p
pm
)
0
2000
4000
6000
8000
10000
12000
14000
Case 1q = 0.3 mg CO2/kg corn/h
Chamber AGrain ColumnChamber B
Diffusion time (min)
0 60 120 180 240
CO
2 c
on
cen
trati
on
(p
pm
)
0
2000
4000
6000
8000
10000
12000
14000
Case 2q = 4.7 mg CO2/kg corn/h
Chamber AGrain ColumnChamber B
Diffusion time (min)
0 60 120 180 240
CO
2 c
on
cen
trati
on
(p
pm
)
0
2000
4000
6000
8000
10000
12000
14000
Case 3q = 30 mg CO2/kg corn/h
Chamber AGrain ColumnChamber B
77
The effective diffusion coefficients of CO2 through bulk corn were in the range of
3.10 × 10⁻⁶
to 3.93 × 10⁻⁶
m2/s, depending on moisture and temperature conditions (Table
15). Singh et al. (1984) reported the effective diffusion coefficient of CO2 through bulk
corn was 3.02 × 10⁻⁶
m2/s at 14% corn moisture and 10°C temperature. In our study, the
diffusion coefficient of CO2 through bulk corn was 3.30 × 10⁻⁶
m2/s at 14.0% corn
moisture and 10°C temperature. These two diffusion coefficients were in good
agreement, considering the difference in porosity and probable differences in kernel size
and shape. Xu et al. (2002) suggested that effective diffusivity of CO2 in stored grain can
be approximated by multiplying the normal mass diffusivity of CO2 in air by the porosity
of grain if the matrix of medium is assumed not to affect gas diffusivity significantly. The
results in this study showed that this approximation can result in an overestimate of the
effective diffusivity in the stored corn. The diffusion coefficient of CO2 in air could be
calculated by the gas kinetic theory developed by Hirschfelder et al. (1949). At 10°C, the
diffusion coefficient of CO2 in air is calculated to be 13.8 × 10⁻⁶
m2/s. y Xu et al’s
approximation, the estimated effective diffusivity of CO2 in bulk corn would be 4.7 × 10-
6 m
2/s, which is about 50% higher than the measured value in this study.
As temperature increased from 10 to 30°C, the diffusion coefficient increased from
3.21 × 10⁻⁶
to 3.76 × 10⁻⁶
m2/s, by 17%. According to the kinetic theory of gas, an
increase in temperature increases the velocity of gas molecules of the interstitial air and
hence increases the CO2 diffusion rate through bulk corn. This finding agrees with the
study by Shumugam et al. (2005, who reported that the CO2 diffusion through bulk grain
(wheat, barley and canola) increased at different levels as temperature increased from 5 to
40°C. As corn moisture content increased from 14.0 to 18.8%, the effective diffusion
coefficient through bulk corn decreased from 3.59 × 10⁻⁶
to 3.39 × 10⁻⁶
m2/s. But as corn
moisture content further increased from 18.8 to 22.2%, there was no difference observed
on the effective diffusion coefficient. Overall, the effect of corn moisture content was not
as large as the effect of temperature on the CO2 diffusion coefficient.
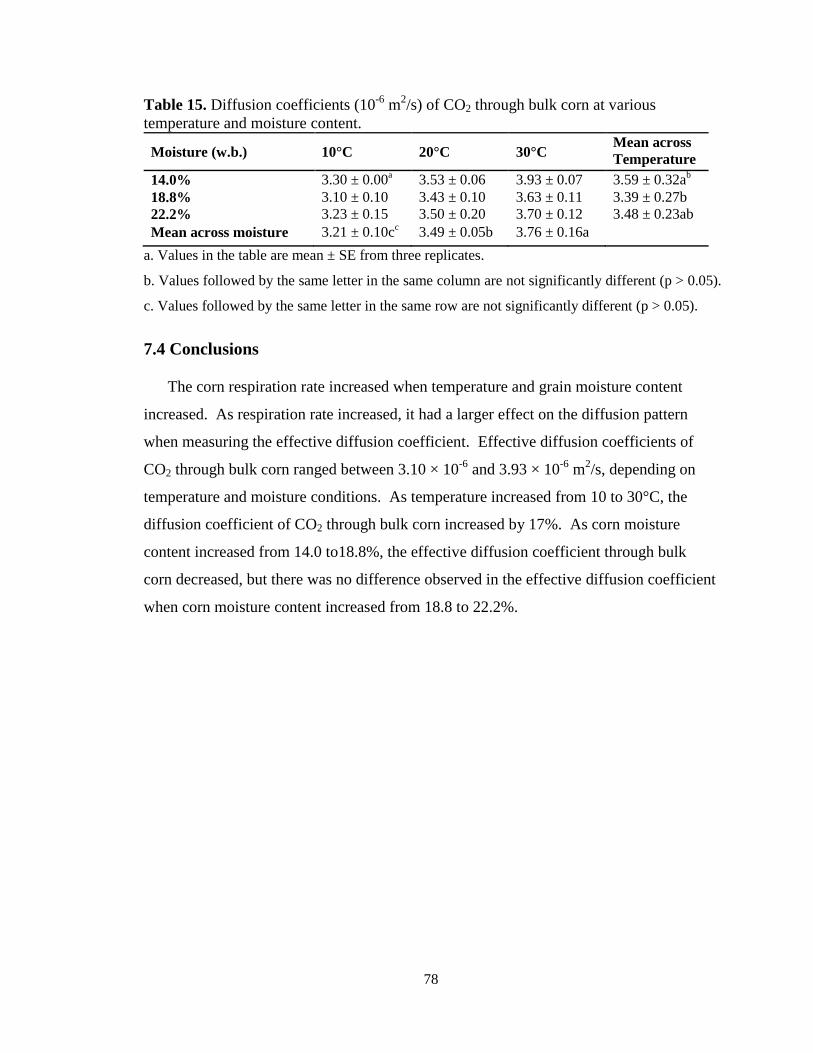
78
Table 15. Diffusion coefficients (10-6
m2/s) of CO2 through bulk corn at various
temperature and moisture content.
Moisture (w.b.) 10°C 20°C 30°C Mean across
Temperature
14.0% 3.30 ± 0.00a 3.53 ± 0.06 3.93 ± 0.07 3.59 ± 0.32a
b
18.8% 3.10 ± 0.10 3.43 ± 0.10 3.63 ± 0.11 3.39 ± 0.27b
22.2% 3.23 ± 0.15 3.50 ± 0.20 3.70 ± 0.12 3.48 ± 0.23ab
Mean across moisture 3.21 ± 0.10cc 3.49 ± 0.05b 3.76 ± 0.16a
a. Values in the table are mean ± SE from three replicates.
b. Values followed by the same letter in the same column are not significantly different (p > 0.05).
c. Values followed by the same letter in the same row are not significantly different (p > 0.05).
7.4 Conclusions
The corn respiration rate increased when temperature and grain moisture content
increased. As respiration rate increased, it had a larger effect on the diffusion pattern
when measuring the effective diffusion coefficient. Effective diffusion coefficients of
CO2 through bulk corn ranged between 3.10 × 10⁻⁶
and 3.93 × 10⁻⁶
m2/s, depending on
temperature and moisture conditions. As temperature increased from 10 to 30°C, the
diffusion coefficient of CO2 through bulk corn increased by 17%. As corn moisture
content increased from 14.0 to18.8%, the effective diffusion coefficient through bulk
corn decreased, but there was no difference observed in the effective diffusion coefficient
when corn moisture content increased from 18.8 to 22.2%.
79
Chapter 8. Conclusions and recommendations
8.1 Conclusions
The feasibility of early harvest of corn and corn stover was examined in terms of dry
matter yields, processing characteristics, chemical compositions and nutritive values. For
corn harvested with high moistures, its storability was investigated by developing a CO2
monitoring system during storage. In line with the four specific objectives stated in the
Introduction, the following are the major conclusions.
1. The dry matter yield of corn increased rapidly until reaching corn maturity and
remained stable after corn maturity, with an average yield of 11.1 t/ha over the
two year study. For corn stover, the 2 year average dry matter yield was 14.8 t/ha
at corn kernel filling stage and decreased to 13.2 t/ha at kernel physiological
maturity and further decreased throughout kernel dry down. During corn dry
down period, moldy kernel percentage increased from 2.1 to 4.1%, and plant
lodging percentage increased from 1.2 to 3.6%.
2. Effects of corn harvest moisture content on dry grind ethanol processes were
observed on fermentation characteristics and DDGS composition. The final
ethanol concentration from corn with harvest moisture content of 54% (110 days
after corn planting, kernel dent stage) was 0.5 to 1.2 percentage points higher than
that from matured corn with lower harvest moisture contents. Ethanol conversion
efficiencies for the corn with harvest moisture contents of 73 and 54% were
higher than that for the corn with lower harvest moisture contents. For the corn
wet milling process, as corn harvest moisture content decreased from 49 to 21%,
the yields of starch and germ increased by 1.2 to 1.9 percentage points
respectively, while the yield of steep water solids, total fiber and gluten decreased.
3. Corn harvest moisture content affected compositions and nutritive values of corn
stover, DDGS and feed value enhanced stover (FVES). As corn harvest moisture
content decreased, neutral detergent fiber, acid detergent fiber and lignin
80
concentrations in corn stover increased while crude protein concentrations
decreased. The study showed that the whole corn plant could be the most
efficiently used if the corn and stover were harvested as soon as corn reached
physiological maturity.
4. Corn respiration rate increased when temperature and grain moisture content
increased. As respiration rate increased, it had a larger effect on the diffusion
pattern when measuring the effective diffusion coefficient. Effective diffusion
coefficients of CO2 through bulk corn ranged between 3.10 × 10⁻⁶
and 3.93 × 10⁻⁶
m2/s, depending on temperature and moisture conditions. As temperature
increased from 10 to 30°C, the diffusion coefficient of CO2 in bulk corn increased.
As corn moisture content increased from 14.0 to 18.8%, the effective diffusion
coefficient through bulk corn decreased, but there is no difference observed in the
effective diffusion coefficient when corn moisture content increased from 18.8 to
22.2%.
8.2 Recommendations for future work
Three potential issues were identified that would benefit from further investigation:
1. The results in this study showed that corn harvested at high moisture contents
have higher ethanol conversion efficiencies compared to corn with lower harvest
moisture contents. Tests in this study were only performed in one variety of the
corn. It is possible that the harvest moisture effects on conversion efficiencies
would vary among different varieties of corn. Therefore, it would be beneficial to
repeat tests with different varieties of corn.
2. The results showed that corn harvested earlier with high moisture content had
advantages. However, there are still some questions, such as how should we store
high moisture corn? Dr. Eckhoff and I proposed the freezing concept to store the
high moisture corn to save the cost and energy. However, data are needed to
show this concept on a large scale. Also, will corn ethanol facilities accept high

81
moisture corn? An economic analysis of the whole process using high moisture
corn needs to be performed to show if using high moisture corn is a profitable
venture.
3. Having a good estimate of the effective CO2 diffusivity through bulk corn is the
first step to better understanding CO2 movement in corn storage bins and hermetic
storage bags. Mathematical models and field studies needs to be conducted in the
future to develop a CO2 monitoring system for corn storage.
82
References
AACC International. 2000a. Methods 44-15A: Approved Methods of the American
Association of Cereal Chemists, 10th Ed. St. Paul, MN: AACC International.
AACC International. 2000b. Methods 44-19: Approved Methods of the American
Association of Cereal Chemists, 10th Ed. St. Paul, MN: AACC International.
Adler, P. R., M. A. Sanderson, A. A. Boateng, P. J. Weimer, and H. J. G. Jung. 2006.
Biomass yield and biofuel quality of switchgrass harvested in fall or spring.
Agronomy Journal. 98: 1518-1525.
Alagusundaram, K., D. S. Jayas, W. E. Muir, N. D. G. White, and R. N. Sinha. 1996.
Apparent flow coefficient of carbon dioxide through wheat bulks. Canadian
Agricultural Engineering. 38: 69-74.
AOAC. 2003a. 990.03: Official Methods of the Association of Official Analytical
Chemists, 17th Ed. Gaithersburg, MD: AOAC.
AOAC. 2003b. 920.39: Official Methods of the Association of Official Analytical
Chemists, 17th Ed. Gaithersburg, MD: AOAC.
AOAC. 2003c. 942.05: Official Methods of the Association of Official Analytical
Chemists, 17th Ed. Gaithersburg, MD: AOAC.
ASAE. 2003. D243.4: Thermal properties of grain and grain products. St. Joseph, MI:
ASAE.
ASAE. 2007. D245.6: Moisture relationships of plant-based agricultural products. St.
Joseph, MI: ASAE.
Anderson, R. A., J. J. Ellis, and E. L. Griffin Jr. 1972. Effects of southern corn leaf blight
on products of wet-milling. Cereal Science. 7: 41-44.
Allaire, S. E., J. A. Lafond , A. R. Cabral, and S. F. Lange. 2008. Measurement of gas
diffusion through soils: comparison of laboratory methods. Journal of
Environmental Monitoring. 10: 1326-1336.
Badenhuizen, N. P. 1965. Occurrence and development of starch in plants. in Starch
Chemistry and Technology, 65-208 Academic Press, New York.
83
Bailey, C. H. 1940. Respiration of cereal grains and flaxseed. Plant Physiol. 15: 257-274.
Ball, B. C. 1981. A laboratory method to measure gas diffusion and flow in soil and
other porous materials. Journal of Soil Science. 32: 323-333.
Bern, C. J., J. L. Steele and R. V. Morey. 2002. Shelled corn CO2 evolution and storage
time for 0.5% dry matter loss. Applied Engineering in Agriculture. 18: 703-7069.
Berry, C. S. 1986. Resistant starch: Formation and measurement of starch that survives
exhaustive digestion with amylolytic enzymes during the determination of dietary
fibre. Journal of Cereal Science. 4: 301-314.
Biliaderis, C. G. 2009. Structural transitions and related physical properties of starch. In
Starch Chemistry and Technology, 3rd ed, 293-372. BeMiller, J. Whistler R.
Elsevier.
Buchele, W. F. 1975. Harvesting and utilization of corn stalks from Iowa farms in:
Energy in Agriculture Collection. 7th ed. East Lansing, Mich.: Michigan State
University, Department of Agricultural Engineering.
Burt, D. J., and P. L. Russell. 1983. Gelatinization of low water content wheat starch-
water mixtures. A combined study by differential scanning calorimetry and light
microscopy. Starch‐Stärke. 35: 354-360.
Center, C. F., G. D. Jones, and M. T. Carter. 1970. Dry matter accumulation and
depletion in leaves, stems, and ears of maturing maize. Agronomy Journal. 62:
535-537.
Cofie-Agblor, R, W. E. Muir, N. D. G White, D. S. Jayas. 1997. Microbial heat
production in stored wheat. Canadian Agricultural Engineering. 39: 303-307.
Cofie-Agblor, R., W. E. Muir, R. Sinicio, S. Cenkowski, D.S.Jayas. 1995. Characteristics
of carbon dioxide sorption by stored wheat. Journal of Stored Products Research.
31: 317–324.
Cone, J. W. and F. M. Engels. 1993. The influence of ageing on cell wall composition
and degradability of three maize genotypes. Animal Feed Science and Technology.
40: 331-342.
84
Cumberland, D. J. and R. Crawford. 1987. The packing of particles. In Handbook of
Powder Technology. 85-119. J. C. Williams and T. Allen,ed. Elsevier, Amsterdam.
Cummins, D. G. 1970. Quality and yield of corn plants and component parts when
harvested for silage at different maturity stages. Agronomy Journal. 62: 781-784.
Dabney, S. M., J. A. Delgado, and D. W. Reeves. 2001. Using winter cover crops to
improve soil and water quality. Commun. Soil Science and Plant Analysis. 32:
1221-1250.
Darby, H. M. and J. G. Lauer. 2002. Harvest date and hybrid influence on corn forage
yield, quality, and preservation. Agronomy Journal. 94: 559-566.
Dillahunty, A. L., T. J. Siebenmorgen, R. W. Buescher, D. E. Smith,and A.
Mauromoustakos. 2000. Effect of moisture content and temperature on respiration
rate of rice. Cereal Chemistry. 77: 541–543.
Dudukovic, M. P. 1982. An analytical solution for the transient response in a diffusion
cell of the Wicke-Kallenbach type. Chemical Engineering Science. 37: 153-158.
Dye, R. F., and J. M. Dallavalle. 1958. Diffusion of gases in porous media. Industrial
Engineering Chemistry. 50: 1195–1200.
Earle, F. R., J. J. Curtis, and J. E. Hubbard. 1946. Composition of the component parts of
the corn kernel. Cereal Chemistry. 23: 504-511.
Eckhoff, S. R., 2010. Freezing instead of drying high-moisture corn, Resource.
November/December, 5-9.
Eckhoff, S. R., S. K. Singh, B. E. Zehr, K. D. Rausch, E. J. Fox, A. K. Mistry, A. E.
Haken, Y. X. Niu, S. H. Zou, P. Buriak, M. E. Tumbleson and P. L. Keeling. 1996.
A 100-g laboratory corn wet-milling procedure. Cereal Chemistry. 73: 54-57.
Eckhoff, S. R., L. Du, P. Yang, K. D. Rausch, D. L. Wang, B. H. Li, and M. E.
Tumbleson. 1999. Comparison between alkali and conventional corn wet-milling:
100-g procedures. Cereal Chemistry. 76: 96-99.
85
Englyst, H. N. and G. T. Macfarlane. 1986. Breakdown of resistant and readily digestible
starch by human gut bacteria. Journal of Science and Food Agriculture. 37: 699-
706.
Erickson, B., and L. Valentin 2008. Evaluating corn harvest timing. Top farmer crop
workshop newsletter. Available at:
http://www.agecon.purdue.edu/topfarmer/newsletter/TFCW9_2008.pdf. Accessed
March 14th
, 2012.
Evans, J. W. 1941. Microscopic examination of developing corn starch. Cereal Chemistry.
18: 462-473.
Farnham, D. E., G. O. Benson, and R. B. Pearce. 2003. Corn perspective and culture. In
Corn: Chemistry and Technology, 1-33. 2nd ed. Academic Press: New York.
Fernandez, A., R. Stroshine, and J. Tuite. 1982. Carbon dioxide production and mold
growth in stored corn. Paper 82-3016. ASABE. St Joseph, MI.
Ferrero, C., M. N. Martino, and N. E. Zaritzky. 1993. Stability of frozen starch pastes:
Effect of freezing, storage and xanthan gum addition. Journal of Food Processing
and Preservation. 17: 191-211.
Flegg, P. B. 1953. The effect of aggregation on diffusion of gases and vapours through
soils. Journal of Science and Food Agriculture. 4: 104-105.
Henderson, F. Y. and T. A. Oxley. 1944. The properties of grain in bulk. II. The
coefficient of diffusion of carbon dioxide through wheat. Journal of the Society of
Chemical Industry.62: 52-53.
Hirschfelder, J. O., R. B. Bird, E. L. Spotz. 1949. The transport properties of gases and
gaseous mixtures. II. Chemical Reviews. 44: 205-231.
Huang, H., D. Faulkner, L. Berger, and S. Eckhoff. 2012a. Harvest date influence on dry
matter yield and moisture of corn and stover. Transactions of ASABE. 55: 593-598.
Huang, H., Xu, L., Eckhoff, S. 2012b. Effect of harvest moisture and frozen storage on
corn-wet-milling yields and starch pasting properties. Cereal Chemistry. 89: 104-
108.
86
Ileleji, K. E., D. E. Maier, C. Bhat, and C. P. Woloshuk. 2006. Detection of a developing
hot spot in stored corn with a CO2 sensor. Applied Engineering in Agriculture. 22:
275-289.
Ingle, J., D. Beitz, and R. H. Hageman. 1965. Changes in composition during
development and maturation of maize seeds. Plant Physiology. 40: 835-839.
Irlbeck, N., J. Russell, A. Hallauer, and D. Buxton. 1993. Nutritive value and ensiling
characteristics of maize stover as influenced by hybrid maturity and generation,
plant density and harvest date. Animal Feed Science and Technology. 41: 51-64.
Jane, J. and J. F. Robyt. 1984. Structure studies of amylose-V complexes and retro-
graded amylose by action of alpha amylases, and a new method for preparing
amylodextrins. Carbohydrate Research. 132: 105-118.
Jenkins, B. M. and H. R. Sumner. 1986. Harvesting and handling agricultural residues for
energy. Transactions of ASABE. 29: 824-836.
Jennings, S. D., D. J. Myers, L. A. Johnson, and L. M. Pollak. 2002a. Effects of maturity
on grain quality and wet-milling properties of two selected corn hybrids. Cereal
Chemistry. 79: 697-702.
Jennings, S. D., D. J. Myers, L. A. Johnson, and L. M. Pollak. 2002b. Effects of maturity
on corn starch properties. Cereal Chemistry. 79: 703-706.
Jeong, H. Y. and S. T. Lim. 2003. Crystallinity and pasting properties of freeze-thawed
high amylose maize starch. Starch‐Stärke. 55: 511-517.
Jiang, H., J. Lio, M. Blanco, M. Campbell, and J. Jane, 2010. Resistant-starch formation
in high-amylose maize starch during kernel development. Journal of Agricultural
and Food Chemistry. 58: 8043-8047.
Jones, S. B., D. Or, and G. E. Bingham. 2003. Gas diffusion measurement and modeling
in coarse-textured porous media. Vadose Zone Journal. 2: 602-610.
Kaminsky, T. 1989. Investigation of the feasibility of collection, densification, storage,
transportation, and marketing of agricultural biomass. Saskatchewan Research
87
Council Publication No. I−4305−1−E−89. Saskatoon, Sask.:Saskatchewan
Research Council.
Khankari, K. K., S. V. Patankar and R. V. Morey. 1995. A mathematical model for
natural convection moisture migration in stored grain. Transactions of ASAE. 38:
1777-1787
Khoo, U. and M. J. Wolf. 1970. Origin and development of protein granules in maize
endosperm. American Journal of Botany. 57: 1042-1050.
Kiesselbach, T. and E. R. Walker. 1952. Structure of certain specialized tissue in the
kernel of corn. American Journal of Botany. 39: 561-569.
Landström, S., L. Lomakka, and S. Andersson. 1996. Harvest in spring improves yield
and quality of reed canary grass as a bioenergy crop. Biomass and Bioenergy. 11:
333-341.
Lee, D., V. N. Owens, A. Boe, and P. Jeranyama. 2007. Composition of Herbaceous
Biomass Feedstocks. Brookings, SD: North Central Sun Grant Center, 16.
Lewis, A. L. C., W. J. Cherney, and H. Jerome, 2004. Hybrid, maturity, and cutting
height interactions on corn forage yield and quality. Agronomy Journal. 96: 267-
274.
Li, L., M. Blanco, and J. Jane. 2007. Physicochemical properties of endosperm and
pericarp starches during maize development. Carbohydrate Polymers. 67: 630-639.
Liu, J., X. Cheng, G. Xie, W. Zhu, and S. Xiong. 2009. Variation in corn stover yield and
fuel quality with harvest time. In Power and Energy Engineering Conference, 2009.
APPEEC 2009.
Maier, D. E., R. Hulasare, B. Qian, and P. Armstrong. 2006. Monitoring carbon dioxide
levels for early detection of spoilage and pests in stored grain. 9th
International
Working Conference on Stored Product Protection: 1174-1181.
Mckee, H. S. 1958. Protein metabolism in ripening and dormant seeds and fruits. In
Encyclop. Plant Physiology. 581-585. W. Ruhland, 1st ed. Springer Verlag, Berlin.
88
McMaster, G. S. and W. Wilhelm. 1997. Growing degree-days: one equation, two
interpretations. Agricultural and Forest Meteorology. 87: 291-300.
Moog, D. J. P., R. L. Stroshine, and L. M. Seitz. 2010. Fungal susceptibility at four
temperature-moisture combinations and carbon dioxide kit color reader evaluation.
Cereal Chemistry. 87: 182-189.
Muir, W. E., D. Waterer, and R. N. Sinha. 1985. Carbon dioxide as an early indicator of
stored cereal and oilseed spoilage. Transactions of ASAE. 28: 1673-1675.
Naidu, K., V. Singh, D. B. Johnston, K. D. Rausch, and M. E. Tumbleson. 2007. Effects
of ground corn particle size on ethanol yield and thin stillage soluble solids. Cereal
Chemistry. 84: 6-9.
National Forage Testing Association. 2002. 5.1. Determination of amylase neutral
detergent fiber by refluxing. Available at:
http://www.foragetesting.org/lab_procedure/_old/ndfiber.html. Accessed 24
February, 2012.
Nielsen, R.L., C. Woloshuk, and K. Wise. 2009. Manage Moldy Corn. Purdue University,
Agronomy Department. Available at:
http://www.ag.purdue.edu/extension/cornmold/Pages/causes.aspx. Accessed 10
June 2011.
Nielsen, R. L. 1995. Questions relative to harvesting and storing corn stover. Purdue
University, Agronomy Department. Available at:
http://www.agry.purdue.edu/ext/corn/pubs/agry9509.htm. Accessed 10 June 2011.
Nielsen, R. L. 2011. Field dry down of mature corn grain. Purdue University, Agronomy
Department. Available at:
http://www.agry.purdue.edu/ext/corn/news/timeless/graindrying.html. Accessed
12 March, 2012.
Paes, J. L., L. R. A. Faroni, , M. A. Martins, O. D. Dhingra, and T. A. Silva. 2011.
Diffusion and sorption of allyl isothiocyanate in the process of fumigation of
maize. Revista Brasileira de Engenharia Agrícola Ambiental. 15: 296-301.
89
Philippeau, C. and B. Michalet-Doreau. 1997. Influence of genotype and stage of
maturity of maize on rate of ruminal starch degradation. Animal Feed Science
Technology. 68: 25-35.
Pordesimo, L. O., W. C. Edens, and S. Sokhansanj. 2004a. Distribution of aboveground
biomass in corn stover. Biomass and Bioenergy. 26: 337-343.
Pordesimo, L. O., S. Sokhansanj, and W. C. Eden. 2004b. Moisture and yield of corn
stover fractions before and after grain maturity. Transactions of ASABE 47: 1597-
1603.
Pordesimo, L., B. Hames, S. Sokhansanj, and W. Edens, 2005. Variation in corn stover
composition and energy content with crop maturity. Biomass and Bioenergy. 28:
366-374.
Pronyk, C., W. E. Muir, N. D. G. White, and D. Abramson. 2004. Carbon dioxide
production and deterioration of stored canola. Canadian Biosytems Engieering. 46:
325-333.
Ragai, H., and W. E. Loomis. 1953. Respiration of maize grain. Plant Physiology. 29: 49-
55.
Reible, D. D. and F. H. Shair. 1982. A technique for the measurement of gaseous
diffusion in porous media. Journal of Soil Science. 33: 165-174.
Robertson, M. D., A. S. Bickerton, A. L. Dennis, H. Vidal, and K. N. Frayn. 2005.
Insulin-sensitizing effects of dietary resistant starch and effects on skeletal muscle
and adipose tissue metabolism. The American Journal of Clinical Nutrition. 82:
559-567.
Russell, J. R. 1986. Influence of harvest date on the nutritive value and ensiling
characteristics of maize stover. Animal Feed Science and Technology. 14: 11-27.
Schel, J. H. N, H. Keiftz, and A. A. M. Van Lammeren. 1984. Interaction between
embryo and endosperm during early development stages of maize caryopses.
Canadian Journal of Botany. 62: 2842-2853.
90
Seitz, L. M., D. B. Sauer, H. E. Mohr, and D. F. Aldis. 1982. Fungal growth and dry
matter loss during bin storage of high-moisture corn. Cereal Chemistry. 59: 9-14.
Sharma, V., K. D. Rausch, J. V. Graeber, S. J. Schmidt, P. Buriak, M. E. Tumbleson, and
V. Singh. 2010. Effect of resistant starch on hydrolysis and fermentation of corn
starch for ethanol. Applied Biochemistry and Biotechnology. 160: 800-811.
Shannon, J. C., and D. Garwood. 1984. Genetics and physiology of starch development.
In Starch: Chemistry and Technology, 25-79. R. L. Whistler, J. N. BeMiller, and E.
F. Pascall, 2nd
ed. Academic Press: New York.
Shinners, K. J. and B. N. Binversie. 2007. Fractional yield and moisture of corn stover
biomass produced in the Northern US Corn Belt. Biomass and Bioenergy. 31: 576-
584.
Shinners, K. J., B. N. Binversie, R. E. Muck, and P. Weimer. 2007. Comparison of wet
and dry corn stover harvest and storage. Biomass and Bioenergy. 31: 211-221.
Shinners, K. J., A. D. Wepner, R. E. Muck, and P. J. Weimer. 2011. Aerobic and
anaerobic storage of single-pass, chopped corn stover. BioEnergy Research. 4: 61-
75.
Shunmugam, G., D. S. Jayas, N. D. G. White, and W.E. Muir. 2005. Diffusion of carbon
dioxide through grain bulks. Journal of Stored Products and Research. 41: 131–
144
Singh, V., D. B. Johnston, K. Naidu, K. D. Rausch, R. L. Belyea, and M. E. Tumbleson.
2005. Comparison of modified dry-grind corn processes for fermentation
characteristics and DDGS composition. Cereal Chemistry. 82: 187-190.
Singh, D., W. E. Muir, and R. N. Sinha. 1983. Finite element modeling of carbon dioxide
diffusion in stored wheat. Canadian Biosystems Engineering. 25: 149-152.
Singh, D., W. E. Muir, and R. N. Sinha. 1984. Apparent coefficient of diffusion of carbon
dioxide through samples of cereal and rapeseed. Journal of Stored Products and
Research. 20: 169-175.
91
Singh, D., W. E. Muir, and R. N. Sinha. 1985. Transient method to determine the
diffusion coefficient of gases. Canadian Agricultural Engineering. 27: 69-72.
Sinha R. N. and A. H. Wallace II. 1965. Ecology of a fungus induced hot spot in stored
grain. Canadian Journal of Plum Science. 45: 48-59.
Smith, M. S., W. W. Frye, and J. J. Varco. 1987. Legume winter cover crops. Adv. Soil
Sci. 7: 96-139.
Sewell, J. R., L. L. Berger, T. G. Nash, M. J. Cecava, P. H. Doane, J. L. Dunn, M. K.
Dyer, and N. A. Pyatt. 2009. Nutrient digestion and performance by lambs and
steers fed thermochemically treated crop residues. Journal of Animal Science. 87:
1024-1033.
Tester, R. F. and W. R. Morrison. 1990. Swelling and gelatinization of cereal starches. I.
effects of amylopectin, amylose, and lipids. Cereal Chemistry. 67: 551-557.
Tester, R. F., and W. R. Morrison. 1992. Swelling and gelatinization of cereal starches III.
Some properties of waxy and normal nonwaxy barley starches. Cereal Chemistry. 69:
654-658.
Thomas, K. C., S. H. Hynes, and W. M. Ingledew. 1996. Practical and theoretical
considerations in the production of high concentrations of alcohol by fermentation.
Process Biochemistry. 31: 321-331.
Thomas, D. J., and Atwell, W. A. 1997. Starch. Pages 13-24 in: Starch Analysis Methods.
AACC: St. Paul, MN.
Undersander D., D. R. Mertens, and N. Thiex. 1993. Forage analysis procedures.
Available at: http://www.foragetesting.org/files/LaboratoryProcedures.pdf.
Accessed 23 March 2012.
Underwood, E. J. and N. Suttle. 1999. The mineral nutrition of livestock. 3rd ed.
Wallingford, U.K.: CAB International.
USDA. 2012. Agricultural statistics 2010 – Chapter 1– Statistics of grain and feed.
Available at:
92
http://www.nass.usda.gov/Publications/Ag_Statistics/2010/Chapter01.pdf.
Accessed 12 June 2012.
Wang, P., W. Liu, D. B. Johnston, K. D. Rausch, S. J. Schmidt, M. E. Tumbleson, and V.
Singh. 2010. Effect of endosperm hardness on an ethanol process using a granular
starch hydrolyzing enzyme. Transactions of ASABE. 53: 307-312.
Wang, P., V. Singh, L.Xu, D. B. Johnston, K. D. Rausch, and M. E. Tumbleson. 2005.
Comparison of enzymatic (E-mill) and conventional dry-grind corn processes
using a granular starch hydrolyzing enzyme. Cereal Chemistry. 82: 734-738.
Wang, S., Ingledew, W. M., Thomas, K. C., Sosulski, K., and Sosulski, F. W. 1999.
Optimization of fermentation temperature and mash specific gravity for fuel
alcohol production. Cereal Chemistry. 76: 82-86.
Watson, S. A. 2003. Description, development, structure, and composition of the corn
kernel. Pages 69-106 in: Corn: Chemistry and Technology, 2nd Ed. P. J. White and L.
A. Johnson, eds. AACC International: St. Paul, MN.
Weaver, D. E., C. E. Coppock, G. B. Lake, and R. W. Everett. 1978. Effect of maturation
on composition and in vitro dry matter digestibility of corn plant parts. Journal of
Dairy Science. 61: 1782-1788.
Wiersma, D., P. Carter, K. Albrecht, and G. Coors. 1993. Kernel Milkline Stage and
Corn Forage Yield, Quality, and Dry Matter Content. Journal of Production
Agriculture. 6: 94-99.
Wolf, M. J., C. L. Buzan, M. M. MacMasters, and C. E. Rist. 1952. Structure of the
mature corn kernel. II. Microscopic structure of pericarp, seed coat, and hilar layer
of dent corn. Cereal Chemistry. 32: 165-182.
Wu, Y. 1992. Corn hardness as related to yield and particle size of fractions from a micro
hammer-cutter mill. Cereal Chemistry. 69: 343-347.
Wu, X., D. Wang, S. R. Bean, and J. P. Wilson. 2006. Ethanol Production from Pearl
Millet Using Saccharomyces cerevisiae. Cereal Chemistry. 83: 127-131.
93
Wyman, C.E. 2003. Applications of corn stover and fiber. In Corn: Chemistry and
Technology. 23-750. 2nd
ed. Academic Press: New York.
Xu, S., D.S. Jayas, N.D.G. White, and W.E.Muir. 2002. Momentum-diffusive model of
gas transfer in granular media. Journal of Stored Products Research. 38: 455-462.
Y S I incorporated. 2000. Determination of % cook in extruded cereal products using
chemical solubilization. Application # 322. Yellow Springs, OH
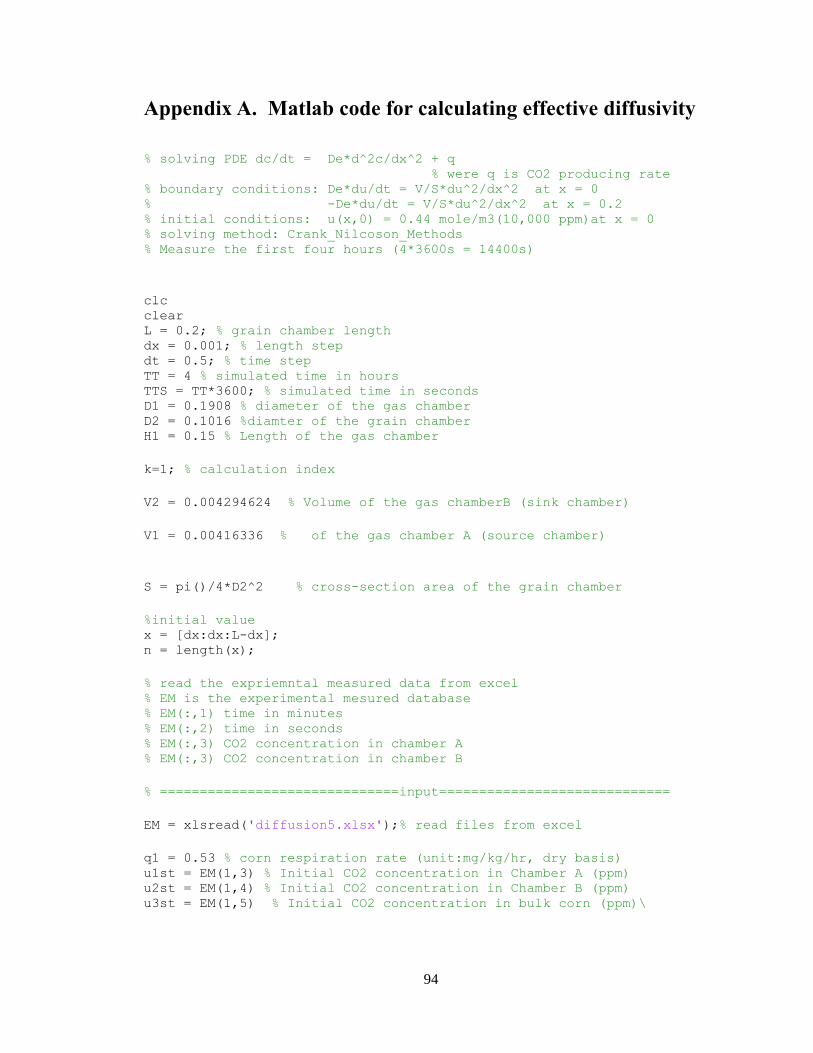
94
Appendix A. Matlab code for calculating effective diffusivity
% solving PDE dc/dt = De*d^2c/dx^2 + q % were q is CO2 producing rate % boundary conditions: De*du/dt = V/S*du^2/dx^2 at x = 0 % -De*du/dt = V/S*du^2/dx^2 at x = 0.2 % initial conditions: u(x,0) = 0.44 mole/m3(10,000 ppm)at x = 0 % solving method: Crank_Nilcoson_Methods % Measure the first four hours (4*3600s = 14400s)
clc clear L = 0.2; % grain chamber length dx = 0.001; % length step dt = 0.5; % time step TT = 4 % simulated time in hours TTS = TT*3600; % simulated time in seconds D1 = 0.1908 % diameter of the gas chamber D2 = 0.1016 %diamter of the grain chamber H1 = 0.15 % Length of the gas chamber
k=1; % calculation index
V2 = 0.004294624 % Volume of the gas chamberB (sink chamber)
V1 = 0.00416336 % of the gas chamber A (source chamber)
S = pi()/4*D2^2 % cross-section area of the grain chamber
%initial value x = [dx:dx:L-dx]; n = length(x);
% read the expriemntal measured data from excel % EM is the experimental mesured database % EM(:,1) time in minutes % EM(:,2) time in seconds % EM(:,3) CO2 concentration in chamber A % EM(:,3) CO2 concentration in chamber B
% ==============================input=============================
EM = xlsread('diffusion5.xlsx');% read files from excel
q1 = 0.53 % corn respiration rate (unit:mg/kg/hr, dry basis) u1st = EM(1,3) % Initial CO2 concentration in Chamber A (ppm) u2st = EM(1,4) % Initial CO2 concentration in Chamber B (ppm) u3st = EM(1,5) % Initial CO2 concentration in bulk corn (ppm)\
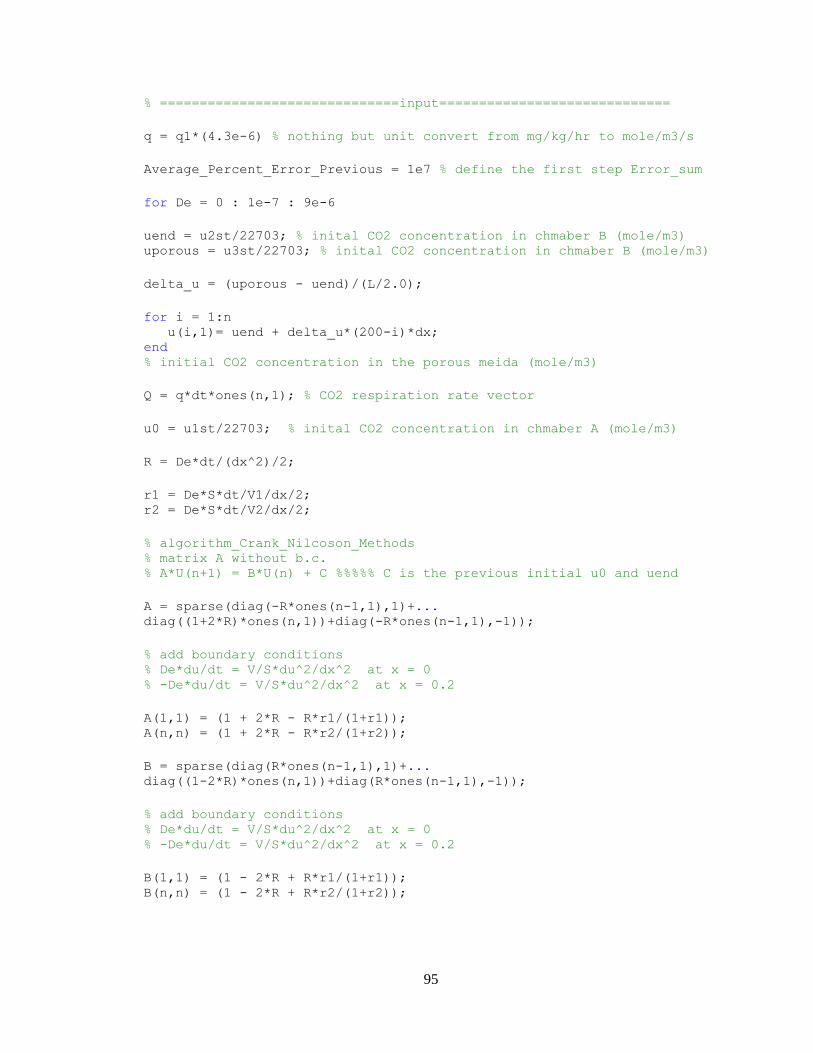
95
% ==============================input=============================
q = q1*(4.3e-6) % nothing but unit convert from mg/kg/hr to mole/m3/s
Average_Percent_Error_Previous = 1e7 % define the first step Error_sum
for De = 0 : 1e-7 : 9e-6
uend = u2st/22703; % inital CO2 concentration in chmaber B (mole/m3) uporous = u3st/22703; % inital CO2 concentration in chmaber B (mole/m3)
delta_u = (uporous - uend)/(L/2.0);
for i = 1:n u(i,1)= uend + delta_u*(200-i)*dx; end % initial CO2 concentration in the porous meida (mole/m3)
Q = q*dt*ones(n,1); % CO2 respiration rate vector
u0 = u1st/22703; % inital CO2 concentration in chmaber A (mole/m3)
R = De*dt/(dx^2)/2;
r1 = De*S*dt/V1/dx/2; r2 = De*S*dt/V2/dx/2;
% algorithm_Crank_Nilcoson_Methods % matrix A without b.c. % A*U(n+1) = B*U(n) + C %%%%% C is the previous initial u0 and uend
A = sparse(diag(-R*ones(n-1,1),1)+... diag((1+2*R)*ones(n,1))+diag(-R*ones(n-1,1),-1));
% add boundary conditions % De*du/dt = V/S*du^2/dx^2 at x = 0 % -De*du/dt = V/S*du^2/dx^2 at x = 0.2
A(1,1) = (1 + 2*R - R*r1/(1+r1)); A(n,n) = (1 + 2*R - R*r2/(1+r2));
B = sparse(diag(R*ones(n-1,1),1)+... diag((1-2*R)*ones(n,1))+diag(R*ones(n-1,1),-1));
% add boundary conditions % De*du/dt = V/S*du^2/dx^2 at x = 0 % -De*du/dt = V/S*du^2/dx^2 at x = 0.2
B(1,1) = (1 - 2*R + R*r1/(1+r1)); B(n,n) = (1 - 2*R + R*r2/(1+r2));
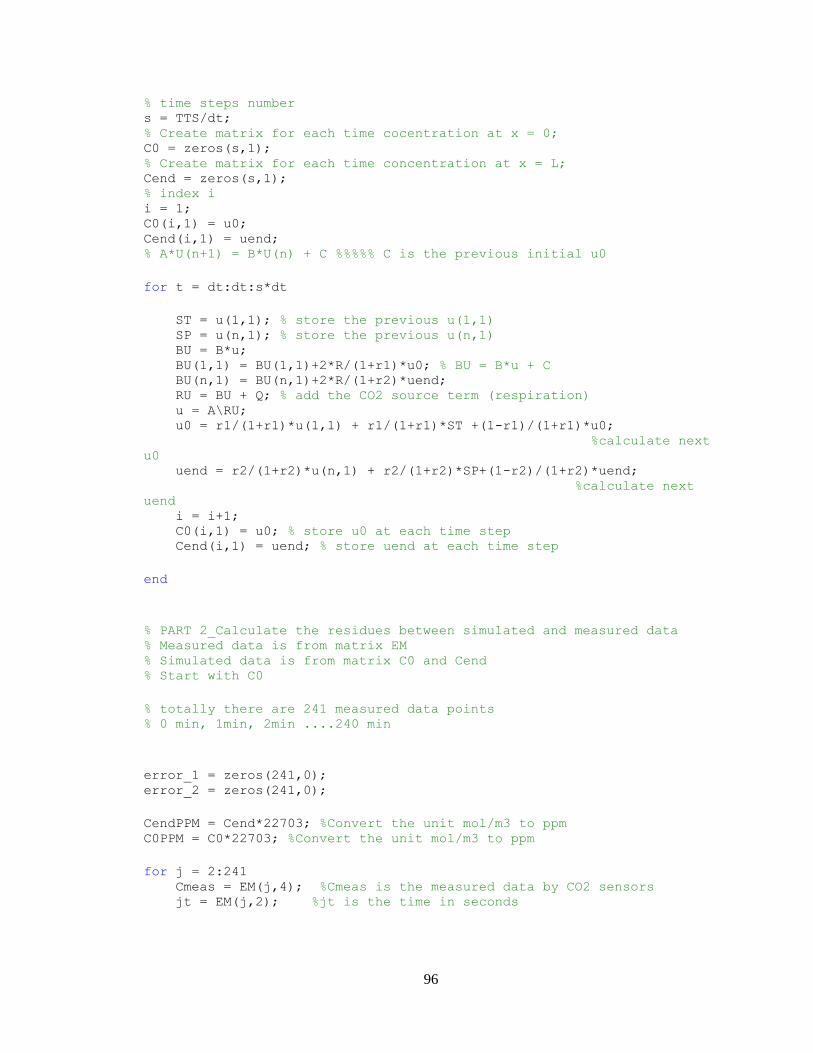
96
% time steps number s = TTS/dt; % Create matrix for each time cocentration at x = 0; C0 = zeros(s,1); % Create matrix for each time concentration at x = L; Cend = zeros(s,1); % index i i = 1; C0(i,1) = u0; Cend(i,1) = uend; % A*U(n+1) = B*U(n) + C %%%%% C is the previous initial u0
for t = dt:dt:s*dt
ST = u(1,1); % store the previous u(1,1) SP = u(n,1); % store the previous u(n,1) BU = B*u; BU(1,1) = BU(1,1)+2*R/(1+r1)*u0; % BU = B*u + C BU(n,1) = BU(n,1)+2*R/(1+r2)*uend; RU = BU + Q; % add the CO2 source term (respiration) u = A\RU; u0 = r1/(1+r1)*u(1,1) + r1/(1+r1)*ST +(1-r1)/(1+r1)*u0; %calculate next
u0 uend = r2/(1+r2)*u(n,1) + r2/(1+r2)*SP+(1-r2)/(1+r2)*uend; %calculate next
uend i = i+1; C0(i,1) = u0; % store u0 at each time step Cend(i,1) = uend; % store uend at each time step
end
% PART 2_Calculate the residues between simulated and measured data % Measured data is from matrix EM % Simulated data is from matrix C0 and Cend % Start with C0
% totally there are 241 measured data points % 0 min, 1min, 2min ....240 min
error_1 = zeros(241,0); error_2 = zeros(241,0);
CendPPM = Cend*22703; %Convert the unit mol/m3 to ppm C0PPM = C0*22703; %Convert the unit mol/m3 to ppm
for j = 2:241 Cmeas = EM(j,4); %Cmeas is the measured data by CO2 sensors jt = EM(j,2); %jt is the time in seconds
97
nt = jt/dt; % nt is the index in vector C0 Csimu = CendPPM(nt,1); % Csimu is the simulated data error_1(j,1) = (Cmeas - Csimu)/Cmeas/241; % store the difference at
each step end
for j = 2:241 Cmeas = EM(j,3); %Cmeas is the measured data by CO2 sensors jt = EM(j,2); %jt is the time in seconds nt = jt/dt; % nt is the index in vector C0 Csimu = C0PPM(nt,1); % Csimu is the simulated data error_2(j,1) = (Cmeas - Csimu)/Cmeas/241; % store the difference at
each step end
Average_Percent_Error = sum(abs(error_1))+ sum(abs(error_2))/2 % total
error from all time steps
if Average_Percent_Error < Average_Percent_Error_Previous
Average_Percent_Error_Previous = Average_Percent_Error;
uend_Previous = uend; u0_Previous = u0; u_Previous = u;
CendPPM_Previous = CendPPM; C0PPM_Previous = C0PPM;
else
De_fit = De - 1e-7 break;
end
end
%======exact data at every 1 min, and stored in another matrix======%
C_united = zeros(241,5); for i = 1 : 241
C_united(i,1) = EM(i,1); C_united(i,2) = EM(i,3); C_united(i,3) = EM(i,4);
end
nstep = (EM(2,2)-EM(1,2))/dt;
98
for i = 1 : 241
C_united(i,4) = C0PPM_Previous((i-1)*nstep+1,1); C_united(i,5) = CendPPM_Previous((i-1)*nstep+1,1);
end
% plotting concentrations at each time step at x = 0 and x = L %(time scale second) figure (1) tf = [0:dt:s*dt]; plot(tf,C0PPM_Previous,'LineWidth',2,'color','red') hold all plot(tf,CendPPM_Previous,'LineWidth',2,'color','red') dtm = EM(2,2); tfm = [0:dtm:240*dtm]; plot(tfm,EM(:,3),'LineWidth',1,'color','blue'); plot(tfm,EM(:,4),'LineWidth',1,'color','blue'); hold off hleg1 = legend('Simulated','Simulated','Measured','Measured'); title('measured and simulated CO2 conc.') xlabel('diffusion time (sec)') ylabel('CO2 concentration(ppm)')
% plotting concentrations at each time step at x = 0 and x = L %(time scale hour) figure (2) tf = [0:dt/3600:s*dt/3600]; plot(tf,C0PPM_Previous,'LineWidth',2,'color','red') hold all plot(tf,CendPPM_Previous,'LineWidth',2,'color','red') dtm = EM(2,2)/3600; tfm = [0:dtm:240*dtm]; plot(tfm,EM(:,3),'LineWidth',1,'color','blue'); plot(tfm,EM(:,4),'LineWidth',1,'color','blue'); hold off hleg1 = legend('Simulated','Simulated','Measured','Measured'); title('measured and simulated CO2 conc.') xlabel('diffusion time (hr)') ylabel('CO2 concentration(ppm)')
% plotting concentrations at final step from x = o to x to L %(time scale hour) figure (3) u_Previous = [u0_Previous;u_Previous;uend_Previous]; x = [0,x,L]; uppm = 22703*u_Previous; plot(x,uppm,'LineWidth',2,'color','red')

99
title('simulated CO2 conc.from x = 0 to x = L') xlabel('diffusion time (sec)') ylabel('CO2 concentration(ppm)')
100
Appendix B.
Finite element modeling of carbon dioxide and temperature
distributions in stored corn
B1. Introduction
The CO2 movement in bulk corn can be primarily considered as the diffusive and
convective transport of CO2 through the interstitial spaces of the bulk corn where corn
itself acts as a source for the CO2 through respiration. In the diffusion transport, the CO2
moves from high concentration field to low concentration to diminish concentration
gradients and at the same time the respiration of corn at the spoilage spot tends to
maintain such gradients, and thus, the problem of CO2 movement becomes dynamic in
nature. In North America, corn is harvested in the fall and placed in the storage bins at
high temperatures after drying. As winter proceeds, the temperature of corn near the
outer wall would decrease, but the temperature of corn in the center of the storage bin
would remain high, due to the low thermal diffusivity of the bulk corn. Such temperature
gradients would induce the natural convections in the grain storage bins. Moreover, the
time varying ambient temperature makes the whole transport an unsteady process, which
makes the system more complex.
In this section, a finite element model (FEM) was built to predict the CO2 movement
and distribution in stored corn, based on the measured corn respiration rate and CO2
diffusivity through bulk corn in Chapter 7. In this model, only the diffusion of the CO2
movement is considered. Compared to the comprehensive diffusion-convection model,
the model built based on the diffusion only is simpler and needs less computational time
since it does not involve the bulk fluid flow computation. However, this model would be
a good starting point in developing a physical understanding of CO2 movement process in
bulk corn.
B2 Model development
Transient CO2 transport and temperature changes in porous media can be described
by partial differential equations based on the mass and energy conservation theorem. All
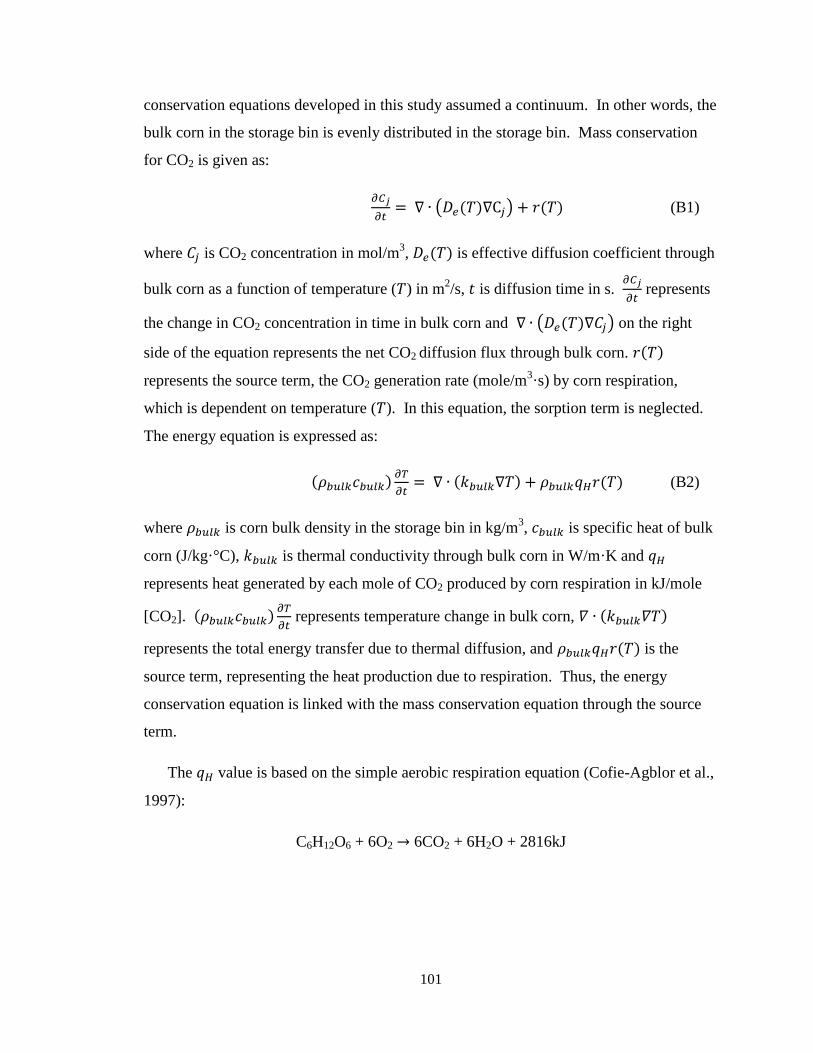
101
conservation equations developed in this study assumed a continuum. In other words, the
bulk corn in the storage bin is evenly distributed in the storage bin. Mass conservation
for CO2 is given as:
( ( ) ) ( ) (B1)
where is CO2 concentration in mol/m3, ( ) is effective diffusion coefficient through
bulk corn as a function of temperature ( ) in m2/s, is diffusion time in s.
represents
the change in CO2 concentration in time in bulk corn and ( ( ) ) on the right
side of the equation represents the net CO2 diffusion flux through bulk corn. ( )
represents the source term, the CO2 generation rate (mole/m3·s) by corn respiration,
which is dependent on temperature ( ). In this equation, the sorption term is neglected.
The energy equation is expressed as:
( )
( ) ( ) (B2)
where is corn bulk density in the storage bin in kg/m3, is specific heat of bulk
corn (J/kg·°C), is thermal conductivity through bulk corn in W/m·K and
represents heat generated by each mole of CO2 produced by corn respiration in kJ/mole
[CO2]. ( )
represents temperature change in bulk corn, ( )
represents the total energy transfer due to thermal diffusion, and ( ) is the
source term, representing the heat production due to respiration. Thus, the energy
conservation equation is linked with the mass conservation equation through the source
term.
The value is based on the simple aerobic respiration equation (Cofie-Agblor et al.,
1997):
C6H12O6 + 6O2 6CO2 + 6H2O + 2816kJ
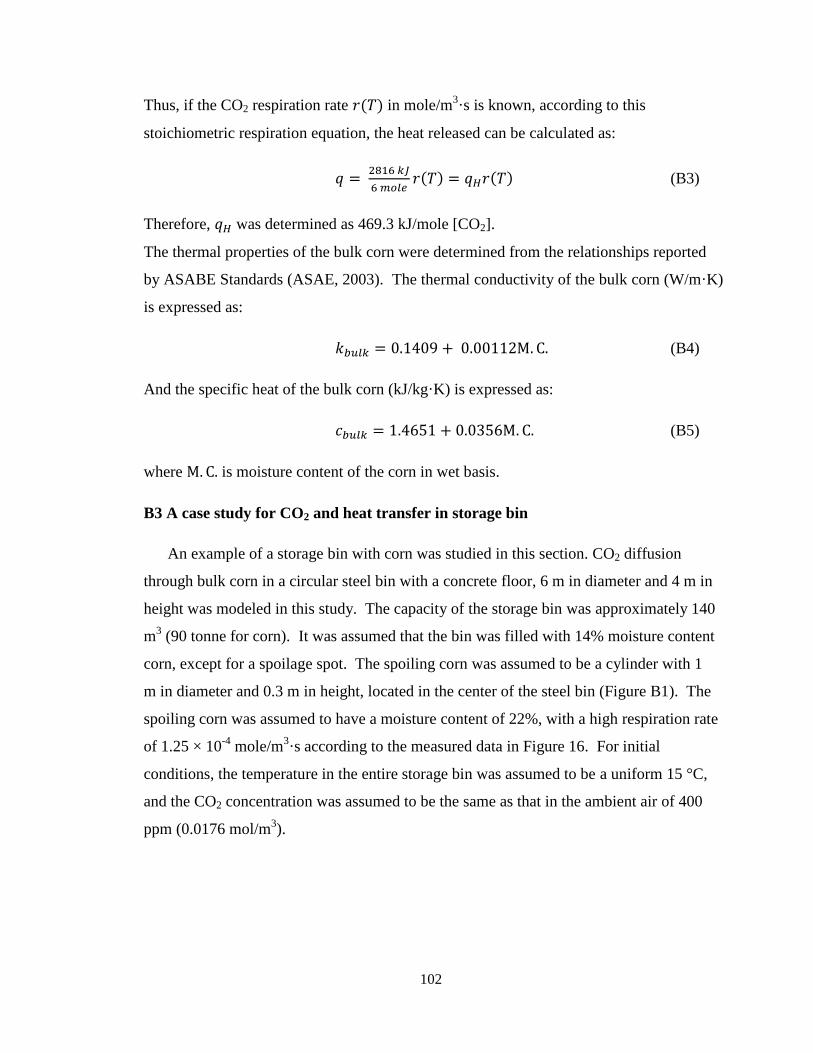
102
Thus, if the CO2 respiration rate ( ) in mole/m3·s is known, according to this
stoichiometric respiration equation, the heat released can be calculated as:
( ) ( ) (B3)
Therefore, was determined as 469.3 kJ/mole [CO2].
The thermal properties of the bulk corn were determined from the relationships reported
by ASABE Standards (ASAE, 2003). The thermal conductivity of the bulk corn (W/m·K)
is expressed as:
(B4)
And the specific heat of the bulk corn (kJ/kg·K) is expressed as:
(B5)
where is moisture content of the corn in wet basis.
B3 A case study for CO2 and heat transfer in storage bin
An example of a storage bin with corn was studied in this section. CO2 diffusion
through bulk corn in a circular steel bin with a concrete floor, 6 m in diameter and 4 m in
height was modeled in this study. The capacity of the storage bin was approximately 140
m3 (90 tonne for corn). It was assumed that the bin was filled with 14% moisture content
corn, except for a spoilage spot. The spoiling corn was assumed to be a cylinder with 1
m in diameter and 0.3 m in height, located in the center of the steel bin (Figure B1). The
spoiling corn was assumed to have a moisture content of 22%, with a high respiration rate
of 1.25 × 10⁻⁴
mole/m3·s according to the measured data in Figure 16. For initial
conditions, the temperature in the entire storage bin was assumed to be a uniform 15 °C,
and the CO2 concentration was assumed to be the same as that in the ambient air of 400
ppm (0.0176 mol/m3).
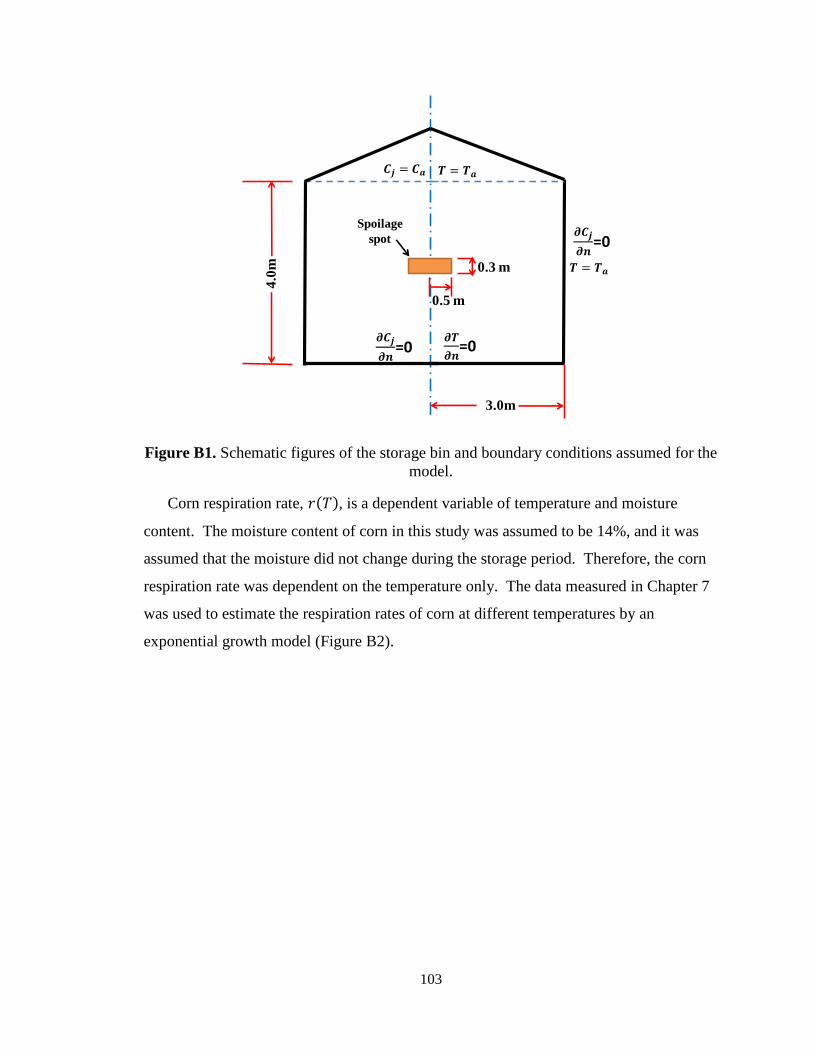
103
Figure B1. Schematic figures of the storage bin and boundary conditions assumed for the
model.
Corn respiration rate, ( ), is a dependent variable of temperature and moisture
content. The moisture content of corn in this study was assumed to be 14%, and it was
assumed that the moisture did not change during the storage period. Therefore, the corn
respiration rate was dependent on the temperature only. The data measured in Chapter 7
was used to estimate the respiration rates of corn at different temperatures by an
exponential growth model (Figure B2).
3.0m
4.0
m
=0
=0
=0
0.5 m
0.3 m
Spoilage
spot
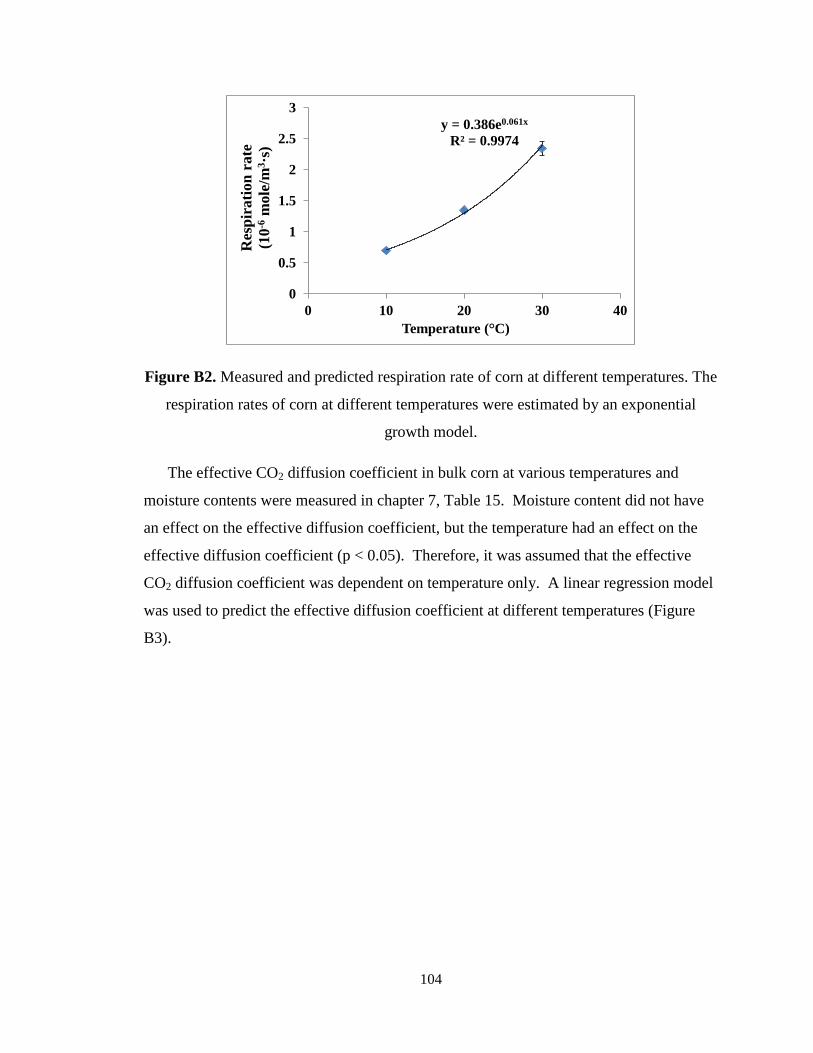
104
Figure B2. Measured and predicted respiration rate of corn at different temperatures. The
respiration rates of corn at different temperatures were estimated by an exponential
growth model.
The effective CO2 diffusion coefficient in bulk corn at various temperatures and
moisture contents were measured in chapter 7, Table 15. Moisture content did not have
an effect on the effective diffusion coefficient, but the temperature had an effect on the
effective diffusion coefficient (p < 0.05). Therefore, it was assumed that the effective
CO2 diffusion coefficient was dependent on temperature only. A linear regression model
was used to predict the effective diffusion coefficient at different temperatures (Figure
B3).
y = 0.386e0.061x
R² = 0.9974
0
0.5
1
1.5
2
2.5
3
0 10 20 30 40
Res
pir
ati
on
rate
(10
-6m
ole
/m3·s
)
Temperature ( C)
105
Figure B3. Measured and predicted CO2 effective diffusion coefficient through bulk corn
at different temperatures.
The concrete floor of the bin and steel bin wall were assumed to be impermeable to
CO2 diffusion. Thus, the boundary conditions for the bin floor and wall were expressed as:
(B6)
In reality, the top surface of the grain is open to atmosphere under a ventilated roof. Due
to the high diffusivity of CO2 in air, it is reasonable to assume that CO2 leaving the top
surface of the grain diffuses away instantaneously. Therefore, the CO2 boundary
condition for the top surface of the grain was expressed as:
(B7)
where is the CO2 concentration in the atmosphere, which equals to 400 ppm (0.0176
mol/m3). The temperature of the bin wall and the top grain surface was specified to be
the same as the varying atmosphere temperature ( ). The temperature boundary
condition for the bin wall was expressed as:
( ) (B8)
y = 0.027x + 2.937
R² = 1.000
3
3.2
3.4
3.6
3.8
4
0 10 20 30 40
CO
2ef
fect
ive
dif
fusi
vit
y
(10
-6m
2/s
)
Temperature ( C)
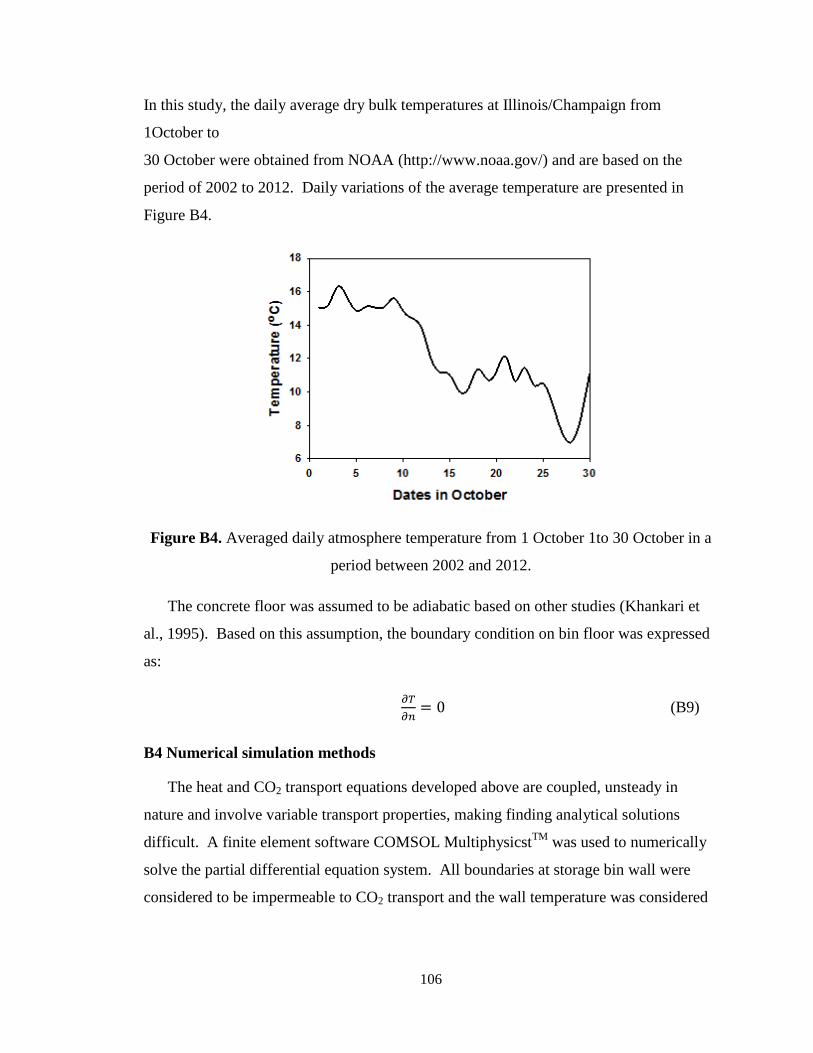
106
In this study, the daily average dry bulk temperatures at Illinois/Champaign from
1October to
30 October were obtained from NOAA (http://www.noaa.gov/) and are based on the
period of 2002 to 2012. Daily variations of the average temperature are presented in
Figure B4.
Figure B4. Averaged daily atmosphere temperature from 1 October 1to 30 October in a
period between 2002 and 2012.
The concrete floor was assumed to be adiabatic based on other studies (Khankari et
al., 1995). Based on this assumption, the boundary condition on bin floor was expressed
as:
(B9)
B4 Numerical simulation methods
The heat and CO2 transport equations developed above are coupled, unsteady in
nature and involve variable transport properties, making finding analytical solutions
difficult. A finite element software COMSOL MultiphysicstTM
was used to numerically
solve the partial differential equation system. All boundaries at storage bin wall were
considered to be impermeable to CO2 transport and the wall temperature was considered
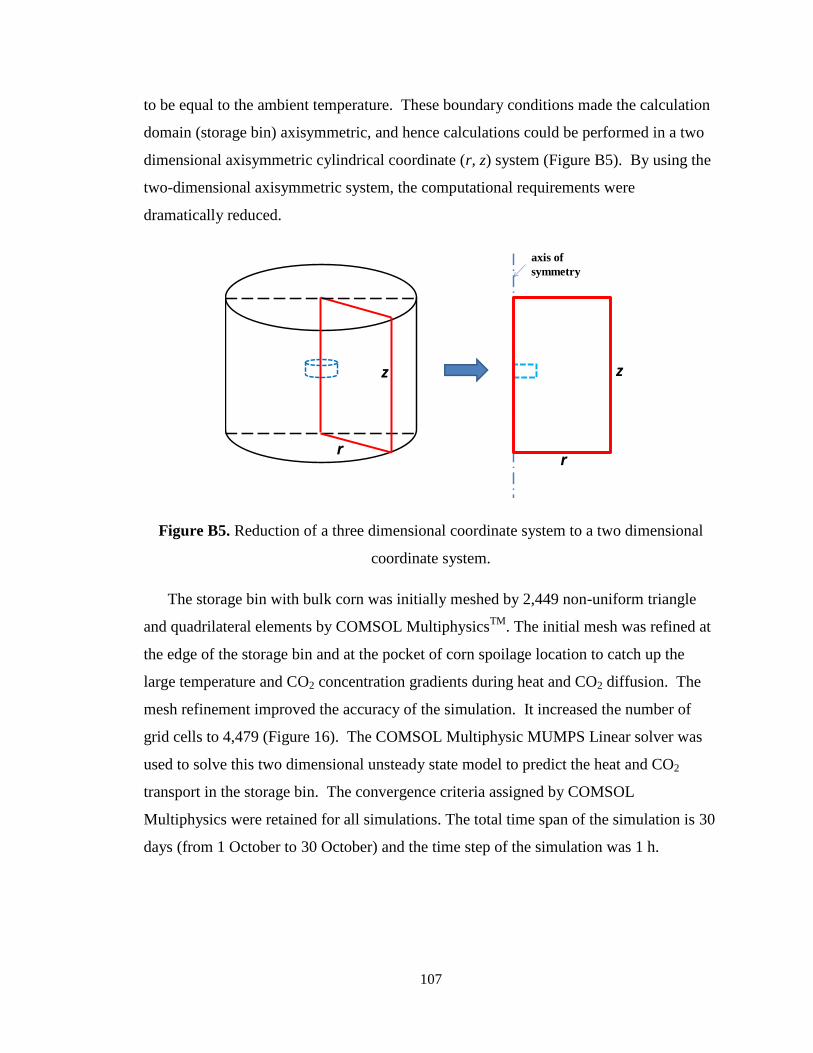
107
to be equal to the ambient temperature. These boundary conditions made the calculation
domain (storage bin) axisymmetric, and hence calculations could be performed in a two
dimensional axisymmetric cylindrical coordinate (r, z) system (Figure B5). By using the
two-dimensional axisymmetric system, the computational requirements were
dramatically reduced.
Figure B5. Reduction of a three dimensional coordinate system to a two dimensional
coordinate system.
The storage bin with bulk corn was initially meshed by 2,449 non-uniform triangle
and quadrilateral elements by COMSOL MultiphysicsTM
. The initial mesh was refined at
the edge of the storage bin and at the pocket of corn spoilage location to catch up the
large temperature and CO2 concentration gradients during heat and CO2 diffusion. The
mesh refinement improved the accuracy of the simulation. It increased the number of
grid cells to 4,479 (Figure 16). The COMSOL Multiphysic MUMPS Linear solver was
used to solve this two dimensional unsteady state model to predict the heat and CO2
transport in the storage bin. The convergence criteria assigned by COMSOL
Multiphysics were retained for all simulations. The total time span of the simulation is 30
days (from 1 October to 30 October) and the time step of the simulation was 1 h.
r
z
r
z
axis of
symmetry
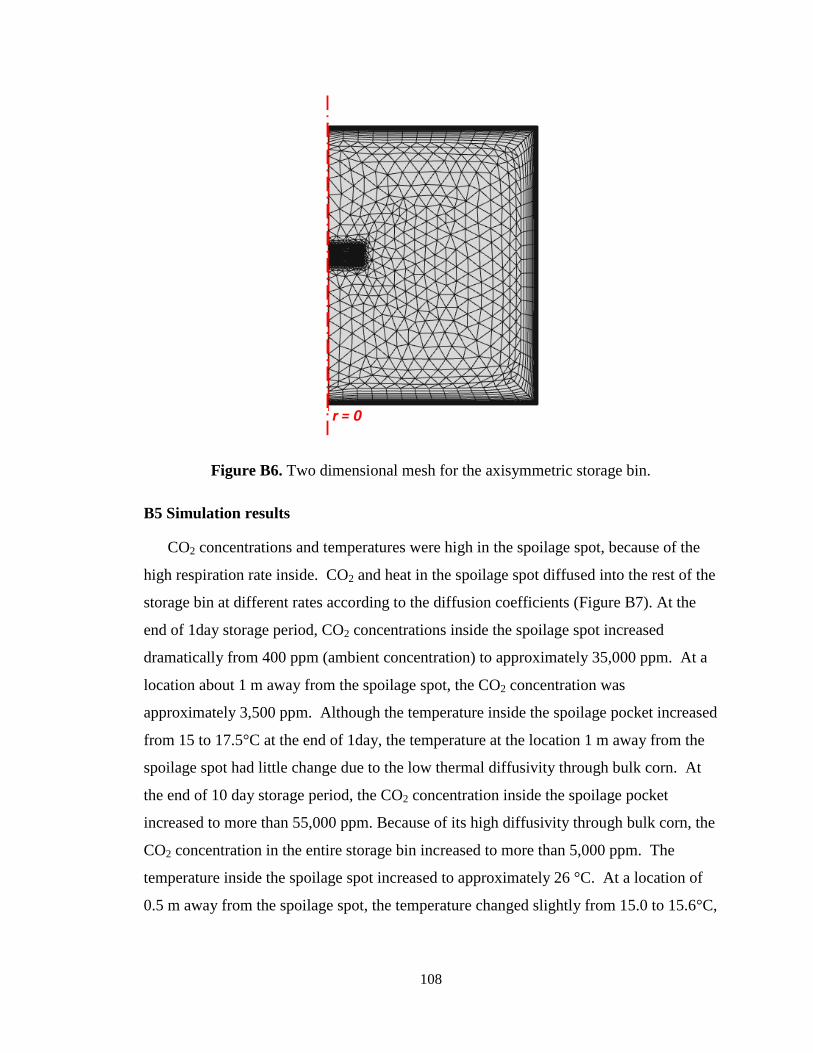
108
Figure B6. Two dimensional mesh for the axisymmetric storage bin.
B5 Simulation results
CO2 concentrations and temperatures were high in the spoilage spot, because of the
high respiration rate inside. CO2 and heat in the spoilage spot diffused into the rest of the
storage bin at different rates according to the diffusion coefficients (Figure B7). At the
end of 1day storage period, CO2 concentrations inside the spoilage spot increased
dramatically from 400 ppm (ambient concentration) to approximately 35,000 ppm. At a
location about 1 m away from the spoilage spot, the CO2 concentration was
approximately 3,500 ppm. Although the temperature inside the spoilage pocket increased
from 15 to 17.5°C at the end of 1day, the temperature at the location 1 m away from the
spoilage spot had little change due to the low thermal diffusivity through bulk corn. At
the end of 10 day storage period, the CO2 concentration inside the spoilage pocket
increased to more than 55,000 ppm. Because of its high diffusivity through bulk corn, the
CO2 concentration in the entire storage bin increased to more than 5,000 ppm. The
temperature inside the spoilage spot increased to approximately 26 °C. At a location of
0.5 m away from the spoilage spot, the temperature changed slightly from 15.0 to 15.6°C,
r = 0
109
which is difficult to be detected with temperature sensors, such as a thermal couples
typically used in grain bins. Thermocouples have a typical accuracy of ± 2 °C. At the
end of 3- day storage period, the temperature near the bin boundaries decreased due to the
decreasing ambient temperature in late October. However, the temperature inside the
spoilage spot kept increasing due to the large amount of heat produced by respiration.
The temperature in the spoilage spot reached to 31 °C although the ambient temperature
was only 8 °C. The large temperature gradient between the inside bin and outside bin
boundaries would increase the heat conduction. The CO2 concentration in the entire
storage bin increased to more than 6,000 ppm. Overall, CO2 diffused much faster in the
storage bin than heat. The simulation results in this study agree with the report published
by Singh and Wallace (1965), who stated that a single temperature measurement must be
within about 0.5 m of an active spoilage spot to detect the grain spoilage. Further, Ileleji
et al. (20006) conducted field study by comparing CO2 concentrations and temperatures
monitoring and concluded that temperature cables alone was not a reliable indicator of
stored grain conditions and CO2 sensors could be used as an additional complimentary
tool for stored grain management.
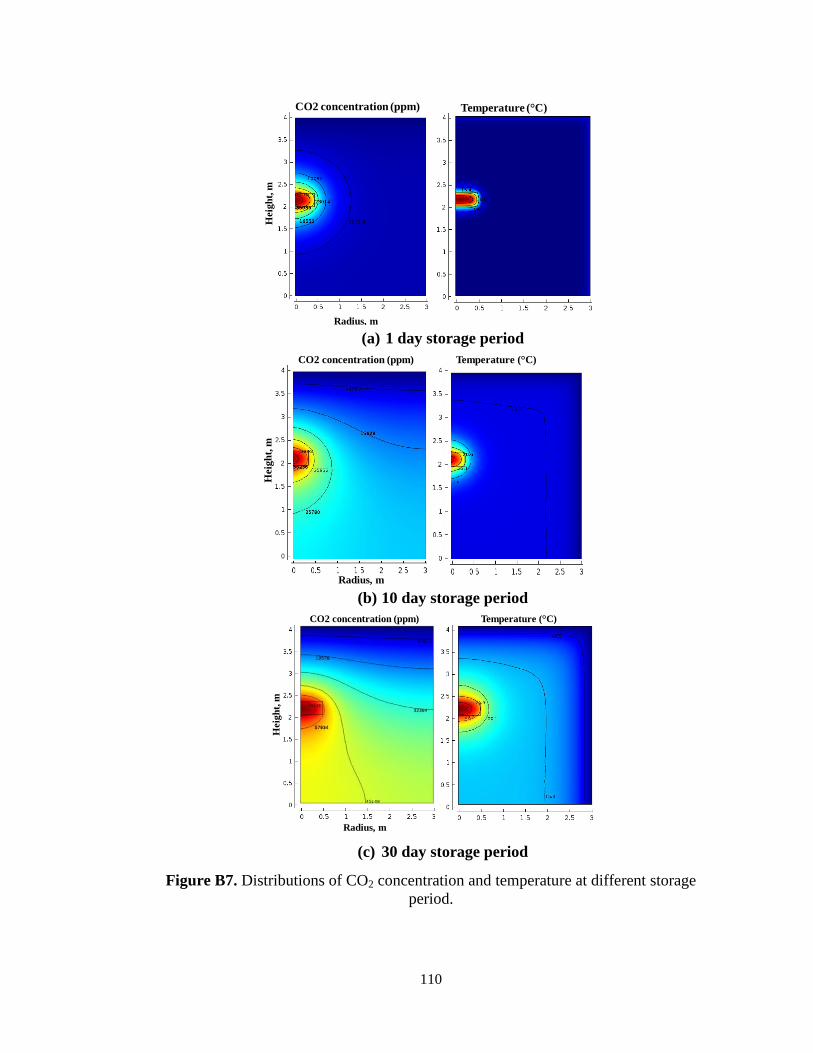
110
(a) 1 day storage period
(b) 10 day storage period
(c) 30 day storage period
Figure B7. Distributions of CO2 concentration and temperature at different storage
period.
Heig
ht,
m
Radius, m
CO2 concentration (ppm) Temperature ( C)
Heig
ht,
m
Radius, m
CO2 concentration (ppm) Temperature ( C)
Heig
ht,
m
Radius, m
CO2 concentration (ppm) Temperature ( C)