characterization and removal of filter cake …
TRANSCRIPT

CHARACTERIZATION AND REMOVAL OF FILTER CAKE GENERATED BY
ILMENITE WATER-BASED DRILLING FLUIDS
A Thesis
by
JIANPING SU
Submitted to the Office of Graduate and Professional Studies of
Texas A&M University
in partial fulfillment of the requirements for the degree of
MASTER OF SCIENCE
Chair of Committee, Hisham Nasr-El-Din
Committee Members, Jerome Schubert
Mahmoud El-Halwagi
Head of Department, A. Daniel Hill
August 2016
Major Subject: Petroleum Engineering
Copyright 2016 Jianping Su

ii
ABSTRACT
With the development of the oil and gas industry, people started to drill deeper
wells to get oil and gas. New weighting materials have been developed to help solve the
problem caused by the most commonly used barite. Ilmenite is among one of those with
higher specific gravity. It can achieve the same density with adding less weighting
materials than using barite. Less solids content in drilling fluid is an advantage in
rheological properties. Recently, micronized ilmenite has again been tested in labs, after
resolving the abrasiveness and magnetic problem that normal ilmenite created. Due to the
composition of ilmenite, iron is likely to precipitate in acidic condition and cause
formation damage when using acid to remove the filter cake.
The effectiveness of using lower concentration of hydrochloric acid (HCl) as well
as using 7.5 wt% HCl and 7.5 wt% hydroxyethyl ethylenediamine triacetic acid (HEDTA)
to remove the filter cake generated by ilmenite water-based drilling fluids were
investigated. To prepare the ilmenite water-based muds, a high speed mixer was used.
After preparing the fluid, the filter cake was generated by high pressure high temperature
(HP/HT) filter press at 300 psi and 250°F on a sandstone core with 2.5 in. diameter and 1
in. thickness. Cores with filter cakes were computerized tomography (CT) scanned. Then,
the filter cake was soaked with HCl and HCl + HEDTA for several hours. After removal,
cores with remaining filter cakes were CT scanned again and compare with the initial.
Solutions after reaction were analyzed by inductively coupled plasma (ICP) to determine
different cation concentrations. Scanning electron microscopy-energy dispersive

iii
spectroscopy (SEM-EDS) was used to analyze the filter cake, as well as the residual filter
cake.
The results showed that lower concentration of HCl cannot completely remove the
filter cake generated by ilmenite water-based drilling fluids. With limited volume of the
acid, higher concentration of HCl, which can increase the initial acid to ilmenite ratio, will
be more efficient to remove the filter cake generated by ilmenite water-based drilling
fluids.

iv
ACKNOWLEDGEMENTS
I thank my committee chair, Dr. Nasr-El-Din, and my committee members, Dr.
Schubert, and Dr. El-Halwagi, for their guidance and support throughout my study at
Texas A & M University. Thanks for Gia Alexander for proofreading this thesis.
Thanks also my colleagues and the department faculty and staff for making my life
at Texas A&M University a memorable experience.
Finally, thanks to my girlfriend, and my parents for their love and support.

v
TABLE OF CONTENTS
Page
ABSTRACT .......................................................................................................................ii
ACKNOWLEDGEMENTS .............................................................................................. iv
TABLE OF CONTENTS ................................................................................................... v
LIST OF FIGURES ........................................................................................................... vi
LIST OF TABLES ......................................................................................................... viii
CHAPTER I INTRODUCTION AND LITERATURE REVIEW ................................... 1
1.1 Development of Ilmenite as a Weighting Material .............................................. 1 1.2 Reaction between Ilmenite and Acid .................................................................... 5 1.3 Application of CT Scan in Removing the Filter Cake ......................................... 7
1.4 Removal of the Ilmenite Filter Cake .................................................................... 8 1.5 Research Objective ............................................................................................... 9
CHAPTER II EXPERIMENTAL STUDIES .................................................................. 11
2.1 Materials ............................................................................................................. 11
2.2 Equipment and Procedures ................................................................................. 12
CHAPTER III RESULTS AND DISCUSSION .............................................................. 15
3.1 Rheological Properties ....................................................................................... 15
3.2 HP/HT Static Filtration ...................................................................................... 16 3.3 Characterization of the Filter Cake .................................................................... 17
3.4 Filter Cake Removal ........................................................................................... 26
CHAPTER IV CONCLUSIONS AND RECOMMENDATIONS ................................. 38
REFERENCES ................................................................................................................. 40
vi
LIST OF FIGURES
Page
Fig. 1 - Chemical structure of HEDTA. ........................................................................... 11
Fig. 2 - HP/HT static filtration curve on Bandera sandstones at 300 psi and
200/250ºF. ......................................................................................................... 17
Fig. 3 - Measurement of the thickness of the filter cake using CT scan. ......................... 18
Fig. 4 - Left: Bandera sandstone core with filter cake after static filtration;
right: two layers of filter cakes under CT scan. ................................................ 19
Fig. 5 - Left: Berea sandstone core with filter cake after static filtration;
Right: two layers of filter cakes under CT scan. .............................................. 20
Fig. 6 - EDS analysis of unreacted upper filter cake. ....................................................... 22
Fig. 7 - EDS analysis of unreacted lower filter cake. ....................................................... 22
Fig. 8 - SEM of upper filter cake (location one) with X300 magnification. .................... 24
Fig. 9 - SEM of lower filter cake (location one) with X300 magnification. .................... 24
Fig. 10 - SEM of upper filter cake (location two) with X500 magnification. .................. 25
Fig. 11 - SEM of lower filter cake (location two) with X500 magnification. .................. 25
Fig. 12 - Left: Filter cake after static filtration at 300 psi and 250ºF;
middle: filter cake after soaking with 7.5 wt% HCl at 300 psi
and 250ºF; right: filter cake after drying at 212ºF for three hours.................... 27
Fig. 13 - Left: 3-D model of the CT image after static filtration; 3-D model
of the CT image after treating with 7.5 wt% HCl. ............................................ 27
Fig. 14 - Left: filter cake after static filtration; remaining filter cake after
soaking with 7.5 wt% HCl and 7.5 wt% HEDTA for 6 hours. ......................... 30
Fig. 15 - Left: CT scan of the filter cake after static filtration; CT scan of
the remaining filter cake after soaking with 7.5 wt% HCl and 7.5
wt% HEDTA for 6 hours. ................................................................................. 30
Fig. 16 - Left: solution before reaction with 7.5 wt% HCl and 7.5 wt%
HEDTA; right: solution after reaction with 7.5 wt% HCl and 7.5
wt% HEDTA. ................................................................................................... 32

vii
Fig. 17 - SEM of the remaining filter cake (location one) with X100
magnification. ................................................................................................... 33
Fig. 18 - SEM of remaining filter cake (location two) with X300
magnification. ................................................................................................... 34
Fig. 19 - SEM of remaining filter cake (location three) with X200
magnification. ................................................................................................... 34
Fig. 20 - EDS analysis of location two. ............................................................................ 35
Fig. 21 - EDS analysis of location three. .......................................................................... 36

viii
LIST OF TABLES
Page
Table 1 - Mechanical properties between hematite, ilmenite, Fer-O-BAR
with barite (Haaland et al. 1976). ....................................................................... 3
Table 2 - Ilmenite Water-based Drilling Fluid Formula (Elkatakty et al. 2013a). ........... 12
Table 3 - Properties of ilmenite water-based drilling fluid. ............................................. 15
Table 4 - Comparison of thickness of filter cake by CT scan and Vernier Caliper. ........ 18
Table 5 - Different elemental compositions and concentrations of the
upper and lower filter cake. .............................................................................. 23
Table 6 - Weight difference of the core when using HCl. ............................................... 27
Table 7 - Values of pH and density before and after treatment with 7.5
wt% HCl and 7.5 wt% HEDTA. ....................................................................... 29
Table 8 - Wet different of the core when using HCl with HEDTA ................................. 29
Table 9 - Cation concentration in solution after reaction with 7.5 wt% HCl
and 7.5 wt% HEDTA. ....................................................................................... 32
Table 10 - Elemental composition of the filter press cell (stainless steel 316). ............... 33
Table 11 - Left: elemental composition of location one; right: elemental
composition of location two. ............................................................................ 35

1
CHAPTER I
INTRODUCTION AND LITERATURE REVIEW
1.1 Development of Ilmenite as a Weighting Material
Engineers mostly drill the wells overbalance in order to prevent well kick and even
blowout. Weighting materials help to increase the density of the drilling fluid and thus
elevate the hydrostatic pressure of the mud over formation pressure. API barite is the most
commonly used weighting material (Al-Bagoury and Steele 2012); however, it is not
applicable for all conditions. When using high density drilling fluid weighted with barite,
rheological properties become a serious issue. In addition, the filter cake generated by
barite cannot be removed by HCl. Different iron containing materials have been used in
the oil industry since the 1970s.
Menzel (1973) introduced FER-O-BAR (synthetic iron oxide, manufactured from
pyrite). It has been tested both in the lab and the field. Conclusions were drawn by
comparing FER-O-BAR with barite:
1. Higher specific gravity (4.7 over 4.2),
2. Abrasivity is similar or lower, and lower than natural iron oxide,
3. Good rheology property in heavy oil and water-based mud,
4. Acid removable up to 85% by HCl,
5. Lower sag rate, and
6. Separate by magnetic process from the mud while not influencing the drilling
or logging.

2
The average particle size was approximately 10 µm. The reason that it is not widely used
today may be due to its high cost and limited production.
To dissolve all the weighting materials in the drilling fluids, Sloan et al. (1975)
introduced iron carbonate (Siderite), FeCO3, which can be removed by both HCl and
formic acid. Gravity and hardness of the iron carbonate were similar to barite. It can be
used for both water-based and oil-based mud and can increase the density up to 19 lb/gal.
Permeability after removal by using iron carbonate was higher than using other weighting
materials, such as barite, barite with iron carbonate, or barite with calcium carbonate. In
theory, the reaction product of iron carbonate with acid is ferrous iron, which will
precipitate at a pH of 6-7 at room temperature. But during the drilling process, there will
be fresh fluid coming from the surface which will carry oxygen. Ferrous can then be
oxidized to ferric, which will precipitate earlier at a pH of 1-2 at room temperature (Taylor
et al. 1999).
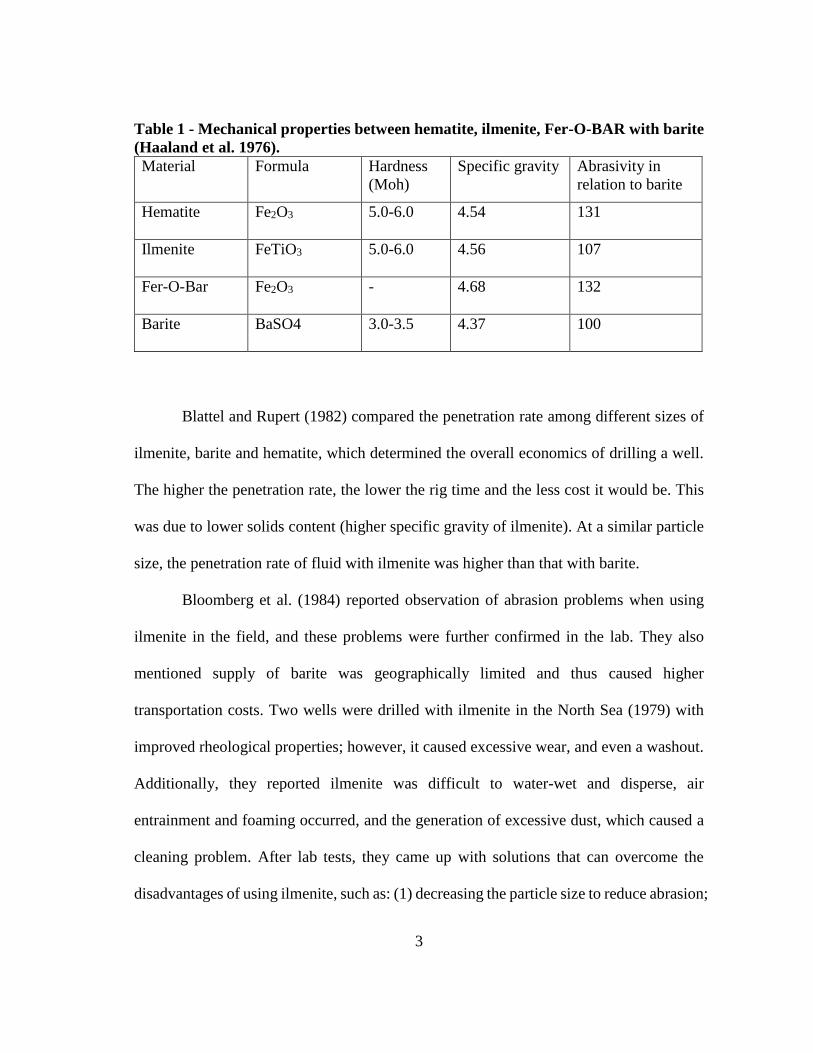
Haaland et al. (1976) compared hematite, ilmenite and FER-O-BAR with barite
(Table 1). The specific gravity of iron oxide is higher than barite, which means to achieve
the same density, less weighting materials can be used. The hardness and abrasivity of
iron oxide are higher than barite, which may add additional cost to the drilling process.
3
Table 1 - Mechanical properties between hematite, ilmenite, Fer-O-BAR with barite
(Haaland et al. 1976).
Material Formula Hardness
(Moh)
Specific gravity Abrasivity in
relation to barite
Hematite Fe2O3 5.0-6.0 4.54 131
Ilmenite FeTiO3 5.0-6.0 4.56 107
Fer-O-Bar Fe2O3 - 4.68 132
Barite BaSO4 3.0-3.5 4.37 100
Blattel and Rupert (1982) compared the penetration rate among different sizes of
ilmenite, barite and hematite, which determined the overall economics of drilling a well.
The higher the penetration rate, the lower the rig time and the less cost it would be. This
was due to lower solids content (higher specific gravity of ilmenite). At a similar particle
size, the penetration rate of fluid with ilmenite was higher than that with barite.
Bloomberg et al. (1984) reported observation of abrasion problems when using
ilmenite in the field, and these problems were further confirmed in the lab. They also
mentioned supply of barite was geographically limited and thus caused higher
transportation costs. Two wells were drilled with ilmenite in the North Sea (1979) with
improved rheological properties; however, it caused excessive wear, and even a washout.
Additionally, they reported ilmenite was difficult to water-wet and disperse, air
entrainment and foaming occurred, and the generation of excessive dust, which caused a
cleaning problem. After lab tests, they came up with solutions that can overcome the
disadvantages of using ilmenite, such as: (1) decreasing the particle size to reduce abrasion;

4
and (2) reducing the flotation chemicals during production (either by treating with sodium
silica and caustic or gravimetric) to solve the hydrophobic character.
Fjogstad et al. (2000) and Saasen et al. (2001) reported using ilmenite as a
weighting material offshore in northern Norway. They further decreased the mean particle
size from an average 50 microns to 10 microns and got acceptable erosion rates especially
for water-based drilling fluid. They substituted ilmenite for in consideration of less heavy
metals and are less harmful to the environment. This ilmenite drilling fluid gave good
rheological and fluid-loss properties during drilling, as well as a low tendency to separate
or sag (stable density). The black color of ilmenite made the weighting material easier to
identify. Abrasion was observed in MWD tools, which was caused by using thinner fluids.
Abrasion problem in a dry bulk system was increased due to more homogenous particle
size and can be reduced by a reduction of the transfer speed.
Amighi and Shahbazi (2010) recommended rather than using barite, using ilmenite
or manganese tetraoxide for HP/HT drilling operations and high-angle wells. They
concluded that ilmenite is more suitable than barite on an overall perspective.
Al-Bagoury and Steele (2012) and Al-Bagoury (2014) showed that a new
micronized ilmenite can be used with both water-based and oil-based drilling fluids for
difficult drilling conditions and fluid requirement. This new ilmenite had an even smaller
average particle size 5 µm. Abrasion problem was solved by removing the coarse
materials and the magnetic problem was solved by the removal of a very small amount of
magnetic component from the ilmenite sample. Results showed with lower plastic
5
viscosity, medium sag problem, and large fluid loss volume compared with using API
barite. The reason is due to the wide size distribution of barite.
Elkatatny et al. (2012) optimized the rheology properties of the ilmenite water-
based mud, as well as pH, which gave stable dispersion, thermal stability under hot roll,
reduce filtration volume, and got a thin filter cake. The formula of the drilling fluid used
in this thesis is based on this paper.
Tehrani et al. (2014) mentioned the unstable supplies and increased need for barite,
which made it more expensive and led to alternatives. Ilmenite and hematite were among
the candidates. However, the natural magnetic characteristics of these weighting materials
could affect downhole tools that were used to measure the earth’s magnetic field direction,
as well as other magnetic tools. Their work combined abrasiveness with magnetic
characteristics, to show their effect on the drilling fluid properties.
1.2 Reaction between Ilmenite and Acid
Ilmenite is mainly composed of FeTiO3 and reacts with HCl (Olanipekun, 1999):
FeTiO3 + 4HCl → FeCl2 + TiOCl2 + 2H2O -------------------- (1)
The problem with the dissolution of ilmenite is iron. Iron can precipitate under acidic
condition. Smith et al. (1969) found iron (III) precipitate at a pH of 2. Taylor et al. (1999)
did experiments and showed iron hydroxide precipitated at a pH 1 and the reaction was
almost complete at 2 at room temperature. Precipitation will occur even earlier at higher
temperatures. By adding HCl, the filter cake can be dissolved, but this cause iron
precipitation which can induce formation damage.
6
Olanipekun (1999) investigated different factors that can affect the reaction with
ilmenite and HCl. He concluded that stirring had no effect on the reaction, particle size
was inversely proportional to the reaction and acid concentration and temperature had
significant effect on the reaction. Olanipekun further pointed out that titanium ions formed
polynuclear species, [(TiO)8(OH)12]4+ and titanium oxide could be precipitated by
hydrolysis of titanium ions in the solution.
After presenting a thorough literature review, Van Dyk et al. (2002) proposed a
new mechanism of ilmenite react with HCl. The rate of chemical reaction controlled the
first period, in which both iron and titanium could go to solution. Next, titanium species
that formed in the solution (polymerization of titanium) determined the reaction. This
process depended on the initial acid to ilmenite mole ratio. The last determining factor of
the reaction was the reaction product that formed (TiOCl2). It could precipitate in the pores
of the ilmenite or as fines in the leach solution. They recommended using higher initial
acid to ilmenite mole ratio to delay the polymerization of titanium and form fine particles
in the solution.
Borhan and Nee (2015) discussed the reaction of ilmenite with H2SO4. The
researchers tried to remove iron only and to yield only TiO2. They found that with the
increasing reaction time, polymeric species would be destroyed and thus enhance the
formation of multinuclear complexes of titanium [TiO2(OH)3]+ and Ti4O6(OH)3]
+, which
would lead to more titanium dissolution. They also concluded that higher temperature
increased the instability of titanium, enhanced its polymerization.

7
1.3 Application of CT Scan in Removing the Filter Cake
In this thesis, CT scan will help to aid characterize the filter cake generated with
ilmenite water-based mud. Wellington and Vinegar (1987) summarized the use of X-Ray
Computerized Tomography as it applies to petroleum engineering studies. It was
originally used in hospitals to help doctors see inside patients’ bodies. The technique first
came into being in 1972. The inventor, Godfrey Hounsfield received Noble prize. The
petroleum industry first began using CT during the 1980s in petrophysics and reservoir
engineering. A CT scan can complete in a few seconds with accuracy. As for drilling fluid
area, CT scan can be applied to characterize of the core materials and visualize mud
invasion.
In recent years, Elkatatny et al. (2012) used the CT scan method to determine filter
cake properties of water-based drilling mud. Bentonite water-based mud was weighted
with calcium carbonate. Through CT scan, the filter cake contained two layers. The
internal and external parts of the filter cake were different in thickness and porosity and
components. The different components of the two layers became a serious issue when
dealing with a removal process. The layer closer to the disk contained calcium carbonate,
which reacts easily with hydrochloric acid. The layer closer to the drilling mud contained
materials which cannot be easily removed by HCl. It is necessary to remove this layer
before using HCl to remove layers closer to the disk.
CT scan facilitates the measurement of the thickness of the filter cake. In the past,
after HP/HT static filtration, the thickness of the filter cake was measured by Vernier
Caliper. This method proved less accurate and the accuracy depended on the skills of the

8
person who conducted the experiments. Sometimes, a Vernier Caliper also damaged the
filter cakes if the person touched the surface of the filter cake with it by mistake. Even
though, other methods were developed as summarized in Bageri et al. (2013), they proved
time consuming and complicated. With CT scan, the thickness of the filter is only one of
the useful pieces of information that can be received in those few seconds, with the most
accuracy and no damage to the filter cakes.
1.4 Removal of the Ilmenite Filter Cake
Filter cake is generated during the drilling process. Small particles, usually called
bridging materials and most likely calcium carbonate, go into pores in the rock. As a
consequence, fluid starts to build a thin layer on the surface of the rock. This thin and
strong layer of filter cake can prevent additional fluid from entering the formation. This
thin layer of filter cake can also reduce incompatible fluids going deep into the formation,
which can cause formation damage. After drilling, it is necessary to remove this thin layer
of filter cake to control formation damage. Different drilling fluids with different
weighting materials, such as ilmenite have unique advantages in their rheological
properties. These fluids are better at drilling (lower solid content, stable density and
viscosity), and cause few problem. However, filter cake generated by these fluids is hard
to remove.
Limited work has been done to date on the effective removal of the ilmenite filter
cake. HCl at lower concentration (5 wt%) was used to remove filter cake generated by
ilmenite weighted water-based mud (Elkatatny et al. 2013b). Chelating agent and glycolic

9
acid have also been tested independently. The conclusions drawn at that time were that
either chelating agent or glycolic acid alone was not effective in removing filter cake
generated by ilmenite water-based mud.
Xiao et al. (2015) removed ilmenite filter cakes based on oil-based mud. The
difference between water-based muds and oil-based muds is the wettability of the filter
cake. The difference of removing the filter cake by oil based mud involves first using
mutual solvent to change the oil-wet filter cake to water-wet filter cake, and then following
the same procedure. The results show that to remove the filter cake, a higher concentration
of HCl (10-15 wt%) should be used.
1.5 Research Objective
The objective is to evaluate the effectiveness of HCl at a lower concentration (7.5
wt%) to remove the filter cake generated by ilmenite water-based drilling fluids. In
addition, 7.5 wt% HEDTA was also added to stabilize cations, especially iron. HEDTA,
as one of the chelating agents, could react with cations that has two or three positive
charges and form complexes, which are soluble in water.
In order to achieve these objectives, ilmenite water-based drilling fluid was
prepared at room temperature. Rheological properties were measured with a Grace M3600
viscometer. Density was measured by a Baroid mud balance. HP/HT static filtration filter
press were used to generate filter cake by ilmenite water-based drilling fluid at 250ºF and
300 psi. CT scan wsd used to characterize the filter cake generated by ilmenite water-
10
based drilling fluid. SEM-EDS was used to visualize and determine the composition of
the filter cake.
Acid was prepared and mixed with corrosion inhibitor. Density and pH were
measured. The combination then soaked with the core and the filter cake inside the filter
press for four or six hours. Solutions after reaction were collected. pH and density were
measured again. Solution were filtered and diluted and analyzed by ICP to determine
different amount of cations. The remaining filter cake was analyzed by SEM-EDS to
determine the composition.
11
CHAPTER II
EXPERIMENTAL STUDIES
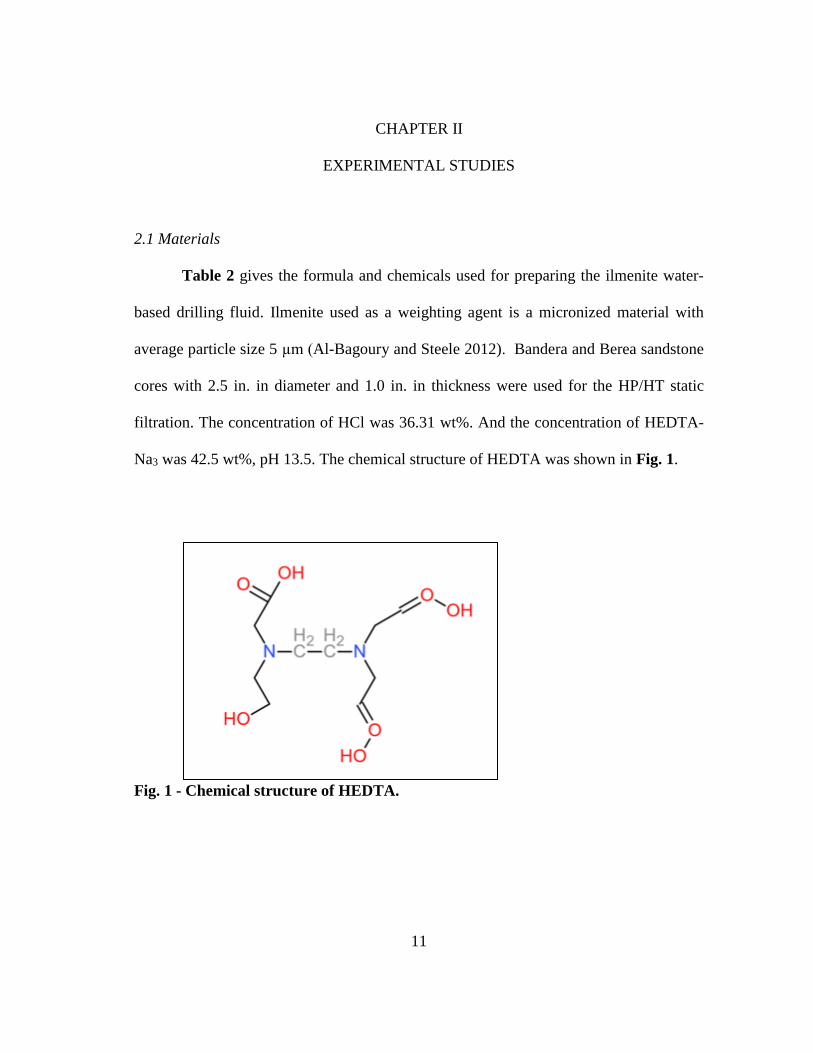
2.1 Materials
Table 2 gives the formula and chemicals used for preparing the ilmenite water-
based drilling fluid. Ilmenite used as a weighting agent is a micronized material with
average particle size 5 µm (Al-Bagoury and Steele 2012). Bandera and Berea sandstone
cores with 2.5 in. in diameter and 1.0 in. in thickness were used for the HP/HT static
filtration. The concentration of HCl was 36.31 wt%. And the concentration of HEDTA-
Na3 was 42.5 wt%, pH 13.5. The chemical structure of HEDTA was shown in Fig. 1.
Fig. 1 - Chemical structure of HEDTA.
12
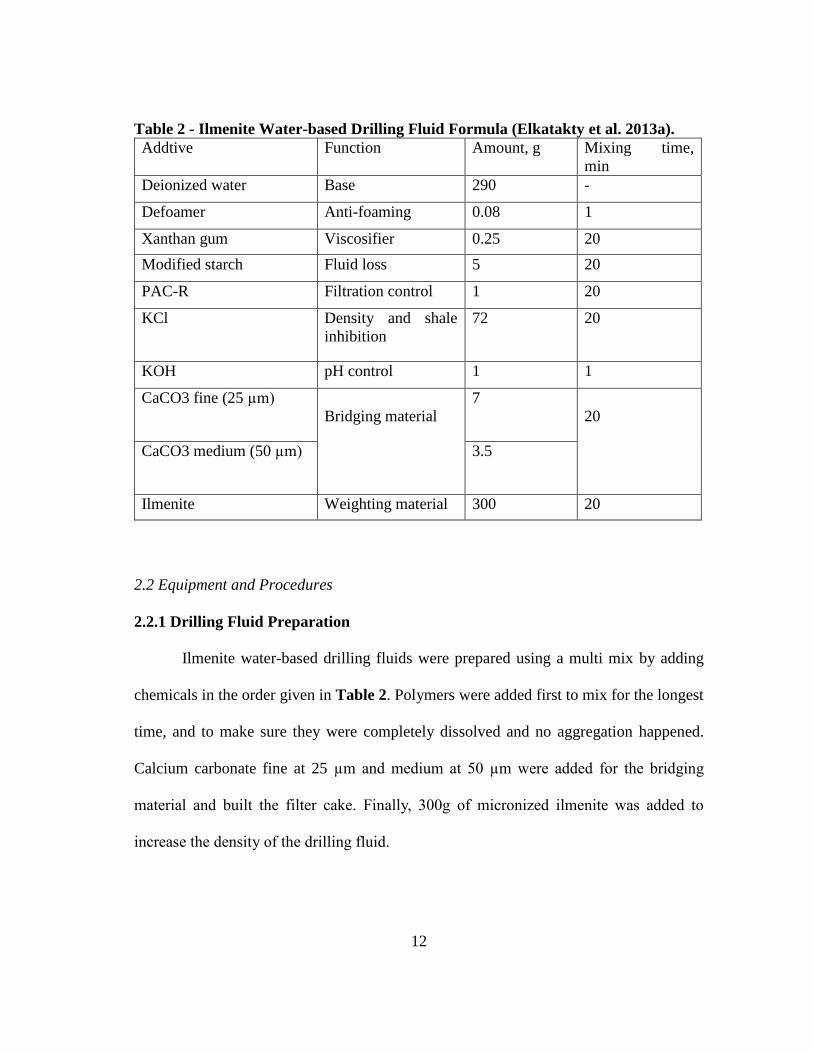
Table 2 - Ilmenite Water-based Drilling Fluid Formula (Elkatakty et al. 2013a).
Addtive Function Amount, g Mixing time,
min
Deionized water Base 290 -
Defoamer Anti-foaming 0.08 1
Xanthan gum Viscosifier 0.25 20
Modified starch Fluid loss 5 20
PAC-R Filtration control 1 20
KCl Density and shale
inhibition
72 20
KOH pH control 1 1
CaCO3 fine (25 µm)
Bridging material
7
20
CaCO3 medium (50 µm) 3.5
Ilmenite Weighting material 300 20
2.2 Equipment and Procedures
2.2.1 Drilling Fluid Preparation
Ilmenite water-based drilling fluids were prepared using a multi mix by adding
chemicals in the order given in Table 2. Polymers were added first to mix for the longest
time, and to make sure they were completely dissolved and no aggregation happened.
Calcium carbonate fine at 25 µm and medium at 50 µm were added for the bridging
material and built the filter cake. Finally, 300g of micronized ilmenite was added to
increase the density of the drilling fluid.

13
2.2.2 Rheological Properties Measurement
Rheological properties were measured with a Grace M3600 viscometer at 120ºF
and atmosphere pressure. RPM at 600, 300, 200, 100, 6, 3 were measured after the
temperature reached the target. 10 s and 10 min gel strength were measured after mixing
the drilling fluid at 600 RPM for 1 minute and then stop and start to count time. Density
was measured using a Baroid mud balance.
2.2.3 Characterization of the Filter Cake
Both Bandera and Berea sandstone cores were used to simulate the formation
downhole. The core was first dried in an oven at 212ºF for three hours and weighted. Then
the core was saturated with 5 wt% KCl to prevented fines migration. After the saturation,
the core was weighted again and numbered.
Static filtration was performed using an Ofite HP/HT filter press at 200/250ºF and
300 psi. The core was wrapped with the sealing tape before putting into the filter press.
After putting the core and the drilling fluid inside the filter press cell, temperature was
added through a heating jacket outside the cell. Then, pressure was added through a valve
from the top. After 30 minutes heating time and then the pilot light turned on, then the
valve under the cell was opened and filtrates were collected via a measuring cylinder. At
the same time of opening the valve, volume at different time was recorded and plotted.
Spurt volume can be derived from the intercept of the curve.
After 30 minutes, the core with the filter cake was taken out of the filter press
carefully. The core with the filter cake was measured again to determine the weight of the
filter cake. The core with the filter cake was CT scanned later.
14
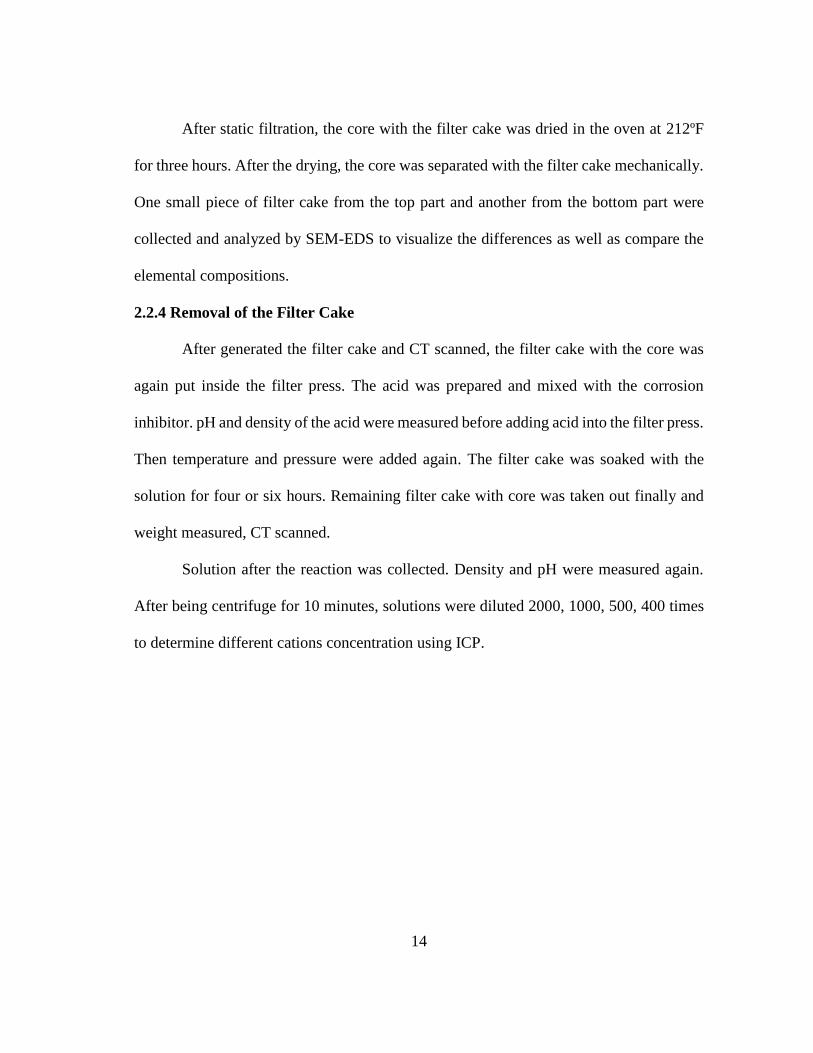
After static filtration, the core with the filter cake was dried in the oven at 212ºF
for three hours. After the drying, the core was separated with the filter cake mechanically.
One small piece of filter cake from the top part and another from the bottom part were
collected and analyzed by SEM-EDS to visualize the differences as well as compare the
elemental compositions.
2.2.4 Removal of the Filter Cake
After generated the filter cake and CT scanned, the filter cake with the core was
again put inside the filter press. The acid was prepared and mixed with the corrosion
inhibitor. pH and density of the acid were measured before adding acid into the filter press.
Then temperature and pressure were added again. The filter cake was soaked with the
solution for four or six hours. Remaining filter cake with core was taken out finally and
weight measured, CT scanned.
Solution after the reaction was collected. Density and pH were measured again.
After being centrifuge for 10 minutes, solutions were diluted 2000, 1000, 500, 400 times
to determine different cations concentration using ICP.
15
CHAPTER III
RESULTS AND DISCUSSION
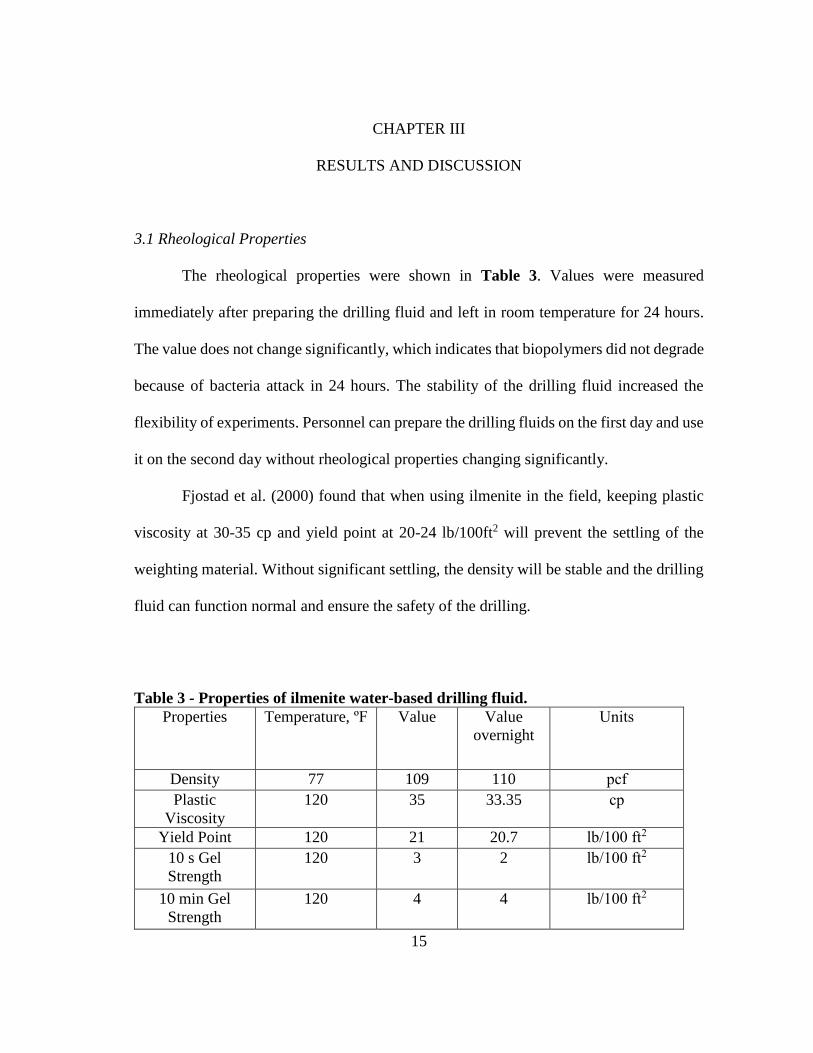
3.1 Rheological Properties
The rheological properties were shown in Table 3. Values were measured
immediately after preparing the drilling fluid and left in room temperature for 24 hours.
The value does not change significantly, which indicates that biopolymers did not degrade
because of bacteria attack in 24 hours. The stability of the drilling fluid increased the
flexibility of experiments. Personnel can prepare the drilling fluids on the first day and use
it on the second day without rheological properties changing significantly.
Fjostad et al. (2000) found that when using ilmenite in the field, keeping plastic
viscosity at 30-35 cp and yield point at 20-24 lb/100ft2 will prevent the settling of the
weighting material. Without significant settling, the density will be stable and the drilling
fluid can function normal and ensure the safety of the drilling.
Table 3 - Properties of ilmenite water-based drilling fluid.
Properties Temperature, ºF Value Value
overnight
Units
Density 77 109 110 pcf
Plastic
Viscosity
120 35 33.35 cp
Yield Point 120 21 20.7 lb/100 ft2
10 s Gel
Strength
120 3 2 lb/100 ft2
10 min Gel
Strength
120 4 4 lb/100 ft2

16
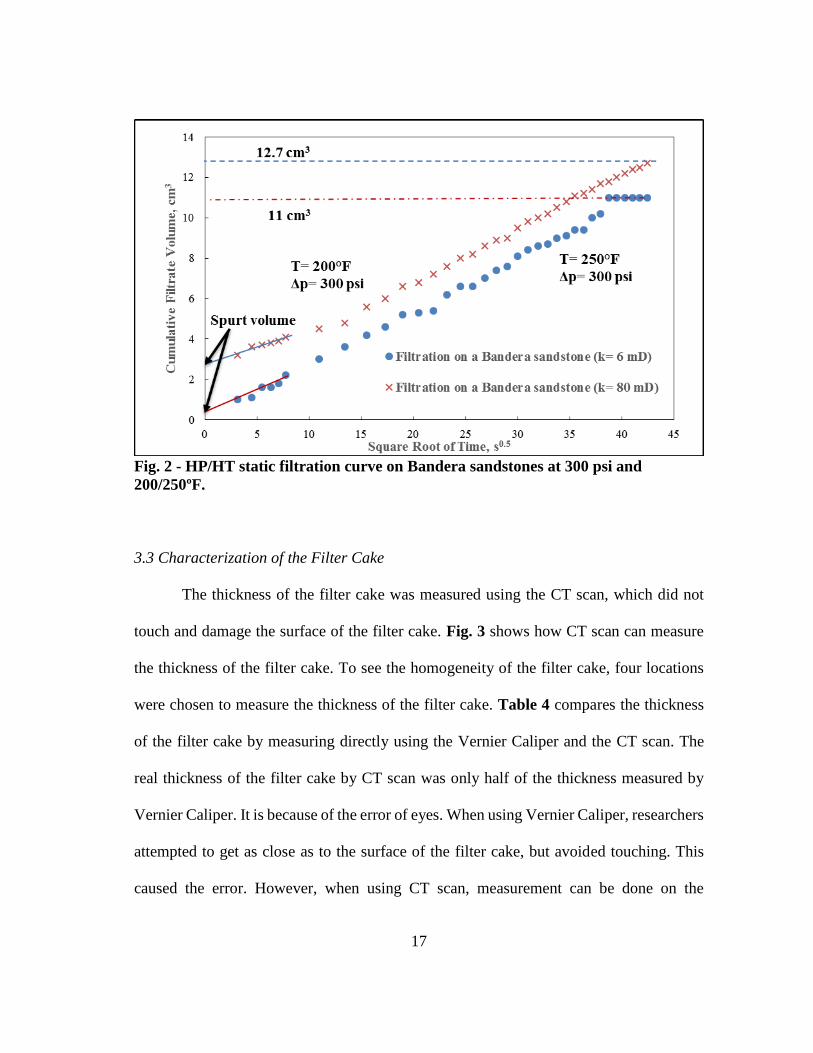
3.2 HP/HT Static Filtration
Fig. 2 shows static filtration under HP/HT condition. The y-axis is the cumulative
filtrate volume in cm3 and the x-axis is the square root of time (s0.5). The two lines
represented static filtration on two different permeability Bandera sandstone cores. The
cumulative filtration volumes for high permeability (k= 80 mD) and low permeability
Bandera sandstone (k= 6 mD) were 12.7 cm3 and 11 cm3 at 300 psi and 200/250ºF. The
intercept on the y-axis was the spurt volume of the drilling fluid. The value represented
the volume that invaded the formation before the filter cake start to builds.
The filtration volume can be related to temperature, permeability of the core and
the particle size of the weighting material in the drilling fluid. With the increasing
temperature, more filtration should be expected. Higher permeability cores can cause more
filtration. Thus, the filtration volume was higher on the higher permeability Bandera
sandstones cores, although with a lower temperature.
For the high permeability Bandera cores, during the filtration process, the
cumulative volume was not a parallel line with the x-axis after 30 minutes, which indicated
the permeability of the formed filter cake was not low enough the stop the filtration. The
drilling fluid formula should be further adjusted when using the mud on a higher
permeability core.
17
Fig. 2 - HP/HT static filtration curve on Bandera sandstones at 300 psi and
200/250ºF.
3.3 Characterization of the Filter Cake
The thickness of the filter cake was measured using the CT scan, which did not
touch and damage the surface of the filter cake. Fig. 3 shows how CT scan can measure
the thickness of the filter cake. To see the homogeneity of the filter cake, four locations
were chosen to measure the thickness of the filter cake. Table 4 compares the thickness
of the filter cake by measuring directly using the Vernier Caliper and the CT scan. The
real thickness of the filter cake by CT scan was only half of the thickness measured by
Vernier Caliper. It is because of the error of eyes. When using Vernier Caliper, researchers
attempted to get as close as to the surface of the filter cake, but avoided touching. This
caused the error. However, when using CT scan, measurement can be done on the

18
computer and without damaging the filter cake. And more importantly, the result is
accurate. The filter cake was firm and thin with the average thickness 0.266 ± 0.013 in.,
which could reduce the risk of pipe sticking during the drilling. Bageri et al. (2013) also
concluded the CT scan was a more accurate method in measuring the thickness of the filter
cake than directly using Vernier Caliper.
Fig. 3 - Measurement of the thickness of the filter cake using CT scan.
Table 4 - Comparison of thickness of filter cake by CT scan and Vernier Caliper.
Location Thickness, in. by CT scan Thickness, in. by Vernier Caliper
1 0.129 0.288
2 0.133 0.251
3 0.133 0.262
4 0.139 0.264
Average 0.13± 0.005 0.266± 0.013

19
CT scan images showed the filter cake contained two layers with different CT
numbers. Fig. 4 shows a Bandera sandstone core on the left after static filtration with the
black filter cake on the top. On the right, the CT image shows the average thickness of the
filter cake is 0.337 in. The CTNs stands for the relevant density. With a higher CT number,
the density of the material will be higher. The average CTNs for the core was 1776. And
the CTNs for upper layer was 2400 and 3500 for the lower layer. Fig. 5 presents a Berea
sandstone core with the filter cake on the top. The two layers were also existed under CT
scan with lower CTNs for the upper layer (2411) and high CTNs for the lower layer
(3396). The CTNs of the core was 1650 and thickness of the filter cake was 0.203 in.
Fig. 4 - Left: Bandera sandstone core with filter cake after static filtration; right: two
layers of filter cakes under CT scan.

20
Fig. 5 - Left: Berea sandstone core with filter cake after static filtration; Right: two
layers of filter cakes under CT scan.
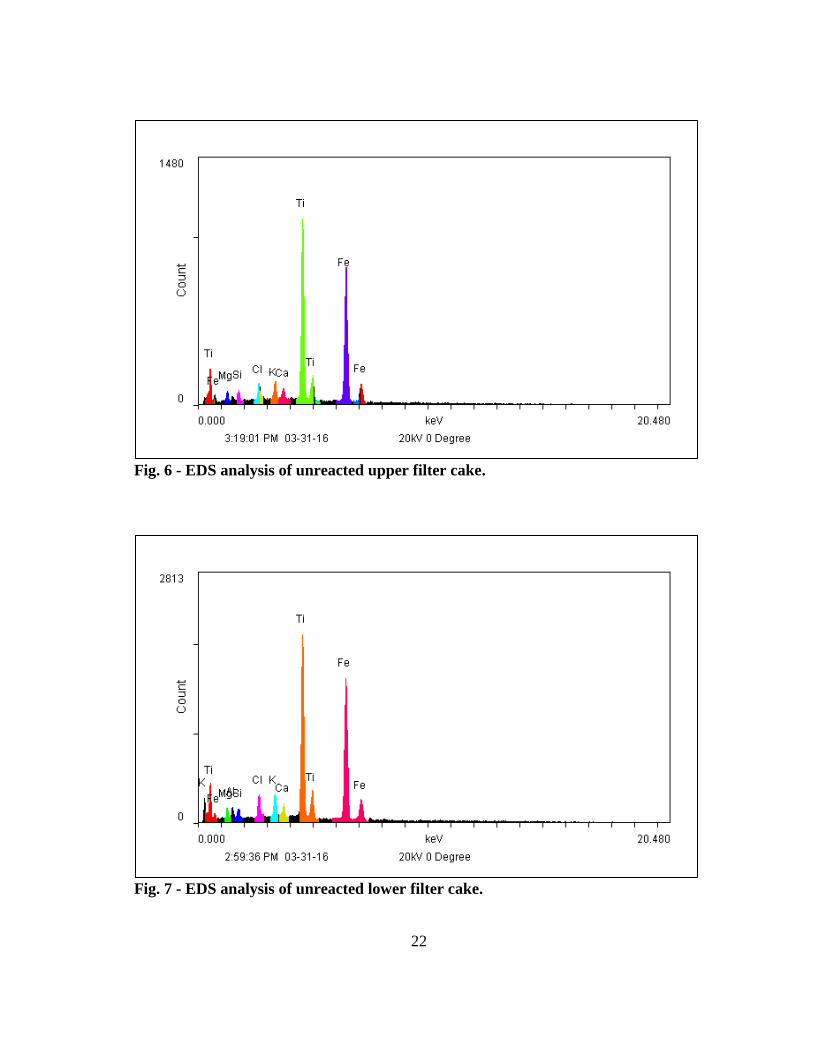
To better understand the two layers of the filter cakes, SEM-EDS was used to both
visualize and determine the elemental composition of the filter cake. Figs. 6 and 7 show
the EDS result as different peaks. The two different peaks for iron were added together to
determine the iron concentration. Table 5 gives the elemental composition of the upper
and lower filter cake. Both layers contain more than 50 wt% iron and 30 wt% titanium.
The amount of potassium and chloride came from the drilling fluid, in which 72 g KCl
was added for shale inhibition and increasing the density of the drilling fluid. Besides,
calcium also came from the drilling fluid. Calcium carbonate was added to be the bridging
material. In the EDS analysis, other elements also existed. They may come from the
impurities of the chemicals that used to prepare the drilling fluid.
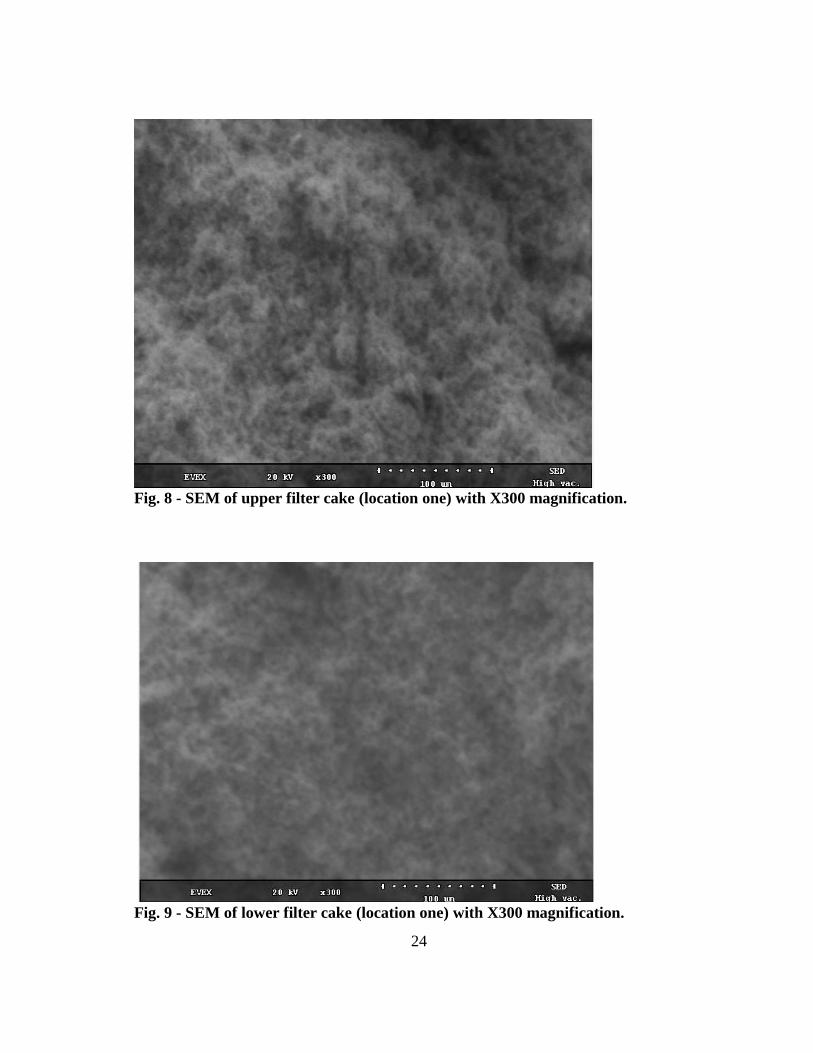
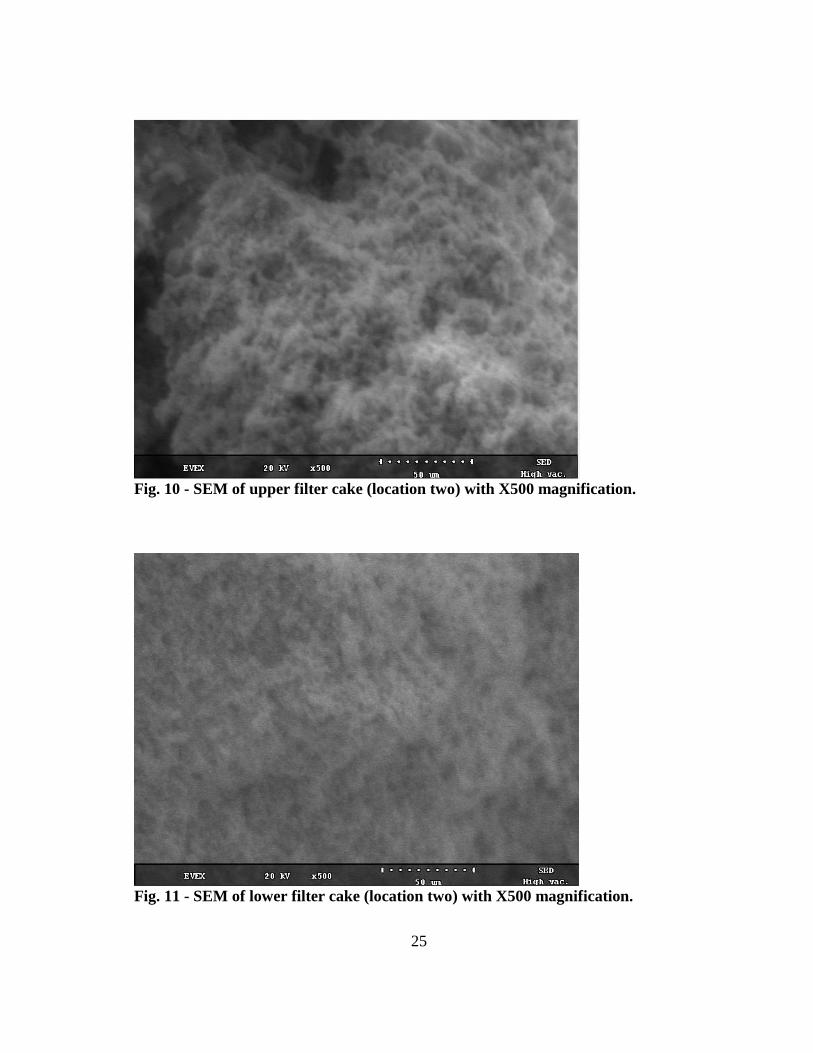
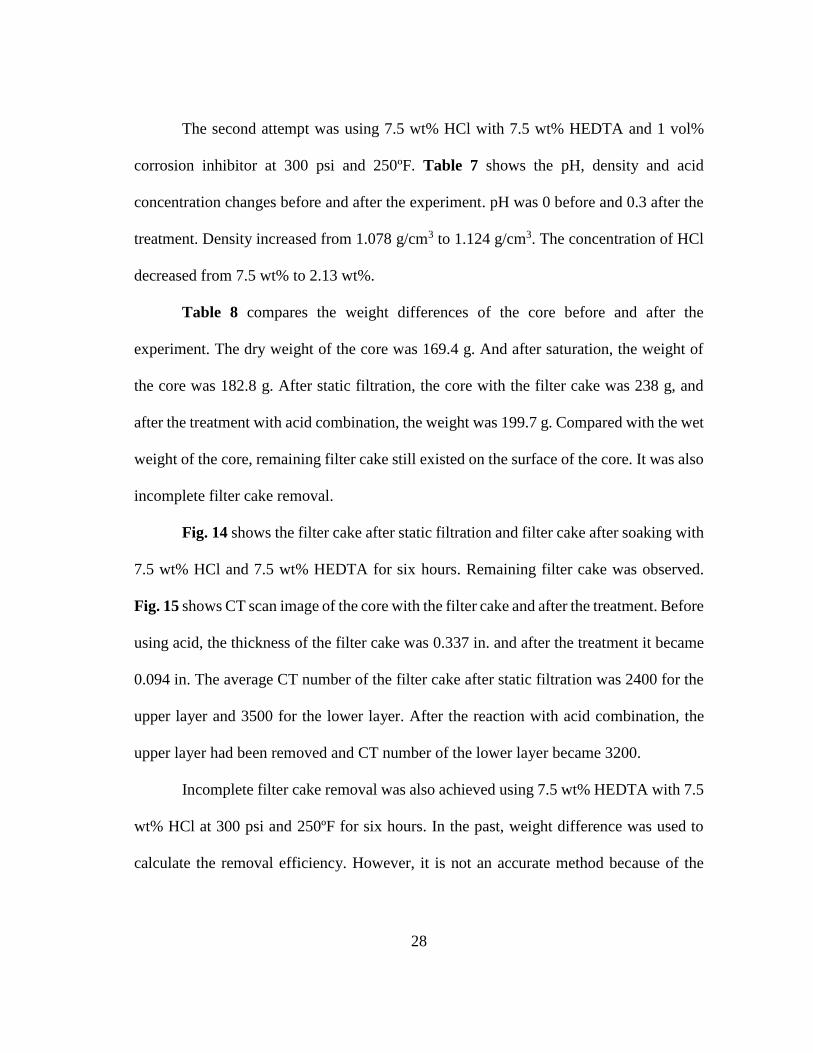
The weight concentration shown indicates similar components of the upper and
lower filter cakes. Figs. 8 and 9 compare the upper layer of the filter cake with the lower
layer of the filter cake under 300 magnification. From 300 magnification, more pores were

21
observed in the upper filter cake. And the lower layer of the filter cake was more dense
and compact. Figs. 10 and 11 further confirmed the differences between the two layers
under 500 magnification.
The difference comes from the deposition of the filter cake. At first, the high
density, heavy weighting materials start to deposit on the surface of the core. Later,
smaller and lighter materials deposit on the top part of the filter cake. And the lower filter
cake is kept being compacted until the end of the filtration.
Elkatatny et al. (2012) used bentonite based drilling fluid, with at most 50 g
weighting material. They found that closer to the core contained mainly the weighting
material and the layer closer to the drilling fluid contained other materials.
In this research, the drilling fluid formula contained 300 g weighting material. This
amount of the weighting material was far more than other components. Thus, the filter
cake was composed mainly the weighting material and with minor other materials from
the drilling fluid. And the difference was in the porosity or density.
22
Fig. 6 - EDS analysis of unreacted upper filter cake.
Fig. 7 - EDS analysis of unreacted lower filter cake.

23
Table 5 - Different elemental compositions and concentrations of the upper and lower
filter cake.
Element of the
upper filter cake
Concentration, wt% Element of the
lower filter cake
Concentration, wt%
Fe 55.86 Fe 51.73
Ti 29.66 Ti 29.03
Mg 5.1 Mg 4.96
Si 2.54 Si 2.51
Cl 2.79 Cl 3.56
K 2.44 K 3.09
Ca 1.61 Ca 1.61
Sum 100 Al 3.6
Sum 100
24
Fig. 8 - SEM of upper filter cake (location one) with X300 magnification.
Fig. 9 - SEM of lower filter cake (location one) with X300 magnification.
25
Fig. 10 - SEM of upper filter cake (location two) with X500 magnification.
Fig. 11 - SEM of lower filter cake (location two) with X500 magnification.

26
3.4 Filter Cake Removal
Filter cakes generated by ilmenite water-based muds were removed at 300 psi and
250ºF with:
1. 7.5 wt% HCl + 1 vol% corrosion inhibitor,
2. 7.5 wt% HCl and 7.5 wt% HEDTA + 1 vol% corrosion inhibitor.
The first attempt was using 7.5 wt% HCl with 1 vol% corrosion inhibitor with four
hours soaking time. Fig. 12 shows the filter cake after static filtration, after treatment with
7.5 wt% HCl soaking for four hours, and after drying at 212ºF for three hours. Incomplete
removal filter cake remained on the surface of the core. Fig. 13 shows a 3-D model of the
filter cake under CT scan. On the left side, after static filtration, some drilling fluid
invasion can be observed which may due to the bridging process. On the right side, after
reacting with 7.5 wt% HCl for four hours, more filtration into the core was observed.
Table 6 shows the weight differences of the core. The dry weight of the core was
168.4 g and after saturation with 5 wt% KCl, it was 178.2 g. After static filtration, the core
with the filter cake was 219.7 g. Later, after the filter cake removal, the core with
remaining filter cake was 191.4 g. Compares to the saturated core 178.2 g, the filter cake
removal was incomplete. The remaining filter cake with the core was also dried and
compared with the initial and the conclusion was also incomplete filter cake removal.

27
Fig. 12 - Left: Filter cake after static filtration at 300 psi and 250ºF; middle: filter
cake after soaking with 7.5 wt% HCl at 300 psi and 250ºF; right: filter cake after
drying at 212ºF for three hours.
Fig. 13 - Left: 3-D model of the CT image after static filtration; 3-D model of the CT
image after treating with 7.5 wt% HCl.
Table 6 - Weight difference of the core when using HCl.
Dry weight, g Wet weight, g
Core 168.4 178.2
Core with filter cake - 219.7
Core with remaining filter cake 179.8 191.4
28
The second attempt was using 7.5 wt% HCl with 7.5 wt% HEDTA and 1 vol%
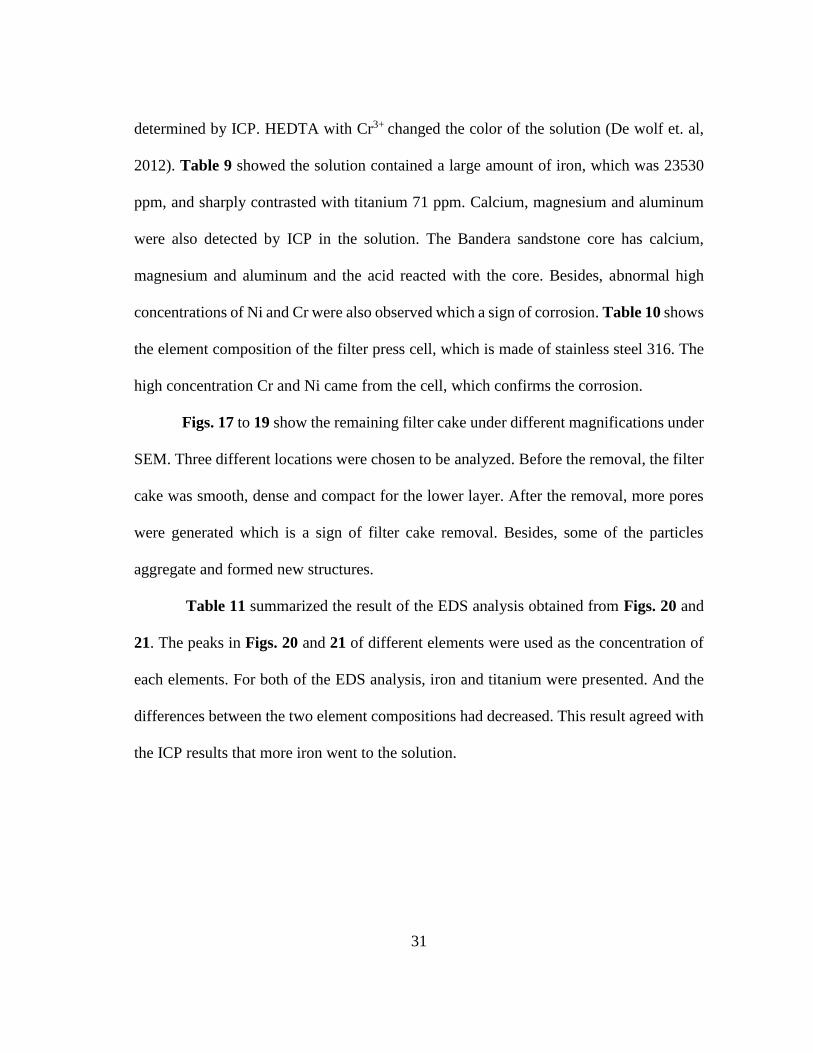
corrosion inhibitor at 300 psi and 250ºF. Table 7 shows the pH, density and acid
concentration changes before and after the experiment. pH was 0 before and 0.3 after the
treatment. Density increased from 1.078 g/cm3 to 1.124 g/cm3. The concentration of HCl
decreased from 7.5 wt% to 2.13 wt%.
Table 8 compares the weight differences of the core before and after the
experiment. The dry weight of the core was 169.4 g. And after saturation, the weight of
the core was 182.8 g. After static filtration, the core with the filter cake was 238 g, and
after the treatment with acid combination, the weight was 199.7 g. Compared with the wet
weight of the core, remaining filter cake still existed on the surface of the core. It was also
incomplete filter cake removal.
Fig. 14 shows the filter cake after static filtration and filter cake after soaking with
7.5 wt% HCl and 7.5 wt% HEDTA for six hours. Remaining filter cake was observed.
Fig. 15 shows CT scan image of the core with the filter cake and after the treatment. Before
using acid, the thickness of the filter cake was 0.337 in. and after the treatment it became
0.094 in. The average CT number of the filter cake after static filtration was 2400 for the
upper layer and 3500 for the lower layer. After the reaction with acid combination, the
upper layer had been removed and CT number of the lower layer became 3200.
Incomplete filter cake removal was also achieved using 7.5 wt% HEDTA with 7.5
wt% HCl at 300 psi and 250ºF for six hours. In the past, weight difference was used to
calculate the removal efficiency. However, it is not an accurate method because of the
29
ignorance of the dissolution of the core. The acid will react with the filter cake, as well as
the core. Thus, the results obtained by using weight loss is not the true removal efficiency.
Table 7 - Values of pH and density before and after treatment with 7.5 wt% HCl and
7.5 wt% HEDTA.
Value Before treatment After treatment
pH 0 0.3
Density, g/cm3 1.078 1.124
HCl concentration, wt% 7.5 2.13
Table 8 - Wet different of the core when using HCl with HEDTA.
Dry weight, g Wet weight, g
Core 169.4 182.8
Core with filter cake - 238
Core with remaining filter cake - 199.7

30
Fig. 14 - Left: filter cake after static filtration; remaining filter cake after soaking
with 7.5 wt% HCl and 7.5 wt% HEDTA for 6 hours.
Fig. 15 - Left: CT scan of the filter cake after static filtration; CT scan of the
remaining filter cake after soaking with 7.5 wt% HCl and 7.5 wt% HEDTA for 6
hours.
Fig. 16 shows the solution color before and after the treatment. The yellow color
came from the corrosion inhibitor. The purple color after reaction was abnormal and rarely
seen in the lab. Table 7 presents the elemental composition of the solution after reaction
31
determined by ICP. HEDTA with Cr3+ changed the color of the solution (De wolf et. al,
2012). Table 9 showed the solution contained a large amount of iron, which was 23530
ppm, and sharply contrasted with titanium 71 ppm. Calcium, magnesium and aluminum
were also detected by ICP in the solution. The Bandera sandstone core has calcium,
magnesium and aluminum and the acid reacted with the core. Besides, abnormal high
concentrations of Ni and Cr were also observed which a sign of corrosion. Table 10 shows
the element composition of the filter press cell, which is made of stainless steel 316. The
high concentration Cr and Ni came from the cell, which confirms the corrosion.
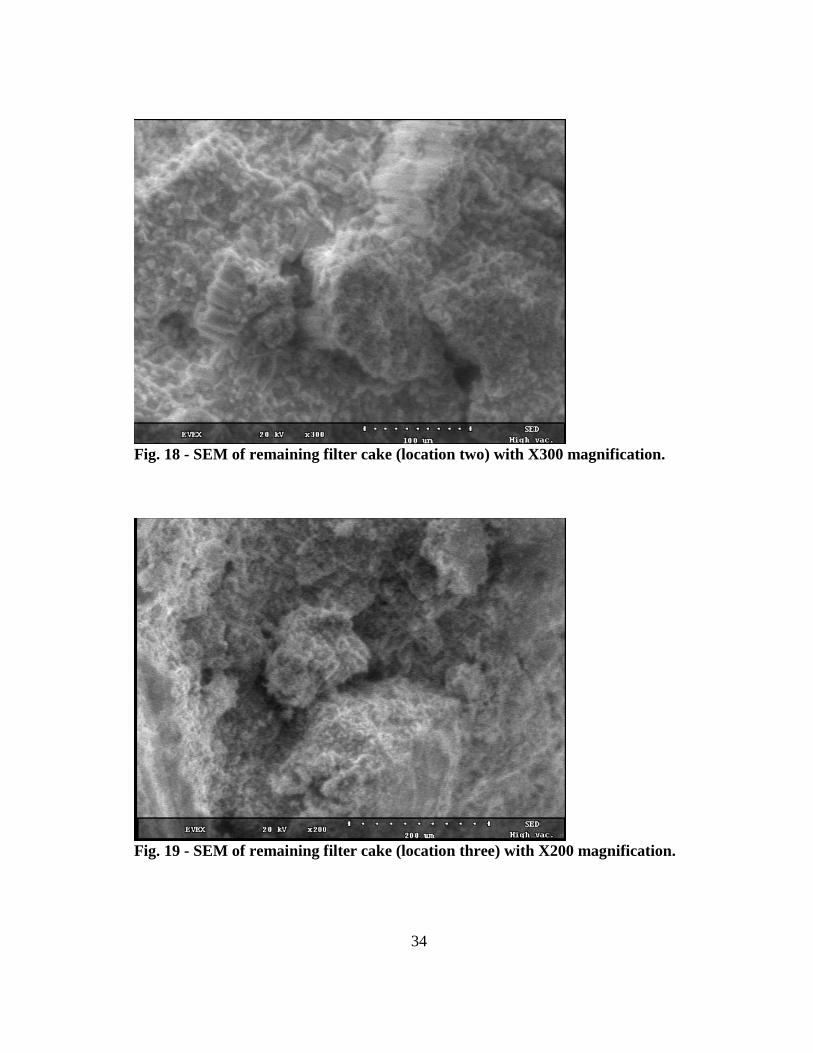
Figs. 17 to 19 show the remaining filter cake under different magnifications under
SEM. Three different locations were chosen to be analyzed. Before the removal, the filter
cake was smooth, dense and compact for the lower layer. After the removal, more pores
were generated which is a sign of filter cake removal. Besides, some of the particles
aggregate and formed new structures.
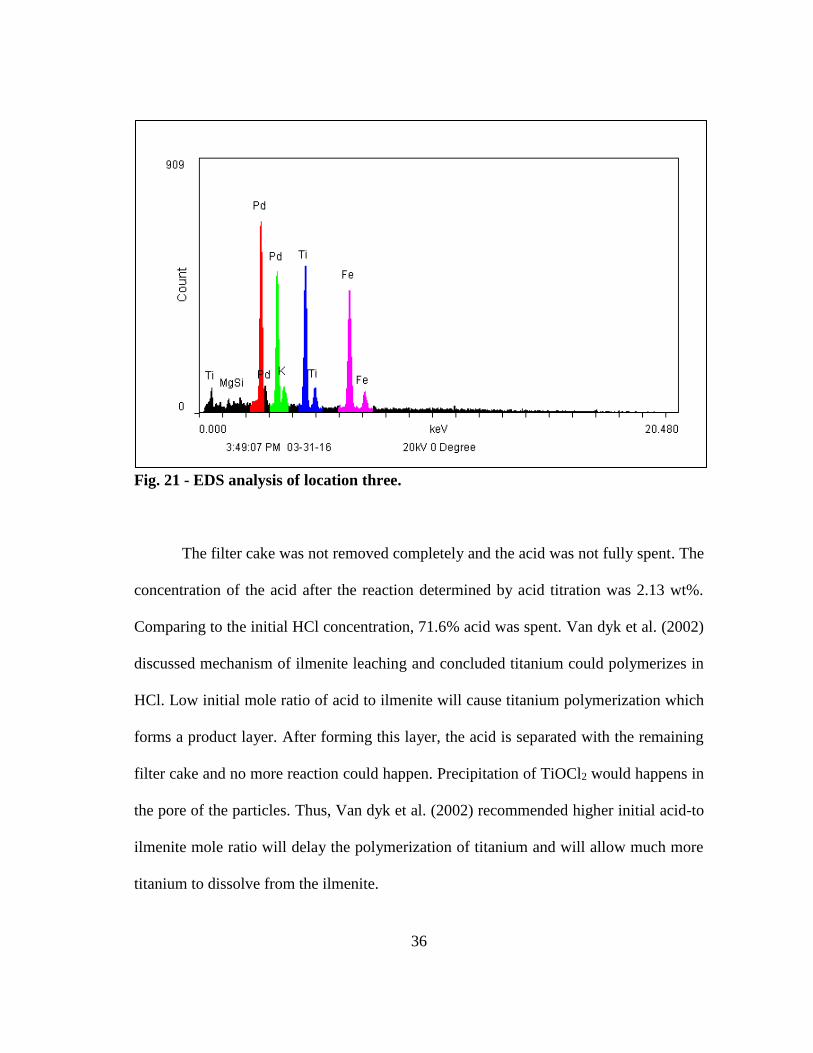
Table 11 summarized the result of the EDS analysis obtained from Figs. 20 and
21. The peaks in Figs. 20 and 21 of different elements were used as the concentration of
each elements. For both of the EDS analysis, iron and titanium were presented. And the
differences between the two element compositions had decreased. This result agreed with
the ICP results that more iron went to the solution.

32
Fig. 16 - Left: solution before reaction with 7.5 wt% HCl and 7.5 wt% HEDTA;
right: solution after reaction with 7.5 wt% HCl and 7.5 wt% HEDTA.
Table 9 - Cation concentration in solution after reaction with 7.5 wt% HCl and 7.5
wt% HEDTA.
Element Concentration, ppm
Fe 23,530
Ti 71
Ca 1,982
Mg 374
Al 252
Ni 2,851
Cr 4,616
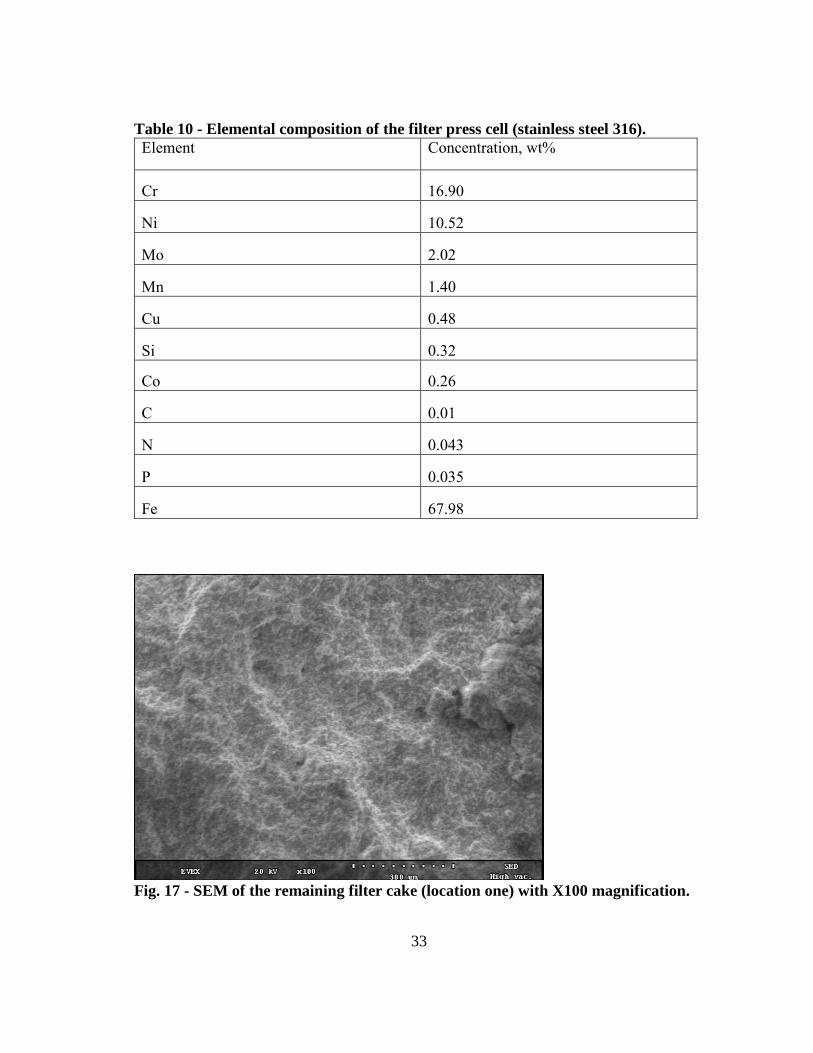
33
Table 10 - Elemental composition of the filter press cell (stainless steel 316).
Element Concentration, wt%
Cr 16.90
Ni 10.52
Mo 2.02
Mn 1.40
Cu 0.48
Si 0.32
Co 0.26
C 0.01
N 0.043
P 0.035
Fe 67.98
Fig. 17 - SEM of the remaining filter cake (location one) with X100 magnification.
34
Fig. 18 - SEM of remaining filter cake (location two) with X300 magnification.
Fig. 19 - SEM of remaining filter cake (location three) with X200 magnification.

35
Table 11 - Left: elemental composition of location one; right: elemental composition
of location two.
Element Concentration, wt% Element Concentration, wt%
Cl 28.7 Mg 4.48
K 29.57 Si 1.97
Ti 17.85 Pd 9.99
Fe 23.88 Ti 34.63
Fe 48.92
Fig. 20 - EDS analysis of location two.
36
Fig. 21 - EDS analysis of location three.
The filter cake was not removed completely and the acid was not fully spent. The
concentration of the acid after the reaction determined by acid titration was 2.13 wt%.
Comparing to the initial HCl concentration, 71.6% acid was spent. Van dyk et al. (2002)
discussed mechanism of ilmenite leaching and concluded titanium could polymerizes in
HCl. Low initial mole ratio of acid to ilmenite will cause titanium polymerization which
forms a product layer. After forming this layer, the acid is separated with the remaining
filter cake and no more reaction could happen. Precipitation of TiOCl2 would happens in
the pore of the particles. Thus, Van dyk et al. (2002) recommended higher initial acid-to
ilmenite mole ratio will delay the polymerization of titanium and will allow much more
titanium to dissolve from the ilmenite.
37
The start point of polymerization of titanium as described in Van dyk et al. (2002),
when the concentration of titanium is larger than 10-3 mol/L. 71 ppm titanium determined
by ICP and divided by the molecular weight of titanium, 47.867 is 1.48×10⁻³ mol/L. So it
is concluded that titanium polymerize in the solution and mass transfer limited the
reaction.

38
CHAPTER IV
CONCLUSIONS AND RECOMMENDATIONS
Ilmenite water based drilling fluid was prepared and used to generate the filter cake
at HP/HT conditions. CT scan and SEM-EDS were used to characterize the filter cake.
Different acids were used to remove the filter cake. The following conclusions were
obtained by the results:
1. Ilmenite water-based drilling fluid provides a good rheological properties, with
acceptable filtration volume (<15 cm3). This will decrease the mud invasion
into the formation and cause less formation damage.
2. CT scan is a good method to characterize the filter cake generated by ilmenite
water-based drilling fluid. Two layers were overserved and confirmed by
SEM-EDS. The two layers were different in the density, which led to different
CT numbers. SEM showed less pores in the upper layer. The lower layer was
more dense and compact. EDS showed similar elemental compositions of the
two layers.
3. Removal of filter cake generated by ilmenite water-based mud with lower
concentration of HCl (7.5 wt%) was not complete. Remaining filter cake was
observed by both weight difference and CT scan.
4. Adding HEDTA is a good method to prevent iron precipitation in the solution.
Corrosion issue was noticed when adding HEDTA. The solution color changed
from yellow to purple, which is the color of HEDTA with Cr3+.
39
5. The combination of 7.5 wt% HCl with 7.5 wt% HEDTA also cannot
completely remove the filter cake. Unspent acid and remaining filter cake
indicates the polymerization of titanium, which could separate ilmenite from
the acid and stop the reaction.
6. A filter press cell made of stainless steel is not a good reactor for the acid.
Corrosion happened inside the cell. A special cell (Hastelloy) is needed in the
future to minimize corrosion.
7. After solving the corrosion issue, future work can be done by using higher acid
concentration to remove the filter cake generated by ilmenite water based
drilling fluid to achieve high initial acid to ilmenite mole ratio.
8. For the application in the field, more cost and benefit should be calculated
before applying acid to remove the filter cake. It may not be economic to
remove the filter cake than leave untreated.

40
REFERENCES
Al-Bagoury, M. and Steele, C. D. 2012. A New, Alternative Weight Material for Drilling
Fluids. IADC/SPE Drilling Conference and Exhibition, San Diego, California, USA,
6-8 March. SPE-151331-MS. http://dx.doi.org/10.2118/151331-MS (accessed 23
June 2016).
Al-Bagoury, M. 2014. Micronized Ilmenite - A Non-damaging Non-Sagging New Weight
material for Drilling Fluids. Presented at the SPE Bergen One Day Seminar, Bergen,
Norway, 2-2 April. SPE-169182-MS. http://dx.doi.org/10.2118/169182-MS
(accessed 23 June 2016).
Amighi, M. and Shahbazi, K. 2010. Effective Ways to Avoid Barite Sag and Technologies
to Predict Sag in HP/HT and Deviated Wells. Presented at the SPE Deep Gas
Conference and Exhibition, Manama, Bahrain, 24-26 January. SPE-132015-MS.
http://dx.doi.org/10.2118/132015-MS (accessed 23 June 2016).
Bageri, B. S., Al-Mutairi, S. H., and Mahmoud, M. 2013. Different Techniques for
Characterizing the Filter Cake. Presented at the SPE Unconventional Gas Conference
and Exhibition, Muscat, Oman, 28-30 January. SPE-163960-MS.
http://dx.doi.org/10.2118/163960-MS (accessed 23 June 2016).
Blattel, S. R., and Rupert, J. P. 1982. The Effect of Weight Material Type on Rate of
Penetration Using Dispersed and Non-Dispersed Water-Base Muds. Presented at
the 57th Annual Fall Technical Conference and Exhibition of the Society of
Petroleum Engineers of AIME, New Orleans, LA, 26-29 September. SPE-10961-
MS. http://dx.doi.org/10.2118/10961-MS (accessed 23 June 2016).

41
Blomberg, N. E., Melberg, B. Boe, A. et al. 1984. Evaluation of Ilmenite as Weight
Material in Drilling Fluids. Journal of Petroleum Technology 36 (6): 969-974. SPE-
11085-PA. http://dx.doi.org/10.2118/11085-PA (accessed 23 June 2016).
Borhan, M. Z., Nee, T. Y., 2015. Synthesis of TiO2 Nanopowders from Red Gypsum using
EDTA as Complexing Agent. Journal of Nanostructure in Chemistry 5 (1): 71-76.
http://dx.doi.org/10.1007/s40097-014-0137-7 (accessed 23 June 2016).
De Wolf, C. A., Nasr-El-Din, H. A., Bouwman, A. et al. 2012. A New, Low Corrosive
Fluid To Stimulate Deep Wells Completed With Cr-based Alloys. Presented at the
SPE International Conference and Workshop on Oilfield Corrosion, Aberdeen,
UK, 28-29 May. SPE-152716-MS. http://dx.doi.org/10.2118/152716-MS
(accessed 23 June 2016).
Elkatatny, S., Mahmoud, M. A., and Nasr-El-Din, H. A. 2012. Characterization of Filter
Cake Generated by Water-Based Drilling Fluids Using CT Scan. SPE Drilling &
Completion 27 (2): 282-293. SPE-144098-PA. http://dx.doi.org/10.2118/144098-PA
(accessed 23 June 2016).
Elkatatny, S. M., Nasr-El-Din, H. A., and Al-Bagoury, M. 2013a. Properties of Ilmenite
Water-Based Drilling Fluids for HPHT Applications. Presented at the International
Petroleum Technology Conference, Beijing, China, 26-28 March. IPTC-16983-MS.
http://dx.doi.org/10.2523/IPTC-16983-MS (accessed 23 June 2016).
Elkatatny, S.M., Xiao, J., Nasr-El-Din, H.A. et al. 2013b. Using Hydrochloric Acid to
Remove Ilmenite Water-Based Filter Cake in HP/HT Applications. Presented at the

42
SPE European Formation Damage Conference and Exhibition, Noordwijk,
Netherlands, 5-7 June. SPE-165181-MS. http://dx.doi.org/10.2118/165181-MS
(accessed 23 June 2016).
Fjogstad, A., Saasen, A., Hagen, R. et al. 2000. Field Trial of Alternative Weight Material
with Improved Occupational Hygiene and Environmental Performance. Presented at
the SPE International Conference on Health, Safety and Environment in Oil and Gas
Exploration and Production, Stavanger, Norway, 26-28 June. SPE-61042-MS.
http://dx.doi.org/10.2118/61042-MS (accessed 23 June 2016).
Haaland, E., Pettersen, G., and Tuntland, O. B. 1976. Testing Of Iron Oxides As Weight
Materials For Drilling Muds. SPE-6218-MS.
https://www.onepetro.org/download/general/SPE-6218-MS?id=general%2FSPE-
6218-MS (accessed 23 June 2016).
Menzel, D. 1973. A New Weighting Material for Drilling Fluids Based on Synthetic Iron
Oxide. Presented at the Fall Meeting of the Society of Petroleum Engineers of AIME,
Las Vegas, Nevada, 30 September-3 October. SPE-4517-MS.
http://dx.doi.org/10.2118/4517-MS (accessed 23 June 2016).
Olanipekun, E. 1999. A kinetic study of the leaching of a Negerian ilmenite ore by
hydrochloric acid. Hydrometallurgy 53 (1): 1-10.
http://dx.doi.org/doi:10.1016/S0304-386X(99)00028-6 (accessed 23 June 2016).
Saasen, A., Hoset, H., Rostad, E. J. et al. 2001. Application of Ilmenite as Weight Material
in Water-based and Oil Based Drilling Fluids. Presented at the SPE Annual Technical

43
Conference and Exhibition, New Orleans, Louisiana, 30 September-3 October. SPE-
71401-MS. http://dx.doi.org/10.2118/71401-MS (accessed 23 June 2016).
Sloan, J.P., Brooks, J.P., and Dear III, S.F. 1975. A New, Nondamaging, Acid-Soluble
Weighting Material. Journal of Canadian Petroleum Technology 27 (1): 15—20.
SPE-4782-PA. http://dx.doi.org/10.2118/4782-PA (accessed 23 June 2016).
Smith, C. F., Crowe, C. W., and Nolan III, T. J. 1969. Secondary Deposition of Iron
Compounds Following Acidizing Treatments. Journal of Petroleum Technology 21
(9): 1121-1129. SPE-2358-PA. http://dx.doi.org/10.2118/2358-PA (accessed 23 June
2016).
Talyor, K. C., Nasr-El-Din, H. A., and Al-Alawi, M. J. 1999. Systematic Study of Iron
Control Chemicals Used During Well Stimulation. SPE Journal 4 (1): 19-24. SPE-
54602-PA. http://dx.doi.org/10.2118/54602-PA (accessed 23 June 2016).
Tehrani, A., Cliffe, A., Hodder M. H. et al. 2014. Alternative Drilling Fluid Weighting
Agents: A Comprehensive Study on Ilmenite and Hematite. Presented at the 2014
IADC/SPE Drilling Conference and Exhibition, Fort Worth, Texas, 4-6 March.
SPE-167937-MS. http://dx.doi.org/10.2118/167937-MS (accessed 23 June 2016).
Van Dyk, J. P., Vegter, N. M., and Pistorius, P. C. 2002. Kinetics of Ilmenite Dissolution
in Hydrochloric Acid. Hydrometallurgy. 65 (1): 31-36.
http://dx.doi.org/10.1016/S0304-386X(02)00063-4 (accessed 23 June 2016).
Wellington, S. L. and Vinegar, H. J. 1987. X-Ray Computerized Tomography. Journal of
Petroleum Technology 39 (8): 885-898. SPE-16983-PA.
http://dx.doi.org/10.2118/16983-PA (accessed 23 June 2016).
44
Xiao, J., Nasr-El-Din, H. A., and Al-Bagoury, M. 2015. Removal of Ilmenite Oil-based
Filter Cake under HP/HT Conditions Using Hydrochloric Acid. Presented at the SPE
North Africa Technical Conference and Exhibition, Cairo, Egypt, 14-16 September.
SPE-175728-MS. http://dx.doi.org/10.2118/175728-MS (accessed 23 June 2016).