filtration, 1. fundamentals · filter cake 2.1.1. definition of filter resistance and cake...
TRANSCRIPT
� 2012 Wiley-VCH Verlag GmbH & Co. KGaA, Weinheim
Article No : b02_10
Filtration, 1. Fundamentals
SIEGFRIED RIPPERGER, Gonbach, Germany
WALTER G€oSELE, Heidelberg, Germany
CHRISTIAN ALT, M€unchen, Germany
1. Terminology . . . . . . . . . . . . . . . . . . . . . 678
2. Filtration Models . . . . . . . . . . . . . . . . . . 681
2.1. Calculation of the Pressure Drop over the
Filter Medium and/or the Filter Cake . . 681
2.1.1. Definition of Filter Resistance and Cake
Permeability: The Darcy Equation . . . . . . 681
2.1.2. The Equation of Kozeny and Carman . . . . 681
2.2. Cake Filtration . . . . . . . . . . . . . . . . . . . 682
2.2.1. The ‘‘Cake Filter Equation’’ . . . . . . . . . . . 682
2.2.2. Evaluation of Experiments with
Linear Diagrams . . . . . . . . . . . . . . . . . . . 6832.2.2.1. Linear Diagram in the Differential Form. . 6832.2.2.2. Linear Diagram in Integrated Form . . . . . 6842.2.2.3. Example . . . . . . . . . . . . . . . . . . . . . . . . . 6842.2.2.4. Deviations from Linearity . . . . . . . . . . . . 685
2.2.3. Compressible Cake Filtration . . . . . . . . . . 686
2.3. Blocking Filtration and other Modes of
Filtration . . . . . . . . . . . . . . . . . . . . . . . . 687
2.3.1. Complete Blocking Filtration . . . . . . . . . . 687
2.3.2. Intermediate and Standard Blocking Filtration 687
2.3.3. Simplified Evaluation of Experimental Data 688
2.4. Depth Filtration . . . . . . . . . . . . . . . . . . . 688
2.4.1. Depth Filtration Mechanisms . . . . . . . . . . 688
2.4.2. Cleaning and Sizing of Deep Bed Filters . 690
2.5. Cross-Flow Filtration. . . . . . . . . . . . . . . 691
3. Washing of Filter Cakes . . . . . . . . . . . . 693
3.1. Basic Effects, Mass Balances . . . . . . . . . 693
3.2. Example of Experimental Results . . . . . 694
3.3. Test Procedures and Pitfalls . . . . . . . . . 694
3.4. ‘‘Intermediate’’ Deliquoring before Cake
Washing . . . . . . . . . . . . . . . . . . . . . . . . . 696
4. Deliquoring of Filter Cakes . . . . . . . . . . 696
4.1. Deliquoring by Gas Pressure . . . . . . . . . 696
4.1.1. Equilibrium Saturation of Filter Cakes . . . 696
4.1.2. Kinetics of Deliquoring by Gas Pressure. . 698
4.1.3. Approximate Solution for Coarse,
Incompressible Cakes . . . . . . . . . . . . . . . 699
4.1.4. Practical Scale-Up of Deliquoring by Gas
Pressure . . . . . . . . . . . . . . . . . . . . . . . . . 700
4.1.5. Shrinking and Cracks in Filter Cakes . . . . 701
4.2. Deliquoring by Expression. . . . . . . . . . . 702
5. Optimal Filtration Cycle Time. . . . . . . . 703
6. Interparticle Forces and Forces Between
Particles and Filtermedia, DLVO Theory 704
7. Mathematical Simulation of Filtration
and Cake Formation . . . . . . . . . . . . . . . 705
8. Handling of ‘‘Unfilterable’’ Suspension . 706
8.1. Optimization of Upstream Steps
(Crystallization, Precipitation) . . . . . . . . 707
8.2. Application of Flocculants (Polyelectrolytes) 707
8.3. Adaptation of pH . . . . . . . . . . . . . . . . . . 707
8.4. Checking of Alternatives to Cake
Filtration . . . . . . . . . . . . . . . . . . . . . . . . 707
8.5. Use of a Filter Aid . . . . . . . . . . . . . . . . . 707
References . . . . . . . . . . . . . . . . . . . . . . . 708
Symbols
A: cross-sectional area, filter area, m2
a: resistance of a porous medium
aH: cake resistance relative to cake
thickness, m�2
am: cake resistance relative to dry mass,
m/kg
B: creep constant
b: resistance of the filter medium, m�1
C: creep constant
c: Concentration of the suspension
cV: solid concentration as a part of total
volume
dh: hydraulic pore diameter of a porous
structure
dpore: capillary diameter, m
dS: Sauter mean diameter of particles, m
E: electrostatic potential at the solids
surface, V
e: porosity of the porous medium
H: cake thickness
I: ionic strength, mol/L
DOI: 10.1002/14356007.b02_10.pub2
1. Terminology
Filtration is the separation process of removingsolid particles, microorganisms or droplets froma liquid or a gas by depositing them on a filtermedium also called a septum, which is essentiallypermeable to only the fluid phase of the mixturebeing separated. The particles are depositedeither at the outer surface of the filter mediumand/or within its depth. The permeation of thefluid phase through the filter medium is con-nected to a pressure gradient.
This chapter deals onlywith filtration process-es of solid–liquidmixtures (suspensions, slurries,sludges). For the treatment of gases by filtrationsee ! Dust Separation.
Sometimes, however, purification of a liquidor gas is called filtration even when no semiper-meable medium is involved (as in electrokineticfiltration).
The liquid more or less thoroughly separatedfrom the solids is called the filtrate, effluent,permeate or, in case of water treatment, cleanwater. As in other separation processes, theseparation of phases is never complete: Liquidadheres to the separated solids (cake with resid-ual moisture) and the filtrate often contains somesolids (solids content in the filtrate or turbidity).
The purpose of filtration may be clarificationof the liquid or solids recovery or both. In clar-ification the liquid is typically a valuable productand the solids are of minor quantity and are oftendiscarded without further treatment. If however,the solids are to be recovered, they very oftenhave to be washed, deliquored and dried (seeFig. 1). In this article, washing means thecleaning of a product (filter cake) and it isdistinguished from cleaning parts of the filteritself, which will be called rinsing (e.g., rinsinga filter screen or a filter cloth by jets of water). Afurther distinction is to bemade betweenwashingand extraction or leaching. Washing eliminatesliquid contaminants from the pores between the
J: Boucher’s filterability index, m�3
KH: proportionality volume of cake/volume
of filtrate, m3/m3
Km: proportionality mass of cake/volume of
filtrate, kg/m3
KN: proportionality number of particles/
volume of filtrate, m�3
k: permeability of the filter cake ¼ 1/aH,
m2
L: distance from the inlet face of the filter
bed, m
l: filter coefficient of deep bed filters, m�1
m: mass of dry filter cake, kg
mi: molar concentration of ion ‘‘i’’, mol/L
N: number of open pores
n: compressibility factor
h: viscosity, Ns/m2
pL: pressure in the liquid, Pa
pS: compressive stress on the solids, Pa
Dp: pressure drop
pc: capillary pressure, Pa
pce: capillary entry pressure, Pa
pci: capillary suction pressure, Pa
q: exponent describing blocking behavior
r: distance from the solids surface, m
rD: Debye length, m
SR: reduced saturation
S: saturation (volume of liquid/volume of
pores)
Sv: specific inner surface
S¥: irreducible saturation
treg: regeneration time for cleaning and pre-
paring a run, s
Q: dimensionless time
Uc: consolidation rate
V: volume of filtrate, m3
_V : volumetric flow rate, m3/h
V/A: specific flow rate or filtration velocity
zi: valency of ion ‘‘i’’z: surface potential, V
Y: energy potential
Indices
av: average
e: end of filtration
H: related to cake thickness (height)
L: liquid
loc: local
m: related to cake mass
N: number
S: solid
w: wash liquor
pore: pore (volume)
678 Filtration, 1. Fundamentals Vol. 14
particles of a filter cake. Extraction recoverssoluble matter out of the solid particles them-selves (! Liquid–Solid Extraction). The termdrying means thermal drying, while the elimina-tion of liquid from the filter cake by mechanicalforces is called deliquoring or dewatering, e.g.,deliquoring by a pressurized gas or by expres-sion.
Filtration processes can be classified in accor-dance with different criteria:
1. Location of particle retentionThe particles can be separated on the outersurface of the filter medium (surface filtra-tion, cake filtration) or inside of the filtermedium (depth filtration, deep bed filtration)
2. Generation of the pressure differencePressure filtration, vacuum filtration, gravityfiltration, centrifugal filtration
3. Operation modediscontinuous, continuous, quasi-continuous.Dynamic filtration and static (normal) filtra-tion. In case of dynamic filtration are duringthe filtration process mechanisms activewhich helps to reduce the build up of a filtercake. The most common dynamic filtrationprocess is cross-flow-filtration
4. ApplicationFor example water filtration, beer filtration
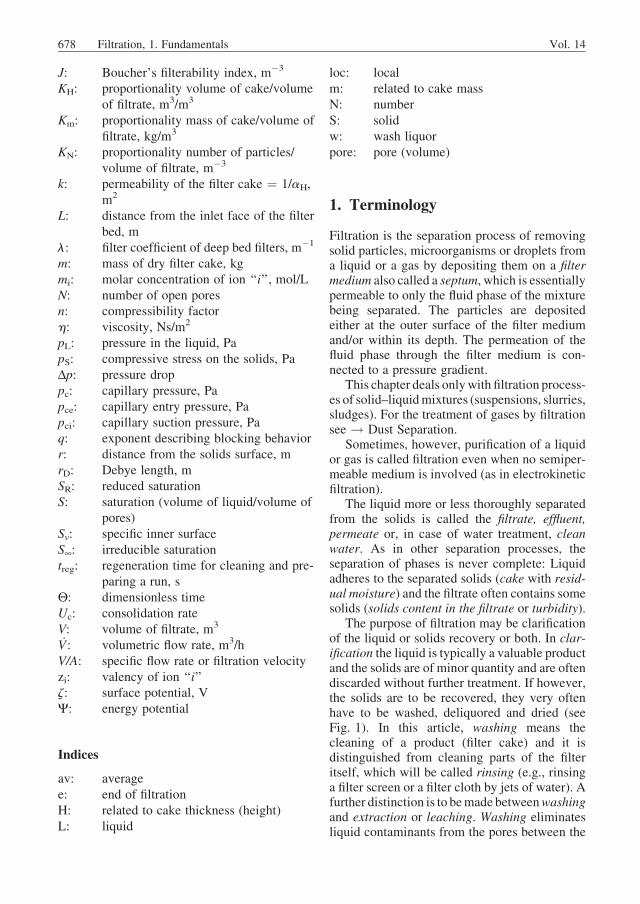
Filtration is effected by application of a pres-sure difference which can be produced bya pressurized fluid, by a vacuum, by the gravityor by centrifugal force (see Fig. 2). Pressurefiltration typically requires a pump for deliveringthe suspension to the filter. Vacuum filtrationrequires a vacuum pump. The pump evacuatesthe gas from a filtrate receiver, where the filtrateis separated from the gas. The filtrate is drainedeither by a barometric leg of at least 8 to 10 m orby a pump that is able to run on snore (i.e. witha deficiency of feed liquid so that it tends to draw
in air). In some cases the liquid is allowed to flowthrough the filter medium only by gravity (gravi-ty filtration). Centrifugal filtration is done inperforated centrifuge rotors (! Centrifuges,Filtering).
In case of vacuum filters the cake is freelyaccessible. This facilitates automatic cake han-dling. However, vacuumfilters cannot handle hotliquids, or solvents with high vapor pressure. Thepressure difference across vacuum filters is verylimited, and the residual moisture of the filtercake is higher than with pressure filters. Pressurefilters allow high pressure differences. They arepreferred when the product must be kept ina closed system for safety reasons, or if theresidual moisture content is important. The han-dling of the filter cake is obviously more difficultin a pressure filter. Filtration by centrifugalforce requires more technical equipment, but asa general rule it yields solids with lower residualmoisture (! Centrifuges, Filtering).
During a dynamic filtration the collectedsolids on the filter media are continuouslyremoved, mostly with a tangential flow to thefilter medium (cross-flow filtration). Cross-flowfiltration is a standard operation with membranesas a filter medium. The flow parallel to the filtermedium reduces the formation of a filter cake or
Figure 1. Solids processing chain
Figure 2. Driving forces in filtration
Vol. 14 Filtration, 1. Fundamentals 679
keeps it at a low level. So it is possible to geta quasi-stationary filtrate flow for a long time.
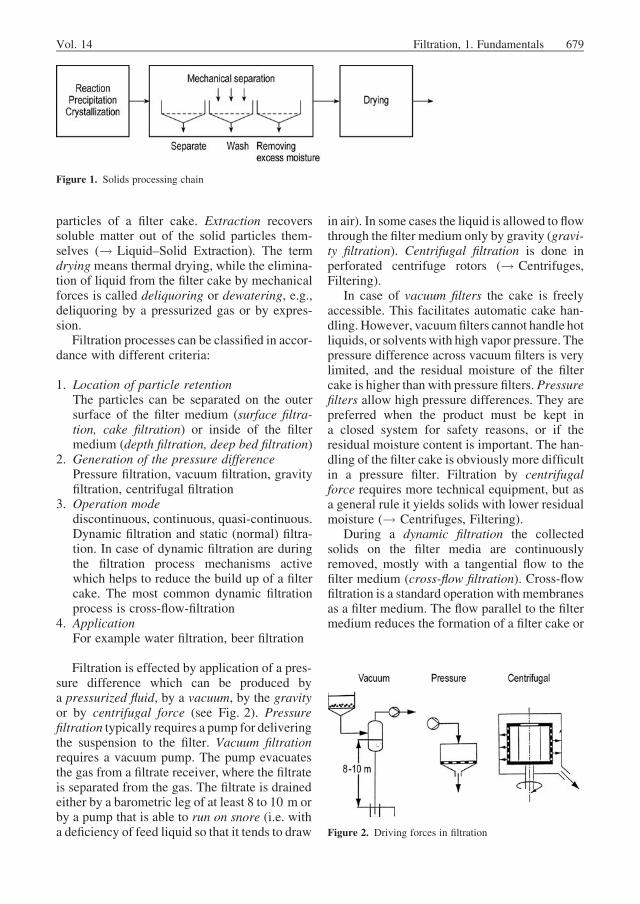
Various models have been developed todescribe the physical process of filtration. Thischapter concentrates on four idealized filtrationmodels depicted in Figure 3.
Cake filtration is the most frequently usedmodel. Here it is assumed that the solids aredeposited on the upstream side of the filter me-dium as a homogeneous porous layer witha constant permeability. As soon as the first layerof cake is formed, the subsequent filtration takesplace an the top of the cake and the mediumprovides only a supporting function. Thus, if theflow rate dV/dt is constant, the pressure drop willincrease linearly, proportional to the quantity ofsolid deposited. This model can be applied espe-cially for all hard, particulate solids.
Blocking Filtration. The pressure drop iscaused by solid particles blocking pores. Soft,gelatinous particles retained by a sieve exhibitsuch a behavior. If the flow rate dV/dt is constant,the pressure drop increases exponentially withthe quantity filtered, the number of open poresasymptotically approaching zero. The pores maybelong to a filtermedium (screen or filter layer) orit may be pores within a filter cake of coarseparticles, which are blocked by migrating fineparticles.
Deep Bed or Depth Filtration. Solid par-ticles are retained in a deep filter layer. This takesplace for example in sand filters for clarificationof drinking water, which retain even colloidalparticles. The typical effect of deep bed filtrationis adhesion of solids to the grains of the filterlayer. Only rather big particles are retained bythe screening effect. When the filter bed has beensaturated with solids, the solids concentrationin the filtrate leaving the bed progressivelyapproaches that of the incoming suspension.
Cross-Flow Filtration. In cross-flow filtra-tion the suspension flows with high speed tan-gentially to the filter medium surface, preventingthe formation of a filter cake. Only a small flow ofliquid passes through the filter medium. A certainlayer of solids accumulates in the boundary layeron the filter surface, and reduces the flow offiltrate. After an initial period, a dynamic equi-librium is established between convectivetransport of solids to the filter surface and re-moval of solids by hydrodynamic forces actingon the particles due to turbulence and diffusion.
Surface filtration is the antonym to depthfiltration. The solids are retained on the surfaceof a filter medium. Generally the models of cakefiltration or of blocking filtration can be applied.
Screening designates a classification process,which retains the particles below a certainsize and lets pass the smaller ones through the
Figure 3. Filtration models
680 Filtration, 1. Fundamentals Vol. 14
openings of the screen (! Screening). Often theterm screening-filtration is also used to designatea surface filtration with a screen as a filter medi-um. Its mode of action resembles screening (orstraining) as long as the filter medium is clean,but it is clearly a cake filtration as soon as a layerof solids has formed.
2. Filtration Models
2.1. Calculation of the Pressure Dropover the Filter Medium and/or theFilter Cake
2.1.1. Definition of Filter Resistance andCake Permeability: The Darcy Equation
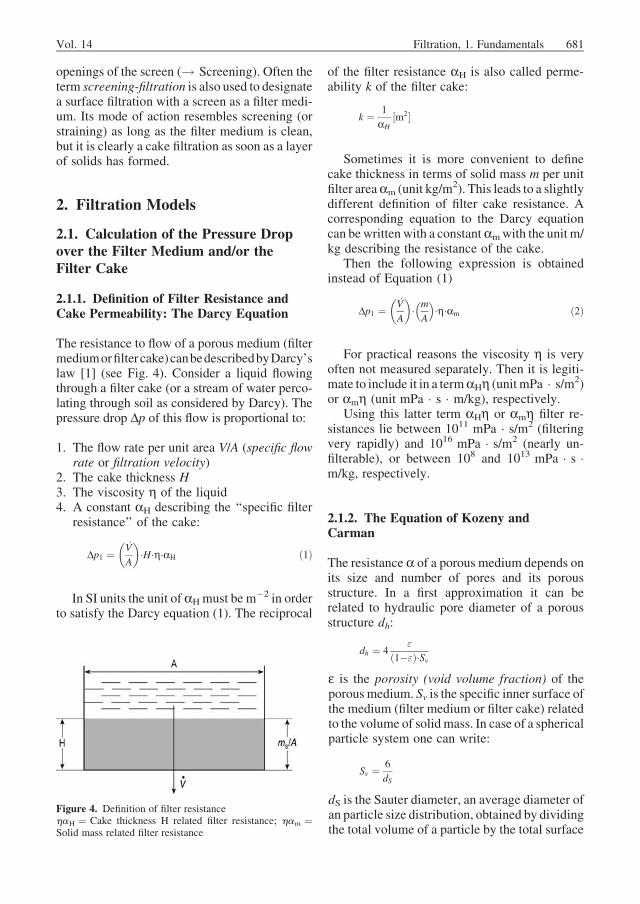
The resistance to flow of a porous medium (filtermediumorfiltercake)canbedescribedbyDarcy’slaw [1] (see Fig. 4). Consider a liquid flowingthrough a filter cake (or a stream of water perco-lating through soil as considered by Darcy). Thepressure drop Dp of this flow is proportional to:
1. The flow rate per unit area V/A (specific flowrate or filtration velocity)
2. The cake thickness H3. The viscosity h of the liquid4. A constant aH describing the ‘‘specific filter
resistance’’ of the cake:
Dp1 ¼_V
A
� �
�H�h�aH ð1Þ
In SI units the unit of aHmust be m�2 in orderto satisfy the Darcy equation (1). The reciprocal
of the filter resistance aH is also called perme-ability k of the filter cake:
k ¼ 1
aH½m2�
Sometimes it is more convenient to definecake thickness in terms of solid mass m per unitfilter areaam (unit kg/m2). This leads to a slightlydifferent definition of filter cake resistance. Acorresponding equation to the Darcy equationcan bewrittenwith a constantamwith the unit m/kg describing the resistance of the cake.
Then the following expression is obtainedinstead of Equation (1)
Dp1 ¼_V
A
� �
� m
A
� ��h�am ð2Þ
For practical reasons the viscosity h is veryoften not measured separately. Then it is legiti-mate to include it in a termaHh (unitmPa � s/m2)or amh (unit mPa � s � m/kg), respectively.
Using this latter term aHh or amh filter re-sistances lie between 1011 mPa � s/m2 (filteringvery rapidly) and 1016 mPa � s/m2 (nearly un-filterable), or between 108 and 1013 mPa � s �m/kg, respectively.
2.1.2. The Equation of Kozeny andCarman
The resistance a of a porous medium depends onits size and number of pores and its porousstructure. In a first approximation it can berelated to hydraulic pore diameter of a porousstructure dh:
dh ¼ 4"
ð1�"Þ�Sve is the porosity (void volume fraction) of theporous medium. Sv is the specific inner surface ofthe medium (filter medium or filter cake) relatedto the volume of solid mass. In case of a sphericalparticle system one can write:
Sv ¼ 6
dS
dS is the Sauter diameter, an average diameter ofan particle size distribution, obtained by dividingthe total volume of a particle by the total surface
Figure 4. Definition of filter resistancehaH ¼ Cake thickness H related filter resistance; ham ¼Solid mass related filter resistance
Vol. 14 Filtration, 1. Fundamentals 681
area. One can see that the specific surface and thehydraulic pore diameter depend strong on theparticle sizes.
Based on a laminar flow inside a poroussystem with pores of a hydraulic diameter dhone get in combination with the Darcy equation(1) an useful approximation for the specificresistance of a porous medium:
aH� 5�ð1�"Þ2�36"3�d2S
� 5�ð1�"Þ2"3�S2v
: ð3Þ
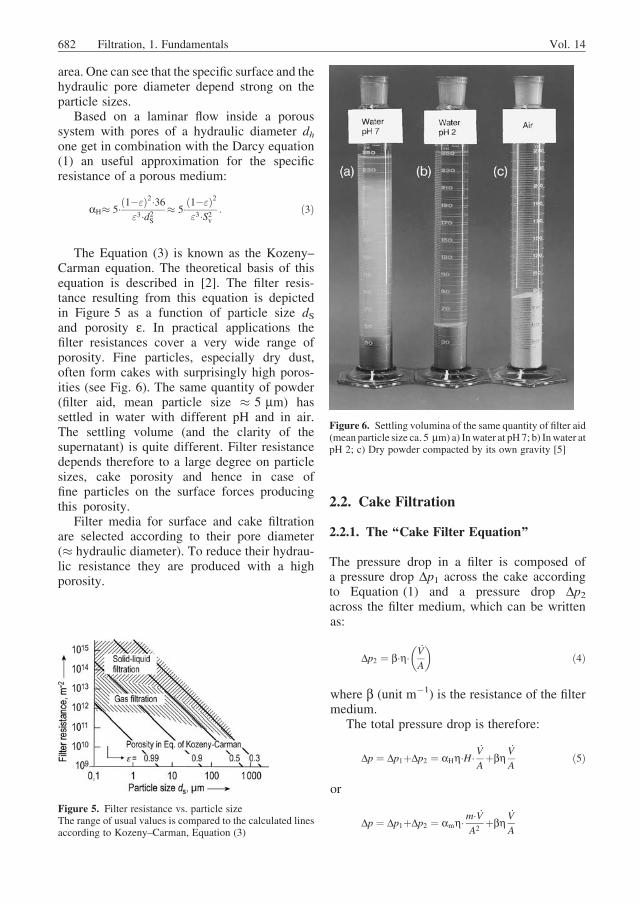
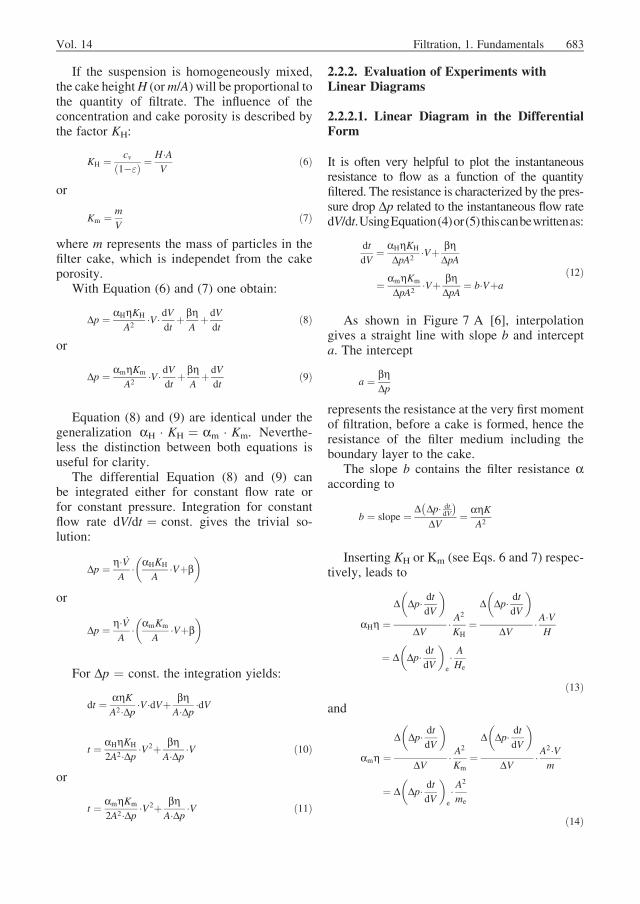
The Equation (3) is known as the Kozeny–Carman equation. The theoretical basis of thisequation is described in [2]. The filter resis-tance resulting from this equation is depictedin Figure 5 as a function of particle size dSand porosity e. In practical applications thefilter resistances cover a very wide range ofporosity. Fine particles, especially dry dust,often form cakes with surprisingly high poros-ities (see Fig. 6). The same quantity of powder(filter aid, mean particle size � 5 mm) hassettled in water with different pH and in air.The settling volume (and the clarity of thesupernatant) is quite different. Filter resistancedepends therefore to a large degree on particlesizes, cake porosity and hence in case offine particles on the surface forces producingthis porosity.
Filter media for surface and cake filtrationare selected according to their pore diameter(� hydraulic diameter). To reduce their hydrau-lic resistance they are produced with a highporosity.
2.2. Cake Filtration
2.2.1. The ‘‘Cake Filter Equation’’
The pressure drop in a filter is composed ofa pressure drop Dp1 across the cake accordingto Equation (1) and a pressure drop Dp2across the filter medium, which can be writtenas:
Dp2 ¼ b�h�_V
A
� �
ð4Þ
where b (unit m�1) is the resistance of the filtermedium.
The total pressure drop is therefore:
Dp ¼ Dp1þDp2 ¼ aHh�H�_V
Aþbh
_V
Að5Þ
or
Dp ¼ Dp1þDp2 ¼ amh�m�_V
A2þbh
_V
A
Figure 5. Filter resistance vs. particle sizeThe range of usual values is compared to the calculated linesaccording to Kozeny–Carman, Equation (3)
Figure 6. Settling volumina of the same quantity of filter aid(mean particle size ca. 5 mm) a) Inwater at pH 7; b) Inwater atpH 2; c) Dry powder compacted by its own gravity [5]
682 Filtration, 1. Fundamentals Vol. 14
If the suspension is homogeneously mixed,the cake heightH (orm/A) will be proportional tothe quantity of filtrate. The influence of theconcentration and cake porosity is described bythe factor KH:
KH ¼ cvð1�"Þ ¼
H�AV
ð6Þ
or
Km ¼ m
Vð7Þ
where m represents the mass of particles in thefilter cake, which is independet from the cakeporosity.
With Equation (6) and (7) one obtain:
Dp ¼ aHhKH
A2�V � dV
dtþbh
Aþ dV
dtð8Þ
or
Dp ¼ amhKm
A2�V � dV
dtþbh
Aþ dV
dtð9Þ
Equation (8) and (9) are identical under thegeneralization aH � KH ¼ am � Km. Neverthe-less the distinction between both equations isuseful for clarity.
The differential Equation (8) and (9) canbe integrated either for constant flow rate orfor constant pressure. Integration for constantflow rate dV/dt ¼ const. gives the trivial so-lution:
Dp ¼ h� _VA
� aHKH
A�Vþb
� �
or
Dp ¼ h� _VA
� amKm
A�Vþb
� �
For Dp ¼ const. the integration yields:
dt ¼ ahKA2�Dp �V�dVþ
bhA�Dp �dV
t ¼ aHhKH
2A2�Dp �V2þ bh
A�Dp �V ð10Þ
or
t ¼ amhKm
2A2�Dp �V2þ bhA�Dp �V ð11Þ
2.2.2. Evaluation of Experiments withLinear Diagrams
2.2.2.1. Linear Diagram in the DifferentialForm
It is often very helpful to plot the instantaneousresistance to flow as a function of the quantityfiltered. The resistance is characterized by the pres-sure drop Dp related to the instantaneous flow ratedV/dt.UsingEquation(4)or(5)thiscanbewrittenas:
dt
dV¼ aHhKH
DpA2�Vþ bh
DpA
¼ amhKm
DpA2�Vþ bh
DpA¼ b�Vþa
ð12Þ
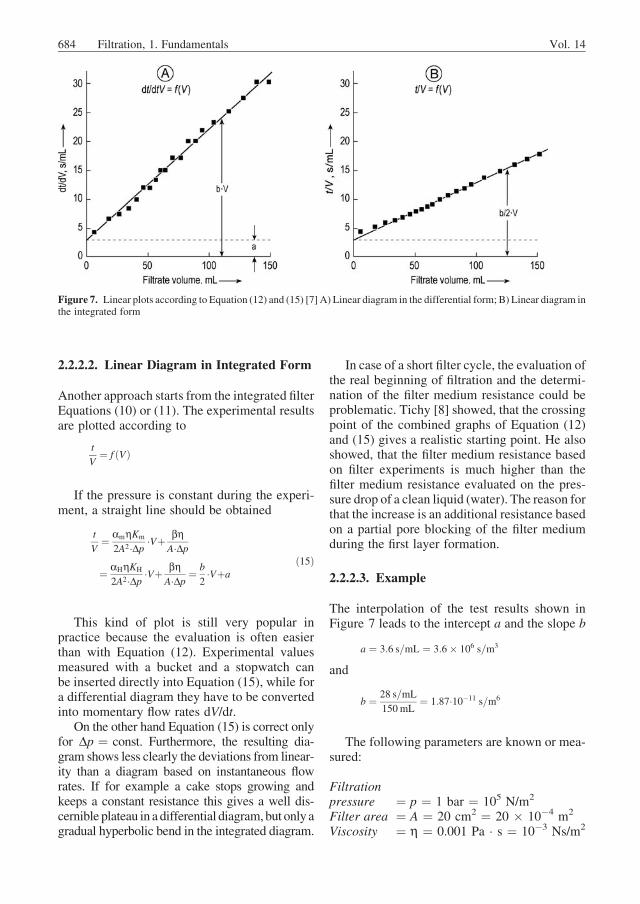
As shown in Figure 7 A [6], interpolationgives a straight line with slope b and intercepta. The intercept
a ¼ bhDp
represents the resistance at the very first momentof filtration, before a cake is formed, hence theresistance of the filter medium including theboundary layer to the cake.
The slope b contains the filter resistance aaccording to
b ¼ slope ¼ D Dp� dtdV
� �
DV¼ ahK
A2
Inserting KH or Km (see Eqs. 6 and 7) respec-tively, leads to
aHh ¼D�
Dp� dtdV
�
DV� A
2
KH¼
D�
Dp� dtdV
�
DV�A�VH
¼ D�
Dp� dtdV
�
e
� AHe
ð13Þand
amh ¼D�
Dp� dtdV
�
DV� A
2
Km¼
D�
Dp� dtdV
�
DV�A
2�Vm
¼ D�
Dp� dtdV
�
e
� A2
me
ð14Þ
Vol. 14 Filtration, 1. Fundamentals 683
2.2.2.2. Linear Diagram in Integrated Form
Another approach starts from the integrated filterEquations (10) or (11). The experimental resultsare plotted according to
t
V¼ f ðVÞ
If the pressure is constant during the experi-ment, a straight line should be obtained
t
V¼ amhKm
2A2�Dp �Vþ bhA�Dp
¼ aHhKH
2A2�Dp �VþbhA�Dp ¼ b
2�Vþa
ð15Þ
This kind of plot is still very popular inpractice because the evaluation is often easierthan with Equation (12). Experimental valuesmeasured with a bucket and a stopwatch canbe inserted directly into Equation (15), while fora differential diagram they have to be convertedinto momentary flow rates dV/dt.
On the other hand Equation (15) is correct onlyfor Dp ¼ const. Furthermore, the resulting dia-gram shows less clearly the deviations from linear-ity than a diagram based on instantaneous flowrates. If for example a cake stops growing andkeeps a constant resistance this gives a well dis-cernible plateau in adifferential diagram,but only agradual hyperbolic bend in the integrated diagram.
In case of a short filter cycle, the evaluation ofthe real beginning of filtration and the determi-nation of the filter medium resistance could beproblematic. Tichy [8] showed, that the crossingpoint of the combined graphs of Equation (12)and (15) gives a realistic starting point. He alsoshowed, that the filter medium resistance basedon filter experiments is much higher than thefilter medium resistance evaluated on the pres-sure drop of a clean liquid (water). The reason forthat the increase is an additional resistance basedon a partial pore blocking of the filter mediumduring the first layer formation.
2.2.2.3. Example
The interpolation of the test results shown inFigure 7 leads to the intercept a and the slope b
a ¼ 3:6 s=mL ¼ 3:6� 106 s=m3
and
b ¼ 28 s=mL
150mL¼ 1:87�10�11 s=m6
The following parameters are known or mea-sured:
Filtrationpressure ¼ p ¼ 1 bar ¼ 105 N/m2
Filter area ¼ A ¼ 20 cm2 ¼ 20 � 10�4 m2
Viscosity ¼ h ¼ 0.001 Pa � s ¼ 10�3 Ns/m2
Figure 7. Linear plots according to Equation (12) and (15) [7] A) Linear diagram in the differential form; B) Linear diagram inthe integrated form
684 Filtration, 1. Fundamentals Vol. 14
Cake height¼ He ¼ 37 mmCake mass ¼ me ¼ 24.3 gVolume offiltrate ¼ Ve ¼ 154 cm3
Concentration factors:
KH ¼ A�He
Ve¼ 20�10�4�0:037
154�10�6 ¼ 0:481
or
Km ¼ me
Ve¼ 24:3�10�3
154�10�6 �kg
m3¼ 158
kg
m3
The filtermedium resistance can be calculatedby
b ¼ a�Dp�Ah
¼ 3:6�106� 105�20�10�4
103m�1
¼ 7:2�1011m�1
If the porosity of the filter cake is e ¼ 0.4 andthe part of liquid inside the filter cake isneglected, the solid concentration (as a part oftotal volume) in the suspension is:
cv ¼ A�He�ð1�"ÞVe
¼ KHð1�"Þ ¼ 0:289
From Equation (13) or (14) the cake filterresistance can be calculated by
aH ¼ b�A2�DpKHh
¼ 0:187�1011� 400�10�8�105
0:481�10�3 m�2
¼ 1:56�1014m�2
am ¼ b�A2�DpKmh
¼ 0:187�1011� 400�10�8�105
158�10�3 m�2
¼ 4:73�1011 mkg
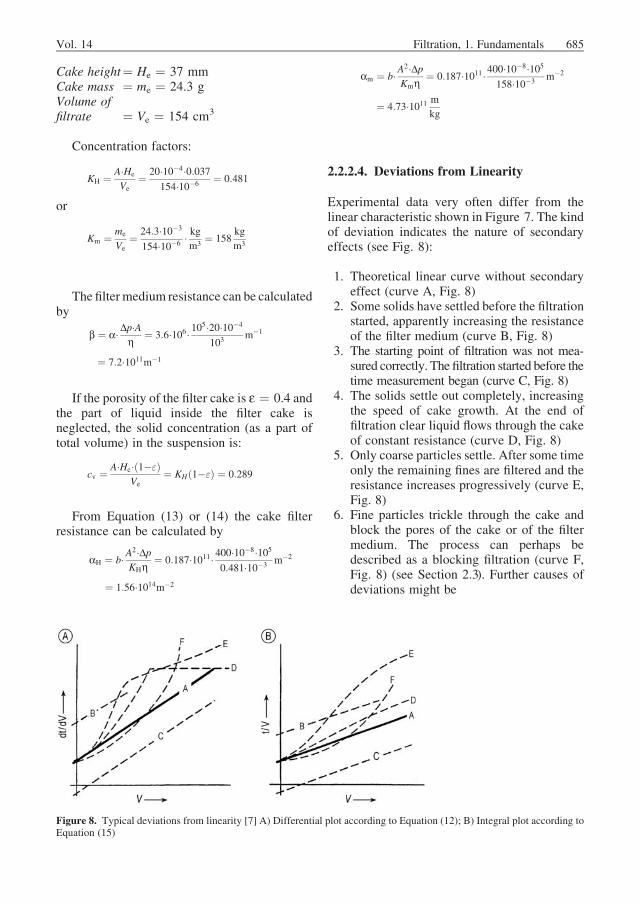
2.2.2.4. Deviations from Linearity
Experimental data very often differ from thelinear characteristic shown in Figure 7. The kindof deviation indicates the nature of secondaryeffects (see Fig. 8):
1. Theoretical linear curve without secondaryeffect (curve A, Fig. 8)
2. Some solids have settled before the filtrationstarted, apparently increasing the resistanceof the filter medium (curve B, Fig. 8)
3. The starting point of filtration was not mea-sured correctly. The filtration started before thetime measurement began (curve C, Fig. 8)
4. The solids settle out completely, increasingthe speed of cake growth. At the end offiltration clear liquid flows through the cakeof constant resistance (curve D, Fig. 8)
5. Only coarse particles settle. After some timeonly the remaining fines are filtered and theresistance increases progressively (curve E,Fig. 8)
6. Fine particles trickle through the cake andblock the pores of the cake or of the filtermedium. The process can perhaps bedescribed as a blocking filtration (curve F,Fig. 8) (see Section 2.3). Further causes ofdeviations might be
Figure 8. Typical deviations from linearity [7] A) Differential plot according to Equation (12); B) Integral plot according toEquation (15)
Vol. 14 Filtration, 1. Fundamentals 685
7. Determination of the beginning or the endpoint of filtration may not be correct. Theend point is particularly difficult to deter-mine if there is no sight glass in the filter. It istherefore common practice to neglect somepoints at the end of the measurement
8. Unusual properties of the suspension likefoambubbles or oil droplets, non-Newtonianrheology of the liquid and -isometric, plate-like particles with special orientation canproduce a great variety of effects
9. The solid may be so voluminous that it fillsnearly the whole suspension. The processthen resembles rather an expression than afiltration (Section 4.2).
10. Freshly precipitated solids sometimes con-tinue to agglomerate or to ‘‘ripen’’ duringfiltration, changing their effective particlesize and with it the filtration properties.
2.2.3. Compressible Cake Filtration
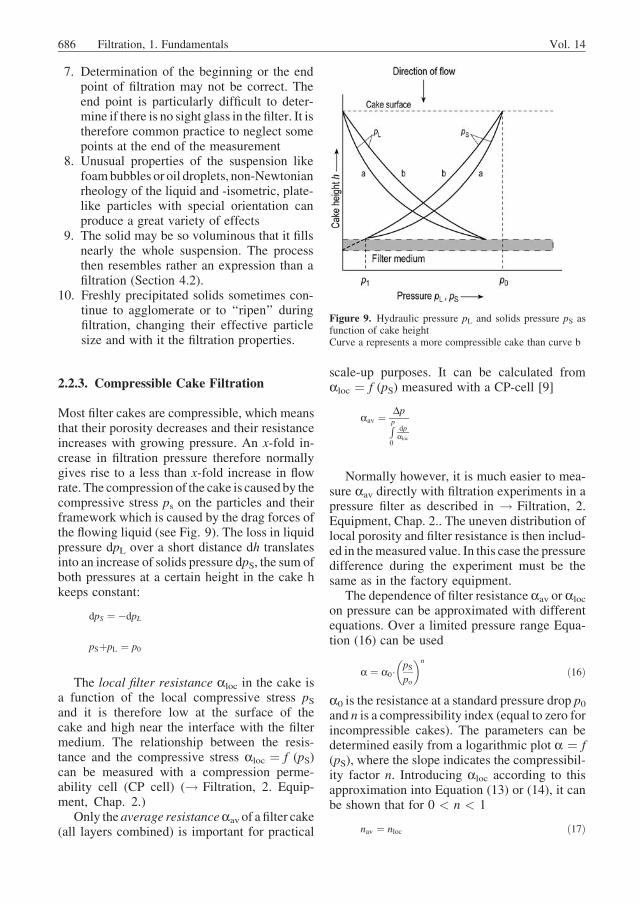
Most filter cakes are compressible, which meansthat their porosity decreases and their resistanceincreases with growing pressure. An x-fold in-crease in filtration pressure therefore normallygives rise to a less than x-fold increase in flowrate. The compression of the cake is caused by thecompressive stress ps on the particles and theirframework which is caused by the drag forces ofthe flowing liquid (see Fig. 9). The loss in liquidpressure dpL over a short distance dh translatesinto an increase of solids pressure dpS, the sum ofboth pressures at a certain height in the cake hkeeps constant:
dpS ¼ �dpL
pSþpL ¼ p0
The local filter resistance aloc in the cake isa function of the local compressive stress pSand it is therefore low at the surface of thecake and high near the interface with the filtermedium. The relationship between the resis-tance and the compressive stress aloc ¼ f (pS)can be measured with a compression perme-ability cell (CP cell) (! Filtration, 2. Equip-ment, Chap. 2.)
Only the average resistanceaav of a filter cake(all layers combined) is important for practical
scale-up purposes. It can be calculated fromaloc ¼ f (pS) measured with a CP-cell [9]
aav ¼ DpRp
0
dpaloc
Normally however, it is much easier to mea-sure aav directly with filtration experiments in apressure filter as described in ! Filtration, 2.Equipment, Chap. 2.. The uneven distribution oflocal porosity and filter resistance is then includ-ed in themeasured value. In this case the pressuredifference during the experiment must be thesame as in the factory equipment.
The dependence of filter resistance aav or aloc
on pressure can be approximated with differentequations. Over a limited pressure range Equa-tion (16) can be used
a ¼ a0� pSpo
� �n
ð16Þ
a0 is the resistance at a standard pressure drop p0and n is a compressibility index (equal to zero forincompressible cakes). The parameters can bedetermined easily from a logarithmic plot a ¼ f(pS), where the slope indicates the compressibil-ity factor n. Introducing aloc according to thisapproximation into Equation (13) or (14), it canbe shown that for 0 < n < 1
nav ¼ nloc ð17Þ
Figure 9. Hydraulic pressure pL and solids pressure pS asfunction of cake heightCurve a represents a more compressible cake than curve b
686 Filtration, 1. Fundamentals Vol. 14
a0;av ¼ ð1�nÞ�a0;loc ð18Þ
Thus the approximation Equation (16) has theadvantage that it applies to both the local and theaverage resistance. However, such an approxi-mation is valid only for a limited range of pres-sures and Equation (17) and (18) are restricted to0 < n < 1.
TILLER and coworkers [10] give an integrationof the filter equation also for n > 1. According totheir equations the flow rate quickly reachesa constant value with increasing pressure. Forpractical purposes it can be approximated thatsuch ‘‘supercompactible’’ filter cakes with n > 1(e.g., a great number of waste water sludges)yield the same flow rate independently of thepressure applied: increasing pressure only in-creases the compressed layer adjacent to the filtercloth. (The hypothetical cake which yields thehighest flow at an ‘‘optimal pressure’’ and lessflow at higher pressures apparently does notexist. In practical application, however, the out-put of a filtration may be best with moderatepressure, since this avoids excessive blocking ofthe filter medium).
For practical purposes Equations [16–18] areoften ignored and compressible cakes are treatedwith the same equations as incompressible cakes,provided a is defined as average specific cakeresistance under the conditions of operation.
Concerning deliquoring of compressiblecakes, it is important to know that the porosityis unevenly distributed after filtration. The filterresistance often is concentrated in a thin, com-pressed layer facing the filter medium, the rest ofthe cake being very porous and wet. Deliquoringby expression (see Section 4.2) will then be veryeffective, even at moderate pressures, since itacts also on the upper layer of the cake.
2.3. Blocking Filtration and otherModes of Filtration
2.3.1. Complete Blocking Filtration
According to the idealized idea of completeblocking filtration, every particle in the suspen-sion is retained on the filter medium and blocks(seals) one pore. The remaining number of openpores is then given by
NðtÞ ¼ N0ð1�KN�VLÞwhereN0 is the number of pores in the clean filtermedium, N(t) is the remaining number of openpores, and KN (m�3) is the concentration ofparticles by number in the suspension. At con-stant pressure drop the volume of filtrate V(t)Dp¼ const. can be descibed by [11]
VðtÞ ¼ 1
KN�½1�expð�KN� _V0�tÞ�
with _V0ðm3=sÞ being the flow rate at the start offiltration with a clean filter medium.
2.3.2. Intermediate and Standard BlockingFiltration
In real filtration processes not every particle inthe suspension will block a pore of the filtermedium. Some particles will be retained byadhesion to the walls of a pore without blockingit totally; others will pass through the filtermedium without being retained at all. Differentformulae (or filtration laws) exist to describesuch moderate blocking. A generalized model isbased on Equation (19) and (20)
d2t
dV2¼ const� dt
dV
� �q
ð19Þ
for constant pressure filtration and
dðDpÞdV
¼ const�ðDpÞq ð20Þ
for constant rate filtration.The exponent q in this equation varies be-
tween 0 and 2 and describes the blocking speed:
q ¼ 0 cake filtration, slow blockingq ¼ 1 so-called intermediate filtrationq ¼ 3/2 so-called standard blocking filtrationq ¼ 2 complete blocking.
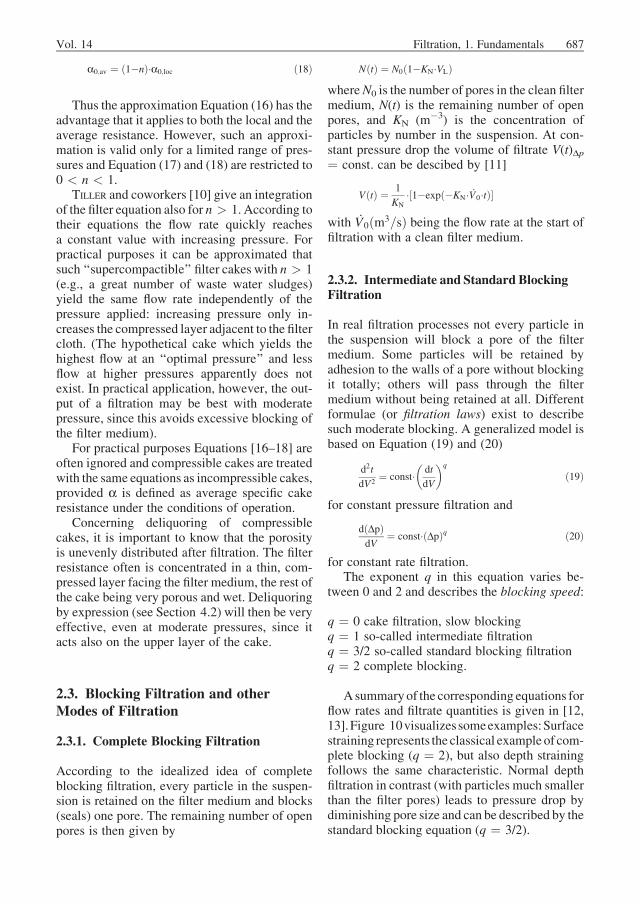
A summaryof the corresponding equations forflow rates and filtrate quantities is given in [12,13].Figure 10visualizes someexamples:Surfacestraining represents the classical example of com-plete blocking (q ¼ 2), but also depth strainingfollows the same characteristic. Normal depthfiltration in contrast (with particles much smallerthan the filter pores) leads to pressure drop bydiminishing pore size and can be described by thestandard blocking equation (q ¼ 3/2).
Vol. 14 Filtration, 1. Fundamentals 687
In most filtrations it is highly probable thatmore than one filtration mode occurs. Cake fil-tration for example often is preceded by an initialperiod before cake build-up which can bedescribed as standard blocking. This period ischaracterized by depth filtration (particles pene-trating into the filter medium) and/or by finespassing through the filter medium (creating ini-tial turbidity of the filtrate). For scientific inves-tigations it may then be helpful to identify thefiltration mechanism more precisely by parame-ter-fitting the experimental data and quantifyingthe above-mentioned ‘‘blocking speed’’.
2.3.3. Simplified Evaluation ofExperimental Data
A very pragmatic approach is often usedto describe the mode of filtration. The pressuredrop at constant flow rate is depicted on a semi-
logarithmic scale as a function of the volumefiltered.Normally the values can be approximatedby a straight line according to [14]
logp
p0
� �
¼ �J�VL ð21Þ
For the flow rate at constant pressure drop thesame approximation holds
log_V_V0
� �
¼ �J�VL ð22Þ
Here p0 is the initial pressure drop of the cleanfilter; and the gradient J, which represents some-thing like the above-mentioned blocking speed,isBoucher’s filterability index. If J ¼ 1Equation(21) and (22) are identical to an intermediatefiltration with q ¼ J ¼ 1. However, for othervalues of J the physical meaning of J is unclear.For scientific purposes this approach is thereforenot so well accepted. For practical purposes,however, it is very useful.
2.4. Depth Filtration
2.4.1. Depth Filtration Mechanisms
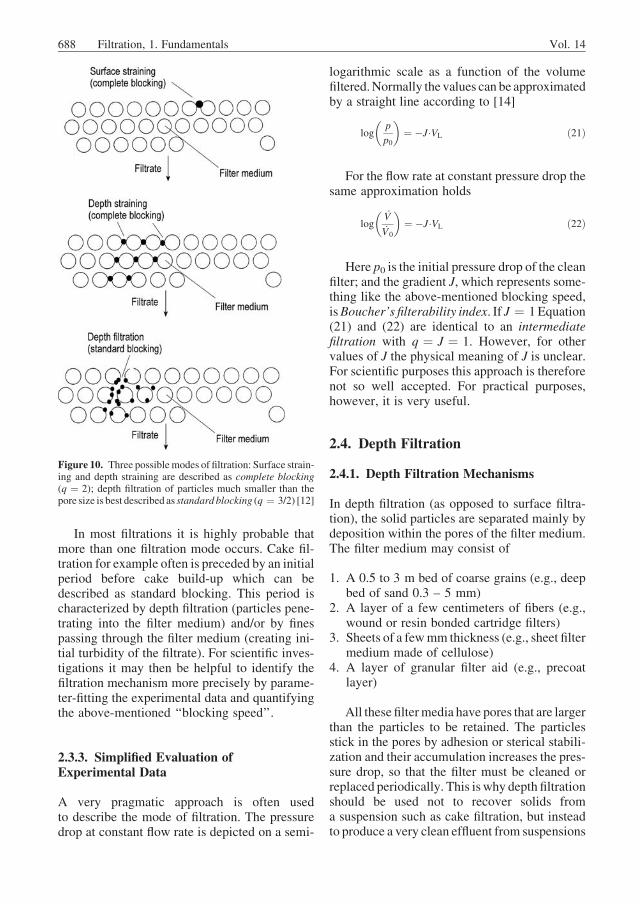
In depth filtration (as opposed to surface filtra-tion), the solid particles are separated mainly bydeposition within the pores of the filter medium.The filter medium may consist of
1. A 0.5 to 3 m bed of coarse grains (e.g., deepbed of sand 0.3 – 5 mm)
2. A layer of a few centimeters of fibers (e.g.,wound or resin bonded cartridge filters)
3. Sheets of a fewmm thickness (e.g., sheet filtermedium made of cellulose)
4. A layer of granular filter aid (e.g., precoatlayer)
All these filtermedia have pores that are largerthan the particles to be retained. The particlesstick in the pores by adhesion or sterical stabili-zation and their accumulation increases the pres-sure drop, so that the filter must be cleaned orreplaced periodically. This is why depth filtrationshould be used not to recover solids froma suspension such as cake filtration, but insteadto produce a very clean effluent from suspensions
Figure 10. Three possiblemodes of filtration: Surface strain-ing and depth straining are described as complete blocking(q ¼ 2); depth filtration of particles much smaller than thepore size is best described as standard blocking (q ¼ 3/2) [12]
688 Filtration, 1. Fundamentals Vol. 14

with very low solids loading (typically< 0.1 g/L)and with very fine particles. Depending on theparticle size, the prevailing effects of retention aresummarized in Figure 11:
1. Particles larger than the pores are trappedmechanically. This is typically true for parti-cles � 10 mm
2. Particles 1 – 10 mm in diameter hit the solidsurface mainly due to inertia effects and stickthere due to a sterical stabilization and surfaceforces
3. Particles < 0.1 mm reach the solid surfacemainly because of diffusion and stick theredue to surface forces
In the range between 0.1 and 1 mm the trans-port mechanisms to the inner surface of bothinertia and diffusion are small and hence a mini-mum in the effectiveness of depth filters isobserved.
Thus the transport of particles to the solidsurface is rather well explained and can be de-scribed mathematically. However, the mecha-nism of adhesion to the filter grains and theresulting sticking probability is not well-under-stood. Consequently the clarification effect mustbe summarized in an empirical filter coefficient ldescribing the local decrease in concentration ofthe suspension flowing through the bed:
� qcqL
¼ l�c
where c is the concentration of the suspensionand L is the distance from the inlet face of thefilter. For uniform conditions, this differentialequation can be integrated:
c ¼ c0�expð�l0�LÞhere l0 is the initial filter coefficient of a cleanfilter medium. As soon as the medium is loadedwith solids, its efficiency will change and that iswhy the solution of the differential equationbecomes rather difficult. Different models existto describe the process, but they are rarelyused for practical purposes. To find a suitablefilter medium in a depth filter which showsgood retention efficiency over a long cycletime, laboratory tests over a realistic cycle timehave to be carried outwith filter layers of realisticdepth.
The pressure drop in a depth filter can beinterpreted as an effect of two different phenom-ena of blocking filtration:
1. The filter media exhibit a resistance to flow,which is increased by the solids deposit in thepores. The quantity of deposit is generallysmall compared to the pore volume, and theadditional pressure loss per unit depth can bedescribed as proportional to the local specificdeposit. For constant solids concentration atthe inlet and constant retention the increasein this pressure drop with time is thereforeapproximately constant.
2. In addition there is often a pressure drop due todeposits on the surface of the filter bed. This isa typical blocking filtration and can be de-scribed by Boucher’s law (Eqs. 21 and 22).
The total pressure drop of a depth filter atconstant flow rate can then be approximated byan equation of the type
pðtÞ ¼ const1�tþconst2�eJ�t
The pressure drop should bemeasured in a testfilterwith a vertical height close to that of the full-scale unit (Fig. 12 A) [15]. For the case that thedriving force is gravity, the pressure profile isshown in Figure 12 B. In the static equilibrium,at flow zero, 1 m of pressure head is gained forevery meter of depth. The downstream consu-mers may then draw a constant flow rate. Whenflow has started, the pressure drop within themedium increases linearly with depth. As solidsare deposited in the pores, the local pressure losswill increase in the upper layers and the pressureline becomes distorted. When the pressureline touches the atmospheric pressure value, the
Figure 11. Retention mechanisms in a deep bed filter a)Particles > 10 mm are retained by mechanical interception;b) Particles of ca. 1 mm size are subject to inertial impact andadhesion; c) Particles<1 mm follow mainly Brownian diffu-sion and adhesion
Vol. 14 Filtration, 1. Fundamentals 689
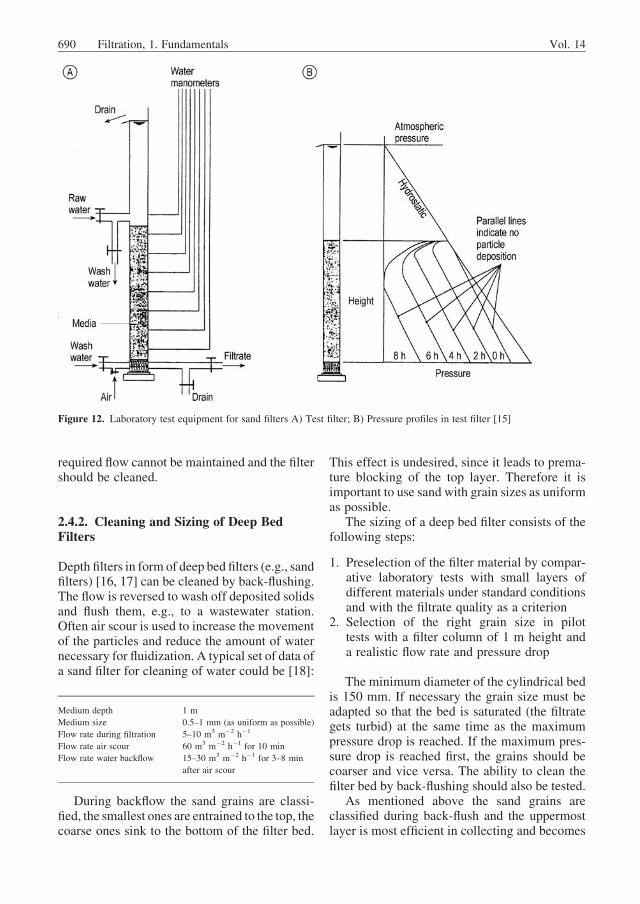
required flow cannot be maintained and the filtershould be cleaned.
2.4.2. Cleaning and Sizing of Deep BedFilters
Depth filters in form of deep bed filters (e.g., sandfilters) [16, 17] can be cleaned by back-flushing.The flow is reversed to wash off deposited solidsand flush them, e.g., to a wastewater station.Often air scour is used to increase the movementof the particles and reduce the amount of waternecessary for fluidization. A typical set of data ofa sand filter for cleaning of water could be [18]:
Medium depth 1 m
Medium size 0.5–1 mm (as uniform as possible)
Flow rate during filtration 5–10 m3 m�2 h�1
Flow rate air scour 60 m3 m�2 h�1 for 10 min
Flow rate water backflow 15–30 m3 m�2 h�1 for 3–8 min
after air scour
During backflow the sand grains are classi-fied, the smallest ones are entrained to the top, thecoarse ones sink to the bottom of the filter bed.
This effect is undesired, since it leads to prema-ture blocking of the top layer. Therefore it isimportant to use sand with grain sizes as uniformas possible.
The sizing of a deep bed filter consists of thefollowing steps:
1. Preselection of the filter material by compar-ative laboratory tests with small layers ofdifferent materials under standard conditionsand with the filtrate quality as a criterion
2. Selection of the right grain size in pilottests with a filter column of 1 m height anda realistic flow rate and pressure drop
The minimum diameter of the cylindrical bedis 150 mm. If necessary the grain size must beadapted so that the bed is saturated (the filtrategets turbid) at the same time as the maximumpressure drop is reached. If the maximum pres-sure drop is reached first, the grains should becoarser and vice versa. The ability to clean thefilter bed by back-flushing should also be tested.
As mentioned above the sand grains areclassified during back-flush and the uppermostlayer is most efficient in collecting and becomes
Figure 12. Laboratory test equipment for sand filters A) Test filter; B) Pressure profiles in test filter [15]
690 Filtration, 1. Fundamentals Vol. 14

clogged rapidly by captured solids. This disad-vantage is diminished when a second layer ofcoarse material with lower specific weight isadded on top of the sand layer. During backflowthese low density grains collect at the bed surfaceand form a coarse layer able to retain a greatquantity of dirt (so-called multimedia filters ordual media filters, e.g., with a layer of anthraciteparticles 1–2 mm in size on top of amain layer ofsand grains 0.5–1 mm in size.)
Other designs of sand filters convert the dis-advantage of classification into an advantage byoperating in the upflow mode with filtering andback-flushing from below. This offers the advan-tage that large quantities of incoming dirt areretained in the lower layer of sand, which con-tains the coarser grains and larger pores. Theseupflow filters however need special safeguardsagainst breakthrough of dirt when the pressuredrop becomes high.
In order to increase the retention capacity ina given volume, it has also been proposed to useporous grains instead of sand grains. Small piecesof polymeric foam have indeed this effect [19].Cleaning by simple back-flush is, however, notpossible with this material, it must be cleanedby back-flush combined with compression.Therefore this method has not yet found practicalapplication.
Quasi-continuous operation can be achievedusing two ore more conventional deep bed filtersin parallel. Truly continuous deep bed filtersoperates in the normal manner expect a portionof the filter bed is continuous or intermittentlyremoved from the lower layer, cleaned to re-moved the contaminant and then automaticallyreturned to the top of the filter bed. The cleaningand transport of the particles is mostly realized inthe same time form of a hydraulic transport fromthe bottom to the top of the filter bed.
2.5. Cross-Flow Filtration
Cross-flow filtration is a form of a dynamicfiltration. In cross-flow filtration the build-up ofa filter cake on the surface of the filter media ishindered by a strong flow tangentially (parallel)to the filter surface. Clear liquid passes throughthe filter medium (mostly a membrane) andthe concentrate (respectively the retentate) withhigher concentrations of the rejected components
is discharged from the filter. The cross-flowstream over the filter media has often a linearvelocity in the range of 1 to 6m/s. This cross-flowis achieved in most cases by pumping the sus-pension through amembranemodule, which e.g.,contains the membrane in form of a bundle ofmembrane tubes (! Filtration, 2. Equipment,Section 10.1.). Alternatively the cross-flow isachieved by rotating inserts. The limitation ofthe deposition of particles and macromoleculeson the membrane surface enables to filter veryfine particles, which otherwisewould form a cakewith prohibitively high resistance. Even submi-cron, nonparticulate matter can be retained bymembranes with a corresponding separationcharacteristic according to this principle. Theshearing action on at the membrane surfaceslimits the deposition of retained matter due tolift forces and diffusion processes back fromthe membrane. In normal operation the filtrate(respectively permeate) is collected and the con-centrate is re-circulated until the desired concen-tration of retained components is achieved, orpumping can not be longer performed due toraised viscosity of the suspension. Typical unitscomprise one ore more membrane modules anda recirculation pump.
In this chapter a short overview will only begiven, covering both the filtration of particles andthe separation of nonparticulate matter. For moredetails see ! Membranes and Membrane Sepa-ration Processes, 1. Principles. Depending on thesize of the species retained, a distinction is madebetween microfiltration, ultrafiltration, nanofil-tration, and reverse osmosis. Typical parametersof cross-flow filtration are summarized inTable 1.
Cross-flowMicrofiltration. Microfiltrationretains particles and microorganisms down to0.1 mm in size. In steady-state cross-flow filtra-tion these particles are conveyed onto the mem-brane by convection due to the filtrate flow andtransported away from it by hydrodynamic liftforces due to the parallel shear flow (forces FY
and FL in Fig. 13). For particles below a certainsize the lift force becomes smaller than theconvection, FL < FY, and they are deposited onthe membrane [20]. After deposition they areretained by van der Waals’ adhesion forces FA
and not easily swept away even if there is nofiltrate flow (irreversible cake formation). In case
Vol. 14 Filtration, 1. Fundamentals 691
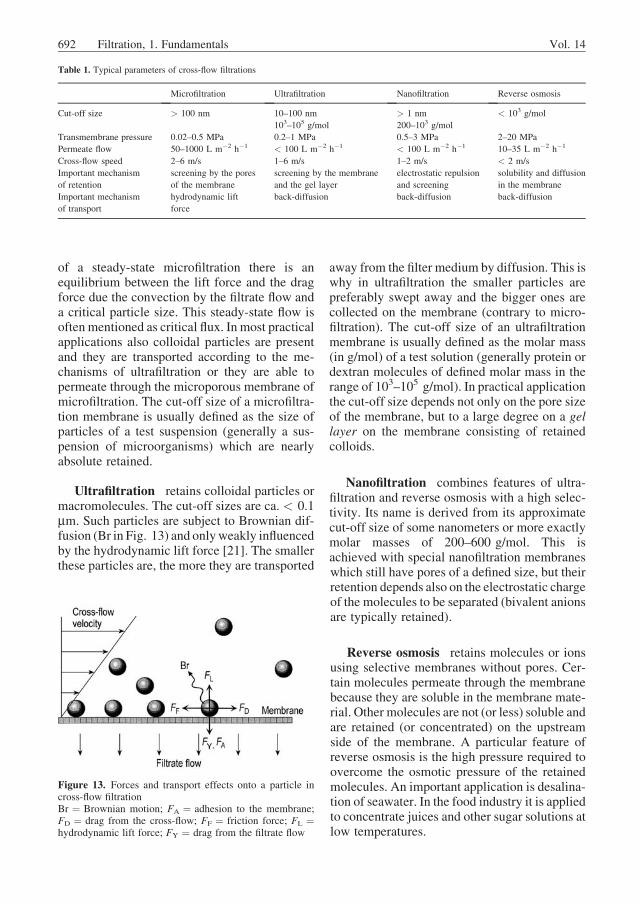
of a steady-state microfiltration there is anequilibrium between the lift force and the dragforce due the convection by the filtrate flow anda critical particle size. This steady-state flow isoften mentioned as critical flux. In most practicalapplications also colloidal particles are presentand they are transported according to the me-chanisms of ultrafiltration or they are able topermeate through the microporous membrane ofmicrofiltration. The cut-off size of a microfiltra-tion membrane is usually defined as the size ofparticles of a test suspension (generally a sus-pension of microorganisms) which are nearlyabsolute retained.
Ultrafiltration retains colloidal particles ormacromolecules. The cut-off sizes are ca. < 0.1mm. Such particles are subject to Brownian dif-fusion (Br in Fig. 13) and onlyweakly influencedby the hydrodynamic lift force [21]. The smallerthese particles are, the more they are transported
away from the filter medium by diffusion. This iswhy in ultrafiltration the smaller particles arepreferably swept away and the bigger ones arecollected on the membrane (contrary to micro-filtration). The cut-off size of an ultrafiltrationmembrane is usually defined as the molar mass(in g/mol) of a test solution (generally protein ordextran molecules of defined molar mass in therange of 103–105 g/mol). In practical applicationthe cut-off size depends not only on the pore sizeof the membrane, but to a large degree on a gellayer on the membrane consisting of retainedcolloids.
Nanofiltration combines features of ultra-filtration and reverse osmosis with a high selec-tivity. Its name is derived from its approximatecut-off size of some nanometers or more exactlymolar masses of 200–600 g/mol. This isachieved with special nanofiltration membraneswhich still have pores of a defined size, but theirretention depends also on the electrostatic chargeof the molecules to be separated (bivalent anionsare typically retained).
Reverse osmosis retains molecules or ionsusing selective membranes without pores. Cer-tain molecules permeate through the membranebecause they are soluble in the membrane mate-rial. Other molecules are not (or less) soluble andare retained (or concentrated) on the upstreamside of the membrane. A particular feature ofreverse osmosis is the high pressure required toovercome the osmotic pressure of the retainedmolecules. An important application is desalina-tion of seawater. In the food industry it is appliedto concentrate juices and other sugar solutions atlow temperatures.
Table 1. Typical parameters of cross-flow filtrations
Microfiltration Ultrafiltration Nanofiltration Reverse osmosis
Cut-off size > 100 nm 10–100 nm > 1 nm < 103 g/mol
103–105 g/mol 200–103 g/mol
Transmembrane pressure 0.02–0.5 MPa 0.2–1 MPa 0.5–3 MPa 2–20 MPa
Permeate flow 50–1000 L m�2 h�1 < 100 L m�2 h�1 < 100 L m�2 h�1 10–35 L m�2 h�1
Cross-flow speed 2–6 m/s 1–6 m/s 1–2 m/s < 2 m/s
Important mechanism
of retention
screening by the pores
of the membrane
screening by the membrane
and the gel layer
electrostatic repulsion
and screening
solubility and diffusion
in the membrane
Important mechanism
of transport
hydrodynamic lift
force
back-diffusion back-diffusion back-diffusion
Figure 13. Forces and transport effects onto a particle incross-flow filtrationBr ¼ Brownian motion; FA ¼ adhesion to the membrane;FD ¼ drag from the cross-flow; FF ¼ friction force; FL ¼hydrodynamic lift force; FY ¼ drag from the filtrate flow
692 Filtration, 1. Fundamentals Vol. 14
3. Washing of Filter Cakes
3.1. Basic Effects, Mass Balances
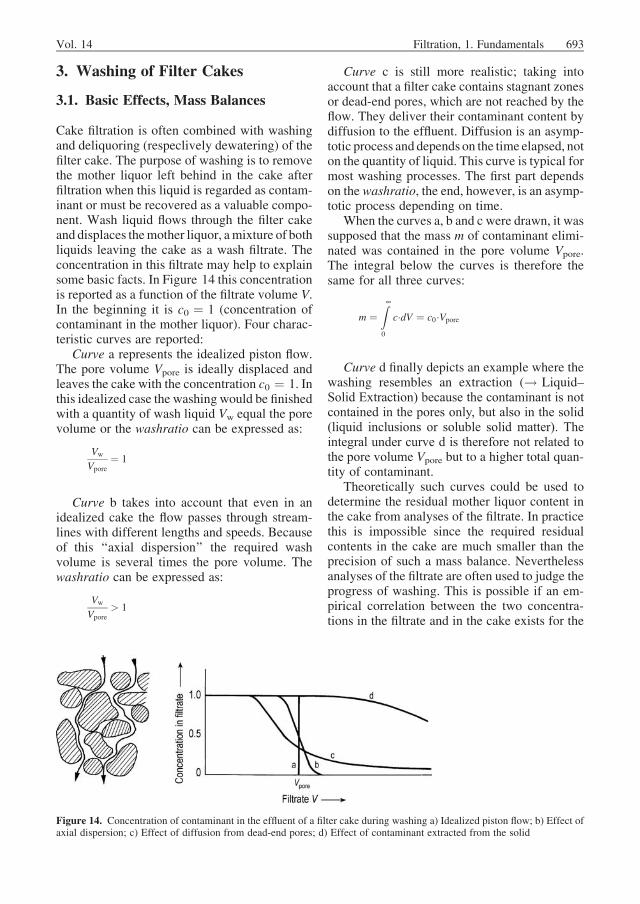
Cake filtration is often combined with washingand deliquoring (respeclively dewatering) of thefilter cake. The purpose of washing is to removethe mother liquor left behind in the cake afterfiltration when this liquid is regarded as contam-inant or must be recovered as a valuable compo-nent. Wash liquid flows through the filter cakeand displaces themother liquor, amixture of bothliquids leaving the cake as a wash filtrate. Theconcentration in this filtrate may help to explainsome basic facts. In Figure 14 this concentrationis reported as a function of the filtrate volume V.In the beginning it is c0 ¼ 1 (concentration ofcontaminant in the mother liquor). Four charac-teristic curves are reported:
Curve a represents the idealized piston flow.The pore volume Vpore is ideally displaced andleaves the cake with the concentration c0 ¼ 1. Inthis idealized case the washing would be finishedwith a quantity of wash liquid Vw equal the porevolume or the washratio can be expressed as:
Vw
Vpore¼ 1
Curve b takes into account that even in anidealized cake the flow passes through stream-lines with different lengths and speeds. Becauseof this ‘‘axial dispersion’’ the required washvolume is several times the pore volume. Thewashratio can be expressed as:
Vw
Vpore> 1
Curve c is still more realistic; taking intoaccount that a filter cake contains stagnant zonesor dead-end pores, which are not reached by theflow. They deliver their contaminant content bydiffusion to the effluent. Diffusion is an asymp-totic process and depends on the time elapsed, noton the quantity of liquid. This curve is typical formost washing processes. The first part dependson the washratio, the end, however, is an asymp-totic process depending on time.
When the curves a, b and c were drawn, it wassupposed that the mass m of contaminant elimi-nated was contained in the pore volume Vpore.The integral below the curves is therefore thesame for all three curves:
m ¼Z¥
0
c�dV ¼ c0�Vpore
Curve d finally depicts an example where thewashing resembles an extraction (! Liquid–Solid Extraction) because the contaminant is notcontained in the pores only, but also in the solid(liquid inclusions or soluble solid matter). Theintegral under curve d is therefore not related tothe pore volume Vpore but to a higher total quan-tity of contaminant.
Theoretically such curves could be used todetermine the residual mother liquor content inthe cake from analyses of the filtrate. In practicethis is impossible since the required residualcontents in the cake are much smaller than theprecision of such a mass balance. Neverthelessanalyses of the filtrate are often used to judge theprogress of washing. This is possible if an em-pirical correlation between the two concentra-tions in the filtrate and in the cake exists for the
Figure 14. Concentration of contaminant in the effluent of a filter cake during washing a) Idealized piston flow; b) Effect ofaxial dispersion; c) Effect of diffusion from dead-end pores; d) Effect of contaminant extracted from the solid
Vol. 14 Filtration, 1. Fundamentals 693
particular process. The validity of such empiricalcorrelation is, however, restricted to the particu-lar equipment and operating parameters.
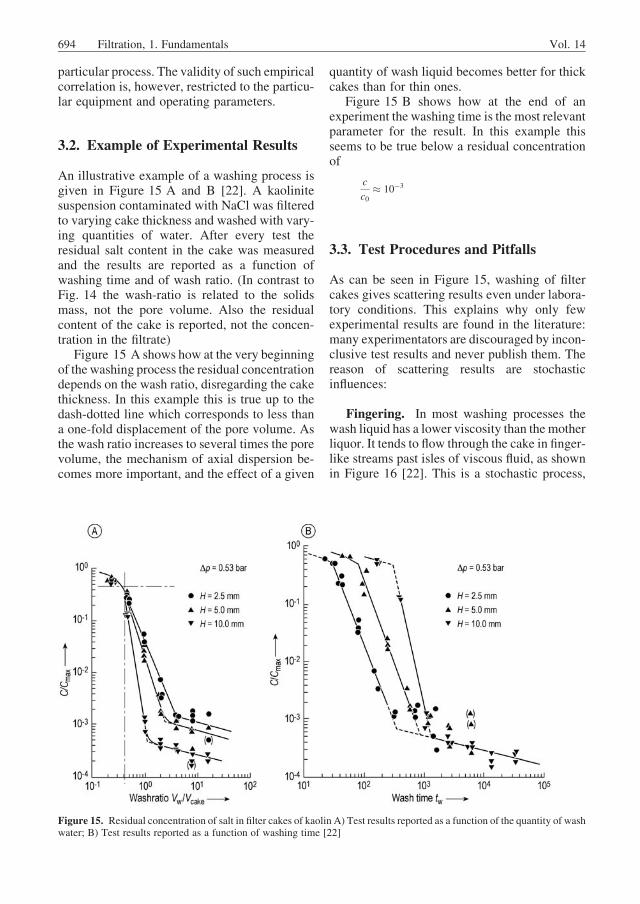
3.2. Example of Experimental Results
An illustrative example of a washing process isgiven in Figure 15 A and B [22]. A kaolinitesuspension contaminated with NaCl was filteredto varying cake thickness and washed with vary-ing quantities of water. After every test theresidual salt content in the cake was measuredand the results are reported as a function ofwashing time and of wash ratio. (In contrast toFig. 14 the wash-ratio is related to the solidsmass, not the pore volume. Also the residualcontent of the cake is reported, not the concen-tration in the filtrate)
Figure 15 A shows how at the very beginningof the washing process the residual concentrationdepends on the wash ratio, disregarding the cakethickness. In this example this is true up to thedash-dotted line which corresponds to less thana one-fold displacement of the pore volume. Asthe wash ratio increases to several times the porevolume, the mechanism of axial dispersion be-comes more important, and the effect of a given
quantity of wash liquid becomes better for thickcakes than for thin ones.
Figure 15 B shows how at the end of anexperiment the washing time is the most relevantparameter for the result. In this example thisseems to be true below a residual concentrationof
c
c0� 10�3
3.3. Test Procedures and Pitfalls
As can be seen in Figure 15, washing of filtercakes gives scattering results even under labora-tory conditions. This explains why only fewexperimental results are found in the literature:many experimentators are discouraged by incon-clusive test results and never publish them. Thereason of scattering results are stochasticinfluences:
Fingering. In most washing processes thewash liquid has a lower viscosity than the motherliquor. It tends to flow through the cake in finger-like streams past isles of viscous fluid, as shownin Figure 16 [22]. This is a stochastic process,
Figure 15. Residual concentration of salt in filter cakes of kaolin A) Test results reported as a function of the quantity of washwater; B) Test results reported as a function of washing time [22]
694 Filtration, 1. Fundamentals Vol. 14
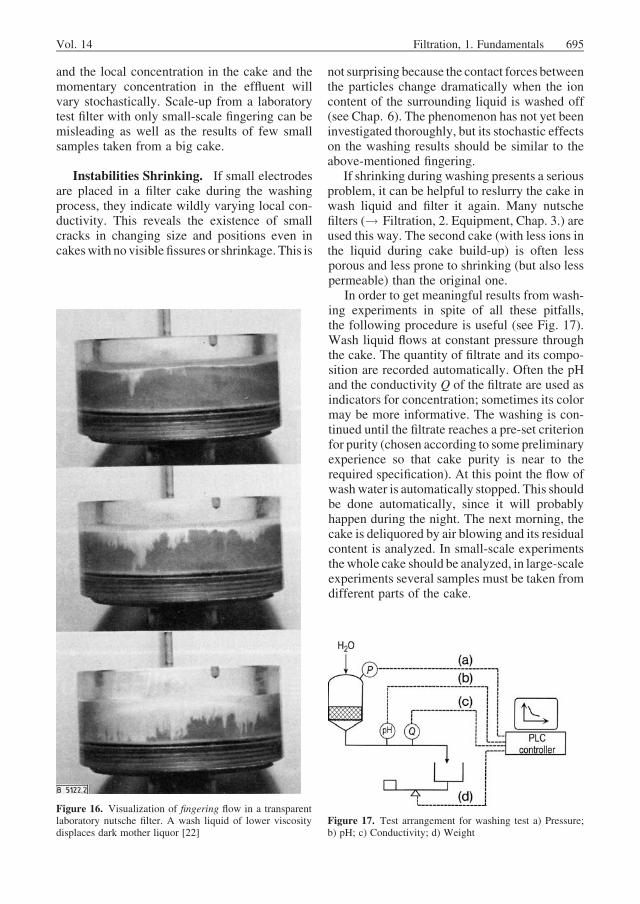
and the local concentration in the cake and themomentary concentration in the effluent willvary stochastically. Scale-up from a laboratorytest filter with only small-scale fingering can bemisleading as well as the results of few smallsamples taken from a big cake.
Instabilities Shrinking. If small electrodesare placed in a filter cake during the washingprocess, they indicate wildly varying local con-ductivity. This reveals the existence of smallcracks in changing size and positions even incakeswith no visible fissures or shrinkage. This is
not surprising because the contact forces betweenthe particles change dramatically when the ioncontent of the surrounding liquid is washed off(see Chap. 6). The phenomenon has not yet beeninvestigated thoroughly, but its stochastic effectson the washing results should be similar to theabove-mentioned fingering.
If shrinking during washing presents a seriousproblem, it can be helpful to reslurry the cake inwash liquid and filter it again. Many nutschefilters (! Filtration, 2. Equipment, Chap. 3.) areused this way. The second cake (with less ions inthe liquid during cake build-up) is often lessporous and less prone to shrinking (but also lesspermeable) than the original one.
In order to get meaningful results from wash-ing experiments in spite of all these pitfalls,the following procedure is useful (see Fig. 17).Wash liquid flows at constant pressure throughthe cake. The quantity of filtrate and its compo-sition are recorded automatically. Often the pHand the conductivity Q of the filtrate are used asindicators for concentration; sometimes its colormay be more informative. The washing is con-tinued until the filtrate reaches a pre-set criterionfor purity (chosen according to some preliminaryexperience so that cake purity is near to therequired specification). At this point the flow ofwashwater is automatically stopped. This shouldbe done automatically, since it will probablyhappen during the night. The next morning, thecake is deliquored by air blowing and its residualcontent is analyzed. In small-scale experimentsthewhole cake should be analyzed, in large-scaleexperiments several samples must be taken fromdifferent parts of the cake.
Figure 16. Visualization of fingering flow in a transparentlaboratory nutsche filter. A wash liquid of lower viscositydisplaces dark mother liquor [22]
Figure 17. Test arrangement for washing test a) Pressure;b) pH; c) Conductivity; d) Weight
Vol. 14 Filtration, 1. Fundamentals 695

The following results must then be evaluated:
1. The required washing time2. The required quantity of wash liquid3. The resulting purity of the cake
Each of these criteria will scatter stochasti-cally, but considering all three together a mean-ingful interpretation will result.
3.4. ‘‘Intermediate’’ Deliquoringbefore Cake Washing
Normally it is advantageous to deliquor the cakepartly before washing, thus reducing the amountof mother liquor to be washed out. Sometimes,however, this ‘‘intermediate’’ deliquoring hasdetrimental effects:
If deliquoring is done by gas pressure, cracksmay appear which let pass the washing liquid(see Section 4.1). In this case any deliquoringbefore the washing has to be avoided carefully.On belt filters (! Filtration, 2. Equipment,Chap. 10.) an overlap of filtering and washingzones is therefore often accepted, even if motherliquid and wash liquid get mixed. Some nutschefilters (! Filtration, 2. Equipment, Chap. 3.)have even been equipped with optical sensors toavoid premature deliquoring [23]. They mea-sure the light reflected by the liquid surface anddetect when the cake surface runs dry, so that thegas pressure can be released before cracksappear.
If deliquoring is done by compression (seeSection 4.2), the cake may get rather imperme-able. Thus, according to a rule-of-thumb theapplied pressure should be raised monotonouslyduring the sequence of filtering–intermediatedeliquoring–washing–final deliquoring, i.e., thesqueezing pressure for intermediate deliquoringshould be lower than the pressure for washing.
4. Deliquoring of Filter Cakes
4.1. Deliquoring by Gas Pressure
The moisture in the pores of a filter cake can bedisplaced by gas flowing through the cakeunder pressure. The residual saturation withmoisture as a function of time then asymptoti-
cally approaches a final equilibrium value asrepresented in Figure 18. Thus, an equilibriumis established with regard to mechanical dis-placement of the liquid. Thermal drying by air-flow will of course further reduce the moisturedown to total dryness if the air flows long enough.But generally thermal effects are small as com-pared with mechanical effects because of thecomparably small mass of air flowing througha filter cake [24].
The final equilibriummoisture formechanicaldewatering depends on the nature of the cake andthe applied pressure difference. The initial deli-quoring speed however depends in addition onthe cake thickness. For both values the flow rateof gas is apparently without importance, if it isnot to produce the pressure difference. In the nextsections first the equilibrium conditions will beexamined.
4.1.1. Equilibrium Saturation of FilterCakes
A plot of saturation of the cake versus pressuredifference in an equilibrium state is calleda capillary pressure curve. It can be measuredin a device according to Figure 19 [25]. Thesaturated filter cake (b) is placed in the filter (a)on a filter media (c) (e.g., semipermeable mi-croporous membrane, the membrane is perme-able for liquid, but it is impermeable for gas atthe applied pressure). Gas pressure is applied viaport (e). The quantity of liquid displaced fromthe cake is drained by the valve (d) and collect-ed. The standpipe is used to obtain an exactliquid level when the pressure gauge is adjustedto zero.
A typical capillary pressure curve is shown inFigure 20 (material: incompressible cake ofglass beads with a mean diameter of 79 mm and
Figure 18. Deliquoring by gas pressure— residual satura-tion as a function of time
696 Filtration, 1. Fundamentals Vol. 14
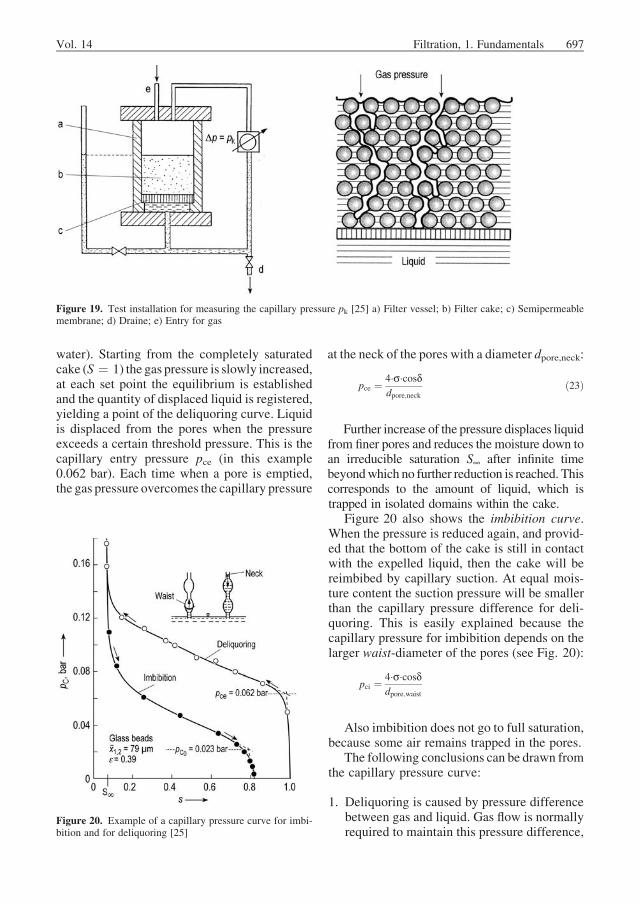
water). Starting from the completely saturatedcake (S ¼ 1) the gas pressure is slowly increased,at each set point the equilibrium is establishedand the quantity of displaced liquid is registered,yielding a point of the deliquoring curve. Liquidis displaced from the pores when the pressureexceeds a certain threshold pressure. This is thecapillary entry pressure pce (in this example0.062 bar). Each time when a pore is emptied,the gas pressure overcomes the capillary pressure
at the neck of the pores with a diameter dpore,neck:
pce ¼ 4�s�cosddpore;neck
ð23Þ
Further increase of the pressure displaces liquidfrom finer pores and reduces the moisture down toan irreducible saturation S¥ after infinite timebeyondwhich no further reduction is reached. Thiscorresponds to the amount of liquid, which istrapped in isolated domains within the cake.
Figure 20 also shows the imbibition curve.When the pressure is reduced again, and provid-ed that the bottom of the cake is still in contactwith the expelled liquid, then the cake will bereimbibed by capillary suction. At equal mois-ture content the suction pressure will be smallerthan the capillary pressure difference for deli-quoring. This is easily explained because thecapillary pressure for imbibition depends on thelarger waist-diameter of the pores (see Fig. 20):
pci ¼ 4�s�cosddpore;waist
Also imbibition does not go to full saturation,because some air remains trapped in the pores.
The following conclusions can be drawn fromthe capillary pressure curve:
1. Deliquoring is caused by pressure differencebetween gas and liquid. Gas flow is normallyrequired to maintain this pressure difference,
Figure 19. Test installation for measuring the capillary pressure pk [25] a) Filter vessel; b) Filter cake; c) Semipermeablemembrane; d) Draine; e) Entry for gas
Figure 20. Example of a capillary pressure curve for imbi-bition and for deliquoring [25]
Vol. 14 Filtration, 1. Fundamentals 697
but not for the deliquoring itself. No gas flowis necessary if the cake is placed on a semi-permeable membrane, which is impermeablefor gas. (This principle can also be usedtechnically for dewatering without gas flow[26])
2. A certain threshold pressuremust be exceededbefore liquid is displaced from the pores; thisis the capillary entry pressure pce. This impliestechnical consequences:
3. Vacuum filters are restricted to pressure dif-ferences < 1 bar. This means that cakes can-not be deliquored by suction if their pce is nearor above this limit. A pressure filter withDp> 1 bar has to be considered for suchcakes, even if its installation is much moreexpensive than that of a vacuum filter. Theo-retically suction can dewater filter cakes withpores> ca. 3 mm:with pure water and a smallcontact angle (d � 0) Equation (23) yieldsp ¼ 1 bar for dpore ¼ 2,9 mm.
Filter cakes of submicronic particles likewastewater sludge have such a high capillaryentry pressure that their pores cannot be dewa-tered mechanically: with pure water and a smallcontact angle Equation (23) yields p > 10 barfor dpore < 0.29 mm.
4.1.2. Kinetics of Deliquoring by GasPressure
In most cases there is no semipermeable mem-brane below the cake but a normal filter mediumthat is permeable for gas, like a filter cloth. Gasand liquid flow simultaneously through the cake.
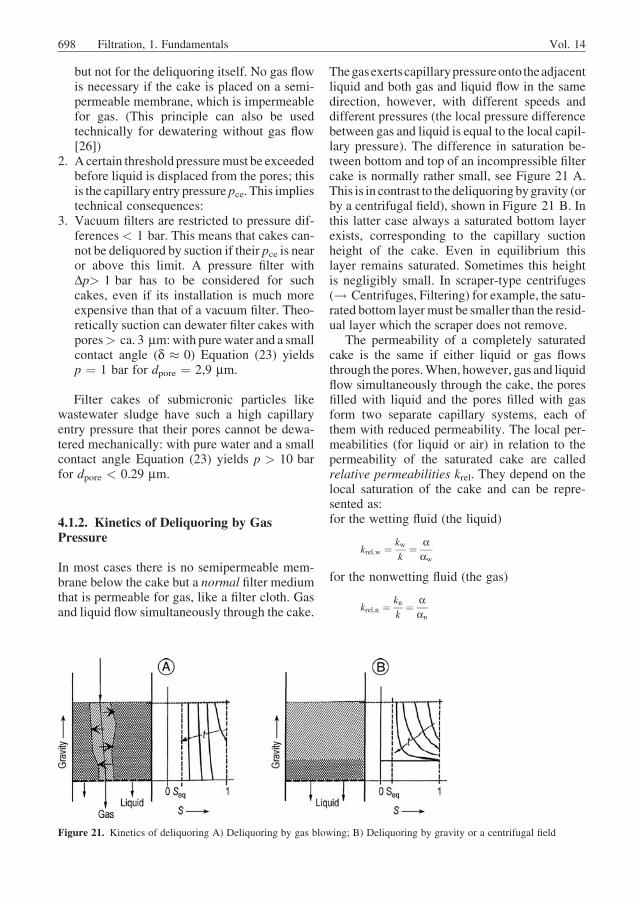
Thegasexertscapillarypressureonto theadjacentliquid and both gas and liquid flow in the samedirection, however, with different speeds anddifferent pressures (the local pressure differencebetween gas and liquid is equal to the local capil-lary pressure). The difference in saturation be-tween bottom and top of an incompressible filtercake is normally rather small, see Figure 21 A.This is in contrast to the deliquoringbygravity (orby a centrifugal field), shown in Figure 21 B. Inthis latter case always a saturated bottom layerexists, corresponding to the capillary suctionheight of the cake. Even in equilibrium thislayer remains saturated. Sometimes this heightis negligibly small. In scraper-type centrifuges(! Centrifuges, Filtering) for example, the satu-rated bottom layer must be smaller than the resid-ual layer which the scraper does not remove.
The permeability of a completely saturatedcake is the same if either liquid or gas flowsthrough the pores.When, however, gas and liquidflow simultaneously through the cake, the poresfilled with liquid and the pores filled with gasform two separate capillary systems, each ofthem with reduced permeability. The local per-meabilities (for liquid or air) in relation to thepermeability of the saturated cake are calledrelative permeabilities krel. They depend on thelocal saturation of the cake and can be repre-sented as:for the wetting fluid (the liquid)
krel;w ¼ kwk
¼ aaw
for the nonwetting fluid (the gas)
krel;n ¼ knk¼ a
an
Figure 21. Kinetics of deliquoring A) Deliquoring by gas blowing; B) Deliquoring by gravity or a centrifugal field
698 Filtration, 1. Fundamentals Vol. 14

Such relative permeabilities are shown sche-matically in Figure 22 as a function of cakesaturation [27]. The permeability for the liquid(the wetting phase) declines to zero at a finitesaturation. This value corresponds to the irreduc-ible saturation S¥. At the other extreme the flowof air ceases when the saturation is above 90%.Some of the voids are filled with air withoutallowing an appreciable airflow.
If the curves for capillary pressure and for therelative permeabilities as a function of saturationare known, the local values of capillary pressure,gas permeability, and liquid permeability aredefined as functions of the local saturation. Thedeliquoring kinetics by gas flow can then bedescribed mathematically. The resulting systemof interdependent differential equations ishowever extremely complex and not suited forpractical application. For scientific purposesapproximate solutions have been verified bycomparing them to experiments [25].
4.1.3. Approximate Solution for Coarse,Incompressible Cakes
For the particular case of incompressible cakeswith threshold pressures much smaller than theapplied gas pressure pce � p (hence for rathercoarse solid particles), WAKEMAN has describedthe process of deliquoring by gas pressure bythree dimensionless parameters [28]:
reduced saturation
SR ¼ S
1�S¥
dimensionless time
Q ¼ pce�taH�h�H2�ð1�S¥Þ�"
dimensionless pressure difference
DP ¼ pentrypce
� pexitpce
According to this approach, the cake is char-acterized by its porosity e, the filter resistanceaH
(of the saturated cake) and the capillary pressurecurve which itself is approximately described bythe capillary entry pressure pce and the ‘‘irreduc-ible’’ saturation S¥ (see Fig. 20). The relativepermeabilities are described by generalized in-terpolation formula. With these approximationsthe residual saturation and the theoretical gasflow rate can be read from the dimensionlesscharts, shown in Figures 23 and 24. An examplehow to apply these charts is given in [29]. How-ever, the validity of these charts is limited topce � p and to incompressible cakes. Also thegas flow rate indicated on the chart does not takeinto account the possibility of cracks in the cakewhich can increase the gas flow tremendously(see Section 4.1.5).
Figure 22. Relative permeability as a function of saturation[27]
Figure 23. Reduced cake saturation vs. dimensionless time[29]
Vol. 14 Filtration, 1. Fundamentals 699
4.1.4. Practical Scale-Up of Deliquoring byGas Pressure
The deliquoring kinetics are normally investigat-ed by measuring the residual moisture as a func-tion of cake thickness, blowing time, and pressuredifference. The results are interpolated to give theparameters necessary for scale-up. Extrapolationbeyond the investigated range of cake thickness,blowing time, and pressure should be avoided. Inaddition it is important tomeasure and to scale-upthe gas flow from realistic experiments, since inmost cases the capacity of the compressor is thelimiting factor, not the pressure. Particular atten-tion has to be paid to the possible formation ofcracks. In case of doubt, a filter test with suffi-
ciently large filter area is recommended, becausethe cracksmay not be pronounced and obvious ona small laboratory filter. Typically the cracksappear at a characteristic liquid saturation whichthen represents the limit for deliquoring by gasblowing with technically reasonable gas flowrates (see Section 4.1.5).
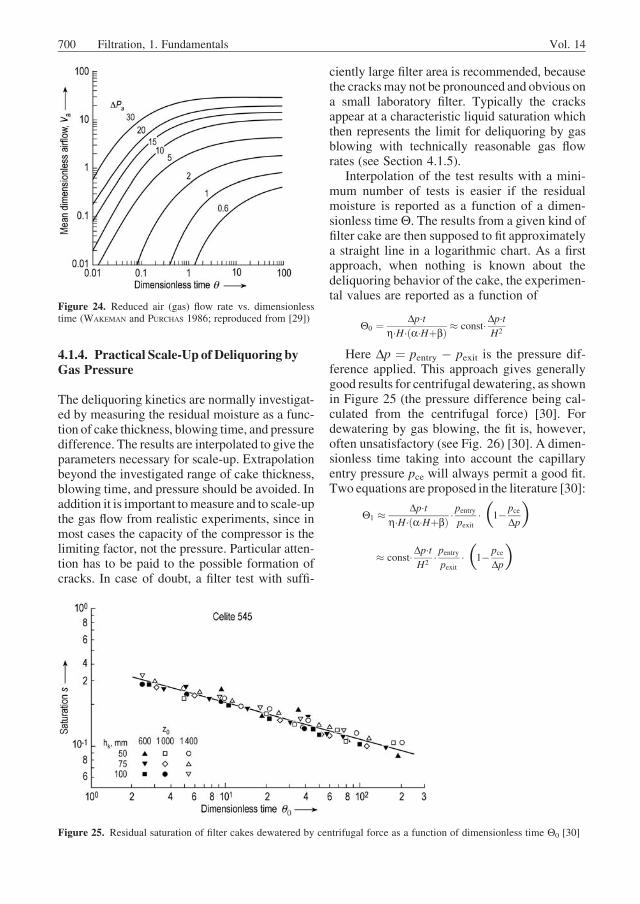
Interpolation of the test results with a mini-mum number of tests is easier if the residualmoisture is reported as a function of a dimen-sionless timeQ. The results from a given kind offilter cake are then supposed to fit approximatelya straight line in a logarithmic chart. As a firstapproach, when nothing is known about thedeliquoring behavior of the cake, the experimen-tal values are reported as a function of
Q0 ¼ Dp�th�H�ða�HþbÞ � const�Dp�t
H2
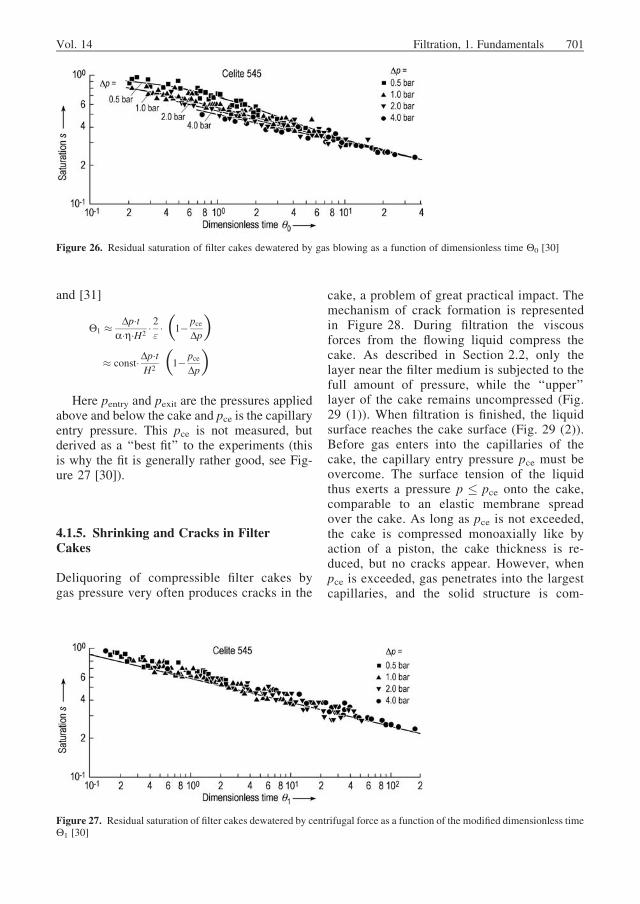
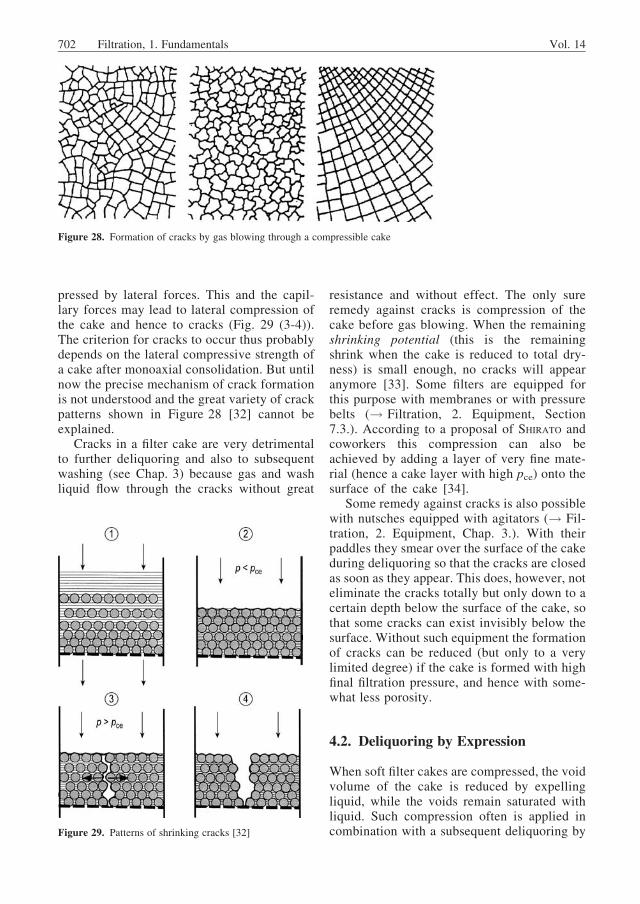
Here Dp ¼ pentry � pexit is the pressure dif-ference applied. This approach gives generallygood results for centrifugal dewatering, as shownin Figure 25 (the pressure difference being cal-culated from the centrifugal force) [30]. Fordewatering by gas blowing, the fit is, however,often unsatisfactory (see Fig. 26) [30]. A dimen-sionless time taking into account the capillaryentry pressure pce will always permit a good fit.Two equations are proposed in the literature [30]:
Q1 � Dp�th�H�ða�HþbÞ �
pentrypexit
� ð1� pceDpÞ
� const�Dp�tH2
� pentrypexit
� ð1� pceDpÞ
Figure 24. Reduced air (gas) flow rate vs. dimensionlesstime (WAKEMAN and PURCHAS 1986; reproduced from [29])
Figure 25. Residual saturation of filter cakes dewatered by centrifugal force as a function of dimensionless time Q0 [30]
700 Filtration, 1. Fundamentals Vol. 14
and [31]
Q1 � Dp�ta�h�H2
� 2"� ð1� pce
Dp� const�Dp�t
H2 ð1� pceDpÞ
Here pentry and pexit are the pressures appliedabove and below the cake and pce is the capillaryentry pressure. This pce is not measured, butderived as a ‘‘best fit’’ to the experiments (thisis why the fit is generally rather good, see Fig-ure 27 [30]).
4.1.5. Shrinking and Cracks in FilterCakes
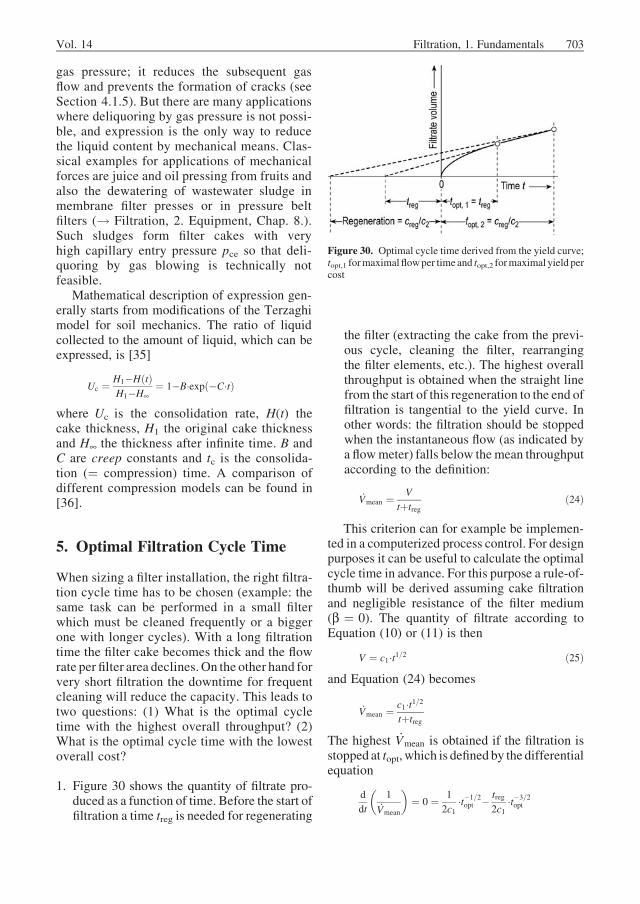
Deliquoring of compressible filter cakes bygas pressure very often produces cracks in the
cake, a problem of great practical impact. Themechanism of crack formation is representedin Figure 28. During filtration the viscousforces from the flowing liquid compress thecake. As described in Section 2.2, only thelayer near the filter medium is subjected to thefull amount of pressure, while the ‘‘upper’’layer of the cake remains uncompressed (Fig.29 (1)). When filtration is finished, the liquidsurface reaches the cake surface (Fig. 29 (2)).Before gas enters into the capillaries of thecake, the capillary entry pressure pce must beovercome. The surface tension of the liquidthus exerts a pressure p � pce onto the cake,comparable to an elastic membrane spreadover the cake. As long as pce is not exceeded,the cake is compressed monoaxially like byaction of a piston, the cake thickness is re-duced, but no cracks appear. However, whenpce is exceeded, gas penetrates into the largestcapillaries, and the solid structure is com-
Figure 26. Residual saturation of filter cakes dewatered by gas blowing as a function of dimensionless time Q0 [30]
Figure 27. Residual saturation of filter cakes dewatered by centrifugal force as a function of the modified dimensionless timeQ1 [30]
Vol. 14 Filtration, 1. Fundamentals 701
pressed by lateral forces. This and the capil-lary forces may lead to lateral compression ofthe cake and hence to cracks (Fig. 29 (3-4)).The criterion for cracks to occur thus probablydepends on the lateral compressive strength ofa cake after monoaxial consolidation. But untilnow the precise mechanism of crack formationis not understood and the great variety of crackpatterns shown in Figure 28 [32] cannot beexplained.
Cracks in a filter cake are very detrimentalto further deliquoring and also to subsequentwashing (see Chap. 3) because gas and washliquid flow through the cracks without great
resistance and without effect. The only sureremedy against cracks is compression of thecake before gas blowing. When the remainingshrinking potential (this is the remainingshrink when the cake is reduced to total dry-ness) is small enough, no cracks will appearanymore [33]. Some filters are equipped forthis purpose with membranes or with pressurebelts (! Filtration, 2. Equipment, Section7.3.). According to a proposal of SHIRATO andcoworkers this compression can also beachieved by adding a layer of very fine mate-rial (hence a cake layer with high pce) onto thesurface of the cake [34].
Some remedy against cracks is also possiblewith nutsches equipped with agitators (! Fil-tration, 2. Equipment, Chap. 3.). With theirpaddles they smear over the surface of the cakeduring deliquoring so that the cracks are closedas soon as they appear. This does, however, noteliminate the cracks totally but only down to acertain depth below the surface of the cake, sothat some cracks can exist invisibly below thesurface. Without such equipment the formationof cracks can be reduced (but only to a verylimited degree) if the cake is formed with highfinal filtration pressure, and hence with some-what less porosity.
4.2. Deliquoring by Expression
When soft filter cakes are compressed, the voidvolume of the cake is reduced by expellingliquid, while the voids remain saturated withliquid. Such compression often is applied incombination with a subsequent deliquoring by
Figure 28. Formation of cracks by gas blowing through a compressible cake
Figure 29. Patterns of shrinking cracks [32]
702 Filtration, 1. Fundamentals Vol. 14
gas pressure; it reduces the subsequent gasflow and prevents the formation of cracks (seeSection 4.1.5). But there are many applicationswhere deliquoring by gas pressure is not possi-ble, and expression is the only way to reducethe liquid content by mechanical means. Clas-sical examples for applications of mechanicalforces are juice and oil pressing from fruits andalso the dewatering of wastewater sludge inmembrane filter presses or in pressure beltfilters (! Filtration, 2. Equipment, Chap. 8.).Such sludges form filter cakes with veryhigh capillary entry pressure pce so that deli-quoring by gas blowing is technically notfeasible.
Mathematical description of expression gen-erally starts from modifications of the Terzaghimodel for soil mechanics. The ratio of liquidcollected to the amount of liquid, which can beexpressed, is [35]
Uc ¼ H1�HðtÞH1�H¥
¼ 1�B�expð�C�tÞ
where Uc is the consolidation rate, H(t) thecake thickness, H1 the original cake thicknessand H¥ the thickness after infinite time. B andC are creep constants and tc is the consolida-tion (¼ compression) time. A comparison ofdifferent compression models can be found in[36].
5. Optimal Filtration Cycle Time
When sizing a filter installation, the right filtra-tion cycle time has to be chosen (example: thesame task can be performed in a small filterwhich must be cleaned frequently or a biggerone with longer cycles). With a long filtrationtime the filter cake becomes thick and the flowrate per filter area declines. On the other hand forvery short filtration the downtime for frequentcleaning will reduce the capacity. This leads totwo questions: (1) What is the optimal cycletime with the highest overall throughput? (2)What is the optimal cycle time with the lowestoverall cost?
1. Figure 30 shows the quantity of filtrate pro-duced as a function of time. Before the start offiltration a time treg is needed for regenerating
the filter (extracting the cake from the previ-ous cycle, cleaning the filter, rearrangingthe filter elements, etc.). The highest overallthroughput is obtained when the straight linefrom the start of this regeneration to the end offiltration is tangential to the yield curve. Inother words: the filtration should be stoppedwhen the instantaneous flow (as indicated bya flowmeter) falls below themean throughputaccording to the definition:
_Vmean ¼ V
tþtregð24Þ
This criterion can for example be implemen-ted in a computerized process control. For designpurposes it can be useful to calculate the optimalcycle time in advance. For this purpose a rule-of-thumb will be derived assuming cake filtrationand negligible resistance of the filter medium(b ¼ 0). The quantity of filtrate according toEquation (10) or (11) is then
V ¼ c1�t1=2 ð25Þand Equation (24) becomes
_Vmean ¼ c1�t1=2tþtreg
The highest _Vmean is obtained if the filtration isstopped at topt, which is defined by the differentialequation
d
dt
1_Vmean
� �
¼ 0 ¼ 1
2c1�t�1=2opt � treg
2c1�t�3=2opt
Figure 30. Optimal cycle time derived from the yield curve;topt,1 formaximal flowper time and topt,2 formaximal yield percost
Vol. 14 Filtration, 1. Fundamentals 703

This leads to the rule-of-thumb for maximumthroughput:
topt;1 ¼ treg
This rule is valid if the influence of the filtermedium resitance is neglected (b ¼ 0).2. Quite analogous considerations are valid
for the optimal cycle time in terms of costper quantity filtered. During filtration, therunning cost is proportional to time (capitalcost and pumping energy), cost ¼ c2t. InFigure 30 all costs are converted with thisproportionality factor c2 into an equivalentrunning time: t ¼ cost/c2.Regeneration re-presents a considerable cost, includingdowntime, labor, new filter elements, anddisposal of waste. If this cost is called creg,the mean specific cost is
cost
filtrate¼ c2�tþcreg
V
With the approximation of Equation (25) this is
cost
filtrate¼ c2
c1�t1=2opt;2þ
cregc1
�t�1=2opt;2
The minimum is defined by
d
dt
cost
filtrate
� �¼ 0 ¼ c2
2c1�t�1=2opt;2�
creg2c1
�t�3=2opt;2
As result the rule-of-thumb for maximal yieldper cost is obtained:
c2�topt;2 ¼ creg
or cost for the filter run ¼ cost for regeneratingthe filter.
These rules have been derived here for con-stant pressure filtration. They can also be derivedfor filter runs with different but constant flowrates until a pre-set final pressure. Practitionerstherefore apply the rule-of-thumb rather gener-ally (e.g., also for filtration with a pump witha characteristic curve anywhere between con-stant pressure and constant flow).
6. Interparticle Forces and ForcesBetween Particles and Filtermedia,DLVO Theory
According to the theory of DERJAGUIN, LANDAU,VERWEY, and OVERBEEK (DLVO theory), the
forces between suspended particles of equal ma-terial are described by repulsion due to electro-static charges and attraction due to van derWaals’ forces:
Repulsion. Particles in suspension (espe-cially in polar liquids like water) have an electri-cally charged surface due to adsorption anddissolution of ions. The order of magnitude ofthis charge z is�120 mV < z < 120 mV, and itdepends on the pH of the liquid. The chargereaches relatively far, depending on the ion con-tent of the surrounding liquid. The reach ischaracterized by the Debye length rD. In puredistilled water this length is exceptionally longwith 0.9 mm. Inmost technical aqueous solutionsit is much smaller, in sea water for example only0.4 nm [37].
Attraction. Van derWaals forces are part ofthe cohesive forces between themoleculeswithinthe solid particle. They reach also a certaindistance beyond the surface, but their range isless than that of electrostatic forces. The declineis proportional to the distance according to
Eattraction ¼ � const
r
When two particles approach to distance zero,these attractive forces become very strong andshould in principle become equal to the cohesiveforce inside the particle. The reality is, however,more complicated because there are always ab-sorbed molecules on the surface.
An example of the superposition of bothforces according to DLVO theory is representedin Figure 31. The graph shows the resultingenergy potential. A positive gradient of thecurves describes attraction, negative gradientrepulsion. At very small distances, attractionprevails. At larger distance electrostatic repul-sion prevails (if it is not zero).
Attraction and repulsion between two parti-cles in suspension. The superposition of electro-static repulsion and attraction by van der Waalsforces is represented by the resulting energypotential. High ion content in the surroundingliquid reduces the reach of electrostatic repulsion(Debye length)
Interparticle contact. Electrostaticallycharged particles repulse one another. In com-
704 Filtration, 1. Fundamentals Vol. 14

parison to their equally charged neighborsthey show some kind of smooth and slipperyrepulsive skin. (The smooth repulsive skin canbe made visible with modern atomic forcemicroscopy, see [38].) The Debye length char-
acterizes the thickness of this skin (seeFig. 32).
Without electric charge, there is no such skin.The particles touch their neighbors with theirrough surfaces and tend to adhere due to van derWaals’ forces.
Particles in aqueous suspension with weakelectric charge most probably have oppositelycharged patches on their surface what mayenhance mutual adhesion and the formation ofloose flocs.
In comparison to particles with the samesurface charge, it is covered with a repulsiveskin of a thickness near the Debye length. Thisskin has no roughness and no friction; hence itis rather slippery
The surface charge of suspended particlescan be measured as a zeta potential (! Col-loids, Chap. 4.; ! Emulsions, Section 11.6.).This potential varies with the suspending liq-uid, especially with its pH: High pH means ahigh concentration of OH� ions, which can beabsorbed, creating a negative surface charge.Low pH means high concentration of protonsand a positive surface charge. At a certain pHthe surface is neutral (point of zero charge,isoelectric point). At this particular pH, theparticles can more easily agglomerate and areeasier to filter. This optimal pH is often de-termined empirically without knowledge ofthe zeta potential.
7. Mathematical Simulation ofFiltration and Cake Formation
Different attempts have been made to simulatenumerically the structure and porosity of filtercakes. Until now such calculations are restrictedto spherical particles with homogeneous surface.Starting from randomly chosen locations thetrajectories of particles in a filter flow are calcu-lated. When they touch the cake surface, thedeposition is simulated using either a stickingangle [39, 40], or a friction angle and an adhesiveforce [41, 42], or by estimating the interparticleforces from van der Waals’ and electrostaticforces according to the DLVO theory [43]. Aftercalculating the deposition of a large number ofparticles, the packing density of the resulting cakeis found (see Figure 33 A and B). These calcula-
Figure 31. Energy potential vs. particle distance (DLVO-theory)
Figure 32. A particle in suspension
Vol. 14 Filtration, 1. Fundamentals 705
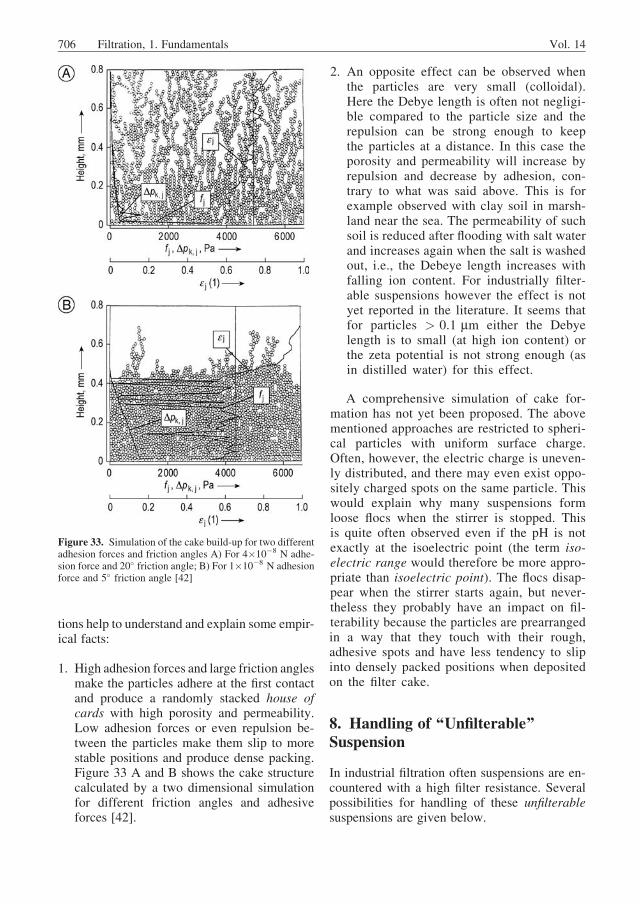
tions help to understand and explain some empir-ical facts:
1. High adhesion forces and large friction anglesmake the particles adhere at the first contactand produce a randomly stacked house ofcards with high porosity and permeability.Low adhesion forces or even repulsion be-tween the particles make them slip to morestable positions and produce dense packing.Figure 33 A and B shows the cake structurecalculated by a two dimensional simulationfor different friction angles and adhesiveforces [42].
2. An opposite effect can be observed whenthe particles are very small (colloidal).Here the Debye length is often not negligi-ble compared to the particle size and therepulsion can be strong enough to keepthe particles at a distance. In this case theporosity and permeability will increase byrepulsion and decrease by adhesion, con-trary to what was said above. This is forexample observed with clay soil in marsh-land near the sea. The permeability of suchsoil is reduced after flooding with salt waterand increases again when the salt is washedout, i.e., the Debeye length increases withfalling ion content. For industrially filter-able suspensions however the effect is notyet reported in the literature. It seems thatfor particles > 0.1 mm either the Debyelength is to small (at high ion content) orthe zeta potential is not strong enough (asin distilled water) for this effect.
A comprehensive simulation of cake for-mation has not yet been proposed. The abovementioned approaches are restricted to spheri-cal particles with uniform surface charge.Often, however, the electric charge is uneven-ly distributed, and there may even exist oppo-sitely charged spots on the same particle. Thiswould explain why many suspensions formloose flocs when the stirrer is stopped. Thisis quite often observed even if the pH is notexactly at the isoelectric point (the term iso-electric range would therefore be more appro-priate than isoelectric point). The flocs disap-pear when the stirrer starts again, but never-theless they probably have an impact on fil-terability because the particles are prearrangedin a way that they touch with their rough,adhesive spots and have less tendency to slipinto densely packed positions when depositedon the filter cake.
8. Handling of ‘‘Unfilterable’’Suspension
In industrial filtration often suspensions are en-countered with a high filter resistance. Severalpossibilities for handling of these unfilterablesuspensions are given below.
Figure 33. Simulation of the cake build-up for two differentadhesion forces and friction angles A) For 4�10�8 N adhe-sion force and 20 friction angle; B) For 1�10�8 N adhesionforce and 5 friction angle [42]
706 Filtration, 1. Fundamentals Vol. 14
8.1. Optimization of Upstream Steps(Crystallization, Precipitation)
Considerable improvements in filterability areachieved by producing coarser particles. Goodknowledge is available about crystallization(! Crystallization and Precipitation). If, how-ever, the solids are formed by precipitation, i.e.,by mixing two reactants, this quick processoften depends strongly on the mixing conditionsand the reaction speeds. In this case the filter-ability must be improved empirically. Improve-ment has been achieved with the followingparameters:
1. Continuous mixing instead of batch mixing2. Recycling of suspended solids to the zone of
solids formation3. Variation of temperature, mixing ratio,
stirring speed etc.
8.2. Application of Flocculants(Polyelectrolytes)
Synthetic, water-soluble polymers are highlyeffective as flocculating agents. They agglom-erate fine particles in aqueous dispersion tovoluminous flocs, which settle and filtereasily. As a general rule, however, the result-ing filter cake or sediment has a higher poros-ity and residual moisture than withoutflocculation.
Synthetic flocculants are commercially avail-able as nonionic, anionic, or cationic grades withmore or less ionic character. A charge opposite tothe zeta potential of the solids to be separatedgives theoretically the best effect. In practice it is,however, easier to observe the flocculation visu-ally without knowledge of the surface charge.Samples of the suspension are prepared in grad-uated cylinders and gently mixed with differentflocculants in 0.1% solution. The high dilution isnecessary to reduce the viscosity and facilitatemixing. The required quantity of polyelectrolyteis generally in the range of 0.5–10 kg per ton drysolids, equivalent to 10–100 mL of solution for1 L suspension.
Criteria for the flocculation effect are settlingspeed, clarity of the supernatant, and aspects ofthe flocs (small, dense flocs are sometimespreferred, because they are more stable).
8.3. Adaptation of pH
As explained in Chapter 6, the interparticleforces depend on the pH of the surroundingliquid. With a pH in the isoelectric range theparticles can aggregate and their filter resistanceand settling speed is increased.
8.4. Checking of Alternatives to CakeFiltration
Possiblealternatives tofiltrationareprocessingin:
1. Settling centrifuges (! Centrifuges, Sedi-menting) or static settlers. Even poorly filter-able suspensions sometimes settle readily,either the solids have high specific weight orbig, soft flocs make an impermeable cake(e.g., wastewater sludge)
2. Cross-flow filtration (see Section 2.5). Thisalternative, however, yields the solids asa thickened suspension only
3. Evaporation of the liquid (! Evaporation).This alternative may be attractive if therequired energy is not to high (highly concen-tratedsuspensionoraliquidwithmoderateheatof evaporation, like many organic solvents)
8.5. Use of a Filter Aid
Filter aids are inert powders added to the liquid tobe filtered and increasing the porosity andpermeability of the cake (! Filtration, 2. Equip-ment, Chap. 16.). They are very helpful, providedthe presence of filter aid in the solid can beaccepted. Filter aids are used in two ways:
. As a precoat layer to protect the filter mediumand improve filtrate clarity
. As a body feed to increase flow rates
Preliminary laboratory tests help to identifythe proper kind of filter aid. The selection proce-dure is done in three steps:
1. Selection of the rightmaterial according to thechemical resistance and purity (perlite, diato-maceous earth, cellulose, carbon)
2. Selection of the grade (particle size) of thefilter aid. The particle size should be as coarseas possible to give low filter resistance, but
Vol. 14 Filtration, 1. Fundamentals 707
fine enough to prevent the dirt particles fromtrickling through the pores of the cake. Forselection of the grade a precoat layer is pre-pared by filtering a diluted suspension of filteraid. Then the solution to be cleaned is filteredthrough this layer. After filtration the precoatlayer is broken in half. The dirt should forma separate layer on the top and should not havepenetrated into the precoat
3. Selection of the quantity of filter aid. As a firstguess the quantity of filter aid is calculatedwhich gives a cake volume equal to the vol-ume of dirt to be separated. It is then admixedto the suspension and the filterability of thismixture determined. If the flow rate is to low,the next trial should be made with a higherquantity of filter aid
References
1 H. Darcy: ‘‘Les fontaines publiques de la ville de Dijon,’’
Paris 1856.
2 J. Kozeny,Ber. Math.-naturwiss. Abt. Akad.Wien. (1927)
271 – 306.
3 A. E. Scheidegger: The Physics of Flow Through Porous
Media, 3rd ed., University of Toronto Press, Toronto
1974, pp. 137ff.
4 H. Rumpf, A. R. Gupte,Chem. Ing. Tech. 43 (1971) no. 6,
367 – 375.
5 W. G€osele, Filtrieren Separieren 9 (1995) no. 1, 14 – 22.
6 VDI-Richtlinie ‘‘Filtrierbarkeit von Suspensionen’’ VDI
2762, 1997.
7 ‘‘Filtrierbarkeit von Suspensionen, ’’VDI-Richtlinie 2762
(1997) .
8 J. Tichy: Fortschritt–Berichte VDI, Reihe 3, Nr. 877,
Sonthofen (2007) .
9 L. Svarovsky: Solid – Liquid Separation, Butterworths,
London 1977, p. 175.
10 M. Tiller, T. Cleveland, R. Lu, Ind. Eng. Chem. Res. 38
(1999) 590 – 595.
11 P. H. Hermans, H. L. Bred�ee, Rec. Trav. Chim. 54 (1935)
680 – 700.
12 A. Rushton, A. S. Ward, R. G. Holdich: Solid – Liquid
Filtration and Separation Technology, VCH Verlagsge-
sellschaft, Weinheim, Germany, 1996, pp. 64 ff.
13 K. Luckert, Wiss. Z. Techn. Univ. Magdeburg 36 (1992)
no. 5/6, 74 – 80.
14 P. L. Boucher, J. Proc. Inst. Civ. Eng. (1946 – 1947)
415 – 445.
15 A. Rushton, A. S. Ward, R. G. Holdich: Solid – Liquid
Filtration and Separation Technology, VCH Verlagsge-
sellschaft, Weinheim, Germany, 1996, p. 198.
16 A. Rushton, A. S. Ward, R. G. Holdich: Solid – Liquid
Filtration and Separation Technology, VCH Verlagsge-
sellschaft, Weinheim, Germany 1996, pp. 185 ff.
17 K. J. Ives, in A. Rushton (ed.):Mathematical Models and
Design Methods in Solid-Liquid Separation, NATO ASI
series E No. 88, Martinus Nijhoff, Dordrecht 1985,
pp. 90 ff.
18 G. Dierckx in: La Filtration Industrielle des Liquides,
Tome III, Soci�et�e Belge deFiltration,Li�ege1978, pp. 295 –
314.
19 A. Palinski, W. Uhl, R. Gimbel, Vom Wasser 89 (1997)
175 – 189.
20 J. Altmann, S. Ripperger, J. Membrane Sci. 124 (1997)
119 – 128.
21 S. Ripperger, J. Altmann,Filtrieren Separieren 11 (1997)
no. 3, 109 – 113.
22 W.Bender,Chem. Ing. Tech. 55 (1983) no. 11, 823 – 829.
23 K.-H. Steiner, Chem. Ing. Tech. 61 (1989) no. 1, 1 – 8.
24 H. Anlauf, Fortschrittsber. VDI, Reihe 3, 114 (1986) .
25 H. Schubert: Kapillarit€at in por€osen Feststoffsystemen,
Springer Verlag, Heidelberg 1982, p. 184.
26 H. Anlauf, Maschinenmarkt 95 (1989) no. 8, 26 – 30.
27 R. J. Wakeman: ‘‘Cake Dewatering’’, in L. Svarovsky
(ed.): Solid – Liquid Separation, Butterworths, London
1977, p. 300.
28 R. J. Wakeman, Filtr. Sep. 16 (1979) no. 6, 655 – 669.
29 A. Rushton, A. S. Ward, R. G. Holdich: Solid – Liquid
Filtration and Separation Technology, VCH Verlagsge-
sellschaft, Weinheim, Germany, 1996, pp. 348 ff.
30 D. Redeker, K.-H. Steiner, U. Esser, Chem. Ing. Tech. 55
(1983) no. 11, 829 – 839.
31 I. Nicolaou, W. Stahl, Aufbereit. Tech. 33 (1992) no. 6,
328 – 338.
32 J. Walker, Spektrum Wissensch. 12 (1986) 188 – 197.
33 W. Tiedemann, Fortschrittsber. VDI, Reihe 3, 453
(1996) .
34 M. Shirato, T. Murase, E. Iritani, S. Nakatsuka,Filtr. Sep.
24 (1987) no. 2, 115 – 119.
35 A. Rushton, A. S. Ward, R. G. Holdich: Solid – Liquid
Filtration and Separation Technology, VCH Verlagsge-
sellschaft, Weinheim, Germany 1996, pp. 455 ff.
36 D. Leclerc, S. Rebouillat, in A. Rushton (ed.):Mathemat-
ical Models and Design Methods in Solid – Liquid Sepa-
ration, NATO ASI series E No. 88, Martinus Nijhoff,
Dordrecht 1985, pp. 356 ff.
37 J. Gregory in K. J. Ives (ed.): The Scientific Basis of
Flocculation, Sijdhoff & Noordhoff, Alphen aan de Rijn
1978, p. 91.
38 H.-J. Jacobasch, P. Weidenhammer, Chem. Ing. Tech. 68
(1996) 1590 – 1594.
39 D. Houi, R. Lenormand, in F. Family, D. P. Landau (eds.):
Kinetics of Aggregation and Gelation, Elsevier, Amster-
dam 1984.
40 P. Schmitz, B. Wandelt, D. Houi, M. Hildenbrand,
J. Membrane. Sci. 84 (1993) 171 – 183.
41 W. H€oflinger, C. St€ockelmayer, A. Hackl, Filtr. Sep.
(1994) Dec., 807 – 811.
42 W. H€oflinger, C. St€ockelmayer, Staub Reinhalt. Luft 55
(1995) 423 – 428.
43 W.-M. Lu, C. C. Lai, K.-J. Hwang, Sep. Technol. 5 (1995)
45 – 53.
708 Filtration, 1. Fundamentals Vol. 14
Further Reading
G. G. Chase, E. Mayer: Filtration, ‘‘Kirk Othmer Encyclo-
pedia of Chemical Technology’’, 5th ed., vol. 11, p. 321–
397, John Wiley & Sons, Hoboken, 2005, online: DOI:
10.1002/0471238961.0609122019220118.a01.pub2
(March 2003)
K. Sutherland:A-Z of Filtration and Related Separations, 1st
ed., Elsevier, Oxford 2005.
K. Sutherland: Filters and Filtration Handbook, 5th ed.,
Elsevier Butterworth-Heinemann, Amsterdam 2008.
R. J. Wakeman, E. S. Tarleton: Solid/liquid Separation,
1st ed., Elsevier, Oxford 2005.
Vol. 14 Filtration, 1. Fundamentals 709