chapter vi cost and return analysis of egg production...
TRANSCRIPT
CHAPTER VI
COST AND RETURN ANALYSIS OF EGG
PRODUCTION
6.1 INTRODUCTION
6.2 LIFE HISTORY OF CHICKEN
6.2.1 Duration of the life of chicken in the process of egg laying
6.2.2 Duration of the life of chicken in one year
6.3 HATCHERIES POPULATION
6.4 COST OF PRODUCTION
6.4.1 Expenditure incurred during brooding stage
6.4.2 Expenditure incurred during growing stage
6.4.3 Expenditure incurred during adult stage
6.5 COST OF SALES OF EGG
6.5.1 Annual average cost of sales of egg in small poultry farm
6.5.2 Annual average cost of sales of egg in medium poultry farm
6.5.3 Annual average cost of sales of egg in large poultry farm
6.6 EGG PRODUCTION
6.6.1 Number of eggs laid by chickens
6.6.2 Number of eggs laid by chickens in small poultry farm
6.6.3 Number of eggs laid by chickens in medium poultry farm
6.6.4 Number of eggs laid by chickens in large poultry farm
6.6.5 Marketable surplus or eggs
232
6.7 PRICE ANALYSIS
6.7.1 Analytical Frame work
6.7.2 Secular Trend
6.7.3 Cyclical Variation
6.7.4 Seasonal Variation
6.7.5 Irregular Variation
6.7.6 Temporal Variation
233
6.1 INTRODUCTION
A study of cost and returns in different farm sizes will help the poultry
entrepreneurs in the decision making process. An economic analysis of cost is
an indicator of profitability in farming activity. However, a general descriptive
analysis of costs and returns is no substitute for a vigorous production function
analysis which serves well as an indicator of the efficiency of factors
proportion in production. Nevertheless, a study of costs and returns throws
useful light on aspects which need careful scrutiny in a vigorous analysis. With
this in view, an attempt was made to analyze cost and returns of egg production
in the study region of Salem district.
6.2 LIFE HISTORY OF CHICKEN
Egg Laying
The female chicken is called the hen and the male chicken is called the
rooster. A hen does not actually need to mate with a rooster to lay eggs.
However, for an egg to develop into a chick, the egg needs to be fertilized. The
eggs that we purchase at the grocery store are nothing but unfertilized eggs. A
hen lays one egg a day and has the capacity to lay over 300 eggs a year.
Moreover, the hen begins to lay eggs when she attains 20 weeks of age.
Formation of the Egg
The process from creation of the egg to being laid, takes about 25 hours.
The egg begins with the formation of egg yolk inside the hen. This yolk is
234
produced by the ovary of the hen by a process called ovulation. The yolk at this
stage is called oocyte. This yolk or oocyte travels down the hen's oviduct,
where it is fertilized internally by the sperm from the rooster. Fertilization is
not necessary for egg formation. If it does take place it leads to the
development of chicks later on.
As this yolk moves further down, it gets covered with a white membrane
called vitelline membrane and some layers of egg white or albumin. Thus, this
is where the egg white begins to get developed. The yolk with the albumin
continues to move further down the oviduct, where a casing for the egg white
and egg yolk are formed. Slowly and gradually the shell of the egg develops
and after 20 hours, it gets completely formed. The egg shell receives its
pigmentation, which is produced in the chickens. Once the egg shell is
complete, the hens lays her egg in a comfortable place.
Chick
After the hen lays her egg, the chick inside the egg will grow for 21
days. The baby chick uses the yolk in the egg for its nutrition as it grows bigger
and bigger. The hen maintains the necessary temperature for proper
development of the chicks inside the eggs by sitting on them and keeping them
warm. She also turns the eggs around with her beak. After this period of 21
days of incubation, the egg breaks and the wet chick crack the shell and enter
this world. They come with wet feathers, which dry fast. Chicks can walk as
235
soon as they are hatched. It is important to remember that only fertilized eggs
will develop into chicks. Since chicks like their parent chickens lack teeth, they
use their gizzards to break down their food into smaller bits. However, for this
they need to be fed with a grainy substance called grit, which needs to be
sprinkled in their food once the chicks become 7 days old.
Chicken
In a period of 6 months, the chicks grow into adult chicks. As per the
gender of the chick, the male chicks will grow into roosters with colorful
plumage, while the female chicks will grow into hens. When they reach
adulthood, the rooster and hen will mate and the chicken life cycle continues.
Chickens are raised at home and even on poultry farms in large
numbers. In some cases, they are solely bred either for meat or for eggs for,
while in some cases they are bred for both eggs and meat. Some keep chickens
as pets on their farms. Irrespective of the reason why they are raised, chicks
and chickens are real fun to have around the farm. Watching the entire life
cycle of a chicken taking place before our eyes and watching how the mother
hen takes care of her young one is simply endearing!
Brooding (Day-old to 6 weeks)
When a hen sits still for a prolonged period without eating or drinking
normally, she is said to be ‘broody’. This is a normal process during which the
hen stops producing eggs in order to incubate a nest full of eggs. When the

236
eggs hatch the hen then cares for the chicks by keeping them warm and finding
feed and water for them. Modern strains of chicken have been selected not to
go broody so that more eggs are laid over a period of time.
When rearing chicks commercially the aim is to do the same thing as the
hen. The stage of life when chicks need some additional heat is called the
brooding stage. It lasts up to six weeks, depending on the temperature of the
environment until the chicks can control their body temperature themselves.
From day-old they usually receive chick starter feed which aims to ensure they
have plenty of protein (19 per cent) and energy for body growth.
Growing (6 to 20 weeks)
Once the chicks are able to control their body temperature they still need
to be protected from climate extremes. At this stage, they receive pullet grower
feed which is less expensive and contains only 15 per cent to 17 per cent
protein and 7 per cent less energy than the starter feed.
Beak-trimming is done and some vaccinations are given during the
grower stage to prepare the birds for their adult life as laying hens. Anything
that limits growth at this time can affect their ability to lay well.
However, excessive feeding at this time can be harmful, again leading to poor
production.
Restriction in feed supply to birds during growing stops them from
growing at a fast rate and results in both feed savings and increased egg
production when the birds mature. Careful weekly weighing of the birds is
237
essential to restrict body weight and work out when the flock is growing.
Breeding companies recommend what weight birds should be at each age.
Adult layer (20 to/up to 78 weeks)
Adult hens are the real workers of the industry. For best performance
they need to be fed carefully and kept in a house at 21-28oC. This means that
hen houses are designed to keep as near as possible to this temperature round
the year. The hens are checked regularly to monitor their health and medicines
may be administered as needed. Tinted egg strains usually require less feed
(105g feed/hen/day) than brown egg strains (120g feed/hen/day).
The quality of feed provided to hens may be varied based on the level of
production. Hens would need more nutrients just before and during their peak
production than at other times. This is called phase feeding. It can be
economical to adjust rations for such high demand periods1.
1 www.poultry.dahd.nic.in/poultry/chickenhistory.html
238
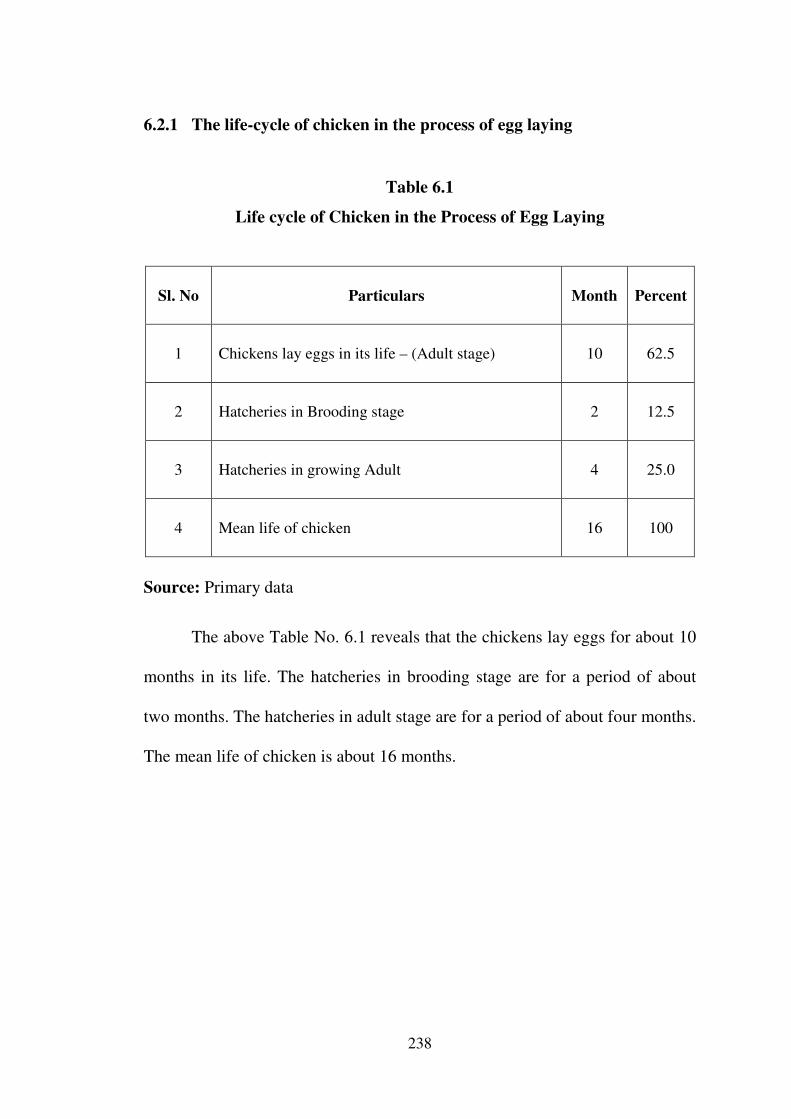
6.2.1 The life-cycle of chicken in the process of egg laying
Table 6.1
Life cycle of Chicken in the Process of Egg Laying
Sl. No Particulars Month Percent
1 Chickens lay eggs in its life – (Adult stage) 10 62.5
2 Hatcheries in Brooding stage 2 12.5
3 Hatcheries in growing Adult 4 25.0
4 Mean life of chicken 16 100
Source: Primary data
The above Table No. 6.1 reveals that the chickens lay eggs for about 10
months in its life. The hatcheries in brooding stage are for a period of about
two months. The hatcheries in adult stage are for a period of about four months.
The mean life of chicken is about 16 months.
239
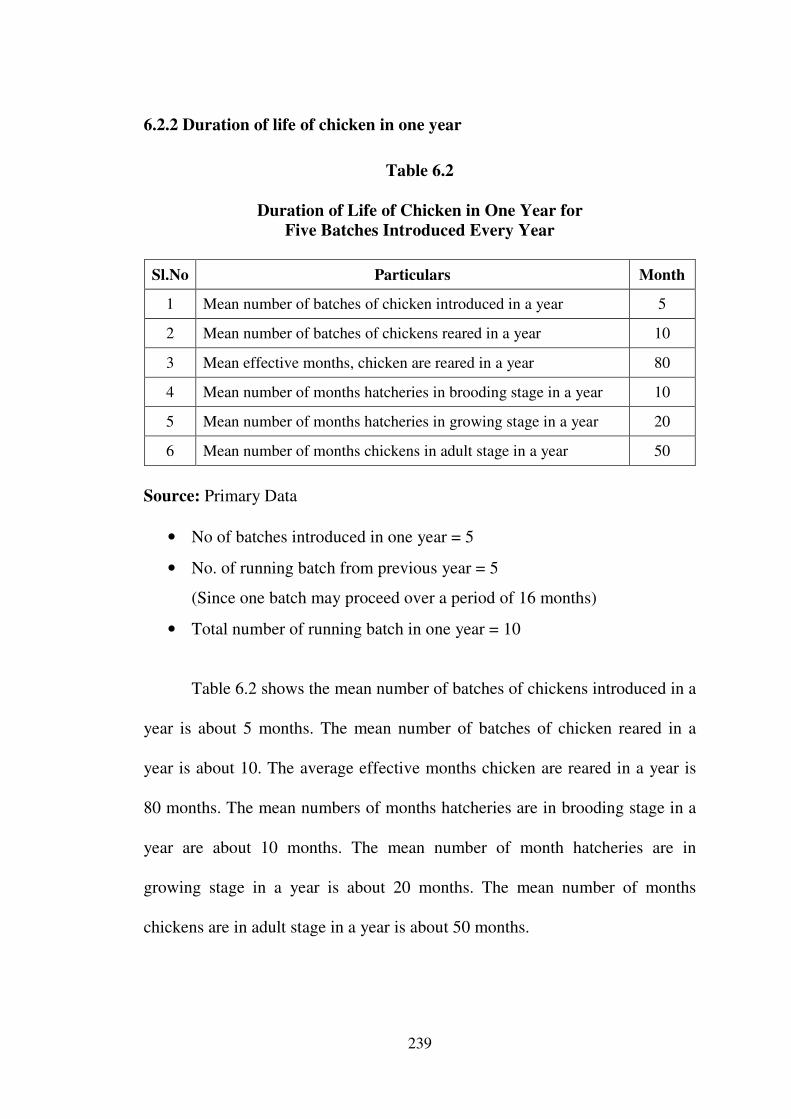
6.2.2 Duration of life of chicken in one year
Table 6.2
Duration of Life of Chicken in One Year for
Five Batches Introduced Every Year
Sl.No Particulars Month
1 Mean number of batches of chicken introduced in a year 5
2 Mean number of batches of chickens reared in a year 10
3 Mean effective months, chicken are reared in a year 80
4 Mean number of months hatcheries in brooding stage in a year 10
5 Mean number of months hatcheries in growing stage in a year 20
6 Mean number of months chickens in adult stage in a year 50
Source: Primary Data
• No of batches introduced in one year = 5
• No. of running batch from previous year = 5
(Since one batch may proceed over a period of 16 months)
• Total number of running batch in one year = 10
Table 6.2 shows the mean number of batches of chickens introduced in a
year is about 5 months. The mean number of batches of chicken reared in a
year is about 10. The average effective months chicken are reared in a year is
80 months. The mean numbers of months hatcheries are in brooding stage in a
year are about 10 months. The mean number of month hatcheries are in
growing stage in a year is about 20 months. The mean number of months
chickens are in adult stage in a year is about 50 months.

240
6.3 HATCHERIES POPULATION
Hatcheries Population
The raising chickens has been taking place for so many years that its
difficult to remember not having these wonderful creatures and their fabulous
eggs. As anyone who raises chickens knows, when a hen gets older, she begins
to lay fewer eggs. Most hatcheries rear almost five batches. To maintain a
steady supply of eggs, its important, from time to time, to bring in a group of
new layers. This is usually done by ordering baby chicks and raising them to
adulthood.
Table 6.3 shows the categorywise classification of annual mean
hatcheries population in poultry industry in the study area.
Table 6.3
Annual Mean Hatcheries Population Reared in Poultry Industry
Sl.
No. Particulars
Type of Industry
Small Medium Large
1. Mean number of hatcheries reared per batch 5180 8472 15607
2. Mean number of casuality per batch 622 953 1579
3. Live population of hatcheries per batch 4558 7519 14028
4. Mean number of batches reared in one year 10 10 10
5. Live population of hatcheries per year 45580 75190 140280
6. Percentage of causality 12.00 11.25 10.12
Source: Primary Data
241
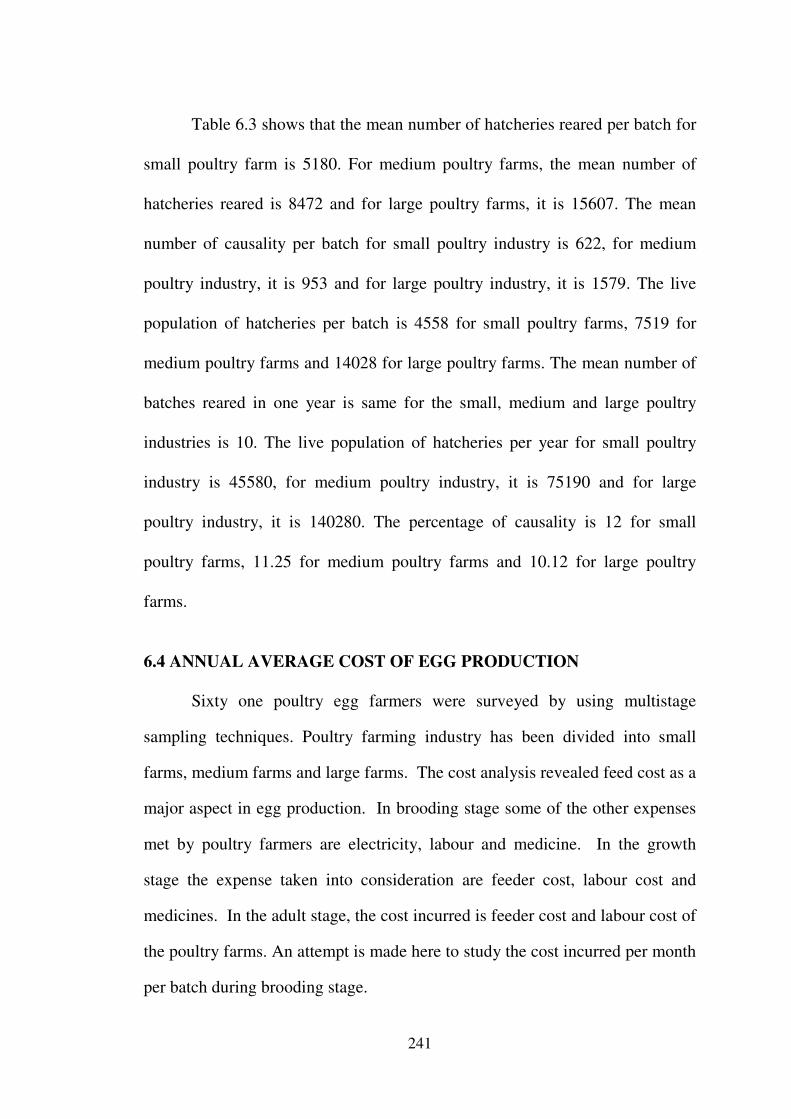
Table 6.3 shows that the mean number of hatcheries reared per batch for
small poultry farm is 5180. For medium poultry farms, the mean number of
hatcheries reared is 8472 and for large poultry farms, it is 15607. The mean
number of causality per batch for small poultry industry is 622, for medium
poultry industry, it is 953 and for large poultry industry, it is 1579. The live
population of hatcheries per batch is 4558 for small poultry farms, 7519 for
medium poultry farms and 14028 for large poultry farms. The mean number of
batches reared in one year is same for the small, medium and large poultry
industries is 10. The live population of hatcheries per year for small poultry
industry is 45580, for medium poultry industry, it is 75190 and for large
poultry industry, it is 140280. The percentage of causality is 12 for small
poultry farms, 11.25 for medium poultry farms and 10.12 for large poultry
farms.
6.4 ANNUAL AVERAGE COST OF EGG PRODUCTION
Sixty one poultry egg farmers were surveyed by using multistage
sampling techniques. Poultry farming industry has been divided into small
farms, medium farms and large farms. The cost analysis revealed feed cost as a
major aspect in egg production. In brooding stage some of the other expenses
met by poultry farmers are electricity, labour and medicine. In the growth
stage the expense taken into consideration are feeder cost, labour cost and
medicines. In the adult stage, the cost incurred is feeder cost and labour cost of
the poultry farms. An attempt is made here to study the cost incurred per month
per batch during brooding stage.

242
Table 6.4
Average Cost Incurred Per Month Per Batch During Brooding Stage
Sl.
No. Particulars
Type of industry
Small Medium Large
Amount
(Rs.) Percent
Amount
(Rs.) Percent
Amount
(Rs.) Percent
1. Feeder Cost 37117.20 45.81 50745.76 41.13 82798.43 37.35
2. Labour cost 3785.00 4.67 4990.61 4.05 6071.43 2.74
3. Medicine Cost 2483.20 3.06 3565.97 2.89 7737.71 3.49
4. Cost of
electricity 37635.40 46.45 64071.73 51.93 125050.65 56.42
5. Total cost 81020.00 100.00 123374.07 100.00 221658.22 100.00
Source: Primary Data
Table 6.4 reveals that the feeder cost amounts to Rs.37117.20 for small
poultry industries, Rs.50745.76 for medium poultry industries and Rs.82798.43
for large poultry industries. The labour cost amounts to Rs.3785 in small
poultry industries, Rs.4990.61 in medium poultry industries and Rs.6071.43 in
large poultry industries. The cost of medicines worked out to be about
Rs.2483.20 for small poultry industries, Rs.3565.97 for medium poultry
industries and Rs.7737.71 for large poultry industries. The electricity charge is
about Rs.37635.40 for small poultry industries, Rs.64071.73 for medium
poultry industries and Rs.125050.65 for large poultry industries. It is evident
from the Table that the electricity charges is higher for the small, medium, as
well as the large poultry industries compared to the other costs. The Table also
infers that the total cost for the large poultry industries (Rs.221658.22) is

243
higher than that of small poultry industries (Rs.81020) and medium poultry
industries (Rs.123374.07).
Table 6.5 below indicates the cost incurred per month per batch during
the growing stage with respect to small, medium and large types of farms.
Table 6.5
Average Cost Incurred Per Month Per Batch During Growing Stage
Sl.
No. Particulars
Type of industry
Small Medium Large
Amount
(Rs.) Percent
Amount
(Rs.) Percent
Amount
(Rs.) Percent
1. Feeder Cost 61949.35 89.76 50745.76 85.57 82798.43 85.71
2. Labour cost 4870.00 7.06 4990.61 8.42 6071.43 6.28
3. Medicine Cost 2198.75 3.19 3565.97 6.01 7737.71 8.01
4. Total cost 69018.10 100.00 59302.34 100.00 96607.57 100.00
Source: Primary Data
Table 6.5 shows that the feeder cost amounts to Rs.61949.35 for small
poultry industries, Rs.37254.15 for medium poultry industries and
Rs.177029.86 for large poultry industries. The labour cost amounts to Rs.4870
for small poultry industries, Rs.7683.33 for medium poultry industries and
Rs.7357.14 for large poultry industries. The medicine cost worked out to
Rs.2198.75 for small poultry industries, Rs.3744.18 for medium poultry
industries and Rs.7016.86 for large poultry industries. It is evident from the
Table that the feeder cost is higher for the small, medium, as well as the large
poultry industries compared to the other costs. The Table also infers that the

244
total cost for the large poultry industries (Rs.191403.86) is higher than that of
small poultry industries (Rs.69018.1) and medium poultry industries
(Rs.108681.66).
The figures in Table 6.6 reveal the cost incurred during adult stage by
taking feed cost and labour cost into account.
Table 6.6
Average Cost Incurred Per Month Per Batch During Adult Stage
Sl.
No. Particulars
Type of industry
Small Medium Large
Amount
(Rs.) Percent
Amount
(Rs.) Percent
Amount
(Rs.) Percent
1. Feeder Cost 60200.15 86.67 98556.39 87.73 192170.00 92.00
2. Labour cost 9255.00 13.33 13784.85 12.27 16714.29 8.00
3. Total cost 69455.15 100.00 112341.24 100.00 208884.29 100.00
Source: Primary Data
Table 6.6 reveals that the feeder cost amounts to Rs.60200.15 for small
poultry industries, Rs.98556.39 for medium poultry industries and Rs.192170
for large poultry industries. The labour cost ammount to Rs.9255 for small
poultry industries, Rs.13784.85 for medium poultry industries and Rs.16714.29
for large poultry industries. It is evident from the Table that the feeder cost is
higher for the small, medium, as well as the large poultry industries compared
to the other costs. The Table also infers that the total cost for the large poultry
industries (Rs.208884.29) is higher than that of small poultry industries
(Rs.69455.15) and medium poultry industries (Rs.112341.24).

245
6.5 COST OF SALE OF EGG
In order to know the cost of sale of egg. One must know the cost of
hatcheries, brooding stage, growing stage, adult stage, cost of production
manufacturing over heads, administrative over heads, other fixed cost, cost of
sales etc. All these particulars are listed below in Table No. 6.7.
Costs. When calculating costs for the laying cycle, the main expenditures to
consider are:
� Rearing - rearing brooders until they become layers.
� Housing - building or maintaining laying house and brooder house.
� Equipment - the cost of miscellaneous items such as feeders,
buckets, etc.
� Feed - total feed used during the year.
� Labour - labour costs incurred in rearing and manage birds.
� Vaccinations - medicines and veterinary visits.
� Mortality - loss of laying birds due to disease etc.
� Various expenses - lighting, water etc.
Income. When calculating income for the laying cycle, the earnings to consider
are derived from:
� The sale of eggs.
� The sale of culled birds after the first cycle of production.
� Where applicable manure sold as fertilizer.

246
Table 6.7
Annual Average Cost of Sales of Egg in Small Poultry Farm
Sl.No Particulars Cost/
month Months Total cost Percent
1. Cost of hatcheries 595182.00 4.37
2. Brooding stage 81020.80 10 810208.00 5.95
3. Growing stage 69018.1 20 1380362.00 10.14
4 Adult stage 96455.15 50 3472757.50 25.51
5. Cost of production 6258509.50 45.98
6 Manufacturing overheads 2552400 18.75
7. Administrative overheads 1338400 9.83
8. Other fixed costs 3461600 25.43
9. Cost of sales 13610909.50 100.00
10. Less: Miscellaneous Receipts
11. Sale of manure 162720.60
12. Sale of cull bird 861462.00
Total Misc. receipts 1024182.60
13. Net cost of sales 12586726.90
Source: Primary data
Table 6.7 reveals that the expenditure starts with the cost of hatcheries
which amounts to Rs.595182 (4.37 per cent). The brooding stage cost is
Rs.810208 (5.95 per cent), growing stage cost is Rs.1380362 (10.14 per cent)
and the adult stage cost is Rs.3472757.50 (25.51 per cent). The cost of
production amounts to Rs.6258509.50 (45.98 per cent) followed by the
manufacturing overheads Rs.2552400 (18.75 per cent) and the administrative
overheads Rs.1338400 (9.83 per cent). The other fixed costs amounts to
Rs.3461600 (25.43 per cent). The total cost of sales is Rs.13610909.50 (100
per cent). Income of the small poultry farm in sale of manure is Rs.162720.60
247
(1.20 per cent) and sale of cull bird is Rs.861462 (6.33 per cent). Total
miscellaneous receipts are Rs.1024182.60 (7.52 per cent). So the net cost of
sales is total expenses minus total receives which amounts to about
Rs.12586726.90.
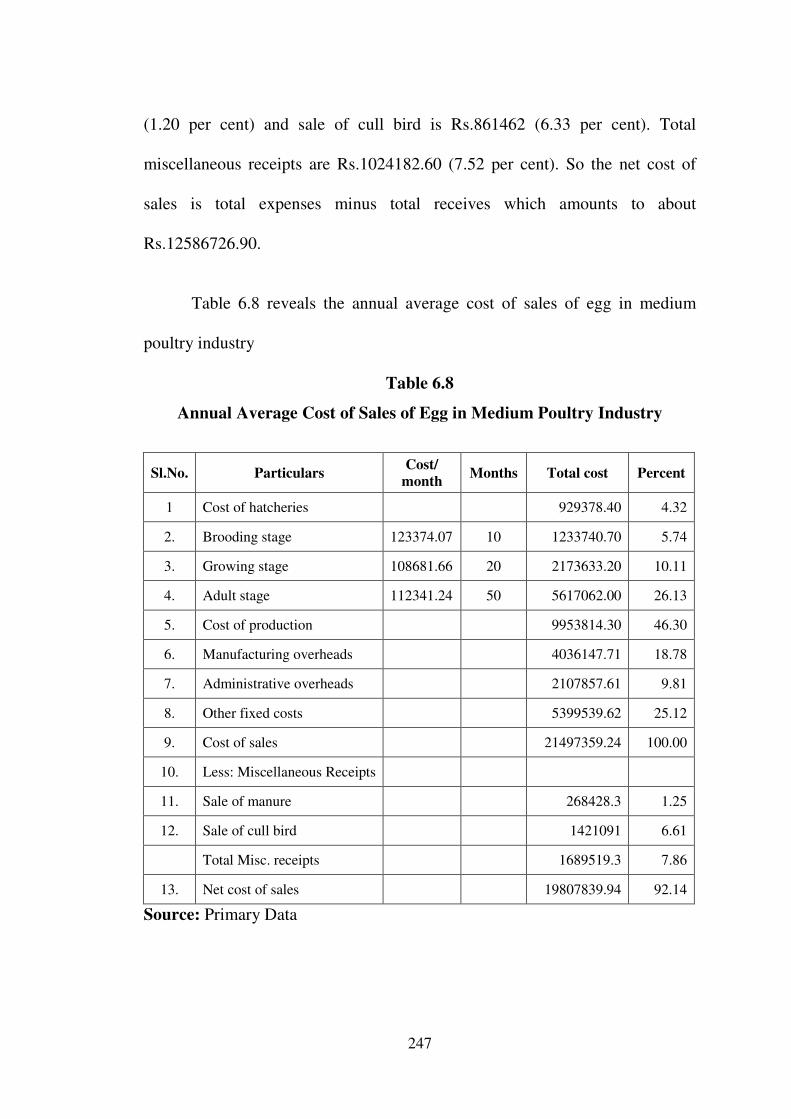
Table 6.8 reveals the annual average cost of sales of egg in medium
poultry industry
Table 6.8
Annual Average Cost of Sales of Egg in Medium Poultry Industry
Sl.No. Particulars Cost/
month Months Total cost Percent
1 Cost of hatcheries 929378.40 4.32
2. Brooding stage 123374.07 10 1233740.70 5.74
3. Growing stage 108681.66 20 2173633.20 10.11
4. Adult stage 112341.24 50 5617062.00 26.13
5. Cost of production 9953814.30 46.30
6. Manufacturing overheads 4036147.71 18.78
7. Administrative overheads 2107857.61 9.81
8. Other fixed costs 5399539.62 25.12
9. Cost of sales 21497359.24 100.00
10. Less: Miscellaneous Receipts
11. Sale of manure 268428.3 1.25
12. Sale of cull bird 1421091 6.61
Total Misc. receipts 1689519.3 7.86
13. Net cost of sales 19807839.94 92.14
Source: Primary Data

248
Table 6.8 reveals that the expenditure starts with the cost of hatcheries
which amounts to Rs.929378.40 (4.32 per cent). The brooding stage cost is
Rs.1233740.70 (5.74 per cent), growing stage cost is Rs.2173633.20 (10.11 per
cent) and the adult stage cost is Rs.5617062 (26.13 per cent). The cost of
production amounts to Rs.9953814.30 (46.30 per cent) followed by the manu-
facturing overheads Rs.4036147.71 (18.78 per cent) and the administrative
overheads Rs.2107857.61 (9.81per cent). The other fixed costs amounts for
Rs.5399539.62 (25.12 per cent). The total cost of sales is Rs. 21497359.24 (100
per cent). Income of the small poultry farm from sale of manure is Rs.268428.3
(1.25 per cent) and sale of cull bird Rs.1421091 (6.61 per cent). Total
miscellaneous receipts are Rs.1689519.3 (7.86 per cent). So the net cost of
sales is total expenses minus total receipt which amount to Rs.19807839.94.
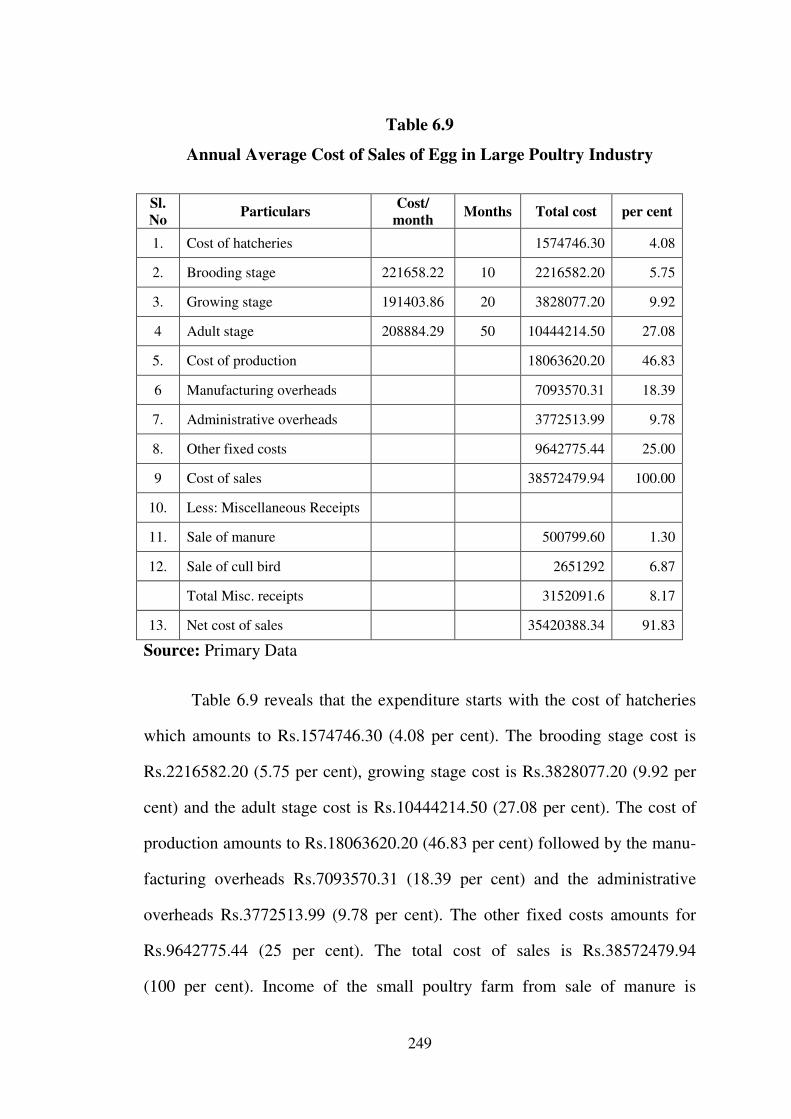
The figures given below in Table 6.9 show the annual average cost of
sales of egg in large poultry farms.
249
Table 6.9
Annual Average Cost of Sales of Egg in Large Poultry Industry
Sl.
No Particulars
Cost/
month Months Total cost per cent
1. Cost of hatcheries 1574746.30 4.08
2. Brooding stage 221658.22 10 2216582.20 5.75
3. Growing stage 191403.86 20 3828077.20 9.92
4 Adult stage 208884.29 50 10444214.50 27.08
5. Cost of production 18063620.20 46.83
6 Manufacturing overheads 7093570.31 18.39
7. Administrative overheads 3772513.99 9.78
8. Other fixed costs 9642775.44 25.00
9 Cost of sales 38572479.94 100.00
10. Less: Miscellaneous Receipts
11. Sale of manure 500799.60 1.30
12. Sale of cull bird 2651292 6.87
Total Misc. receipts 3152091.6 8.17
13. Net cost of sales 35420388.34 91.83
Source: Primary Data
Table 6.9 reveals that the expenditure starts with the cost of hatcheries
which amounts to Rs.1574746.30 (4.08 per cent). The brooding stage cost is
Rs.2216582.20 (5.75 per cent), growing stage cost is Rs.3828077.20 (9.92 per
cent) and the adult stage cost is Rs.10444214.50 (27.08 per cent). The cost of
production amounts to Rs.18063620.20 (46.83 per cent) followed by the manu-
facturing overheads Rs.7093570.31 (18.39 per cent) and the administrative
overheads Rs.3772513.99 (9.78 per cent). The other fixed costs amounts for
Rs.9642775.44 (25 per cent). The total cost of sales is Rs.38572479.94
(100 per cent). Income of the small poultry farm from sale of manure is

250
Rs.500799.60 (1.30 per cent) and sale of cull bird Rs.2651292 (6.87 per cent).
Total miscellaneous receipts are Rs.315209.6 (8.17 per cent). So the net cost of
sales is total expenses minus total receipts which amounts to Rs.35420380.34.
6.6 EGG PRODUCTION
Birds usually start to lay eggs at around five months (20-21 weeks) of
age and continue to lay for 12 months (52 weeks) on an average, laying fewer
eggs as they near the moulting period.
The typical production cycle lasts about 17 months (72 weeks) and
involves three distinct phases, as follows.
Phase 1: Small chicks or brooders. This phase lasts from 0 to 2 months (0-8
weeks) during which time small chicks are kept in facilities (brooder houses)
separate from laying birds.
Phase 2: Growers. This phase lasts about 3 months, from the nineth to the
twentieth week of age. Growers may be either housed separately from small
chicks or continue to be reared in brooder-cum-grower houses. It is important
to provide appropriate care to the growers, particularly, between their
seventeenth and twentieth week of age as their reproductive organs develop
during this period.
Phase 3: Layers. Growers are transferred from the grower house to the layer
house when they are 18 weeks old to prepare for the laying cycle. Birds
251
typically lay for a twelve-month period starting when they are about 21 weeks
old and lasting until they are about 72 weeks old.
Production planning
On an average a bird produces one egg per day. Furthermore, not all
birds start to lay exactly when they are 21 weeks old. Planning is therefore
required for egg production to be constant so as to meet the market demand.
In areas where the climate is hot and humid, commercial hybrid laying
birds produce on average of 180 to 200 eggs per year. In very high temperature
climate, birds can produce on average of 250 to 300 eggs per year.
The age of the flock is shown in Table 6.10 the first column and the
percentage of birds that actually lay during that week of age is shown in the
second column. Usually at 21 weeks of age only 5 per cent of the flock lay.
For 100 birds at 21 weeks of age, only five would actually be laying. On an
average a bird produces 208 eggs over a twelve-month period, which is a
weekly production rate of four eggs per bird. At 21 weeks of age 20 eggs are
produced (five birds produce four eggs each) and at 22 weeks 40 eggs are
produced etc.
Egg production rises rapidly and then starts to fall after 31 weeks of age.
When less than 65 per cent of the flock are laying eggs (71 weeks of age), it
may become uneconomical to retain birds. Feed costs and sales of culled birds
for meat must be considered along with the prices for eggs. In some instances
252
when egg prices are high it may be viable to delay culling birds until only 45
per cent of the flock is still laying eggs (78 weeks of age).
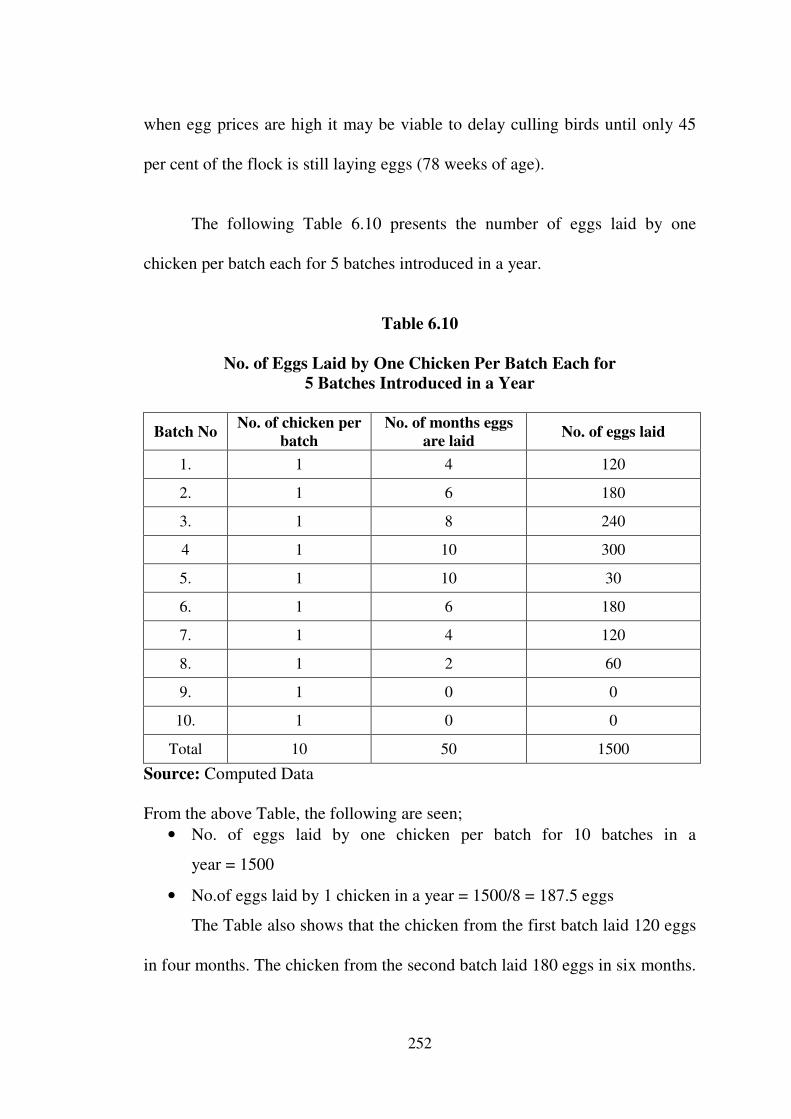
The following Table 6.10 presents the number of eggs laid by one
chicken per batch each for 5 batches introduced in a year.
Table 6.10
No. of Eggs Laid by One Chicken Per Batch Each for
5 Batches Introduced in a Year
Batch No No. of chicken per
batch
No. of months eggs
are laid No. of eggs laid
1. 1 4 120
2. 1 6 180
3. 1 8 240
4 1 10 300
5. 1 10 30
6. 1 6 180
7. 1 4 120
8. 1 2 60
9. 1 0 0
10. 1 0 0
Total 10 50 1500
Source: Computed Data
From the above Table, the following are seen;
• No. of eggs laid by one chicken per batch for 10 batches in a
year = 1500
• No.of eggs laid by 1 chicken in a year = 1500/8 = 187.5 eggs
The Table also shows that the chicken from the first batch laid 120 eggs
in four months. The chicken from the second batch laid 180 eggs in six months.
253
240 eggs were laid by the chicken from the third batch in about eight months.
The chicken from the fourth batch laid 300 eggs in 10 months. The chicken
from the fifth batch laid 30 eggs in 10 months. So the total number of eggs laid
by one chicken per batch for 5 batches introduced in the year is about 870. For
last 10 batches for 50 months the, total eggs laid is 1500.
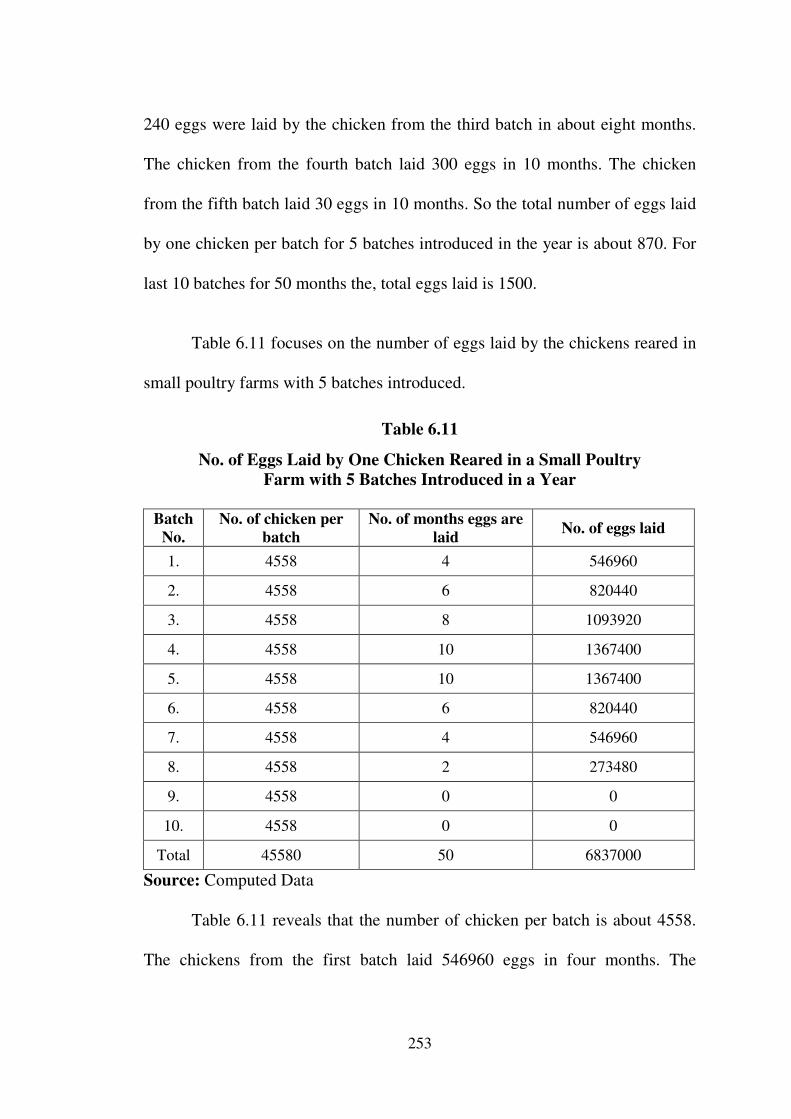
Table 6.11 focuses on the number of eggs laid by the chickens reared in
small poultry farms with 5 batches introduced.
Table 6.11
No. of Eggs Laid by One Chicken Reared in a Small Poultry
Farm with 5 Batches Introduced in a Year
Batch
No.
No. of chicken per
batch
No. of months eggs are
laid No. of eggs laid
1. 4558 4 546960
2. 4558 6 820440
3. 4558 8 1093920
4. 4558 10 1367400
5. 4558 10 1367400
6. 4558 6 820440
7. 4558 4 546960
8. 4558 2 273480
9. 4558 0 0
10. 4558 0 0
Total 45580 50 6837000
Source: Computed Data
Table 6.11 reveals that the number of chicken per batch is about 4558.
The chickens from the first batch laid 546960 eggs in four months. The
254
chickens from the second batch laid 820440 eggs in six months. 1093920 eggs
were laid by the chickens from the third batch in about eight months. The
chickens from the fourth batch laid 1367400 eggs in 10 months. The chickens
from the fifth batch laid 1367400 eggs in 10 months. So the total number of
eggs laid by chickens reared in small poultry farm with 5 batches introduced in
the year is about 5196120.
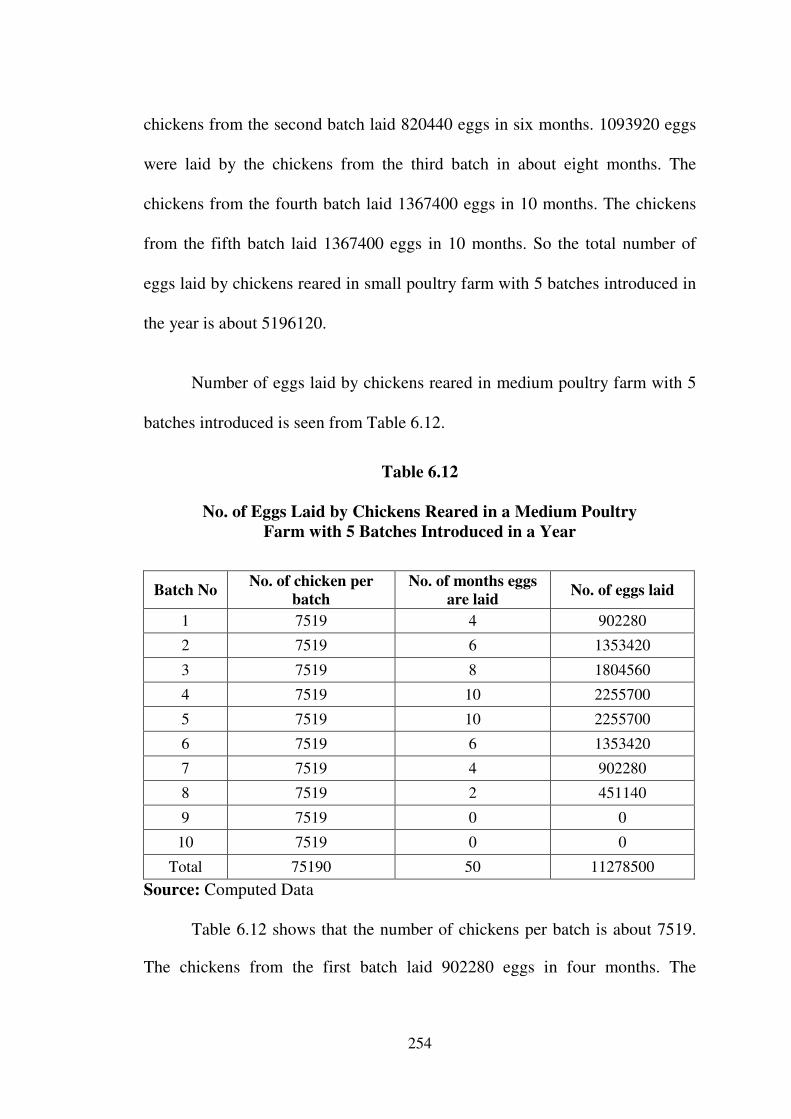
Number of eggs laid by chickens reared in medium poultry farm with 5
batches introduced is seen from Table 6.12.
Table 6.12
No. of Eggs Laid by Chickens Reared in a Medium Poultry
Farm with 5 Batches Introduced in a Year
Batch No No. of chicken per
batch
No. of months eggs
are laid No. of eggs laid
1 7519 4 902280
2 7519 6 1353420
3 7519 8 1804560
4 7519 10 2255700
5 7519 10 2255700
6 7519 6 1353420
7 7519 4 902280
8 7519 2 451140
9 7519 0 0
10 7519 0 0
Total 75190 50 11278500
Source: Computed Data
Table 6.12 shows that the number of chickens per batch is about 7519.
The chickens from the first batch laid 902280 eggs in four months. The
255
chickens from the second batch laid 1353420 eggs in six months. 1804560 eggs
were laid by the chickens from the third batch in eight months. The chickens
from the fourth batch laid 2255700 eggs in 10 months. The chickens from the
fifth batch laid 2255700 eggs in 10 months. So the total number of eggs laid by
chickens reared in a medium poultry farm with 5 batches introduced in the year
is about 8571660.
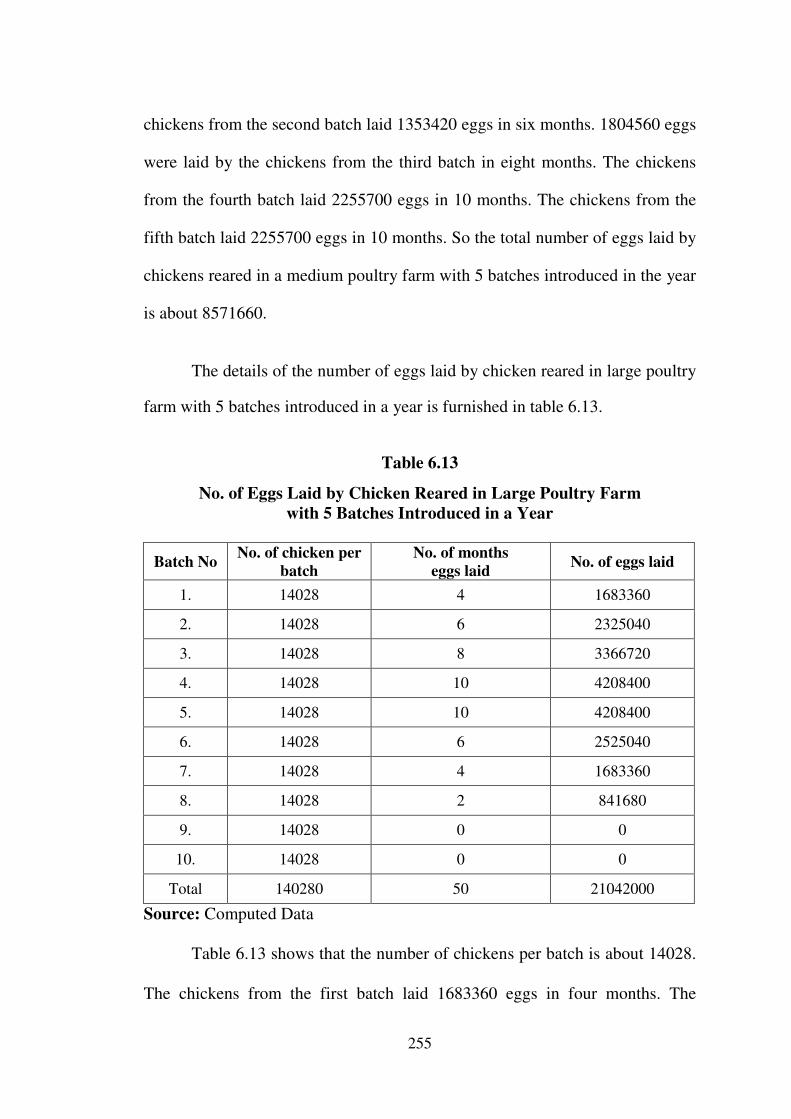
The details of the number of eggs laid by chicken reared in large poultry
farm with 5 batches introduced in a year is furnished in table 6.13.
Table 6.13
No. of Eggs Laid by Chicken Reared in Large Poultry Farm
with 5 Batches Introduced in a Year
Batch No No. of chicken per
batch
No. of months
eggs laid No. of eggs laid
1. 14028 4 1683360
2. 14028 6 2325040
3. 14028 8 3366720
4. 14028 10 4208400
5. 14028 10 4208400
6. 14028 6 2525040
7. 14028 4 1683360
8. 14028 2 841680
9. 14028 0 0
10. 14028 0 0
Total 140280 50 21042000
Source: Computed Data
Table 6.13 shows that the number of chickens per batch is about 14028.
The chickens from the first batch laid 1683360 eggs in four months. The

256
chickens from the second batch laid 2325040 eggs in six months. 3366720 eggs
were laid by the chickens from the third batch in eight months. The chickens
from the fourth batch laid 4208400 eggs in 10 months. The chickens from the
fifth batch laid 4208400 eggs in 10 months. So the total number of eggs laid by
chickens reared in a large poultry farm, with 5 batches introduced in the year, is
about 15791920.
6.6.5 Marketable surplus of eggs
The following Table No. 6.14 exhibits the annual mean eggs laid by the
chicken population in poultry industry
Table 6.14
Annual Mean Eggs Laid by Chicken Population in Poultry Industry
Sl.No Particulars Type of Industry
Small Medium Large
1. Total number of eggs produced per
year 6837000 11278500 21042000
2. Less: Total number of eggs damaged
per year 430731 800774 1862217
3. Marketed surplus of eggs 6406269 10477727 19179783
4. Percentage of damaged eggs 6.30 7.1 8.8
Source: Primary Data
Table 6.14 reveals that the total number of eggs produced per year in a
small poultry industry is about 6837000, while for a medium poultry industry,
it is 11278500. The total number of eggs damaged per year in a small poultry
industry is 430731 and 800774 in a medium poultry industry. So the marketed

257
surplus of eggs is total number of eggs produced per year minus the total
number of eggs damaged per year. It is 6406269 for small poultry farms and
10477727 for medium poultry farms. The percentage of damaged eggs is 6.30
for small poultry farms and 7.1 for medium poultry farms.
6.6.6 Unit Cost and Earnings Per Egg
Table 6.15
Unit Cost and Earning Per Egg
Sl.No Particulars Type of industry
Small Medium Large
1. Net Cost of sales of Egg 12586726.90 19807839.94 35420388.34
2. No.of egg produced per annum 6406269 10477727 19179783
3. Cost per egg 1.96 1.89 1.85
4. Net selling price per egg 2.27 2.27 2.27
Profit per egg 0.31 0.38 0.42
Source: Primary Data
Table 6.15 shows the net cost of sales of eggs for small poultry farms is
Rs.12586726.9. For medium poultry farms, it is Rs.19807839.94 and for the
large poultry farms, it is Rs.35420388.34. The number of eggs produced per
year for the small poultry farms is Rs. 6406269. For medium poultry farms. It
is Rs.10477727 and for large poultry farms, it is Rs.19179783. The cost per egg
for small poultry farms is 1.96. For medium poultry farms, it is 1.89 and for
large poultry farms, it is 1.85. The net selling price per egg for small, medium

258
and large poultry farms are the same (2.27). The profit per egg for small
poultry farm is 0.31, for medium poultry farm, it is 0.38 and for large poultry
farm, it is 0.42.
6.7 PRICE ANALYSIS
There is an unlimited demand for fresh laid eggs. The market has never
yet been fully supplied, nor is it likely to be for a very long time to come. The
fact that some specially favoured small towns may have all the fresh eggs they
can consume, must not be thought to overthrow this statement regarding the
great consuming centers.
The eggs price is most profitable is not so much on account of great
demand and high prices as because the cost of production is proportionately
less than that in other braches of the chicken business. For the eggs such pullets
would lay, especially if hatched early enough, to begin laying doing October or
early November, would be worth several times the market price that they could
command at that season. It is all well enough to sell hens after they have done.
6.7.1 Analytical Framework
Time series analysis was carried out to study the behaviour of prices of
eggs per batch over a period of time. A multiplicative model4 of the following
type has been used.
Y = T x C x S x I
259
where,
Y = Actual price in Rupees per qty
T = Secular Trend
C = Cyclical variation
S = Seasonal variation
I = Irregular variation
In the present study due to non-availability of monthly average price
statistics over years, the components were decomposed into three categories
namely, secular trend, cyclical variation and irregular variation. The seasonal
variation was separately analysed with ten years ‘monthly data’.
6.7.2 Secular Trend
The secular trend is the basic tendancy of prices to increase or decrease
for a period of time. It describes the pattern of behaviour which has
characterized the series in the past. In the present study, the trend of time series
of statistics was worked out, with linear regression equation, since the price
exhibited secular relationship with time. A trend equation fitted for the price of
egg is
Y = a+bt
where,
Y = Price of egg / rupees per qty
a = Constant
b = regression coefficient
t = time in years

260
6.7.3 Cyclical Variation
A careful study of cyclical variation facilitates facing recession period
and reap the benefits during booms. In the present study, the cyclical variation
in annual prices of egg was studied through moving average method. The steps
involved are shown below.
Step 1 : Dividing the actual average yearly price by the trend price
Step 2 : Computation of six yearly centered moving average for
the detrended data and this formed cyclical variation
6.7.4 Seasonal Variation
It is a variation which occurs with some degree of regularity within a
specific period of one year or shorter. This study is useful to take policy
decisions regarding purchase production, inventory control and the like. In the
present study the seasonal variation in the monthly average prices were studied
for twenty years by applying the moving average method. The steps involved
are shown below:-
Step 1 : Computation of 12 months moving average for monthly average
price series of egg.
Step 2 : Obtaining the percentage series of actual price to moving average
prices and arranging them by month.
Step 3 : Calculating median for each month eventually arriving at the
seasonal indices through adjustment factor.

261
6.7.5 Irregular Variation
It is the irregular movement of prices over a period of time due to
random factors. In the present study, cyclical-Irregular (CI) components were
derived by dividing the actual time series with trend element. Since seasonal
element was market in the annual price series, this cyclical Irregular (CI)
component was divided by cyclical component (C) to estimate the irregular
variation.
6.7.6 Temporal Variation
A study on temporal variation of prices would be useful in forecasting
the price movements in future. This would, in turn, help the producers and
traders in marketing effective decision in production and marketing including
storage.
Namakkal is the major market for eggs. Secondly Salem district is the
major market for eggs in Tamilnadu. Moreover, this market has got the
advantage of being well connected by all means of transportation namely road,
railway and air. The price effect in Salem market will be reflected in all other
markets. Therefore Salem Market was selected to study the temporal price
variation of egg.
The present study has analysed the temporal variation of egg prices in
Salem, market using yearly average price of egg for the period from 1991 to
262
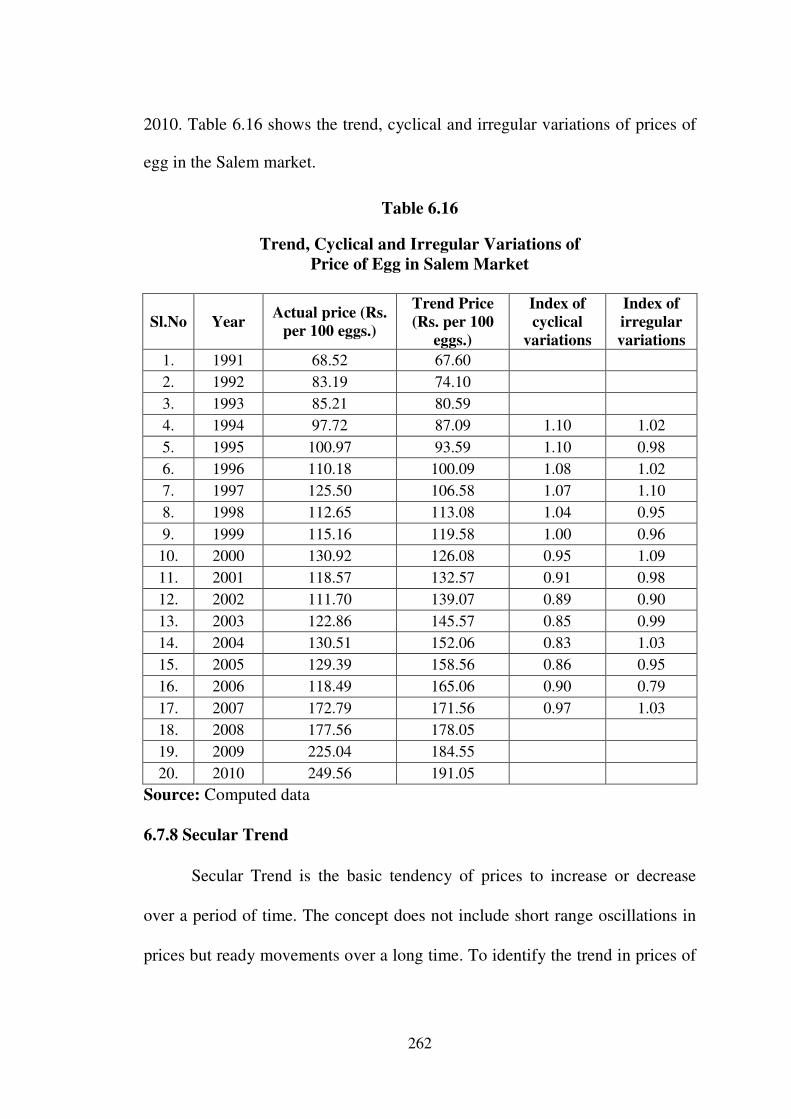
2010. Table 6.16 shows the trend, cyclical and irregular variations of prices of
egg in the Salem market.
Table 6.16
Trend, Cyclical and Irregular Variations of
Price of Egg in Salem Market
Sl.No Year Actual price (Rs.
per 100 eggs.)
Trend Price
(Rs. per 100
eggs.)
Index of
cyclical
variations
Index of
irregular
variations
1. 1991 68.52 67.60
2. 1992 83.19 74.10
3. 1993 85.21 80.59
4. 1994 97.72 87.09 1.10 1.02
5. 1995 100.97 93.59 1.10 0.98
6. 1996 110.18 100.09 1.08 1.02
7. 1997 125.50 106.58 1.07 1.10
8. 1998 112.65 113.08 1.04 0.95
9. 1999 115.16 119.58 1.00 0.96
10. 2000 130.92 126.08 0.95 1.09
11. 2001 118.57 132.57 0.91 0.98
12. 2002 111.70 139.07 0.89 0.90
13. 2003 122.86 145.57 0.85 0.99
14. 2004 130.51 152.06 0.83 1.03
15. 2005 129.39 158.56 0.86 0.95
16. 2006 118.49 165.06 0.90 0.79
17. 2007 172.79 171.56 0.97 1.03
18. 2008 177.56 178.05
19. 2009 225.04 184.55
20. 2010 249.56 191.05
Source: Computed data
6.7.8 Secular Trend
Secular Trend is the basic tendency of prices to increase or decrease
over a period of time. The concept does not include short range oscillations in
prices but ready movements over a long time. To identify the trend in prices of
263
egg in Salem market for the period from 1991 to 2010, the linear regression
equation was fitted and the estimated trend function was,
Y = 6.497 x -12868
R2 = 0.722
A figure in parenthesis is denoting standard error.
Significant at one per cent level.
It could be observed from the above function that the co-efficient of
determination (R2) was 0.722 which indicated that 72.20 percent of variation in
the price of egg was explained by the dependent variable.
The results also show that there has been a significant increase in the
price of egg over the years. The annual average price of egg per quantity has
increased at the rate of Rs.12868 per annum. The actual price series with the
estimated trend value is presented in figure 6.1.

264
Diagram 6.1
Estimated Price trend of Egg during 1991 - 2010
Y = 6.497 x -12868 * Price (100 Eggs)
R2 = 0.722 - Linear (Price (100 eggs)
0
50
100
150
200
250
300
1991 1994 1997 2000 2003 2006 2009
Year
Pri
ce
of
eg
gs

265
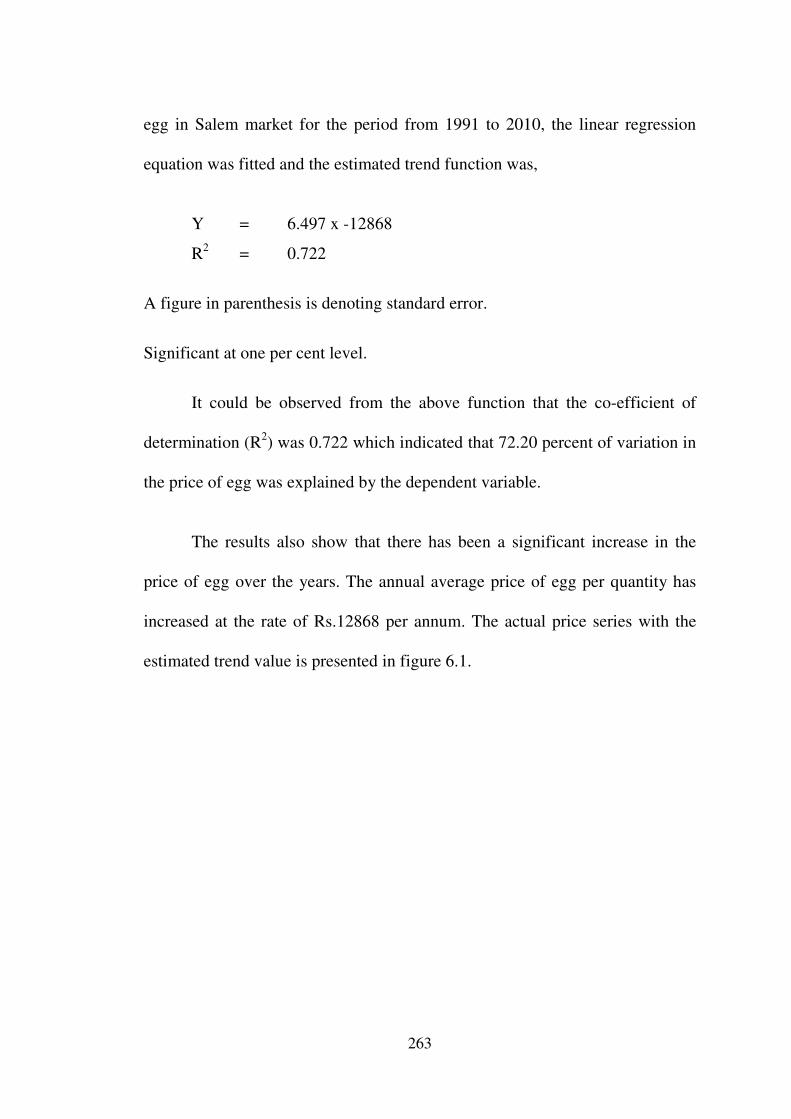
6.7.9 Cyclical Variation
Cyclical variation in price of eggs refers to recurrent up and down
movements around secular trend levels which have a duration anywhere from 2
to 20 years. These cycles may or may not be periodic. This study is useful in
framing variable policies for stabilizing the price level. The cyclical variation
in prices of egg is analysed by moving average method. The results are
presented in Table 6.16 and the indices of cyclical variations have been plotted
in Figure 6.2.
It could be seen from table that the indices of cyclical variation in the
prices of eggs were the maximum in 1994 and started declining until 2000 and
again started increasing and reached the peak level in 2005. The price of eggs
started to increase until 2007 and then it recovered.
266
Diagram 6.2
Indices of Cyclical Variation
◊ Cyclical index
- Linear (cyclical index)
0
0.2
0.4
0.6
0.8
1
1.2
1991 1994 1997 2000 2003 2006 2009
Year
Ind
ice
s o
f C
yc
lic
al
Va
ria
tio
ns

267
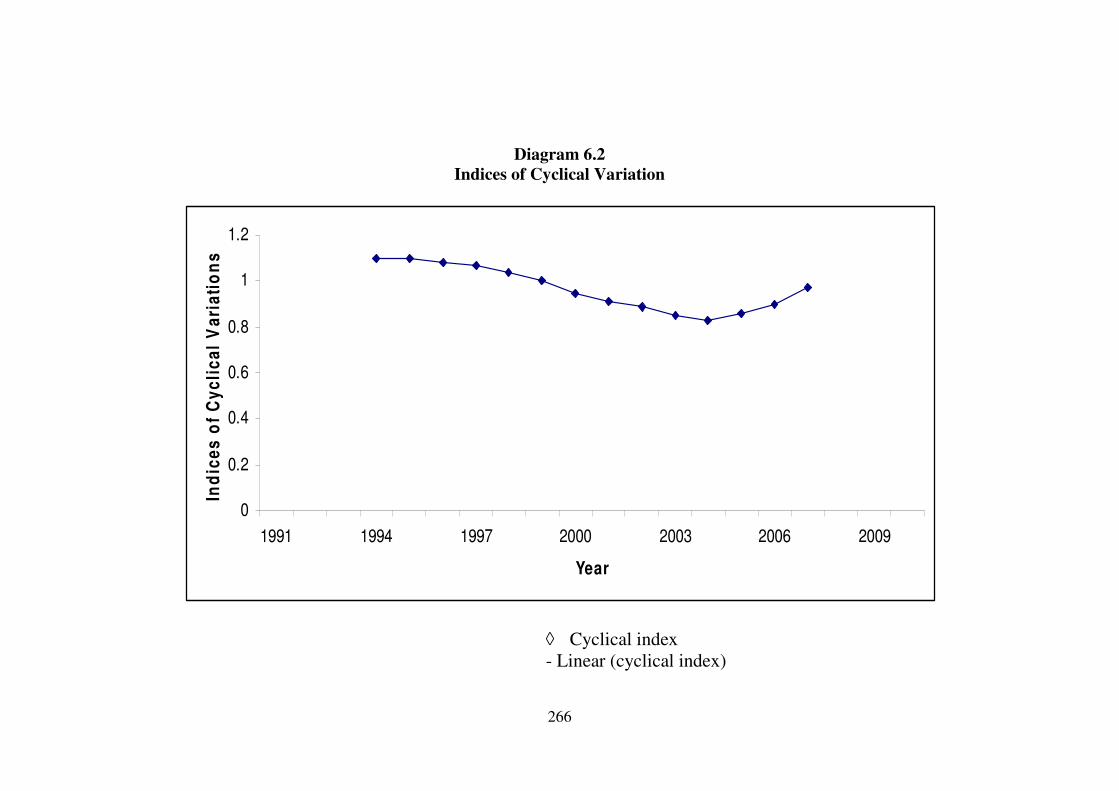
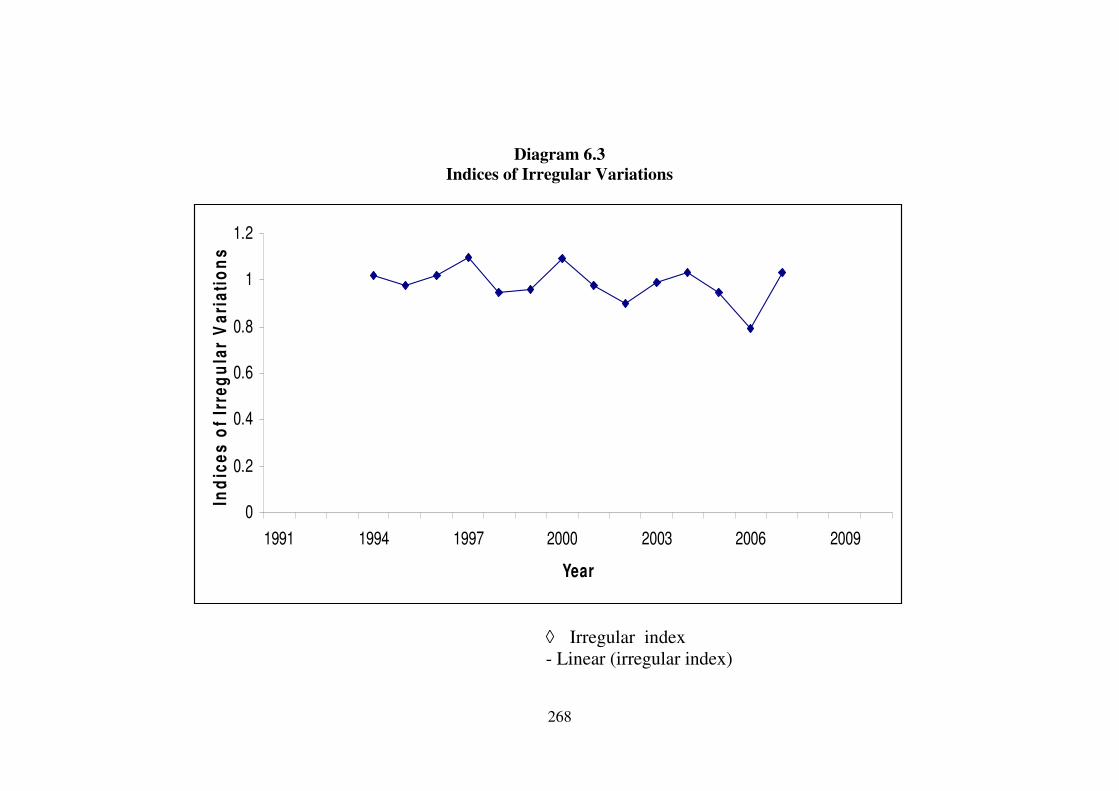
6.7.10 Irregular Variation
Irregular variation refers to such variations in the price of egg which do
not follow in a definite pattern. Irregular variation in price includes all types of
variations, other than the trend, seasonal and cyclical movements. Irregular
variation in price is caused by certain special isolated occurrences such as
sudden shortage in demand or rapid technological progress. By their nature
these movements are irregular and inpredictable. An analysis of irregular
variation in the price of eggs in Salem market was carried out and the results
obtained are depicted in figure no. 6.3.
It could be observed from the figure that once in five or six years price
of eggs varied much by irregular factors. The indices of irregular variations for
the price of eggs in Salem market ranged from 0.9 to 1.09. The co-efficient of
variation of irregular variation per cent. Thus it is inferred from the figure that
irregular variation in the price off egg was seen which was confirmed by the
co-efficiency of variation of the irregular indices. The irregular variation in the
price of eggs may be due to sudden changes in demand, influenced by the
changes in taste and buying behaviour, the price of substitutes, change in
relative income level and the like.
In the present study seasonal variations of the monthly average of eggs
are studied for ten years from 2000 – 01 to 2009 – 2010 by applying 12 months
moving average and the results obtained are presented in Table 6.16 and
depicted in figure no. 6.3.
268
0
0.2
0.4
0.6
0.8
1
1.2
1991 1994 1997 2000 2003 2006 2009
Year
Ind
ice
s o
f Ir
reg
ula
r V
ari
ati
on
s
Diagram 6.3
Indices of Irregular Variations
◊ Irregular index
- Linear (irregular index)

269
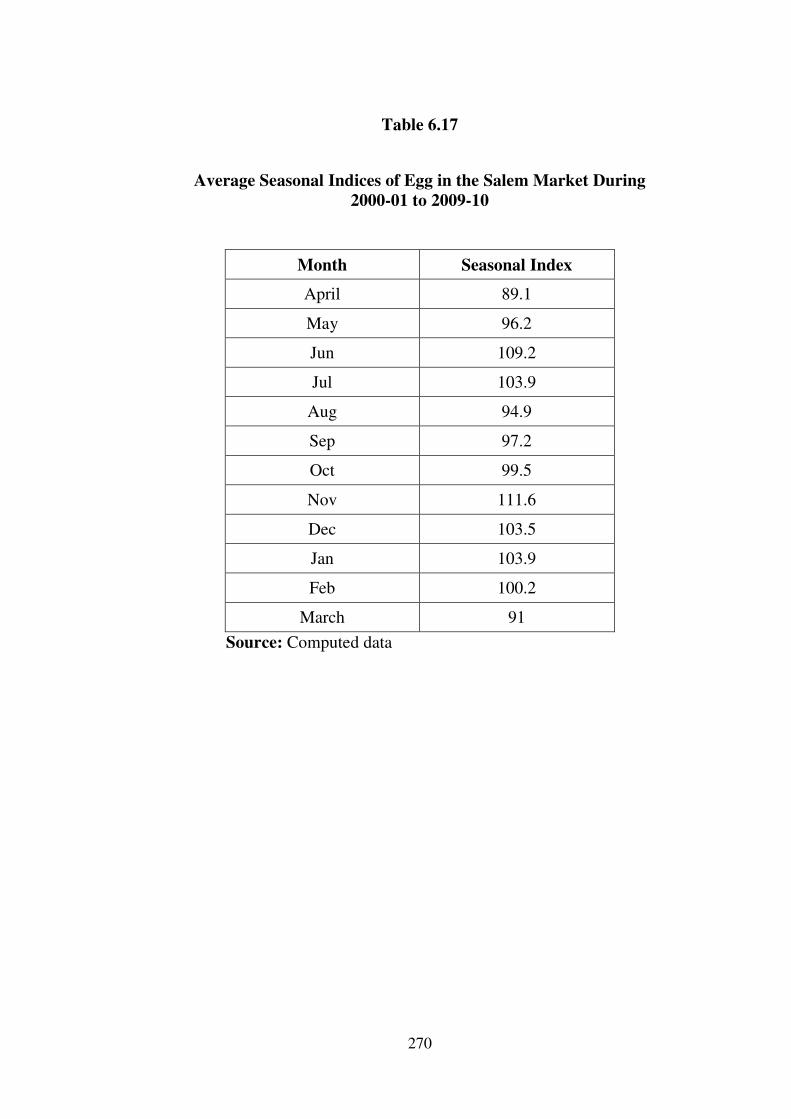
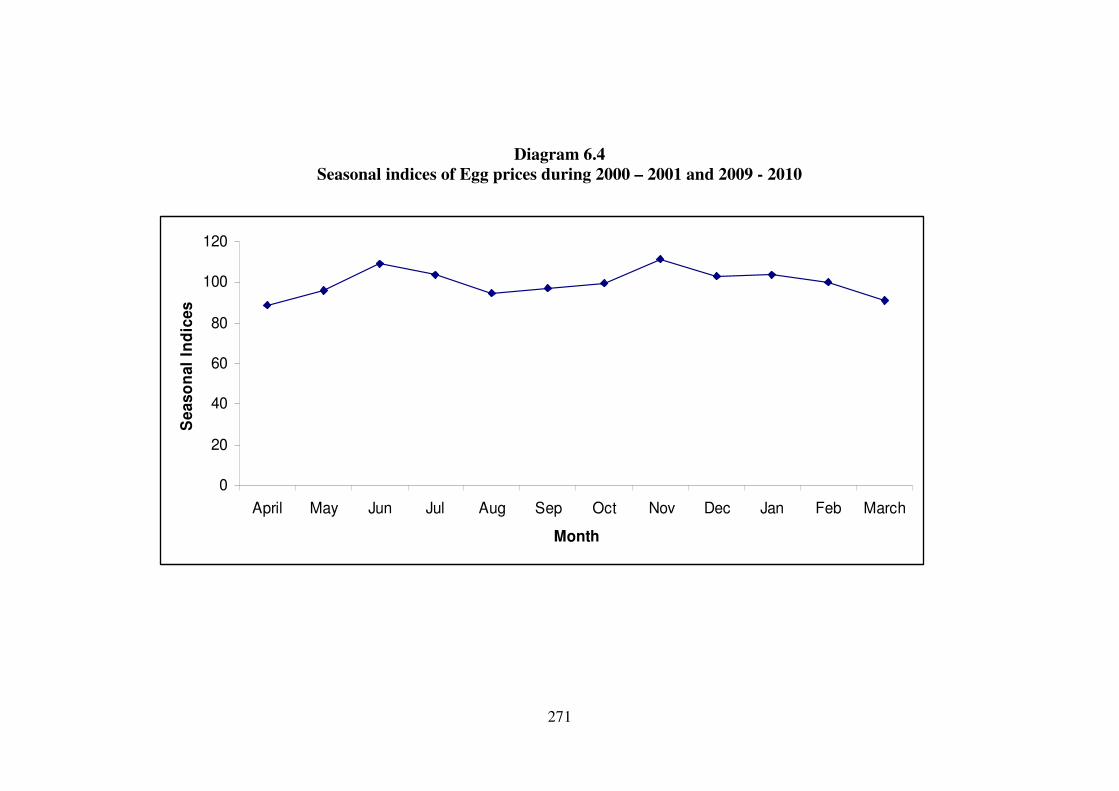
6.7.11 Seasonal Variation
There is considerable seasonality associated with poultry consumption
for each geographical region based on religious beliefs, weather conditions and
festivities. For example:- Hindu month of Puratassi in September - October and
Sabarimala pilygrimage in December - January result in decline in egg
consumption in Salem District. On the other hand, consumption increases
during festive period of October - December (combined with winter season)
and during marriage season in various parts of the country. Generally, egg
production and consumption is lower in summer season than in winter. Hence
there exists a regular demand throughout the year, but supply varies with the
production season.
Table 6.17 reveals that much variation exists in the price of eggs in the
Salem market in different months of a year. It could be observed from the
seasonal indices that the lowest price prevailed from August-October. Which is
religious season.
270
Table 6.17
Average Seasonal Indices of Egg in the Salem Market During
2000-01 to 2009-10
Month Seasonal Index
April 89.1
May 96.2
Jun 109.2
Jul 103.9
Aug 94.9
Sep 97.2
Oct 99.5
Nov 111.6
Dec 103.5
Jan 103.9
Feb 100.2
March 91
Source: Computed data
271
Diagram 6.4
Seasonal indices of Egg prices during 2000 – 2001 and 2009 - 2010
0
20
40
60
80
100
120
April May Jun Jul Aug Sep Oct Nov Dec Jan Feb March
Month
Se
as
on
al
Ind
ice
s