chapter v: portfolio assessment
TRANSCRIPT

Portfolio-1
Chapter V: PORTFOLIO ASSESSMENT Portfolio Assessment Who takes it? All students must develop and submit a portfolio as a requirement for graduation. In academic year 2013-2014, 1185 students submitted portfolios. When is it administered? Most students complete the process as part of their capstone experience, so students usually submit portfolios during their senior year. Some submit earlier, while others have actually completed their Truman course work and submit after they have finished their time on campus. Since it is a graduation requirement, students who do not submit their portfolio are subject to transcript/diploma/verification holds. Our new online portfolio submission system went online in August 2011, and it is specifically designed to allow students to store potential portfolio elements throughout their college career. Regardless of when students submit the portfolio, the work itself may have been completed at any time during their college career. How long does it take for the student to compile the portfolio? The average this year is four hours, including time to retrieve and upload previously written files. This is the same as last year, but up slightly from previous years. What office administers it? The portfolio project director administers portfolio collection in conjunction with each discipline/program. The portfolio project director also leads the faculty and staff readers who evaluate and score the portfolios. These readers work in groups of approximately twenty and also participate in faculty development and campus discussion. Who originates the submission requirements for portfolios? The Assessment Committee evaluates requests for specific portfolio items, led by the Portfolio director working with faculty assessors and the Portfolio Committee (a standing subcommittee of the Assessment Committee) When are results typically available? The portfolios are read and scored in May and August. The results are usually available late in the fall or early in spring of the following year. What type of information is sought? Faculty evaluators and the Assessment Committee designate the types of works requested from students, but many of the requested items have remained constant for multiple years. In the 2013-2014 academic year, a portfolio included works demonstrating 1) critical thinking and writing, 2) interdisciplinary thinking, 3) civic engagement. The portfolio also included a work or experience the student considered 4) most personally satisfying, and 5) a Letter to Truman in which students give summary thoughts about their experience with the Portfolio and at Truman. Other items may be included, but these are evaluated separately, if at all, including a 6) transformative learning experience questionnaire. From whom are the results available? The director of the portfolio project can release datasets or additional analyses upon request. Are the results available by school or department? Yes. To whom are results regularly distributed? Overall results of portfolio assessment are available to the Truman community through this Assessment Almanac. Occasional reports are given to governance, planning workshops, and other forums. Some departments use the information to reform their curriculum, improve programs, and engage in self-study. Faculty who participate in reading sessions report changing their assignments and their teaching techniques based on their experience. Are the results comparable to data of other universities?
Portfolio-2
No. While some universities are using portfolios for assessment of general education or liberal studies, most do not use similar prompts or submission categories. 2014 Truman Portfolio
Since 1988, Truman State has utilized a locally designed senior portfolio for sampling and assessing
student achievement and learning. It has been a graduation requirement since 1999. This volume reports and analyzes current year academic year portfolio assessment findings, concluding with a discussion about changes to the portfolio project and about the use of the data for improving teaching and learning.
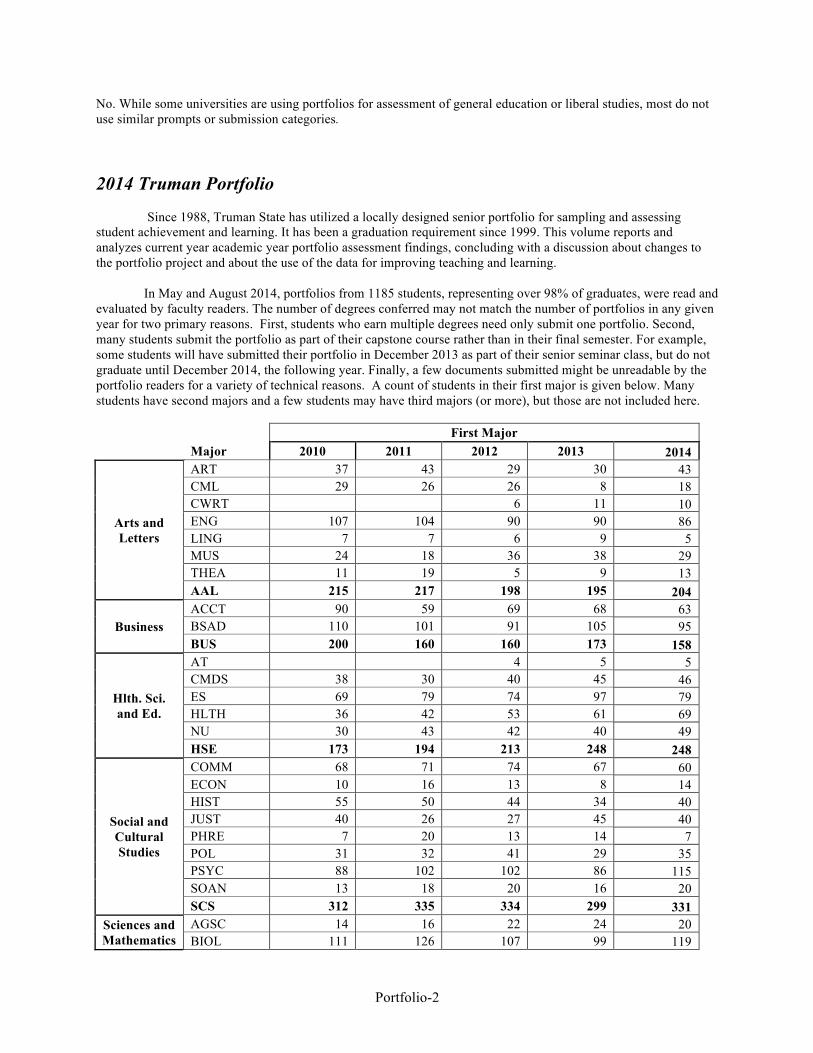
In May and August 2014, portfolios from 1185 students, representing over 98% of graduates, were read and evaluated by faculty readers. The number of degrees conferred may not match the number of portfolios in any given year for two primary reasons. First, students who earn multiple degrees need only submit one portfolio. Second, many students submit the portfolio as part of their capstone course rather than in their final semester. For example, some students will have submitted their portfolio in December 2013 as part of their senior seminar class, but do not graduate until December 2014, the following year. Finally, a few documents submitted might be unreadable by the portfolio readers for a variety of technical reasons. A count of students in their first major is given below. Many students have second majors and a few students may have third majors (or more), but those are not included here. First Major Major 2010 2011 2012 2013 2014
Arts and Letters
ART 37 43 29 30 43 CML 29 26 26 8 18 CWRT 6 11 10 ENG 107 104 90 90 86 LING 7 7 6 9 5 MUS 24 18 36 38 29 THEA 11 19 5 9 13 AAL 215 217 198 195 204
Business ACCT 90 59 69 68 63 BSAD 110 101 91 105 95 BUS 200 160 160 173 158
Hlth. Sci. and Ed.
AT 4 5 5 CMDS 38 30 40 45 46 ES 69 79 74 97 79 HLTH 36 42 53 61 69 NU 30 43 42 40 49 HSE 173 194 213 248 248
Social and Cultural Studies
COMM 68 71 74 67 60 ECON 10 16 13 8 14 HIST 55 50 44 34 40 JUST 40 26 27 45 40 PHRE 7 20 13 14 7 POL 31 32 41 29 35 PSYC 88 102 102 86 115 SOAN 13 18 20 16 20 SCS 312 335 334 299 331
Sciences and Mathematics
AGSC 14 16 22 24 20 BIOL 111 126 107 99 119

Portfolio-3
CHEM 23 19 28 19 33 CS 17 19 24 28 34 MATH 23 30 23 22 25 PHYS 15 12 7 15 8 SAM 203 222 211 207 239
IDSM 6 9 10 3 5 All 1109 1142 1130 1125 1185
Because each individual program within Art, Classical and Modern Languages, and Music has relatively
few graduates, data have been combined throughout this report to preserve individual anonymity. In most cases, these majors can be separated further upon request. Note that Athletic Training and Creative Writing majors are only recently listed separately (in previous years, these students were combined with Exercise Science and English, respectively).
A total of sixty-five faculty and staff members read and evaluated portfolios, representing all ranks of
faculty across all five academic schools and twenty-two academic departments, as well as four Graduate Teaching Assistants from English and ten professional staff from the writing center, athletics, counseling services, international admissions, and study abroad. Fourteen participants were new readers. Each week, a student worker assisted with processing, technical support, and sorting, providing critical support to the success of this complicated process.
This year, reading sessions were scheduled over three weeks during the May and August interims, from
May 12-16, May 19-23, and August 7-8 and 11-12, 2014 in the computer classroom in Magruder Hall (MG 2005). Roughly one-third of the readers participated during each week; this year, no one read during more than one session. Readers gathered daily at 8:30 AM and ended at 4:30 PM with an hour for lunch and a morning and afternoon break. Both May sessions met for five days of the week this year, and the August session met during a four days split week (Thursday-Friday and Monday-Tuesday). Every week readers evaluated Interdisciplinary and Critical Thinking & Writing submissions, as well as Letters to Truman and Most Personally Satisfying responses; every student’s submissions in these categories were read and scored. Our new submissions, “Civic Engagement”, also had submissions scored each week.
The Critical Thinking and Writing rubric changed to a new
format in 2013 consistent with the campus wide acceptance of the Common Framework for Critical Thinking Pedagogy, and this prompt continued as a Performance funding criterion for Missouri State Appropriations. This skill has been a major focus within every department on campus during the 2013-14 academic year, so the results were highly anticipated. A new prompt in Civic Engagement was implemented aimed at determining if our campus work involves the production of engaged public citizens.
2014 Portfolio Contents
• Critical Thinking and Writing • Interdisciplinary Thinking • Civic Engagement • Most Personally Satisfying Experience • Letter to Truman • Transformative Exp. Questionnaire

Portfolio-4
2014 Truman Portfolio Findings This report presents the findings of the Portfolio Project for all prompts and submissions. Groupings are based on the five-school administrative structure adopted in 2008. The table on the previous page shows how various majors are characterized in this scheme. When a student had more than one major, their first major was used for grouping. Grouping of several years of past data into this structure has been included to allow comparisons over time. Because this assessment relies on students to first retain and then select materials for inclusion in their portfolios, the resulting data are inherently “fuzzier” than data from a standardized, systematically controlled instrument. Students occasionally indicate that they are submitting work that is not their strongest demonstration because they did not keep or did not receive back the artifacts which best demonstrate their competence in the specified area. Other students report that they were never challenged to use the thinking skills or the type of approach requested by individual prompts. Lack of motivation may inhibit the thoughtfulness of the selection process or engagement in self-assessment encouraged by the prompts for each portfolio category. In their reflective Letters to Truman, students report a wide range of motivation levels. Some complete the portfolio in stages, as part of a course, and show good engagement with the process. Others are quite frank in stating that they compiled their portfolio quickly because other responsibilities were considered higher priorities. The administration of the portfolio and the degree of self-reflection it fosters in students are uneven across the campus. Since most of the work submitted was completed outside of the portfolio process itself, lack of motivation to complete the portfolio does not always translate directly into poor quality submissions. In addition to the ratings of quality, we have kept track of the sources of items selected by seniors for each submission. We characterize that data by indicating several of the most common sources (disciplines and courses) for each category. In some cases, students could not recall all of the details of when and why the work was created; except where a large percentage of students were missing data, we include percentages only for those students who did report the information. Finally, students identify submissions that are collaborative or from a service learning or capstone experience; in addition, they identify submissions that deal with issues of race, class, gender, international perspectives, and environmental perspectives. Faculty reviewers may volunteer this information when the student did not. The two continuing prompts in 2014 are Interdisciplinary Thinking and Critical Thinking and Writing. The table summarizing the scores for these prompts is below. Scoring for Interdisciplinary Thinking uses a 5-point scale with the following points: 0 (no demonstration of competence), 1 (weak competence), 2 (minimal competence), 3 (competence) and 4 (strong competence). Only the most exceptional papers are included in the strong competence category, but papers scoring a 2 or higher are scored as “demonstrating competence” in that area. As mentioned above, the Critical Thinking and Writing scoring rubric changed to a new format consistent with the campus wide acceptance of the Common Framework for Critical Thinking Pedagogy, and so the scoring is different starting with 2013. The rubric includes four subcategories of critical thinking as well as a separate category for the writing score. Each subcategory has a scale of 1-4, with a sum of the scores of the critical thinking subscores ranging from 4-16. A score of 10 for this sum is considered demonstrating competence for this rubric. The details of this new rubric will be discussed further below, but this table does allow for direct comparison with the percent competent category. 2010-2014 Continuing Prompts’ Mean Scores and % Achieving Benchmark Mean score % Achieving Benchmark
Year 2010 2011 2012 2013 2014 2010 2011 2012 2013 2014
Interdisciplinary thinking
1.79 1.85 1.94 1.82 1.85 59.4% 62.5% 65.2% 63% 64
Critical Thinking 1.83 1.91 1.83 10.18* 10.31* 67% 71% 65% 60%* 65%* *New rubric in use, with new scoring system. The benchmark is scoring 10 or better on the sum of the Critical Thinking subscores of the rubric. See further discussion below.
Portfolio-5
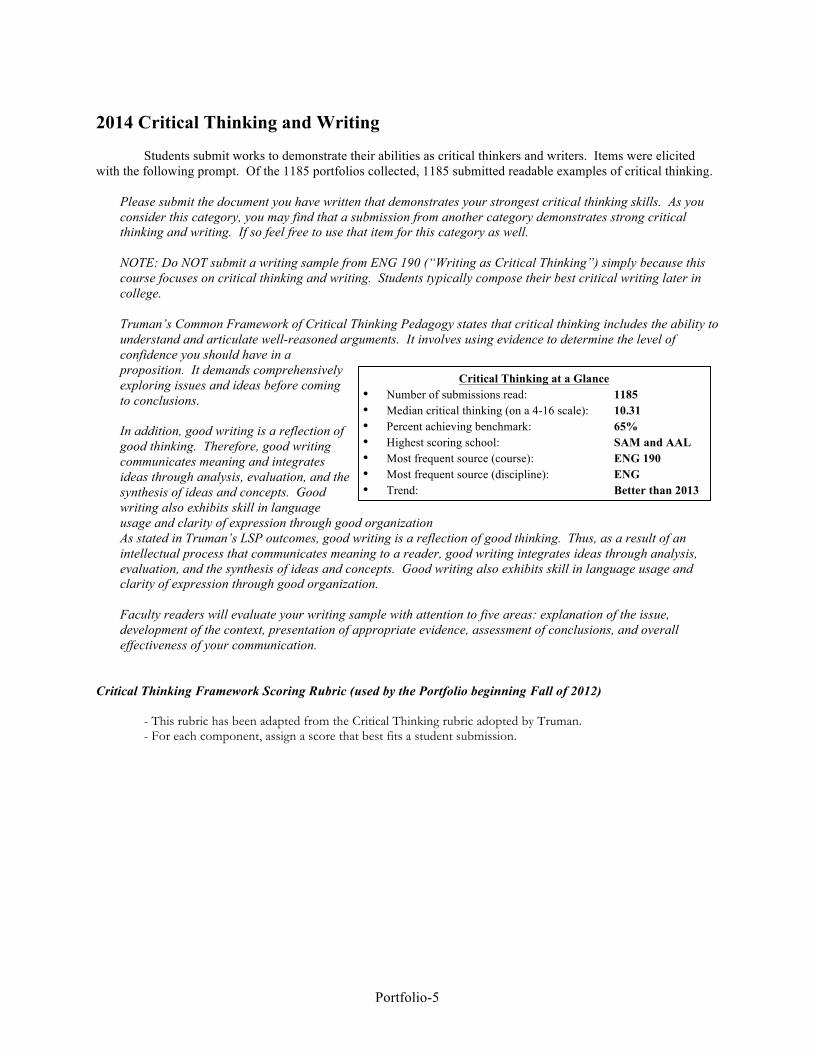
2014 Critical Thinking and Writing Students submit works to demonstrate their abilities as critical thinkers and writers. Items were elicited with the following prompt. Of the 1185 portfolios collected, 1185 submitted readable examples of critical thinking.
Please submit the document you have written that demonstrates your strongest critical thinking skills. As you consider this category, you may find that a submission from another category demonstrates strong critical thinking and writing. If so feel free to use that item for this category as well. NOTE: Do NOT submit a writing sample from ENG 190 (“Writing as Critical Thinking”) simply because this course focuses on critical thinking and writing. Students typically compose their best critical writing later in college. Truman’s Common Framework of Critical Thinking Pedagogy states that critical thinking includes the ability to understand and articulate well-reasoned arguments. It involves using evidence to determine the level of confidence you should have in a proposition. It demands comprehensively exploring issues and ideas before coming to conclusions. In addition, good writing is a reflection of good thinking. Therefore, good writing communicates meaning and integrates ideas through analysis, evaluation, and the synthesis of ideas and concepts. Good writing also exhibits skill in language usage and clarity of expression through good organization As stated in Truman’s LSP outcomes, good writing is a reflection of good thinking. Thus, as a result of an intellectual process that communicates meaning to a reader, good writing integrates ideas through analysis, evaluation, and the synthesis of ideas and concepts. Good writing also exhibits skill in language usage and clarity of expression through good organization. Faculty readers will evaluate your writing sample with attention to five areas: explanation of the issue, development of the context, presentation of appropriate evidence, assessment of conclusions, and overall effectiveness of your communication.
Critical Thinking Framework Scoring Rubric (used by the Portfolio beginning Fall of 2012)
- This rubric has been adapted from the Critical Thinking rubric adopted by Truman. - For each component, assign a score that best fits a student submission.
Critical Thinking at a Glance • Number of submissions read: 1185 • Median critical thinking (on a 4-16 scale): 10.31 • Percent achieving benchmark: 65% • Highest scoring school: SAM and AAL • Most frequent source (course): ENG 190 • Most frequent source (discipline): ENG • Trend: Better than 2013

Portfolio-6
1. Identifies, summarizes, and appropriately formulates the issue (e.g. a question to be answered, hypothesis to be
tested, subject to be interpreted, or a problem to be solved).
4 - Mastering 3 - Developing 2 - Growing 1 - Emerging Clearly identifies and summarizes issue including nuances and details, revealing subsidiary, embedded, or implicit issues.
Identifies and summarizes issue, though some aspects are incorrect or confused. Some nuances or key details missing or glossed over.
Identifies and summarizes issue in a confused or incorrect way. Nuances and key details missing.
Fails to or does not attempt to identify and summarize issue.
2. (merged with 3) Identifies and considers existing context, theory, and/or previous work in the field (literature
reviews, world-views, contentions, interpretations, interdisciplinary approaches).
4 - Mastering 3 - Developing 2 - Growing 1 - Emerging Approaches issue with clear sense of scope and context. May consider multiple relevant contexts. Shows clear and nuanced understanding of convergent or divergent aspects of contexts. Engages multiple, convergent and divergent perspectives in nuanced ways that qualify or enrich own perspective.
Presents and explores relevant contexts in relation to issue, but with some limitations. Shows some clear understanding of convergent or divergent aspects of context. Engages both convergent and divergent or challenging perspectives, may be tentative, overstating, or too easily dismissive.
Presents context superficially or connects to issue in a limited way. Shows limited under-standing of convergent or divergent aspects of context. Presents convergent and divergent or challenging perspectives, but with little engagement.
Does not connect issue to context, or attempts but fails to do so. Shows little or no awareness of convergent or divergent aspects of context. Raises only convergent or agreeable perspectives or conclusions; avoids challenging, divergent, or discomforting perspectives.
5. Presents, interprets, analyses, and/or assesses appropriate supporting evidence (e.g. observations, data,
information, citations, argumentation, proofs, etc.) using validated techniques.
4 - Mastering 3 - Developing 2 - Growing 1 - Emerging Shows excellent skills in searching, selecting and evaluating appropriate sources. Appropriate and salient evidence is thoroughly developed and clearly supports conclusions. Causal relationships are clearly and consistently distinguished from correlations. Demonstrates understanding of complex relationships between facts, opinions, and values in light of available evidence; recognizes bias, including selection bias.
Shows some adequate skills in searching, selecting, and evaluating appropriate sources. Evidence is appropriate—exploration may be routine or gaps may exist in relation to conclusions. Distinguishes causality and correlation, Distinguishes among facts, opinions, and values, may recognize some issues of bias, and opinions are responsive to evidence.
Shows inadequate skills in searching, selecting, and evaluating sources. Some evidence may be inappropriate or related only loosely to conclusions. Aware of distinction between cause and correlation, but confuses application. Attempts or begins to distinguish fact, opinion, values may mention without developing issues of bias.
No indication of search, selection, or source evaluation skills. Evidence is lacking, simplistic, inappropriate, or unrelated to the topic. Conflates cause and correlation. Does not distinguish among fact, opinion, and values; seems unaware of problems of bias or holds opinions in face of counterevidence.
Portfolio-7
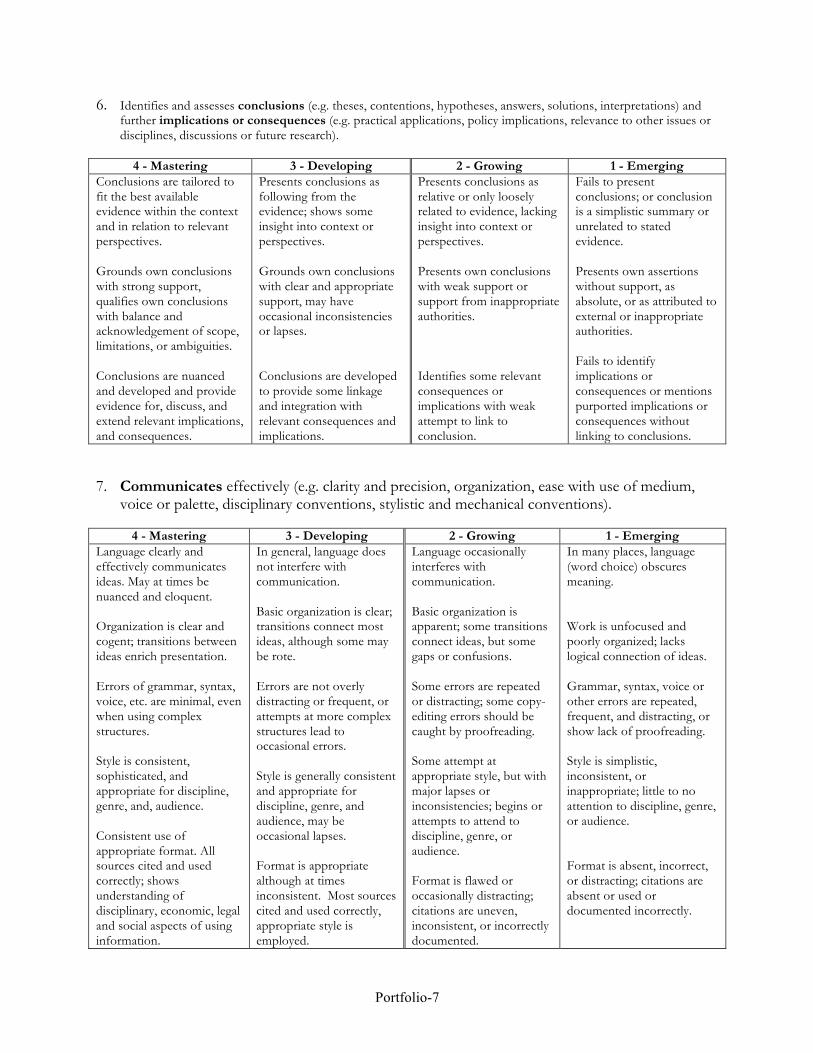
6. Identifies and assesses conclusions (e.g. theses, contentions, hypotheses, answers, solutions, interpretations) and further implications or consequences (e.g. practical applications, policy implications, relevance to other issues or disciplines, discussions or future research).
4 - Mastering 3 - Developing 2 - Growing 1 - Emerging Conclusions are tailored to fit the best available evidence within the context and in relation to relevant perspectives. Grounds own conclusions with strong support, qualifies own conclusions with balance and acknowledgement of scope, limitations, or ambiguities. Conclusions are nuanced and developed and provide evidence for, discuss, and extend relevant implications, and consequences.
Presents conclusions as following from the evidence; shows some insight into context or perspectives. Grounds own conclusions with clear and appropriate support, may have occasional inconsistencies or lapses. Conclusions are developed to provide some linkage and integration with relevant consequences and implications.
Presents conclusions as relative or only loosely related to evidence, lacking insight into context or perspectives. Presents own conclusions with weak support or support from inappropriate authorities. Identifies some relevant consequences or implications with weak attempt to link to conclusion.
Fails to present conclusions; or conclusion is a simplistic summary or unrelated to stated evidence. Presents own assertions without support, as absolute, or as attributed to external or inappropriate authorities. Fails to identify implications or consequences or mentions purported implications or consequences without linking to conclusions.
7. Communicates effectively (e.g. clarity and precision, organization, ease with use of medium, voice or palette, disciplinary conventions, stylistic and mechanical conventions).
4 - Mastering 3 - Developing 2 - Growing 1 - Emerging
Language clearly and effectively communicates ideas. May at times be nuanced and eloquent. Organization is clear and cogent; transitions between ideas enrich presentation. Errors of grammar, syntax, voice, etc. are minimal, even when using complex structures. Style is consistent, sophisticated, and appropriate for discipline, genre, and, audience. Consistent use of appropriate format. All sources cited and used correctly; shows understanding of disciplinary, economic, legal and social aspects of using information.
In general, language does not interfere with communication. Basic organization is clear; transitions connect most ideas, although some may be rote. Errors are not overly distracting or frequent, or attempts at more complex structures lead to occasional errors. Style is generally consistent and appropriate for discipline, genre, and audience, may be occasional lapses. Format is appropriate although at times inconsistent. Most sources cited and used correctly, appropriate style is employed.
Language occasionally interferes with communication. Basic organization is apparent; some transitions connect ideas, but some gaps or confusions. Some errors are repeated or distracting; some copy-editing errors should be caught by proofreading. Some attempt at appropriate style, but with major lapses or inconsistencies; begins or attempts to attend to discipline, genre, or audience. Format is flawed or occasionally distracting; citations are uneven, inconsistent, or incorrectly documented.
In many places, language (word choice) obscures meaning. Work is unfocused and poorly organized; lacks logical connection of ideas. Grammar, syntax, voice or other errors are repeated, frequent, and distracting, or show lack of proofreading. Style is simplistic, inconsistent, or inappropriate; little to no attention to discipline, genre, or audience. Format is absent, incorrect, or distracting; citations are absent or used or documented incorrectly.

Portfolio-8
Faculty readers evaluated the works using this new rubric. Rather than a single score for Critical Thinking, submissions are judged as meeting Truman’s standard for Critical Thinking if the sum of the first four scores (excluding Communication) equals or exceeds 10. Around 65% of students met that standard.
The table below gives the scores by a student’s first major. The shaded columns on the right show the % of students who scored at or above a 10 on the score sum and the associated average score on those four, and the other columns show the average score on that element. Communication is in the far right (in an unshaded column) as a measure of technical writing ability on a 1-4 scale. This year, the schools of Science and Mathematics (10.55) and of Arts and Letters (10.54) had the highest average scores, which were significantly higher than the average overall (10.31). Health Science and Education (10.38) scored just above average, followed Social and Cultural Studies (10.12) and then Business (9.94). 2014 Critical Thinking and Writing Scores by First Major and School
N
Issue Context SupportEvid. Concl. Sum4 %10+ Comm.
2014
Artsand
letters
ART 43 2.74 2.74 2.72 2.58 10.79 74% 2.65CML 18 3.11 2.83 2.50 2.22 10.67 61% 2.89CRWT 10 2.90 2.60 3.10 2.70 11.30 70% 3.10ENG 86 2.98 2.72 2.62 2.38 10.70 70% 2.92LING 5 3.20 3.20 3.40 3.00 12.80 100% 3.40MUS 29 2.76 2.38 2.52 2.31 9.97 62% 2.83THEA 13 2.39 2.00 2.00 1.92 8.31 31% 2.39AAL 204 2.87 2.65 2.62 2.40 10.54 67% 2.83
Busin
ess ACCT 63 2.87 2.60 2.60 2.51 10.59 70% 2.76
BSAD 95 2.49 2.35 2.37 2.31 9.52 56% 2.43BUS 158 2.65 2.45 2.46 2.39 9.94 61% 2.56
Hlth
.Sci.and
Ed. ATHT 5 2.20 2.80 2.80 2.60 10.40 40% 2.00
CMDS 46 3.11 2.83 2.61 2.57 11.11 83% 3.02ES 79 2.76 2.48 2.41 2.22 9.86 57% 2.56HLTH 69 2.84 2.59 2.49 2.30 10.23 62% 2.70NU 49 2.86 2.69 2.82 2.39 10.76 65% 2.69HSE 248 2.85 2.62 2.56 2.35 10.38 65% 2.70
Socialand
CulturalStudies
COMM 60 2.60 2.63 2.57 2.42 10.22 53% 2.62ECON 14 3.14 3.07 2.79 2.50 11.50 79% 3.00HIST 40 2.83 2.85 2.90 2.40 10.98 75% 2.73JUST 40 2.95 3.00 2.63 2.53 11.10 73% 2.83PHRE 7 2.71 2.71 2.71 2.00 10.14 57% 2.86POL 35 3.20 3.17 2.80 2.94 12.11 80% 3.06PSYC 115 2.74 2.71 2.52 2.29 10.26 62% 2.71SOAN 20 2.85 2.50 2.90 2.60 10.85 60% 2.60SCS 331 2.22 2.80 2.66 2.44 10.12 66% 2.76
Sci
enc
e&
Ma
the
ma
ticsAGSC 20 2.75 2.40 2.40 2.55 10.10 50% 2.60

Portfolio-9
BIOL 119 2.83 2.66 2.79 2.38 10.66 64% 2.87CHEM 33 2.88 2.70 2.73 2.49 10.79 79% 2.94CS 34 2.68 2.68 2.65 2.32 10.32 62% 2.94MATH 25 2.60 2.56 2.52 2.24 9.92 64% 2.68PHYS 8 3.00 2.50 3.25 3.13 11.88 88% 3.25SAM 239 2.79 2.63 2.72 2.41 10.55 65% 2.86
IDSM 5 2.60 3.00 2.40 2.40 10.40 40% 3.00
ALL 1185 2.64 2.66 2.61 2.40 10.31 65% 2.75 Submissions were also analyzed by the discipline from which the submission comes. As the table below
shows, ENG (N = 170) and JINS (N = 128) are still the most common sources for submissions. PSYC, COMM and PHRE also drew more than 60 submissions each. Note that the Sum4 score for ENG would be higher if ENG 190 submissions (N = 26) were removed. The row marked “<5” come from a range of disciplines with fewer than 5 submissions.
2014 Critical Thinking and Writing Scores by Course Prefix
PrefixN
Issue Context SupportEvid. Concl. Sum4 %10+ Comm.
2014ALL 1185 2.64 2.66 2.61 2.40 10.31 65% 2.75ENG 170 2.76 2.52 2.52 2.31 10.11 59% 2.71JINS 128 2.76 2.63 2.41 2.30 10.11 60% 2.69PSYC 72 2.72 2.72 2.57 2.39 10.40 64% 2.71COMM 65 2.55 2.54 2.49 2.32 9.91 52% 2.60PHRE 65 2.55 2.45 2.51 2.22 9.72 52% 2.66BIOL 59 3.07 2.81 3.02 2.58 11.48 75% 3.07HIST 49 2.65 2.76 2.67 2.31 10.39 67% 2.63POL 43 2.95 2.98 2.84 2.77 11.53 77% 2.84ES 43 2.95 2.51 2.51 2.28 10.26 60% 2.61BSAD 40 2.85 2.70 2.83 2.68 11.05 73% 2.93JUST 38 3.03 2.79 2.61 2.55 10.97 74% 2.79NU 34 3.09 2.94 3.03 2.50 11.56 79% 2.88ACCT 34 2.77 2.47 2.59 2.32 10.15 74% 2.53CMDS 29 3.14 2.90 2.59 2.66 11.28 86% 3.03ART 28 2.61 2.64 2.71 2.25 10.21 64% 2.50SOAN 24 2.79 2.58 2.67 2.29 10.33 54% 2.58HLTH 23 3.00 2.70 2.70 2.44 10.83 78% 2.74ED 21 3.10 2.91 2.52 2.24 10.76 71% 2.95CS 19 2.84 2.58 2.74 2.37 10.53 68% 3.00ECON 18 2.83 2.78 2.33 2.67 10.61 61% 2.72AGSC 17 3.12 2.82 2.53 2.71 11.18 71% 2.88PHYS 12 2.75 2.92 2.92 2.92 11.50 75% 3.17

Portfolio-10
CHEM 10 3.00 2.70 2.80 2.80 11.30 90% 3.00MUSI 10 2.90 2.10 2.60 2.20 9.80 50% 3.00MATH 9 2.33 2.44 2.67 2.11 9.56 67% 2.00SPAN 9 2.89 2.89 2.11 1.89 9.78 56% 2.89IDSM 6 3.17 2.83 2.83 2.17 11.00 83% 2.83INDV 5 3.40 3.40 3.00 2.40 12.20 80% 3.40ENVS 5 3.00 2.60 2.60 2.00 10.20 60% 2.60THEA 5 2.00 1.60 1.60 1.60 6.80 20% 2.00<5 28 2.97 2.83 2.87 2.52 11.19 81% 2.85
Because this rubric is still a new measure, inter-rater reliability was of
particular importance, and our new measure has exceeded expectations. Of the 1185 submissions, 473 (almost 40%) were scored by a second reviewer. On the right is the table of absolute differences between the two reviewers on the combined four components. The range of scores is from 4 to 16, and over one-quarter of reviewers assigned the same summed score, with over 90% giving a score within +/- two. A Pearson correlation of the two scores gave r = 0.814 showing a very highly significant level of inter-rater reliability.
As our academic programs begin to implement their critical thinking plans, we expect scores to continue to rise in this submission area, in line with the campus-wide attention being placed on Critical Thinking as a key component of a liberal education.
2014 Interdisciplinary Thinking
Examples of student work demonstrating interdisciplinary thinking were elicited with the following prompt:
Please include a work demonstrating that you have engaged in interdisciplinary thinking. “Interdisciplinary Thinking” means using the perspectives, methodologies or modes of inquiry of two or more disciplines in exploring problems, issues, and ideas as you make meaning or gain understanding. You work in an interdisciplinary way when you integrate or synthesize ideas, materials, or processes across traditional disciplinary boundaries. You should not assume that you are generating interdisciplinary work if you merely use essential skills like writing, speaking, a second language, computation, percentages, or averages to explore content, perspectives and ideas in only one discipline. To illustrate interdisciplinary thinking, consider reviewing the examples from the “Book of Fours,” which is available on the Portfolio Project website. These outstanding works were submitted by Truman students for this category and demonstrate a strong command of interdisciplinary thinking skills.
The portfolio readers scored submissions using these descriptors:
Abs.Diff. Percent6+ 0%5 0.6%4 2.1%3 6.3%2 21.1%1 42.5%0 27.1%
Interdisciplinary Thinking at a Glance • Number of submissions read 1183 (of 1185) • Mean score (on a 0-4 scale): 1.85 • % Scoring 2 or higher 64% • Highest scoring School: Science and Math • Most frequent source (discipline): JINS • Trends in recent years: Stable

Portfolio-11
Some Descriptors of Competence as an Interdisciplinary Thinker The items submitted may have some, many, or all of these features which influence your holistic response to the material you review. 4 Strong Competence
v A number of disciplines v Significant disparity of disciplines v Uses methodology from other disciplines for inquiry v Analyzes using multiple disciplines v Integrates or synthesizes content, perspectives, discourse, or methodologies from a number of
disciplines 3 Competence
v A number of disciplines v Less disparity of disciplines v Moderate analysis using multiple disciplines v Moderate integration or synthesis
2 Some Competence v A number of disciplines v Minimal disparity of disciplines v Minimal analysis using multiple disciplines v Minimal evidence of comprehension of interdisciplinarity
1 Weak Competence
v A number of disciplines v Mentions disciplines without making meaningful connections among them v No analysis using multiple disciplines v No evidence of comprehension of interdisciplinarity
0 No demonstration of competence as an interdisciplinary thinker
v Only one discipline represented v No evidence of multiple disciplines, of making connections among disciplines, or of some
comprehension of interdisciplinarity
The students’ scores, organized and averaged by their first major, are listed in the following table. When the data are examined by school (omitting IDS majors who, while few in number, outperform all other groups), submissions from the School of Business still score lower than those from other schools. The scores of the HSE majors are still a bit lower than the others, but their scores continue to move toward the average of all majors. Majors from all schools have a median of 2 (IDS majors have a median of 3). 2014 Interdisciplinary Thinking Scores by First Major and School
Mean Score % Competent
Maj. 2010 2011 2012 2013 2014 2010 2011 2012 2013 2014
Arts
and
Let
ters
ART 1.97 2.05 2.14 1.61 1.81 70% 70% 79% 50% 60%CML 1.97 2.19 2.27 1.75 2.22 69% 73% 73% 63% 78%CWRT* 2.33 2 1.00 67% 64% 30%ENG 1.94 1.98 2.04 2.13 1.83 68% 68% 71% 77% 62%

Portfolio-12
LING 1.71 2.86 1 2.33 2.00 43% 100% 17% 67% 80%MUS 2.33 2.56 2.06 1.73 1.90 83% 83% 75% 62% 69%THEA 1.91 2.32 2.2 1.89 1.85 64% 89% 80% 78% 62%AAL 1.99 2.12 2.07 1.95 1.83 69% 73% 72% 68% 63%
Busi
ness
ACCT 1.73 1.76 1.72 1.72 1.59 61% 64% 58% 64% 52%BSAD 1.63 1.5 1.68 1.51 1.74 53% 49% 51% 48% 61%BUS 1.68 1.6 1.7 1.59 1.68 57% 54% 54% 54% 58%
Hlt
h. S
ci.
and
Ed.
AT* 3 2 0.80 100% 80% 20%CMDS 1.58 1.57 1.9 1.96 1.70 58% 57% 68% 66% 59%ES 1.57 1.56 1.76 1.56 1.53 49% 54% 62% 51% 56%HLTH 1.75 1.9 1.51 1.92 1.93 47% 62% 51% 61% 72%NU 1.6 2 1.93 2.13 1.57 57% 67% 62% 78% 53%HSE 1.61 1.73 1.78 1.82 1.67 52% 59% 61% 60% 60%
Soci
al a
nd C
ultu
ral S
tudi
es
COMM 1.9 1.58 1.92 1.91 1.65 67% 54% 62% 62% 60%ECON 2 2.13 2.23 2.13 2.57 67% 75% 85% 75% 86%HIST 1.87 2 2.14 1.94 1.75 65% 68% 66% 74% 63%JUST 1.33 1.62 1.48 1.43 1.80 60% 46% 56% 48% 65%PHRE 2.29 2.45 1.92 1.77 1.86 56% 85% 69% 69% 57%POL 1.77 1.94 2.02 1.86 2.20 48% 59% 63% 68% 83%PSYC 1.83 1.64 2 2 1.63 61% 51% 71% 72% 57%SOAN 1.85 1.78 2.55 1.88 1.90 71% 67% 90% 63% 55%SCS 1.8 1.79 2 1.86 1.79 62% 59% 68% 65% 63%
Scie
nces
and
Mat
hem
atic
s AGSC 1.79 1.81 2 1.17 2.45 50% 69% 64% 42% 85%BIOL 1.87 2.02 2.25 1.95 2.04 64% 68% 76% 68% 72%CHEM 1.48 1.63 1.79 1.53 1.94 39% 63% 54% 53% 58%CS 1.76 1.47 1.96 1.71 2.00 59% 53% 63% 61% 65%MATH 1.96 1.87 1.52 2.18 1.92 57% 63% 52% 73% 64%PHYS 1.8 2.17 1.86 2.27 1.75 60% 67% 71% 73% 50%SAM 1.82 1.91 2.04 1.84 2.03 59% 66% 67% 63% 69%
IDSM 1.67 3.11 2.4 3.67 2.60 61% 89% 80% 100% 100%
ALL 1.78 1.85 1.94 1.82 1.81 60% 63% 65% 63% 63%
The table below lists the IDS submission scores organized by the course prefix. It includes the number of submissions for each course prefix, the mean score for that prefix, and the percent that met or exceeded our benchmark of 2. The JINS courses continue to be successful at producing papers that earn scores demonstrating competence in interdisciplinary thinking. While several other disciplines and courses were also notably successful, the JINS course seems to be fulfilling its designated purpose of giving students demonstrable interdisciplinary experiences.

Portfolio-13
2014 IDS Scores by Course Prefix Prefix 2014Count Mean %2+JINS 681 2.04 71%ENG 63 1.41 44%PSYC 39 1.26 46%PHRE 37 1.49 54%BSAD 24 1.50 54%ART 22 1.41 41%COMM 21 1.67 71%MUSI 21 1.57 57%HIST 20 1.90 65%POL 17 2.06 77%IDSM 16 2.19 75%JUST 16 1.44 50%BIOL 16 1.50 44%NU 16 1.06 31%AGSC 13 2.15 85%ECON 11 1.09 27%ES 11 0.91 27%CS 10 2.10 70%ED 10 0.90 30%CMDS 10 0.80 20%ENVS 9 1.78 67%SPAN 8 1.63 50%ACCT 8 1.13 25%SOAN 7 1.86 57%THEA 7 1.57 43%HLTH 5 1.80 60%<5 32 1.36 51%
To measure inter-rater reliability, 843 submissions (71%) were read and scored by two readers. Mean
scores overall stayed about the same (1.83 v 1.88), and inter-reader reliability was high, with 72% of second readers assigning either the same score or a score within one rating of the first scorer. Fourteen submissions differed by 4 levels (for instance, a first reader score assigning a score of zero while the other scored the submission as a four). A Pearson’s correlation between the two readers was found to be r = 0.42.
AbsDiff % n
4 2% 143 10% 852 15% 1291 37% 316

Portfolio-14
0 35% 299 100% 843
2014 Civic Engagement
In 2014, the portfolio project began an exploration of the actions of students relating to their community involvement. Our guiding documents all include strong statements that Truman produces publicly engaged citizens. For example, our Vision Statement reads:
“Truman will demonstrate its public liberal arts and sciences mission by developing educated citizens needed to protect our democracy and offer creative solutions to local, state, national and global problems. It will do so through transformative experiences that foster critical thought, daring imagination and empathetic understanding of human experiences at home and around the world. Truman graduates will be citizen-leaders committed to service….”
Also our Desired Characteristics of Graduates includes this statement (emphasis added): “Truman graduates are creative, socially responsible leaders and engaged world citizens. They are responsible, informed, and compassionate. Upon graduation, they will have the tools and characteristics that will enable them to be active, successful participants in their worlds.” This Civic Engagement prompt is aimed at learning about the community commitments of our students and
about what students learn about their communities and themselves through such involvement. For the first year of this project, we decided to ask for submissions very broadly. Furthermore, we decided to focus primarily on 1) civic action and 2) the related personal reflection and growth of our students. Here is the language that we used to elicit this information.
What was your most meaningful and significant civic engagement experience during the years that you attended Truman?
"Civic Engagement is working to make a difference in the civic life of our communities and developing the combination of knowledge, skills, values and motivation to make that difference. It means promoting the quality of life in a community […].” (Excerpted from Civic Responsibility and Higher Education, edited by Thomas Erhlich)
* Civic engagement may begin with your own self-awareness, wherein you understand your own cultural or family origins, development, assumptions, and/or predispositions.
* It might then be followed by exploring a civic understanding of other people or cultures, recognizing and appreciating how their circumstances are the same or different from your own.
* Ultimately, your civic engagement should include actions that would improve the quality of life for people in a community. Community can be broadly defined here as a group of people who have common characteristics or bonds; some examples include your residence hall, neighborhood, student organization, major department, profession, internship site, town/city/state, church, nation, world, etc.
Your most meaningful and significant civic engagement experience while at Truman may be from activities that took place either in the classroom or outside of the classroom. This experience may have been for credit or pay, as an assignment in a course, tied to service learning, associated with a co-curricular activity, or just for fun.

Portfolio-15
It is not necessary to have a paper or artifact to submit with this prompt, but if you do, please attach it to the prompt from the vault.
In the box below, describe this most meaningful or significant civic engagement experience wherein you made a difference for a community in collaboration with others or on your own.
You might include:
* how you (and/or your team) developed and implemented your approach to the civic engagement experience,
* how you evaluated (or would evaluate) the process, and
* if possible, the result of the endeavor.
In this last box, describe what you learned about yourself and your community through this experience.
Scoring for this prompt used the following rubric, which was derived from a similar one developed by the AAC&U. Note that a score of zero was available to the readers if the none of the criteria was demonstrated at all.
TRUMAN PORTFOLIO CIVIC ENGAGEMENT RUBRIC (As of September 2013, Adapted from the AAC&U VALUE Rubric)
Civic engagement is "working to make a difference in the civic life of our communities and developing the combination of knowledge, skills, values, and motivation to make that difference. It means promoting the quality of life in a community, through both political and non-political processes." (Excerpted from Civic Responsibility and Higher Education, edited by Thomas Ehrlich, published by Oryx Press, 2000, Preface, page vi.) In addition, civic engagement encompasses actions wherein individuals participate in activities of personal and public concern that are both individually life enriching and socially beneficial to the community.
Mastering 4
Developing 3
Growing 2
Emerging 1
Civic Identity and Commitment
Provides evidence of experience in civic engagement activities and describes learning about self as it relates to a reinforced and clarified sense of civic identity and continued commitment to public action.
Provides evidence of experience in civic engagement activities and describes learning about self as it relates to a growing sense of civic identity and commitment.
Evidence suggests involvement in civic engagement activities is generated from expectations or course requirements rather than from a sense of civic identity.
Provides little evidence of experience in civic engagement activities and does not connect experiences to civic identity.
Civic Organizations and Groups
Demonstrates ability and commitment to collaboratively work across and within community groups to achieve a civic aim.
Demonstrates ability and commitment to work actively within community groups to achieve a civic aim.
Demonstrates experience identifying intentional ways to participate in civic groups.
Exhibits awareness of civic groups; experiments with civic groups, tries out a few.
Civic Communication
Tailors communication strategies to
Effectively communicates in civic context,
Communicates in civic context, showing ability to do
Communicates in civic context, showing ability to do

Portfolio-16
eloquently and effectively express, listen, and adapt ideas and messages based on others' perspectives, establishing relationships to further civic action.
showing ability to do all of the following: express, listen, and adapt ideas and messages based on others' perspectives.
more than one of the following: express, listen, or adapt ideas and messages based on others' perspectives.
one of the following: express, listen, or adapt ideas and messages based on others' perspectives.
Civic Action Demonstrates independent experience and innovation in team leadership of complex or multiple civic engagement activities.
Demonstrates independent experience or team leadership of civic action.
Reports clear and full participation in civically focused actions.
Has experimented with some civic activities.
Reflection about Civic Action
Accompanies civic engagement with deep reflective insights or analysis about results of civic actions.
Includes some reflective insights or analysis about the results of civic actions.
Begins to reflect on or describe how their civic actions may benefit individual(s) or communities.
Shows little internalized understanding of the potential benefits of civic activities and little commitment to future action.
We had anticipated that Truman students would report deep connections with their communities,
since we know that many of our students are very service-oriented. Instead, we found that many students did not seem to understand what we were asking about, even with the descriptions in the beginning of the prompt. Readers agreed that some level of civic engagement is a reasonable goal, overall, but wondered where in our curricular and extra-curricular activities these opportunities should occur. Many readers felt that it was not very obvious how their own courses could address this concept.
Furthermore, the rubric tried to score submissions on issues that we had not directly asked the students to explore. Since the prompt itself had focused on the students’ civic actions and then their reflections, many of the students did not address their own civic identities, recognition of how they themselves fit within civic organizations, or communication with civic groups. These points were challenging to extract from the narratives that the students submitted.
In the end, the readers ultimately recommitted to action and reflection as the primary aspects of civic engagement that we would like to know. The rubric for the 2015 Civic Engagement prompt will be streamlined to more directly correspond to the two text boxes that the students are using to report their experiences.
The table below lists the average scores in each of the rubric categories for the students by their majors and by schools. Students in Health Science and Education generally scored better than average in every category, while the business school generally scored lower. Overall, this data suggests that our students are participating “fully” in civically focused activities and are just beginning to reflect on what these activities mean to them and to the communities that they are serving.

Portfolio-17
2014 Civic Engagement Scores by Major
Major 2014N Identity Organizations Communication Action Reflection
Art
s an
d Le
tter
s
ART 43 1.74 1.49 1.40 1.51 1.44CML 18 2.50 2.11 2.06 1.89 2.44CRWT 10 2.30 2.30 2.10 2.00 2.50ENG 86 2.16 2.00 1.95 1.97 1.87LING 5 1.40 1.60 1.60 1.20 1.40MUS 29 1.93 1.62 1.48 1.69 1.66THEA 13 2.31 2.31 2.00 2.31 1.92AAL 204 2.07 1.87 1.78 1.83 1.82
Busi
ness
ACCT 63 2.11 2.02 1.81 1.95 1.78BSAD 95 1.74 1.60 1.38 1.58 1.56BUS 158 1.89 1.77 1.55 1.73 1.65
Hlt
h. S
ci.
and
Ed.
ATHT 5 1.40 1.00 1.40 1.20 1.40CMDS 46 2.00 2.00 1.91 1.96 2.17ES 79 1.90 1.82 1.68 1.80 1.94HLTH 69 2.71 2.59 2.29 2.58 2.64NU 49 2.35 2.10 2.08 2.04 2.16HSE 248 2.22 2.11 1.97 2.08 2.21
Soci
al a
nd C
ultu
ral S
tudi
es
COMM 60 2.13 2.20 1.80 1.92 1.85ECON 14 2.00 1.86 1.50 1.64 2.00HIST 40 1.68 1.50 1.33 1.53 1.43JUST 40 1.75 1.55 1.60 1.55 1.75PHRE 7 1.43 1.29 0.86 1.29 1.29POL 35 2.31 2.17 2.09 2.06 2.40PSYC 115 2.17 1.96 1.90 2.00 2.10SOAN 20 1.55 1.50 1.40 1.55 1.60SCS 331 1.54 1.87 1.73 1.82 1.91
Scie
nces
and
Mat
hem
atic
s AGSC 20 2.40 1.90 1.80 2.10 2.20BIOL 119 2.24 2.02 1.80 1.98 2.02CHEM 33 2.33 2.21 1.82 2.00 2.09CS 34 1.53 1.41 1.38 1.32 1.44MATH 25 2.24 1.96 1.72 1.92 2.16PHYS 8 1.75 1.63 1.75 1.63 1.50SAM 239 2.15 1.93 1.73 1.88 1.96
IDSM 5 2.60 2.60 2.40 2.20 2.60 ALL 1185 1.95 1.92 1.77 1.88 1.94

Portfolio-18
Only 516 of the total submissions (less than 44%) were connected to a course. This low number implies that our students are exploring these opportunities more through their extra-curricular activities than through courses. The average scores awarded for each course prefix are tabulated below, in order of the number of submissions. Of those submissions that were course based, the largest number of submissions came from Health Science or Exercise Science classes. Communications courses came in a close third. In addition, the HLTH course submissions scored higher than average in every category of the rubric. If proficiency in civic engagement continues to gain acceptance as an important form of growth for our students, faculty from all across campus may want to consider how their courses could include some component of civic engagement as a useful way of learning the material and applying that knowledge in a practical setting. 2014 Civic Engagement Scores by Course Prefix
Course 2014N Identity Organizations Communication Action ReflectionALL 1185 1.95 1.92 1.77 1.88 1.94HLTH 70 2.56 2.44 2.27 2.54 2.53ES 44 1.68 1.66 1.59 1.68 1.89COMM 40 1.80 1.68 1.55 1.60 1.53ENG 32 1.28 1.06 0.97 0.97 1.19JINS 31 1.07 0.97 0.94 0.81 0.90NU 28 2.11 1.86 1.86 1.71 1.86PSYC 27 1.82 1.63 1.93 1.78 2.19SOAN 27 1.63 1.56 1.56 1.63 1.56ED 26 1.54 1.31 1.58 1.35 1.62CMDS 24 1.92 1.96 2.00 1.88 2.04JUST 21 1.67 1.57 1.57 1.38 1.62POL 19 1.74 1.32 1.58 1.37 1.47PHRE 18 0.94 1.00 0.72 0.72 0.83BSAD 12 1.08 0.83 0.92 0.92 0.75ART 10 1.70 1.30 1.40 1.00 1.40ECON 10 1.70 1.60 1.60 1.30 1.80IDSM 10 1.90 1.90 1.90 1.80 1.80BIOL 9 1.44 1.56 1.56 1.67 1.44CS 7 0.71 0.57 1.00 0.86 1.00HIST 7 0.43 0.43 0.43 0.14 0.43MUSI 7 1.29 0.86 1.00 0.86 1.43ENVS 6 1.83 1.67 1.83 2.00 1.83ACCT 5 0.80 0.60 0.80 0.40 0.60SPAN 4 2.00 1.50 1.25 1.25 2.00AGSC 3 1.33 1.00 1.00 1.00 0.67CHEM 3 1.67 2.00 1.00 1.00 1.00FREN 3 1.00 0.33 0.67 0.33 0.67GEOG 2 2.00 2.00 1.00 1.50 1.50
Portfolio-19
INDV 2 0.50 0.50 0.50 0.50 1.00LING 2 2.00 2.00 2.50 2.00 2.00SED 2 0.00 0.00 0.00 0.00 0.00CHIN 1 1.00 0.00 0.00 0.00 2.00DS 1 0.00 0.00 0.00 0.00 0.00GERM 1 1.00 1.00 1.00 1.00 0.00JAPN 1 0.00 0.00 0.00 0.00 0.00THEA 1 3.00 3.00 2.00 3.00 0.00
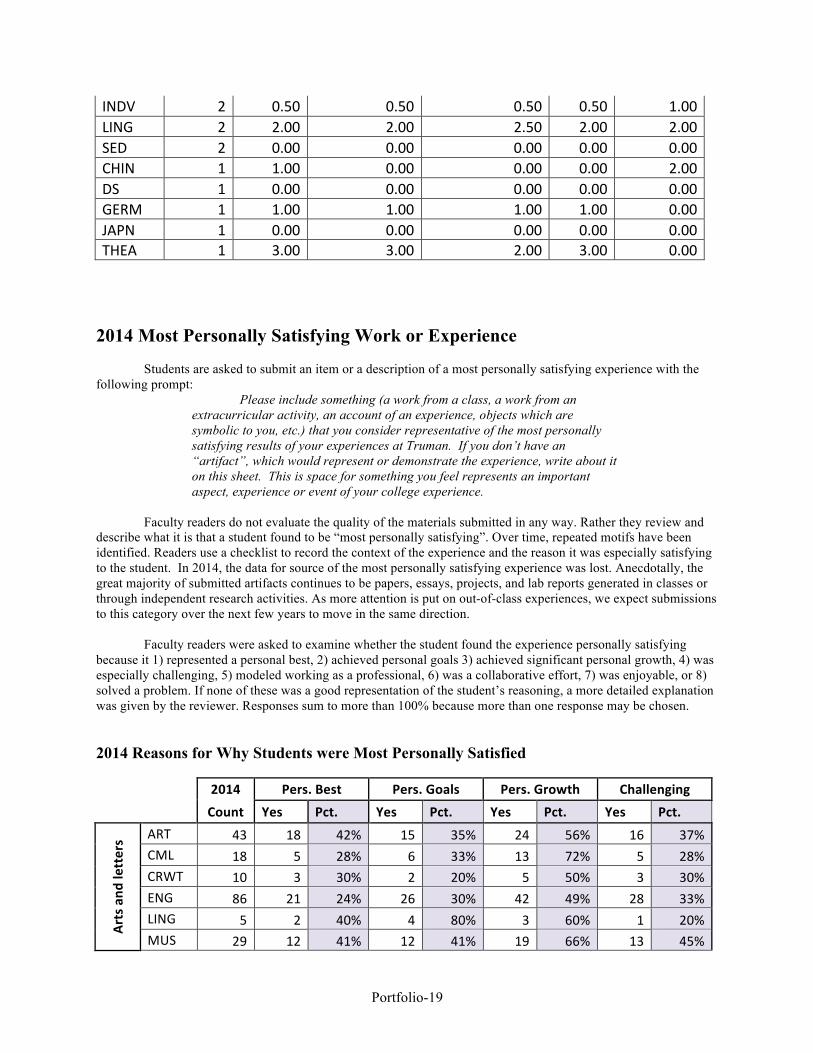
2014 Most Personally Satisfying Work or Experience Students are asked to submit an item or a description of a most personally satisfying experience with the following prompt:
Please include something (a work from a class, a work from an extracurricular activity, an account of an experience, objects which are symbolic to you, etc.) that you consider representative of the most personally satisfying results of your experiences at Truman. If you don’t have an “artifact”, which would represent or demonstrate the experience, write about it on this sheet. This is space for something you feel represents an important aspect, experience or event of your college experience.
Faculty readers do not evaluate the quality of the materials submitted in any way. Rather they review and describe what it is that a student found to be “most personally satisfying”. Over time, repeated motifs have been identified. Readers use a checklist to record the context of the experience and the reason it was especially satisfying to the student. In 2014, the data for source of the most personally satisfying experience was lost. Anecdotally, the great majority of submitted artifacts continues to be papers, essays, projects, and lab reports generated in classes or through independent research activities. As more attention is put on out-of-class experiences, we expect submissions to this category over the next few years to move in the same direction.
Faculty readers were asked to examine whether the student found the experience personally satisfying because it 1) represented a personal best, 2) achieved personal goals 3) achieved significant personal growth, 4) was especially challenging, 5) modeled working as a professional, 6) was a collaborative effort, 7) was enjoyable, or 8) solved a problem. If none of these was a good representation of the student’s reasoning, a more detailed explanation was given by the reviewer. Responses sum to more than 100% because more than one response may be chosen. 2014 Reasons for Why Students were Most Personally Satisfied
2014 Pers.Best Pers.Goals Pers.Growth Challenging
Count Yes Pct. Yes Pct. Yes Pct. Yes Pct.
Artsand
letters ART 43 18 42% 15 35% 24 56% 16 37%
CML 18 5 28% 6 33% 13 72% 5 28%CRWT 10 3 30% 2 20% 5 50% 3 30%ENG 86 21 24% 26 30% 42 49% 28 33%LING 5 2 40% 4 80% 3 60% 1 20%MUS 29 12 41% 12 41% 19 66% 13 45%

Portfolio-20
THEA 13 6 46% 2 15% 4 31% 5 39%AAL 204 67 33% 67 33% 110 54% 71 35%
Busine
ss ACCT 63 12 19% 11 17% 31 49% 11 17%
BSAD 95 16 17% 18 19% 41 43% 33 35%BUS 158 28 18% 29 18% 72 46% 44 28%
Hlth
.Sci.and
Ed. ATHT 5 3 60% 2 40% 2 40% 2 40%
CMDS 46 12 26% 11 24% 23 50% 18 39%ES 79 18 23% 13 16% 34 43% 23 29%HLTH 69 8 12% 14 20% 45 65% 21 30%NU 49 12 24% 10 20% 20 41% 17 35%HSE 248 53 21% 50 20% 124 50% 81 33%
Socialand
CulturalStudies COMM 60 8 13% 8 13% 34 57% 21 35%
ECON 14 5 36% 2 14% 5 36% 6 43%HIST 40 12 30% 9 23% 14 35% 14 35%JUST 40 8 20% 6 15% 21 53% 15 38%PHRE 7 3 43% 1 14% 1 14% 2 29%POL 35 13 37% 4 11% 14 40% 17 49%PSYC 115 21 18% 18 16% 56 49% 46 40%SOAN 20 5 25% 3 15% 10 50% 5 25%SCS 331 75 23% 51 15% 155 47% 126 38%
Sciencesand
Mathe
matics
AGSC 20 2 10% 2 10% 12 60% 7 35%BIOL 119 26 22% 26 22% 51 43% 36 30%CHEM 33 6 18% 12 36% 11 33% 14 42%CS 34 10 29% 5 15% 12 35% 13 38%MATH 25 8 32% 4 16% 10 40% 10 40%PHYS 8 2 25% 2 25% 4 50% 4 50%SAM 239 54 23% 51 21% 100 42% 84 35%
IDSM 5 0 0% 1 20% 3 60% 0 0%
ALL 1185 277 23% 249 21% 564 48% 406 34% 2014 Reasons for Why Students were Most Personally Satisfied (continued)
2014 Professional Collaborative Enjoyable Prob.Solv.
Count Yes Pct. Yes Pct. Yes Pct. Yes Pct.
Artsand
letters
ART 43 10 23% 1 2% 25 58% 3 7%CML 18 2 11% 2 11% 5 28% 1 6%CRWT 10 3 30% 0 0% 6 60% 0 0%ENG 86 20 23% 7 8% 39 45% 6 7%

Portfolio-21
LING 5 2 40% 0 0% 0 0% 0 0%MUS 29 5 17% 5 17% 16 55% 1 3%THEA 13 4 31% 2 15% 7 54% 0 0%AAL 204 46 23% 17 8% 98 48% 11 5%
Busine
ss ACCT 63 14 22% 17 27% 31 49% 4 6%
BSAD 95 20 21% 21 22% 46 48% 5 5%BUS 158 34 22% 38 24% 77 49% 9 6%
Hlth
.Sci.and
Ed. ATHT 5 3 60% 0 0% 3 60% 1 20%
CMDS 46 19 41% 8 17% 21 46% 7 15%ES 79 18 23% 11 14% 38 48% 6 8%HLTH 69 19 28% 19 28% 37 54% 8 12%NU 49 14 29% 3 6% 26 53% 1 2%HSE 248 73 29% 41 17% 125 50% 23 9%
Socialand
CulturalStudies COMM 60 23 38% 5 8% 31 52% 5 8%
ECON 14 4 29% 2 14% 5 36% 1 7%HIST 40 6 15% 4 10% 13 33% 0 0%JUST 40 7 18% 7 18% 15 38% 4 10%PHRE 7 0 0% 0 0% 3 43% 0 0%POL 35 8 23% 1 3% 12 34% 0 0%PSYC 115 21 18% 12 10% 62 54% 11 10%SOAN 20 5 25% 1 5% 8 40% 5 25%SCS 331 74 22% 32 10% 149 45% 26 8%
Sciencesand
Mathe
matics
AGSC 20 9 45% 5 25% 10 50% 1 5%BIOL 119 32 27% 19 16% 57 48% 6 5%CHEM 33 11 33% 7 21% 14 42% 5 15%CS 34 11 32% 6 18% 6 18% 5 15%MATH 25 6 24% 5 20% 11 44% 1 4%PHYS 8 3 38% 3 38% 4 50% 4 50%SAM 239 72 30% 45 19% 102 43% 22 9%
IDSM 5 0 0% 1 20% 0 0% 0 0%
ALL 1185 299 25% 174 15% 551 46% 91 8%
Over the last 5 years, the percentage of students who cite each of the various reasons has remained remarkably consistent, as can be seen in the table below. Students are particularly satisfied by work that allows them to grow personally and that is simply enjoyable. They like to be challenged and to do the work that they will be doing as a professional in their field. They do not often mention problem solving or collaboration as important in the work that they find most personally satisfying.
2010 – 2014 Percentages of Students Citing Different Reasons for their Most Personally Satisfying Submission

Portfolio-22
Year 2010 2011 2012 2013 2014
Reasons PersonalGrowth 39% 41% 39% 36% 48%Enjoyable * * 74% 43% 46%Challenging 34% 35% 34% 32% 34%Professional 26% 23% 22% 23% 25%PersonalBest 30% 26% 27% 27% 23%PersonalGoals 23% 23% 22% 19% 21%Collaborative 12% 11% 11% 10% 15%ProblemSolving * * 0% 3% 8%
* Enjoyable and Problem solving were not categories before 2012. 2014 Letters to Truman Finally, the portfolio asks students to compose a letter addressed to the Liberal Arts and Science Portfolio Project Team. In 2014, 1185 (100%) of portfolios included a Letter to Truman. This is amazingly high, given that portfolios must be resubmitted if they are missing one of the academic prompts, but portfolios without Letters to Truman are sometimes grudgingly accepted. While the academic works submitted in other categories provide direct insight into student achievement, the Letters to Truman provide a more personal view of student attitudes and opinions. The content of these letters varies widely, and many students do not talk about all of the suggested topics. Therefore, when numerical data are reported for this category, any student not reporting an opinion is listed as “no indication.” This would be true even when a student gives no indication because they submitted no Letter to Truman.
During the weeks of portfolio assessment and evaluation, the student letters are generally reserved for the
last day. While reading student letters, faculty readers are instructed to reserve one or more student letters to share with the group, and thus the week of portfolio evaluations ends with an airing of student concerns, criticisms, recommendations, and/or praise. Here is the prompt that is used to solicit students’ final thoughts about their time at Truman. “Thank you for completing your Truman Portfolio! As a final submission, please compose and submit a reflective letter or essay addressed to Truman. “You can tell us anything you think that we as an institution should hear. “Absolutely every letter is read by a faculty or staff reader, and while we cannot promise to solve every problem you tell us about, we are very interested in what you have to say. “Points that you might include are: * The process you used in putting together the portfolio, including the total amount of time (in hours) you spent in assembling your portfolio. * Anything you may have learned or affirmed about yourself through the portfolio process. * Your thoughts on the portfolio assessment process. * Did you hear about the portfolio ahead of time? Which methods of communication worked best?
Letters to Truman at a Glance • Number of submissions: 1186 • Median time to complete portfolio: 4 hours • Attitudes to Truman Education Very Positive • Attitudes to portfolio Positive • Common themes Growth in academic prowess
Praise to faculty

Portfolio-23
* Your thoughts on other assessment instruments or practices here at Truman. * Your thoughts on your experiences and education while at Truman in your major, other classes, and out-of-class experiences. * Your plans for the future. * Anything else you want to tell us.”
Faculty readers track the number of hours devoted to the portfolio assembly, and look for self-reflection in the letters. When students express attitudes about the portfolio, about assessment and about their education, readers note whether those opinions are positive, mixed, or negative. Finally, readers designate parts of letters containing relevant insights, or specific suggestions, to be given a broader audience. Some of these insights and suggestions are shared openly with the other readers as described above, and some are included as quotes here. Some students make statements describing how impactful a particular member or department of our Truman community has been on their academic and personal development; when possible, we try to forward those accolades to the people who made the difference and perhaps to their direct supervisor.
Because of an expressed concern that portfolio assessment could be too intrusive in student and faculty lives, the prompt for the Letters to Truman asks seniors to report the time involved in compiling and submitting their portfolio, and faculty readers record this time. In 2014, the mode response was 4 hours, with percentiles shown in the table. This analysis includes all responses that could be put into quantitative form – some students did not address the time they spent on this task, and others gave responses like “I spent a little bit each week for the whole semester.” Even so, a small number of students reporting a very large amount of time makes the raw average a bit misleading, and probably an overestimate. However, these numbers are an increase over the past few years, perhaps due to more senior seminar and capstone classes requiring work on it each week.
2014 Percentiles 2014 Hours 100% 30
90% 10 75% 6 50% 4 25% 3 10% 2
0% 0.5
Some students reported difficulty in finding papers because their computers had crashed or they had not remembered to save their work, but many also reported that choosing the best work for each prompt was quite simple. As discussed below, many students found the search process itself reflective and useful. ATTITUDE TOWARD THE PORTFOLIO PROCESS
Most students (almost 70%) did comment on their attitudes toward the Portfolio, which are about the same as last year, and are still mostly positive. Positive comments about the portfolio often point out how the process has given them a chance to see their own growth, usually in thinking or in writing. One student said:
“Gathering material from many different courses is a great culmination to encapsulate the variety of courses I have received from this liberal arts institution.” Some students who report mixed feelings about the portfolio comment on how the requested prompts are
not relevant to their main interests, and some worry about how the portfolio reflects on themselves personally. Others mentioned their own lack of organization and file keeping (our new system is helping with this). One student said:
“I think that portfolio process should be introduced earlier so that students know that they open and start to upload documents. I didn’t realize that I could have access to the vault earlier than senior year. Maybe someone told me, but I just wasn’t worried about yet.”
Portfolio-24
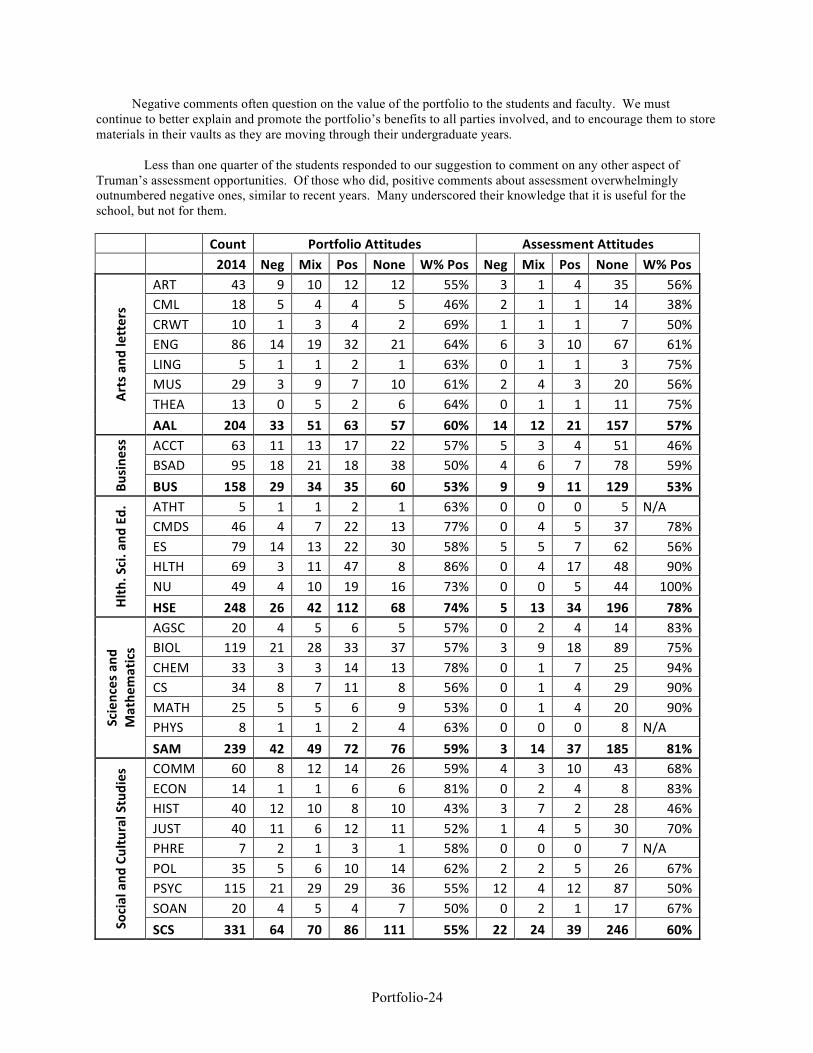
Negative comments often question on the value of the portfolio to the students and faculty. We must continue to better explain and promote the portfolio’s benefits to all parties involved, and to encourage them to store materials in their vaults as they are moving through their undergraduate years.
Less than one quarter of the students responded to our suggestion to comment on any other aspect of
Truman’s assessment opportunities. Of those who did, positive comments about assessment overwhelmingly outnumbered negative ones, similar to recent years. Many underscored their knowledge that it is useful for the school, but not for them. Count PortfolioAttitudes AssessmentAttitudes 2014 Neg Mix Pos None W%Pos Neg Mix Pos None W%Pos
Artsand
letters
ART 43 9 10 12 12 55% 3 1 4 35 56%CML 18 5 4 4 5 46% 2 1 1 14 38%CRWT 10 1 3 4 2 69% 1 1 1 7 50%ENG 86 14 19 32 21 64% 6 3 10 67 61%LING 5 1 1 2 1 63% 0 1 1 3 75%MUS 29 3 9 7 10 61% 2 4 3 20 56%THEA 13 0 5 2 6 64% 0 1 1 11 75%AAL 204 33 51 63 57 60% 14 12 21 157 57%
Busine
ss
ACCT 63 11 13 17 22 57% 5 3 4 51 46%BSAD 95 18 21 18 38 50% 4 6 7 78 59%BUS 158 29 34 35 60 53% 9 9 11 129 53%
Hlth
.Sci.and
Ed. ATHT 5 1 1 2 1 63% 0 0 0 5 N/A
CMDS 46 4 7 22 13 77% 0 4 5 37 78%ES 79 14 13 22 30 58% 5 5 7 62 56%HLTH 69 3 11 47 8 86% 0 4 17 48 90%NU 49 4 10 19 16 73% 0 0 5 44 100%HSE 248 26 42 112 68 74% 5 13 34 196 78%
Sciencesand
Mathe
matics
AGSC 20 4 5 6 5 57% 0 2 4 14 83%BIOL 119 21 28 33 37 57% 3 9 18 89 75%CHEM 33 3 3 14 13 78% 0 1 7 25 94%CS 34 8 7 11 8 56% 0 1 4 29 90%MATH 25 5 5 6 9 53% 0 1 4 20 90%PHYS 8 1 1 2 4 63% 0 0 0 8 N/ASAM 239 42 49 72 76 59% 3 14 37 185 81%
Socialand
CulturalStudies COMM 60 8 12 14 26 59% 4 3 10 43 68%
ECON 14 1 1 6 6 81% 0 2 4 8 83%HIST 40 12 10 8 10 43% 3 7 2 28 46%JUST 40 11 6 12 11 52% 1 4 5 30 70%PHRE 7 2 1 3 1 58% 0 0 0 7 N/APOL 35 5 6 10 14 62% 2 2 5 26 67%PSYC 115 21 29 29 36 55% 12 4 12 87 50%SOAN 20 4 5 4 7 50% 0 2 1 17 67%SCS 331 64 70 86 111 55% 22 24 39 246 60%
Portfolio-25
IDSM 5 1 1 1 2 50% 0 1 0 4 50% ALL 1185 195 247 369 374 61% 53 73 142 917 67%
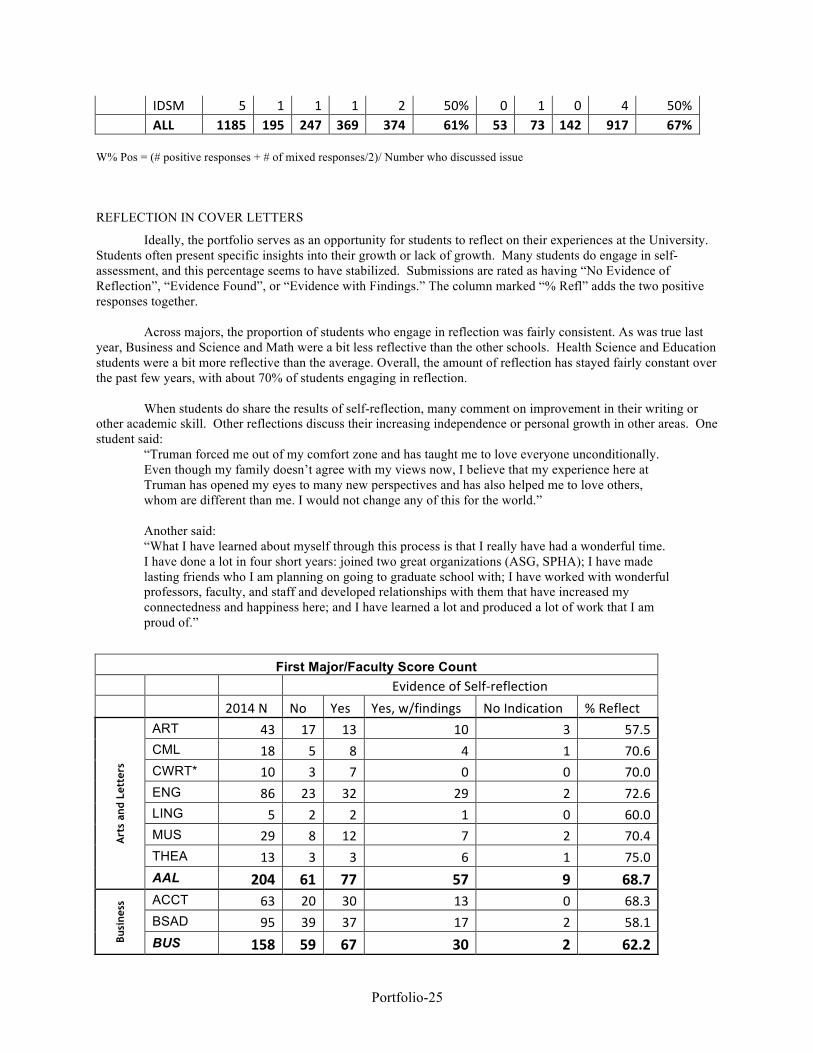
W% Pos = (# positive responses + # of mixed responses/2)/ Number who discussed issue
REFLECTION IN COVER LETTERS
Ideally, the portfolio serves as an opportunity for students to reflect on their experiences at the University. Students often present specific insights into their growth or lack of growth. Many students do engage in self-assessment, and this percentage seems to have stabilized. Submissions are rated as having “No Evidence of Reflection”, “Evidence Found”, or “Evidence with Findings.” The column marked “% Refl” adds the two positive responses together.
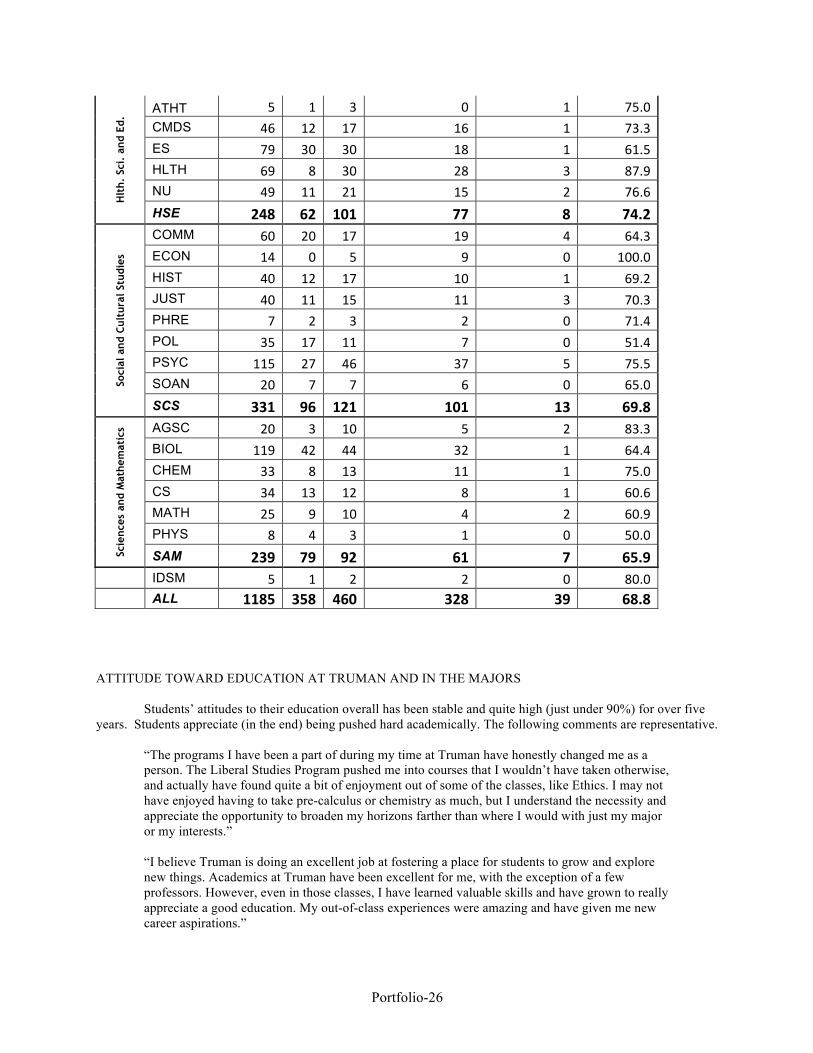
Across majors, the proportion of students who engage in reflection was fairly consistent. As was true last year, Business and Science and Math were a bit less reflective than the other schools. Health Science and Education students were a bit more reflective than the average. Overall, the amount of reflection has stayed fairly constant over the past few years, with about 70% of students engaging in reflection.
When students do share the results of self-reflection, many comment on improvement in their writing or
other academic skill. Other reflections discuss their increasing independence or personal growth in other areas. One student said:
“Truman forced me out of my comfort zone and has taught me to love everyone unconditionally. Even though my family doesn’t agree with my views now, I believe that my experience here at Truman has opened my eyes to many new perspectives and has also helped me to love others, whom are different than me. I would not change any of this for the world.” Another said: “What I have learned about myself through this process is that I really have had a wonderful time. I have done a lot in four short years: joined two great organizations (ASG, SPHA); I have made lasting friends who I am planning on going to graduate school with; I have worked with wonderful professors, faculty, and staff and developed relationships with them that have increased my connectedness and happiness here; and I have learned a lot and produced a lot of work that I am proud of.”
First Major/Faculty Score Count
EvidenceofSelf-reflection 2014N No Yes Yes,w/findings NoIndication %Reflect
Art
s an
d Le
tter
s
ART 43 17 13 10 3 57.5CML 18 5 8 4 1 70.6CWRT* 10 3 7 0 0 70.0ENG 86 23 32 29 2 72.6LING 5 2 2 1 0 60.0MUS 29 8 12 7 2 70.4THEA 13 3 3 6 1 75.0AAL 204 61 77 57 9 68.7
Busi
ness
ACCT 63 20 30 13 0 68.3BSAD 95 39 37 17 2 58.1BUS 158 59 67 30 2 62.2
Portfolio-26
Hlt
h. S
ci.
and
Ed.
ATHT 5 1 3 0 1 75.0CMDS 46 12 17 16 1 73.3ES 79 30 30 18 1 61.5HLTH 69 8 30 28 3 87.9NU 49 11 21 15 2 76.6HSE 248 62 101 77 8 74.2
Soci
al a
nd C
ultu
ral S
tudi
es
COMM 60 20 17 19 4 64.3ECON 14 0 5 9 0 100.0HIST 40 12 17 10 1 69.2JUST 40 11 15 11 3 70.3PHRE 7 2 3 2 0 71.4POL 35 17 11 7 0 51.4PSYC 115 27 46 37 5 75.5SOAN 20 7 7 6 0 65.0SCS 331 96 121 101 13 69.8
Scie
nces
and
Mat
hem
atic
s AGSC 20 3 10 5 2 83.3BIOL 119 42 44 32 1 64.4CHEM 33 8 13 11 1 75.0CS 34 13 12 8 1 60.6MATH 25 9 10 4 2 60.9PHYS 8 4 3 1 0 50.0SAM 239 79 92 61 7 65.9
IDSM 5 1 2 2 0 80.0
ALL 1185 358 460 328 39 68.8 ATTITUDE TOWARD EDUCATION AT TRUMAN AND IN THE MAJORS
Students’ attitudes to their education overall has been stable and quite high (just under 90%) for over five years. Students appreciate (in the end) being pushed hard academically. The following comments are representative.
“The programs I have been a part of during my time at Truman have honestly changed me as a person. The Liberal Studies Program pushed me into courses that I wouldn’t have taken otherwise, and actually have found quite a bit of enjoyment out of some of the classes, like Ethics. I may not have enjoyed having to take pre-calculus or chemistry as much, but I understand the necessity and appreciate the opportunity to broaden my horizons farther than where I would with just my major or my interests.” “I believe Truman is doing an excellent job at fostering a place for students to grow and explore new things. Academics at Truman have been excellent for me, with the exception of a few professors. However, even in those classes, I have learned valuable skills and have grown to really appreciate a good education. My out-of-class experiences were amazing and have given me new career aspirations.”

Portfolio-27
Many students use their Letters to Truman to “shout out” to the people who have made a difference for them here. Most of these people are from within their majors, but other groups and individuals are mentioned routinely. For example, the University Counseling Center, the Career Center, the International Students office, and many others regularly make a great difference for our students. It is wonderful to read about how much our community of Trumanites support each other and are “there” for each other. When possible, these accolades are reported to both to the specific people or offices who are described and to their direct supervisor.
"I found my niche in Alpha Phi Omega on campus, and the people I met there were undoubtedly some of the greatest people I have ever met. In fact all of the people here were fantastic and welcoming: staff included. Everyone here truly wanted me to succeed, and that served as my greatest motivation to do my very best every single day.” “The professors... care about their students in a way that I never expected from a college professor, and they’re very talented and knowledgeable of their fields, but there’s also a passion that’s displayed making them even more valuable as teachers and guides. They’re inspiring and enlightening, and they challenge you in ways you’ve never been challenged.” “Through all of our interactions and conversations we help each other make sense of our world and translate our classroom head knowledge into pragmatic actions and sustainable changes. We help each other channel our naively enthusiastic passions into meaningful and effective work. The magic is in the students. I am fundamentally altered by the experiences I have lived and endured alongside all of the uniquely talented students Truman attracts.” This year, only 30 students were negative about their overall education at Truman. The few mixed and
negative submissions vary, but some use the Letters to Truman to give very specific or very general complaints about Truman, disdain for a “well-rounded education” or a particular professor, or the lack of name recognition Truman has.
The Letters to Truman prompt changed in 2012 to specifically mention the major when asking for students’
thoughts about their education. Since then, the number of students who comment on this issue continues to steadily climb, with 62% of students commenting on their attitude to their major this year. As with the comments about their education in general, comments about the major are also overwhelmingly positive, with 87% of those that comment rating it as positive this year. This proportion has stayed steady over time. Only 25 students had only negative things to say about their major’s education. Positive comments vary by major, of course, but often focus on faculty interaction, preparation for future career or study, or the community of students they have worked with.
“I have found that the biology curriculum at Truman is fantastic. There are shortcomings in its organization and requirements, which the department is well aware of and working to fix, and by and large the material is up to date and reflected in the latest journals. I have completed two Research Experiences for Undergraduates sponsored by the National Science Foundation, and both times I have felt and demonstrated a level of preparation far beyond that of other undergraduates in the same program and at the same point in their biology educations. Few things build confidence as being asked to explain a procedure to another student and be told by a graduate student that your explanation was spot on. Truman undoubtedly prepared me well for these experiences, and for that I thank you.”
“Some good things that I will point out is the professors here (as a whole) are great. Especially in the business and statistics department…. I love the fact that I have been challenged here. I think that there needs to be a line drawn dividing a “hefty workload” and insanity…."
On the other hand, one student commented though on how the budget cuts have affected her major:
“While I am grateful for the opportunities I have had with the theatre department, there is one thing I wish I could change about Truman, the budget cuts. As a student, I feel as if I have lost many opportunities because of the cuts to the department’s budget. While I am aware that budget cuts have been made all over the board, it sometimes feels that the theatre department is often left

Portfolio-28
in the dark. It saddens me to see our budget decline and then directors have to make sacrifices for their shows in order to stay within their budgets.”
Count Education Attitudes Major Attitudes
2014 Neg Mix Pos None W% Pos Neg Mix Pos None
W% Pos
Art
s and
lette
rs
ART 43 4 9 24 6 77% 4 11 16 12 69% CML 18 0 4 13 1 88% 0 3 10 5 88% CRWT 10 0 0 8 2 100% 0 2 5 3 86% ENG 86 2 17 58 9 86% 1 9 47 29 90% LING 5 0 1 2 2 83% 0 1 0 4 50% MUS 29 0 9 16 4 82% 1 5 16 7 84% THEA 13 0 2 10 1 92% 0 0 7 6 100% AAL 204 6 42 131 25 85% 6 31 101 66 84%
Busin
ess ACCT 63 1 12 41 9 87% 2 9 20 32 79%
BSAD 95 3 12 68 12 89% 1 12 36 46 86% BUS 158 4 24 109 21 88% 3 21 56 78 83%
Hlth
. Sci
. and
Ed.
ATHT 5 1 0 2 2 67% 0 2 2 1 75% CMDS 46 0 8 35 3 91% 2 4 21 19 85% ES 79 4 19 53 3 82% 0 11 46 22 90% HLTH 69 0 4 61 4 97% 0 4 54 11 97% NU 49 0 3 41 5 97% 0 4 32 13 94% HSE 248 5 34 192 17 90% 2 25 155 66 92%
Scie
nces
and
M
athe
mat
ics
AGSC 20 0 4 13 3 88% 0 2 10 8 92% BIOL 119 4 19 89 7 88% 1 21 52 45 84% CHEM 33 0 6 24 3 90% 0 0 20 13 100% CS 34 0 4 25 5 93% 0 1 20 13 98% MATH 25 0 4 19 2 91% 1 5 14 5 83% PHYS 8 0 1 7 0 94% 0 0 5 3 100% SAM 239 4 38 177 20 89% 2 29 121 87 89%
Soci
al a
nd C
ultu
ral S
tudi
es
COMM 60 2 10 40 8 87% 1 4 24 31 90% ECON 14 0 1 13 0 96% 0 1 8 5 94% HIST 40 1 14 19 6 76% 4 2 21 13 81% JUST 40 2 9 25 4 82% 1 6 11 22 78% PHRE 7 0 2 5 0 86% 0 0 4 3 100% POL 35 2 5 22 6 84% 2 0 16 17 89% PSYC 115 3 22 81 9 87% 4 15 47 49 83% SOAN 20 0 8 10 2 78% 0 2 7 11 89% SCS 331 10 71 215 35 85% 12 30 138 151 85%
IDSM 5 1 2 2 0 60% 0 0 2 3 100% ALL 1185 30 211 826 118 87% 25 136 573 451 87%

Portfolio-29
Transformative Learning Experiences Questionnaire (TEQ)
Although Truman uses various instruments and systems to measure students’ participation in key experiential learning opportunities such as Study Abroad, Undergraduate Research Experiences, Service Learning, and Internships, we do not have a single instrument that asks about all of them. The portfolio project has administered a survey to students about these and other transformative experiences since 2010. We define Transformative Learning as follows: Transformative learning occurs when an educational experience that includes reflection results in a profound change in the way you think and/or behave relative to what you have learned. Students may complete the TEQ at any time, but are also asked to review it again when they indicate that their portfolio is complete. Students are first asked to consider: “Thinking of your higher-education experience at Truman as a whole, to what degree was your education Transformative, according to the definition above?” 5 - Totally Transformative 4 - Very Transformative 3 - Transformative 2 - Somewhat Transformative 1 - Not Particularly Transformative
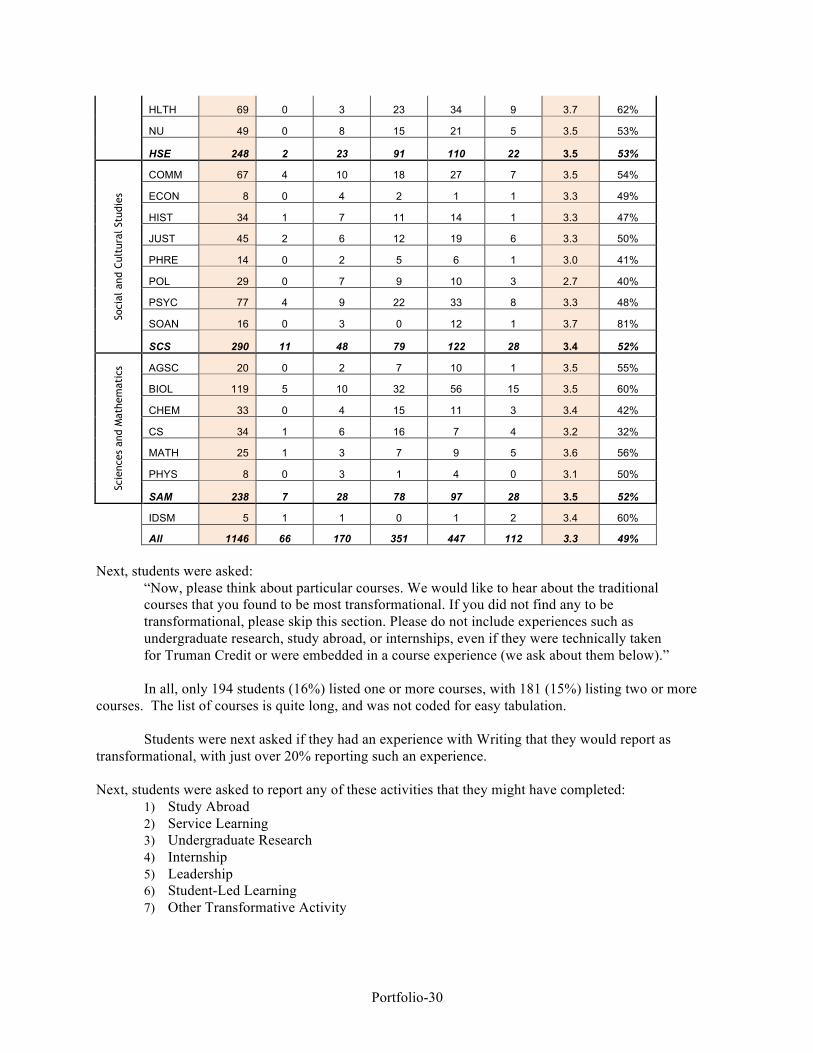
Overall, about half of students answered “Totally” or “Very” transformative. Examining the
average score for each discipline in the table below reveals no significant differences; similarly, although the data is not shown here, no significant differences were found with respect to gender. 2014 Scores for Whether Truman Education as a Whole was Transformative
2014 Score Avg. %
N 1 2 3 4 5 4 & 5
Arts
and
Let
ters
ART 43 5 2 16 17 3 3.3 47%
CML 18 1 3 9 4 1 3.1 28%
CWRT 10 0 3 2 3 2 3.4 50%
ENG 86 2 4 28 41 11 3.6 60%
LING 5 0 1 1 3 0 3.4 60%
MUS 29 1 3 9 11 5 3.6 55%
THEA 13 1 0 4 5 3 3.7 62%
AAL 204 10 16 69 84 25 3.5 53%
Busi
ness
ACCT 63 6 9 27 17 4 3.1 33%
BSAD 94 2 24 31 32 5 3.1 39%
BUS 157 8 33 58 49 9 3.1 37%
Hlt
h. S
ci.
and
Ed. AT 5 1 0 1 2 1 3.4 60%
CMDS 46 0 4 23 16 3 3.4 41%
ES 79 1 8 29 37 4 3.4 52%
Portfolio-30
HLTH 69 0 3 23 34 9 3.7 62%
NU 49 0 8 15 21 5 3.5 53%
HSE 248 2 23 91 110 22 3.5 53%
Soci
al a
nd C
ultu
ral S
tudi
es
COMM 67 4 10 18 27 7 3.5 54%
ECON 8 0 4 2 1 1 3.3 49%
HIST 34 1 7 11 14 1 3.3 47%
JUST 45 2 6 12 19 6 3.3 50%
PHRE 14 0 2 5 6 1 3.0 41%
POL 29 0 7 9 10 3 2.7 40%
PSYC 77 4 9 22 33 8 3.3 48%
SOAN 16 0 3 0 12 1 3.7 81%
SCS 290 11 48 79 122 28 3.4 52%
Scie
nces
and
Mat
hem
atic
s AGSC 20 0 2 7 10 1 3.5 55%
BIOL 119 5 10 32 56 15 3.5 60%
CHEM 33 0 4 15 11 3 3.4 42%
CS 34 1 6 16 7 4 3.2 32%
MATH 25 1 3 7 9 5 3.6 56%
PHYS 8 0 3 1 4 0 3.1 50%
SAM 238 7 28 78 97 28 3.5 52%
IDSM 5 1 1 0 1 2 3.4 60%
All 1146 66 170 351 447 112 3.3 49% Next, students were asked:
“Now, please think about particular courses. We would like to hear about the traditional courses that you found to be most transformational. If you did not find any to be transformational, please skip this section. Please do not include experiences such as undergraduate research, study abroad, or internships, even if they were technically taken for Truman Credit or were embedded in a course experience (we ask about them below).”
In all, only 194 students (16%) listed one or more courses, with 181 (15%) listing two or more
courses. The list of courses is quite long, and was not coded for easy tabulation.
Students were next asked if they had an experience with Writing that they would report as transformational, with just over 20% reporting such an experience. Next, students were asked to report any of these activities that they might have completed:
1) Study Abroad 2) Service Learning 3) Undergraduate Research 4) Internship 5) Leadership 6) Student-Led Learning 7) Other Transformative Activity

Portfolio-31
When they check that they have done one of these activities, follow-up questions are asked. The table below shows the levels of transformative activities that were reported by the students in the last 5 years. The percentages are remarkably consistent over this time period.
Experience %ReportingActivity
2010 2011 2012 2013 2014StudyAbroad 21% 22% 23% 19% 20%
ServiceLearning 23% 21% 23% 18% 23%Research 26% 29% 31% 27% 29%Internship 24% 29% 33% 26% 35%Leadership 35% 35% 40% 36% 38%Student-led 7% 6% 9% 7% 7%Writing* 25% 21% 21%Other* 8% 7% 7% 7% 7%Course* 8% 7% 45% 42% 16%
Any(Big4) 61% 65% 65% 65% 69%Any 79% 82% 82% 79% 83%
* Some issues with the TEQ instrument for comparison purposes include:
1) “Writing” was new in 2012 as an option on the instrument. 2) For “Writing,” “Course,” and “Other” only those students with transformative experiences give a
report. (Presumably all students did some writing and took a variety of courses). For the others, students who had any experience, transformative or not, were asked to respond either way, so average ratings may be artificially low.
3) Some terms are not fully defined in the survey or campus-wide, so students may have different ideas of “Research,” “Service-learning,” and other terms used in this study.
Significant differences continue to be found by gender. There is no category where men report
higher participation than women (although undergraduate research and leadership are comparable this year), and some differences are quite striking.
Experience 2011 2012 2013 2014
Women Men Women Men Women Men Women Men
Study Abroad 28% 12% 28% 17% 24% 13% 25% 10%
Service Learning 28% 11% 27% 15% 25% 9% 29% 14%
Research 30% 27% 30% 31% 29% 26% 30% 29%
Internship 31% 26% 36% 29% 38% 30% 35% 34%
Leadership 41% 25% 44% 33% 37% 37% 41% 33%
Student-led 5% 6% 10% 8% 8% 6% 9% 5%
Course*+ 27% 26% 49% 38% 46% 38% 17% 15%

Portfolio-32
Writing* 7% 8% 23% 19% 22% 20%
Other* 7% 6% 7% 8% 8% 6% 7% 7% Many differences by first major are evident, most unsurprising. For example, language majors study abroad more than most, while pre-professional majors take internships. As we saw in the Civic Engagement prompt data, the School of Health Science and Education does a significant amount of service learning in their curricula. Science majors do a lot of research, etc.
Count Participation by Experience
Maj. 2014 StAbr ServL UGRes Intern Ldrshp Stuled Writing Other
Arts
and
Let
ters
ART 43 19% 5% 28% 23% 26% 7% 30% 7% CML 18 56% 17% 33% 11% 39% 11% 22% 6% CRWT 10 40% 20% 10% 40% 40% 10% 70% 10% ENG 86 21% 12% 15% 26% 34% 6% 55% 14% LING 5 0% 20% 40% 0% 40% 0% 0% 60% MUS 29 10% 3% 14% 0% 38% 7% 17% 7% THEA 13 23% 0% 8% 23% 38% 8% 15% 0% AAL 204 23% 9% 19% 20% 34% 7% 38% 11%
Busi
ness
ACCT 63 11% 21% 2% 40% 54% 6% 8% 8% BSAD 95 21% 8% 9% 45% 43% 7% 16% 4% BUS 158 17% 13% 6% 43% 47% 7% 13% 6%
Hlt
h. S
ci.
and
Ed.
AT 5 20% 0% 80% 0% 40% 0% 0% 20% CMDS 46 35% 43% 41% 11% 50% 4% 22% 9% ES 79 14% 38% 46% 77% 35% 8% 9% 8% HLTH 69 12% 86% 36% 48% 42% 14% 20% 4% NU 49 43% 31% 14% 29% 37% 6% 8% 4% HSE 248 23% 50% 37% 46% 40% 8% 14% 6%
Scie
nces
and
Mat
hem
atic
s AGSC 20 5% 10% 30% 55% 50% 10% 25% 5% BIOL 119 26% 14% 41% 17% 41% 8% 15% 3% CHEM 33 9% 3% 67% 27% 30% 6% 18% 6% CS 34 0% 3% 6% 47% 18% 0% 15% 9% MATH 25 20% 4% 28% 12% 40% 8% 12% 8% PHYS 8 0% 0% 50% 25% 13% 13% 13% 0% SAM 239 17% 9% 38% 26% 36% 7% 16% 5%
Soci
al a
nd C
ultu
ral S
tudi
es COMM 60 10% 12% 10% 45% 43% 8% 22% 8%
ECON 14 29% 14% 43% 50% 50% 21% 36% 7% HIST 40 13% 8% 30% 38% 25% 3% 30% 8% JUST 40 10% 23% 10% 23% 28% 8% 23% 13% PHRE 7 14% 14% 0% 14% 14% 14% 0% 14% POL 35 29% 9% 20% 51% 51% 6% 31% 9% PSYC 115 21% 46% 58% 35% 32% 3% 21% 9% SOAN 20 30% 55% 80% 55% 35% 15% 25% 5%
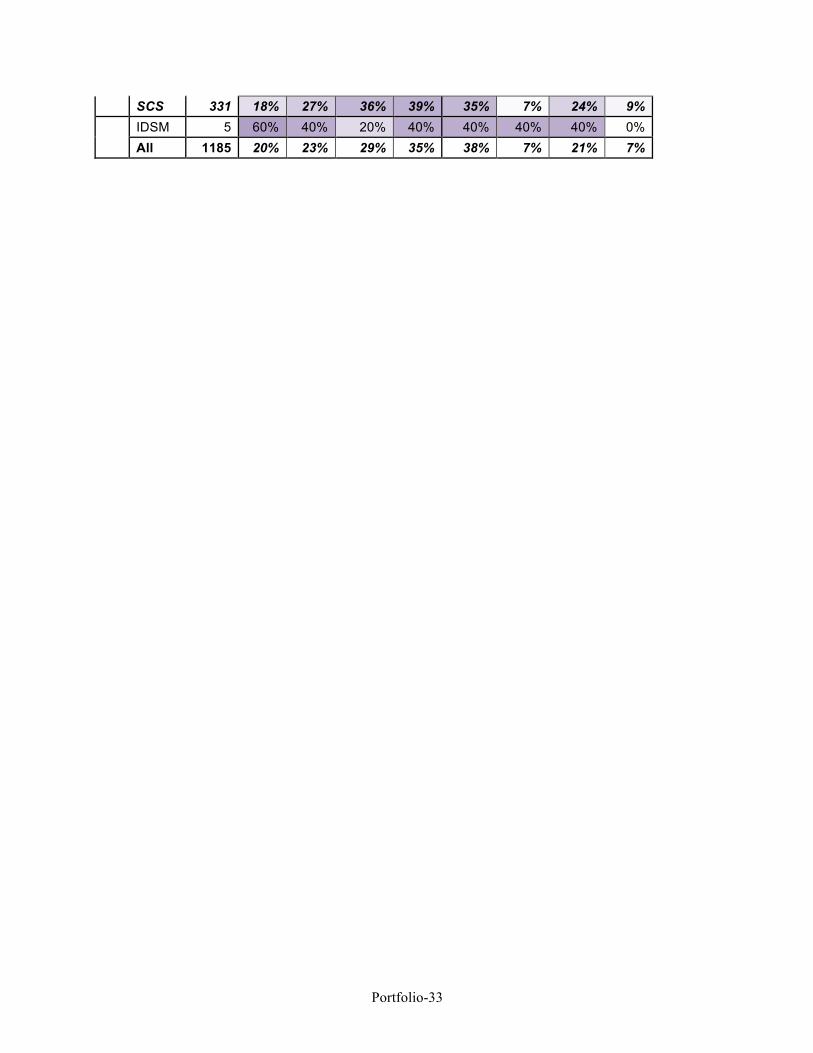
Portfolio-33
SCS 331 18% 27% 36% 39% 35% 7% 24% 9% IDSM 5 60% 40% 20% 40% 40% 40% 40% 0%
All 1185 20% 23% 29% 35% 38% 7% 21% 7%

Portfolio-34
Looking across activities, participation varies by major and school.
Count Big4 Participation Big4 All Participation All Major 2014 One or
More Two or More Avg.
One or More
Two or More Avg.
Arts
and
Let
ters
ART 43 67% 13% 0.74 77% 44% 1.44 CML 18 73% 23% 1.17 78% 67% 1.94 CRWT 10 50% 17% 1.10 100% 70% 2.40 ENG 86 49% 14% 0.73 86% 56% 1.81 LING 5 83% 33% 0.60 80% 40% 1.60 MUS 29 42% 5% 0.28 55% 31% 0.97 THEA 13 80% 60% 0.54 54% 46% 1.15 AAL 204 55% 15% 1.38 77% 51% 1.61
Busi
ness
ACCT 63 51% 19% 0.73 73% 44% 1.49 BSAD 95 66% 20% 0.84 77% 46% 1.58 BUS 158 60% 19% 1.35 76% 46% 1.54
Hlt
h. S
ci.
and
Ed.
AT 5 50% 25% 1.00 80% 60% 1.60 CMDS 46 64% 19% 1.30 93% 65% 2.15 ES 79 88% 47% 1.75 91% 75% 2.34 HLTH 69 100% 72% 1.81 94% 80% 2.62
NU 49 90% 36% 1.16 88% 47% 1.71
HSE 248 86% 45% 2.02 92% 69% 2.25
Scie
nces
and
Mat
hem
atic
s
AGSC 20 74% 23% 1.00 80% 55% 1.90
BIOL 119 59% 36% 0.98 82% 53% 1.68
CHEM 33 68% 50% 1.06 85% 45% 1.67
CS 34 75% 13% 0.56 68% 24% 0.97
MATH 25 46% 4% 0.64 76% 40% 1.32
PHYS 8 36% 29% 0.75 63% 13% 1.13
SAM 239 63% 30% 1.36 79% 45% 1.54
Soci
al a
nd C
ultu
ral S
tudi
es
COMM 60 64% 25% 0.77 78% 52% 1.58
ECON 14 50% 21% 1.36 79% 79% 2.50
HIST 40 76% 37% 0.88 80% 48% 1.53 JUST 40 50% 11% 0.65 80% 43% 1.35 PHRE 7 77% 15% 0.43 43% 29% 0.86 POL 35 78% 41% 1.09 89% 69% 2.06 PSYC 115 86% 42% 1.60 96% 69% 2.25 SOAN 20 100% 45% 2.20 100% 100% 3.00
SCS 331 90% 33% 1.76 86% 61% 1.94
IDSM 5 100% 40% 1.60 100% 60% 2.80
All 1185 69% 30% 1.62 83% 58% 1.82
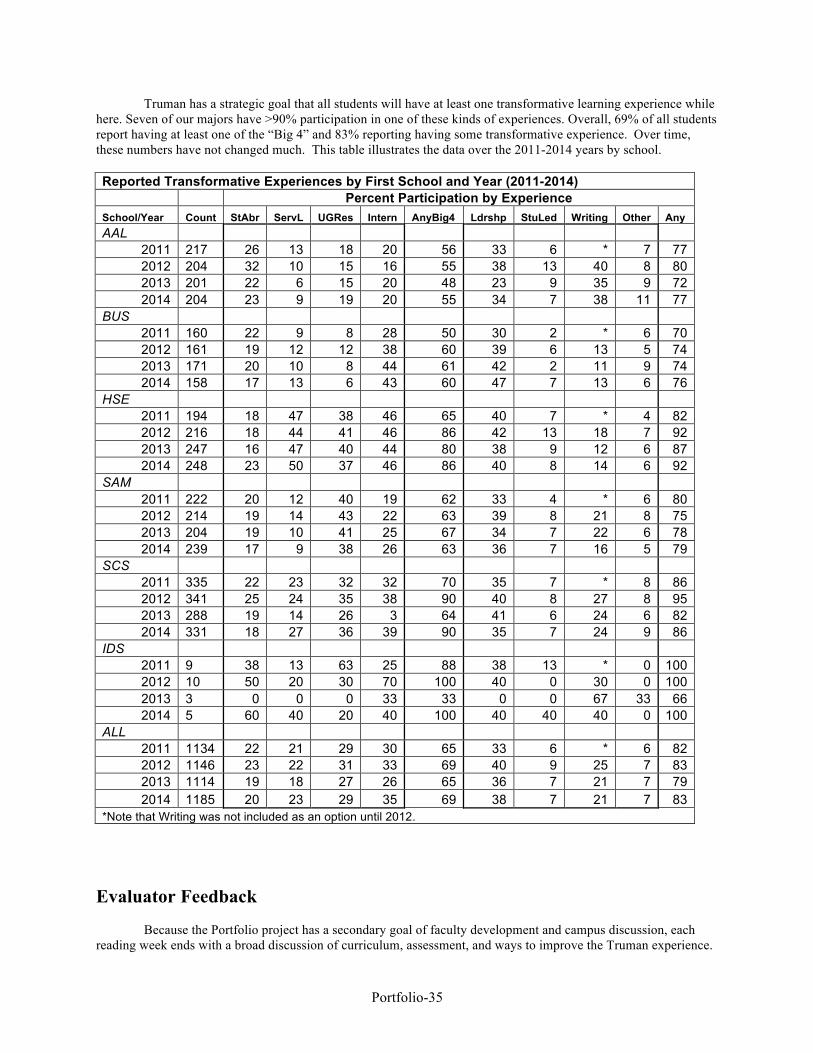
Portfolio-35
Truman has a strategic goal that all students will have at least one transformative learning experience while here. Seven of our majors have >90% participation in one of these kinds of experiences. Overall, 69% of all students report having at least one of the “Big 4” and 83% reporting having some transformative experience. Over time, these numbers have not changed much. This table illustrates the data over the 2011-2014 years by school.
Reported Transformative Experiences by First School and Year (2011-2014) Percent Participation by Experience School/Year Count StAbr ServL UGRes Intern AnyBig4 Ldrshp StuLed Writing Other Any AAL
2011 217 26 13 18 20 56 33 6 * 7 77 2012 204 32 10 15 16 55 38 13 40 8 80 2013 201 22 6 15 20 48 23 9 35 9 72 2014 204 23 9 19 20 55 34 7 38 11 77
BUS 2011 160 22 9 8 28 50 30 2 * 6 70 2012 161 19 12 12 38 60 39 6 13 5 74 2013 171 20 10 8 44 61 42 2 11 9 74 2014 158 17 13 6 43 60 47 7 13 6 76
HSE 2011 194 18 47 38 46 65 40 7 * 4 82 2012 216 18 44 41 46 86 42 13 18 7 92 2013 247 16 47 40 44 80 38 9 12 6 87 2014 248 23 50 37 46 86 40 8 14 6 92
SAM 2011 222 20 12 40 19 62 33 4 * 6 80 2012 214 19 14 43 22 63 39 8 21 8 75 2013 204 19 10 41 25 67 34 7 22 6 78 2014 239 17 9 38 26 63 36 7 16 5 79
SCS 2011 335 22 23 32 32 70 35 7 * 8 86 2012 341 25 24 35 38 90 40 8 27 8 95 2013 288 19 14 26 3 64 41 6 24 6 82 2014 331 18 27 36 39 90 35 7 24 9 86
IDS 2011 9 38 13 63 25 88 38 13 * 0 100 2012 10 50 20 30 70 100 40 0 30 0 100 2013 3 0 0 0 33 33 0 0 67 33 66 2014 5 60 40 20 40 100 40 40 40 0 100
ALL 2011 1134 22 21 29 30 65 33 6 * 6 82 2012 1146 23 22 31 33 69 40 9 25 7 83 2013 1114 19 18 27 26 65 36 7 21 7 79 2014 1185 20 23 29 35 69 38 7 21 7 83
*Note that Writing was not included as an option until 2012.
Evaluator Feedback Because the Portfolio project has a secondary goal of faculty development and campus discussion, each reading week ends with a broad discussion of curriculum, assessment, and ways to improve the Truman experience.

Portfolio-36
In addition, each evaluator during the May and August sessions was asked to complete an online survey in the weeks following their participation in the portfolio review process. We asked about specific prompts and also generally about the value of the week to the participants. Although the portfolio team is not a formal decision-making body, the presence of so many faculty and staff from across campus make this a unique opportunity for discussion and sharing ideas across departments and schools. The new rubric for the Critical Thinking and Writing Prompt was fully implemented this year and the faculty found it very intuitive to use for scoring. Since this prompt will continue to be used as a Performance Funding measure, it is gratifying that faculty find scoring to be straightforward. One faculty member said:
“I liked the changes from previous rubrics. I found that, in general, students were more successful than in past years in this area.”
The Civic Engagement Prompt was new this year, so the feedback on this prompt was especially useful. In
general the readers agreed that civic engagement is a reasonable goal for our students, and that we are particularly interested in what we asked the students: what did they do for their community and what did it mean to both the community and to themselves. However, our scoring rubric needs to be revised to more clearly focus on the action and reflection that the prompt itself asks the students to describe. One reader said:
“Yes, with the rise in technology, such as social networks, our students are more connected than ever but are increasingly less likely to physically engage with the world around them. Civic Engagement gets them out of their bubble and immediately seeing that they can impact their immediate and larger societies.”
Another commented that: “I think education before and reflection after civic involvement is essential to civic engagement. I appreciate the focus on civic engagement, but I think many of our students are going out into the community without knowledge and without reflection. This seems to be the lightest aspects of civic engagement. I would like to see more learning and thinking take place before the students become involved and more reflection after they participate.”
All of the 2014 Portfolio Reading sessions were held in the Magruder Hall computer room, MG 2005, to be
in the same building as the portfolio director and our portfolio office space. It is a comfortable, friendly space and conversation has flowed readily during discussions. Snacks are kept in a neighboring classroom (MG 2007), so that readers can sometimes get up, move around, and visit with one another in a separate space. One reader said:
“I enjoyed discussions with my colleagues and the opportunity to read submissions from students across the campus. I felt the week was well paced and I liked the new facility as well.”
Overall, faculty and staff readers report a very positive experience, and several mentioned the benefits to their course and assignment development. One said:
“I have already retooled my JINS course after the interdisciplinary discussion.” Another said:
“The courses I teach are quite skill based, so Critical Thinking is sometimes a difficult aspect to draw into these courses. I've gotten some ideas of assignments that will challenge my students' critical thinking skills.”
Future Plans The guiding principles for the portfolio project continue to be
A. Efficiency: Everything in the portfolio should be used for campus assessment and anything not useful should be removed.
B. Feedback: Evolve the portfolio away from being perceived as a “black hole” where students submit work but never receive feedback about that work.
C. Technology Improvements: allow greater opportunities and flexibility. D. Student Buy-in and motivation: Can we convince more of them to care? E. Faculty Buy-In and motivation: Can we convince more of them to care?

Portfolio-37
F. Baselines: As our curriculum evolves, what do we need to measure now so that we will recognize changes once they happen?
Our online system is still working well. Students may now upload files as soon as they arrive on campus and we are actively encouraging students to log in early in their careers here. The system also allows Course-embedded submissions, such as submissions from ENG 190 - Writing as Critical Thinking, JINS courses, and capstone artifacts, whether or not they will be used as part of the formal portfolio review. Although not fully embedded with other campus databases, the capability can be added later.
Another feature that is now possible is the ability of the portfolio system to maintain major-specific portfolio submissions and reflections. The Department of Society and Environment has used the Portfolio system to collect research papers from their SOAN majors since 2012, and this year, Health and Exercise Science added a prompt for their majors to submit their research papers from specific courses, so their growth in critical thinking can be assessed. We would welcome other programs’ interest in using the portfolio system in this major specific way. As the Undergraduate Council continues its review of LSP components, the portfolio is ready to revise LSP-driven prompts or to implement necessary new prompts. One campus topic that seems to be on the horizon is a Civic Engagement. Many of our guiding documents suggest that we aim to develop fully engaged citizens, so a prompt relating to this topic is being considered for inclusion in the next year.
Summary Student performance remains stable. The new elements have achieved stability, and the submission system is working well. Our students generally demonstrate competence at Interdisciplinary Thinking and Critical Thinking and Writing. The portfolio project is well-placed to continue to be seen as a jewel of Truman’s assessment program and will continue to be seen as a national leader in portfolio assessment, as well as using a portfolio as a valuable faculty development tool.