chapter studying cyanobacteria by means of fluorescence
TRANSCRIPT

1
Chapter
Studying Cyanobacteria by Means of Fluorescence Methods: A ReviewNatalia Yu. Grigoryeva
Abstract
Self-fluorescence is a powerful tool for investigation of living photosynthetic microorganisms. Since the physiological state of such microorganisms is closely related to the operation and activity of photosynthetic system; thus, any varia-tions in spectroscopic properties of their self-fluorescence indicate the changes in their physiological state. Cyanobacteria (or blue green alga) are one of the most widespread photosynthetic organisms in nature, and the ecological aspect in their investigation is quite valuable. On the other hand, thousands of strains belonging to different cyanobacterial species are cultivated in biolaboratories all over the world for different biotechnological applications such as biofuel cells, food production, pharmaceuticals, and fertilizers. Thus, the novel noninvasive methods of their investigation are quite important for on-line monitoring of cyanobacterial cultures. In this chapter, several fluorescence techniques are presented for investigation of living cyanobacterial cells and cultures.
Keywords: cyanobacteria, photosynthesis, fluorescence spectroscopy, confocal microscopic spectroscopy, fluorescence induction, flow cytometry, remote sensing
1. Introduction
In the last years, the investigation of cyanobacteria attracts a considerable attention due to their environmental and biotechnological importance. New applications of cyanobacterial communities appear in biotechnology (i.e., pro-duction of biofuel, agricultural fertilizers, pharmaceutics, and food additives ultraviolet protection compounds) [1–5] and biosensing [6–9]. Large-scale indus-trial production of the cyanobacterial products requires optimization and more detailed control of incubation conditions in order to increase productivity. On the other hand, the ecological problem of harmful bloom monitoring and control makes an important contribution in this rising interest to cyanobacteria, as to one of the main indicator organisms of the environment pollution and to methods of their investigation [10–18]. Obviously, future research in this field will be focused on the improvement of different treatments that inhibit harmful growth; thus, the development of novel noninvasive methods for on-line monitoring of cyano-bacterial communities in vivo is quite needed. The presence of a photosynthetic apparatus similar to higher plants makes microalgae and cyanobacteria suitable for use in biosensors based on monitoring changes in photosynthesis and other bioenergetic processes in the cell [19–21].

Fluorescence Methods for Investigation of Living Cells and Microorganisms
2
A vast amount of work was done to achieve a present insight into the physi-ological processes, which rules cyanobacteria life, and their genetic background [10–18]. Nowdays, it was clearly shown that there is a universal genetic response to most abiotic stressors (heat, osmotic, saline, acid stress, strong light, and ultraviolet radiation) [22]. Moreover, this universal response is closely related to the photo-synthetic activity of cyanobacterial cells [23]. This fact gives a unique opportunity for operational in-line monitoring (including remote sensing) of the physiological state of photosynthetic microorganisms in variable environmental conditions. Since most photosynthetic pigments possess self-fluorescent properties, thus, the emission spectral composition and fluorescence kinetics can provide important information about photosynthetic activity of living cells and reveal any variations in their physiological state under the influence of external factors.
All fluorescence methods can be divided in to two groups by their degree of organism impact. First group deals with in vivo investigations of living cells. Such methods should be noninvasive and very sensitive to study the life as it is, in dynamics of growth and adaptation. The second group deals with dead material. By these methods, chemical, morphological and genetic structure of the cell can be studied in different soluble and nonsoluble chemical components. In this chapter, we will be interested in the first ones. The most naturally suitable and appropriate methods of investigation of photosynthetic organisms are to use the self-fluorescence of photosynthetic apparatus. In this sense, following in vivo and in situ methods can be suggested: fluorescence spectroscopy (steady-state fluorescence) [24, 25], chlorophyll fluorescence induction analysis (fast and slow kinetics) [26, 27], pulse amplitude-modulated fluorometry (chlorophyll fluorescence quenching) [28, 29], delayed fluorescence [30, 31], flow cytometry [32, 33], confocal microscopic spectroscopy [34, 35], and remote sensing (pas-sive and active, e.g., fluorescence LIDAR technique) [36, 37].
Two main aspects in studying cyanobacteria usually are interested both ecologists and biotechnologists: physiological state of cyanobacteria on population and cell level, and biological diversity of the considered community. Fluorescence methods can successfully solve both problems.
2. Peculiarities of cyanobacterial photosynthetic apparatus
Photosynthetic system of cyanobacteria, in contrast to green algae and higher plants, contains the external membrane light-harvesting complexes. The antenna complex for photosystem II (PSII) and photosystem I (PSI) is extrinsic and is formed as a large multiprotein organelle (phycobilisome), which is located on the stromal side of the thylakoid membrane. The detailed description of the mor-phology, structure, chemical, and optical properties of light-harvesting complex of cyanobacteria, detached phycobilisomes, and phycobilins can be found in numerous publications [10–15, 38–40]. Here, we only pointed out several main features of its self-fluorescence spectrum that are essential for further discussion.
Phycobilisomes (PBSs) are assembled from 12 to 18 different types of polypep-tides, which may be grouped into three classes: (1) phycobiliproteins, (2) linker polypeptides, and (3) PBS-associated proteins. And only first ones bear chromo-phores and form fluorescence response together with chlorophyll a (Chl a) of PSII and PSI. PBSs are constructed from two main structural elements: a core substructure and peripheral rods that are arranged in a hemidiscoidal fashion around that core (Figure 1). During the energy transfer process through PBS to PSII and PSI, the occasional quenching of the absorbed light by fluorescence

3
Studying Cyanobacteria by Means of Fluorescence Methods: A ReviewDOI: http://dx.doi.org/10.5772/intechopen.93543
can occur and this is the essential property for fluorescence spectroscopy. Both steady-state and time-resolved fluorescence measurements are used for probing the structure and functioning of photosynthetic system of cyanobacteria via this specific fluorescent response.
The fluorescence of intact living cyanobacterial cells is originated from the efficiency of the energy transfer between all components of the energy transfer chain including the final step, the delivery to PSII or PSI (Figure 1). Each transfer step results in the spectrum shape as a peak or shoulder [41, 42]. This is due to the fact that in the course of the energy transfer from the initially photoexcited phy-cobiliprotein to the reaction center of photosystems PSI and PSII; fluorescence is emitted from almost every type of pigment and can be used as a probe to examine the mechanism of energy transfer within the light-harvesting system and between two photosystems [30, 38–40]. To monitor this energy transfer process, a sample should be irradiated with the light that selectively absorbs by one set of pigments and then the fluorescence, originated from another set of pigments, should be recorded. This type of fluorescence excitation experiment can be used to measure the efficiency of energy transfer from one set of pigments to another, which reflects the species-specific features, if cyanobacteria are in the optimal physiological state. On the other hand, under any external actions this fluorescence “finger prints” will change according to mechanisms of the cyanobacterial response on this action, and the changes in steady-state fluorescence and its kinetics finally can reveal these mechanisms.
As it was mentioned previously, a vast amount of fluorescence techniques were elaborated to study physiological state and biological diversity of photosynthetic organisms, but not all of them can be directly applied to cyanobacteria. Several crucial features of their fluorescence response lead to the necessity of changes in conventional techniques; otherwise, it will lead to insufficient or wrong results. To demonstrate these features of cyanobacteria, we present here several simple but representative examples, which show specific fluorescence response of cya-nobacteria compared to green microalgae Chlorella ellipsoidea Gerneck CALU 3. It should be mentioned here that the fluorescence response of green microalgae is quite similar to higher plants one, due to the similarity of the structure of their photosynthetic apparatus.
In Figure 2, three sets of fluorescence spectra, recorded via standard lambda-scanning procedure of confocal laser scanning microscope (CLSM) Leica TCS-SP5, and microphotographs of corresponding species, obtained simultaneously in fluorescence and transmission detection channels, are presented. The excitation wavelengths, corresponding to the emission lines of three CLSM lasers, are indi-cated over the curves (405, 458, 476, 488, 496, 514, 543, and 633 нм). It is well seen that depending on the excitation wavelength, the room temperature fluorescence emission spectrum of the intact cyanobacterial cells exhibits various extents of
Figure 1. Schematic drawing of photosynthetic apparatus and energy transfer in cyanobacteria.

Fluorescence Methods for Investigation of Living Cells and Microorganisms
4
contribution of phycobilisome emission to the spectrum, opposite to green algae. If one exclusively excites chlorophyll a fluorescence, using a 458-nm excitation wavelength, the emission spectrum of cyanobacterial cells shows no appreciable emission of phycocyanin or allophycocyanin. It is due to the fact that, in cyanobac-teria, the 458-nm excitation wavelength is preferentially absorbed by PSI and PSII, bypassing photosynthetic pigments of light harvesting complex (LHC). The excita-tion by intermediate (blue and green) wavelengths (405, 476, 488, and 496 nm) reveals fluorescent maxima of all photosynthetic pigments, belonging to the cor-responding species, since the light in this range is absorbed by all pigment-protein complexes almost in equal portions and fluorescence emits by all steps of energy transfer chain. The direct excitation of cyanobacterial cells in the phycocyanin absorption region at 514 and 543 nm results in emission spectrum with two main peaks at 580 and 656 nm, which are due to phycoerythrin, phycocyanin, and allo-phycocyanin emission. The spectra for 633-nm excitation wavelength directly give a prominent emission band at 656 nm that originates from phycocyanin, omitting the band at 580 nm, which cannot be excited by 633 nm. Other small emission bands, corresponding to fine pigment structure of antenna complex, are not resolved at the room temperature investigation.
Opposite to cyanobacterial species, green algae demonstrate poor diversity in the emission spectra (Figure 2(a)). Comparative analysis of the series of fluores-cence spectra for different cyanobacterial species and strains (Figure 2(b) and (c)) reveals visible variations in their shape, and thus, species/strains differentiation (so-called ataxonomic analysis) could be carried out [41, 42]. Moreover, this diver-sity in fluorescence responses on different excitation wavelength in cyanobacterial cells shows that all fluorescence techniques based on the analysis of chlorophyll a fluorescence, developed for higher plants (pulse amplitude modulation technique, flow cytometry, remote sensing, etc.), should be strongly modified for studying cyanobacteria.
Figure 2. Three characteristic sets of CLSM single-cell fluorescence spectra and microphotographs of corresponding strains, obtained simultaneously in fluorescence and transmission detection channels. (a) Chlorella ellipsoidea Gerneck CALU 3; (b) Synechocystis aquatilis CALU 1336; (c) Phormidium favosum str. Marvan CALU 624. All spectra are normalized to the maximum intensity and shifted along x-axis for convenience of observation. Corresponding excitation wavelengths are given over the curves. Dashed lines indicate wavelength of Chl a fluorescence maximum at 682 nm. The white bar corresponds to 5, 2.5, and 25 μm, respectively.

5
Studying Cyanobacteria by Means of Fluorescence Methods: A ReviewDOI: http://dx.doi.org/10.5772/intechopen.93543
Another important difference in the in vivo fluorescence response of cyano-bacteria and green algae lies in stress-state investigations. Figure 3 illustrates the temporal changes of the in vivo fluorescence spectrum in one living cell of cyano-bacterial strain Synechocystis aquatilis CALU 1336 and one living cell of Chlorella ellipsoidea Gerneck CALU 3 under light and heat stress. The series of spectra were recorded by means of CLSM lambda-scanning technique at the excitation wave-length 488 nm. Comparison of Figure 3(a) and (b) demonstrates the difference in stress fluorescence response for these two cases. Thus, the conclusions about stress state of cyanobacteria, made on the basis of the techniques elaborated for green algae and higher plants, are sometimes meaningless and sometimes absolutely incorrect. The presence of additional photosynthetic pigments in LHC of cyanobac-teria and some specific features in their photoprotection mechanisms makes them principally different from other photosynthetic taxa.
It should be noted here that this temporal set of fluorescence emission spectra illustrates all stages of cyanobacterial cell degradation, that is, all possible physi-ological states of the considered speci. Thus, during the growth evolution of the culture and aging of each cell, all these stages will be presented simultaneously in the volume samples of the whole population. This means that the analysis of the population growth and the community viability by means of fluorescence methods should also be corrected for cyanobacteria compared to green algae ones.
Figure 3. Time degradation of living cell of (a) cyanobacterial strain Synechocystis aquatilis CALU 1336 and (b) Chlorella ellipsoidea Gerneck CALU 3 under light and heat stress. Spectra were recorded at the excitation wavelength 488 nm and with the time step 2 min. Spectra are shifted along x-axis relative to each other for convenience of observation. Over the spectra, there are several fluorescent images taken at corresponding physiological states and recorded via CLSM. Right panels represent time dependence of the fluorescence intensity at 656 nm (PC-APC fluorescence) and at 682 nm (Chl a fluorescence) for cyanobacteria and at 682 nm for green microalgae. Dashed lines indicate the wavelength of Chl a fluorescence maximum at 682 nm.

Fluorescence Methods for Investigation of Living Cells and Microorganisms
6
Figure 4 illustrates several cells of unicelluar cyanobacterial culture Synechocystis aquatilis CALU 1336. Diverse physiological states are observed and indicated with arrows. Small fluorescent signal corresponds to healthy cells. Cells in frustrated physiological state (dying cells) have a high fluorescence and are indicated by green arrows. Dead cells have no fluorescence and can be observed only in transmission channel. They are indicated with white arrows.
Here, we have demonstrated only two examples of the differences between cyanobacterial and green-algae fluorescent response. Below some more cases will be considered concerning specific fluorescence techniques.
3. Fluorescence methods to study cyanobacteria
As it was mentioned previously, two main properties of cyanobacterial com-munities are of great interest during the investigation and control: physiological state (or viability) and biological diversity. And the fluorescence measurements contribute greatly to the study of these issues.
Historically, since the 1960s, researches had noted that changes in physiological state of cyanobacterial cell, occurring when it is grew old or is treated with different external actions, manifest themselves as corresponding changes in the intrinsic self-fluorescence spectrum [43]. Several studies have shown that changes in the pigment fluorescence are associated with the changes in the enzymatic activity of the cell and an increase in the permeability of the cell membrane, which can be used as an indica-tor of aging for cyanobacterial species [41, 44]. Today, there is no doubt that the in vivo analysis of fluorescence characteristics of photosynthetic apparatus is a powerful tool for studying the impact of a wide variety of environmental factors on cyanobac-teria [24, 45]. The changes in the steady-state and variable fluorescencereflect the in-time physiological state of cyanobacterial communities, exposed to different external factors [23]. The environmental changes cause the changes in bioenergetic processes occurring in cyanobacterial cells; they significantly affect the kinetics parameters and spectral features of the intrinsic fluorescence spectra. Since early 1980s, chlorophyll fluorescence kinetics has been widely used for investigation of viability of eukaryotic plants [28, 46]; however, the specific features of cyanobacteria only recently began taking into account. Therefore, in some earlier works, it was reported that the results of chlorophyll fluorescence measurements in cyanobacteria did not reflect the condi-tion of photosynthesis at all [29, 47–49].
The fluorescence spectra have been widely used to classify phytoplankton popu-lations since approximately early 1970s [50]. However, because of the generally low
Figure 4. CLSM micrographs of cyanobacterium Synechocystis aquatilis CALU 1336, visualized with CLSM. (a) Transmission image, (b) fluorescence false-green channel represents the response from phycobilins and Chl a at 650–680 nm, (c) represents an overlap of fluorescence and transmission channels. Scale bar = 7.5 μm.

7
Studying Cyanobacteria by Means of Fluorescence Methods: A ReviewDOI: http://dx.doi.org/10.5772/intechopen.93543
number of available excitation wavelengths in the conventional devices, the rate of species discrimination was relatively low. Researches can separate only algal groups that differ greatly in the structure of the photosynthetic apparatus (e.g., crypto-phytes, chlorophytes, and cyanobacteria) but cannot separate groups that are more similarly pigmented (e.g., among cyanobacterial species) [51, 52]. Discrimination between similarly pigmented taxa or even between species within a taxon requires high-resolution and multi-wavelength spectral analysis to reveal small peculiarities in configuration and functioning of photosynthetic system. The rigorous discrimi-nation is possible if the inter-species differences are greater than those within a species. For cyanobacteria, the spectral features of fluorescence, emitted by single cells in vivo, depends only on the structure and operational effectiveness of photo-synthetic apparatus; thus, they reflect the individual characteristic of cyanobacterial strain and can be used for confident differentiation up to strain level [42]. The pos-sible contribution of environmental adaptation effects to the resulting fluorescence spectra can be minimized by an accurate definition of the corresponding spectral regions of the excitation and emission wavelengths. Recent progress in CLSM methods allows to get spectroscopic data from single cells, instead of the whole population (like in conventional fluorescence spectroscopy); thus, the external interference has a minimal effect on the resultant spectrum.
Several fluorescent methods for in vitro and in situ investigations will be considered in this part, and the specific features of their use for studying cyano-bacteria will be outlined.
3.1 Fluorescence spectroscopy
Steady-state fluorescence spectroscopy can solve many routine problems of lim-nology and oceanology in a noninvasive manner. For example, the gravimetrically measured dry weight is an invasive method that is unsuitable for monitoring growth over time in the same sample; however, fluorescence methods can successfully replace it by applying calibration curves for in vivo chlorophyll a fluorescence of different cyanobacteria species [53]. This is the only one simple example of growth rate measurement. In more complicated cases, like monitoring of physiological state or biological diversity of cyanobacterial communities, fluorescence spectroscopy can become the only possible noninvasive method of investigation.
Opposite to the absorption spectra, the in vivo fluorescence spectra are much more informative. Moreover, it was shown in [54, 55] that the fluorescence assay would be a preferred alternative to absorbance in quantifying cyanobacterial growth because the fluorescence measures only viable cells and absorbance measures total cell biomass (including dead cells). Fluorescence spectroscopy is a highly sensitive, nearly instantaneous, noninvasive way to study various compo-nents and processes in situ and in vivo. Although the fluorescence spectra contain the information only about photosynthetic apparatus of different algal groups, they include the information about the chemical structure of light harvesting complex (LHC) and accessory pigment-proteins, as well as about the character of links between pigment-protein complexes and the efficiency of energy transfer in the light-harvesting process. When compared with absorption, fluorescence is affected by the excitation wavelength and energy. Thus, the use of different excita-tion wavelengths can provide more detailed information for the study of single-cell composition (Figure 5).
As it was mentioned previously, the specific features of fluorescence measure-ments of cyanobacterial communities, based on their initial fluorescence, lay mostly in the peculiarities of their photosynthetic apparatus, in particular, of the light-harvesting antennae. The distinct set of photopigments makes cyanobacteria

Fluorescence Methods for Investigation of Living Cells and Microorganisms
8
an ideal laboratory object for various biological investigations. Fast adaptation and understandable fluorescence response on the environmental changes allow using cyanobacteria as an indicator organism in ecological studies and as a laboratory object in biotechnological applications. However, the structure and functioning of their photosynthetic apparatus differ drastically from eukaryotic plants (Figure 5). Thus, the attention should be paid while applying fluorescence methods, elabo-rated for higher plants, to cyanobacteria and vice versa, during the application of the results of cyanobacterial studies to green algae. Let us mention several specific features that should be kept in mind while working with cyanobacteria.
The problem of registration and control of the physiological state of natural communities and the viability of cultures during incubation is a primary task in both ecological and biotechnological fields of application of cyanobacteria. In cyanobac-teria, the main pigments responsible for photosynthetic activity are phycobilins; therefore, the methods associated with the analysis of only chlorophyll fraction do not give satisfactory results in the study of cyanobacterial cultures [56–58]. Moreover, the analysis of the fraction of water-soluble phycobilins may give the ambiguous information, due to debris of disrupted cells in the culture medium. The former gives underestimated results, and the latter, overestimated results. Thus, the analysis of the viability of living cyanobacterial cells should be carried out considering a set of fluo-rescence spectra with different excitation wavelength, to elucidate the impact of each photosynthetic pigment [41, 44, 49]. The examples of one-excitation-wavelength studies are also present in the literature [59, 60]. However, the conclusions made on the basis of such investigations are questionable.
The investigation of phytoplankton communities and the identification of individual algae species, in the presence of different photosynthetic pigments, are completely impossible via one or two fluorescence spectra. Here, only a set of fluorescence spectra with different excitation wavelength can give a sufficient accuracy (see e.g., [42, 61]).
In the last years, so-called excitation-emission fluorescence matrices are often used in investigations of the effect of pollutants on natural algae communities [24], as well as in biological diversity studies [25, 62, 63]. Some researches even develop submersible devices to carry out such fluorescence study in situ [64].
3.2 Chlorophyll fluorescence kinetics
A vast amount of works are devoted to the investigation of chlorophyll fluores-cence induction (fast and slow kinetics) and chlorophyll fluorescence quenching
Figure 5. Absorption (a) and fluorescence excitation (action) spectra (b) for Synechocystis aquatilis CALU 1336 (blue line) and Chlorella ellipsoidea Gerneck CALU 3 (red line).

9
Studying Cyanobacteria by Means of Fluorescence Methods: A ReviewDOI: http://dx.doi.org/10.5772/intechopen.93543
analysis via saturation pulse method in green algae and higher plants, but only few of them concerns studies of cyanobacteria [28, 29, 47, 65–67]. Here, we will be interested in the peculiarities of using this technique for studying cyanobacteria. Therefore, we will not discuss here theoretical basics but only pointed out some important features of fluorescence kinetics in cyanobacterial photosynthetic apparatus.
In numerous reviews, the theoretical investigations of chlorophyll a (Chl a) fluorescence induction in different photosynthetic organisms are presented [26, 27, 65–69]. Basically, three classes of processes modulate Chl a fluorescence: photochemical quenching [q(P)], nonphotochemical quenching [q(N)], and fluorescence lowering or fluorescence increase due to state 1 to 2 and state 2 to 1 transitions, respectively. In addition at high actinic light excitation, Chl a fluores-cence can be subject to various photoinhibitory quenching processes q(I), which are much slower than the previous three.
Differences in the interpretation of cyanobacterial fluorescence induction start from the first step. First of all, the dark adaptation shifts plants and algae toward light state 1 (enlarged PS II antenna, high fluorescence state), whereas in cyanobacteria, dark adaptation shifts toward light state 2 (enlarged PS I antenna, low fluorescence state). This leads to discrepancy in interpretation of the JIP-test results like very small rise of OJIP fluorescence, compared to eukaryotic plants (see Figure 6) and very large rise of PSM fluorescence instead of decay for green algae and higher plants [26] Here and hereafter, the notation of main points in polyphasic chlorophyll a fluorescence curve (OJIP and PSMT) is taken from the main works of Strasser and Stamatakis [65, 66].
The first recorded signal in fluorescence induction (FI) experiment, F0, is considered usually as the maximally oxidized QA and as the maximal rate of primary charge separation in the RCIIs in dark-adapted green algae and higher plants. In cyanobacteria, the O level of fluorescence induction curve is higher (see Figure 6) because of C-phycocyanin and allophycocyanin fluorescence contributions at 710 nm and also because QA is partly reduced in the dark due to equilibration with the PQ pool, which is reduced in darkness by respiratory substrates. This happens because in cyanobacteria, the PQ pool is shared both by photosynthetic and respiratory electron transport (PSET and RSET), contrary to
Figure 6. Fast OJIP chlorophyll fluorscence kinetics for Microcystis firma CALU 398 (blue line) and Cucumis sativus L. (red line). Characteristics were recorded with PAM-2500, Walz GmbH, Effeltrich, Germany.

Fluorescence Methods for Investigation of Living Cells and Microorganisms
10
other photosynthetic organisms, where PSET and RSET functions are segregated in different organelles, plastoquinones are oxidized enzymically in darkness, and their fluorescence quenching effect is enhanced. Also, in cyanobacteria, Chl a is more abundant in PSI than in PSII compared to eukaryotic plants. Besides this, a dark-reduced PQ pool shifts cyanobacteria to state 2, in which the excitation which PBS donates to PSI is maximized, increasing the contribution of PSI to F0. In other words, in cyanobacteria, F0 contains a larger fraction of the redox-silent PSI fluorescence than it does in higher plants and algae. Finally, the OP rise is the integrated response of excited Chls a to redox signals and electrostatic fields that PSET generates within the thylakoid membrane.
Compared to the OP rise, the PSMT decay (in plans and rise in cyanobacteria) is far more complex (see e.g., Figure 2 in [47]). In cyanobacteria, lumen acidity-dependent q(N) works in a characteristically different way than in eukaryotic plants. While in the latter, q(N) dissipates primarily the excess Chl a excitation in PSII; in cyanobacteria, it dissipates primarily the excess Chl a excitation in PSI, which is obtained from PBS when the cyanobacterium is in state 2 (e.g., after dark adaptation). In other words, in cyanobacteria, q(N) quenching occurs as a sequel to the fluorescence lowering during the state 1 to 2 transition [70]. Moreover, in contrast to algae and higher plants, cyanobacteria have the maximum fluorescence signal in point M between O and T, instead of point P for other photosynthetic organisms. This is due to the fact that in cyanobacteria, the PQ pool is reduced by respiratory substrates during dark adaptation, as it is shared by both the PSET and the RSET chains [71, 72]. Thereby, an extensive, and often monotonous, P to T fluorescence decay in higher plants reflects a state 1 to 2 transition. And the opposite situation occurs in cyanobacteria, where the SMT transient is dominant in the total fluorescence induction pattern, with SM rise corresponding to a state 2 to 1 transition. Thus, it is obvious that the Fm parameter for cyanobacteria should be obtained at another point (M), than for higher plants (P). The SM rise in cyano-bacteria displays interesting phenomenology, which cannot always be explained adequately. In contrast to green algae, noncyclic and cyclic PSET inhibitors do not block the SM rise in cyanobacteria, although the fluorescence induction kinetic details are changed. When the MT fluorescence decay takes place, a cyanobacte-rium cell is at state 1 and most likely stays there during the MT decay because it is illuminated continuously. The MT decay in cyanobacteria is observed only under strong actinic illumination, raising the possibility of q(I) (as that part of a light-induced depression of Chl a fluorescence that is not reversed by dark adaptation) contributions to it.
Concerning fluorescence quenching analysis based on pulse amplitude modulation technique [73], it should be noted that this method can give detailed information of the main processes in photosynthetic system of cyanobacteria, but inherent simplicity of this method there is a risk of uncritical use which in certain cases may lead to questionable results and conclusions. In several reviews [28, 29, 67, 74, 75], a lot of peculiarities are pointed out, which distinguish cya-nobacteria from eukaryotic plants. They are difference in metabolic interactions (i.e., reduced PQ pool in dark-acclimated cyanobacterial cells due to respiratory electron transport), the problems arise from pigment composition (i.e., the impact of phycobilins fluorescence into the overall chlorophyll fluorescence and the dependence of the result on the wavelength of excitation light), the high rate of development of nonphotochemical quenching, the problem with the estima-tion of electron transport rate (ETR) (due to the difference in distribution of light energy between PSI and PSII in cyanobacteria), discrepancy in the behavior of q(N) (nonphotochemical quenching) and q(P) (the redox state of PQ pool) (because the regulation of state transition in cyanobacteria is due to not only
11
Studying Cyanobacteria by Means of Fluorescence Methods: A ReviewDOI: http://dx.doi.org/10.5772/intechopen.93543
redox control, but in some way to component in cytochrome b6/f complex), the role of the blue light intensity in nonphotochemical quenching (nonphotochemical OCP quenching), etc. Some of them were already described previously.
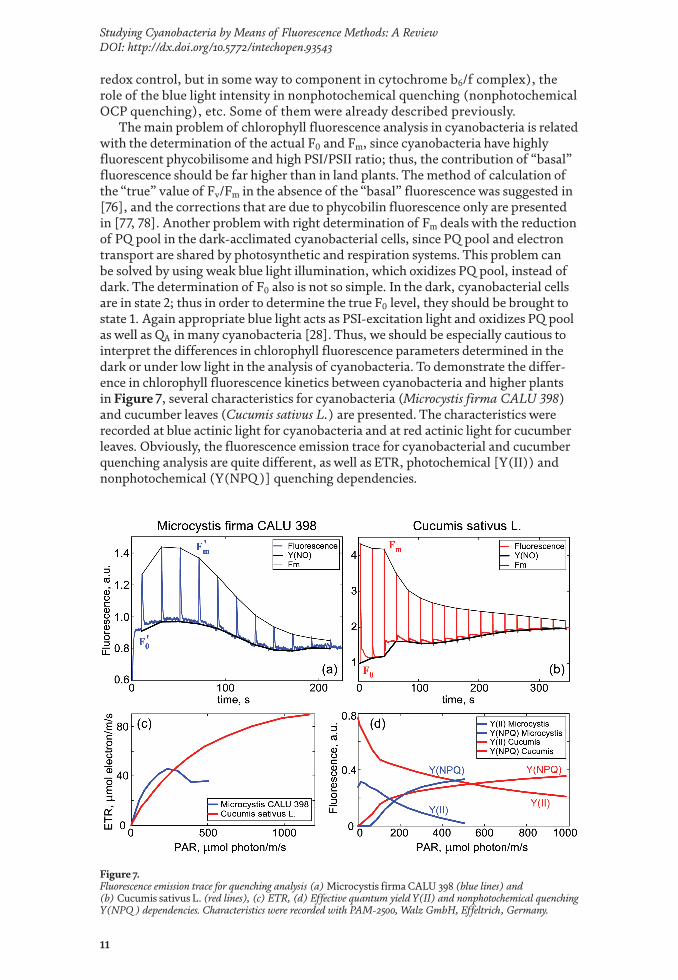
The main problem of chlorophyll fluorescence analysis in cyanobacteria is related with the determination of the actual F0 and Fm, since cyanobacteria have highly fluorescent phycobilisome and high PSI/PSII ratio; thus, the contribution of “basal” fluorescence should be far higher than in land plants. The method of calculation of the “true” value of Fv/Fm in the absence of the “basal” fluorescence was suggested in [76], and the corrections that are due to phycobilin fluorescence only are presented in [77, 78]. Another problem with right determination of Fm deals with the reduction of PQ pool in the dark-acclimated cyanobacterial cells, since PQ pool and electron transport are shared by photosynthetic and respiration systems. This problem can be solved by using weak blue light illumination, which oxidizes PQ pool, instead of dark. The determination of F0 also is not so simple. In the dark, cyanobacterial cells are in state 2; thus in order to determine the true F0 level, they should be brought to state 1. Again appropriate blue light acts as PSI-excitation light and oxidizes PQ pool as well as QA in many cyanobacteria [28]. Thus, we should be especially cautious to interpret the differences in chlorophyll fluorescence parameters determined in the dark or under low light in the analysis of cyanobacteria. To demonstrate the differ-ence in chlorophyll fluorescence kinetics between cyanobacteria and higher plants in Figure 7, several characteristics for cyanobacteria (Microcystis firma CALU 398) and cucumber leaves (Cucumis sativus L.) are presented. The characteristics were recorded at blue actinic light for cyanobacteria and at red actinic light for cucumber leaves. Obviously, the fluorescence emission trace for cyanobacterial and cucumber quenching analysis are quite different, as well as ETR, photochemical [Y(II)) and nonphotochemical (Y(NPQ )] quenching dependencies.
Figure 7. Fluorescence emission trace for quenching analysis (a) Microcystis firma CALU 398 (blue lines) and (b) Cucumis sativus L. (red lines), (c) ETR, (d) Effective quantum yield Y(II) and nonphotochemical quenching Y(NPQ ) dependencies. Characteristics were recorded with PAM-2500, Walz GmbH, Effeltrich, Germany.

Fluorescence Methods for Investigation of Living Cells and Microorganisms
12
The instrumental support of these two fluorescence methods, the fluorometers, that are currently in use for kinetic fluorescence studies, is based on different approaches to measure the variable Chl a fluorescence differing in the manner by which the photochemistry is saturated: shutterless and LED-based instruments for direct fluorometry, as plant efficiency analyzer (HandyPEA, M-PEA, PocketPEA; Hansatech Instruments, Kings Lynn Norfolk, UK) [79], pulse amplitude modula-tion, PAM fluorometry (Phyto-PAM Phytoplankton Analyzer; PAM-2000, Walz GmbH, Germany) [80], the pump and probe fluorometry [81], the fast repetition rate fluorometry [82], the pump during probe fluorometry [83], and several others that are functionally similar, such as the fluorescence induction and relaxation technique [84], the background irradiance gradient single turnover fluorometry [85], and advanced laser fluorometry [86]. In the last years, a lot of new modifications of these instru-ments appeared, including multicolor PAM (MULTI-COLOR-PAM and PHYTO-PAM Phytoplankton Analyzer, Waltz GmbH, Effeltrich, Germany) [87–89] and imaging PAM (IMAGING-PAM M-Series, Waltz GmbH, Effeltrich, Germany) [73]. Recently developed multi-color-PAM (Waltz GmbH, Effeltrich, Germany) [87] provides six different colors of measure light and six different colors of actinic light, all of which qualify for highly accurate measurements of fast induction kinetics and assessment of wavelength-dependent Fv/Fm and functional absorption cross-section of PSII.
3.3 Delayed fluorescence analysis
Delayed fluorescence (DF) occurs in photosynthetically active cells and is emitted between 450 and 750 nm with decay times from milliseconds to minutes [30, 31, 52, 90]. DF excitation spectroscopy is a real-time, nondestructive method for rapid estimation of the photosynthetically active pigments—chlorophylls, accessory pigments and phycobiliproteins. It can be used to determine chlorophyll concentration and phytoplankton composition [91–95], as well as to study the changes in electron transport [96], different stress states [97–100], the response to the diurnal light cycle [101], etc. The DF measurement distinguishes between cyanobacteria, cryptophyta, green algae, and chromophyte algae because they have different chlorophylls, accessory pigments, and phycobiliproteins. DF has some specific features in cyanobacteria, due to their specific structural arrangement of the photosynthetic membranes. In particular, in contrast to other algae, some parameters of delayed fluorescence from cyanobacteria show specific changes within the temperature range at which membrane lipids undergo thermophilic phase transitions [102].
The origin of DF is as follows. The accessory pigments, absorbing photons, provide charge separation at the reaction centers of PSII and PSII after the exci-tonic energy transfer in light-harvesting complex. Then electrons are transported through the electron transport chain to the Calvin cycle. Stopping the illumination initiates processes of the reverse light phase, that is, electrons in the electron trans-port chain flow back to the oxidized reaction center P680+, leading to an excited state P680*. This excited state P680* decays to the ground state emitting a delayed fluorescence in 580–720 nm wavelength range. DF can be observed during several minutes until a charge equilibrium between donor side (water splitting complex) and acceptor side (plastoquinone, PSI) is reached by recombination. The resulting decay curve includes the fast decay, produced by recombination of electrons and holes, which are located near P680+, and the long-lasting decay, caused by electron-hole pairs, which are located at greater distances from P680+ (e.g., electrons near PSI together with holes at the Mnn+ complex) [96]. Thus, the cellular components, which absorb light, but do not lead to charge separation (like dead cells, or photo-protective pigments—carotenoids), are not detected by DF spectroscopy.

13
Studying Cyanobacteria by Means of Fluorescence Methods: A ReviewDOI: http://dx.doi.org/10.5772/intechopen.93543
The peculiarities of DF spectroscopy for cyanobacteria are associated with the difference from plants in cellular metabolism, and structure and functioning of their photosynthetic apparatus, which are pointed out in the previous section. The differences in kinetics and spectral characteristics of DF can be easily traced from higher plants taking into account the relation between photosynthetic and respira-tory systems in sharing of electron transport chain and the presence of external light-harvesting complex (phycobilisome). The former influences the DF kinetics, and the latter, DF spectral features. For example, the temporal DF dependence (DF decay curve) shows the transient peak with variable, species-specific heights and timing, in contrast to green algae, which have no any peak (see, e.g., Figure 2 in [100]). The height and timing of this peak is affected differently by different toxicants [100]. Thus, DF can be used as a rapid, reliable, and sensitive phytoplank-ton toxicity test. In the laboratory experiments, the comparison of four measuring techniques (delayed fluorescence, prompt fluorescence, photometric absorbance, and microscopic cell count) to assess growth inhibition freshwater algae and cyano-bacteria shows very high sensitivity of delayed fluorescence excitation spectroscopy [90]. DF as a parameter is used to investigate the phytoplankton community in lakes [95], its seasonal aspect, and vertical distribution [95, 103], as well as continu-ous biomonitoring of surface waters [94]. Delayed fluorescence excitation spectra, obtained by measuring the intensity of delayed fluorescence at different excitation wavelengths and reflecting the photosynthetic pigment composition, is used to determine chlorophyll concentration and phytoplankton composition [30, 94, 95].
Finally, it should be noted that the delayed fluorescence is the only method that can diverse live and dead cells during on-line monitoring. Its major advantage is that it is emitted only from cells that are photosynthetically active, that is, alive; thus, the additional signals from dead cell debris do not interfere with the measurements. Long-term DF emission also prevents interference problems with fluorescent backgrounds in natural samples [94]. Furthermore, DF can measure nano- and pico-plankton, which may be lost during filtration or may be unaccounted in direct microscopic analysis.
Since 1995, DF excitation spectroscopy has been used in addition to microscopic biovolume estimation to monitor the phytoplankton composition in Germany [104]. Within an EC project “Phytoplankton On-Line,” started in 2000, an on-line version of the DF excitation spectrometer has been developed to monitor continu-ously the composition of phytoplankton species in Lake Erken, Sweden, Lake Balaton, Hungary and Lake Kinneret, Israel.
3.4 Flow cytometry
Flow cytometry (FCM) is a rapid technique for the quantitative measurement of the properties of individual cells [105, 106]. It is a method for conducting a multi-parameter analysis of cells suspended in liquid and passing through a laser beam. In FCM, the excitation and emission properties of individual cells at one or more wavelength are measured together with the light scatter parameters, such as perpendicular light scatter, forward light scatter, and time of flight. Usually in order to detect any fluorescence, suspended cells require staining with organic dyes. In cyanobacteria, self-fluorescence of photopigments (chlorophylls and phy-cobilins) not only allows cells to be counted in a rapid manner but also enables a wide range of potential applications in ecological and biochemical studies, such as definition of biomass, distribution, and dynamics of phytoplankton [33, 107–109], discrimination and identification of algae species [110–112], and the investigation of the responses to contaminants [113–116]. It should be noted that the presence of these photopigments limits the possibility to stain cells with synthetic dyes

Fluorescence Methods for Investigation of Living Cells and Microorganisms
14
as their excitation and emission spectra can greatly overlap. Thus, the attention should be paid while choosing appropriate fluorescent dyes with respect to the particular microorganism and the available lasers with which the FCM instrument is equipped [117].
For example, recently, an FCM protocol for quantitative and rapid analysis of Microcystis cells and colonies in lake sediment was developed [118]. Because of its many advantages, including rapidity, sensitivity, multiparametric analysis, and cell sorting capacity, FCM has been increasingly applied to environmental studies with aquatic microorganisms.
Various FCM instruments are also coupled with cell sorters [106, 119]. In this case, individual cells can be diverted from the fluid stream based on their properties such as cell morphology, taxonomic position, surface and intracellular protein expression, gene expression, and cellular physiology and collected into homogenous fractions for further analyses [120]. In spite of different cell viability after such a process (especially for fragile species), FCM featuring a sorting device has been successfully applied to isolate different phytoplankton taxa from mixed cultures at a success rate of 80% [121].
Initially, most of the commercially available flow cytometers cannot be directly applied to the study of aquatic biota, due to the large size range and low densities of the field samples. However, in 1989, the so-called Optical Plankton Analyzer has been designed by a group of American researchers [122]. Later, several companies in the United Kingdom and United States began to produce new modifications of flow cytometers for limnological and oceanographical applications [123]. Currently, the major producers in this field include Beckman Coulter, Becton-Dickinson, Thermo Fisher Scientific, and DakoCytomation provide a number of devices equipped with several lasers with different emitted wavelengths that allow studying cells stream flowing at a speed of over 100,000 cells per second. One of the advantages of FCM is the possibility of rapid and automated measurement of very small volume of the tested samples (1 cm3 1 × 10⁶ cells).
The particularity of studying cyanobacteria via FCM lays in the right choice of excitation and emission wavelengths for recording fluorescent signal, as it was described in previous sections. Measurement of chlorophyll and phycobilin fluores-cence via FCM can provide the information on changes in the efficiency of photo-synthetic apparatus, and indirectly, it can impart information on the cell’s condition and growth state. It can be used to test the impact of different factors on cyanobac-teria development, that is pH, toxic metals, herbicides, and other pollutants, under controlled laboratory conditions [114, 115, 124]. In addition to chlorophyll fluores-cence, the fluorescence emission of phycocyanin pigment-protein complexes that participate in transferring signals also can be used in environmental stress studies of cyanobacteria, similar to those based on chlorophyll a measurement. Thus, cyanobacteria are well suited to flow cytometric analysis.
Considering that FCM equipped with a dual laser is able to measure chlorophyll a and phycocyanin, this method could also be of value in ecological studies of cyanobacteria. Once coupled with cell sorting, FCM can be successfully applied to isolate cyanobacteria from mixed phytoplankton samples. The recent emergence of advanced microfluidics, the availability of sophisticated digital image processing techniques, the advent of various optical imaging modalities, and image-guided cell sorting extend the capabilities of FCM from the measurements of one-dimensional signal intensities to multidimensional information-rich images, which can be used to analyze the spatial architecture of single cells in flow in addition to the analysis of the volume samples [125]. However, the presence of autofluorescence in cyanobac-terial cells limits the use of staining cells with synthetic fluorochromes due to signal overlap. Moreover, the colonial forms and filamentous cyanobacteria (especially in

15
Studying Cyanobacteria by Means of Fluorescence Methods: A ReviewDOI: http://dx.doi.org/10.5772/intechopen.93543
freshwater species) are still rather difficult to study using FCM due to their different colony size and trichome lengths. In this case, the light scattering does not allow individual cells to be distinguished.
3.5 Confocal microscopic spectroscopy
Self-fluorescence of the photosynthetic apparatus of cyanobacteria originates from excited states of light-harvesting complex and PSII/PSI that were lost before photochemistry took place. It usually represents a small fraction of the excited state decay in photosynthetic complex of healthy cells. Nevertheless, this small fraction can be easily detected by confocal laser scanning microscopy (CLSM) [126, 127]. With CLSM, a very small excitation and detection areas can be investigated, so that single cells under nondamage conditions can be studied in vivo. In addition to above-mentioned techniques that now can be carried out on the single-cell level, CLSM provides some additional facilities. The investigation of self-fluorescence of single living cells reveals the relation between the physiological state and the operational activity of photosynthetic system. The investigation of self-fluorescence gives the information about single-cell processes as well as about the collaboration in cell communities. The changes in spectral characteristics of living photosynthetic cells indicate changes in their physiological state and can be applied for the studies of the results of stress states and external actions. Light-, heat-, ultrasound-, and toxin-induced changes can be distinguished by means of confocal microscopic spectroscopy since all these external actions are stress factors affecting photosyn-thetic process [44].
Modern CLSMs are unique tools for visualizing cellular structures and analyzing dynamic processes inside single cells. They exceed classical light microscopes in their axial resolution, which enables to acquire optical sections (slices) of a specimen. Thus, the object can be imaged in three dimensions and subsequently visualized as a 3D computer model. CLSM is designed for the quantification and analysis of image-coded information. Among other things, they allow easy determination of fluorescence intensities, distances, areas, and their changes over time. They are capable of quickly detecting and quantitatively unmixing the spectral signatures of fluorescent objects. Many useful parameters as the degree of colocalization of labeled structures or the ion concentration in a specimen can be analyzed [128]. The most interesting feature of CLSM is the capability for single-cell microscopic spectroscopy, which allows obtaining spectroscopic information inside small regions and single cells [35]. Another group of facilities deals with the quantitative analysis of dynamic processes in living cells using techniques such as fluorescence recovery after photobleaching (FRAP) [129, 130], fluorescence resonance energy transfer (FRET), fluorescence lifetime imaging microscopy (FLIM) [131], photo-activation, and photoconversion. Recently, a lot of additional techniques appear in modern CLSMs, which open new perspectives for single-cell investigation, such as white laser, which provides the ability to obtain not only fluorescence emission spectra, but also single-cell excitation and absorption spectra [132]; hyperspectral CLSM that allows more precise fluorescence spectra through the cell thickness and gives more detailed fluorescent pigments location [34, 133]; and STED and multiphotonic techniques, which extend the CLSM abilities to single-molecular studies [134, 135].
However, while working with living cells, the caution must be taken. The studies of the photosynthetic cells require some additional specific skills and techniques to perform measurements and to carry out data processing [35, 41, 42, 44]. The efficiency of photosynthesis and photosynthetic rate are highly dependent on irradiance. This can be seen in the light dependency of various photosynthetic

Fluorescence Methods for Investigation of Living Cells and Microorganisms
16
parameters. Moreover, not only light quantity, but also light “quality” (wavelength) is an important factor [38]. Thus, special spectroscopic methods are required to study the physiology of phototrophic microorganisms [136]. These organ-isms employ light-dependent photosynthesis as the main energy source for their metabolism, and the detected self-fluorescence finally reflects the diversity in morphological and physiological states of their photosynthetic cells.
The main problem of in vivo investigations is to protect the object under con-sideration from light and heat damage. Since in CLSM the laser light density in the focus point is high, the dwell time and the intervals between the illuminations may influence photodamage and saturation of photosynthesis. It is well known that most chromophores and natural pigments bleach under the high laser excitation energies; thus, a bleach test should be performed [35]. It was shown experimentally that especially phycoerythrin and phycocyanin, as accessory pigments, were very sensitive to photobleaching, while the fluorescence of chlorophyll a and allophyco-cyanin remained stable in the intact cells [137]. Thus, during fluorescence detection of the main accessory pigments of cyanobacteria, the changes in their fluorescence intensity should be controlled during the recording period. The power of individual laser lines should be chosen according to the photodamage they cause. In some experiments, the repeated spectra were obtained under selected excitation power, and in this case, the excitation power would affect the cells (see Figure 3). In each case, the optimal zoom and excitation energy parameters should be selected, so the fluorescence spectra did not vary within the experimental error. When excitation energy is increased, both the intensity and shape of fluorescence spectra can change because of photodamage or structure breakdown in photosynthetic systems.
In the experiments, where several laser lines were involved in the investiga-tion (see Figure 2), it is useful to record the first spectrum again at the end of each series to control the initial state of the cell. Moreover, the cell fluorescence intensities depend on the sensitivity setting of the photomultiplier, distance from the sample, and the excitation energy (which varies for different laser lines of CLSM); thus, the only qualitative analysis of spectral characteristics is acceptable in multispectra regime.
CLSM gives the opportunity to truly understand the cellular function; thus, we need to extend our imaging capabilities in ways that enable us to follow sequential events in real time, monitor the kinetics of dynamic processes, and record sensitive or transient events. Fluorescence spectra of cyanobacterial photosynthetic pig-ments are easily recorded by spectral CLSM. The fluorescence shares of individual phycobiliproteins can be reliably determined by spectral unmixing, showing that the spectral resolution of CLSM is well suited for this approach. In addition, CLSM technique allows the investigation not only cultivable but also the noncultivable cyanobacterial species.
3.6 Remote sensing
Methods of fluorescence spectroscopy suit very well for large-scale monitoring and remote sensing. They can be used in ecological studies, water quality control and on-line monitoring of cyanobacterial occurrence, distribution, and spatial and temporal dynamics in the environment [138–140]. Obviously, the presence of cyano-bacteria and their photopigments influence reflectance, which is the ratio of radia-tion leaving the water (reflected) to the total amount of radiation incident on the water, is detected by remote sensing devices. Reflectance can be viewed by remote sensors called spectroradiometers, which can be either multispectral (sampling the electromagnetic spectrum over a relatively wide range of wavelengths in each discrete band) or hyperspectral (collecting and processing information from many

17
Studying Cyanobacteria by Means of Fluorescence Methods: A ReviewDOI: http://dx.doi.org/10.5772/intechopen.93543
narrow contiguous wavelength intervals across the electromagnetic spectrum). Remote sensing of chlorophyll a using its absorbance in the blue and red electromag-netic wavelengths has been successfully applied in the monitoring of phytoplankton blooms, and many single-band or band-ratio-type algorithms have been developed for chlorophyll a concentration retrieval from both multispectral and hyperspectral data obtained from ground-based, airborne, or satellite sensors [36]. However, the selective determination of cyanobacteria in the presence of other photoautotrophs requires the use of targeted algorithms (baseline, band-ratio, and semi-analytical nested band-ratio) for retrieval of phycocyanin concentration. Two spectral char-acteristics should be taken into account: a pronounced absorption peaks near 570 and 630 nm and two fluorescent peaks near 580 and 660 nm. Unfortunately, only in some instances, retrieval of phycocyanin concentrations at high cyanobacterial densities is possible from multispectral data, for example, provided by the MERIS satellite imaging spectrometer [141–143]. More sensitive hyperspectral remote sens-ing of phycocyanin is applied in cyanobacterial bloom monitoring using shipboard [144, 145] or airborne sensors [146, 147] and is eventually possible with the satellite Hyperion Hyperspectral Imager, which is capable of acquiring hyperspectral data [36, 148]. The methods are being continuously improved in their sensitivity, selec-tivity, resolution, robustness, and applicability, including new instrument designs or derivation of new algorithms for pigment concentration derivation [146, 149–153].
The most interesting instrument, providing active remote sensing of phy-toplankton and dissolved organic matter (DOM) fluorescence, is a laser remote sensing spectrometer (LIDAR) used in shipborne laboratories [154–159]. A LIDAR fluorosensor for marine and freshwater applications is remotely excite and detect laser-induced fluorescence emissions by chromophore groups belonging to different species present in the water body. Four out of 12 available spectral channels, cor-responding to water Raman backscattering (402 nm), DOM (450 nm), and phyto-plankton pigments (phycocyanin, 650 nm; chlorophyll, 690 nm), were selected in wavelength by placing suitable interference filters. The water Raman peak is used to measure the water turbidity. This allows comparing different seawaters. Some laser transmitters of the LIDAR are also capable of operating in the dual pulse mode, to remotely measure the Chl a fluorescence yield according to the pump-and-probe excitation scheme [154].
Thus, the question of the applicability of the remote sensing to monitor the spatial distribution of cyanobacteria can be now answered affirmatively. Recent progress in spatial and spectral resolution of remote sensing allows distinction of cyanobacteria and various groups of algae on the basis of their photosynthetic pigments at a detailed spatial scale. In particular, quantification of cyanobacterial biomass and the recognition of cyanobacterial surface blooms by means of optical detection become true, and these advances allow field studies at the population level [160].
4. Conclusion
In the last years, fluorescence methods became a strong alternative to traditional methods of environmental research of cyanobacteria. They allow selective and sensitive quantification of cyanobacteria to be done quickly and easily in a nonde-structive manner in situ with real-time data acquisition using fixed, portable, or remote-sensing devices, giving a unique opportunity for automated and continual monitoring of cyanobacterial communities by handheld instruments, shipboard sensors, or airborne and satellite platforms. Data obtained by fluorescence methods can valuably contribute to our understanding of the environmental distribution and

Fluorescence Methods for Investigation of Living Cells and Microorganisms
18
Author details
Natalia Yu. GrigoryevaSt. Petersburg Federal Research Center of Russian Academy of Science, Scientific-Research Centre for Ecological Safety, Saint-Petersburg, Russia
*Address all correspondence to: [email protected]
dynamics of cyanobacteria, bloom formation, and cyanotoxin production and to water toxicity risk assessment. Large-scale remote sensing can give the information about the development of cyanobacterial blooms in oceans and freshwater bodies. On the other hand, the laboratory results of the single-cell spectroscopic investiga-tions can give new information to improve remote sensing control. Airborne and satellite data should be also accompanied with shipboard (based phycocyanin fluorescence monitoring) and laboratory studies to provide deep insight to the cyanobacteria nature.
Conflict of interest
The authors declare no conflict of interest.
© 2020 The Author(s). Licensee IntechOpen. Distributed under the terms of the Creative Commons Attribution - NonCommercial 4.0 License (https://creativecommons.org/licenses/by-nc/4.0/), which permits use, distribution and reproduction for non-commercial purposes, provided the original is properly cited.

19
Studying Cyanobacteria by Means of Fluorescence Methods: A ReviewDOI: http://dx.doi.org/10.5772/intechopen.93543
[1] Abed RM, Dobretsov S, Sudesh K. Applications of cyanobacteria in biotechnology. Journal of Applied Microbiology. 2009;106(1):1-12. DOI: 10.1111/j.1365-2672.2008.03918.x
[2] Vijayakumar S, Menakha M. Pharmaceutical applications of cyanobacteria—A review. Journal of Acute Medicine. 2015;1(5):15-23. DOI: 10.1016/j.jacme.2015.02.004
[3] Singh S, Kate BN, Banerjee UC. Bioactive compounds from cyanobacteria and microalgae: An overview. Critical Reviews in Biotechnology. 2005;25(3):73-95. DOI: 10.1080/07388550500248498
[4] Thajuddin N, Subramanian G. Cyanobacterial biodiversity and potential applications in biotechnology. Current Science. 2005;89(1):47-57
[5] Richmond A, editor. Handbook of Microalgal Culture: Biotechnology and Applied Phycology. Carlton: Blackwell Science Ltd.; 2004. p. 576. DOI: 10.1002/9780470995280
[6] Lei Y, Chen W, Mulchandani A. Microbial biosensors. Analytica Chimica Acta. 2006;568(1-2):200-210. DOI: 10.1016/j.aca.2005.11.065
[7] Reshetilov AN. Biosensor development in Russia. Biotechnology Journal: Healthcare Nutrition Technology. 2007;2(7):849-862. DOI: 10.1002/biot.200700021
[8] Ignatov SG, Ferguson JA, Walt DR. A fiber-optic lactate sensor based on bacterial cytoplasmic membranes. Biosensors & Bioelectronics. 2001;16(1-2):109-113. DOI: 10.1016/S0956-5663(00)00144-5
[9] Giardi MT, Rea G, Berra B, editors. Bio-farms for nutraceuticals: Functional food and safety control by biosensors.
In: Advances in Experimental Medicine and Biology. Vol. 698. New York, USA: Springer Science & Business Media; 2011. p. 360. DOI: 10.1007/978-1-4419-7347-4
[10] Whitton BA, editor. Ecology of Cyanobacteria II: Their Diversity in Space and Time. Durham, UK: Springer Science & Business Media; 2012. p. 760. DOI: 10.1007/978-94-007-3855-3
[11] Gault PM, Marler HJ, editors. Handbook on Cyanobacteria: Biochemistry, Biotechnology and Applications. (Bacteriology Research Developments Series). New York: Nova Science Publishers; 2009. p. 538. ISBN: 978-1-60741-092-8
[12] Huisman J, Matthijs HC, Visser PM, editors. Harmful Cyanobacteria. Aquatic Ecology Series. Vol. 3. Dordrecht: Springer; 2005. p. 243. DOI: 10.1007/1-4020-3022-3
[13] Granéli E, Turner JT, editors. Ecology of Harmful Algae. Berlin: Springer Science & Business Media; 2006. p. 406. DOI: 10.1007/978-3-540-32210-8
[14] Seckbach J, editor. Algae and Cyanobacteria in Extreme Environments. Israel: Springer Science & Business Media; 2007. p. 786. DOI: 10.1007/978-1-4020-6112-7
[15] Bryant DA, editor. The Molecular Biology of Cyanobacteria (Advances in Photosynthesis 1). Dordrecht: Kluwer Academic Press; 1994. p. 881. DOI: 10.1007/978-94-011-0227-8
[16] Radix P, Léonard M, Papantoniou C, Roman G, Saouter E, Gallotti-Schmitt S, et al. Comparison of four chronic toxicity tests using algae, bacteria, and invertebrates assessed with sixteen chemicals. Ecotoxicology and Environmental Safety. 2000;47(2): 186-194. DOI: 10.1006/eesa.2000.1966
References
Fluorescence Methods for Investigation of Living Cells and Microorganisms
20
[17] Juneau P, Dewez D, Matsui S, Kim SG, Popovic R. Evaluation of different algal species sensitivity to mercury and metolachlor by PAM-fluorometry. Chemosphere. 2001;45(4-5):589-598. DOI: 10.1016/S0045-6535(01)00034-0
[18] Solé A, Gaju N, Méndez-Álvarez S, Esteve I. Confocal laser scanning microscopy as a tool to determine cyanobacteria biomass in microbial mats. Journal of Microscopy. 2001;204(3):258-262. DOI: 10.1046/j.1365-2818.2001.00951.x
[19] Khishamuddin NA, Shing WL, Kin CM, Niu VB. Fluorometric response of photosynthetic microorganism consortium as potential bioindicator for heavy metals detection in water. EnvironmentAsia. 2018;11(1):80-86. DOI: 10.14456/ea.2018.6
[20] Teo SC, Wong LS. Whole cell-based biosensors for environmental heavy metals detection. Annual Research & Review in Biology. 2014:2663-2674. DOI: 10.9734/ARRB/2014/9472
[21] Wong LS, Lee YH, Surif S. Performance of a cyanobacteria whole cell-based fluorescence biosensor for heavy metal and pesticide detection. Sensors. 2013;13(5):6394-6404. DOI: 10.3390/s130506394
[22] Los DA, Zorina A, Sinetova M, Kryazhov S, Mironov K, Zinchenko VV. Stress sensors and signal transducers in cyanobacteria. Sensors. 2010;10(3):2386-2415. DOI: 10.3390/s100302386
[23] Mironov KS, Sinetova MA, Shumskaya M, Los DA. Universal molecular triggers of stress responses in Cyanobacterium synechocystis. Lifestyles. 2019;9(3):67. DOI: 10.3390/life9030067
[24] Zung JB, Woodlee RL, Fuh MR, Warner IM. Preliminary investigation of the effect of select pollutants
on marine phytoplankton using multidimensional fluorescence measurements. International Journal of Environmental Analytical Chemistry. 1990;41(3-4):149-158. DOI: 10.1080/03067319008027357
[25] Simis SG, Huot Y, Babin M, Seppälä J, Metsamaa L. Optimization of variable fluorescence measurements of phytoplankton communities with cyanobacteria. Photosynthesis Research. 2012;112(1):13-30. DOI: 10.1007/s11120-012-9729-6
[26] Stirbet A. On the relation between the Kautsky effect (chlorophyll a fluorescence induction) and photosystem II: Basics and applications of the OJIP fluorescence transient. Journal of Photochemistry and Photobiology, B: Biology. 2011;104(1-2):236-257. DOI: 10.1016/j.jphotobiol.2010.12.010
[27] Goltsev VN, Kalaji HM, Paunov M, Bąba W, Horaczek T, Mojski J, et al. Variable chlorophyll fluorescence and its use for assessing physiological condition of plant photosynthetic apparatus. Russian Journal of Plant Physiology. 2016;63(6):869-893. DOI: 10.1134/S1021443716050058
[28] Schreiber U, Endo T, Mi H, Asada K. Quenching analysis of chlorophyll fluorescence by the saturation pulse method: Particular aspects relating to the study of eukaryotic algae and cyanobacteria. Plant & Cell Physiology. 1995;36(5):873-882. DOI: 10.1093/oxfordjournals.pcp.a078833
[29] Ogawa T, Misumi M, Sonoike K. Estimation of photosynthesis in cyanobacteria by pulse-amplitude modulation chlorophyll fluorescence: Problems and solutions. Photosynthesis Research. 2017;133(1-3):63-73. DOI: 10.1007/s11120-017-0367-x
[30] Berden-Zrimec M, Drinovec L, Zrimec A. Delayed fluorescence. In:

21
Studying Cyanobacteria by Means of Fluorescence Methods: A ReviewDOI: http://dx.doi.org/10.5772/intechopen.93543
Suggett D, Prášil O, Borowitzka M, editors. Chlorophyll a Fluorescence in Aquatic Sciences: Methods and Applications. Dordrecht: Springer; 2010. pp. 293-309. DOI: 10.1007/978-90-481-9268-7_14
[31] Goltsev V, Zaharieva I, Chernev P, Strasser RJ. Delayed fluorescence in photosynthesis. Photosynthesis Research. 2009;101(2-3):217-232. DOI: 10.1007/s11120-009-9451-1
[32] Ormerod MG, Imrie PR. Flow cytometry. Methods in Molecular Biology. 1990;5:543-558. DOI: 10.1385/0-89603-150-0:543
[33] Jonker RR, Meulemans JT, Dubelaar GB, Wilkins MF, Ringelberg J. Flow cytometry: A powerful tool in analysis of biomass distributions in phytoplankton. Water Science and Technology. 1995;32(4):177-182. DOI: 10.1016/0273-1223(95)00696-6
[34] Vermaas WF, Timlin JA, Jones HD, Sinclair MB, Nieman LT, Hamad SW, et al. In vivo hyperspectral confocal fluorescence imaging to determine pigment localization and distribution in cyanobacterial cells. Proceedings of the National Academy of Sciences. 2008;105(10):4050-4055. DOI: 10.1073/pnas.0708090105
[35] Grigoryeva N, Chistyakova L. Confocal laser scanning microscopy for spectroscopic studies of living photosynthetic cells. In: Zeng L-W, Cao S-L, editors. Color Detection. UK: IntechOpen; 2020. pp. 39-64. DOI: 10.5772/intechopen.84825
[36] Kutser T. Passive optical remote sensing of cyanobacteria and other intense phytoplankton blooms in coastal and inland waters. International Journal of Remote Sensing. 2009;30(17):4401-4425. DOI: 10.1080/01431160802562305
[37] Churnside JH, Shaw JA. Lidar remote sensing of the aquatic
environment. Applied Optics. 2020;59(10):C92-C99. DOI: 10.1364/AO.59.000C92
[38] Papageorgiou GC. Fluorescence emission from the photosynthetic apparatus. In: Eaton-Rye J, Tripathy B, Sharkey T, editors. Photosynthesis. Advances in Photosynthesis and Respiration. Vol. 34. Dordrecht: Springer; 2012. pp. 415-443. DOI: 10.1007/978-94-007-1579-0_18
[39] Green BR, Parson WW, editors. Light-Harvesting Antennas in Photosynthesis. Advances in Photosynthesis and Respiration, Vol. 13. Dordrecht: Springer Netherlands Kluwer Academic Publishers; 2003. p. 514. DOI: 10.1007/978-94-017-2087-8
[40] Blankenship RE. Molecular Mechanisms of Photosynthesis. 2nd ed. Chichester, UK: John Wiley & Sons; 2014. p. 314. DOI: 10.1002/9780470758472
[41] Grigoryeva N, Chistyakova L. Fluorescence microscopic spectroscopy for investigation and monitoring of biological diversity and physiological state of cyanobacterial cultures. In: Tiwari A, editor. Cyanobacteria. Rijeka: IntechOpen; 2018. pp. 11-44. DOI: 10.5772/intechopen.78044
[42] Grigoryeva N. Self-fluorescence of photosynthetic system—A powerful tool for investigation of microalgal biological diversity. In: Vítová M, editor. Microalgae—From Physiology to Application. Rijeka: IntechOpen; 2019. pp. 3-26. DOI: 10.5772/intechopen.88785
[43] Sirenko LA, Sakevich AI, Osipovich LF. Methods for Physiological and Biochemical Researching Algae in Hydrobiological Practice. Kiev: Naukova Dumka; 1975. [in Russian]
[44] Grigoryeva NY, Chistyakova LV, Liss AA. Spectroscopic techniques for

Fluorescence Methods for Investigation of Living Cells and Microorganisms
22
estimation of physiological state of blue-green algae after weak external action. Oceanology. 2018;58(6):896-904. DOI: 10.1134/S0001437018060061
[45] Mineeva NM, xKorneva LG, Solovyova VV. Influence of environemntal factors on phytoplankton photosynthetic activity in the Volga River reservoirs. Inland Water biology. 2016;9(3):258-267. DOI: 10.1134/S1995082916030160
[46] Krause GH, Weis E. Chlorophyll fluorescence as a tool in plant physiology. Photosynthesis Research. 1984;5(2):139-157. DOI: 10.1007/BF00028527
[47] Papageorgiou GC, Tsimilli- Michael M, Stamatakis K. The fast and slow kinetics of chlorophyll a fluorescence induction in plants, algae and cyanobacteria: A viewpoint. Photosynthesis Research. 2007;94(2-3):275-290. DOI: 10.1007/s11120-007-9193-x
[48] Schuurmans RM, van Alphen P, Schuurmans JM, Matthijs HC, Hellingwerf KJ. Comparison of the photosynthetic yield of cyanobacteria and green algae: Different methods give different answers. PLoS One. 2015;10(9):e0139061. DOI: 10.1371/journal.pone.0139061
[49] Remelli W, Santabarbara S. Excitation and emission wavelength dependence of fluorescence spectra in whole cells of the cyanobacterium Synechocystis sp. PPC6803: Influence on the estimation of photosystem II maximal quantum efficiency. Biochimica et Biophysica Acta (BBA)-Bioenergetics. 2018;1859(11):1207-1222. DOI: 10.1016/j.bbabio.2018.09.366
[50] Yentsch CS, Yentsch CM. Fluorescence spectral signatures: The characterization of phytoplankton populations by the use of excitation and emission spectra. Journal of Marine Research. 1979;37(3):471-483
[51] Richardson TL, Lawrenz E, Pinckney JL, Guajardo RC, Walker EA, Paerl HW, et al. Spectral fluorometric characterization of phytoplankton community composition using the algae online analyser. Water Research. 2010;44(8):2461-2472. DOI: 10.1016/j.watres.2010.01.012
[52] Suggett DJ, Borowitzka MA, Prášil O. Editors. Chlorophyll a Fluorescence in Aquatic Sciences: Methods and Applications (Developments in Applied Phycology 4). Dordrecht, The Netherlands: Springer; 2010. p. 326. DOI: 10.1007/978-90-481-9268-7
[53] Karsten U, Klimant I, Holst G. A new in vivo fluorimetric technique to measure growth of adhering phototrophic microorganisms. Applied and Environmental Microbiology. 1996;62(1):237-243
[54] Johnson TJ, Hildreth MB, Gu L, Baldwin EL, Zhou R, Gibbons WR. Evaluating viable cell indicators for filamentous cyanobacteria and their application. Journal of Microbiology, Biotechnology and Food Sciences. 2019;2019:886-893. DOI: 10.15414/jmbfs.2016/17.6.3.886-893
[55] Wong LS, Lee YH, Surif S. The fluorometric response of cyanobateria to short exposure of heavy metal. Advances in Environmental Biology. 2012;6(1):103-108
[56] Millan-Almaraz JR, Guevara- Gonzalez RG, de Jesus R-TR, Osornio-Rios RA, Torres-Pacheco I. Advantages and disadvantages on photosynthesis measurement techniques: A review. African Journal of Biotechnology. 2009;8(25):7340-7349. DOI: 10.5897/AJB2009.000-9569
[57] Eilola K, Meier HM, Almroth E. On the dynamics of oxygen, phosphorus and cyanobacteria in the Baltic Sea; a model study. Journal of Marine Systems.

23
Studying Cyanobacteria by Means of Fluorescence Methods: A ReviewDOI: http://dx.doi.org/10.5772/intechopen.93543
2009;75(1-2):163-184. DOI: 10.1016/j.jmarsys.2008.08.009
[58] DeEll JR, Toivonen PM, editors. Practical Applications of Chlorophyll Fluorescence in Plant Biology. New York, USA: Springer Science & Business Media; 2012. p. 271. DOI: 10.1007/978-1-4615-0415-3
[59] Babu NG, Sarma PA, Attitalla IH, Murthy SD. Effect of selected heavy metal ions on the photosynthetic electron transport and energy transfer in the thylakoid membrane of the cyanobacterium, Spirulina platensis. Acad J Plant Sci. 2010;3(1):46-49
[60] Zayadan BK, Akmuhanova NR, Sadvakasova AK, Kirbaeva DK, Bolatkhan K, Bauyenova MO. Influence of heavy metals on fluorescence activity of perspective strains of microalgae and cyanobacteria. International Journal of Biology and Chemistry. 2016;9(1):42-45. DOI: 10.26577/2218-7979-2016-9-1-42-45
[61] MacIntyre HL, Lawrenz E, Richardson TL. Taxonomic discrimination of phytoplankton by spectral fluorescence. In: Suggett D, Prášil O, Borowitzka M, editors. Chlorophyll a Fluorescence in Aquatic Sciences: Methods and Applications. Dordrecht: Springer; 2010. pp. 129-169. DOI: 10.1007/978-90-481-9268-7_7
[62] Zhang F, Su R, He J, Cai M, Luo W, Wang X. Identifying phytoplankton in seawater based on discrete excitation-emission fluorescence spectra. Journal of Phycology. 2010;46(2):403-411. DOI: 10.1111/j.1529-8817.2009.00805.x
[63] Zhang QQ, Lei SH, Wang XL, Wang L, Zhu CJ. Discrimination of phytoplankton classes using characteristic spectra of 3D fluorescence spectra. Spectrochimica Acta Part A: Molecular and Biomolecular Spectroscopy. 2006;63(2):361-369. DOI: 10.1016/j.saa.2005.05.041
[64] Beutler M, Wiltshire KH, Meyer B, Moldaenke C, Lüring C, Meyerhöfer M, et al. A fluorometric method for the differentiation of algal populations in vivo and in situ. Photosynthesis Research. 2002;72(1):39-53. DOI: 10.1023/A:1016026607048
[65] Strasser RJ, Srivastava A, Govindjee. Polyphasic chlorophyll a fluorescence transient in plants and cyanobacteria. Photochemistry and Photobiology. 1995;61(1):32-42. DOI: 10.1111/j.1751-1097.1995.tb09240.x
[66] Stamatakis K, Tsimilli-Michael M, Papageorgiou GC. Fluorescence induction in the phycobilisome-containing cyanobacterium Synechococcus sp PCC 7942: Analysis of the slow fluorescence transient. Biochimica et Biophysica Acta (BBA)-Bioenergetics. 2007;1767(6):766-772. DOI: 10.1016/j.bbabio.2007.02.009
[67] Campbell D, Hurry V, Clarke AK, Gustafsson P, Öquist G. Chlorophyll fluorescence analysis of cyanobacterial photosynthesis and acclimation. Microbiology and Molecular Biology Reviews. 1998;62(3):667-683. DOI: 10.1128/MMBR.62.3.667-683.1998
[68] Genty B, Briantais J-M, Baker NR. The relationship between the quantum yield of photosynthetic electron transport and quenching of chlorophyll fluorescence. Biochimica et Biophysica Acta (BBA) - General Subjects. 1989;990(1):87-92. DOI: 10.1016/s0304-4165(89)80016-9
[69] Van Kooten O, Snel JF. The use of chlorophyll fluorescence nomenclature in plant stress physiology. Photosynthesis Research. 1990;25(3):147-150. DOI: 10.1007/BF00033156
[70] Campbell D, Oquist G. Predicting light acclimation in cyanobacteria from nonphotochemical quenching

Fluorescence Methods for Investigation of Living Cells and Microorganisms
24
of photosystem II fluorescence, which reflects state transitions in these organisms. Plant Physiology. 1996;111(4):1293-1298. DOI: 10.1104/pp.111.4.1293
[71] Hirano M, Satoh K, Katoh S. Plastoquinone as a common link between photosynthesis and respiration in a blue-green alga. Photosynthesis Research. 1980;1(3):149-162. DOI: 10.1007/BF00020594
[72] Scherer S. Do photosynthetic and respiratory electron transport chains share redox proteins? Trends in Biochemical Sciences. 1990;15(12):458-462. DOI: 10.1016/0968-0004(90)90296-N
[73] Demmig-Adams B, Garab G, Adams W III, editors. Non-photochemical Quenching and Energy Dissipation in Plants, Algae and Cyanobacteria. vol. 40. Dordrecht: Springer Netherlands; 2014. p. 650. DOI: 10.1007/978-94-017-9032-1
[74] Bailey S, Grossman A. Photoprotection in cyanobacteria: Regulation of light harvesting. Photochemistry and Photobiology. 2008;84(6):1410-1420. DOI: 10.1111/j.1751-1097.2008.00453.x
[75] Kirilovsky D, Kerfeld CA. The orange carotenoid protein in photoprotection of photosystem II in cyanobacteria. Biochimica et Biophysica Acta. 1817;2012:158-166. DOI: 10.1016/j.bbabio.2011.04.013
[76] Ogawa T, Sonoike K. Dissection of respiration and photosynthesis in the cyanobacterium Synechocystis sp. PCC6803 by the analysis of chlorophyll fluorescence. Journal of Photochemistry and Photobiology, B: Biology. 2015;144:61-67. DOI: 10.1016/j.jphotobiol.2015.02.005
[77] Misumi M, Katoh H, Tomo T, Sonoike K. Relationship between
photochemical quenching and non-photochemical quenching in six species of cyanobacteria reveals species difference in redox state and species commonality in energy dissipation. Plant & Cell Physiology. 2016;57(7):1510-1517. DOI: 10.1093/ pcp/pcv185
[78] Acuña AM, Snellenburg JJ, Gwizdala M, Kirilovsky D, Van Grondelle R, Van Stokkum IH. Resolving the contribution of the uncoupled phycobilisomes to cyanobacterial pulse-amplitude modulated (PAM) fluorometry signals. Photosynthesis Research. 2016;127(1):91-102. DOI: 10.1007/s11120-015-0141-x
[79] Strasser RJ. Govindjee. The Fo and the O–J–I–P fluorescence rise in higher plants and algae. In: Argyroudi-Akoyunoglou JH, editor. Regulation of Chloroplast Biogenesis. Nato ASI Series (Series a: Life Sciences). Vol. 226. Boston: Springer; 1992. pp. 423-426. DOI: 10.1007/978-1-4615-3366-5_60
[80] Schreiber U. Pulse-amplitude-modulation (PAM) fluorometry and saturation pulse method: An overview. In: Papageorgiou GC, Govindjee, editors. Chlorophyll a Fluorescence. Advances in Photosynthesis and Respiration. Vol. 19. Dordrecht: Springer; 2004. pp. 279-319. DOI: 10.1007/978-1-4020-3218-9_11
[81] Falkowski PG, Wyman K, Ley AC, Mauzerall DC. Relationship of steady-state photosynthesis to fluorescence in eucaryotic algae. Biochimica et Biophysica Acta (BBA)-Bioenergetics. 1986;849(2):183-192. DOI: 10.1016/0005-2728(86)90024-1
[82] Kolber ZS, Prášil O, Falkowski PG. Measurements of variable chlorophyll fluorescence using fast repetition rate techniques: Defining methodology and experimental protocols. Biochimica et Biophysica Acta (BBA)-Bioenergetics.

25
Studying Cyanobacteria by Means of Fluorescence Methods: A ReviewDOI: http://dx.doi.org/10.5772/intechopen.93543
1998;(1-3):1367, 88-1106. DOI: 10.1016/S0005-2728(98)00135-2
[83] Olson RJ, Chekalyuk AM, Sosik HM. Phytoplankton photosynethetic characteristics from fluorescence induction assays of individual cells. Limnology and Oceanography. 1996;41(6):1253-1263. DOI: 10.4319/lo.1996.41.6.1253
[84] Gorbunov MY, Falkowski PG. Fluorescence induction and relaxation (FIRe) technique and instrumentation for monitoring photosynthetic processes and primary production in aquatic ecosystems. In: Proceedings of 13th International Congress of Photosynthesis. 29-30 August 2004. Vol. 2. Montreal, QC: Allen Press; 2004. pp. 1029-1031
[85] Johnson ZI. Description and application of the background irradiance gradient-single turnover fluorometer (BIG-STf). Marine Ecology Progress Series. 2004;283:73-80. DOI: 10.3354/meps283073
[86] Chekalyuk A, Hafez M. Advanced laser fluorometry of natural aquatic environments. Limnology and Oceanography: Methods. 2008;6(11):591-609. DOI: 10.4319/lom.2008.6.591
[87] Schreiber U, Klughammer C, Kolbowski J. Assessment of wavelength-dependent parameters of photosynthetic electron transport with a new type of multi-color PAM chlorophyll fluorometer. Photosynthesis Research. 2012;113(1-3):127-144. DOI: 10.1007/s11120-012-9758-1
[88] Lysenko V, Lazar D, Varduny T. A method of a bicolor fast-Fourier pulse-amplitude modulation chlorophyll fluorometry. Photosynthetica. 2018;56(4):1447-1452. DOI: 10.1007/s11099-018-0848-y
[89] Chazalon F, Rabouille S, Hartmann P, Sciandra A, Bernard O. A
dynamical model to study the response of microalgae to pulse amplitude modulated fluorometry. IFAC Proceedings Volumes. 2014;47(3):7152-7157. DOI: 10.3182/20140824-6-ZA-1003.02162
[90] Breuer F, Dören L, Ebke KP. Comparison of four measuring techniques to assess growth inhibition in standardized tests with seven freshwater algae and cyanobacteria. Toxicological and Environmental Chemistry. 2016;98(8):848-859. DOI: 10.1080/02772248.2016.1139116
[91] Bodemer U. Variability of phycobiliproteins in cyanobacteria detected by delayed fluorescence excitation spectroscopy and its relevance for determination of phytoplankton composition of natural water samples. Journal of Plankton Research. 2004;26(10):1147-1162. DOI: 10.1093/plankt/fbh105
[92] Gerhardt V, Bodemer U, Eckert W. Determination of phytoplankton colour classes: Online excitation spectroscopy of the delayed fluorescence (DF) of algae. Internationale Vereinigung für theoretische und angewandte Limnologie: Verhandlungen. 2005;29(1):306-309. DOI: 10.1080/03680770.2005.11902019
[93] Drinovec L, Flander-Putrle V, Knez M, Beran A, Berden-Zrimec M. Discrimination of marine algal taxonomic groups using delayed fluorescence spectroscopy. Environmental and Experimental Botany. 2011;73:42-48. DOI: 10.1016/j.envexpbot.2010.10.010
[94] Istvánovics V, Honti M, Osztoics A, Shafik HM, Padisak J, Yacobi Y, et al. Continuous monitoring of phytoplankton dynamics in Lake Balaton (Hungary) using on-line delayed fluorescence excitation spectroscopy. Freshwater Biology.

Fluorescence Methods for Investigation of Living Cells and Microorganisms
26
2005;50(12):1950-1970. DOI: 10.1111/j.1365-2427.2005.01442.x
[95] Yacobi YZ, Gerhardt V, Gonen- Zurgil Y, Sukenik A. Delayed fluorescence excitation spectroscopy: A rapid method for qualitative and quantitative assessment of natural population of phytoplankton. Water Research. 1998;32(9):2577-2582. DOI: 10.1016/s0043-1354(98)00032-3
[96] Gerhardt V, Bodemer U. Delayed fluorescence: An in vivo method for electron transport studies and on line applications in limnology. In: Proceedings of the 12th International Congress on Photosynthesis. 18-23 August 2001. Vol. 3, No. 1. Queensland, Australia: Science Access; 2001. S14-009. DOI: 10.1071/SA0403352
[97] Zhang L, Xing D. Rapid determination of the damage to photosynthesis caused by salt and osmotic stresses using delayed fluorescence of chloroplasts. Photochemical & Photobiological Sciences. 2008;7(3):352-360. DOI: 10.1039/B714209A
[98] Omagari R, Katsumata M, Arizono K, Ishibashi Y. Toxicity evaluation of 4-Nonylphenol isomers with ecotoxicological bioassay using delayed luminescence in the green alga Pseudokirchneriella subcapitata. Journal of Environment and Safety. 2017;8(2):57-63. DOI: 10.11162/daikankyo.E16RP0801
[99] Yamagishi T, Katsumata M, Yamaguchi H, Shimura Y, Kawachi M, Koshikawa H, et al. Rapid ecotoxicological bioassay using delayed fluorescence in the marine cyanobacterium Cyanobium sp.(NIES-981). Ecotoxicology. 2016;25(10):1751-1758. DOI: 10.1007/s10646-016-1718-7
[100] Leunert F, Grossart HP, Gerhardt V, Eckert W. Toxicant induced changes on delayed fluorescence decay
kinetics of cyanobacteria and green algae: A rapid and sensitive biotest. PLoS One. 2013;8(4):e63127. DOI: 10.1371/journal.pone.0063127
[101] Kurzbaum E, Eckert W, Yacobi YZ. Delayed fluorescence as a direct indicator of diurnal variation in quantum and radiant energy utilization efficiencies of phytoplankton. Photosynthetica. 2007;45(4):562-567. DOI: 10.1007/s11099-007-0096-z
[102] Kaurov Y, Aksyonova GE, Lovyagina ER, Ivanov II, Rubin AB. Thermally-induced delayed fluorescence of photosystem I and II chlorophyll in thermophilic cyanobacterium. General Physiology and Biophysics. 1992;11:229-239
[103] Greisberger S, Teubner K. Does pigment composition reflect phytoplankton community structure in differing temperature and light conditions in a deep alpine lake? An approach using HPLC and delayed fluorescence techniques. Journal of Phycology. 2007;43(6):1108-1119. DOI: 10.1111/j.1529-8817.2007.00404.x
[104] Bodemer U, Gerhardt V, Yacobi YZ, Zohary Z, Friedrich G, Pohlmann M. Phytoplankton abundance and composition of freshwaters systems determined by DF excitation spectroscopy and conventional methods. Archiv für Hydrobiologie Special Issues Advances in Limnology. 2000;55:87-100
[105] Cunningham A. Analysis of microalgae and cyanobacteria by flow cytometry. In: Lloyd D, editor. Flow Cytometry in Microbiology. London: Springer; 1993. pp. 131-142. DOI: 10.1007/978-1-4471-2017-9_10
[106] Poniedziałek B, Falfushynska HI, Rzymski P. Flow cytometry as a valuable tool to study cyanobacteria: A mini-review. Limnological Review.

27
Studying Cyanobacteria by Means of Fluorescence Methods: A ReviewDOI: http://dx.doi.org/10.5772/intechopen.93543
2017;17(2):89-95. DOI: 10.1515/limre-2017-0009
[107] Olson RJ, Chisholm SW, Zettler ER, Altabet MA, Dusenberry JA. Spatial and temporal distributions of prochlorophyte picoplankton in the North Atlantic Ocean. Deep Sea Research Part A. Oceanographic Research Papers. 1990;37(6):1033-1051. DOI: 10.1016/0198-0149(90)90109-9
[108] Moreira-Turcq PF, Cauwet G, Martin JM. Contribution of flow cytometry to estimate picoplankton biomass in estuarine systems. Hydrobiologia. 2001;462(1-3):157-168. DOI: 10.1023/a:1013138317897
[109] Mukhanov VS, Rylkova OA, Churilova TY, Sakhon EG, Pimenov NV. Structure and seasonal trophodynamics of picophytoplankton in Sevastopol bay and adjacent waters (the Black Sea). Microbiology. 2016;85(5):553-561. DOI: 10.1134/S002626171605012X
[110] Mukhanov VS, Naidanova OG, Lopukhina OA, Kemp RB. Cell-, biovolume-and biosurface-specific energy fluxes through marine picoplankton as a function of the assemblage size structure. Thermochimica Acta. 2007;458(1-2): 23-33. DOI: 10.1016/j.tca.2007.02.024
[111] Boddy L, Morris CW, Wilkins MF, Al-Haddad L, Tarran GA, Jonker RR, et al. Identification of 72 phytoplankton species by radial basis function neural network analysis of flow cytometric data. Marine Ecology Progress Series. 2000;195:47-59. DOI: 10.3354/meps195047
[112] Hofstraat JW, De Vreeze ME, Van Zeijl WJ, Peperzak L, Peeters JC, Balfoort HW. Flow cytometric discrimination of phytoplankton classes by fluorescence emission and excitation properties. Journal of Fluorescence. 1991;1(4):249-265. DOI: 10.1007/BF00865249
[113] Dudkowiak A, Olejarz B, Łukasiewicz J, Banaszek J, Sikora J, Wiktorowicz K. Heavy metals effect on cyanobacteria Synechocystis aquatilis study using absorption, fluorescence, flow cytometry, and photothermal measurements. International Journal of Thermophysics. 2011;32(4):762-773. DOI: 10.1007/s10765-010-0852-3
[114] Stauber JL, Franklin NM, Adams MS. Applications of flow cytometry to ecotoxicity testing using microalgae. Trends in Biotechnology. 2002;20(4):141-143. DOI: 10.1016/S0167-7799(01)01924-2
[115] Franklin NM, Stauber JL, Lim RP. Development of flow cytometry-based algal bioassays for assessing toxicity of copper in natural waters. Environmental Toxicology and Chemistry: An International Journal. 2001;20(1): 160-170. DOI: 10.1002/etc.5620200118
[116] Li WK. Primary production of prochlorophytes, cyanobacteria, and eucaryotic ultraphytoplankton: Measurements from flow cytometric sorting. Limnology and Oceanography. 1994;39(1):169-175. DOI: 10.4319/lo.1994.39.1.0169
[117] Karo O, Wahl A, Nicol SB, Brachert J, Lambrecht B, Spengler HP, et al. Bacteria detection by flow cytometry. Clinical Chemistry and Laboratory Medicine (CCLM). 2008;46(7):947-953. DOI: 10.1515/CCLM.2008.156
[118] Zhou Q, Chen W, Zhang H, Peng L, Liu L, Han Z, et al. A flow cytometer based protocol for quantitative analysis of bloom-forming cyanobacteria (Microcystis) in lake sediments. Journal of Environmental Sciences. 2012;24(9):1709-1716. DOI: 10.1016/S1001-0742(11)60993-5
[119] Davey HM, Kell DB. Flow cytometry and cell sorting of heterogeneous microbial populations: The importance of single-cell

Fluorescence Methods for Investigation of Living Cells and Microorganisms
28
analyses. Microbiological Reviews. 1996;60(4):641-696
[120] Ibrahim SF, van den Engh G. Flow cytometry and cell sorting. Advances in Biochemical Engineering/Biotechnology. 2007;106:19-39. DOI: 10.1007/10_2007_073
[121] Cellamare M, Rolland A, Jacquet S. Flow cytometry sorting of freshwater phytoplankton. Journal of Applied Phycology. 2010;22(1):87-100. DOI: 10.1007/s10811-009-9439-4
[122] Dubelaar GB, Groenewegen AC, Stokdijk W, Van Den Engh GJ, Visser JW. Optical plankton analyser: A flow cytometer for plankton analysis, II: Specifications. Cytometry: The Journal of the International Society for Analytical Cytology. 1989;10(5):529-539. DOI: 10.1002/cyto.990100508
[123] Boddy L, Wilkins MF, Morris CW, Tarran GA, Burkill PH, Jonker RR. Techniques for neural network identification of phytoplankton for the EurOPA flow cytometer. In: Proceedings of OCEANS’94; 1994 Sep 13-16. Vol. 1. Brest, France: IEEE. p. I-565. DOI: 10.1109/oceans.1994.363967
[124] Rzymski P, Poniedzialek B, Niedzielski P, Tabaczewski P, Wiktorowicz K. Cadmium and lead toxicity and bioaccumulation in Microcystis aeruginosa. Frontiers of Environmental Science & Engineering. 2014;8(3):427-432. DOI: 10.1007/s11783-013-0566-4
[125] Goda K, Filby A, Nitta N. In flow cytometry, image is everything. Cytometry Part A. 2019;95(5):475-477. DOI: 10.1002/cyto.a.23778
[126] Pawley JB, editor. Handbook of Biological Confocal Microscopy. Boston, MA: Springer; 1995. p. 346. DOI: 10.1007/978-1-4757-5348-6
[127] Wilson T. Confocal Microscopy. London, etc: Academic Press; 1990. p. 426. DOI: 10.1007/978-1-4615-7133-9
[128] Yang S, Su Z, Li H, Feng J, Xie J, Xia A, et al. Demonstration of phycobilisome mobility by the time-and space-correlated fluorescence imaging of a cyanobacterial cell. Biochimica et Biophysica Acta (BBA)-Bioenergetics. 2007;1767(1):15-21. DOI: 10.1016/j.bbabio.2006.11.012
[129] Mullineaux CW. FRAP analysis of photosynthetic membranes. Journal of Experimental Botany. 2004;55(400):1207-1211. DOI: 10.1093/jxb/erh106
[130] Liu LN, Aartsma TJ, Thomas JC, Zhou BC, Zhang YZ. FRAP analysis on red alga reveals the fluorescence recovery is ascribed to intrinsic photoprocesses of phycobilisomes than large-scale diffusion. PLoS One. 2009;4(4):e5295. DOI: 10.1371/journal.pone.0005295
[131] Vitali M, Reis M, Friedrich T, Eckert HJ. A wide-field multi-parameter FLIM and FRAP setup to investigate the fluorescence emission of individual living cyanobacteria. In: Proceedings of SPIE Conference on Laser Applications in Life Sciences (Vol. 7376); 9-11 June 2010; Oulu, Finland: SPIE; 2010. p. 737610-737610-6. DOI: 10.1117/12.871520
[132] Borlinghaus R. Colours count: how the challenge of fluorescence was solved in confocal microscopy. Modern research and educational topics in microscopy. In: Méndez-Vilas A, Díaz J, editors. Colours Count: How the Challenge of Fluorescence Was Solved in Confocal Microscopy. Vol. 2007. FORMATEX; 2007. pp. 890-899. DOI: 10.1.1.564.5122
[133] Sinclair MB, Haaland DM, Timlin JA, Jones HD. Hyperspectral confocal microscope. Applied Optics.
29
Studying Cyanobacteria by Means of Fluorescence Methods: A ReviewDOI: http://dx.doi.org/10.5772/intechopen.93543
2006;45(24):6283-6291. DOI: 10.1364/AO.45.006283
[134] Li D, Shao L, Chen BC,zZhang X, Zhang M, Moses B, et al. Extended-resolution structured illumination imaging of endocytic and cytoskeletal dynamics. Science. 2015;349(6251):aab3500. DOI: 10.1126/science.aab350
[135] van de Linde S, Heilemann M, Sauer M. Live-cell super-resolution imaging with synthetic fluorophores. Annual Review of Physical Chemistry. 2012;63:519-540. DOI: 10.1146/annurev-physchem-032811-112012
[136] Yokono M, Takabayashi A, Akimoto S, Tanaka A. A megacomplex composed of both photosystem reaction centres in higher plants. Nature Communications. 2015;6:6675. DOI: 10.1038/ncomms7675
[137] Wolf E, Schussler A. Phycobiliprotein fluorescence of Nostoc punctiforme changes during the life cycle and chromatic adaptation: Characterization by spectral confocal laser scanning microscopy and spectral unmixing. Plant, Cell & Environment. 2005;28(4):480-491. DOI: 10.1111/j.1365-3040.2005.01290.x
[138] Férard JF, Blaise C. Encyclopedia of Aquatic Ecotoxicology. Netherlands: Springer; 2013. p. 805
[139] Seppälä J, Ylöstalo P, Kaitala S, Hällfors S, Raateoja M, Maunula P. Ship-of-opportunity based phycocyanin fluorescence monitoring of the filamentous cyanobacteria bloom dynamics in the Baltic Sea. Estuarine, Coastal and Shelf Science. 2007;73(3-4):489-500. DOI: 10.1016/j.ecss.2007.02.015
[140] Tyler AN, Hunter PD, Carvalho L, Codd GA, Elliott JA, Ferguson CA, et al. Strategies for monitoring and managing mass populations of toxic
cyanobacteria in recreational waters: A multi-interdisciplinary approach. Environmental Health. 2009;8(S1):S11. DOI: 10.1186/1476-069X-8-S1-S11
[141] Metsamaa L, Kutser T, Strömbeck N. Recognising cyanobacterial blooms based on their optical signature: A modelling study. Boreal Environment Research. 2006;11(6):493-506
[142] Matthews MW, Bernard S, Winter K. Remote sensing of cyanobacteria-dominant algal blooms and water quality parameters in Zeekoevlei, a small hypertrophic lake, using MERIS. Remote Sensing of Environment. 2010;114(9):2070-2087. DOI: 10.1016/j.rse.2010.04.013
[143] Simis SG, Ruiz-Verdú A, Domínguez-Gómez JA, Peña- Martinez R, Peters SW, Gons HJ. Influence of phytoplankton pigment composition on remote sensing of cyanobacterial biomass. Remote Sensing of Environment. 2007; 106(4):414-427. DOI: 10.1016/j.rse. 2006.09.008
[144] Randolph K, Wilson J, Tedesco L, Li L, Pascual DL, Soyeux E. Hyperspectral remote sensing of cyanobacteria in turbid productive water using optically active pigments, chlorophyll a and phycocyanin. Remote Sensing of Environment. 2008;112(11):4009-4019. DOI: 10.1016/j.rse.2008.06.002
[145] Zhang Y, Feng L, Li J, Luo L, Yin Y, Liu M, et al. Seasonal–spatial variation and remote sensing of phytoplankton absorption in Lake Taihu, a large eutrophic and shallow lake in China. Journal of Plankton Research. 2010;32(7):1023-1037. DOI: 10.1093/plankt/fbq039
[146] Hunter PD, Tyler AN, Carvalho L, Codd GA, Maberly SC. Hyperspectral

Fluorescence Methods for Investigation of Living Cells and Microorganisms
30
remote sensing of cyanobacterial pigments as indicators for cell populations and toxins in eutrophic lakes. Remote Sensing of Environment. 2010;114(11):2705-2718. DOI: 10.1016/j.rse.2010.06.006
[147] Li L, Sengpiel RE, Pascual DL, Tedesco LP, Wilson JS, Soyeux E. Using hyperspectral remote sensing to estimate chlorophyll-a and phycocyanin in a mesotrophic reservoir. International Journal of Remote Sensing. 2010;31(15):4147-4162. DOI: 10.1080/01431161003789549
[148] Kutser T, Metsamaa L, Strömbeck N, Vahtmäe E. Monitoring cyanobacterial blooms by satellite remote sensing. Estuarine, Coastal and Shelf Science. 2006;67(1-2):303-312. DOI: 10.1016/j.ecss.2005.11.024
[149] Beutler M, Wiltshire KH, Arp M, Kruse J, Reineke C, Moldaenke C, et al. A reduced model of the fluorescence from the cyanobacterial photosynthetic apparatus designed for the in situ detection of cyanobacteria. Biochimica et Biophysica Acta (BBA)-Bioenergetics. 2003;1604(1):33-46. DOI: 10.1016/S0005-2728(03)00022-7
[150] Lee Z, Carder KL. Absorption spectrum of phytoplankton pigments derived from hyperspectral remote-sensing reflectance. Remote Sensing of Environment. 2004;89(3):361-368. DOI: 10.1016/j.rse.2003.10.013
[151] Vernet M, Iturriaga R. Contribution of Phycoerythrin-Containing Phytoplankton to Remotely Sensed Signals in the Ocean. Final Report, NASA project #10-70414, 1997. USA, CA. p. 14
[152] Subramaniam A, Carpenter EJ, Falkowski PG. Bio-optical properties of the marine diazotrophic cyanobacteria Trichodesmium spp. II. A reflectance model for remote sensing. Limnology
and Oceanography. 1999;44(3):618-627. DOI: 10.4319/lo.1999.44.3.0618
[153] Fadeev VV, Maslov DV, Matorin DN, Reuter R, Zavyalova TI. Some peculiarities of fluorescence diagnostics of phytoplankton in coastal waters of the Black Sea. In: Proceedings of EARSeL-SIG-Workshop LIDAR, June 16-17. Dresden:Earsel: FRG; 2000. pp. 205-213
[154] Barbini R, Colao F, Fantoni R, Palucci A, Ribezzo S. Differential lidar fluorosensor system used for phytoplankton bloom and seawater quality monitoring in Antarctica. International Journal of Remote Sensing. 2001;22(2-3):369-384. DOI: 10.1080/014311601449989
[155] Babichenko S, Kaitala S, Leeben A, Poryvkina L, Seppälä J. Phytoplankton pigments and dissolved organic matter distribution in the Gulf of Riga. Journal of Marine Systems. 1999;23(1-3):69-82. DOI: 10.1016/s0924-7963(99)00051-2
[156] Lednev VN, Grishin MY, Pershin SM, Bunkin AF, Kapustin IA, Molkov AA, et al. Laser remote probing of freshwater reservoir with high phytoplankton concentration. Laser. 2016;13(1):119-134. DOI: 10.21046/2070-7401-2016-13-1-119-134
[157] Bazzani M, Breschi B, Cecchi G, Pantani L, Tirelli D, Valmori G, et al. Phytoplankton monitoring by laser induced fluorescence. EARSeL Adv. Remote Sens. 1992;1(2-II):106-110
[158] Moore TS, Churnside JH, Sullivan JM, Twardowski MS, Nayak AR, McFarland MN, et al. Vertical distributions of blooming cyanobacteria populations in a freshwater lake from LIDAR observations. Remote Sensing of Environment. 2019;225:347-367. DOI: 10.1016/j.rse.2019.02.025
[159] Chekalyuk AM, Gorbunov MY. Laser remote sensing of phytoplankton

31
Studying Cyanobacteria by Means of Fluorescence Methods: A ReviewDOI: http://dx.doi.org/10.5772/intechopen.93543
photosynthetic activity and chlorophyll by using a shipboard lidar system. In: Korppi-Tommola JE, editor. Laser Study of Macroscopic Biosystems. Vol. 1922. Finland: SPIE; 1992. pp. 391-400. DOI: 10.1117/12.146164
[160] Gons HJ, Hakvoort H, Peters SW, Simis SG. Optical detection of cyanobacterial blooms. In: Huisman J, Matthijs HC, Visser PM, editors. Harmful Cyanobacteria. Aquatic Ecology Series. Dordrecht: Springer; 2005. pp. 177-199. DOI: 10.1007/1-4020-3022-3_8